1 A longitudinal twin study of Chinese children learning to read English as a second language Wai Lap Wong Saint John’s College Thesis submitted to the University of Oxford for the degree of Doctor of Philosophy Trinity Term, 2010 Department of Experimental Psychology, University of Oxford

Welcome message from author
This document is posted to help you gain knowledge. Please leave a comment to let me know what you think about it! Share it to your friends and learn new things together.
Transcript
1
A longitudinal twin study of Chinese children learning to readEnglish as a second language
Wai Lap Wong
Saint John’s College
Thesis submitted to the University of Oxfordfor the degree of Doctor of Philosophy
Trinity Term, 2010
Department of Experimental Psychology, University of Oxford

2
3
SHORT ABSTRACT
A longitudinal twin study of Chinese children learning to readEnglish as a second language
Wai Lap Wong
Saint John’s College, University of Oxford
Thesis submitted to the for the degree of Doctor of Philosophy, Trinity Term, 2010
This thesis investigated reading and related skills in Chinese children learning English as a
second language (ESL) in 279 Chinese twin pairs aged from 3 to 11 years. Children were
tested twice, a year apart, with measures of visual word recognition, receptive vocabulary,
phonological awareness, phonological memory and speech perception in both Chinese and
English and Chinese tone awareness. The thesis was divided into two sections with the first
section exploring the phenotypic relationships and the second section estimating the genetic
and environmental influences. In the first section, the causal relationships among the five ESL
skills were modelled (chapter 4) and the relationships between Chinese and ESL skills were
sought (chapter 4). In section two, the univariate heritability (chapter 6), the cross-linguistic
genetic overlap (chapter 7) and the stability and instability of heritability estimates (chapter 8)
for all skills were examined. Findings have shown that ESL speech perception is important to
the development of ESL phonological awareness, phonological memory and receptive
vocabulary, in turn, has an impact on ESL reading development. Genes play an important role
in ESL and Chinese reading development. The differential environmental effects may be due
to the differences in the ESL and Chinese acquisition ecologies.
4
LONG ABSTRACT
A longitudinal twin study of Chinese children learning to readEnglish as a second language
Wai Lap Wong
Saint John’s College, University of Oxford
Thesis submitted to the for the degree of Doctor of Philosophy, Trinity Term, 2010
Background Past studies have shown the relative contributions of genes and environment to
reading and related skills in children speaking English as a first language. However, how
these factors influence second language reading acquisition remains unknown. This thesis has
extended this line of research by examining English as a second language (ESL) acquisition in
Chinese children learning with a twin study design. It focused on the processing of Chinese
and English sound and phonological units under a behavioural genetic framework.
Method This thesis included 279 Chinese twin pairs who were ESL learners, aged from 3 to
11 years. Children were tested twice, a year apart, with measures of Chinese and English
visual word recognition, receptive vocabulary, phonological awareness, phonological memory
and speech perception, and Chinese tone awareness. Four major analyses were conducted.
First, four evidence-based hypotheoretical Path analysis models were tested using structural
equation modelling (SEM) to determine the inter-relationships among ESL skills. Second, the
relationship between ESL and Chinese variables were examined using exploratory factor
analysis (EFA). Third, the contribution of genes, and shared and non-shared environment
were estimated with univariate twin analyses. Lastly, the genetic overlap between ESL and
Chinese skills, and the stability and changes of genetic estimates across time were estimated
with bivariate Cholesky twin analyses.
5
Results Among ESL skills, the results of the SEM model fitting showed that ESL speech
perception indirectly predicted ESL visual word recognition via ESL phonological awareness.
When both ESL and Chinese skills were considered, two factors (Phonological
representations and Lexical restructuring) were extracted by EFA from the ESL and Chinese
variables, indicating both cross-linguistic and cross-domain overlap. Univariate twin analyses
showed that genes accounted for the individual variations in all skills. Bivariate twin analyses
indicated genetic overlap between parallel ESL and Chinese variables, except between ESL
phonological awareness and Chinese tone awareness. Moreover, genetic effects contributed to
the cross-time stability of all ESL and Chinese variables. However, shared environmental
effects on the overlap and cross-time stability were present for some ESL and Chinese
variables only.
Conclusions This thesis has illustrated that ESL reading in Chinese children is a
multi-componential system at the behavioural and cognitive levels. ESL speech perception is
important to the development of ESL phonological awareness, phonological memory and
receptive vocabulary, in turn, has an impact on ESL reading development. At the genetic level,
genes play an important role in ESL and Chinese reading development. Also, common genetic
influences between ESL and Chinese skills suggest their shared etiology, and genetic effects
contribute to the stability of individual skills across time. However, the differential
environmental effects between some ESL and Chinese variables suggest different learning
environments could be optimal for either ESL or Chinese development. Further studies on
identifying these genetic and environmental factors are recommended.

6
ACKNOWLEDGEMENTS
The work you are reading would not have existed without the help and involvement of the
following people. More significantly, they all have played an important role in socializing me
in this 3-year doctorate training. It is a delight to acknowledge all these GREAT people for
their contributions to the fulfillment of this study.
First of all, I would like to say a BIG THANK YOU to the three ‘directors’ of this research
project, Professors Dorothy Bishop, Connie Ho and Mary Waye, for their patient guidance
and invaluable suggestions throughout the ‘filming’ of this ‘documentary’ on the heritability
of second language reading acquisition. Additionally, I wish to express my gratitude to the
‘co-screenplay writer’ Miss Bonnie Chow for her tremendous support throughout the whole
‘filming’ process and for being there for me whenever I needed a helping hand.
The training I received in this Hollywood of intellectual training is amazing. I would like to
express my immense gratitude to Professor Dorothy Bishop - my supervisor, my role model,
and a great source of strength. Your generosity to give the best of yourself at the human and
professional level has no limits, and for that I will always be in debt to you.
Special thank is extended to Professor Connie Ho who has introduced me developmental
dyslexia, Behavioural genetics and aromatherapy, and has provided me with insightful
comments at all stages of my research. Her guidance, suggestions and ‘World’s local bank’
(Child Psychology Laboratory, HKU) helped enormously in bringing the international
collaboration between Oxford and Hong Kong thesis to completion.
Many thanks to Professor Mary Waye for teaching me a new language of Molecular Genetics
(SNPs, polymorphism…etc) and her excellent team for doing a great job in zygosity testing
on twin sample.
I am grateful to all the past and present members of Oxford Study of Children's
Communication Impairments (OSCCI) for helping me to integrate into the life of
‘Hollywood’. Special thanks go to Noel who has been polishing my English, Mervyn who has
been providing me technical support, and, Andrew, Julie, Nic and Pascale who have shared
with me their PhD experiences and expertise. My thanks also go to the OSCCI angels,
Anneka, Georgina and Helen.

7
I wish to acknowledge two members of my DPhil transfer viva, Professor John Coleman and
Dr. Kate Watkins, for their useful advice and trainings on Phonetics, Phonology and
Neuropsychology.
I am deeply indebted to various officers in the department of Experimental Psychology -
Penny, Karen and Pippa - who have helped with the arrangement of examinations and
paperwork. I want to tell Penny that my character has no resemblance to Mr. Clyde in the
movie ‘Bonnie and Clyde’.
Surely, the ‘Hollywood’ English sounds very different from the Hong Kong English. Thanks
for my housemate at St John’s College, Richard and Ben, who have been acting as my Dr.
Higgins in Pygmalion.
I am particularly grateful to Professor Catherine McBride-Chang, Dr. Kevin Chung, Dr.
Man-Tak Leung, Professor Him Cheung, Professor Kit-Tai Hau without whose continuous
help and support things would have been so much harder.
Moreover, I am greatly grateful to my dear friends for keeping my spirits up during the
difficult stages and for being so incredibly helpful with everything not concerning this thesis.
To name a few names, Bocheng, Chris, Ornella, Yi-Chuan, Kieko, Kim, Atsuko, Aaron,
Simon, Chuei-Yee…Thank you for your companionship and delicious food!!!
I am very much indebted to principals, teachers and parents who have generously given their
valuable time and efforts. I would like to dedicate this work to all the little actors and
actresses (the wonderful twin participants).
I also extend my gratitude to the Wellcome Trust, United Kingdom and Research Grant
Council, Hong Kong.
Words cannot describe how thankful I am to my parents King and Shirley and my sisters
Anny and Packy whose constant love, support and encouragement mean everything to me.
Last but not least, I am very grateful to my two DPhil viva examiners Professor Morag Stuart
and Dr Jennifer Lau who have further polished my critical thinking and made this piece of
work one step closer to perfection.
8
Table of contentsShort abstract
Long abstract
Acknowledgments
Table of contents
CHAPTER 1 Reading development in the first language...................................................... 16
1.1 Chapter summary ................................................................................................. 16
1.2 General introduction............................................................................................. 16
1.3 Operational definition of reading skills................................................................ 18
1.4 Using a ‘component skills analysis’ approach to conceptualize reading ............. 20
1.5 The influences of phonological awareness on reading development................... 20
1.6 Ontogeny of phonological awareness .................................................................. 23
1.7 Speech perception ................................................................................................ 23
1.8 The Autonomous view of reading development .................................................. 24
1.9 Speech perception bootstraps phonological awareness........................................ 25
1.10 Lexical restructuring model (LRM) ..................................................................... 29
1.11 A unique relation between phonological memory and vocabulary...................... 33
1.12 A summary of evidence-based models of reading ............................................... 37
CHAPTER 2 The link between the first and second language .............................................. 42
2.1 Chapter summary ................................................................................................. 42
2.2 The scope of this thesis on second language reading acquisition ........................ 42
2.3 L1 and L2 skills and their common underlying cognitive processes ................... 45
2.4 Chinese learners of English as a second language ............................................... 51
2.5 Summary of section 1........................................................................................... 58
CHAPTER 3 Design, methodology and data preparation...................................................... 60
3.1 Participants ........................................................................................................... 60
3.2 Procedure.............................................................................................................. 62
3.3 Pilot testing and modification of tests .................................................................. 62
3.4 English measures.................................................................................................. 63
3.5 Chinese measures ................................................................................................. 65
3.6 Descriptive analyses, gender and zygosity effects ............................................... 68
3.7 Correction of age effects ...................................................................................... 70
CHAPTER 4 models of ESL reading development ............................................................... 72
4.1 Chapter summary ................................................................................................. 72
4.2 An overview of structural equation modelling (SEM)......................................... 72

9
4.3 The application of SEM in the present study....................................................... 76
4.4 Testing the four ESL reading models ................................................................... 77
4.5 Discussion on models of ESL reading development............................................ 84
4.6 Commonalities and specificities of the four final models.................................... 84
4.7 Testing the relationships between ESL and Chinese variables ............................ 90
4.8 Discussion on the ESL-Chinese relationships...................................................... 94
CHAPTER 5 Twin study method and past twin studies on reading development................. 98
5.1 Chapter summary ................................................................................................. 98
5.2 Linkage between section 1 and 2 ......................................................................... 98
5.3 Behavioural genetics and twin study: nature and nurture .................................... 99
5.4 The classical twin study design.......................................................................... 102
5.5 The ACE and ADE models ................................................................................ 104
5.6 The interpretation of univariate estimates from the ACE/ADE models............. 107
5.7 Assumptions of the twin models ........................................................................ 109
5.8 The phenotypes of reading and sources of individual differences ......................111
5.9 Studies of reading using the twin study design .................................................. 112
5.10 Heritability in second language acquisition ....................................................... 117
5.11 Research questions and hypotheses in this study............................................... 119
CHAPTER 6 Univariate twin analyses of ESL and chinese measures at two time points... 120
6.1 Chapter summary ............................................................................................... 120
6.2 Intraclass correlation coefficients of monozygotic and dizygotic twins............ 120
6.3 Univariate genetic analyses................................................................................ 121
6.4 Comparing between the ACE/ADE and its nested models................................ 122
6.5 Visual word recognition and receptive vocabulary............................................ 122
6.6 Phonological awareness and memory ................................................................ 124
6.7 Speech perception .............................................................................................. 128
6.8 Discussion of the results..................................................................................... 129
CHAPTER 7 Bivariate genetic analyses .............................................................................. 140
7.1 Chapter summary ............................................................................................... 140
7.2 Genetic overlap and distinctiveness ................................................................... 140
7.3 Bivariate analysis ............................................................................................... 145
7.4 Cholesky decomposition analysis ...................................................................... 146
7.5 Genetic overlap and specificity between ESL and Chinese skills...................... 147
7.6 Discussion of the results..................................................................................... 153
CHAPTER 8 Longitudinal genetic analysis......................................................................... 157
10
8.1 Continuity and change of genetic and environmental effects ............................ 157
8.2 Longitudinal genetic analyses ............................................................................ 159
8.3 Discussion of the results..................................................................................... 164
CHAPTER 9 General Discussion......................................................................................... 168
References 175
Appendix 1 Project advertising........................................................................................... 217
Appendix 2 Testing materials.............................................................................................. 220
Appendix 3 Details of goodness-of-fit Indices ................................................................ 223
Appendix 4 R script (univariate ACE model).................................................................. 225
Appendix 5 R script (univariate ADE model).................................................................. 233
Appendix 6 R script (bivariate cholesky model) ............................................................. 239
11
LIST OF TABLES
Table Title Page
Table 3.1. Number of individuals in each age band at both time 1 and 2 ..........................................61
Table 3.2. Means and Standard Deviations for English measures by age, gender and zygosity Groups
... 69
Table 3.3. Means and Standard Deviations for Chinese measures by age, gender and zygosity Groups
... 70
Table 4.1. The values of parameter estimates and goodness-of-fit indices of a series of Path analysis
models tested against the Autonomous model (McBride-Chang, 1996)............................78
Table 4.2. The values of parameter estimates and goodness-of-fit indices of a series of Path analysis
models tested against the ‘bootstrapping’ model ...............................................................80
Table 4.3. The values of parameter estimates and goodness-of-fit indices of a series of Path analysis
models tested against the LRM model ...............................................................................82
Table 4.4: The values of parameter estimates and goodness-of-fit indices of a series of Path analysis
models tested against the ‘phonology independent’ model................................................83
Table 4.5: Zero-order correlations among time 1 variables controlling for age.................................89
Table 4.6. Summary of factor matrix extracted before and after oblique rotation for variables
controlling for age^ (N= 287) ............................................................................................92
Table 5.1:. Findings of twin studies of readings relevant to variables measures in this thesis. .......114
Table 5.1: (continued) ......................................................................................................................115
Table 6.1. Summary of intraclass correlation coefficients (MZ twin=207 pairs, DZ twin=72 pairs)
... 121
Table 6.2. Univariate ACE and nested models fit and parameter estimates for all the hypothesized
variables (MZ=207 pairs, DZ=72 pairs) ..........................................................................123
Table 6.3. Univariate ACE/ADE and nested model fits and parameter estimates for all the
hypothesized variables (MZ=207 pairs, DZ=72pairs) .....................................................126
Table 6.4. Univariate ACE/ADE and nested models fit and parameter estimates for all the
hypothesized variables (MZ=207 pairs, DZ=72 pairs) ....................................................128
Table 6.5. A summary of estimates of the best-fitted models ..........................................................130
12
Table 7.1. Cross-twin cross-trait correlations between Chinese and ESL parallel measures at time 1
... 148
Table 7.2. Standardized unsquared path coefficients from bivariate Cholesky decomposition (and 95%
confidence intervals in parentheses) of additive genetic (A), shared environment (C), and
non-shared environment (E) correlations between time 1 Chinese and ESL reading-related
variables ...........................................................................................................................150
Table 7.3. Summary of three indexes yielded from bivariate twin analyses of Chinese and ESL
variables ...........................................................................................................................153
Table 8.1. Cross-twin cross-time correlations between time 1 and 2 of the same measures ...........160
Table 8.2. Standardized unsquared coefficients from bivariate Cholesky decomposition (and 95%
confidence intervals in parentheses) of additive genetic (A), shared environment (C), and
non-shared environment (E) effects between time 1 and time 2 reading-related variables in
ESL measures ...................................................................................................................161
Table 8.3. Standardized unsquared path coefficients from bivariate Cholesky decomposition (and 95%
confidence intervals in parentheses) of additive genetic (A), shared environment (C), and
non-shared environment (E) effects between time 1 and time 2 reading-related variables in
Chinese measures .............................................................................................................162
Table 8.4. Summary of three indexes yielded from bivariate twin analyses....................................164
13
LIST OF FIGURES
Figure Title Page
Figure 1.1: Causal processes of visual word recognition development in the ‘Autonomous’ view...38
Figure 1.2: Causal processes of visual word recognition development in the ‘Bootstrapping’ view.39
Figure 1.3: Causal processes of visual word recognition development in the ‘Lexical Restructuring
Model’. ...............................................................................................................................40
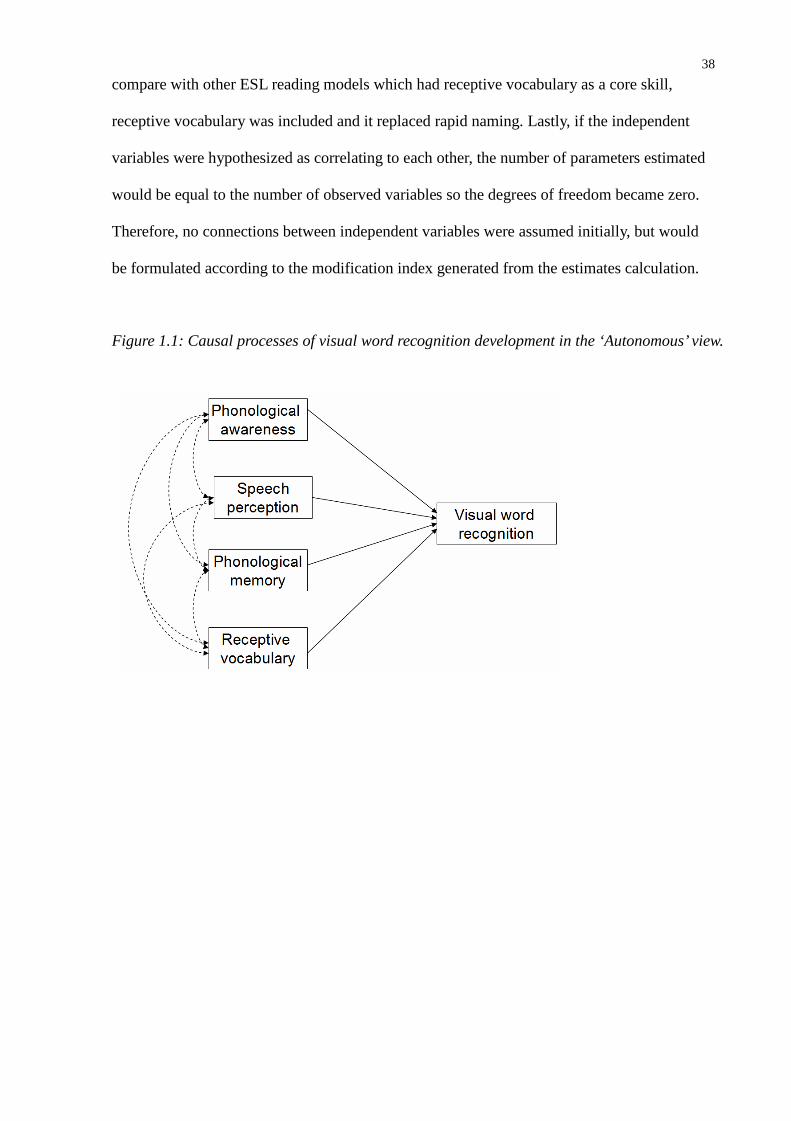
Figure 1.4: Causal processes of visual word recognition development in the ‘Independent Phonology’
view. ...................................................................................................................................41
Figure 2.1: Relations between first- and second-language reading acquisition and bilingualism
(Bialystok, 2007)................................................................................................................43
Figure 2.2: An overview of English and Cantonese consonant (Chan & Li, 2000)...........................52
Figure 2.3: An overview of English (left) and Cantonese Chinese (right) vowels (Chan & Li, 2000).
... 53
Figure 3.1: An instance of cubic regression curve fitting the data of Chinese visual word recognition
against age ..........................................................................................................................71
Figure 4.1: A complete procedure for structural equation modelling. ...............................................73
Figure 4.2: The final Path analysis model of the Autonomous model (McBride-Chang, 1996). ....79
Figure 4.3: The final Path analysis model of the ‘Bootstrapping’ model...........................................80
Figure 4.4: The final Path analysis model of the modified Lexical Restructuring Model. ................82
Figure 4.5: The final Path analysis model of the ‘Phonology independent’ model. ..........................84
Figure 4.6: The scree plot showing eigenvalues in the Exploration Factor Analysis ........................93
Figure 4.7: Summary of results of correlational analyses and exploratory factor analyses...............94
Figure 4.8: Bilingual lexical representations on the phonological map: (a), novice; (b), intermediate; (c)
advanced Chinese-English bilinguals (Zhao & Li, 2010). .................................................96
Figure 5.1: Bronfenbrenner’s (1979) ecological approach (adapted from Longitudinal Study of
Australian Children, 2009)...............................................................................................101
Figure 5.2: Levels of causation for reading abilities (Bishop & Snowling, 2004). .........................102
Figure 5.3: A path diagram for the classical twin study using MZ and same-sex DZ pairs reared within
the same family. ...............................................................................................................105
14
Figure 6.1: Proportion of variance explained (%) by additive genetic (A)/ non-additive genetic (D),
shared environmental (C) nd non-shared environmental (E) on Chinese measures at time 1
and 2 .................................................................................................................................131
Figure 6.2: Proportion of variance explained (%) by additive genetic (A)/ non-additive genetic (D),
shared environmental (C) nd non-shared environmental (E) on English measures at time 1
and 2 .................................................................................................................................132
Figure 6.3: Parasitism and advanced word learning in bilinguals....................................................134
Figure 7.1: For one member of a twin pair, latent factors represent A, C, and E influences on Chinese
variable (phenotype 1) and ESL variable (phenotype 2)..................................................146
Figure 7.2: For two members of a twin pair, latent factors represent A, C, and E influences on Chinese
variable (phenotype 1) and ESL variable (phenotype 2)..................................................147
Figure 9.1: A summary of findings of genetic analyses. ..................................................................170

15
SECTION 1
THE PHENOTYPIC ANALYSIS

16
CHAPTER 1 READING DEVELOPMENT IN THE FIRST LANGUAGE1.1 Chapter summary
In this chapter, I describe the background and objectives of this thesis. The literature
review centres on phonological skills which are important to word reading development. The
relationships among visual word recognition, receptive vocabulary, phonological awareness,
phonological memory and speech perception are discussed with respect to various theoretical
backgrounds such as the motor theory of speech, the lexical restructuring model (LRM) and
perceptual bootstrapping. At the end of the chapter, I will propose several hypothetical causal
models of reading acquisition to be tested among Chinese learners of English as a second
language (ESL).
1.2 General introduction
Reading to learn is an important survival skill for everyone living in the modern and
knowledge-based society because people communicate with and learn various forms of text.
The literacy rate usually ties to the economy of a country (Chiswick, Lee, & Miller, 2003) and
sometimes juvenile delinquency (Shelley-Tremblay, O'Brien, & Langhinrichsen-Rohling,
2007). Also, many entertainments including web surfing demand substantial reading skills.
Therefore, reading instruction is an essential part of education. Despite equal learning
opportunities in many places in the world, pervasive individual differences in reading ability
emerge early in development and remain steady over time (Cunningham & Stanovich, 1997;
Shaywitz, Morris, & Shaywitz, 2006). A large-scale international survey revealed that the
prevalence rates of developmental dyslexia estimated for school-age children ranged from 1%
to 11% (Smythe, Everatt, & Salter, 2004). The above phenomena motivate us to understand
the etiology of reading development.
Globalization results in more international communications. In many cultures, it is
popular and sometimes necessary to master more than one script. According to the Graddol
(2006), over a billion people are learning and using English as a second language for various
17
purposes. As the learning outcomes of reading a second script are diverse, and some
individuals are found at risk for specific learning difficulties in learning a second language, it
is essential to identify the sources of individual variations for pedagogical and diagnostic
reasons (Jia, 2006).
Past studies have shown that the success of bilingual acquisition depends upon a
wide range of factors such as meta-linguistic skills, learning motivation and quality of
education. Of the cognitive skills pertinent to reading development, phonological skills have
drawn the most attention from researchers and have been shown to be a critical factor for
reading development across cultures (Goswami, 2000). Recently, more research has been
devoted to discovering the ontogenesis of phonological skills. This issue is important because
the identification of the precursors of reading ability helps us to search the risk factors of
reading disability and track the developmental trajectory at the pre-literate stage. Recently,
more studies have been conducted on speech processing which is thought to be the foundation
for phonological skills (e.g., Hansen & Bowey, 1994; Hurford, 1991). The link between
speech processing and phonological awareness is not a simple one, but intertwines with the
development of other skills such as phonological memory and receptive vocabulary. The aim
of this study is to understand the inter-connections among the aforementioned skills.
Extending from what we have known about learning to read English as a first
language, this study explores English reading acquisition among Chinese speakers who speak
a tonal language and read a logographic script. The marked differences in language and
orthography between the first (L1) and a second language (L2) might give rise to unique
concurrent relationships among the hypothesized variables. Furthermore, it is also essential to
understand the cross-linguistic interaction between the two languages. A similar issue is
whether L1 and L2 skills involve common underlying cognitive processes (Geva, 1999).
18
Recent behavioural genetic studies have shown that reading abilities and
reading-related skills such as phonological skills are heritable (e.g., Gayan & Olson, 2003).
By employing the twin study method, we can partition the effects of genes and environment
that contribute to the individual variations in reading development. While a growing body of
research has indicated the genetic and environmental influences on the perceptual and
cognitive abilities underlying English reading development among native-speakers, very little
is known about these among learners of English as a second language (ESL). This thesis is a
pioneer ESL study using a twin study design.
This thesis is divided into two main sections. The first section examines the
phenotypic relationships of ESL and Chinese skills by testing several hypothetical causal
models using the structural equation modelling (SEM) approach. In the second section, I
conduct a series of univariate and bivariate genetic analyses to explore the genetic and
environmental effects on ESL and Chinese reading skills.
1.3 Operational definition of reading skills
The definitions of reading vary from time to time and from study to study.
According to the Simple View of Reading, reading involves two major components, namely
decoding and linguistic comprehension (Hoover & Gough, 1990). Decoding, also known as
visual word recognition, refers to the ability to retrieve semantic information from printed
input at the word level. Linguistic comprehension is the ability to take the meaning aspect of
words and derive sentence and discourse interpretations. Although visual word recognition
can be influenced by linguistic context, the two components are empirically proven as
separable. On the one hand, dyslexic children with average or even superior linguistic
comprehension have difficulties in decoding printed words. On the other hand, individuals
diagnosed with hyperlexia were found to have superior decoding skills but impaired linguistic

19
comprehension (Healy, 1982). In the present thesis, I focus on the investigation of visual word
recognition which is a critical element of reading on its own
There are two major models of visual word recognition, the dual route model (Coltheart,
2006) and the Triangle model (Harm & Seidenberg, 2004; Seidenberg & McClelland, 1989).
Despite differences in the ways in which these two models conceptualise the underlying
mechanisms of word reading processes, both models acknowledge that two different kinds of
process underlie visual word recognition in skilled readers of English. The dual route model
consists of two processing routes. The nonlexical phonological route successfully decodes
regular words and nonwords by application of grapheme-phoneme correspondence rules;
following successful decoding, word meanings are retrieved from the phonological form.
Exception words cannot be read accurately by this route as they violate GPC rules. The
lexical route gives direct access to semantics from orthography, and is successful in reading
both regular and exception words, but not nonwords, as by definition these are not stored in
the orthographic lexicon. The Triangle model proposes two sets of processes, phonological
and semantic, which in combination can successfully read regular and exception words and
nonwords. Thus, both models recognise the important contributions of both phonology and
semantics to visual word recognition. Therefore, phonological skills and receptive vocabulary
will be examined in this thesis.
The cognitive approach of reading research studies the mental and lexical
representation, perceptual and cognitive processes, and the meta-linguistic skills that guide
reading development (Lundberg, 1991). In the literature of reading research, terminologies
such as ‘word identification’ and ‘word detection’ are used to denote the same reading task.
Other important aspects of reading such as reading fluency and comprehension are beyond the
scope of this thesis. In short, the operational definition is the accuracy of English real word
20
reading and Chinese character recognition i.e. visual word recognition in the two languages.
1.4 Using a ‘component skills analysis’ approach to conceptualize reading
As Carr, Brown, and Vavrus (1985) pointed out, many reading researchers have
addressed a single or selective number of reading-related skills in their studies, without
conceptualizing a system of reading. The “component skills analysis” (CSA) approach has
been proposed to study the relative contributions of different domains of knowledge and
processing procedures (Levy & Carr, 1990). In this approach, reading is conceptualized as ‘a
kind of a complex information-processing system within which a number of theoretically
distinctive and empirically separable knowledge-process component skills interact to support
perception, comprehension, and memory of visually presented language.’ (Carr et al., 1985)
This approach establishes a solid basis for theory construction, validation and refinement.
Testing of reading models suggested by the CSA approach requires the application of
multivariate statistics. Although statistical theory for today’s multivariate techniques was
developed long ago, these techniques could not be applied to data analysis until statistical
packages became available for personal computer users. With the continued advancement of
statistics (e.g. structural equation modelling, SEM) and computational power, reading models
that hypothesize multiple causal cognitive processes can be tested by fitting the data to SEM
structural models. The use of SEM also allows us to compute and control for measurement
error and test for mediating effects. The Convergent Skills Model is an instance of a
comprehensive reading model validated by SEM (Vellutino, Tunmer, Jaccard, & Chen, 2007).
In this thesis, I will compare several models of the development of visual word recognition
against each other using SEM to understand ESL reading development.
1.5 The influences of phonological awareness on reading development
Learning to read involves the acquisition of a system for mapping between the
sound units of a language and the visual symbols of a corresponding writing system. The

21
process of learning and applying these mappings is termed phonological recoding (Ziegler &
Goswami, 2005). One factor that determines the outcome of phonological recoding is how
well the learners access and manipulate the phonological units which are associated with
contrasting meaning. This ability is termed 'phonological awareness'. There has been a
consensus that phonological awareness is one of the best predictors of early success in reading
acquisition in alphabetic languages (Adams, 1990; Cunningham & Stanovich, 1997; Wagner
& Torgesen, 1987). It predicts not only the reading level of typically-developing children, but
also reading difficulties and developmental dyslexia (e.g., Bradley & Bryant, 1983). It has
been shown to predict reading outcomes even before formal reading instruction begins
(Puolakanaho et al., 2007). Moreover, training in phonological awareness significantly
enhances children’s ability to read (Ehri, Nunes, Willows, Schuster, Yaghoub-Zadeh, &
Shanahan, 2001).
In alphabetic languages, letters or letter-strings in printed words typically represent
phonemes in spoken words; therefore, children’s abilities to segment and manipulate
phonemes in spoken words are believed to give them an advantage in learning to read. This
phoneme awareness is proven to be important for learning to read an alphabetic script
effectively (Brady, Fowler, Stone, & Winbury, 1994; Liberman, Shankweiler, Fischer, &
Carter, 1974). Goswami and Bryant (1990) argued that the ability to consciously access
phonemes only develops later as a consequence of print exposure and reading instruction. For
example, phonological categories of final nasal consonants in English are created by children
studying in primary school (Treiman, Zukowski, & Richmond-Welty, 1995).
The awareness of larger phonological units is also helpful in reading development.
Bryant, MacLean, and Bradley (1990) showed that rhyme and alliteration abilities in young
children predicted their subsequent progress in learning to read and spell. They argued that

22
children who were aware that words that rhyme often share spelling sequences were superior
in reading unfamiliar words. Goswami (1986, 1988, 1990), using a ‘clue word’ task, claimed
to have shown that children were quicker to learn to use rime-based analogies to read novel
words. However, Bowey, Vaughan and Hansen (1998) and Nation, Allen and Hulme (2001)
provided counter evidence to challenge the interpretation of these findings. They argued that it
was the phonological priming effect of saying the words that rhyme with the novel word (clue
word), plus children’s own partial decoding attempts that contributed to improved novel word
reading. Furthermore, Savage and Stuart (1998) showed that similar improvement on novel
word reading could be obtained if clue words were able to provide the pronunciation of the
medial vowel digraph of target words. Nevertheless, Bryant, Maclean, Bradley, and Crossland
(1990) suggested that good rhyme skills facilitate the development of phoneme awareness,
which in turn facilitates reading, possibly by allowing children to master letter–sound
correspondences by sounding out words explicitly. Macmillan (2002) argued in her review
paper that the importance of onset-rime skills as a predictor of reading was over-estimated.
Other studies have generally found phoneme skills to be better predictors of subsequent word
recognition abilities than are onset–rime skills (Duncan, Seymour, & Hill, 1997; Hulme et al.,
2002; Muter, Hulme, Snowling, & Taylor, 1997). These studies found that rhyme skills
explained no unique variance in later reading scores after phoneme skills had been controlled,
whereas phoneme skills remained a unique predictor after rhyme skills were controlled. In a
recent extensive review of reading research, Castles and Coltheart (2004) found almost no
evidence that phonological awareness precedes and influences reading acquisition. However,
Hulme, Snowling, Caravolas, and Carroll (2005) argued that such conclusion was based on a
narrowly-defined causation and the ignorance of other factors (e.g., letter knowledge) that
either mediated or moderated the link between phonological awareness and reading. This
complicated relationship between phonological awareness and reading call for further studies
to clarify the link.
23
1.6 Ontogeny of phonological awareness
Given the importance of phonological awareness, it is of no surprise that various
attempts have been made to discover the precursors of phonological awareness. There is
growing evidence that individual variations in phonological awareness result from differences
in a child’s phonological representations (Brady, 1997; Elbro, 1996; Goswami, 2000; Metsala
& Walley, 1998; Snowling, 2001). Phonological representations hold the speech sound
information and abstract phonological features of spoken words and are influenced by a
variety of phonological processing abilities, such as articulation, speech perception,
phonological memory, vocabulary, etc (e.g., Anthony et al., 2009). Functionally, phonological
representations are the basis for individuals to gain access to words’ meanings and
orthographic representations. Phonological representations have been described in terms of
distinctive features (Elbro, 1996), connectionist units (e.g., Plaut, McClelland, Seidenberg, &
Patterson, 1996; Seidenberg & McClelland, 1989) or patterns of motoric movements of the
articulators (Liberman, 1999). Irrespective of one’s conceptualization, accessing phonological
representations is critically important for oral and written communication.
Below I discuss several theoretical views that specify the nature of phonological
representations and their development. The differences across various views rest on the nature
and roles of perceptual and cognitive skills, the ontogenesis of phonemes and the learning and
developmental mechanisms. The four views are termed ‘Autonomous’, ‘Bootstrapping’,
‘Lexical restructuring model’ and ‘Independent phonology’.
1.7 Speech perception
Before describing the role of speech perception in various views, it is useful to
summarize the main features of speech perception. Speech perception involves three
complementary skills; the ability to tell that a sound has occurred (detection), the ability to
24
distinguish different sounds (discrimination) and the ability to treat sounds that are
acoustically different as equivalent (classification/ phoneme constancy) (Bishop, 2001). A
range of tasks have been invented to tap different aspects and levels (e.g., acoustic, phonetic
and phonemic/ phonological) of speech perception. Apart from natural speech stimuli,
non-speech or synthetic speech stimuli are widely presented in experiments. Commonly used
speech perception tasks involve the identification and discrimination of sounds in a
continuum across a phonemic boundary (categorical perception), and the auditory
discrimination of minimal pairs of words (see Stackhouse, Vance, Pascoe, & Wells, 2007 for
details).
1.8 The Autonomous view of reading development
The mechanism by which speech perception enhances phonological awareness and
reading is not well-documented. It may be the necessity of accurate phoneme identification in
phoneme awareness underlies the apparent relationship between speech perception and
phonemic awareness. Based on the premise that we need a common ground for
communication and it is speech, Liberman (1999) argued that speech is comprised of
consonants and vowels which are intrinsically articulatory gestures (as opposed to the
proposal that speech is non-linguistic motor representations) and are operated in a Phonetic
mode which is shared only among mankind. Liberman, Shankweiler, and Liberman (1989)
have argued that phonemic units are present and function in infancy. However, it requires
reading experience with an alphabetic orthography or with meta-cognitive development more
generally to make the phonemes accessible at the conscious level. Meta-linguistic skills are
interpreted as a subset of a general meta-cognitive control over information processing which
emerges at the concrete operational stage (Piaget, 1985) in middle childhood (Tunmer,
Herriman, & Nesdale, 1988). This ‘Autonomous’ view conceptualizes meta-linguistic
awareness as a distinctive type of linguistic functioning that develops independently from,
and later than, basic linguistic acquisition, but concomitant with the emergence of literacy

25
(Smith & Tager-Flusberg, 1982). In this view, language comprehension and production skills
develop first and without need for meta-linguistic awareness during the preschool years.
About age 6 or 7, children develop the capacity for meta-linguistic awareness when they are
confronted with reading and writing tasks. Empirical evidence in support of the autonomy
hypothesis comes from numerous studies that show that typically-developing children aged 6
to 8 years are competent in a range of meta-linguistic skills, but that preschool children cannot
successfully manage tasks that require them to make explicit judgments about linguistic form.
In studies of phonological awareness development, most 5 to 7 year-olds are found capable of
discriminating similar phonemes but not segmenting spoken words into phonemes (Calfee,
Lindamood, & Lindamood, 1973; Liberman, Shankweiler, Fischer, & Carter, 1974). Children
under 7 years of age have difficulty isolating words from the objects the words refer to
(Markman, 1976) and seem to regard the names as inherent properties of the objects
themselves. Although children's performance on meta-linguistic tasks increases with age (e.g.,
Hakes, 1980; Liberman et al., 1974), the generally poor performance of young children has
led many researchers to conclude that preschool children lack the ability to separate form
from meaning, and that meta-linguistic awareness is a distinctive type of language skill that
emerges after age 6. However, this view has been challenged and later research has shown
that young children are able to segment words into phonemes (e.g. Stuart, 2004).
1.9 Speech perception bootstraps phonological awareness
By detailed phonetic analyses, researchers failed to find evidence for a unique
acoustic property that was an invariant correlate of a phonological feature (Lindau &
Ladefoged, 1986). One way to resolve this ‘mismatch’ problem is to conceptualize speech
learning as statistical learning (Saffran, Johnson, Aslin, & Newport, 1999). For example, the
distribution of patterns of sounds provide a salience cue for word segmentation. Given a
letter-string such as ‘ele’, there is a tendency to anticipate either ‘phant’ or ‘vator’. Rather
than a one-to-one phonological mapping, the connection between speech perception and
26
phonological awareness might be many-to-many and rooted in statistical learning, with
speech perception an earlier learning outcome than phonological awareness. This seemingly
causal relationship between speech perception and phonological awareness could also be
explained by the idea of ‘Bootstrapping’ – using existing knowledge to facilitate acquisition
of novel abilities (Werker & Yeung, 2005). For instance, vowel discrimination tasks at 6
months predict vocabulary size, as well as scores on other language measures at 13–24
months of age (Tsao, Liu, & Kuhl, 2004). In addition, electrophysiological measures of
phonetic discrimination recorded in infancy are linked to reading proficiency in children 3 to
8 years of age (Molfese & Molfese, 1997).
Developmentally, humans possess a set of innate perceptual biases which initiate
subsequent statistical learning in perceptual systems. For instance, foetuses appear to show
preference for their mother’s voice, stories and songs heard prenatally, and their native
language (Fifer & Moon, 2003; Kisilevsky et al., 2003). These studies confirm that prenatal
auditory experience tunes neonatal perception. By at least 9 months, infants are able to detect
the frequency, distribution, and other statistical properties of perceptual input in speech
(Saffran, Werker, & Werner, 2006). Highly frequent phonetic contrasts and phonotactic
patterns (i.e. legitimate combinations of sounds) are categorized in a language-specific
manner at younger ages while less frequent ones are ignored (Anderson, Morgan, & White,
2003). After repeated exposure to lists of nonsense words, infants can recognize the recurring
sound patterns and make generalizations about syllable structure (Saffran & Thiessen, 2003),
stress (Gerken, 2004) and phonotactic patterns (Chambers, Onishi, & Fisher, 2003). A change
of frequency distribution of the speech input can modify the phonetic categories in infants at
6–8 months of age (Maye, Werker, & Gerken, 2002).
Following the early perceptual biases, statistical learning guides further speech
27
perception development. Frequency detection also triggers the ‘Perceptual magnet effect’
(Kuhl, 2004), where central exemplars serve to draw other members from the same phonemic
category, thus diminishing discrimination within a category (e.g. the allophones of /d/, says
[d1,2,3,…x] are grouped into the phoneme /d/). Indeed distributional input might drive
functional reorganization by shrinking and expanding the perceptual distances within and
between categories (Iverson et al., 2003). Another statistical regularity that infants are
sensitive to is ‘transitional probability’, learning that syllables from within a single word have
a higher chance to co-occur than syllables from separate words (Saffran, Johnson, Aslin, &
Newport, 1999). Once word forms can be segmented and represented, abstract linguistic units
can be mapped on concepts. Then, vocabulary learning and qualitative improvement in its
efficiency can be achieved.
Through maturation, speech perception bootstraps the development of phonological
awareness. McBride-Chang (1995) tested sample of 91 typically developing third-grade
children and 45 fourth-grade children and found that a latent speech perception factor based
on three identification tasks contributed unique variance in a phonological awareness
construct, even after controlling for vocabulary knowledge and verbal short-term memory.
Similarly, categorical speech perception and phoneme awareness were moderately correlated
in a 15-month longitudinal study of 142 kindergarten children at the age of 5 (McBride-Chang,
Wagner, & Chang, 1997). Gibbs (1996) found similar but delayed effects at the onset of
reading, with speech perception ability at five and six years predicting phonological
awareness at six and seven years, respectively. In a more recent study, Boets, Wouters, van
Wieringen, De Smedt, and Ghesquiere (2008) showed that speech perception has direct and
indirect effects (via phonological awareness) on reading in typically-developing 5-year-old
Dutch children. In another study, Watson and Miller (1993) showed substantial relationship
between speech perception and phonemic awareness among 94 college undergraduates, with

28
24 reading disabled readers. Using a different approach, Snowling, Hulme, Smith, and
Thomas (1994) showed that a reduction of phonetic similarity between the odd word and the
background items resulted in fewer errors in less demanding awareness measures such as
rhyme oddity (identifying which of three words does not rhyme with the others). These
findings again point to the importance of perceptual factors in ability to analyze the
phonological structure of words. In a training study, Hurford (1990) trained dyslexic children
from second and third grades for a total of 2-3 hours on phoneme discrimination for a number
of phoneme pairs, proceeding from a vowel pair to a liquid pair and finally to a pair of stop
consonants. Subsequently phonemic awareness was significantly enhanced.
However, a small number of studies failed to obtain noteworthy correlation between
early speech perception and later reading success (Mann & DiTunno, 1990; Scarborough,
1996). In response to these negative results, Brady (1997) argued that simple discrimination
or identification tasks with high frequency monosyllabic words, may not be sufficiently
sensitive to tap individual differences. Also, variations in early speech perception skills are
overshadowed by changes in phonology induced by the development of awareness, i.e. similar
changes are undergoing in speech perception and phonological awareness. Interestingly, the
ability to discriminate phonemes has its own developmental trajectory and is bootstrapped by
perceptual biases that emerge before it.
Postulated in an opposite direction, phonological awareness was found to influence
speech perception in multiple studies. Fowler, Brady, and Eisen (1995) compared 5-year-old
children who had attained phoneme awareness with those who were still naïve about
phonemic segments. Fully 100% of the children who were phonemically aware could identify
un-ambiguous end point stimuli on ‘s(vowel)’ and ‘sh(vowel)’ contrasts whereas less than half
of those lacking awareness of phonemes could identify to 90% criterion which syllable had
29
been presented. In Moore, Rosenberg, and Coleman’s (2005) study, a group of typically
developing 8 to 10-year-olds showed better performances in phoneme awareness task after 6
hours of phonemic contrast discrimination training. In another training study, Fowler, Brady,
and Yehuda (1995) found that a total of 90 mins of awareness training on /s/ and /f/ phonemes
could enhance categorical perception of phonemes, suggesting that acquiring awareness
sharpens differentiation of phonemic categories. Additional evidence is documented to
support the claim that progression in phonological awareness seems to stimulate (or at least
precede) development in speech perception (Mayo, Scobbie, Hewlett, & Waters, 2003;
Warrier, Johnson, Hayes, Nicol, & Kraus, 2004).
Although bidirectional relationships between speech perception and phonological
awareness are evidenced, due to the early emergence of speech perception in prior to
phonological awareness, it is still reasonable to believe that phonological awareness is
developmentally contingent on the perception of speech sounds and speech perception
bootstraps the development of phonological awareness, phonological memory, vocabulary and
reading by perceptual learning in the form of statistical learning.
1.10 Lexical restructuring model (LRM)
In contrast to the ‘Autonomous’ view, the ‘Emergent’ view suggests that children as
young as 3 years old can analyze language structure independent of meaning by a mental
framework (Chaney, 1992). Such ability helps solve real problems in oral communication,
such as identifying the word boundaries in a sentence. Sharing a similar view, the Lexical
restructuring model (LRM) suggests that ‘phoneme is not an integral, hard-wired aspect of
speech perception and processing, rather it emerges with spoken language experience as a
result of interaction between vocabulary growth and performance constraints.’ (Walley, 1993)
In other words, developmental changes in vocabulary knowledge are important for the

30
development of phonological awareness, especially at the phoneme level. The development of
the phonological system take two steps, first as structuring the implicit perceptual unit used in
basic speech processing, and later as structuring the explicit unit that can be deployed for
reading.
Since pre-literate children start out with small vocabulary size, holistic phonological
representations are enough for storing and processing of vocabulary (e.g., Jusczyk, 1993).
More precisely, the phonological aspects of vocabulary are represented in the form of physical
and acoustic markers of changes (e.g., changes in amplitude) in the complex speech wave
form (Vihman & Croft, 2007). With rapid vocabulary growth, especially with the “vocabulary
growth spurt” around 18 months for most children, a growing number of words overlap in
their acoustic properties, thus, it is hard to differentiate phonologically similar words. In this
situation, there should be considerable pressure to implement more fine-grained phonological
representations that are composed of smaller speech-based segments such as phonemes that
specify distinctive features of these sounds (such as place of articulation, which distinguishes
/b/ from /d/) (Aslin, & Smith, 1988; Fowler, 1991; Goswami, 1999). Lexical restructuring in
pre-literate children largely takes the form of the representation of phonological segments
corresponding to syllables, onsets and rimes (Gombert, 1992). At the early stage, this
restructuring would involve ‘epilinguistic’ representation such that children should be able to
recognize whether words share syllables, onsets and rimes (epilinguistic processing), but
would not necessarily be able to identify and produce these phonological units as required by
most ‘metalinguistic’ tasks (metalinguistic processing requires the identification and
production of phonological segments). In the normal course of development, the phonological
aspect of this representation is re-represented gradually and restructured a number of times.
The degree to which segmental representation has taken place is in turn thought to determine
how easily the child will become phonologically aware and will learn to read and write.

31
Various lines of research have validated different aspects of the LRM. A gating
paradigm has been used to study the degree of word segmentation across age. Metsala (1997)
presented the listeners with increasing amounts of acoustic-phonetic information from word
onset over a series of trials. The listener then tried to guess the identity of the target word after
each gate. Identification on the basis of a small amount of acoustic-phonetic information
suggests segmental organization. The occurrence of this process depends on the frequency
and density of neighbourhoods of the words. High-frequency words and words that shared a
lot of phonological similarity with other words (in dense neighbourhoods) demanded the most
discrimination and therefore less acoustic-phonetic information was needed for the gating task
(see Inglis, Newsome, Tang, & Martin, 2002 for a demonstration on the internet). As age
increased, the phonological representations of became more segmental and the need of
acoustic-phonetic information was reduced.
The LRM also postulated a positive relation between vocabulary size and
phonological awareness. Receptive vocabulary knowledge has been found to contribute to the
development of phoneme awareness from kindergarten through second grade, irrespective of
reading ability and linguistic environment at home (Cooper, Roth, Speece, & Schatschneider,
2002; Foy & Mann, 2001). In one study, Metsala (1999) found that children with above
median vocabulary test scores had superior phonological awareness, comparing to the
children in the bottom half of the vocabulary score distribution. An interaction between the
density of word neighborhoods was observed. In the first year of this study (Garlock, Walley,
& Metsala, 2001), the researchers found that early acquired words from sparse neighborhoods
predicted phonological awareness, whereas recognition of dense words did not. However,
Metsala (1997) showed that young children were better at a rime oddity task for words from
dense than sparse rime-neighborhoods and children with higher vocabularies performed
particularly well for the more difficult judgments involving final consonants (e.g., meat, seat,

32
weak; De Cara & Goswami, 2003). Similarly, 3- to 4-year-olds performed better on a
phoneme blending picture-matching task for words from dense versus sparse neighborhoods
(Metsala, 1999). For the youngest group of participants in that study (about 7 years of age),
recognition of words from sparse neighborhoods, together with phoneme awareness, predicted
word and pseudoword reading. Taken together, these findings suggest that spoken vocabulary
growth prompts words in dense neighbourhoods to be more differentiated in lexical
representations, and leads to development of literacy skills (e.g., Chaney, 1994; DeCara &
Goswami, 2003; Metsala, 1999; Thomas & Senechal, 1998).
However, it should also be noted that the establishment of detailed phonological
information would be a pre-requisite of vocabulary growth (Dollaghan, 1994). Rather than
structural changes of phonological representations per se, Storkel (2002) has proposed a weak
version of lexical restructuring, according to which the salience of the phonological overlap
among different words (or neighbourhood membership) shifts in development. She argues that
redirection of attention to perceptual salience can better handle the variability in children’s
performance across different tasks, such as the salience of syllable onsets in word perception
and production versus the salience of rimes for some similarity judgments. In a study,
14-month-olds fail to detect the same phonetic detail in a word-object pairing task that they
(and younger infants) easily detect in a simple syllable discrimination task (Stager & Werker,
1997). Nevertheless, LRM focuses more on developmental changes in representation and/or
processing at the word level, than on infants’ basic discrimination and categorization abilities
(Walley, 1993).
Apart from prompting word segmentations, vocabulary has its unique role in
supporting the development of visual word recognition skills (e.g., Bryant, Maclean, &
Bradley, 1990; Stevenson, Parker, Wilkinson, Hegion, & Fish, 1976). It is argued that
33
vocabulary knowledge facilitates the creation of mappings between orthographic,
phonological, and semantic representations in a child’s developing lexical system (Nation &
Snowling, 1998; Plaut, McClelland, Seidenberg, & Patterson, 1996). A closer examination has
revealed differential patterns of such links (Nation & Cocksey, 2009). For instance, Goff,
Pratt, and Ong (2005) found that receptive vocabulary showed a stronger correlation with
irregular word reading (r=.53) than with nonword reading (r=.28) in 10-year-olds. Bowey and
Rutherford (2007) reported the same pattern in a group of 13-year-olds, with receptive
vocabulary correlating .57 with irregular word reading but only .39 with nonword reading. In
contrast, Ouellette (2006) has found that receptive vocabulary breadth (the number of stored
vocabulary entries) alone predicted decoding performance, whereas expressive vocabulary
breadth (the abilities of identifying synonyms and providing definitions) predicted visual
word recognition.
It is important to note that speech perception is not excluded in the LRM, but it
plays its role in the development of epilinguistic skills which are not consciously accessible.
Only by vocabulary acquisition can changes be made at the phonological level which leads to
the emergent of meta-linguistic skills.
1.11 A unique relation between phonological memory and vocabulary
In addition to phonological awareness, the quality of children’s phonological
representations plays an important role in phonological short-term memory (Phonological
memory; Brady, 1997; Gathercole, Willis, Emslie, & Baddeley, 1992). For example,
phonological memory, measured by nonword repetition tasks was related to spoken
vocabulary size and vocabulary acquisition (Gathercole, 1995; Gathercole, Hitch, Service, &
Martin, 1997). Development of phonological memory also makes a distinct contribution to
word reading independent of phonological awareness (Wagner & Torgesen, 1987). Fowler
(1991) has argued that children who have degraded phonological representations will
34
experience significant difficulties in encoding, rehearsing, storing, and retrieving speech
stimuli from memory. Indeed, there is considerable evidence that poor readers perform less
well on measures of phonological memory (Siegel & Ryan, 1988). Thus, phonological
representations have pervasive effects throughout the phonological system.
The nature of phonological memory has been described in the working memory
model (Baddeley, 1986). As a phonological loop, it comprises both a phonological store,
which holds information in phonological form, and a rehearsal process, which serves to
maintain decaying representations in the phonological store. By abstracting the core features
from temporary representations held in the phonological loop, stable phonological
specifications of words can be built and turned into a corresponding entry in lexical long-term
memory (Gathercole & Baddeley, 1993). This account has been supported in the findings of
Gathercole, Willis, Emslie, and Baddeley (1992; nonword repetition in 4-year-olds predicted
vocabulary size at 5 years of age, with the reverse relationship not being supported. Similar
results were obtained in experimental settings. Superior phonological memory function is
associated with greater facility in more rapid learning of the phonological aspects of new
words (Gathercole, Hitch, Service, & Martin, 1997). For instance, in Gathercole and
Baddeley’s (1990) study, 5-year-old children were asked to learn new names of toy animals.
The experimenter paired four toy animals with either a familiar name such as Michael or
phonologically unfamiliar names such as Meeton. The children with high nonword repetition
ability outperformed children with low nonword repetition ability in learning the
phonologically unfamiliar names. In contrast, no noteworthy difference in the rates at which
the two groups of children learned the familiar names was observed. However, the findings
with older children did not support this direction of causality. For children age 4 to 6 and 6 to
8, vocabulary size predicted later performance on nonword repetition tasks, but the converse
relationships were not significant.
35
A second account of the association between nonword repetition and vocabulary
size takes an opposing direction - it is long-term lexical knowledge that influences nonword
repetition. Snowling, Chiat, and Hulme (1991) argued that existing vocabulary knowledge
(particularly the knowledge about the structure of English words) contributes to performance
on nonword repetition tasks. Consistent with this account, Dollaghan, Biber, and Campbell
(1995) have shown that children repeat multi-syllabic nonwords that have a word in the
position of a stressed syllable better than matched nonwords without the lexical component.
These investigators reported the improved performance was due to better repetition of the
remaining, unstressed syllables in the nonword. Also, Dollaghan et al. (1995) observed that
the majority of errors in nonword repetition were due to substituting a word in place of a
non-lexical syllable. These authors concluded that lexical knowledge intruded on performance
in nonword repetition, and then questioned whether phonological memory can be assessed
independent of long-term lexical knowledge. To counter this argument, Gathercole (1995)
tested if the performances of nonword repetition are confounded by wordlikeness, i.e., how
much a nonword stimuli like a real word. Nonwords rated low in wordlikeness would not
closely resemble any known word pattern words and would be thought to have less
contribution from lexical knowledge. Indeed, a stronger association was found between the
performance on nonwordlike (versus wordlike) repetition and vocabulary size. Thus, it was
proposed that the repetition of nonwords rated low in wordlikeness was a purer or more
sensitive measure of phonological short-term memory.
The association between nonword repetition and vocabulary size is also postulated
in the LRM based on the overlap of phonological representations between the two skills. This
is because it will only be possible to maintain temporary representations of unfamiliar items if
the items can be robustly stored in the first place, although it is also true and necessary that
more segmented lexical representations will lead to better flexibility in rearranging individual

36
phonemes in new patterns and thus to more robust representations of nonwords. Vocabulary
size, word familiarity, and phonological relatedness between words, collectively propel the
segmental structure of lexical–phonological representations; these representations, in turn,
support nonword repetition (e.g., Edwards, Beckman, & Munson, 2004; Metsala, 1999). In
Metsala’s (1999) study, vocabulary knowledge was strongly associated with nonword
repetition scores for 3- to 5-year olds. The shared variance of this association was accounted
for by phonological awareness measures, indicating an overlap between phonological
awareness and phonological memory.
A third account is that it is the speech output rather than the prior encoding and
storage components of phonological memory tasks that explain the link found with
vocabulary knowledge (Snowling, Chiat, & Hulme, 1991). Nonword repetition requires
accurate planning and execution of speech-motor gestures which will yield a correct sequence
of phonological output which corresponds to a retrieved memory representation. Articulatory
accuracy is particularly important in the nonword repetition task, where a single phoneme
deviation is scored as an error (Gathercole & Baddeley, 1996). Some children's phonological
production systems take a long time to mature and may never be fully accurate, and this
output problems will result in systematic underestimation of the true phonological memory
capacities of children if recall-only measures are used (Snowling & Hulme, 1989; Wells,
1995).
Based on the above views and empirical evidences of various links among the
hypothesized variables, I developed several Path analysis models and compared the extent to
which the data fit these models. There are several factors that affect how we interpret the
findings of this thesis in respect to the past studies of English reading acquisition in L1. First,
with participants spanning around a large age range, I am not arguing that the changes are

37
akin to development stages. Rather, in the context of individual differences, I can model how
each of the skills feedforward and feedback in a system of reading. As the L1 background
should have influences on L2 reading acquisition, though I use various models of L1 English
reading models as a reference, I am not going to validate these models in their original forms.
Instead, these models provide an empirical framework for this thesis to conceptualize and
understand ESL reading acquisition. In chapter 4, separate model will be tested with the
inclusion of L1 measures.
1.12 A summary of evidence-based models of reading
The present thesis tests the relative strengths of several reading development models
that simulate the trajectory of ESL reading development among Chinese children. Based on
the literature review above, four hypothetical causal models for ESL reading development
were proposed.
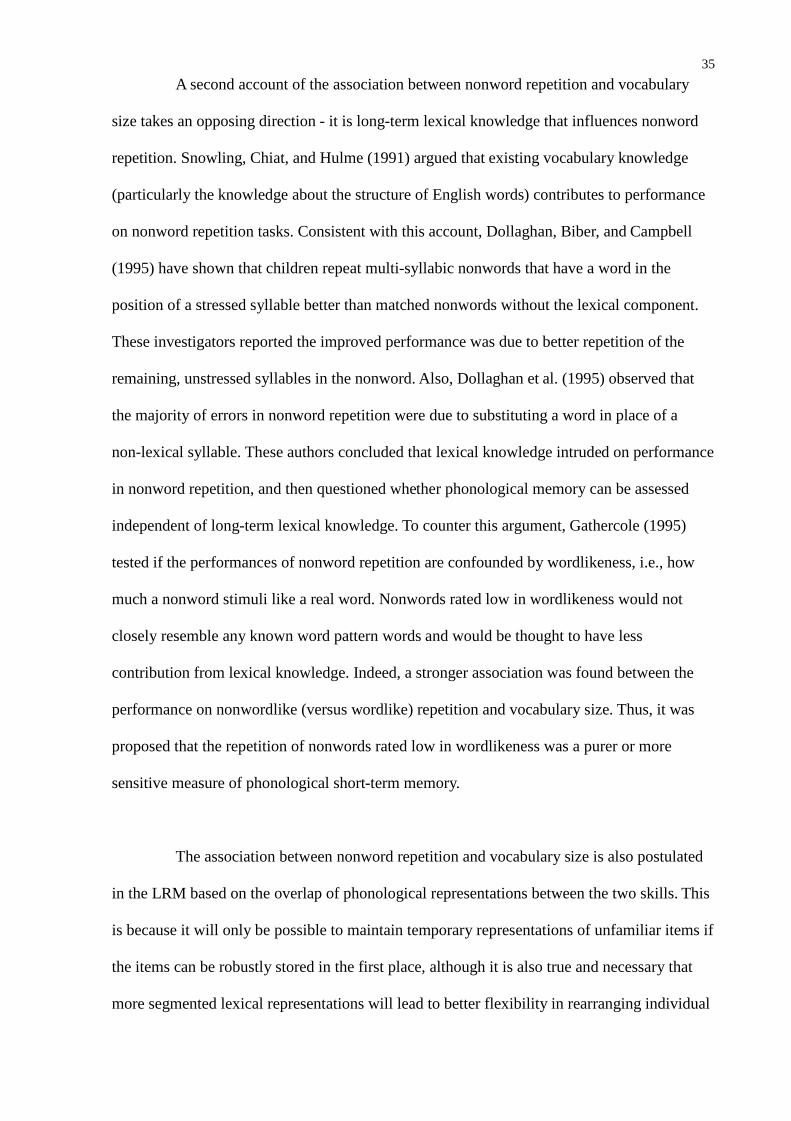
The first model was constructed according to a data-driven model validated in a
previous study of English-speaking children (McBride-Chang, 1996). This model would
represent the ‘Autonomous’ view which built on the motor theory of speech, the
representations of speech perception and phonological awareness (especially at the phoneme
level) are both in the form of articulatory gestures and this leads to the hypothesis that speech
perception should be highly correlated with phonology related skills. In McBride-Chang’s
(1996) final best-fitted model (termed ‘Indirect’ model in her paper), latent constructs of
phonological awareness, phonological memory, speech perception, rapid naming were
correlated, and each of the skills except speech perception causally linked to reading abilities.
The effect of speech perception on reading is mediated via phonological awareness. A model
of ESL reading is constructed based on the ‘Indirect’ model. There were several discrepancies
between the original and the modified ‘Indirect’ models. First, with fewer measures of the
same domain of skills, observed variables instead of latent variables were tested. Second, to
38
compare with other ESL reading models which had receptive vocabulary as a core skill,
receptive vocabulary was included and it replaced rapid naming. Lastly, if the independent
variables were hypothesized as correlating to each other, the number of parameters estimated
would be equal to the number of observed variables so the degrees of freedom became zero.
Therefore, no connections between independent variables were assumed initially, but would
be formulated according to the modification index generated from the estimates calculation.
Figure 1.1: Causal processes of visual word recognition development in the ‘Autonomous’ view.

39
The second model was developed based on the idea of ‘Bootstrapping’ (figure 1.2).
Speech perception of which its development was guided by our innate perceptual biases since
prenatal stage, was thought as a foundation for all the subsequent phonological development.
This model hypothesized that speech perception bootstraps the development of
phonological-related skills under the operations of a set of statistical learning mechanisms.
Also, guided by the statistical learning mechanisms, the resulting phonological skills then
bootstrap reading development.
Figure 1.2: Causal processes of visual word recognition development in the ‘Bootstrapping’ view.
The third model was based on the Lexical restructuring model (LRM) (figure 1.3).
The main hypothesis of this model is the causal route from receptive vocabulary to
phonological awareness. It is vocabulary growth that pressurizes the phonological
representations to become more segmental so to make phonological units consciously
accessible for reading development. In this model, speech perception is responsible for
refining the inaccessible layer of phonological representations. Also, it is hypothesized that
the phonological memory span is largely contributed by the segmental nature of phonological
representations.

40
Figure 1.3: Causal processes of visual word recognition development in the ‘Lexical Restructuring
Model’.
The construction of the fourth model was motivated by the distinctive functions
served by phonological awareness and phonological memory (Wagner & Torgesen, 1987).
Although the two skills are in the domain of phonology, phonological awareness is more
related to the access and manipulation of phonological units, while phonological memory is
more concerned with the temporal storage of phonological information and the conversion of
information stored temporarily in short-term memory storage to long-term lexical knowledge.
It is hypothesized that phonological awareness has a direct impact on reading development,
whereas, phonological memory has a more direct relation with receptive vocabulary and the
latter contributes to reading development. Built upon the research evidence of ‘perception as a
pre-requisite of awareness’, speech perception and phonological awareness are causally
linked.
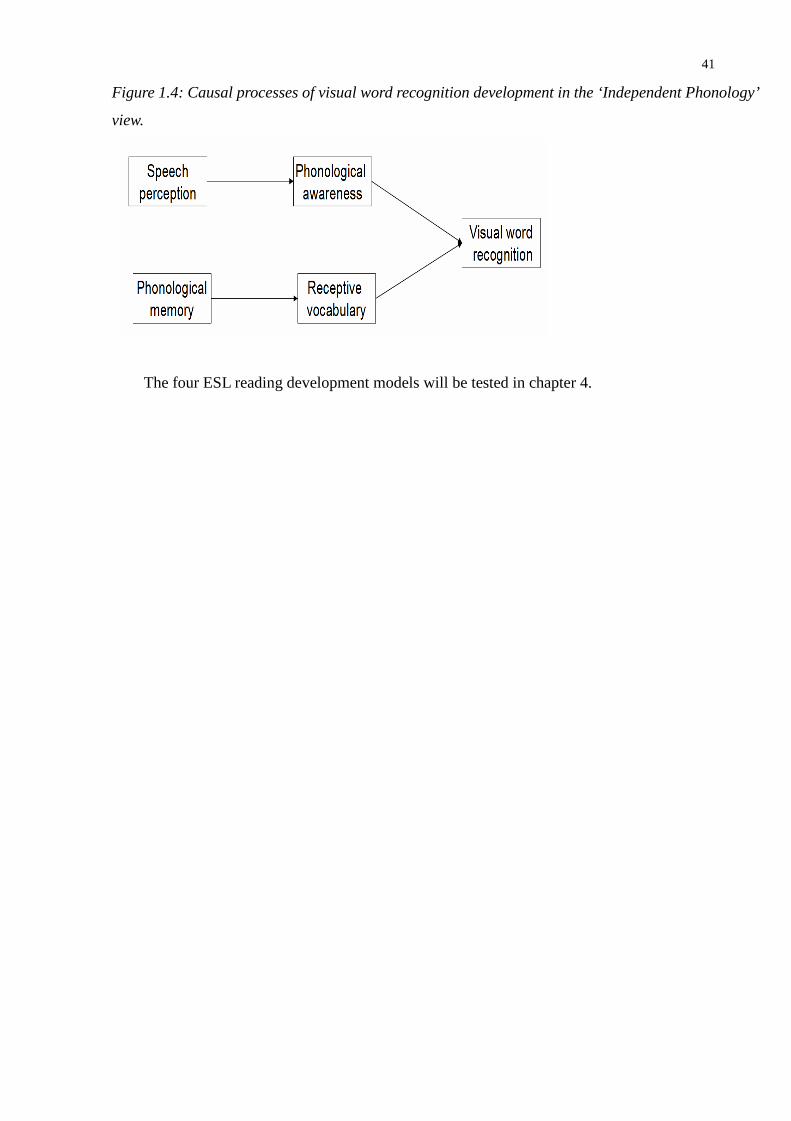
41
Figure 1.4: Causal processes of visual word recognition development in the ‘Independent Phonology’
view.
The four ESL reading development models will be tested in chapter 4.
42
CHAPTER 2 THE LINK BETWEEN THE FIRST AND SECOND LANGUAGE2.1 Chapter summary
In this chapter, I first describe a framework for the study of second language (L2)
reading acquisition in this thesis. Next, I discuss skills that are important to L2 reading
acquisition. Then, I discuss the overlap between L1 and L2 skills. After that, I will describe
the characteristics of Chinese learners of English as a second language (ESL) and discuss
relevant Chinese ESL studies. The chapter is rounded up with major research questions and
hypotheses.
2.2 The scope of this thesis on second language reading acquisition
We have learnt from native reading acquisition research that reading is a complex
and multifaceted construct (Koda, 2007). Diverse experimental paradigms and statistical
methods have being applied to study the nature of different components of reading and their
inter-relationships. The study of L2 reading acquisition is even more challenging because
extra factors have to be taken into account, such as the nature of the language and writing
system of the first language (L1), prior L1 linguistic and literacy experiences, age of
acquisition, learning environments, neural plasticity, etc. Despite such complexity in L2
reading acquisition, much attention is given to this topic in response to the demand of policy
makers, educators and our interest in human’s potential and learning patterns in
multilingualism. Research has been conducted on bilinguals, early or late second language
learners in a variety of linguistic environments. To date, second language reading research has
shown us that common processes appear to underlie phonological awareness in different
writing systems (e.g., Gottardo, Yan, Siegel, & Wade-Woolley, 2001), and the differences
between writing systems have a great impact on children’s acquisition of literacy.
In this thesis, I will focus on the cognitive processes of L2 reading development.
Figure 2.1 provides a schematic presentation that illustrates this particular area of study and

43
some outstanding issues that I will tackle.
Figure 2.1: Relations between first- and second-language reading acquisition andbilingualism (Bialystok, 2007).
Figure 2.1 highlights the dynamics and relevant cognitive processes of L2 reading
development. Bialystok (2007) has contended that this diagram is not intended to be a model
of reading but a description of the relationships among the background skills needed for
reading in both L1 and L2. Because, the model contains the necessary and essential cognitive
factors that contribute to the variability of the rate of second language development, namely
phonetic-coding ability, language-analytic ability and memory (Skehan, 1989), it is
appropriate and useful to construct a L1- L2 reading acquisition model in this thesis.
Bilingualism, the situation in which the learners intend to learn two languages
concurrently and continuously, has an impact on L2 reading development via three major
cognitive factors, namely oral proficiency, concepts of print and meta-linguistic skills. ‘Oral
proficiency’ refers to linguistic knowledge (e.g., vocabulary, syntactic structure) that set a
basis for reading development. ‘Concepts of print’ refers to the understanding of how spoken
44
language is represented in the writing system and the function of print. ‘Meta-linguistic skills’
refers to the meta-cognitive processes (e.g., phonological awareness) and strategies for
reading. Bilingualism has previously been shown to enhance the development of such
meta-linguistic insights. The three cognitive factors of second language reading and the
precursors to reading in a first language are related through their common concepts. Bialystok
(2007) has contended that bilingualism has a general effect on these three cognitive factors in
reading development in both languages. And, there are mutual influences between the
development of L1 and L2 skills. Traditionally, transfer between L1 and L2 is seen as the use
of previously acquired linguistic knowledge, which results in inter-language forms (e.g., Gass
& Selinker, 1983). These views of transfer share three assumptions. First, the reliance on L1
knowledge is partly due to an insufficient grasp of L2 linguistic knowledge. Second, the
linguistic knowledge transferred to L2 is conceived as a set of closely matched, one-on-one
corresponding rules. Third, once adequate L2 proficiency is attained, transfer tends to cease.
The clear implication is that learners’ L1 knowledge plays a diminishing role in explaining
individual differences in L2 learning as L2 develops. This interpretation of transfer is no
longer uniformly endorsed and alternative conceptualizations of transfer have been called for
(August & Shanahan, 2006; Koda, 2007). As an illustration, transfer is defined as the ability
to learn new skills by utilizing previously acquired resources (Genesee, Geva, Dressler, &
Kamil, 2006). Similarly, prior L1 learning experience is regarded as a reservoir of knowledge,
skills, and abilities that is available when learning a L2 language and script (Riches &
Genesee, 2006). Motivated by a constructive view of L1s, the investigative focus is more on
the identification of the resources available to L2 learners at the onset of learning. Positioned
in the Functionalist view, language is viewed as a set of correlated forms and functions, and
its acquisition is viewed as the process of internalizing an infinite set of many-to-many
relationships (MacWhinney, 1992). At the time when the L1 competencies are well rehearsed,
transfer to L2 can occur. During development, both transferred and L1 competencies will

45
continue to mature through experience with L1 and L2 print input. No matter the progress of
learning, transfer tends not to cease at any point. As shown in figure 2.1, the relationships
between L1 and L2 skills are linked bi-directionally with emphasis on the mutual benefit to
each other. Noted also that the ‘-/+/0’ signs in the diagram that suggest the impact of
bilingualism on the three cognitive processes. As these skills develop, bilingualism may either
facilitate (+), interfere (-) or have no effect (0) on reading development (Bialystok, 2007).
This pattern seems contradictory, but, in reality, each of the skills may affect different aspects
of reading; for example, oral proficiency influencing comprehension, concepts of print
affecting word decoding, and meta-linguistic strategies impacting on word recognition.
In this thesis, I will extend from Bialystok’s (2007) model’s original use and try to
understand the ‘cross-language’ and ‘cross-domain’ relationships by exploratory factor
analysis. Three hypothesized variables (i.e., receptive vocabulary, speech perception, and
phonological memory) are categorized as ‘oral proficiency’. The remaining two variables (i.e.,
phonological awareness at the syllable, rime and phoneme levels and Chinese tone awareness)
are grouped as ‘meta-linguistic skills’. As ‘oral proficiency’ and ‘meta-linguistic skills’ are
also the major components of various reading and phonological development models
described in the previous chapter, readers could refer to the last chapter for details. The
‘concept of print’ will be discussed in respect to Chinese children learning English as a second
language.
2.3 L1 and L2 skills and their common underlying cognitive processes
Reading development within one’s L1 is dependent on accurate phonological
representations. It now becomes clearer that reading acquisition in a L2 is also dependent on
fully specified representations of the phonological units of L2. Although children learning to
read in an L2 may have phonological representations that differ from those of L1 speakers, it
does not necessarily follow that they have to go through a new learning routine to become
46
phonologically aware in the L2. Indeed, Cummins’s (1979) linguistic interdependence
hypothesis suggests that there is a significant relationship between children’s skills in
acquiring L1s and L2s. That is, children who have adequate phonological representations and
phonological processing in their L1 would develop similar proficiency in learning an L2.
Thus, the relationship between phonological awareness and literacy development would be
similar for children learning to read in their L1 and in an L2. Indeed, a growing body of
literature supports this view (e.g., Chiappe, Siegel, & Gottardo, 2002; Durgunoglu, Nagy, &
Hancin-Bhatt, 1993; Geva, Yaghoub-Zadeh, & Schuster, 2000; Lesaux & Siegel, 2003).
Together, these studies demonstrate that phonological awareness transfers from children’s L1
to L2 (e.g., Cisero & Royer, 1995) and that phonological awareness has a similar relationship
with reading ability in children’s L1 and L2 (e.g., Chiappe & Siegel, 1999). However, a few
studies have indicated that although children may acquire reading skills in their L2 at the
same rate as native speakers, children initially process the L2 phonology differently than
native speakers (Wang & Geva, 2003). Nonetheless, because the concept of word
segmentation applies to all languages, once emerged in one language, it would be readily
available in learning to discover the sound-to-print correspondence in another language,
serving as the foundation for subsequent L2 phonological awareness and decoding
development in L2.
Indeed, there is growing evidence that phonological awareness at the level of rhyme
plays an important role in reading acquisition in Chinese (Cho & McBride-Chang, 2005;
McBride-Chang & Kail, 2002; So & Siegel, 1997). Apart from natural use of languages, the
cross-linguistic transfer can be elicited and facilitated by direct instruction or training which
targeted at enhancing children’s awareness of phonological units (Quiroga et al., 2002).
Moreover, the rate of learning depends on the orthographic depth of the language. Studies
showed that learning of L2 skills can be faster than L1 skills when the L2 is a shallower

47
orthography (Geva, 1999). From the above discussion, it can be predicted that all facets of
phonological awareness in bilingual children are highly correlated between their two
languages. Indeed, a growing body of evidence suggests that phonological awareness is
strongly related between Chinese and English (Bialystok, McBride-Chang, & Luk, 2005;
Wang, Perfetti, & Liu, 2005), providing further support for the supposition that a portion of
phonological awareness is a general ability shared between the two languages. Other aspects
of reading, such as decoding, are more language dependent and need to be relearned in each
writing system (Bialystok, Luk, & Kwan, 2005). Taken as a whole, the empirical findings
make it plain that (a) as in L1 literacy, phonological awareness plays a critical role in L2
reading acquisition, (b) phonological awareness in a bilingual children’s two languages are
highly correlated, and (c) phonological awareness relates to decoding both within and across
languages.
Regarding speech perception, age of acquisition and language input affect how
second language phonemes are perceived (Birdsong, 1999). In L1 reading development
research, the role played by speech perception has been recognized, though how it is related to
other constructs is less well known. A handful of studies have examined speech perception
and reading development in L2s. For example, in a study of Korean-speaking ESL children,
English speech perception and phonological awareness were important contributors to early
English reading abilities, independent of English oral language skills (Chiappe, Glaeser, &
Ferko, 2007). For the development of L2 speech perception and the interaction between L1
and L2 speech perception, a number of models have explained how children perceive
nonnative phonology. The Feature competition model predicts that L2 phonemes that are
dissimilar to L1 phonemes will be easier to learn than L2 phonemes that are similar to L1
phonemes (Hancin-Bhatt, 1994). Best’s (1995) Perceptual assimilation model suggests that
the quality of L2 phonemes’ representations depends on how well they map onto the
48
phonological system of the L1. Finally, Flege’s (1995) Speech learning model claims that L2
learners may establish new phonetic categories for L2 sounds that differ from the sounds of
their L1. Concerning individual differences in L2 speech perception, anatomical brain studies
showed that the degree of myelination differentiated fast and slow phonetic learners (e.g.,
Anderson, Southern, & Powers, 1999). With a greater number of white matter fibres between
the auditory and parietal cortices, more rapid neural transmission is achieved and therefore
enhances the processing of certain speech sounds such as stop consonants which contain very
rapidly changing acoustic information.
Superior phonological memory function is associated with greater facility in
acquiring L2 vocabulary (Cheung, 1996; Papagno & Vallar, 1995; Service & Kohonen, 1995).
Such a link was still preserved after the effects of age, IQ and L1 vocabulary were controlled
(Masoura & Gathercole, 1999). Furthermore, there were significant differences in the
performances between L1 and L2 nonword repetition tasks in L2 learners, suggesting that
memory for nonwords is language-specific (Thorn & Gathercole, 1999). If L2 learners
experience a lack of fit between their phonological representations and the phonological
structure of the language they are learning, L2 phonological memory would be less readily
available for L2 vocabulary and word learning.
In general, bilingual children have smaller vocabularies in both their L1 and L2
when compared with monolingual children (e.g., Bialystok & Herman, 1999; Droop &
Verhoeven, 2003). Children reading in their first language have already mastered 5,000–7,000
words before they begin formal reading instruction in schools (Biemiller & Slonim, 2001).
However, this is not typically the case for second language learners when assessed in their
second language. For example, Umbel, Pearson, Fernandez, and Oller (1992) tested the
receptive vocabulary of Hispanic children in Miami in both English and Spanish. It was found
49
that English-Spanish bilinguals had acquired significantly less English vocabulary than
English monolinguals, even when the socioeconomic status of the bilingual children was
higher than that of the monolinguals, and the bilingual children knew more English than
Spanish vocabulary. Possibly, learning of two languages concurrently takes away some time
and opportunities to learn and rehearse vocabulary in each language.
Vocabulary knowledge has been considered as an important source of variation in
reading comprehension in past reading models, particularly as it affects higher-level language
processes such as grammatical processing, construction of schemata, and text models (Chall,
1987). More recent studies have recorded the noteworthy role of vocabulary in the
development of earlier reading and reading-related skills including phonological, orthographic,
and morpho-syntactic processes (Muter & Diethelm, 2001; Verhallen & Schoonen, 1993;
Wang & Geva, 2003). Masoura and Gathercole (1999) have shown that the relationship
between L1 and L2 vocabulary was preserved even if phonological memory was controlled
for, implying that L1 vocabulary was important to L2 vocabulary knowledge. This is more
plausible in a non total-immersion language learning situation where few opportunities are
provided for using a L2, therefore, L1 vocabulary bootstraps the learning of L2 vocabulary.
Moreover, whether L1 vocabulary facilitates L2 vocabulary learning depends on the amount
of cognates shared between L1 and L2 and children’s cognate awareness. Cognates are words
that share a historical origin and have similar alphabets, spelling and meaning across
languages (Whitley, 2002). There is a substantial body of studies, documenting the facilitating
role of cognate words in L2 learning among adults (Moss, 1992). For instance, Spanish and
English share an enormous number of cognates. Cognates in English and Spanish account for
one-third to one-half the average educated person‘s active vocabulary, estimated at 10,000 to
15,000 words (Nash, 1997). The ability to recognize a cognate stem within a suffixed English
word, and the systematic relationships between Spanish and English suffixes (e.g., English
50
words ending in "-ty" correspond to a Spanish cognate ending in "-dad") and the saliency and
frequency of correspondence patterns (e.g., action-acción, delicious-delicioso) prompt the
meaning guess and enhance frequent text comprehension (Ringbom, 1992). Nagy, Garcia,
Durgunoglu, and Hancin-Bhatt (1993) found a strong relationship between the ability to
recognize cognates and the reading comprehension skills of Spanish-English bilingual
children in elementary school, even after controlling for Spanish and English vocabulary
knowledge. In another study, the researchers found that awareness of a cognate relationship
between Spanish and English increases markedly with age (Hancin-Bhatt & Nagy, 1994).
However, good L2 vocabulary knowledge does not necessary imply good L2 visual word
recognition because specific skills are involved for vocabulary and word learning (Geva,
1999).
As we have seen above, phonological awareness, phonological memory, speech
perception and vocabulary each play an important but different role in L2 reading acquisition.
Here I discuss the linkage between parallel skills in the first and second languages and
whether skills in two languages are controlled by common underlying cognitive processes.
As Geva (1999) has argued, if positive and significant correlations are observed
between parallel meta-linguistic skills in the two languages, it is very likely that there is a
common underlying cognitive factor that controls the parallel skills in two languages. In
addition, these correlations may be due to a third factor such as common genetic or common
environmental influences (Harlaar et al., 2008). It is important to note that two views are
compatible and the results in chapter 7 of this thesis will shed light on both views. Apart from
a general cognitive process shared between L1 and L2, similar cognitive processes would be
shared between various skills in one language. The development of two skills (e.g.,
phonological awareness and receptive vocabulary) may subsume the same learning
51
mechanism, such as general processing speed (Olson & Byrne, 2005).
2.4 Chinese learners of English as a second language
L2 reading development and processes are influenced by 1) the similarity and
dissimilarity between the language structure of the first and second language, 2) the
‘orthographic distance’ between the two (the degree to which the two writing systems use
similar scripts and have similar levels of orthographic transparency), and 3) the transfer of
processing experience from the first to the second language (Koda, 1996). How do Chinese
children learn English as a second language? In the following, I will describe some of the
characteristics of Chinese ESL learners. The Chinese child participants in this thesis are Hong
Kong Chinese who speak Cantonese which is one of the seven major dialects in Chinese
(Norman, 1988; Ramsey, 1987), and serves as the lingua franca among Hong Kong Chinese
(Li, 1996). The first language of the child participants is Chinese and the second language is
English.
Linguistic distance refers to the degree of structural similarity between two
languages (Koda, 2007). Rogers (2005) argued that there is a long linguistic distance between
Chinese and English. Chinese belongs to the Sino-Tibetan language family (Li & Thompson,
1981) and English is a Germanic language within the Indo-European language family (Yule,
1985).
In terms of phonology, English has 24 basic consonants, 12 pure vowels and 8
diphthongs; Chinese (Cantonese) has 19 basic consonants, 8 pure vowels and 10 diphthongs
(Chan & Li, 2000). Chinese does not have some of the phonemes (e.g., /z/ and /θ/) and
minimal pairs found in English, such as /f/ and /v/ (see figure 2.2 for details). The
phonological differences between English and Chinese contribute to speech perception
difficulties. Brown (2000) observed that Chinese adults who had a mean of 10.4 years of
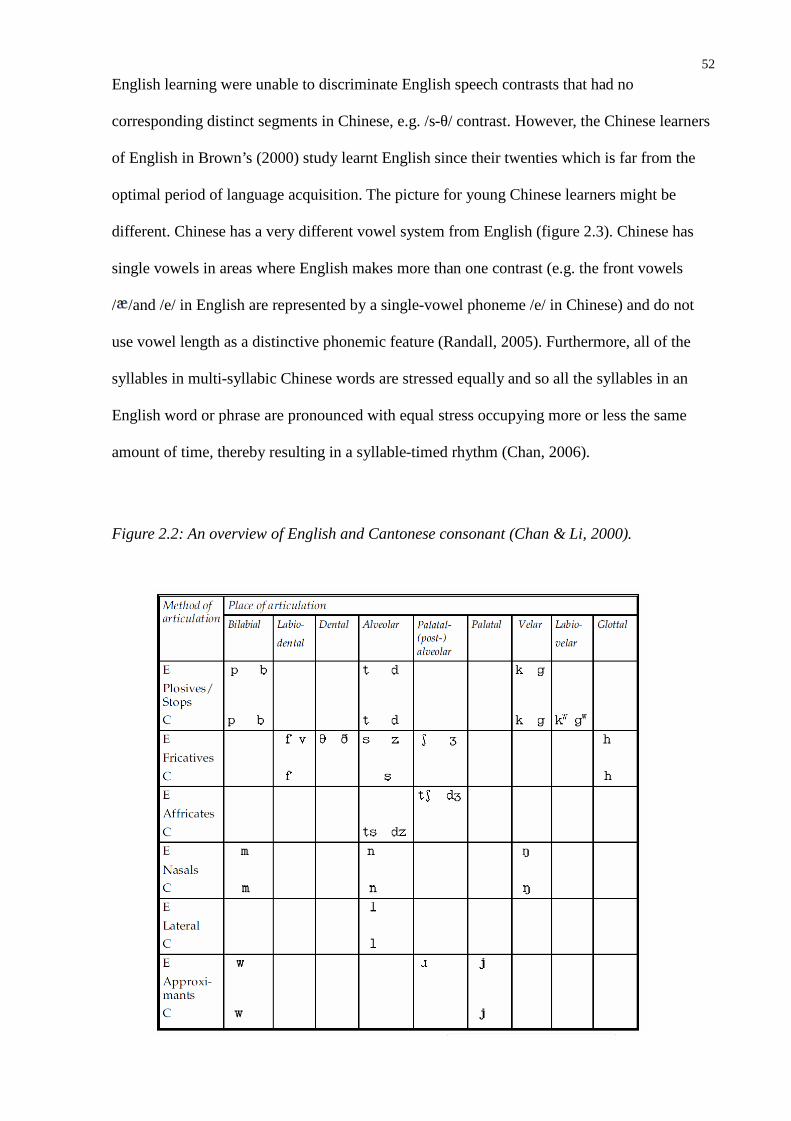
52
English learning were unable to discriminate English speech contrasts that had no
corresponding distinct segments in Chinese, e.g. /s-θ/ contrast. However, the Chinese learners
of English in Brown’s (2000) study learnt English since their twenties which is far from the
optimal period of language acquisition. The picture for young Chinese learners might be
different. Chinese has a very different vowel system from English (figure 2.3). Chinese has
single vowels in areas where English makes more than one contrast (e.g. the front vowels
/ /and /e/ in English are represented by a single-vowel phoneme /e/ in Chinese) and do not
use vowel length as a distinctive phonemic feature (Randall, 2005). Furthermore, all of the
syllables in multi-syllabic Chinese words are stressed equally and so all the syllables in an
English word or phrase are pronounced with equal stress occupying more or less the same
amount of time, thereby resulting in a syllable-timed rhythm (Chan, 2006).
Figure 2.2: An overview of English and Cantonese consonant (Chan & Li, 2000).
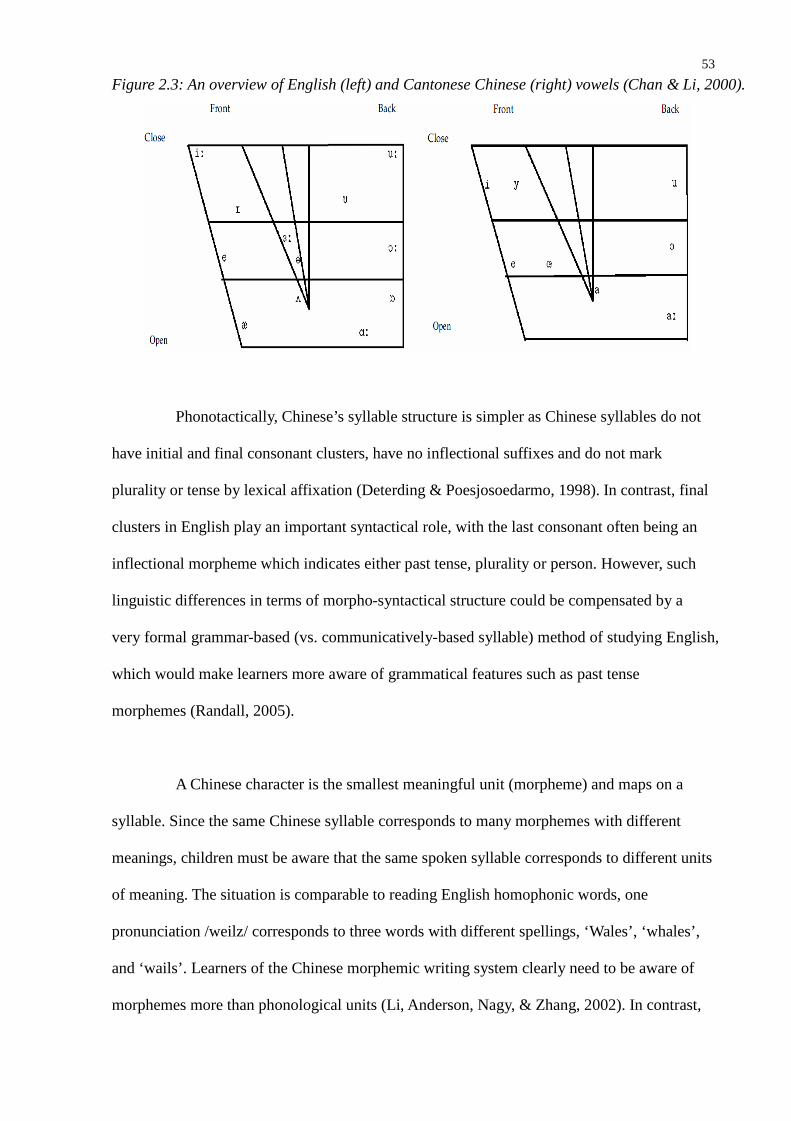
53
Figure 2.3: An overview of English (left) and Cantonese Chinese (right) vowels (Chan & Li, 2000).
Phonotactically, Chinese’s syllable structure is simpler as Chinese syllables do not
have initial and final consonant clusters, have no inflectional suffixes and do not mark
plurality or tense by lexical affixation (Deterding & Poesjosoedarmo, 1998). In contrast, final
clusters in English play an important syntactical role, with the last consonant often being an
inflectional morpheme which indicates either past tense, plurality or person. However, such
linguistic differences in terms of morpho-syntactical structure could be compensated by a
very formal grammar-based (vs. communicatively-based syllable) method of studying English,
which would make learners more aware of grammatical features such as past tense
morphemes (Randall, 2005).
A Chinese character is the smallest meaningful unit (morpheme) and maps on a
syllable. Since the same Chinese syllable corresponds to many morphemes with different
meanings, children must be aware that the same spoken syllable corresponds to different units
of meaning. The situation is comparable to reading English homophonic words, one
pronunciation /weilz/ corresponds to three words with different spellings, ‘Wales’, ‘whales’,
and ‘wails’. Learners of the Chinese morphemic writing system clearly need to be aware of
morphemes more than phonological units (Li, Anderson, Nagy, & Zhang, 2002). In contrast,

54
English has a sound-based writing system which connects graphemes with the sounds of
speech. The English script represents all the phonemes of speech. However, English is a
relatively deep alphabetic orthography of which the grapheme and phoneme regularity and
consistency is low, i.e., words sharing the same orthographic constituent have multiple
pronunciations and words sharing the same pronunciation have several spellings. Because
alphabetic literacy requires segmenting and manipulating phonemic information, alphabetic
readers rely heavily on phonemic analysis. In contrast, phonological decoding in logography
does not entail phonemic analysis because phonology in logographic literacy involves
syllables and morphemes. Because of the syllable-morpheme mapping, the syllable, rather
than the phoneme, is a more salient feature in Chinese phonology. The saliency of the syllable
is demonstrated in the ‘last sound’ game; the English’s last sound is a phoneme while the
Chinese’s last sound is a syllable. In Chinese, around 80% of characters belong to
phono-semantic compounds which consist of a semantic and phonetic radical. A character in
my name, 緯, is an instance of phono-semantic compounds. The semantic radical on the left
suggests something related to ‘thread’ and the phonetic radical on the right provides a
pronunciation cue (/wai/). The awareness and knowledge of phonetic radicals are critical to
Chinese reading. As a result, Chinese people have more difficulties in perceiving the
sub-syllabic units of English (Bialystok & Miller, 1999). However, the sensitivities to
phonemes can be enhanced by training. Chinese children showed an increase from 35% to
60% accuracy in a phoneme deletion task just 10 weeks after learning Zhuyin Fuhao, a
supplementary writing system used in Taiwan (Huang & Hanley, 1997), and similar results
were obtained with adults (Ko & Lee, 1997). In Hong Kong, no such phonetic system is
adopted. Learning to read Chinese requires rote memorization of the arbitrary associations
between characters and syllables.
Chinese is a tonal language, in which a change in the tone of a syllable results in a

55
change in its meaning. In Cantonese, there are six lexical tones. For instance, the syllable /ji/
in different tones refers to the following meanings: /ji1/ (clothing) /ji2/ (chair), /ji3/ (opinion),
/ji4/ (son), /ji5/ (ear), and /ji6/ (two). Tones 1-6 represent high-level, high-rising, mid-level,
low-falling, low-rising and low-level tones respectively. As tone is perceived as attaching to
the rime of a syllable, the nature of tone in spoken Chinese is thought to be suprasegmental.
Gauthier, Shi and Xu (2007) argued that synchronous perception of segments (consonants and
vowels) and pitch patterns is necessary for distinguishing between words, and they showed in
their experiment that the object of tone perception is the articulatory gesture and not simply
pitch contour. Therefore, Chinese lexical tones can also support English phoneme
development. This may explain why Chinese tone processing skill contributed a moderate but
significant amount of variance in predicting English reading even when English
phonemic-level processing skill was controlled (Wang, Perfetti, & Liu, 2005).
In terms of orthography, a Chinese character is nonlinear, as the visual features of
each syllable are shaped into a single block. There is no rule for mapping visual features with
vowels and consonants to form syllable blocks, making Chinese a deep orthography. Because
Chinese ESL learners are used to reading characters holistically, they would bring similar
procedures to bear on word recognition in English. They would favour whole-word, lexical
approaches to word recognition in English. However, orthographic distance as indicated by a
simple alphabetic/logographic divide would not necessarily lead to learning difficulties. In a
study of English dictation, Chinese children did not commit more errors than their alphabetic
(Bahasa Malayu-speaking) counterparts despite very similar levels of language proficiency
and the fact that all of the participants followed the Bahasa Malayu medium education system
in Malaysia (Randall, 2005). Yet, qualitative differences are observed between
proficiency-matched ESL learners (Chinese and Korean children resident in the US). By
comparing the performances in semantic category judgments task, Wang, Koda, and Perfetti

56
(2003) showed that the two groups of children relied on different information during L2
lexical processing and these differences reflected the variations predicted from the properties
specific to their respective L1s. In the study, participants were asked to judge whether a
written word belonged to a category description (e.g., ‘flower’). The participants handled the
task well when the target words were non-homophonic words. ESL learners with alphabetic
(Korean) L1 backgrounds committed more errors with homophonic (phonologically
manipulated e.g., ‘rows’ for ‘rose’) items, whereas ESL learners with logographic (Chinese)
L1 backgrounds made errors with similarly spelled (graphically manipulated e.g., ‘fees’ for
‘feet’) targets.
Next, I summarize the research findings of L2 reading development among ESL
Chinese learners residing in Hong Kong, Mainland China and Taiwan, where the
Chinese-English biscriptal children are not immersed in natural bilingual communities.
Positive cross-linguistic transfers have been evidenced in several studies of Chinese
ESL learners. Chow, McBride-Chang, and Burgess (2005) found that, of the three facets of
phonological processing skills measured, syllable deletion was a relatively strong predictor of
English reading abilities, both concurrently and longitudinally. They suggested that
phonological awareness in Chinese can aid concurrent and subsequent English language
acquisition. Similar results were obtained by Keung and Ho (2009) in their study of 53 Hong
Kong Chinese primary 2 students, showing that English phonological skills (including rhyme
detection and initial phoneme deletion) significantly predicted English (L2) word reading.
However, rhyme awareness in Chinese (L1) predicted phonemic awareness in English (L2)
but not English (L2) word reading. In McBride-Chang and Ho’s (2005) longitudinal study,
Time 1 Chinese phonological processing skills predicted no significant variance in English
word recognition 2 years later. In a recent study, McBride-Chang et al. (2008) showed that
57
there was some evidence for general transfer of phonological awareness in the L1 of
Cantonese to a L2 of English, as demonstrated by the unique contribution of both tone and
syllable awareness to word recognition in English. However, after statistically controlling for
general knowledge, age, and speeded naming, the effect of tone awareness was marginalized
and no longer predictive of English word reading. More recently, a study showed that Chinese
phonological awareness and visual orthographic skills, but not morphological awareness,
accounted for unique variance in English word reading even with the effects of Chinese
character recognition and other reading-related cognitive tasks statistically controlled (Tong &
McBride-Chang, 2010).These findings provide support only for the possible transfer of
phonological skills in Chinese (L1) to phonological skills in English (L2), but not for the
transfer of phonological skills in Chinese (L1) to English (L2) word reading. In contrast,
Huang and Hanley (1995) found that a Chinese phoneme deletion task was correlated with
Chinese and English reading similarly.
Leong, Hau, Cheng, and Tan (2005) concluded from their results of two-wave
structural equation analyses that sensitivity to both the orthography and phonology of English
is essential to learning to read and spell English words and that neither skill by itself is
sufficient. However, it is not clear about the independent contributions of orthographic and
phonological skills to reading and spelling.
A recent paper published by Cheung et al. (2010), which included 141 Hong Kong
Chinese children (three age cohorts: Children in their third [last] kindergarten year, 2nd and
4th graders), showed that speech perception was more predictive of reading and vocabulary
skills in the L1 than L2. Phonological awareness uniquely predicted reading and vocabulary
skills after controlling for morphological awareness in the alphabetic L2. L1 speech
perception and metalinguistic awareness predicted L2 word reading but not vocabulary, after

58
controlling for the corresponding L2 variables.
It was speculated that the cross-linguistic transfer was mediated by some external
factors. Leong et al. (2005) argued that the mandatory primary English syllabus in Hong
Kong overemphasizes semantic rather than phonological and orthographic aspects of English.
Taken as a whole, previous studies have shown that sensitivity to phonology and the ability to
discriminate speech sounds are important to ESL reading development in Chinese learners.
2.5 Summary of section 1
The main research goal in section 1 is to identify the relationships among speech
perception, phonological awareness, phonological memory, vocabulary and reading abilities.
The effects of transfer from L1 to L2 will also be examined.
The major questions are:
1) What are the inter-relationships among speech perception, phonological
awareness, phonological memory, vocabulary and reading abilities? To answer this question, a
series of Path analysis using structural equation modelling (SEM) will be conducted. The
hypothesized models were compared against alternative models to specify the role played by
each skill.
2) Are parallel skills in ESL and Chinese served by a common underlying cognitive
process? First, I will examine the correlations between parallel English and Chinese variables.
Positive and significant correlations between two skills would imply that those variables may
be governed by a common underlying process. In contrast, negative and significant
correlations suggest that cross-linguistic interference occurs.

59
3) Are there any cross-linguistic and cross-domain relationships among the ESL and
Chinese variables? I will test if the ESL and Chinese variables load on certain latent factor(s)
by exploratory factor analysis (EFA). If the ESL and Chinese reading and its related skills
(e.g., Chinese phonological awareness and ESL visual word recognition) load on the same
latent factor, these skills are more likely to operate under the same mechanism and the
Chinese cognitive skills are more readily available for ESL reading development. Otherwise,
the Chinese skills would be less supportive to ESL learning.
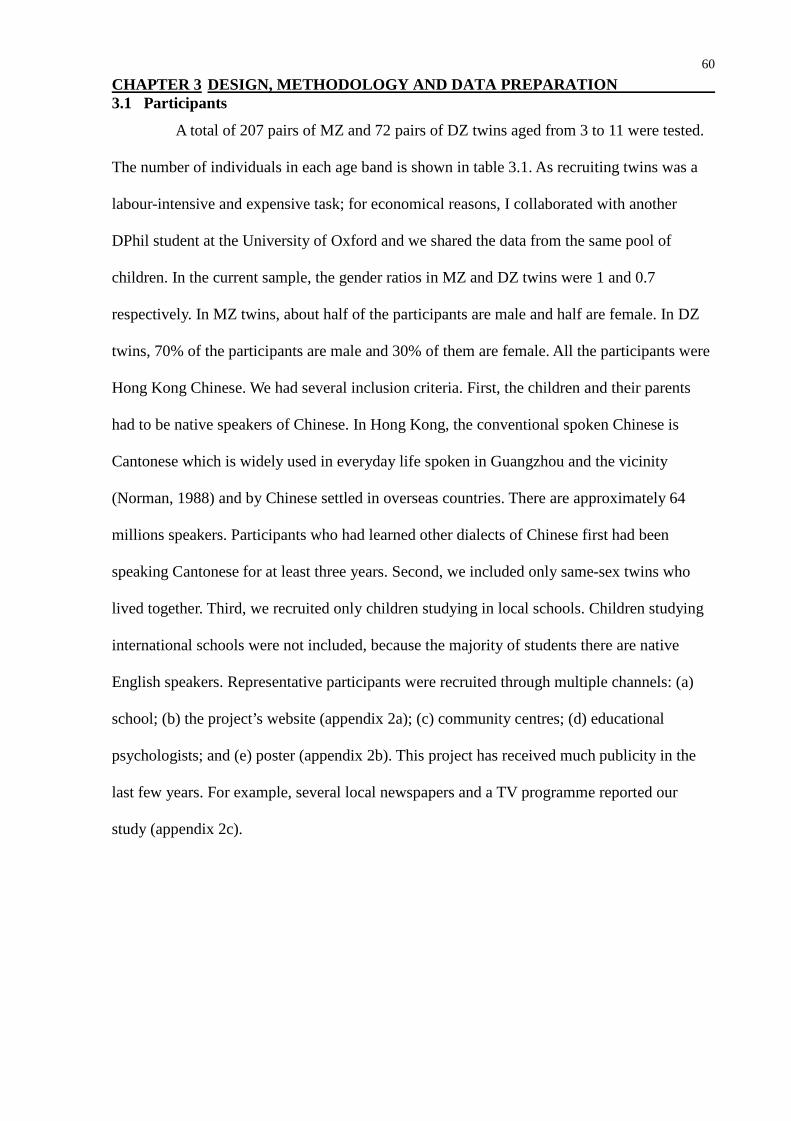
60
CHAPTER 3 DESIGN, METHODOLOGY AND DATA PREPARATION3.1 Participants
A total of 207 pairs of MZ and 72 pairs of DZ twins aged from 3 to 11 were tested.
The number of individuals in each age band is shown in table 3.1. As recruiting twins was a
labour-intensive and expensive task; for economical reasons, I collaborated with another
DPhil student at the University of Oxford and we shared the data from the same pool of
children. In the current sample, the gender ratios in MZ and DZ twins were 1 and 0.7
respectively. In MZ twins, about half of the participants are male and half are female. In DZ
twins, 70% of the participants are male and 30% of them are female. All the participants were
Hong Kong Chinese. We had several inclusion criteria. First, the children and their parents
had to be native speakers of Chinese. In Hong Kong, the conventional spoken Chinese is
Cantonese which is widely used in everyday life spoken in Guangzhou and the vicinity
(Norman, 1988) and by Chinese settled in overseas countries. There are approximately 64
millions speakers. Participants who had learned other dialects of Chinese first had been
speaking Cantonese for at least three years. Second, we included only same-sex twins who
lived together. Third, we recruited only children studying in local schools. Children studying
international schools were not included, because the majority of students there are native
English speakers. Representative participants were recruited through multiple channels: (a)
school; (b) the project’s website (appendix 2a); (c) community centres; (d) educational
psychologists; and (e) poster (appendix 2b). This project has received much publicity in the
last few years. For example, several local newspapers and a TV programme reported our
study (appendix 2c).
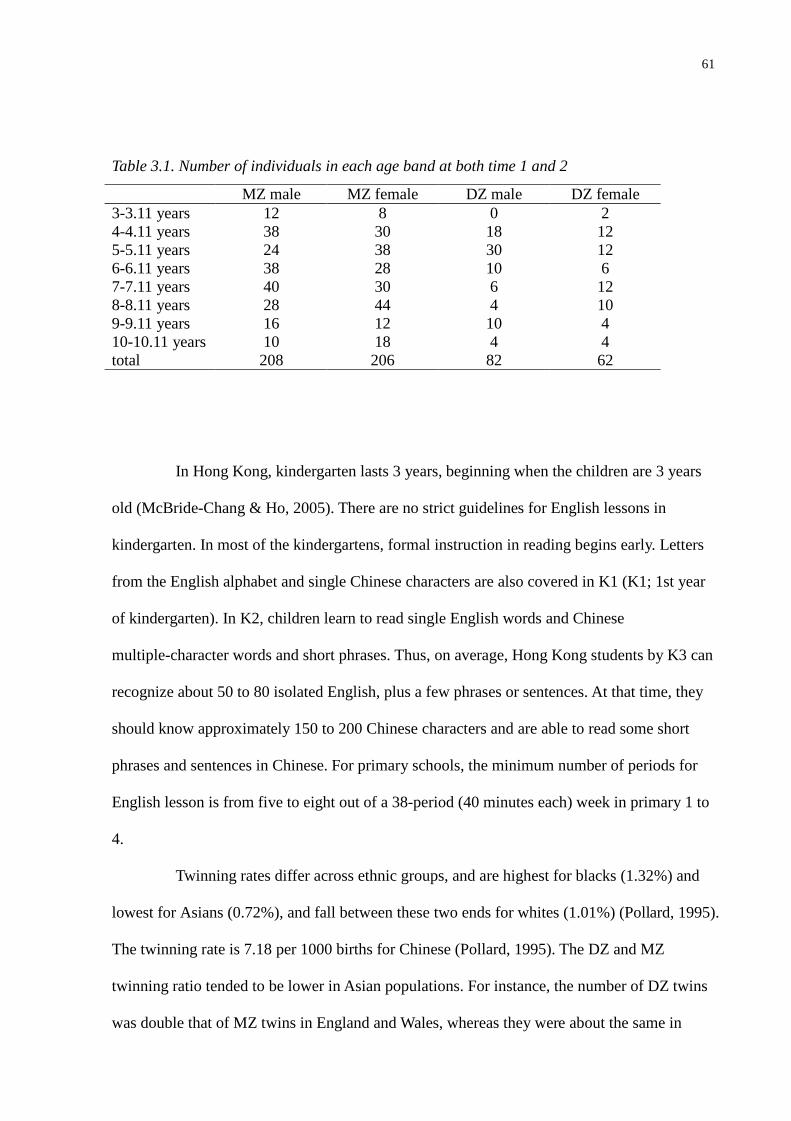
61
Table 3.1. Number of individuals in each age band at both time 1 and 2
MZ male MZ female DZ male DZ female3-3.11 years 12 8 0 24-4.11 years 38 30 18 125-5.11 years 24 38 30 126-6.11 years 38 28 10 67-7.11 years 40 30 6 128-8.11 years 28 44 4 109-9.11 years 16 12 10 410-10.11 years 10 18 4 4total 208 206 82 62
In Hong Kong, kindergarten lasts 3 years, beginning when the children are 3 years
old (McBride-Chang & Ho, 2005). There are no strict guidelines for English lessons in
kindergarten. In most of the kindergartens, formal instruction in reading begins early. Letters
from the English alphabet and single Chinese characters are also covered in K1 (K1; 1st year
of kindergarten). In K2, children learn to read single English words and Chinese
multiple-character words and short phrases. Thus, on average, Hong Kong students by K3 can
recognize about 50 to 80 isolated English, plus a few phrases or sentences. At that time, they
should know approximately 150 to 200 Chinese characters and are able to read some short
phrases and sentences in Chinese. For primary schools, the minimum number of periods for
English lesson is from five to eight out of a 38-period (40 minutes each) week in primary 1 to
4.
Twinning rates differ across ethnic groups, and are highest for blacks (1.32%) and
lowest for Asians (0.72%), and fall between these two ends for whites (1.01%) (Pollard, 1995).
The twinning rate is 7.18 per 1000 births for Chinese (Pollard, 1995). The DZ and MZ
twinning ratio tended to be lower in Asian populations. For instance, the number of DZ twins
was double that of MZ twins in England and Wales, whereas they were about the same in
62
Japan, in 1998 (Imaizumi, 2003). In Hong Kong, the DZ to MZ twinning ratio was found to
be 0.86 in 1994 and 1995 (Tong, Caddy, & Short, 1997). This figure deviated from the
DZ:MZ ratio of the current sample (0.35), possibly due to the exclusion of opposite-sex DZ
twins in this thesis.
The twin identity was confirmed with zygosity testing. We used Oragene DNA
self-collection kit (model no. OG-100 vial format or OG-250 disc format) to collect saliva
from children for zygosity testing done corporately by professionals at the department of
Biochemistry at the Chinese University of Hong Kong and Genome Quebec Innovation
Centre at the University of McGill. Zygosity testing was conducted by two methods:
Sequenom and AmpFISTR. The predictions made by these two methods concur in 100% of
the cases (see Lim et al., under review, for details).
3.2 Procedure
The testing was conducted either at schools, children’s homes or a laboratory at the
University of Hong Kong. All instructions were given in Cantonese. The testing was
completed over two consecutive summers (April to September, 2008 and 2009).
3.3 Pilot testing and modification of tests
We did a pilot test with around 15 children at each grade from kindergarten grade
2-3, and primary school grade 1-4 children (aged from 4 to 10) to verify the difficulty level
and discrimination power of the tests. A test item of high discrimination power is able to
differentiate children with high composite test scores from those with low composite test
scores. We did item analysis for all the tests and selected items that represent high-, mid- and
low- level of difficulty, provided that the item had a fair discrimination power.
63
3.4 English measures
English visual word recognition. This task assessed children’s knowledge of English
words. The English words were adapted from a corpus that included words taken from
popular textbooks used in Hong Kong (appendix 2a). We asked the children to read the words
aloud. We awarded 1 mark for each correct response. Basal and ceiling rules were constructed
based on results of the pilot test so to minimize the administration time. Children were first
tested at the entry level according to their grade levels. If they committed 3 or more errors in a
set, they were then given items from the next lower level. Otherwise, they moved up to the
next higher level. The test stopped when the child scored 0 in 15 consecutive items. The
maximum score was 85, and its Cronbach’s alpha was .99.
English receptive vocabulary Test. The English vocabulary test was an adaptation of a
standardized test, the Receptive One-Word Picture Vocabulary Tests (ROWPVT) (Brownell,
2000). In each item, there are 4 colorful pictures. We presented the target English words to the
children via headphones and asked them to point to the picture that corresponded to the target.
We administered 54 and 94 English words to kindergarteners and primary students
respectively. The Cronbach’s alpha was .92.
English phonological awareness. This test consisted of rime detection, syllable deletion
and initial phoneme deletion tests. In the rime-detection task, all items were selected and
modified from the Alliteration and Rhyme subtest of the Phonological Assessment Battery
(PhAB) (Frederickson, Frith & Reason, 1997). In each trial, we presented three English words
via headphones to the participants and asked them to identify the two words having the same
rime. For example, “look” rhymed with “book” but not with “horse”. The task started with
two sample trials and followed by eight test trials. One mark was rewarded for each correct
response.
64
In the syllable-deletion task, we asked children to delete one syllable from
unfamiliar three-syllable English words. The redundant syllable was either at the initial,
middle or final position. There were a total of six test trials. One mark was awarded for each
correct response. Children who scored at least one mark in this task could proceed to the
initial phoneme deletion task. We instructed children to mentally delete the initial phoneme of
English words and say them aloud. The Cronbach’s alpha for the whole test was .88.
English phonological memory. We assessed phonological memory with a modified
Children’s Test of Nonword Repetition (CNRep) (Gathercole & Baddeley, 1996). We
presented children English pseudo-words with a length of 2-5 syllables via headphones and
asked them to repeat. The responses were marked by the experimenter and were recorded with
mp3 players. We awarded 1 mark for each correctly uttered syllable and 1 mark for each right
order. We subtracted 1 mark for a redundant syllable. For instance, the total score of a
5-syllable word was nine (5 points for correct pronunciation; 4 points for correct order). The
test consisted of 2 sample trials and 16 test items. The Cronbach’s alpha was .87. The
inter-rater reliability indicated by the Intraclass correlation coefficients were satisfactory,
ranging from 0.72 to 0.92 for the scores marked by the 6 experimenters.
English (and Chinese) speech perception. This was a test of AXB speech perception of
phonemic contrasts and it was adapted from Bishop’s owl test (Bishop, Adams, Nation, &
Rosen, 2005). The English and Chinese versions of this task were the same. The children were
asked to choose from two words which sounded the same as a target word in the context of a
computer game (appendix 2b). A correct response was rewarded with a cartoon picture
appearing on the computer screen; otherwise, a 'sigh' sound was presented. The minimal pair
differed either in the place of articulation, manner of articulation or both. Results from the
65
pilot testing indicated that the test was too easy for older participants, so we combined
speech-like noise and the English word tokens with a signal-to-noise ratio of -12dB.
Following the 6 trial items, we presented 24 test trials. The Cronbach’s alpha for English and
Chinese version was .72 and .80 respectively.
To ensure that the participants’ performances were not confounded by auditory
perception, a pure-tone hearing test was administered. We used calibrated audiometer and
followed a standardized procedure to test children’s hearing abilities. Firstly, experimenters
instructed the participant to raise their head if they hear a pure tone via the headphone.
Secondly, the experimenter sat behind the participants so not to allow the child to look at
which button was being pressed. Then, we presented three 1000 Hz pure tones at 40 dB at
unpredictable intervals to familiarize the children the task demands. If the children failed
respond correctly, we increased the volume by 5 dB; otherwise, we decrease 10 dB. Once the
child was able to detect the pure tones at 25 dB, we tested children with 2000 Hz, 4000 Hz
and 500 Hz pure tones. The right ear was tested first, then the left ear.
3.5 Chinese measures
Chinese word reading. A 48-item character reading list and 150 items adapted from the
reading subtest of the Hong Kong Test of Specific Learning Difficulties in Reading and
Writing (HKT-SpLD) (Ho, Chan, Tsang, & Lee, 2000) were combined. Children were
required to read each word aloud. Testing stopped when they failed to read 15 consecutive
items. Kindergartners started from the character reading list, and were given the items adapted
from the HKT-SpLD if they progressed beyond this list. However, the first item of the
HKT-SpLD reading subtest was regarded as the entry point for all primary school children.
They were given the kindergarten character reading list only if they failed to read the easiest
15 consecutive items on the HKT-SpLD reading subtest. The maximum score was 198, and its
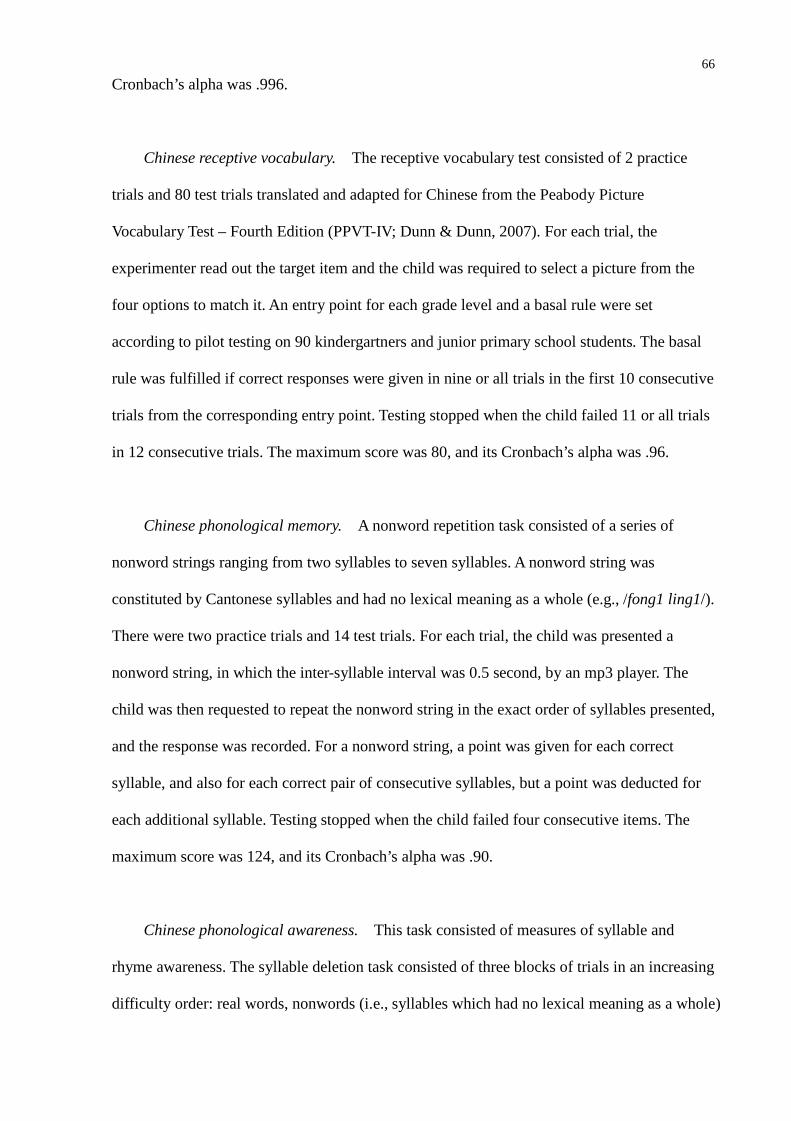
66
Cronbach’s alpha was .996.
Chinese receptive vocabulary. The receptive vocabulary test consisted of 2 practice
trials and 80 test trials translated and adapted for Chinese from the Peabody Picture
Vocabulary Test – Fourth Edition (PPVT-IV; Dunn & Dunn, 2007). For each trial, the
experimenter read out the target item and the child was required to select a picture from the
four options to match it. An entry point for each grade level and a basal rule were set
according to pilot testing on 90 kindergartners and junior primary school students. The basal
rule was fulfilled if correct responses were given in nine or all trials in the first 10 consecutive
trials from the corresponding entry point. Testing stopped when the child failed 11 or all trials
in 12 consecutive trials. The maximum score was 80, and its Cronbach’s alpha was .96.
Chinese phonological memory. A nonword repetition task consisted of a series of
nonword strings ranging from two syllables to seven syllables. A nonword string was
constituted by Cantonese syllables and had no lexical meaning as a whole (e.g., /fong1 ling1/).
There were two practice trials and 14 test trials. For each trial, the child was presented a
nonword string, in which the inter-syllable interval was 0.5 second, by an mp3 player. The
child was then requested to repeat the nonword string in the exact order of syllables presented,
and the response was recorded. For a nonword string, a point was given for each correct
syllable, and also for each correct pair of consecutive syllables, but a point was deducted for
each additional syllable. Testing stopped when the child failed four consecutive items. The
maximum score was 124, and its Cronbach’s alpha was .90.
Chinese phonological awareness. This task consisted of measures of syllable and
rhyme awareness. The syllable deletion task consisted of three blocks of trials in an increasing
difficulty order: real words, nonwords (i.e., syllables which had no lexical meaning as a whole)

67
and nonsense words (i.e., nonsense syllables which had no lexical meaning itself or as a
whole). The items were orally presented by the experimenter and the children were required
to produce an answer orally with one syllable taken away from the compound words. In each
block, two trials required deletion of the first syllable, two trials required deletion of the last
syllable, and one trial required deletion of the middle syllable. For example, the real word
/mong6 jyun5 geng3/ (binoculars) without / jyun5/ is /mong6 geng3/. The target answers
of some real word items were meaningful words. The maximum score was 15.
The rime detection task consisted of two practice trials and nine test trials. For each
item, the experimenter read out a target syllable, and then read out three syllables and
simultaneously showed three pictures illustrating each of them. The child was required to
select a syllable from the three options which rhymed with the target syllable. For example:
/jan4/ (human) was read out as the target syllable, and /ngaa4/ (tooth), /hau4/ (monkey) and
/wan4/ (cloud) were then presented with their illustrations. The answer was /wan4/ (cloud)
which rhymed with the target syllable /jan4/ (human). The maximum score was nine. The
maximum score of the combined task was 24, and its Cronbach’s alpha was .88.
Chinese tone awareness. The Cantonese tone task consisted of 3 practice trials and 15
test trials, administered with a computer. There were three blocks of test trials arranged in the
following order: three-syllable, two-syllable, and one-syllable blocks, and each had five trials.
The three-syllable block was presented first, while the one-syllable block was shown last,
because the more syllables given could provide more cues on identifying the correct tones and
were thus relatively easier. For each trial, three pictures each illustrated a syllable (in the
one-syllable block)/ a group of syllables (in the two-syllable and three-syllable blocks), in
which these syllables/ these groups of syllables had different tones, were shown. The child
was required to label each of them, and was given the syllables if they were not able to label

68
them correctly. This procedure was to ensure that the child knew the syllables represented by
the pictures before proceeding to the actual tone test. Then, a sound of a lexical tone (in the
one-syllable block)/ of a group of lexical tones (in the two-syllable and three-syllable blocks)
was presented, and the child was asked to select the picture representing the syllable(s) which
matched with the sound of lexical tone(s). For instance, in a one-syllable trial, a Cantonese
first lexical tone sound (i.e., high-level tone sound) was presented, and three pictures
illustrated a letter (/seon3/), a lock (/so2/) and a pig (/zyu1/) respectively, were shown
(appendix 2c). The child was then asked which of the three options had the same tone as the
lexical tone sound. The answer was a pig (/zyu1/) which had a Cantonese first tone. The
maximum score was 15, and its Cronbach’s alpha was .66.
3.6 Descriptive analyses, gender and zygosity effects
Before conducting subsequent statistical analyses, descriptive statistics are
computed. The whole sample was divided into two age groups: 3-6.11 years and 7-11 years.
The first group included children studied in kindergarten or grade 1. The second group was
consisted of children graded 2 or above. Descriptive tables for each gender and zygosity are
shown in tables 3.2 (English measures) and 3.3 (Chinese measures).
Next, comparisons of group means between gender and zygosity groups were done.
To achieve random sampling for conducting independent sample t-test, one cotwin was
selected from each twin pair. Results showed that there was no significant mean differences
across zygosity group for all variables, ts (277) = -1.8 to 1.3, p>.05, except for Chinese tone
awareness at time 1, t (277) = 2.01, p<.05. Significant gender differences were observed in
time 1 ESL phonological awareness, time 1 and time 2 Chinese speech perception, time 2 ESL
visual word recognition and time 2 ESL speech perception, ts (277) = -3.1 to -.65, p<.05. No
significant gender differences was observed in the remaining variables, ts (277) = -3.4 to -.35,
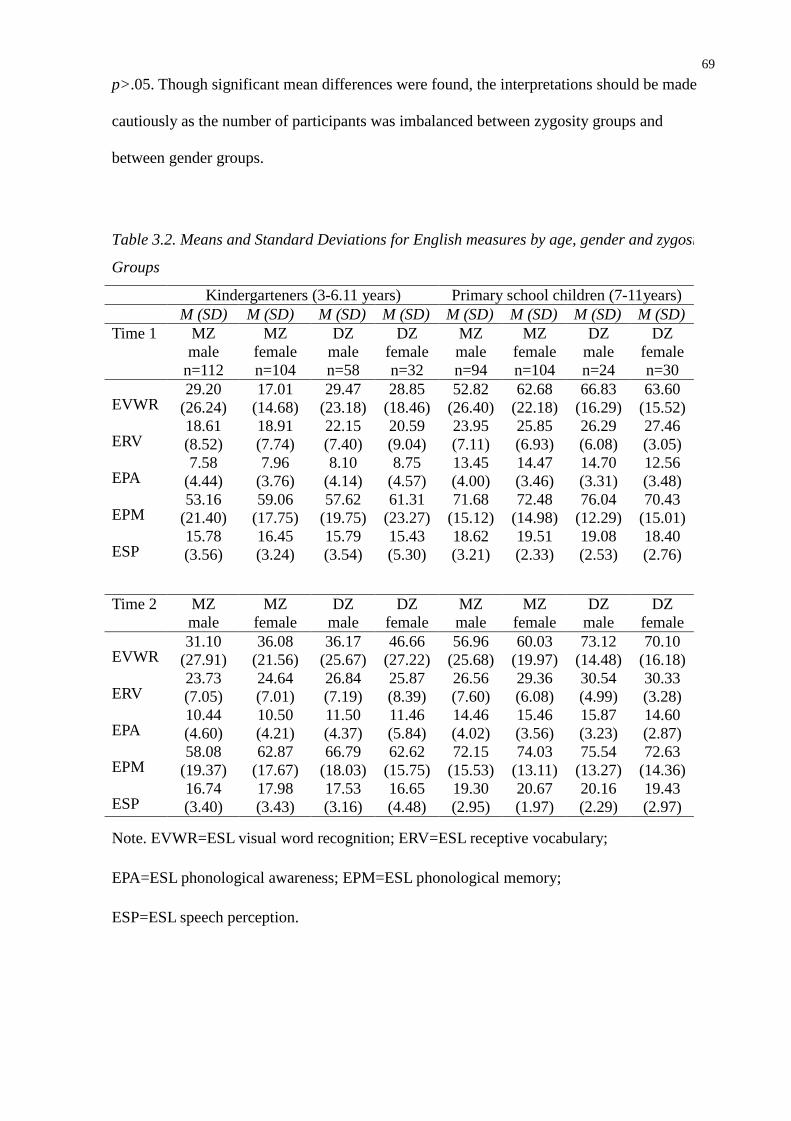
69
p>.05. Though significant mean differences were found, the interpretations should be made
cautiously as the number of participants was imbalanced between zygosity groups and
between gender groups.
Table 3.2. Means and Standard Deviations for English measures by age, gender and zygosity
Groups
Kindergarteners (3-6.11 years) Primary school children (7-11years)M (SD) M (SD) M (SD) M (SD) M (SD) M (SD) M (SD) M (SD)
Time 1 MZmale
n=112
MZfemalen=104
DZmalen=58
DZfemalen=32
MZmalen=94
MZfemalen=104
DZmalen=24
DZfemalen=30
EVWR29.20
(26.24)17.01
(14.68)29.47
(23.18)28.85
(18.46)52.82
(26.40)62.68
(22.18)66.83
(16.29)63.60
(15.52)
ERV18.61(8.52)
18.91(7.74)
22.15(7.40)
20.59(9.04)
23.95(7.11)
25.85(6.93)
26.29(6.08)
27.46(3.05)
EPA7.58
(4.44)7.96
(3.76)8.10
(4.14)8.75
(4.57)13.45(4.00)
14.47(3.46)
14.70(3.31)
12.56(3.48)
EPM53.16
(21.40)59.06
(17.75)57.62
(19.75)61.31
(23.27)71.68
(15.12)72.48
(14.98)76.04
(12.29)70.43
(15.01)
ESP15.78(3.56)
16.45(3.24)
15.79(3.54)
15.43(5.30)
18.62(3.21)
19.51(2.33)
19.08(2.53)
18.40(2.76)
Time 2 MZmale
MZfemale
DZmale
DZfemale
MZmale
MZfemale
DZmale
DZfemale
EVWR31.10
(27.91)36.08
(21.56)36.17
(25.67)46.66
(27.22)56.96
(25.68)60.03
(19.97)73.12
(14.48)70.10
(16.18)
ERV23.73(7.05)
24.64(7.01)
26.84(7.19)
25.87(8.39)
26.56(7.60)
29.36(6.08)
30.54(4.99)
30.33(3.28)
EPA10.44(4.60)
10.50(4.21)
11.50(4.37)
11.46(5.84)
14.46(4.02)
15.46(3.56)
15.87(3.23)
14.60(2.87)
EPM58.08
(19.37)62.87
(17.67)66.79
(18.03)62.62
(15.75)72.15
(15.53)74.03
(13.11)75.54
(13.27)72.63
(14.36)
ESP16.74(3.40)
17.98(3.43)
17.53(3.16)
16.65(4.48)
19.30(2.95)
20.67(1.97)
20.16(2.29)
19.43(2.97)
Note. EVWR=ESL visual word recognition; ERV=ESL receptive vocabulary;
EPA=ESL phonological awareness; EPM=ESL phonological memory;
ESP=ESL speech perception.
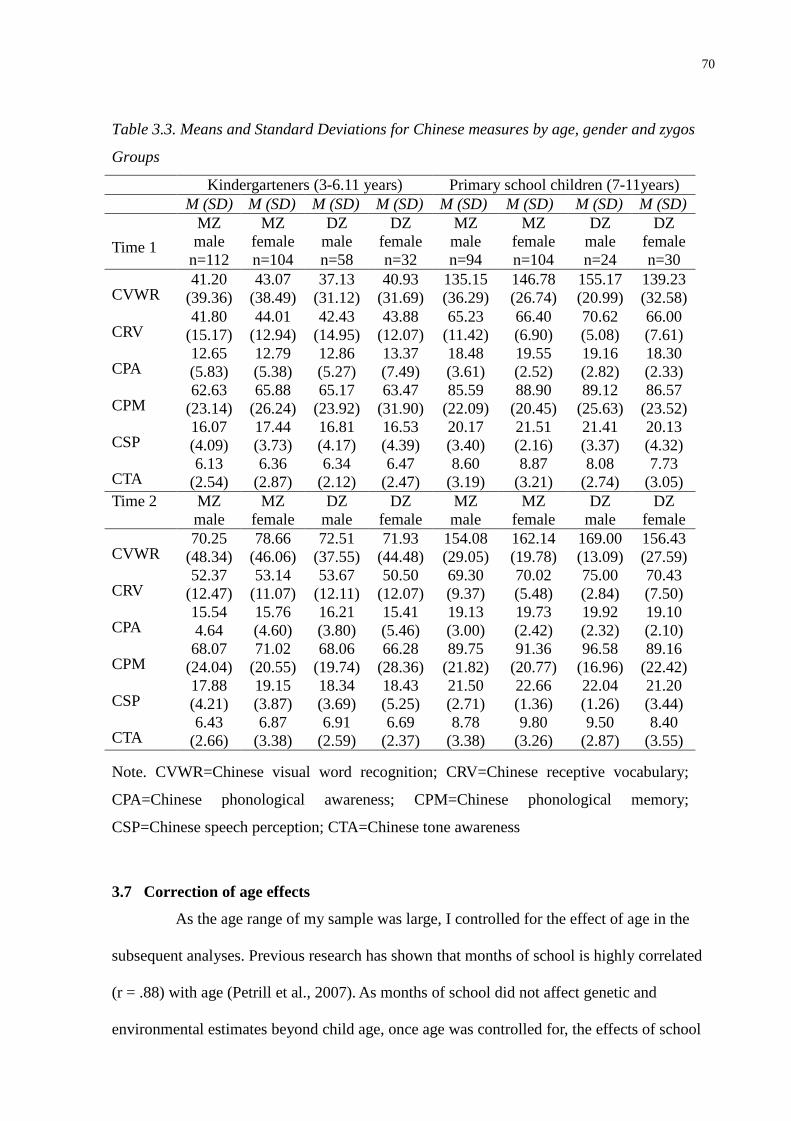
70
Table 3.3. Means and Standard Deviations for Chinese measures by age, gender and zygosity
Groups
Kindergarteners (3-6.11 years) Primary school children (7-11years)M (SD) M (SD) M (SD) M (SD) M (SD) M (SD) M (SD) M (SD)
Time 1
MZmale
n=112
MZfemalen=104
DZmalen=58
DZfemalen=32
MZmalen=94
MZfemalen=104
DZmalen=24
DZfemalen=30
CVWR41.20
(39.36)43.07
(38.49)37.13
(31.12)40.93
(31.69)135.15(36.29)
146.78(26.74)
155.17(20.99)
139.23(32.58)
CRV41.80
(15.17)44.01
(12.94)42.43
(14.95)43.88
(12.07)65.23
(11.42)66.40(6.90)
70.62(5.08)
66.00(7.61)
CPA12.65(5.83)
12.79(5.38)
12.86(5.27)
13.37(7.49)
18.48(3.61)
19.55(2.52)
19.16(2.82)
18.30(2.33)
CPM62.63
(23.14)65.88
(26.24)65.17
(23.92)63.47
(31.90)85.59
(22.09)88.90
(20.45)89.12
(25.63)86.57
(23.52)
CSP16.07(4.09)
17.44(3.73)
16.81(4.17)
16.53(4.39)
20.17(3.40)
21.51(2.16)
21.41(3.37)
20.13(4.32)
CTA6.13
(2.54)6.36
(2.87)6.34
(2.12)6.47
(2.47)8.60
(3.19)8.87
(3.21)8.08
(2.74)7.73
(3.05)Time 2 MZ
maleMZ
femaleDZ
maleDZ
femaleMZmale
MZfemale
DZmale
DZfemale
CVWR70.25
(48.34)78.66
(46.06)72.51
(37.55)71.93
(44.48)154.08(29.05)
162.14(19.78)
169.00(13.09)
156.43(27.59)
CRV52.37
(12.47)53.14
(11.07)53.67
(12.11)50.50
(12.07)69.30(9.37)
70.02(5.48)
75.00(2.84)
70.43(7.50)
CPA15.544.64
15.76(4.60)
16.21(3.80)
15.41(5.46)
19.13(3.00)
19.73(2.42)
19.92(2.32)
19.10(2.10)
CPM68.07
(24.04)71.02
(20.55)68.06
(19.74)66.28
(28.36)89.75
(21.82)91.36
(20.77)96.58
(16.96)89.16
(22.42)
CSP17.88(4.21)
19.15(3.87)
18.34(3.69)
18.43(5.25)
21.50(2.71)
22.66(1.36)
22.04(1.26)
21.20(3.44)
CTA6.43
(2.66)6.87
(3.38)6.91
(2.59)6.69
(2.37)8.78
(3.38)9.80
(3.26)9.50
(2.87)8.40
(3.55)
Note. CVWR=Chinese visual word recognition; CRV=Chinese receptive vocabulary;
CPA=Chinese phonological awareness; CPM=Chinese phonological memory;
CSP=Chinese speech perception; CTA=Chinese tone awareness
3.7 Correction of age effects
As the age range of my sample was large, I controlled for the effect of age in the
subsequent analyses. Previous research has shown that months of school is highly correlated
(r = .88) with age (Petrill et al., 2007). As months of school did not affect genetic and
environmental estimates beyond child age, once age was controlled for, the effects of school

71
were spontaneously minimized. The relationship between raw scores and age for each
variable was identified by curve estimation version 16.0 of Statistical Package for the Social
Sciences (SPSS). Consistently for all the variables, Cubic regression was the best fitted in
comparison to Linear, Logarithmic and Quadratic regressions. Figure 3.1 shows a typical
Cubic regression curve obtained by fitting the raw scores of the hypothesized variables
against age. The standardized residuals of the Cubic regression were computed and saved for
subsequent analyses. To obtain an optimal degree of skewness and kurtosis for each variable,
the data was further normalized based on their cumulative frequencies. Scores that were more
than 3 SD from the mean were scaled down to -3 or +3.
Figure 3.1: An instance of cubic regression curve fitting the data of Chinese visual word recognition
against age

72
CHAPTER 4 MODELS OF ESL READING DEVELOPMENT4.1 Chapter summary
In this chapter, the basics of structural equation modelling (SEM) will be outlined.
The SEM approach is then applied to test the model fit of a series of Path analysis models that
describe the relationships between visual word recognition, receptive vocabulary,
phonological awareness, phonological memory and speech perception.
4.2 An overview of structural equation modelling (SEM)
Structural equation modelling (SEM) is a multivariate statistical analytic approach.
A SEM model pictorially or mathematically presents the inter-variable relations of a theory.
These relations are defined as causal processes represented by a series of regression equations
(Byrne, 2010). In this thesis, SEM modelling was applied to time 1 data only. The resulting
concurrent relationships among the hypothesized variables indicate how each of the
reading-related skills influences each other either unidirectionally or bidirectionally. This
statistical analysis strategy actualizes the ‘Component skills analysis’ approach outlined in
section 1.4. However, the results do not imply causality unless longitudinal data are fitted into
the models in order to have the auto-regressive effects (i.e. the attainment of skills at a
previous time point) controlled. The testing of a SEM model is to estimate the extent to which
the entire system of variables fits the data. Because data analyses in SEM are inferential in
nature, it serves the function of hypothesis-testing in non-experimental research.
Joreskog (1993) has described three common goals of SEM, namely (a) strictly
confirmatory; (b) model comparison; and (c) model generating. As suggested by the name
itself, researchers who aim for ‘strictly confirmatory’ test if the theoretical model matches the
data. The model is either accepted or rejected without further modification and testing. It is
less common than the next two approaches. The ‘model comparison’ approach allows
researchers to test several theoretical models and then determine which model(s) best
explain(s) the data. Lastly, ‘model generating’ suggests that researchers make use of the
73
tentative result of the initial SEM model testing and re-specify a better model until a
satisfactory model is obtained. This iterative method should be guided by theoretical
underpinnings or previous research. From the above discussion, we see the multi-step and
iterative nature of SEM. Figure 4.1 describes the general procedure of the complete SEM
model testing. Because the topic of ESL reading studied in this thesis is still in its infancy,
‘model comparison’ and ‘model generation’ are the more appropriate goals to aim for.
Figure 4.1: A complete procedure for structural equation modelling.
Before model construction, it is crucial to know the number of observed data
variances and covariances (A) and the number of parameters to be estimated (B). If A is equal
to B, a unique solution is obtained for all parameters. This ‘just-identified’ model has no
degrees of freedom and cannot be rejected. If A is smaller than B, the model is
under-identified and results in an infinite number of possible solutions. Neither situation is
useful for hypothesis testing. To specify a SEM model, it is important to maintain the situation
that A is larger than B. With positive degrees of freedom, the ‘over-identified’ model could be
rejected, thereby rendering it of scientific use. So, the construction of ‘over-identified’ models
is a basic requirement of SEM. (Note: A = number of observed variables x (number of
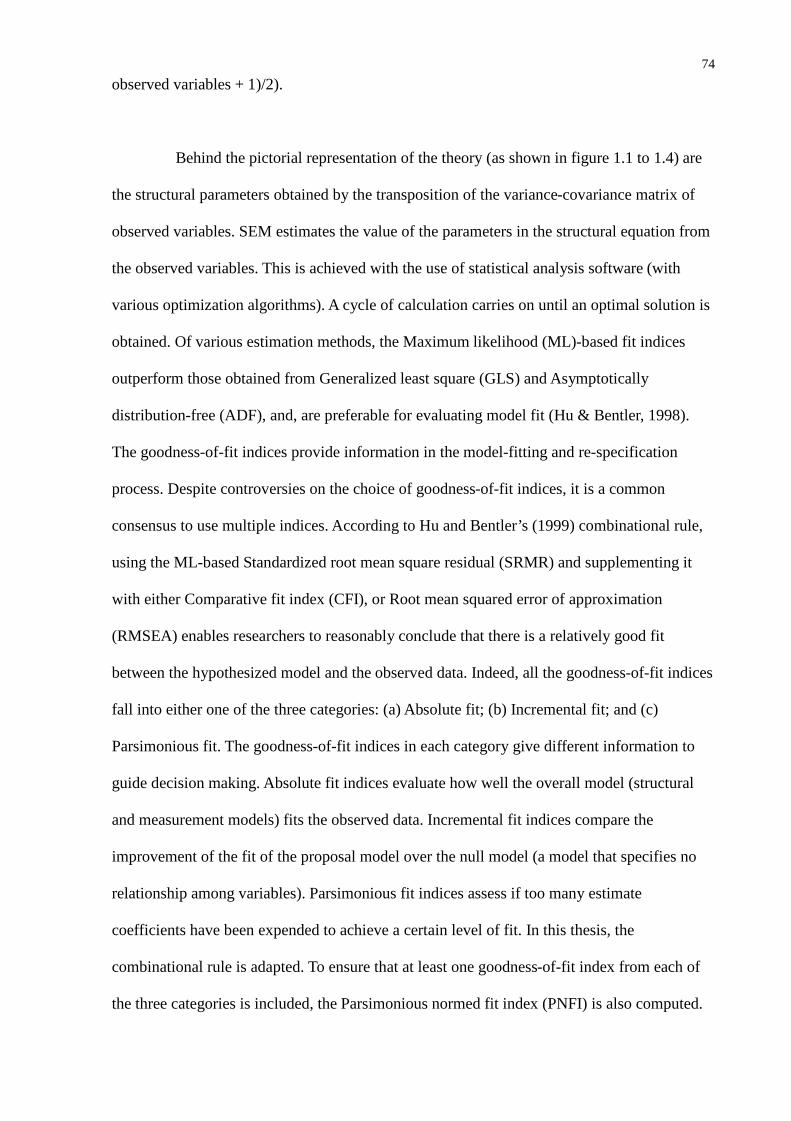
74
observed variables + 1)/2).
Behind the pictorial representation of the theory (as shown in figure 1.1 to 1.4) are
the structural parameters obtained by the transposition of the variance-covariance matrix of
observed variables. SEM estimates the value of the parameters in the structural equation from
the observed variables. This is achieved with the use of statistical analysis software (with
various optimization algorithms). A cycle of calculation carries on until an optimal solution is
obtained. Of various estimation methods, the Maximum likelihood (ML)-based fit indices
outperform those obtained from Generalized least square (GLS) and Asymptotically
distribution-free (ADF), and, are preferable for evaluating model fit (Hu & Bentler, 1998).
The goodness-of-fit indices provide information in the model-fitting and re-specification
process. Despite controversies on the choice of goodness-of-fit indices, it is a common
consensus to use multiple indices. According to Hu and Bentler’s (1999) combinational rule,
using the ML-based Standardized root mean square residual (SRMR) and supplementing it
with either Comparative fit index (CFI), or Root mean squared error of approximation
(RMSEA) enables researchers to reasonably conclude that there is a relatively good fit
between the hypothesized model and the observed data. Indeed, all the goodness-of-fit indices
fall into either one of the three categories: (a) Absolute fit; (b) Incremental fit; and (c)
Parsimonious fit. The goodness-of-fit indices in each category give different information to
guide decision making. Absolute fit indices evaluate how well the overall model (structural
and measurement models) fits the observed data. Incremental fit indices compare the
improvement of the fit of the proposal model over the null model (a model that specifies no
relationship among variables). Parsimonious fit indices assess if too many estimate
coefficients have been expended to achieve a certain level of fit. In this thesis, the
combinational rule is adapted. To ensure that at least one goodness-of-fit index from each of
the three categories is included, the Parsimonious normed fit index (PNFI) is also computed.
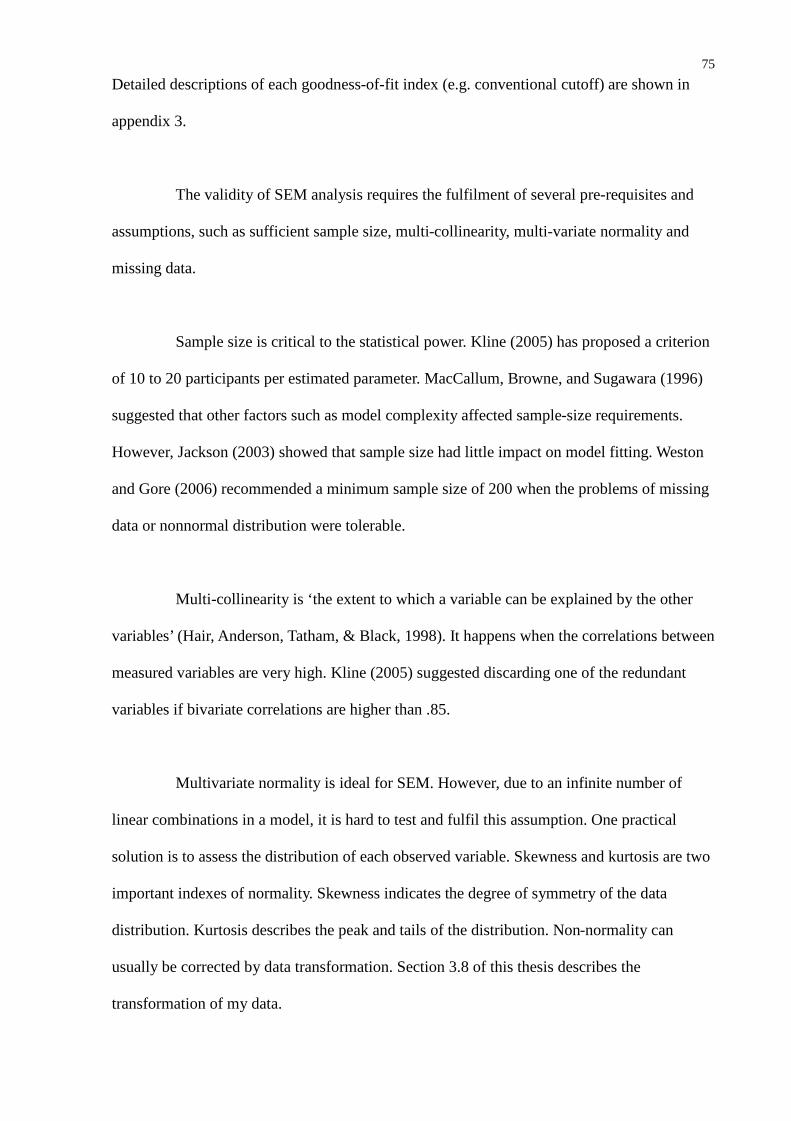
75
Detailed descriptions of each goodness-of-fit index (e.g. conventional cutoff) are shown in
appendix 3.
The validity of SEM analysis requires the fulfilment of several pre-requisites and
assumptions, such as sufficient sample size, multi-collinearity, multi-variate normality and
missing data.
Sample size is critical to the statistical power. Kline (2005) has proposed a criterion
of 10 to 20 participants per estimated parameter. MacCallum, Browne, and Sugawara (1996)
suggested that other factors such as model complexity affected sample-size requirements.
However, Jackson (2003) showed that sample size had little impact on model fitting. Weston
and Gore (2006) recommended a minimum sample size of 200 when the problems of missing
data or nonnormal distribution were tolerable.
Multi-collinearity is ‘the extent to which a variable can be explained by the other
variables’ (Hair, Anderson, Tatham, & Black, 1998). It happens when the correlations between
measured variables are very high. Kline (2005) suggested discarding one of the redundant
variables if bivariate correlations are higher than .85.
Multivariate normality is ideal for SEM. However, due to an infinite number of
linear combinations in a model, it is hard to test and fulfil this assumption. One practical
solution is to assess the distribution of each observed variable. Skewness and kurtosis are two
important indexes of normality. Skewness indicates the degree of symmetry of the data
distribution. Kurtosis describes the peak and tails of the distribution. Non-normality can
usually be corrected by data transformation. Section 3.8 of this thesis describes the
transformation of my data.
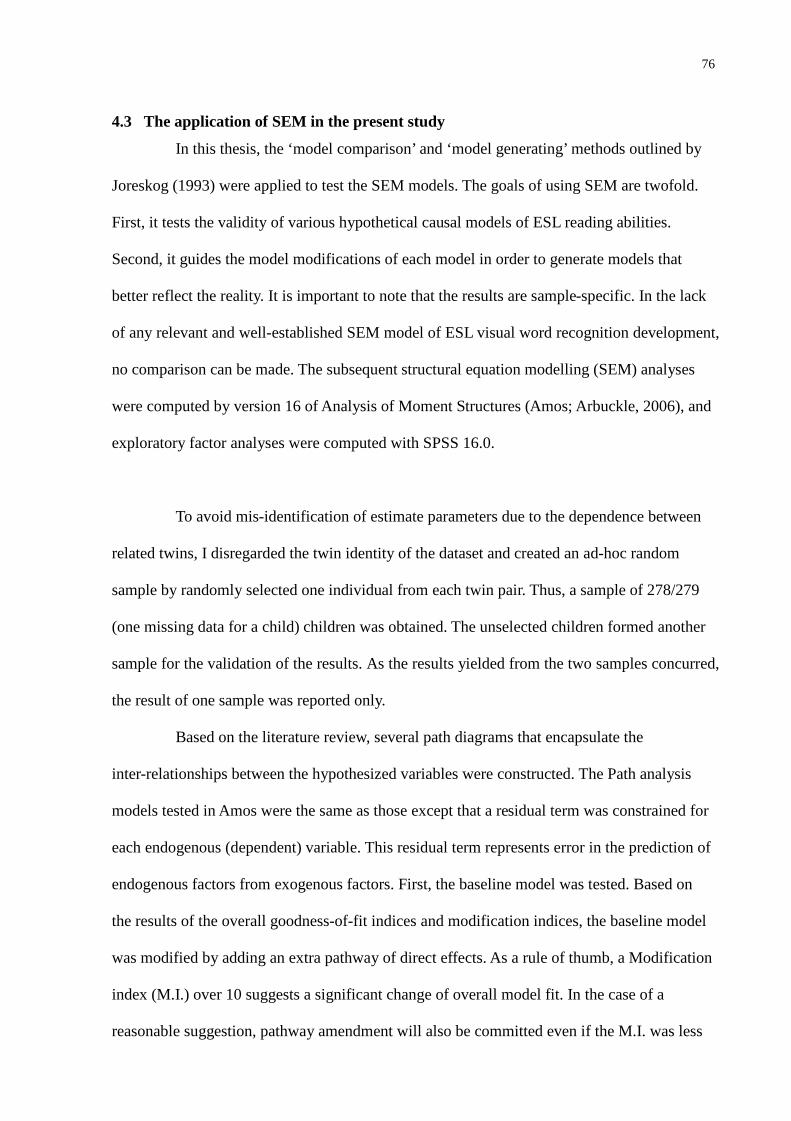
76
4.3 The application of SEM in the present study
In this thesis, the ‘model comparison’ and ‘model generating’ methods outlined by
Joreskog (1993) were applied to test the SEM models. The goals of using SEM are twofold.
First, it tests the validity of various hypothetical causal models of ESL reading abilities.
Second, it guides the model modifications of each model in order to generate models that
better reflect the reality. It is important to note that the results are sample-specific. In the lack
of any relevant and well-established SEM model of ESL visual word recognition development,
no comparison can be made. The subsequent structural equation modelling (SEM) analyses
were computed by version 16 of Analysis of Moment Structures (Amos; Arbuckle, 2006), and
exploratory factor analyses were computed with SPSS 16.0.
To avoid mis-identification of estimate parameters due to the dependence between
related twins, I disregarded the twin identity of the dataset and created an ad-hoc random
sample by randomly selected one individual from each twin pair. Thus, a sample of 278/279
(one missing data for a child) children was obtained. The unselected children formed another
sample for the validation of the results. As the results yielded from the two samples concurred,
the result of one sample was reported only.
Based on the literature review, several path diagrams that encapsulate the
inter-relationships between the hypothesized variables were constructed. The Path analysis
models tested in Amos were the same as those except that a residual term was constrained for
each endogenous (dependent) variable. This residual term represents error in the prediction of
endogenous factors from exogenous factors. First, the baseline model was tested. Based on
the results of the overall goodness-of-fit indices and modification indices, the baseline model
was modified by adding an extra pathway of direct effects. As a rule of thumb, a Modification
index (M.I.) over 10 suggests a significant change of overall model fit. In the case of a
reasonable suggestion, pathway amendment will also be committed even if the M.I. was less

77
than 10. Because the generation of the modification indices was based on statistical analyses,
re-specification of the pathway also relied on theoretical soundness. The modified model was
then subject to another model-fitting test. In addition, based on the principle of parsimony, a
non-significant pathway would be dropped even if the overall model fit did not improve. A
drop of pathway also increased the degrees of freedom. As recommended by Byrne (2010), it
was more sensible to modify one pathway in each model re-specification. This procedure was
repeated until a satisfactory level of goodness-of-fit was obtained. The standardized
regression coefficients of the final model were printed next to the pathway of direct effects
(single-headed arrow) in the Path analysis diagrams (figure 4.1-5 & 7).
4.4 Testing the four ESL reading models
I first tested the Autonomous model (McBride-Chang, 1996) (Figure 1.1). The
results of the baseline model indicated that the overall goodness-of-fit (details of various
indices can be found in appendix 3) was not satisfactory, and so model re-specification was
required. The standardized regression coefficient of two pathways were not significant
(Speech perception to Visual word recognition, p=.51; Phonological memory to Visual word
recognition, p=.78), but they were preserved until all the modifications suggested by the
modification indices (M.I.) were completed. Based on the largest M.I., a bidirectional
pathway between Receptive vocabulary and Phonological awareness was added. The resulting
model gave an improved model fit. The actual correlation coefficient of the new link was
found to be larger than the value expected from the M.I.. Five extra bi-directional pathways
were included and the two non-significant pathways were dropped from the model (see table
4.1 for details). The final model is shown in figure 4.2.
78
Table 4.1. The values of parameter estimates and goodness-of-fit indices of a series of Path analysis
models tested against the Autonomous model (McBride-Chang, 1996)
Model Respecification
M.I.suggestedand actualchanges
2 (df) RMSEA SRMR CFI PNFI
Base-Line
NA NA 195.52 (6) .34 .26 .48 .29
B + EVR < > EPA 63,.47,.48 123.37 (5) .29 .22 .68 .34
C + EPM < > EPA 25,.25,.35 90.01 (4) .28 .18 .77 .30
D + EVR < > EPM 39,.31,.44 29.77 (3) .18 .12 .93 .28
E + EPA < > ESP 5,.11,.13 23.93 (2) .20 .10 .94 .19
F + EVR < > ESP 6,.13,.16 15.76 (1) .23 .07 .96 .10
Final
+ EPM < > ESP
- ESP > EVWR#
- EPM > EVWR#
10,.16,.23 .49 (2) .00 .00 1.0 .20
Note: EVWR=ESL visual word recognition; EVR=ESL receptive vocabulary;
EPA=ESL phonological awareness; EPM=ESL phonological memory;
ESP=ESL speech perception;
< >=bidirectional pathway; > unidirectional pathway;
+ Added an additional pathway; - Deleted a pathway; # based on the principal of parsimony
M.I. = Modification indices (Joreskog & Sorbom, 1984);
2=likelihood ratio chi-square; RMSEA=Root mean square error of approximation;
SRMR=Standardized root mean square residual; CFI=Comparative fit index;
PNFI=Parsimonious goodness-of-fit index
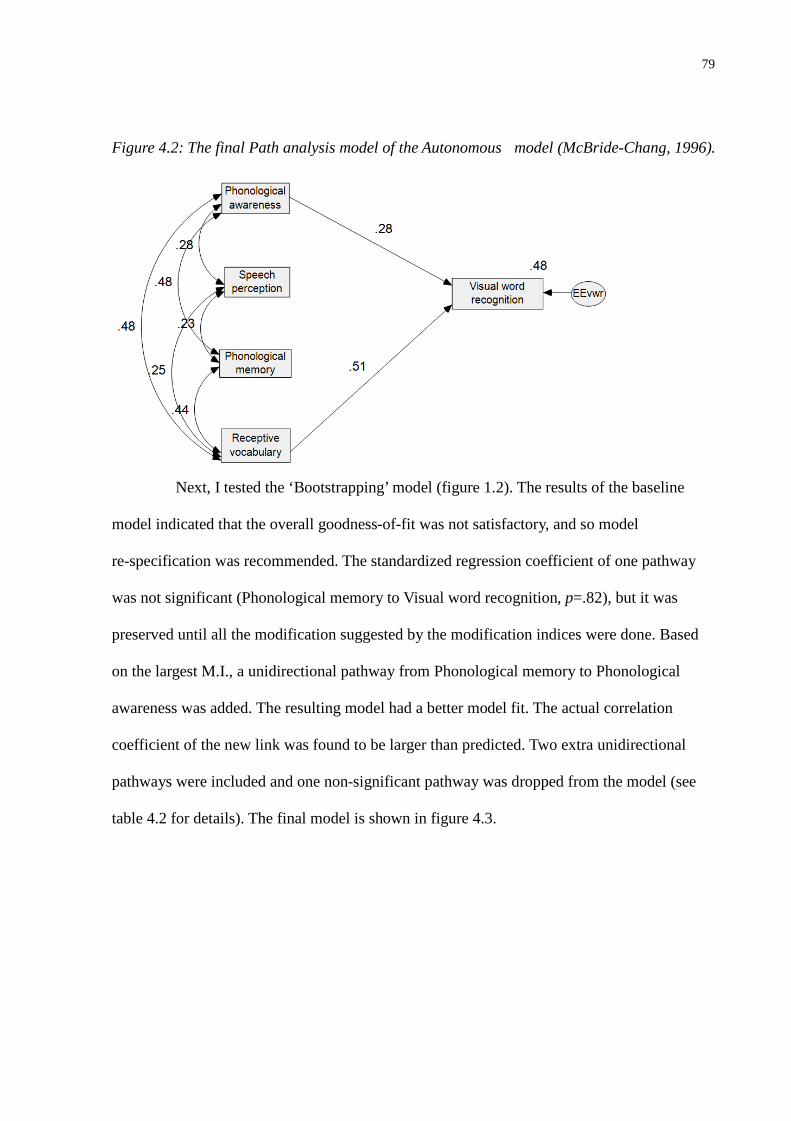
79
Figure 4.2: The final Path analysis model of the Autonomous model (McBride-Chang, 1996).
Next, I tested the ‘Bootstrapping’ model (figure 1.2). The results of the baseline
model indicated that the overall goodness-of-fit was not satisfactory, and so model
re-specification was recommended. The standardized regression coefficient of one pathway
was not significant (Phonological memory to Visual word recognition, p=.82), but it was
preserved until all the modification suggested by the modification indices were done. Based
on the largest M.I., a unidirectional pathway from Phonological memory to Phonological
awareness was added. The resulting model had a better model fit. The actual correlation
coefficient of the new link was found to be larger than predicted. Two extra unidirectional
pathways were included and one non-significant pathway was dropped from the model (see
table 4.2 for details). The final model is shown in figure 4.3.
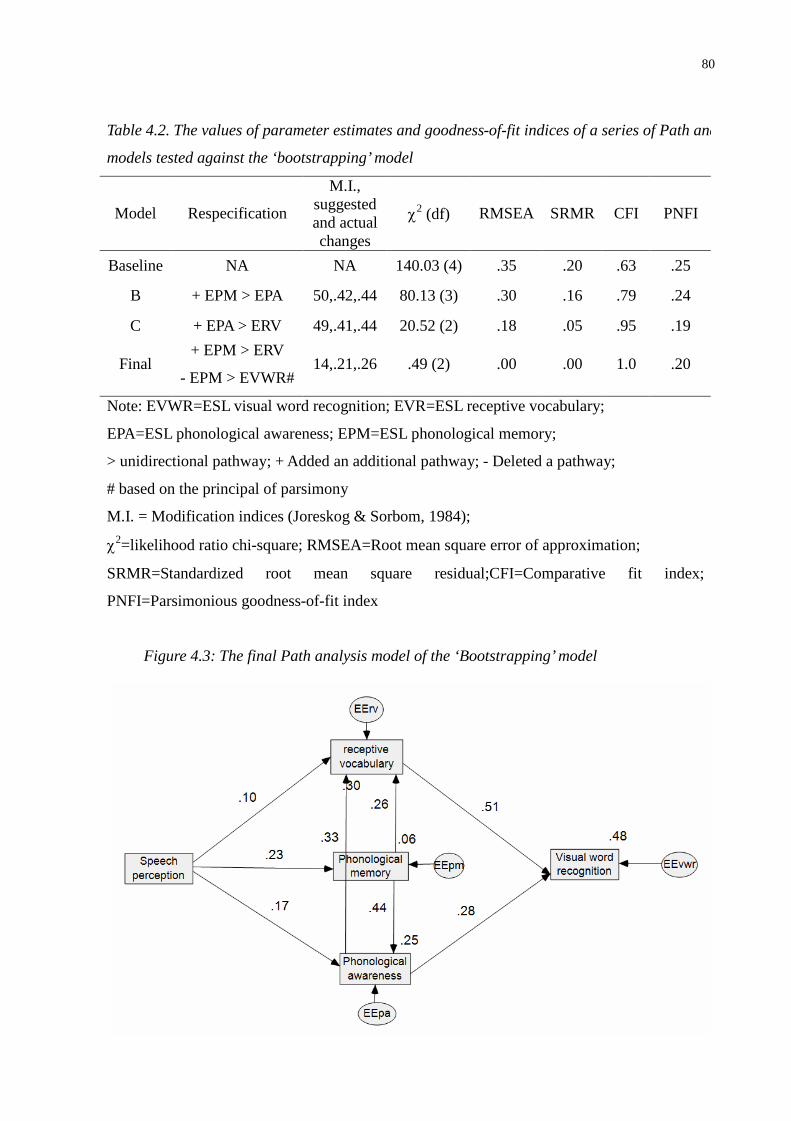
80
Figure 4.3: The final Path analysis model of the ‘Bootstrapping’ model
Table 4.2. The values of parameter estimates and goodness-of-fit indices of a series of Path analysis
models tested against the ‘bootstrapping’ model
Model Respecification
M.I.,suggestedand actualchanges
2 (df) RMSEA SRMR CFI PNFI
Baseline NA NA 140.03 (4) .35 .20 .63 .25
B + EPM > EPA 50,.42,.44 80.13 (3) .30 .16 .79 .24
C + EPA > ERV 49,.41,.44 20.52 (2) .18 .05 .95 .19
Final+ EPM > ERV
- EPM > EVWR#14,.21,.26 .49 (2) .00 .00 1.0 .20
Note: EVWR=ESL visual word recognition; EVR=ESL receptive vocabulary;
EPA=ESL phonological awareness; EPM=ESL phonological memory;
> unidirectional pathway; + Added an additional pathway; - Deleted a pathway;
# based on the principal of parsimony
M.I. = Modification indices (Joreskog & Sorbom, 1984);
2=likelihood ratio chi-square; RMSEA=Root mean square error of approximation;
SRMR=Standardized root mean square residual;CFI=Comparative fit index;
PNFI=Parsimonious goodness-of-fit index
81
The third model to be tested was the Lexical restructuring model (‘LRM’) (figure
1.3). The results of the baseline model indicated that the overall goodness-of-fit was not
satisfactory, model re-specification was required. The standardized regression coefficient of
one pathway was not significant (Phonological memory to visual word recognition, p=.82),
but it was kept until all the modifications suggested by the modification indices were
completed. Based on the largest M.I., a unidirectional pathway from Receptive vocabulary to
Visual word recognition was added. The resulting model had a better model fit. The actual
correlation coefficient of the new link was found to be larger than expected. Three extra
unidirectional and one extra bidirectional pathways were included (see table 4.3 for details).
The final model is shown in figure 4.4.

82
Figure 4.4: The final Path analysis model of the modified Lexical Restructuring Model.
Table 4.3. The values of parameter estimates and goodness-of-fit indices of a series of Path analysis
models tested against the LRM model
Model Respecification
M.I.,suggestedand actualchanges
2 (df) RMSEA SRMR CFI PNFI
Baseline NA NA 129.29 (5) .30 .13 .66 .33
B + ERV > EVWR 51,.37,.51 45.32 (4) .19 .08 .89 .35
C + EPM > EPA 25,.27,.33 11.95 (3) .10 .05 .98 .29
D + Speech > EPA 5,.11,.13 6.12 (2) .09 .03 .99 .20
Final+ ESP > EPM
- EPM > EVWR#5,.12,.13 .49 (2) .00 .00 1.0 .20
Note: EVWR=ESL visual word recognition; EVR=ESL receptive vocabulary;
EPA=ESL phonological awareness; EPM=ESL phonological memory;
ESP=ESL speech perception;
> unidirectional pathway;
+ Added an additional pathway; - Deleted a pathway; # based on the principal of parsimony
M.I. = Modification indices (Joreskog & Sorbom, 1984);
2=likelihood ratio chi-square; RMSEA=Root mean square error of approximation;
SRMR=Standardized root mean square residual; CFI=Comparative fit index;
PNFI=Parsimonious goodness-of-fit index
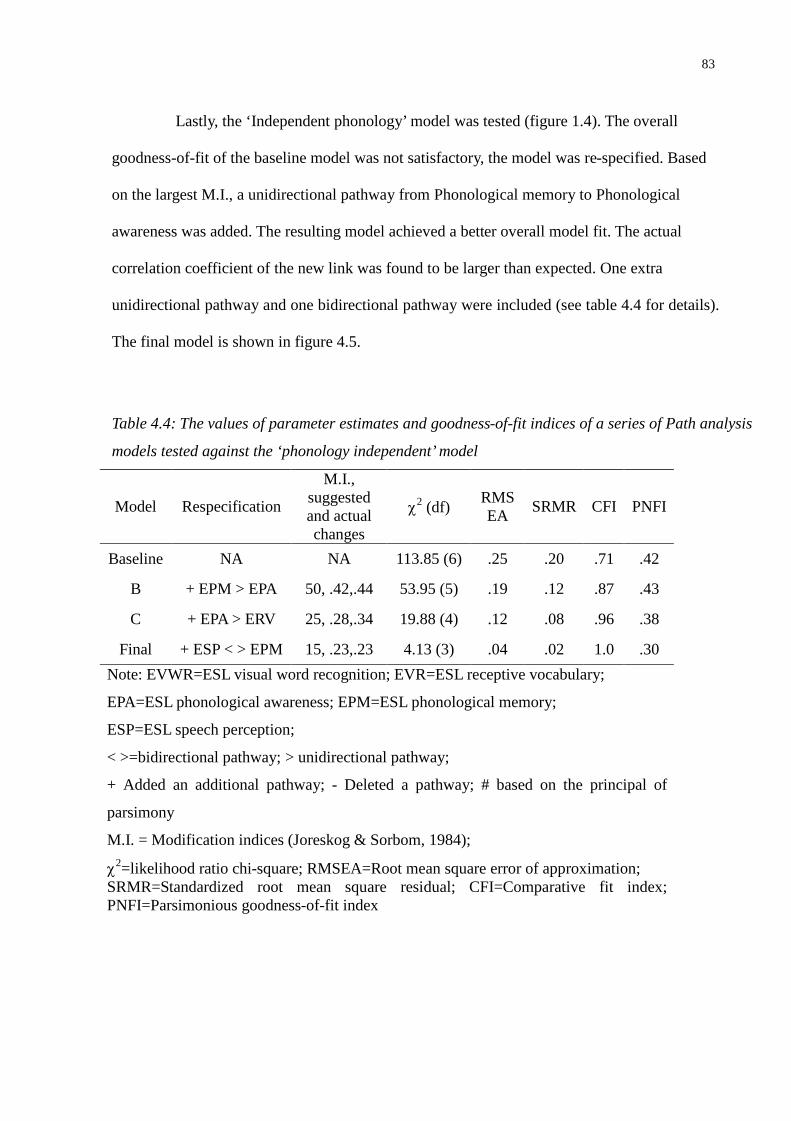
83
Lastly, the ‘Independent phonology’ model was tested (figure 1.4). The overall
goodness-of-fit of the baseline model was not satisfactory, the model was re-specified. Based
on the largest M.I., a unidirectional pathway from Phonological memory to Phonological
awareness was added. The resulting model achieved a better overall model fit. The actual
correlation coefficient of the new link was found to be larger than expected. One extra
unidirectional pathway and one bidirectional pathway were included (see table 4.4 for details).
The final model is shown in figure 4.5.
Table 4.4: The values of parameter estimates and goodness-of-fit indices of a series of Path analysis
models tested against the ‘phonology independent’ model
Model Respecification
M.I.,suggestedand actualchanges
2 (df)RMSEA
SRMR CFI PNFI
Baseline NA NA 113.85 (6) .25 .20 .71 .42
B + EPM > EPA 50, .42,.44 53.95 (5) .19 .12 .87 .43
C + EPA > ERV 25, .28,.34 19.88 (4) .12 .08 .96 .38
Final + ESP < > EPM 15, .23,.23 4.13 (3) .04 .02 1.0 .30
Note: EVWR=ESL visual word recognition; EVR=ESL receptive vocabulary;
EPA=ESL phonological awareness; EPM=ESL phonological memory;
ESP=ESL speech perception;
< >=bidirectional pathway; > unidirectional pathway;
+ Added an additional pathway; - Deleted a pathway; # based on the principal of
parsimony
M.I. = Modification indices (Joreskog & Sorbom, 1984);
2=likelihood ratio chi-square; RMSEA=Root mean square error of approximation;SRMR=Standardized root mean square residual; CFI=Comparative fit index;PNFI=Parsimonious goodness-of-fit index

84
Figure 4.5: The final Path analysis model of the ‘Phonology independent’ model.
4.5 Discussion on models of ESL reading development
In all the four hypothesized models, the baseline models needed further model
re-specification in order to obtain a model with satisfactory overall model fit. The data fitted
almost perfectly into the final models. All final models included L2 variables without a single
L1 variable. As observed consistently in L2 reading research, L2 variables were found to have
a stronger impact on L2 reading skills, overriding the variance attributable to L1 experience.
Thus, although L2 print information processing is guided by insights stemming from literacy
experiences in the two languages, L2 print input appears to be a dominant force in shaping
reading sub-skills in that language (Koda, 2007). The purpose of comparing the four models
is not to support one in the expense of others. On the contrary, the comparisons of different
models help us to uncover the multiple but unique functions of each skill in ESL reading
development.
4.6 Commonalities and specificities of the four final models
Several commonalities were observed across four final models.
First, receptive vocabulary and phonological awareness were causally linked to
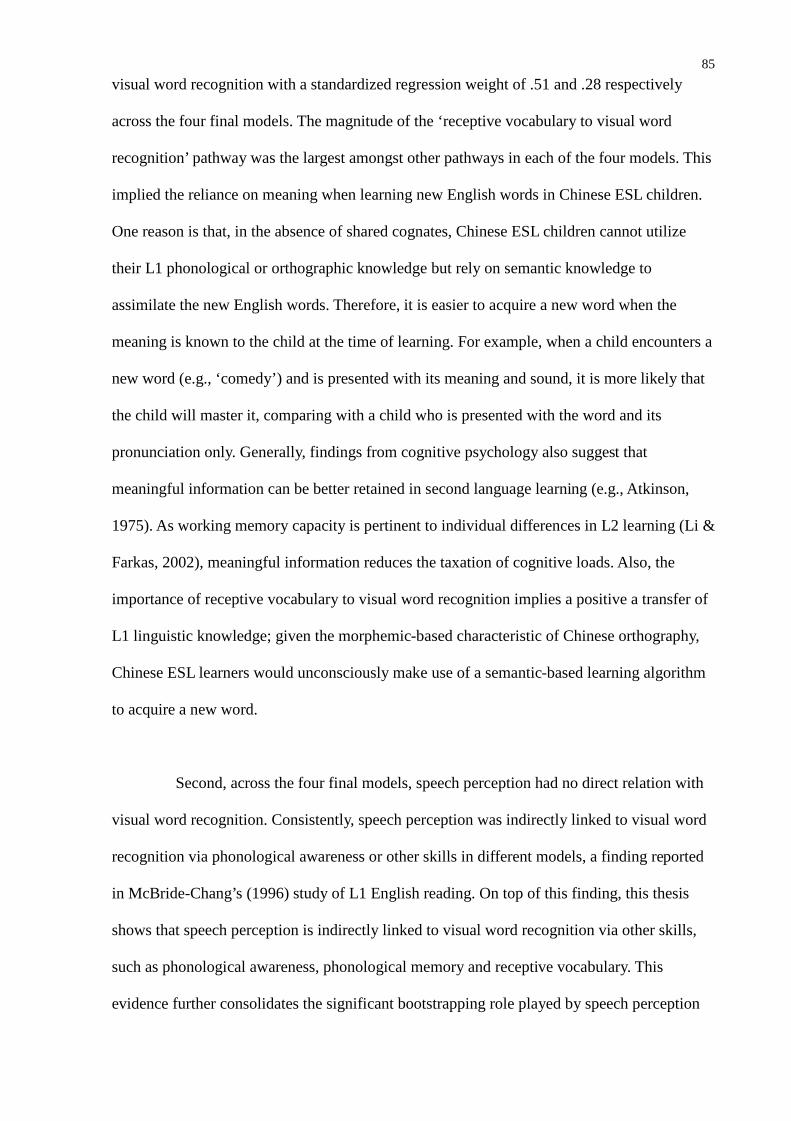
85
visual word recognition with a standardized regression weight of .51 and .28 respectively
across the four final models. The magnitude of the ‘receptive vocabulary to visual word
recognition’ pathway was the largest amongst other pathways in each of the four models. This
implied the reliance on meaning when learning new English words in Chinese ESL children.
One reason is that, in the absence of shared cognates, Chinese ESL children cannot utilize
their L1 phonological or orthographic knowledge but rely on semantic knowledge to
assimilate the new English words. Therefore, it is easier to acquire a new word when the
meaning is known to the child at the time of learning. For example, when a child encounters a
new word (e.g., ‘comedy’) and is presented with its meaning and sound, it is more likely that
the child will master it, comparing with a child who is presented with the word and its
pronunciation only. Generally, findings from cognitive psychology also suggest that
meaningful information can be better retained in second language learning (e.g., Atkinson,
1975). As working memory capacity is pertinent to individual differences in L2 learning (Li &
Farkas, 2002), meaningful information reduces the taxation of cognitive loads. Also, the
importance of receptive vocabulary to visual word recognition implies a positive a transfer of
L1 linguistic knowledge; given the morphemic-based characteristic of Chinese orthography,
Chinese ESL learners would unconsciously make use of a semantic-based learning algorithm
to acquire a new word.
Second, across the four final models, speech perception had no direct relation with
visual word recognition. Consistently, speech perception was indirectly linked to visual word
recognition via phonological awareness or other skills in different models, a finding reported
in McBride-Chang’s (1996) study of L1 English reading. On top of this finding, this thesis
shows that speech perception is indirectly linked to visual word recognition via other skills,
such as phonological awareness, phonological memory and receptive vocabulary. This
evidence further consolidates the significant bootstrapping role played by speech perception
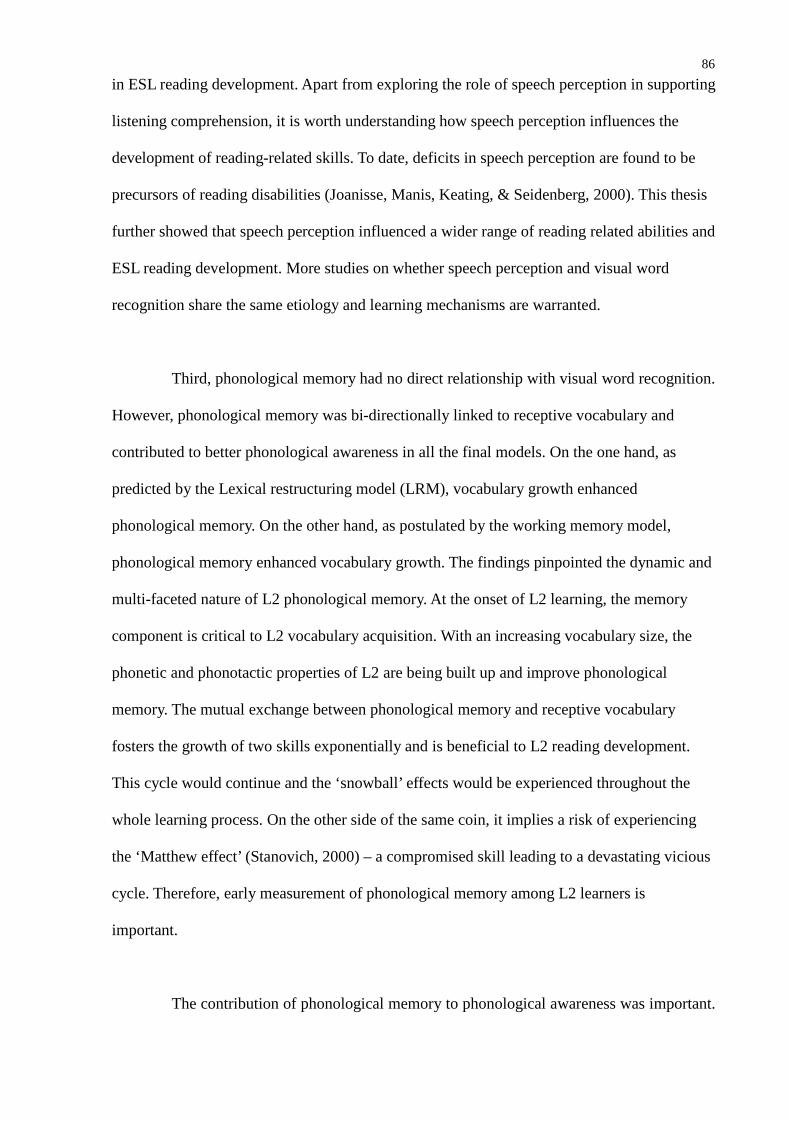
86
in ESL reading development. Apart from exploring the role of speech perception in supporting
listening comprehension, it is worth understanding how speech perception influences the
development of reading-related skills. To date, deficits in speech perception are found to be
precursors of reading disabilities (Joanisse, Manis, Keating, & Seidenberg, 2000). This thesis
further showed that speech perception influenced a wider range of reading related abilities and
ESL reading development. More studies on whether speech perception and visual word
recognition share the same etiology and learning mechanisms are warranted.
Third, phonological memory had no direct relationship with visual word recognition.
However, phonological memory was bi-directionally linked to receptive vocabulary and
contributed to better phonological awareness in all the final models. On the one hand, as
predicted by the Lexical restructuring model (LRM), vocabulary growth enhanced
phonological memory. On the other hand, as postulated by the working memory model,
phonological memory enhanced vocabulary growth. The findings pinpointed the dynamic and
multi-faceted nature of L2 phonological memory. At the onset of L2 learning, the memory
component is critical to L2 vocabulary acquisition. With an increasing vocabulary size, the
phonetic and phonotactic properties of L2 are being built up and improve phonological
memory. The mutual exchange between phonological memory and receptive vocabulary
fosters the growth of two skills exponentially and is beneficial to L2 reading development.
This cycle would continue and the ‘snowball’ effects would be experienced throughout the
whole learning process. On the other side of the same coin, it implies a risk of experiencing
the ‘Matthew effect’ (Stanovich, 2000) – a compromised skill leading to a devastating vicious
cycle. Therefore, early measurement of phonological memory among L2 learners is
important.
The contribution of phonological memory to phonological awareness was important.
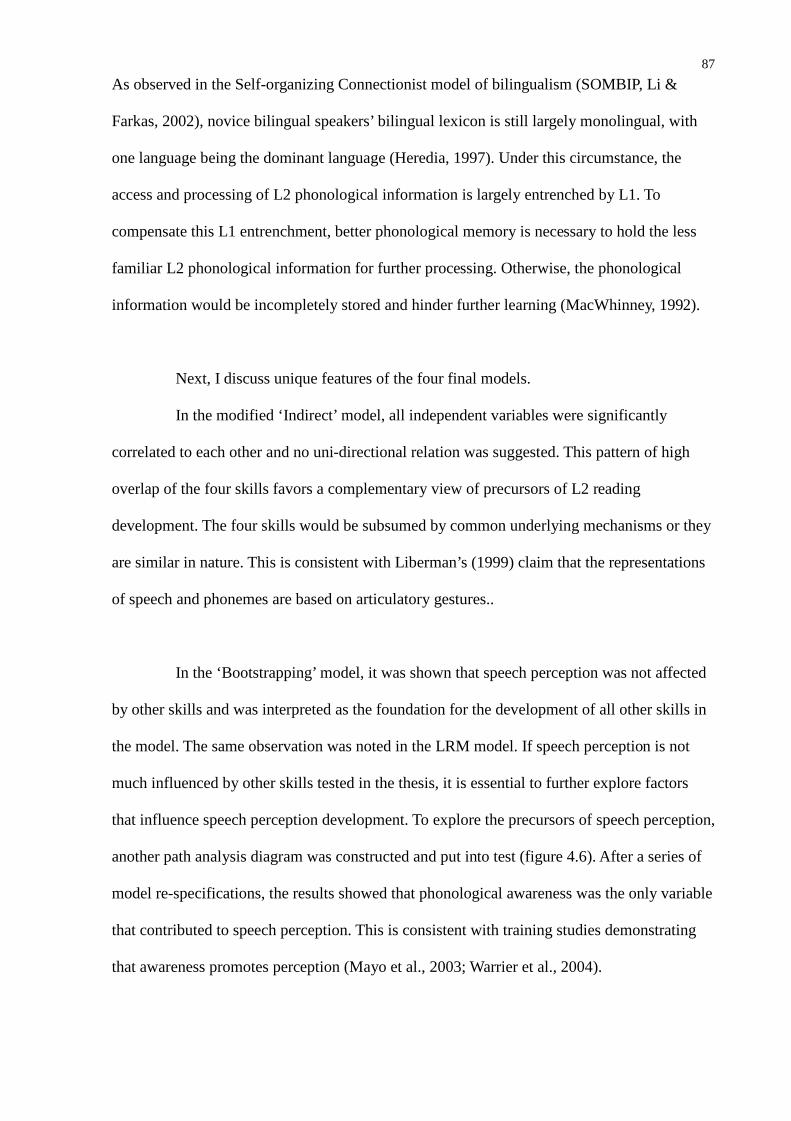
87
As observed in the Self-organizing Connectionist model of bilingualism (SOMBIP, Li &
Farkas, 2002), novice bilingual speakers’ bilingual lexicon is still largely monolingual, with
one language being the dominant language (Heredia, 1997). Under this circumstance, the
access and processing of L2 phonological information is largely entrenched by L1. To
compensate this L1 entrenchment, better phonological memory is necessary to hold the less
familiar L2 phonological information for further processing. Otherwise, the phonological
information would be incompletely stored and hinder further learning (MacWhinney, 1992).
Next, I discuss unique features of the four final models.
In the modified ‘Indirect’ model, all independent variables were significantly
correlated to each other and no uni-directional relation was suggested. This pattern of high
overlap of the four skills favors a complementary view of precursors of L2 reading
development. The four skills would be subsumed by common underlying mechanisms or they
are similar in nature. This is consistent with Liberman’s (1999) claim that the representations
of speech and phonemes are based on articulatory gestures..
In the ‘Bootstrapping’ model, it was shown that speech perception was not affected
by other skills and was interpreted as the foundation for the development of all other skills in
the model. The same observation was noted in the LRM model. If speech perception is not
much influenced by other skills tested in the thesis, it is essential to further explore factors
that influence speech perception development. To explore the precursors of speech perception,
another path analysis diagram was constructed and put into test (figure 4.6). After a series of
model re-specifications, the results showed that phonological awareness was the only variable
that contributed to speech perception. This is consistent with training studies demonstrating
that awareness promotes perception (Mayo et al., 2003; Warrier et al., 2004).

88
The findings of the LRM underscore the importance of receptive vocabulary in
phonological development. The LRM is the only model among the four that shows causal
relationships from receptive vocabulary to phonological memory and phonological awareness.
Although speech perception also had the same direct causal effect on phonological memory
and phonological awareness, the effects of receptive vocabulary outweighed that of speech
perception (to phonological memory, .41 vs. .13; to phonological awareness, .31 vs. .12).
In the ‘Independent phonology’ model, the hypothesis of independence between
phonological awareness and memory was not supported. The linkage between the two skills
was shown to be rooted in speech perception.

89
Table 4.5: Zero-order correlations among time 1 variables controlling for age
1 2 3 4 5 6 7 8 9 10 11
1.EVWR -
2.ERV .64** -
3.EPA .52** .47** -
4.EPM .36** .44** .47** -
5.ESP .18** .25** .27** .23** -
6.CVWR .55** .30** .23** .20** .16** -
7.CRV .19** .32** .26** .32** .26** .26** -
8.CPA .37** .39** .49** .43** .33** .37** .41** -
9.CTA .27** .23** .35** .20** .24** .20** .21** .33** -
10.CPM .12* .19** .25** .37** .30** .15* .35** .35** .17** -
11.CSP .11 .13* .22** .25** .52** .17** .26** .31** .20** .20** -
Note. *p<.05; **p<.01EVWR=ESL visual word recognition; ERV=ESL receptive vocabulary;
EPA=ESL phonological awareness; EPM=ESL phonological memory;
ESP=ESL speech perception;
CVWR=Chinese visual word recognition; CRV=Chinese receptive vocabulary;
CPA=Chinese phonological awareness; CTA=Chinese tone awareness;
CPM=Chinese phonological memory; CSP=Chinese speech perception.
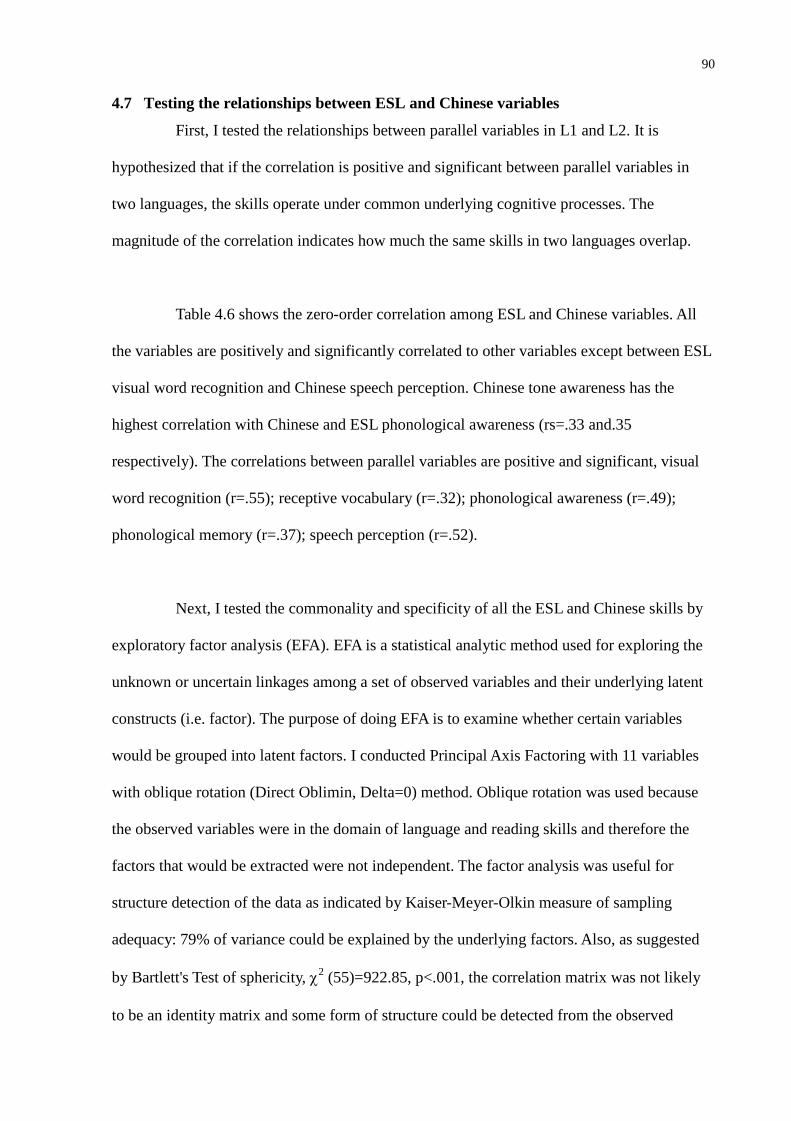
90
4.7 Testing the relationships between ESL and Chinese variables
First, I tested the relationships between parallel variables in L1 and L2. It is
hypothesized that if the correlation is positive and significant between parallel variables in
two languages, the skills operate under common underlying cognitive processes. The
magnitude of the correlation indicates how much the same skills in two languages overlap.
Table 4.6 shows the zero-order correlation among ESL and Chinese variables. All
the variables are positively and significantly correlated to other variables except between ESL
visual word recognition and Chinese speech perception. Chinese tone awareness has the
highest correlation with Chinese and ESL phonological awareness (rs=.33 and.35
respectively). The correlations between parallel variables are positive and significant, visual
word recognition (r=.55); receptive vocabulary (r=.32); phonological awareness (r=.49);
phonological memory (r=.37); speech perception (r=.52).
Next, I tested the commonality and specificity of all the ESL and Chinese skills by
exploratory factor analysis (EFA). EFA is a statistical analytic method used for exploring the
unknown or uncertain linkages among a set of observed variables and their underlying latent
constructs (i.e. factor). The purpose of doing EFA is to examine whether certain variables
would be grouped into latent factors. I conducted Principal Axis Factoring with 11 variables
with oblique rotation (Direct Oblimin, Delta=0) method. Oblique rotation was used because
the observed variables were in the domain of language and reading skills and therefore the
factors that would be extracted were not independent. The factor analysis was useful for
structure detection of the data as indicated by Kaiser-Meyer-Olkin measure of sampling
adequacy: 79% of variance could be explained by the underlying factors. Also, as suggested
by Bartlett's Test of sphericity, 2 (55)=922.85, p<.001, the correlation matrix was not likely
to be an identity matrix and some form of structure could be detected from the observed

91
variables. After the factor extraction process, two components with eigenvalues over Kaiser’s
(1960) criterion of 1 were extracted and they explained 36.86% of the variability in the
original observed variables. This suggested that over 60% of the variation was unexplained.
Summary of factor loadings is shown in table 4.7. Taking the scree plot into account (figure
4.6), two components were retained in the final analysis. Rotation was conducted to optimize
the factor structure and equalize the importance of the extracted factors. The factor loadings
after rotation are show in table 4.7. After the rotation, two factors remained with eigenvalues
larger than 1. Factors with loading higher than .40 are considered to be significantly linked to
the latent factor. Factor 1 consisted of all the variables except ESL and Chinese visual word
recognition. Factor 2 consisted of ESL and Chinese visual word recognition, ESL and Chinese
phonological awareness, ESL receptive vocabulary and ESL phonological memory. The
correlation between Factors 1 and 2 is .47.
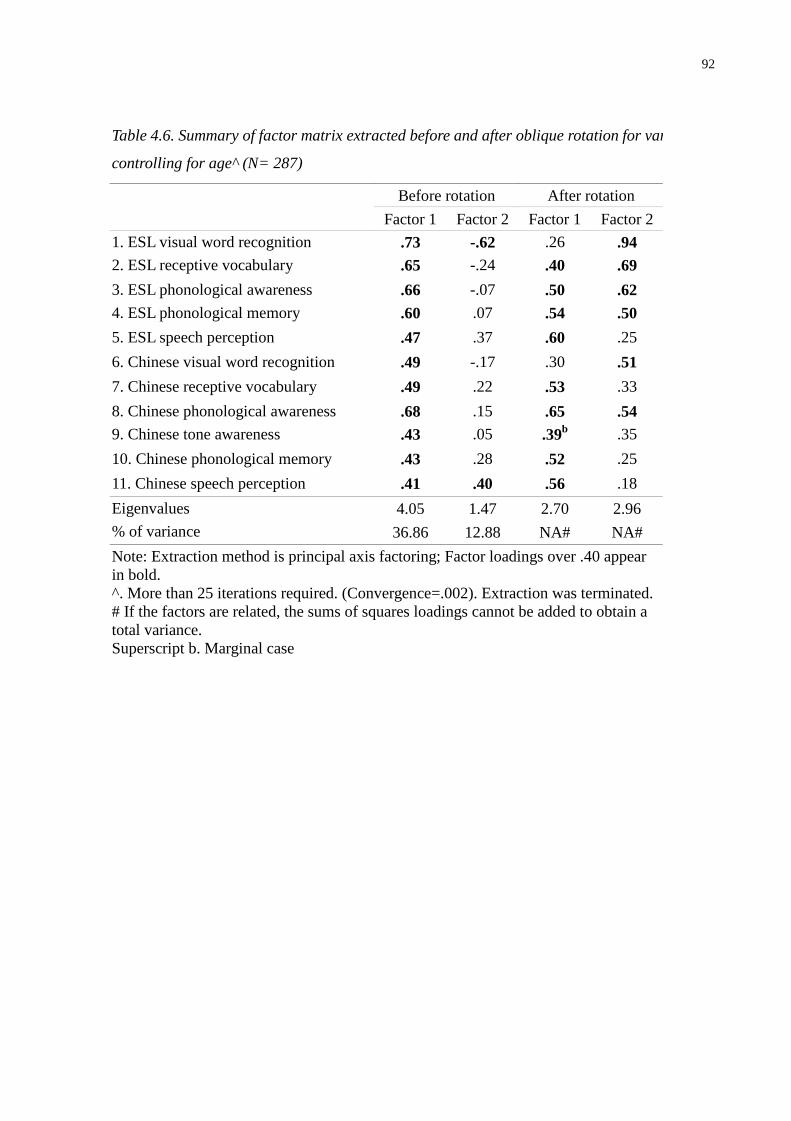
92
Table 4.6. Summary of factor matrix extracted before and after oblique rotation for variables
controlling for age^ (N= 287)
Before rotation After rotation
Factor 1 Factor 2 Factor 1 Factor 2
1. ESL visual word recognition .73 -.62 .26 .942. ESL receptive vocabulary .65 -.24 .40 .69
3. ESL phonological awareness .66 -.07 .50 .624. ESL phonological memory .60 .07 .54 .50
5. ESL speech perception .47 .37 .60 .25
6. Chinese visual word recognition .49 -.17 .30 .51
7. Chinese receptive vocabulary .49 .22 .53 .33
8. Chinese phonological awareness .68 .15 .65 .549. Chinese tone awareness .43 .05 .39b .35
10. Chinese phonological memory .43 .28 .52 .25
11. Chinese speech perception .41 .40 .56 .18
Eigenvalues 4.05 1.47 2.70 2.96
% of variance 36.86 12.88 NA# NA#
Note: Extraction method is principal axis factoring; Factor loadings over .40 appearin bold.^. More than 25 iterations required. (Convergence=.002). Extraction was terminated.# If the factors are related, the sums of squares loadings cannot be added to obtain atotal variance.Superscript b. Marginal case
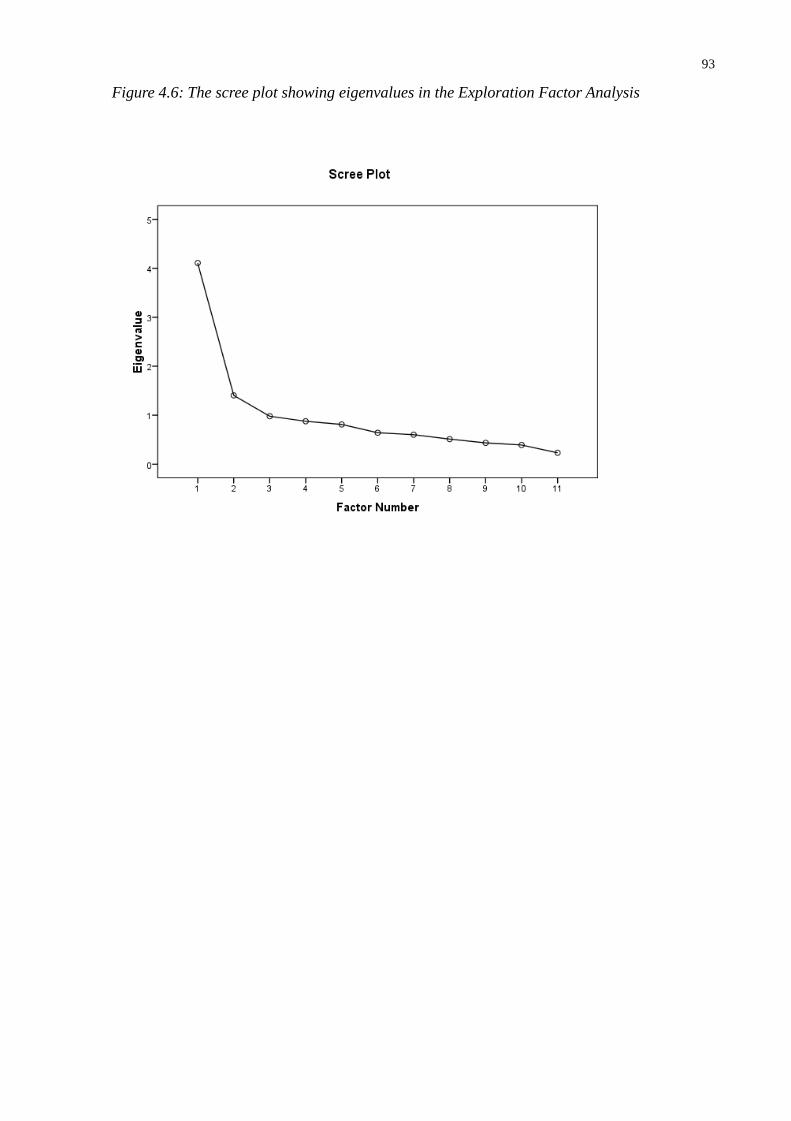
93
Figure 4.6: The scree plot showing eigenvalues in the Exploration Factor Analysis
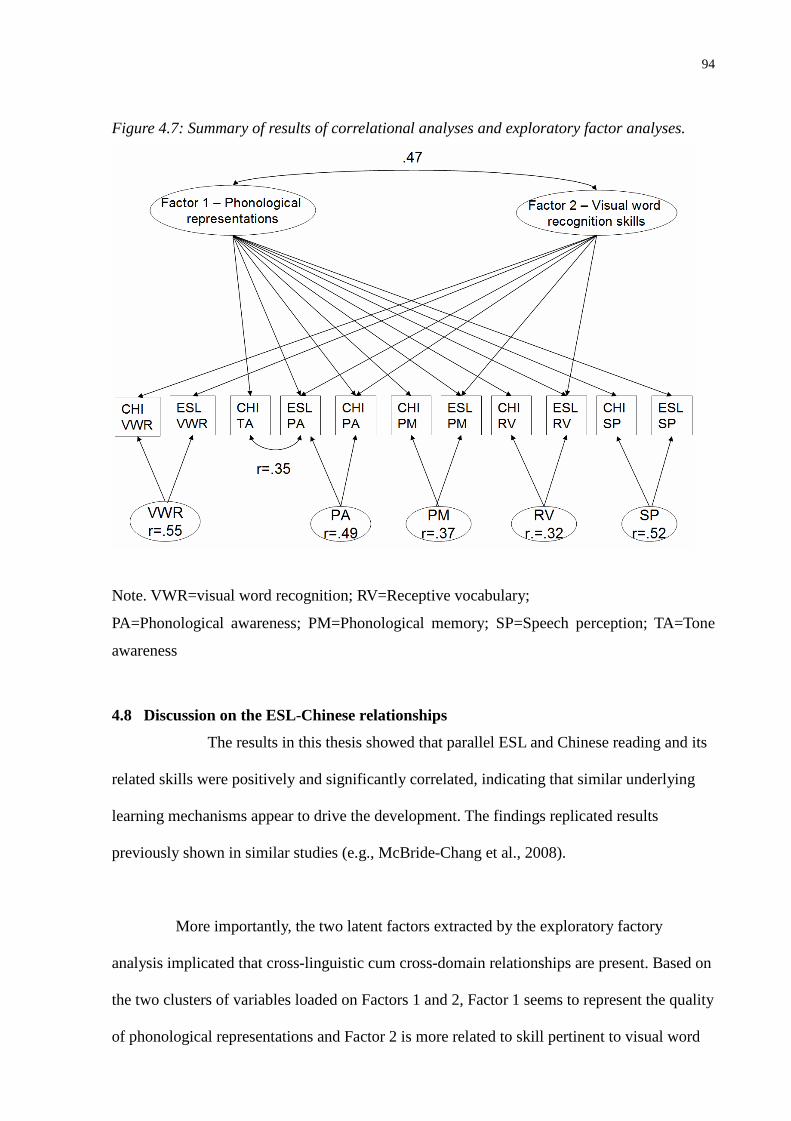
94
Figure 4.7: Summary of results of correlational analyses and exploratory factor analyses.
Note. VWR=visual word recognition; RV=Receptive vocabulary;
PA=Phonological awareness; PM=Phonological memory; SP=Speech perception; TA=Tone
awareness
4.8 Discussion on the ESL-Chinese relationships
The results in this thesis showed that parallel ESL and Chinese reading and its
related skills were positively and significantly correlated, indicating that similar underlying
learning mechanisms appear to drive the development. The findings replicated results
previously shown in similar studies (e.g., McBride-Chang et al., 2008).
More importantly, the two latent factors extracted by the exploratory factory
analysis implicated that cross-linguistic cum cross-domain relationships are present. Based on
the two clusters of variables loaded on Factors 1 and 2, Factor 1 seems to represent the quality
of phonological representations and Factor 2 is more related to skill pertinent to visual word

95
recognition skills. It should be noted that most of the observed variables loaded on both
Factors 1 and 2. It is possible that each observed variable entails more than one component
skill and different component skills contribute differently to a more general cognitive factor.
As discussed in chapter 1, phonological representations lay the foundation for the
development of receptive vocabulary, phonological memory and phonological awareness. The
current results further indicate that ESL and Chinese skills overlap, possibly at the level of
phonological representations (Factor 1). The nature of phonological representations in
Chinese-English bilinguals has been studied with computational models. Figure 4.8a-c shows
the computational maps generated from the Hong Kong Bilingual Corpus from the CHILDES
database (MacWhinney, 2000; Yip & Matthews, 2000) by Zhao and Li (2010). In novice
Chinese-English bilinguals (figure 4.8a), the lexical organization patterns show only small
and fragmented regions of ESL units that dispersed throughout the map. That is, the ESL
representations were parasitic on Chinese words. The limited ESL lexical knowledge would
constrain the development of linguistic and metalinguistic functions in English. In the case of
more competent ESL learners (figure 4.8b), the lexical organization patterns consist of larger
regions of ESL representations. For these ESL learners, there are richer linguistic resources
for ESL learning. Lastly, the network of advanced Chinese-English bilinguals (figure 4.8c)
shows clear and distinct ESL and Chinese phonological representations. The high
distinctiveness of these representations allows the user to use both languages effectively and
efficiently.
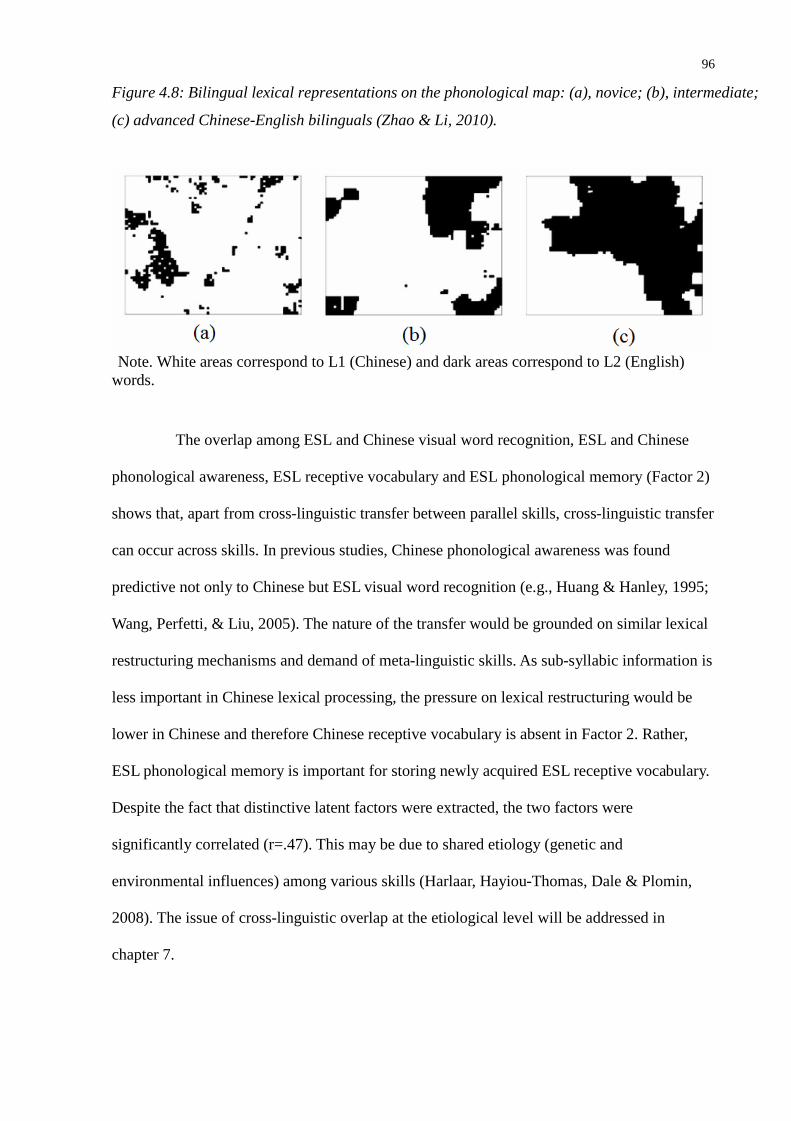
96
Figure 4.8: Bilingual lexical representations on the phonological map: (a), novice; (b), intermediate;
(c) advanced Chinese-English bilinguals (Zhao & Li, 2010).
Note. White areas correspond to L1 (Chinese) and dark areas correspond to L2 (English)words.
The overlap among ESL and Chinese visual word recognition, ESL and Chinese
phonological awareness, ESL receptive vocabulary and ESL phonological memory (Factor 2)
shows that, apart from cross-linguistic transfer between parallel skills, cross-linguistic transfer
can occur across skills. In previous studies, Chinese phonological awareness was found
predictive not only to Chinese but ESL visual word recognition (e.g., Huang & Hanley, 1995;
Wang, Perfetti, & Liu, 2005). The nature of the transfer would be grounded on similar lexical
restructuring mechanisms and demand of meta-linguistic skills. As sub-syllabic information is
less important in Chinese lexical processing, the pressure on lexical restructuring would be
lower in Chinese and therefore Chinese receptive vocabulary is absent in Factor 2. Rather,
ESL phonological memory is important for storing newly acquired ESL receptive vocabulary.
Despite the fact that distinctive latent factors were extracted, the two factors were
significantly correlated (r=.47). This may be due to shared etiology (genetic and
environmental influences) among various skills (Harlaar, Hayiou-Thomas, Dale & Plomin,
2008). The issue of cross-linguistic overlap at the etiological level will be addressed in
chapter 7.

97
SECTION 2
THE GENETIC ANALYSIS
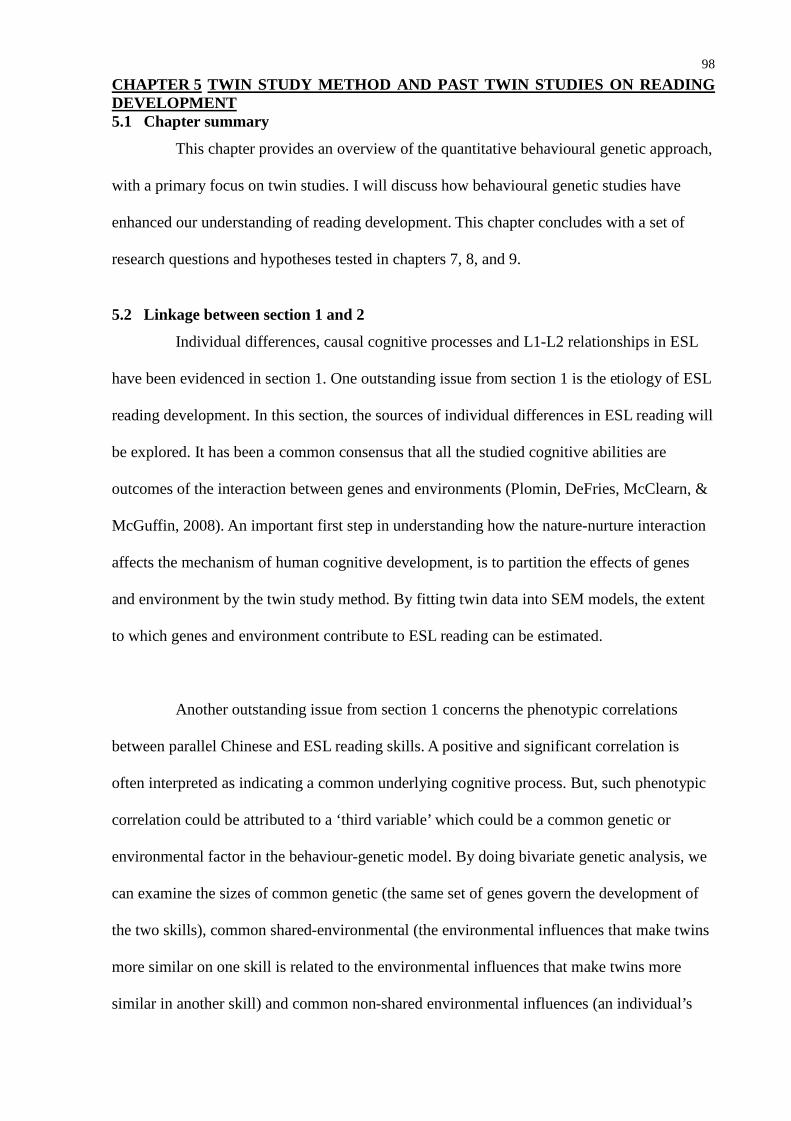
98
CHAPTER 5 TWIN STUDY METHOD AND PAST TWIN STUDIES ON READINGDEVELOPMENT5.1 Chapter summary
This chapter provides an overview of the quantitative behavioural genetic approach,
with a primary focus on twin studies. I will discuss how behavioural genetic studies have
enhanced our understanding of reading development. This chapter concludes with a set of
research questions and hypotheses tested in chapters 7, 8, and 9.
5.2 Linkage between section 1 and 2
Individual differences, causal cognitive processes and L1-L2 relationships in ESL
have been evidenced in section 1. One outstanding issue from section 1 is the etiology of ESL
reading development. In this section, the sources of individual differences in ESL reading will
be explored. It has been a common consensus that all the studied cognitive abilities are
outcomes of the interaction between genes and environments (Plomin, DeFries, McClearn, &
McGuffin, 2008). An important first step in understanding how the nature-nurture interaction
affects the mechanism of human cognitive development, is to partition the effects of genes
and environment by the twin study method. By fitting twin data into SEM models, the extent
to which genes and environment contribute to ESL reading can be estimated.
Another outstanding issue from section 1 concerns the phenotypic correlations
between parallel Chinese and ESL reading skills. A positive and significant correlation is
often interpreted as indicating a common underlying cognitive process. But, such phenotypic
correlation could be attributed to a ‘third variable’ which could be a common genetic or
environmental factor in the behaviour-genetic model. By doing bivariate genetic analysis, we
can examine the sizes of common genetic (the same set of genes govern the development of
the two skills), common shared-environmental (the environmental influences that make twins
more similar on one skill is related to the environmental influences that make twins more
similar in another skill) and common non-shared environmental influences (an individual’s
99
unique experiences explain the development of two skills).
5.3 Behavioural genetics and twin study: nature and nurture
Heritability refers to ‘the contribution of genetic differences to observed differences
among individuals in a particular population at a particular time’ (Plomin et al., 2008). Our
genes are inherited from our parents and are composed of various forms of protein. Functions
of the human genome include genetic coding that occurs in cells throughout the body.
However, effects of individual genes seem to be very small. Using a systematic allelic
association strategy, several significant associations were found between IQ and DNA
markers in or near candidate genes that were relevant to synaptic transmission and brain
development (Plomin et al., 1995). However, only one association was replicated in an
independent sample. Subsequent studies failed to obtain similar results (Payton, 2006; Plomin,
Kennedy, & Craig, 2006). Once the microarrays technique was available and pooling of a few
nanograms of DNA from each participant could be done, genomewide association studies
with hundreds of thousands of single-nucleotide polymorphism (SNP) could be conducted
more efficiently and economically (Sham, Bader, Craig, O’Donovan, & Owen, 2002). SNPs
are the most common type of DNA polymorphism and involve a mutation in a single
nucleotide (Plomin et al., 2008). With pooled DNA and a microarray with10,000 SNPs, four
SNPs associated with general cognitive factor (g) were identified at seven years of age,
though less than 0.3 percent of the variance of g was explained (Butcher et al., 2005). In a
second study, the g SNP set was also found to be significantly associated with reading
(Harlaar et al., 2005). In short, recent discoveries in the field of behavioural genetics have
shown that genes are critical in the individual differences of a range of human behaviours
including reading, but the effects observed in twin studies reflect the combined effect of many
genes, each of which has only a small influence.
Apart from genetic influences, environment as well plays a prime role in reading
100
development. The most prominent of the environmental factors include home language
spoken (Snow & Tabors, 2001), classroom teaching style (Foorman et al., 1998), home
environment (Whitehurst & Lonigan, 1998), and socioeconomic status (Vernon-Feagans,
1996). The nature and interplay of various environmental factors have been summarized in
Bronfenbrenner’s (1979) ecological model. The model has been applied to understand both
literacy development (McBride-Chang, 2004) and dyslexia (Poole, 2003). This ecological
view considers not only the immediate environment the child has close contact with, but what
is influencing this immediate environment in a larger context. Within the ecology of reading,
all environmental factors pertaining to the child continuously influence one another in a
bi-directional manner. For example, in the micro-system, parents design the home literacy
environment, decide which school the child should go to and what learning program the child
should attend. The parents’ choice could be influenced by factors at other systems in the
ecology, e.g. the ideologies of the culture and educational values in the macro-system. The
five systems (chrono-, macro-, exo-, meso-, and micro- systems) and factors related to reading
development in each system are shown in figure 6.1. The chrono-system refers to the pattern
of the environmental events and transitions over time (Bronfenbrenner & Morris, 2006). The
impact of chrono-system which concerns time is considered with a longitudinal design in this
thesis. The effects of some factors are stable and some are not. For instance, parental
influences are relatively stable as shown in research that parents contribute significantly to
children’s literacy development prior to coming to school (McCardle, Scarborough, & Catts,
2001) and during school (Molfese, Molfese, Key, & Kelly, 2003).
101
Figure 5.1: Bronfenbrenner’s (1979) ecological approach (adapted from Longitudinal Study of
Australian Children, 2009).
Since environment is not simply a cluster of standalone agencies but a set of
dynamic transactions between multiple agencies in the five systems of the ecology,
interpretations of environmental influences on ESL reading in this thesis will be made in
reference to the ecological approach. The twin study method provides a unique way to
understand a pure aggregate effect of the ecological system by controlling the genetic effects.
Also, it potentially allows researchers to further explore how an individual’s genetic
propensity influences his surrounding environment. Although this thesis has not dealt with
this gene-environment correlation, it is worth bearing this situation in mind.
In addition, it is worth considering Turkheimer’s (1998) comment on ‘biological
reductionism in psychology’ – how biogenetic theories associate behaviour with genotypic or
neurological variation. He argued that ‘complex human behaviours do not have localized
biological or genetic causes in the sense that stroke lesions cause aphasia or a single gene
causes phenylketonuria.’ In fact, there are levels of distinctive processes that operate between

102
reading behaviour and neurons or genes. Attempts have been made by researchers to build a
comprehensive model that encapsulates the causal relationship among factors at various levels
of analyses (e.g., Bishop & Snowling, 2004; Morton & Frith, 1995). This kind of model is
helpful to understand the essence of and interplay between behaviour, cognition, neurobiology
and etiology. Critically, the mappings between levels are not one-to-one but many-to-many, i.e.
behaviour results from the activity of multiple genes amidst the influence of numerous
environmental factors. In section 1 of this thesis, the interactions between visual word
recognition and related skills have been demonstrated at the behavioural and cognitive levels.
In section 2, the genetic and environmental factors that guide word recognition development
at the etiological level will be examined with the twin study method.
Figure 5.2: Levels of causation for reading abilities (Bishop & Snowling, 2004).
5.4 The classical twin study design
The twin method is a quasi-experimental design that compares the degree of
phenotypic resemblance between monozygotic (MZ) and dizygotic (DZ) twins. MZ twins are
genetically identical because they derive from the same fertilized egg; DZ twins share on
average, half of their segregating alleles (genes that vary across individuals) with their
cotwins because they derive from two separately fertilized eggs.
103
If a trait is influenced by genetic factors, MZ twins should resemble each other to a
greater extent than DZ twins. By comparing the within-pair correlations between MZ and DZ
twins, the relative size of genetic and environmental influences can be estimated. In principle,
doubling the difference between the correlations for MZ and DZ twins provides a rough
approximation to heritability, because MZ twins are twice as similar genetically as DZ twins.
Strong genetic influence (also heritability in the narrow sense, symbolized as a2) is indicated
when the MZ twin correlation is substantial and the DZ twin correlation approaches half that
of the MZ correlation. Within-pair similarity that is not due to genetic factors is assigned as
shared environmental influences (c2), which contribute towards resemblance among
individuals growing up in the same environment. Finally, an estimate of the non-shared
environmental effects (e2), individual specific factors that create differences among cotwins
from the same family, are estimated from within-pair differences between MZ twins. This is
equivalent to the difference between the total phenotypic variance (assigned as 1) and the MZ
twin correlation. Because MZ twins share all their genes and family environment, anything
less than a perfect within-pair correlation for MZ twins shows the influence of non-shared
environment. As this term constitutes the residual variance, any measurement error present
will also be included in this component. Mathematically, MZ twins share all of their genetic
makeup (a2) and shared environment (c2), so that the within-pair correlation (rMZ) is equal to
a2+c2. DZ twins share only half of their segregating genes (1/2a2) but all of the shared
environment (c2), thus the within-pair correlation (rDZ) is equal to 1/2 a2 + c2.
For instance, consider the present twin correlations for phenotype X (MZr = .61,
DZr = .37). A simple method for estimating the approximate level of genetic influence is to
double the difference (i.e. 2 x (.61 - .37)) between MZ and DZ correlations, which would
yield an a2 estimate of .48, indicating that 48% of the variance in phenotype X is due to
genetic influence. An estimate of c2 can then be obtained by subtraction: since rMZ = a2 + c2,

104
c2 in this case is .61-.48 = .13. Finally, e2 is 1-rMZ = .39.
5.5 The ACE and ADE models
Although twin correlations can provide a rough approximation of genetic, shared
and non-shared environmental effects, structural equation model-fitting analyses of
variance/covariance matrices are used to estimate genetic and environmental parameters and
to obtain confidence intervals for these estimates (Neale & Cardon, 1992).
In the narrow sense of heritability (denoted as a2/ h2), the phenotypic variance (Vp)
in a trait is a linear function of additive genetic influences (A), non-additive genetic influences
(D), shared environmental influences (C), and non-shared environmental influences (E) (i.e.
Vp=A+D+C+E). Non-additive genetic influences occur when alleles interact with other
alleles at a locus (dominance) or across loci (epistasis). Graphically, the latent factors (i. e. A,
C, D, E) are represented by circles whereas measured variables are shown by squares (figure
6.3). The causal paths between the latent and observed variables are represented by single
headed arrows and the correlational paths between the latent variables are shown by double
headed arrows. Since the estimation of shared environmental effects and non-additive effects
rely on the difference between the MZ and DZ twin correlation, it is impossible to test the
ACDE model unless sufficient information is supplied by both twin and adoption studies. The
pattern of twin correlations can hint as to whether an ACE or ADE model should be applied
to the data. Because the presence of dominant genetic effects tends to increase the similarity
of MZ twins relative to DZ twins, if the MZ correlation is more than twice of the DZ
correlation on a measure, an ADE model is typically tested. On the basis of behavioural
genetic theory, the genetic correlation between the two siblings (rg) is fixed at 1.0 for MZ
twins and 0.5 for DZ twins. The genetic dominance correlation (rd) is fixed at 1.0 for MZ
twins and 0.25 for DZ twins. By definition, the family environment shared between the two
siblings is congruent, so the shared environmental correlation (rc) is fixed at 1.0 for MZ and
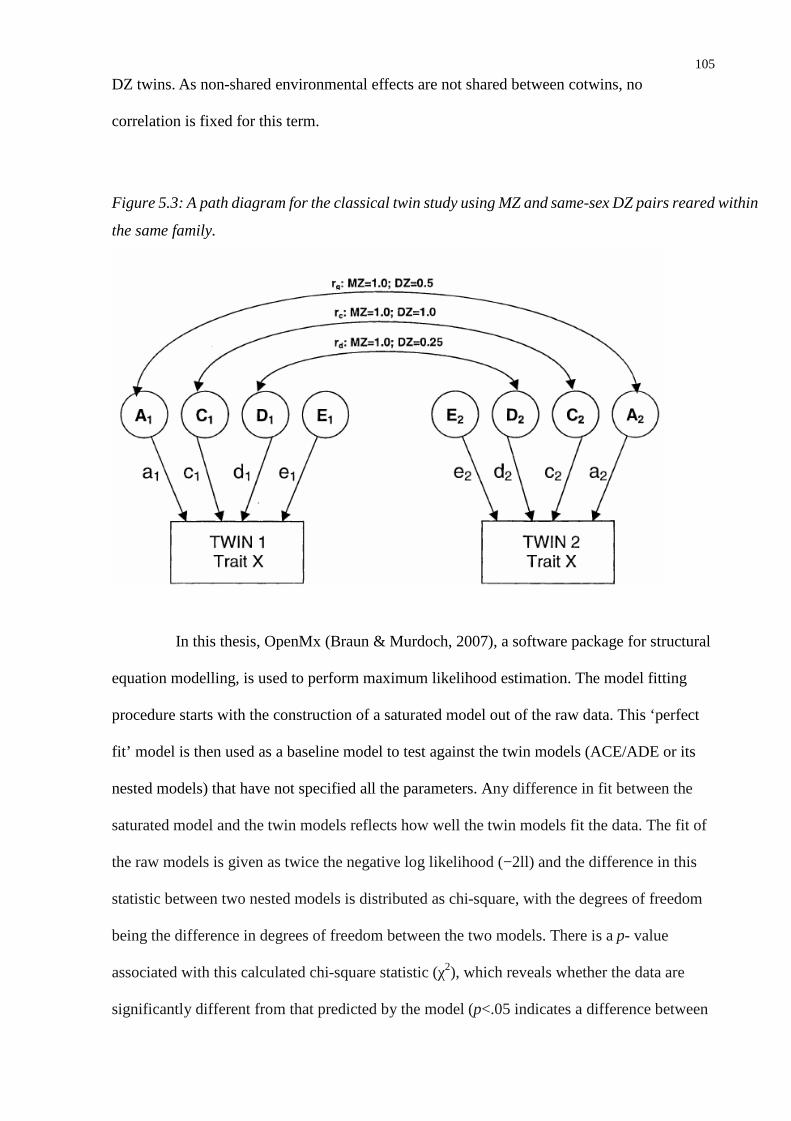
105
DZ twins. As non-shared environmental effects are not shared between cotwins, no
correlation is fixed for this term.
Figure 5.3: A path diagram for the classical twin study using MZ and same-sex DZ pairs reared within
the same family.
In this thesis, OpenMx (Braun & Murdoch, 2007), a software package for structural
equation modelling, is used to perform maximum likelihood estimation. The model fitting
procedure starts with the construction of a saturated model out of the raw data. This ‘perfect
fit’ model is then used as a baseline model to test against the twin models (ACE/ADE or its
nested models) that have not specified all the parameters. Any difference in fit between the
saturated model and the twin models reflects how well the twin models fit the data. The fit of
the raw models is given as twice the negative log likelihood (−2ll) and the difference in this
statistic between two nested models is distributed as chi-square, with the degrees of freedom
being the difference in degrees of freedom between the two models. There is a p- value
associated with this calculated chi-square statistic (χ2), which reveals whether the data are
significantly different from that predicted by the model (p<.05 indicates a difference between
106
the model and the data, i.e. a poor fit). Another relative measure of fit, Akaike’s Information
Criterion (AIC), is obtained by comparing the log-likelihood statistics between a full model
and a saturated model, which estimates the maximum number of parameters to describe the
variances, covariances and means of all studied variables from the raw data. In general, the
lower the fit statistic, the better fit to the data. Lower chi-square values and more negative
AIC generally indicate good fit and parsimony (models with fewest estimated parameters).
The details of goodness-of-fit indices are provided in appendix 3.
In the literature of twin studies, although the majority of measured traits fit better in
an ACE than an ADE model, non-additive genetic effects have been observed in some rare
traits (Lykken, 1982). For the ADE model, heritability (H2) equals the additive genetic
variance (a2) plus non-additive genetic variance (a2 + d2), which reflects broad heritability.
Non-additive genetic effects result from either interactions between alleles at one locus (i.e.,
dominance) or across alleles at multiple loci (i.e., epistasis, i.e. the non-reciprocal interaction
of non-allelic genes) (Lykken, McGue, Tellegen, & Bouchard, 1992). Non-additive variance is
more usually ascribed to dominance rather than epistasis; epistasis is very hard to detect in
human family data, although it can be demonstrated in animal studies where selective
breeding makes it possible to control which genes are present. The strongest evidence ever
obtained for polygenic epistasis in humans involved counts of the number of fingerprint
tri-radii. In this study, the within-pair correlation observed (.90) in 110 pairs of MZ twins was
more than twice the within-pair correlations of 111 pairs of DZ twins and in hundreds of
sibling and parent-child pairs (Heath, Martin, Eaves, & Loesch, 1984). However, correlations
between parent-child and sib pairs were similar, which would not be expected if this effect
was due to dominance.
An alternative way of viewing marked MZ similarity combined with weak
107
similarity of DZ twins is in terms of an emergenic trait (Lykken, 1982). An emergenic trait
refers to a novel or emergent property resulting from the interaction of independently
segregating polygenes interacting at a more molar level (Lykken, McGue, Tellegen, &
Bouchard, 1992). Unlike additive genetic effects, in a configural genetic process all of the
genetic components are essential, and the absence of, or a change in any genetic components
in the sequential process can produce a qualitative or a large quantitative change. Our organs
(e.g., eyes, hands and ears) are properties of configurations of monomorphic genes,
configurations that we all share as part of being human. Polymorphic genes, the type of genes
that are responsible for individual differences of the emergenic traits, can also behave
configurally. Whether they are reared together or apart, MZ twins who share all their genes
and hence all gene configurations, are more likely to share an emergent trait than DZ twins,
siblings, or parents and offspring. For this reason, emergenic traits, although genetic, would
not tend to run in families. MZ twins have almost the same voices and can easily substitute
for one another in telephone conversation (Farber, 1981). Metrical traits such as EEG
spectrum parameters, electrodermal habituation and many of the idiosyncratic personal styles
(e.g., leadership, artistic ability, creativity) have been found to be emergenic (Lykken, 1982;
Lykken, Lacono, Haroian, McGue, & Bouchard, 1988; Lykken, Bouchard, McGue, &
Tellegen, 1990; Tellegen et al., 1988).
5.6 The interpretation of univariate estimates from the ACE/ADE models
Results of univariate twin modelling analyses reveal the relative contributions of
genetic, shared and non-shared environmental influences on a measure. In the early years of
conducting twin studies, the main research aim was to set the null hypothesis as ‘heritability
(h2) = 0’ and test if genetic factors have any influence on the behavioural outcomes. With
accumulative evidence of a wide range of psychological traits, it is now known that almost all
behaviours are the results of genetic disposition and environment. The pure nature-nurture
debate could be said to be over. Turkheimer (2000) has proposed the First law of behaviour
108
genetics – All human behavioural traits are heritable – that summarizes the universal
influences of genes on behaviour. Although many researchers have advocated that twin
studies should go beyond reporting the estimates of genetic and environmental influences
(Johnson, Turkheimer, Irving, & Bouchard, 2009), these univariate estimates analyses are
worthwhile for traits of which the genetic influences have not been acknowledged.
Second-language reading abilities studied in this thesis is one of them. Moreover, the
univariate heritability estimates are important as they clarify findings of familial studies
which examine the relatedness of traits between parents and offspring (Turkheimer, 2000).
For example, Conlon, Zimmer-Gembeck, Creed, and Tucker (2006) have shown that history
of parental reading problems and other reading problems in the family contribute significantly
to orthographic but not phonological processing in early adolescence. But reliance on studies
which use measured parents’ variables to predict reading and meta-linguistic skills cannot
determine if the effects of parents are mediated through the genes they have passed to the
children or the environment shared among them. Applying the twin study method, the effects
of genes and environment can be distinguished.
Recently, many studies have demonstrated that genes and shared environment
explain less than half of the differences among siblings and lead to a critical question of ‘why
are children in the same family so different?’ (Plomin & Daniels, 1987). As hypothesized as
an E term in the twin model, it represents either measurement errors or non-shared
environmental effects. Given that the measurement errors were controlled and minimized,
non-shared environment events are potent in explaining individual variations. So, the
univariate estimates in the twin model can shed light on the potential influences of non-shared
environmental events which had often been ignored (e.g. perinatal factors; Stromswold, 2006).
Researchers have tried to capture non-shared environmental effects with measurable
non-shared environmental events (e.g. birth order), but these have proved to be less important

109
than predicted. It seems more likely that nonshared environment effects involve a series of
unsystematic and unpredictable events whose influences compound over time. Another point
is that researchers have tended to equate idiosyncratic events with accidents, illnesses or other
traumas, which fosters a gloomy view of non-shared environmental events. With better
measurement tools that can maximize the chance of identifying specific non-shared
environmental effects and minimize the chance of committing measurement errors on the
dependent variable, we can understand more of environmental effects that operate on an
individual-by-individual basis.
5.7 Assumptions of the twin models
It is worth noting that the validity of the twin study method depends on a number of
assumptions.
The equal environments assumption (EEA) postulates that MZ and DZ twins are
experiencing roughly the same environments regardless of their zygosity. If MZ twins
experience more similar environments than DZ twins, their phenotypic similarities may
inflate, and as a consequence genetic effects may be over-estimated. One way of testing the
EEA is to study the effect of perceived zygosity in misclassified twins. When MZ twins or
their parents mistake themselves as DZ twins, they have been found to behave similarly to
MZ twins with correctly perceived zygosity (Kendler, Neale, Kessler, Heath, & Eaves, 1994).
While no study has addressed the EEA for reading ability, a few studies that directly
concerned with the EEA for cognitive abilities provided support for the EEA (Richardson &
Norgate, 2005).
Approximately two thirds of MZ twins share the same chorion whereas DZ twins

110
are always in separate chorions. The mono-chorionic MZ twins may experience more similar
environments in utero and this chorionicity effect could potentially inflate the genetic
estimates for monochorionic MZ twins (Prescott, Johnson, & McArdle, 1999). Also,
monochorionic MZ twins experience intrauterine competition for nutrition in the shared
chorion and result in larger birth weight differences in comparison to DZ twins. In more
severe cases, twin to twin transfusion syndrome may occur (van Gemert, Umur, Tijssen, &
Ross, 2001). The association between chorionicity, placentation and organ maturation have
been reported though the effects are small (Jacob et al., 2001; Gutknecht, Spitz, & Carlier,
1999; Sokol, Moore, Rose, Williams, Reed, & Christian, 1995). Importantly, no evidence has
been found regarding the impacts of these factors on language and reading development. The
findings require replication with larger sample size. Further evidences that support the EEA
are observed in various studies (Cronk et al., 2002; Borkenau, Riemann, Angleitner, &
Spinath, 2002).
Another important assumption for the twin study design is random mate selection
for the measured trait. Non-random mate selection (assortative mating) occurs when one
chooses his/her partner bases on a particular phenotype (e.g. occupation), culture or
environment, or chooses a genetically related partner. For example, if a book lover marries
another book lover, their offspring are more genetically prepared for reading and are more
likely to be exposed to an environment rich in books. If a trait is affected by nonrandom
mating, twin similarity in DZ twins for this trait will be heightened. Consequently, the shared
environmental influences will be over-estimated while the genetic effects will be
under-estimated. When relevant phenotypic data for the parental generation are collected and
controlled, we can minimize the effects of non-random mating in the twin model (Neale &
Cardon, 1992).
Though participants in twin studies come from multiple births, findings of twin

111
studies are expected to be generalized into the singleton population. Ideally, we would expect
the effects of twinning to be negligible. In reality, twins tend to be born, on average, about 2
weeks earlier and they are more prone to some adverse conditions triggered by intrauterine
complications (Phillips, 1993). The resulting lighter birth weights (about one third less than
singletons) in twins do not lead to far-reaching impacts in their development (Wilson, 1979).
However, elevated risk for reading difficulties due to twinning has been documented (e.g.,
Johnston, Prior, & Hay, 1984). Insofar as these effects of twinning affect both MZ and DZ
twins, serving to make both members of a pair similar, they are likely to lead to
underestimation of heritability.
Finally, in twin model fitting, the distribution of the phenotypic measures is
assumed to be continuous and normal. Departures from normality can bias estimates of
heritability.
5.8 The phenotypes of reading and sources of individual differences
Reading involves a series of skills, from perceptual to cognitive, and from linguistic
to syntactic. Moreover, reading skills require continuous learning and reading experiences
vary across individuals. The multi-componential and dynamic nature of reading imposes some
challenges on measuring the phenotype of reading. On one hand, we can measure reading
accuracy with norm-referenced reading measures. In the Twins Early Development Study
(TEDS) being conducted in England and Wales (Kovas, Haworth, Dale, & Plomin, 2007),
word identification was measured with the Test of Word Reading Efficiency (TOWRE;
Torgesen, Wagner, & Rashotte, 1999) or a broad range of reading skills including word- and
meaning level strategies and with assessments by classroom teachers based on the UK
National Curriculum (NC) criteria. Petrill, Deater-Deckard, Thompson, De Thorne, and
Schatschneider (2006) have distinguished between content- and process-based reading
measures. Content-based measures (e.g., letter identification) reflect ability of accurately

112
retrieving learnt lexical knowledge from long-term memory. Process-based measures (e.g.
phoneme deletion) require manipulation of linguistic information by mental operation. On the
other hand, reading researchers are constantly exploring the endophenotypes of reading which
are more akin to the genotypes and can be observed consistently even if the behaviours are
constantly changing (Doyle et al., 2005). Endophenotypes are typically identified among
affected individuals. And, potentially valuable endophenotypes should be measurable reliably,
sensitive to genetic susceptibility and specific to the disorder in question (Skuse, 2001). The
endophenotypes of reading have been identified at different levels. For instances,
phonological deficit is an endophenotype of developmental dyslexia at the cognitive level
(Snowling, 2008). The phonological deficits are persistent despite the improved capability of
word decoding and learning in dyslexic children. Neurological markers represented by
electroencephalogram (EEG) and functional magnetic resonance imaging (fMRI) data are
potential endo-phenotypes for various traits (Zietsch et al., 2007).
As documented in earlier chapters, in this thesis, the phenotype of reading is
defined as reading aloud printed words, but in addition, reading-related perceptual and
linguistic skills were assessed.
5.9 Studies of reading using the twin study design
Before reporting past twin studies on reading, it is important to highlight the factors
that influence heritability estimation.
Modelling of twin data requires a sufficiently large sample size for an acceptable
range of statistical power, recruitment and testing of twins is labor-intensive and
time-consuming. Not surprisingly, the number of published studies on reading development is
very scanty and not always ideal in terms of age range or balance of MZ and DZ twins. The
relevant variables may differ from study to study (e.g., including phonological awareness but

113
not phonological memory in study A, and vice versa in study B). Also studies vary in choice
of methods (psychometric testing vs. telephone interview vs. teacher rating), and in the
average levels of literacy attainment of the sample, etc. This can result in huge variations in
design across twin studies of reading and make direct comparison of heritability estimates not
always feasible. In fact, the estimates of genetic and environmental effects do vary across
studies (see Grigorenko, 2001; Stromswold, 2001 for reviews). Nonetheless, improvements
have been made to ensure the validity and reliabilities of twin studies.
The following review of twin studies is centred on the variables studied in section 1
- visual word recognition, receptive vocabulary, phonological awareness and phonological
memory. To the best of my knowledge, no twin study of speech perception has been reported
and no reference can be made.
Generally speaking, nearly all of the twin studies of reading show that the variances
of word reading, vocabulary and phonological skills are influenced by genetic factors. This is
evident in modest to substantial level of additive genetic effects (a2) which mean genes
contribute to the similarity of performances in reading. In one study, Byrne et al. (2005) found
that phonological awareness was highly heritable with modest effects of shared environment,
among preschoolers and kindergarteners in the United States and Australia. Despite a few
exceptions, the genetic influences are consistently larger than shared environmental influences
for word recognition, phonological awareness and phonological memory. An opposite pattern
is observed for vocabulary development. Details of relevant studies are presented in table 6.1.
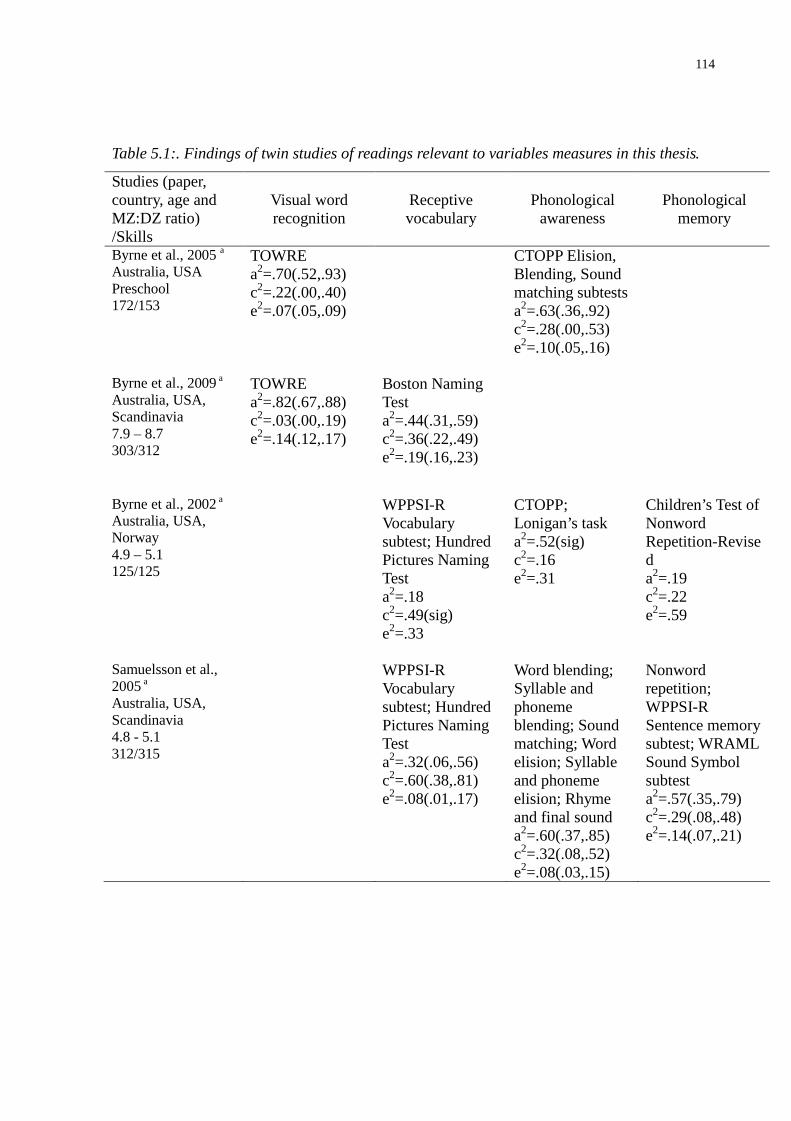
114
Table 5.1:. Findings of twin studies of readings relevant to variables measures in this thesis.
Studies (paper,country, age andMZ:DZ ratio)/Skills
Visual wordrecognition
Receptivevocabulary
Phonologicalawareness
Phonologicalmemory
Byrne et al., 2005 a
Australia, USAPreschool172/153
TOWREa2=.70(.52,.93)c2=.22(.00,.40)e2=.07(.05,.09)
CTOPP Elision,Blending, Soundmatching subtestsa2=.63(.36,.92)c2=.28(.00,.53)e2=.10(.05,.16)
Byrne et al., 2009 a
Australia, USA,Scandinavia7.9 – 8.7303/312
TOWREa2=.82(.67,.88)c2=.03(.00,.19)e2=.14(.12,.17)
Boston NamingTesta2=.44(.31,.59)c2=.36(.22,.49)e2=.19(.16,.23)
Byrne et al., 2002 a
Australia, USA,Norway4.9 – 5.1125/125
WPPSI-RVocabularysubtest; HundredPictures NamingTesta2=.18c2=.49(sig)e2=.33
CTOPP;Lonigan’s taska2=.52(sig)c2=.16e2=.31
Children’s Test ofNonwordRepetition-Reviseda2=.19c2=.22e2=.59
Samuelsson et al.,2005 a
Australia, USA,Scandinavia4.8 - 5.1312/315
WPPSI-RVocabularysubtest; HundredPictures NamingTesta2=.32(.06,.56)c2=.60(.38,.81)e2=.08(.01,.17)
Word blending;Syllable andphonemeblending; Soundmatching; Wordelision; Syllableand phonemeelision; Rhymeand final sounda2=.60(.37,.85)c2=.32(.08,.52)e2=.08(.03,.15)
Nonwordrepetition;WPPSI-RSentence memorysubtest; WRAMLSound Symbolsubtesta2=.57(.35,.79)c2=.29(.08,.48)e2=.14(.07,.21)
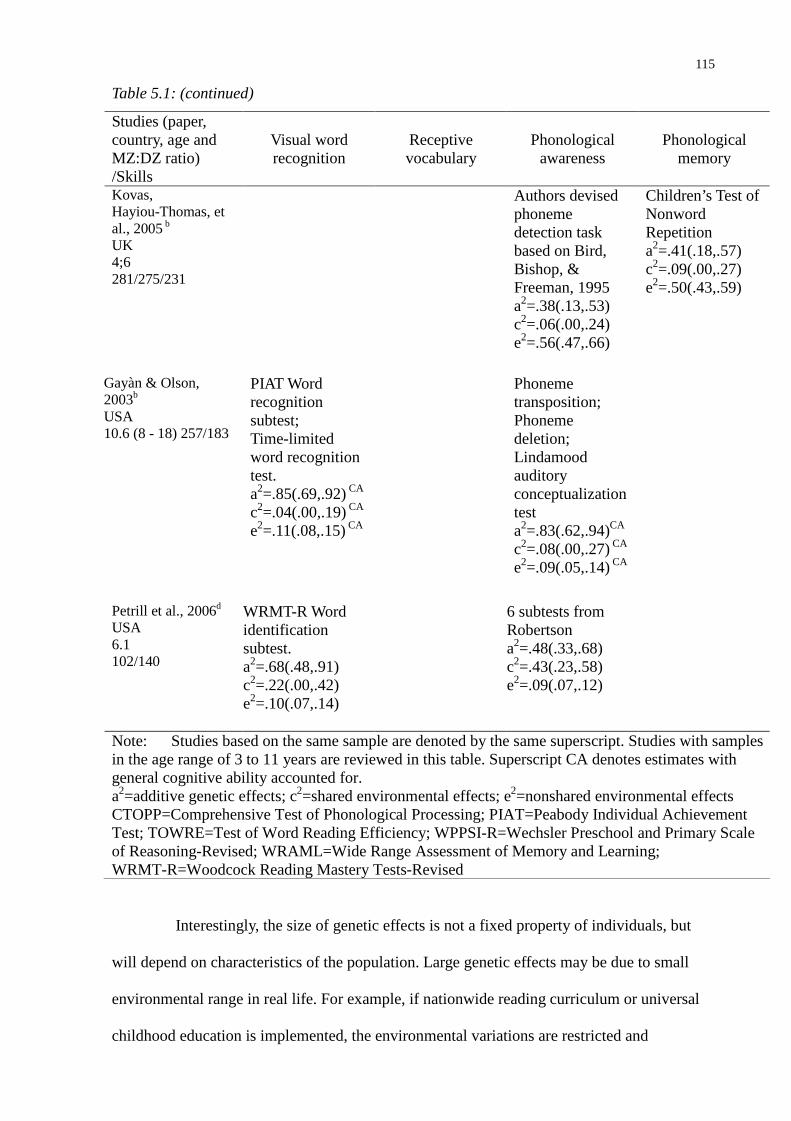
115
Interestingly, the size of genetic effects is not a fixed property of individuals, but
will depend on characteristics of the population. Large genetic effects may be due to small
environmental range in real life. For example, if nationwide reading curriculum or universal
childhood education is implemented, the environmental variations are restricted and
Table 5.1: (continued)
Studies (paper,country, age andMZ:DZ ratio)/Skills
Visual wordrecognition
Receptivevocabulary
Phonologicalawareness
Phonologicalmemory
Kovas,Hayiou-Thomas, etal., 2005 b
UK4;6281/275/231
Authors devisedphonemedetection taskbased on Bird,Bishop, &Freeman, 1995a2=.38(.13,.53)c2=.06(.00,.24)e2=.56(.47,.66)
Children’s Test ofNonwordRepetitiona2=.41(.18,.57)c2=.09(.00,.27)e2=.50(.43,.59)
Gayàn & Olson,2003b
USA10.6 (8 - 18) 257/183
PIAT Wordrecognitionsubtest;Time-limitedword recognitiontest.a2=.85(.69,.92) CA
c2=.04(.00,.19) CA
e2=.11(.08,.15) CA
Phonemetransposition;Phonemedeletion;Lindamoodauditoryconceptualizationtesta2=.83(.62,.94)CA
c2=.08(.00,.27) CA
e2=.09(.05,.14) CA
Petrill et al., 2006d
USA6.1102/140
WRMT-R Wordidentificationsubtest.a2=.68(.48,.91)c2=.22(.00,.42)e2=.10(.07,.14)
6 subtests fromRobertsona2=.48(.33,.68)c2=.43(.23,.58)e2=.09(.07,.12)
Note: Studies based on the same sample are denoted by the same superscript. Studies with samplesin the age range of 3 to 11 years are reviewed in this table. Superscript CA denotes estimates withgeneral cognitive ability accounted for.a2=additive genetic effects; c2=shared environmental effects; e2=nonshared environmental effectsCTOPP=Comprehensive Test of Phonological Processing; PIAT=Peabody Individual AchievementTest; TOWRE=Test of Word Reading Efficiency; WPPSI-R=Wechsler Preschool and Primary Scaleof Reasoning-Revised; WRAML=Wide Range Assessment of Memory and Learning;WRMT-R=Woodcock Reading Mastery Tests-Revised
116
individual variations are more likely to be caused by genetic variations. The twin model is
potentially important to evaluate the effectiveness of response to-instruction (RTI) approach
on reading. The idea of RTI is to observe age-to-age changes in reading and spelling
achievement to improve identification of reading disability and the selection of at-risk readers
for intervention (Compton, Fuchs, Fuchs, & Bryant, 2006). If successful, individual
differences in reading and spelling skills accounted for by lack of or limited reading
instruction should be successively reduced, implying that unresponsiveness to generally
effective literacy instruction should be increasingly accounted for by individual capabilities. If
the twin study method could be integrated with intervention studies of RTI, the training
effects attributed to genes and environment could be partitioned.
As mentioned above, variations in design across studies complicate comparisons of
heritability estimates. A few studies, such as the International Longitudinal Twin Study (ILTS)
have attempted to investigate the cultural and country effects systematically in a single twin
study.
The ILTS of early reading development involves the United States (Colorado),
Australia (the Sydney area), and Scandinavia (Sweden and Norway) with samples of twins
born between 1994 and 2000. As shown in their studies, the onset of reading instruction and
educational philosophy seem to be a critical factor for cross-country differences in the
etiology of reading. In Scandinavia, there is an established tradition that children should not
be subjected to any formal or informal reading instruction until compulsory education starts
when the child is 7 years old (Lundberg, 1999). The main theme in the preschool curriculum
is to emphasize social, emotional, and aesthetic development rather than intellectual
preparation for school work. This philosophy is also well integrated among most parents in
Scandinavia. Thus, approximately 50% of the Scandinavian twins were unable to read any

117
words at the end of kindergarten prior to formal reading instruction at age seven in first grade.
The situation in English-speaking countries is quite the opposite. These countries generally
favour early informal and sometimes formal reading instruction in the home and preschool
(Mann & Wimmer, 2002). Comparing between two English-speaking countries, Australian
children attend kindergarten for the full school day (roughly 9:00 a.m. to 3:00 p.m.) whereas
in Colorado, the state from which the U.S. sample was recruited, kindergarten children
generally attend half days. With greater intensity of instruction in New South Wales, children
are engaged to genetically-influenced learning processes earlier than in the US and more
reliable individual differences in response to formal reading instruction can be observed,
resulting in a higher genetic contribution to overall variability. Non-significant trends suggest
higher heritabilities for several measures in the Australian sample, significantly lower
preschool print knowledge in Scandinavia, consistent with the relatively lower amount of
shared book reading and letter-based activities with parents, and lack of emphasis on print
knowledge in Scandinavian preschools.
The twin study reported in this thesis was conducted in Hong Kong and it can be a
focal point for comparing reading development between Western and Chinese cultures.
5.10 Heritability in second language acquisition
To date, there is only one twin study of second language acquisition. Dale, Harlaar,
Haworth, and Plomin (2010) tested 604 pairs of 14-year-old twins from England and Wales.
These adolescents had English as the primary language of their home and had been learning
French, German, Italian, or Spanish as L2. The assessment of L2 competency was based on
teachers’ rating of the twins’ performance in their foreign-language course using the United
Kingdom National Curriculum (NC) criteria (Department for Education and Skills, 2004;
National Curriculum Assessments, 2007). The L1 competency at the same age was assessed
118
with a similar tool for English in NC.
It was shown that the additive genetic effects on L2 acquisition were substantial
(.67) and larger than that for L1 (.41) and also larger than estimates previously published for
first-language acquisition in early childhood. The findings add evidence to the general pattern
of increasing heritability across development for language and cognitive measures (Plomin et
al., 2008). The non-shared environmental effects of .20 may reflect the fact that about 10% of
the twins were studying a different language than their sibling, and were assessed by a
different teacher. Moreover, the results demonstrate that overlap of genetic influences on first-
and second-language acquisition were virtually complete (.99) whereas overlap between
shared environmental influences on the two domains was low (.07).
The current study overcomes some of the methodological limitations of Dale et
al.’s (2010) study. First, I study reading acquisition and reading related skills specifically,
rather than the global assessment of attainment of a second language. Second, rather than
relying on teachers’ assessments, children’s abilities were measured directly with
psychometric tests and experimental tasks. Third, the participants are limited to Chinese
native speakers who learn English as a second language, rather than having a mixture of
second languages.
119
5.11 Research questions and hypotheses in this study
To fill the research gap, I devised this pioneering study. Building on past studies, I
examined genetic and environmental contributions to reading development in a second
language.
Research question 1: What are the sources of individual differences in Chinese and ESL
skills? To handle this question, I fit the twin data into the univariate ACE (ADE, if necessary),
AE, CE and E models to estimate the additive/dominant genetic effects, shared and
non-shared environmental effects on all the variables.
Research question 2: To what extent do genes and environment contribute to the
ESL-Chinese phenotypic correlation? How much can L2 learning rely on resources available
from L1? Are the same cognitive processes or neural networks subsumed for parallel skills in
Chinese and ESL?
Research question 3: Are ESL and Chinese skills at the two time points controlled by the
same set of genes?
Chapter 6 will focus on analyses relating to question 1. Chapters 7 and 8 will then
introduce the bivariate statistical methods that are required to handle questions 2-3. Using the
Cholesky decomposition I obtain three indexes that represent 1) bivariate heritability, 2)
genetic correlation, and 3) the percentage of genetic and environmental influences that explain
the phenotypic associations between ESL and Chinese and skills.
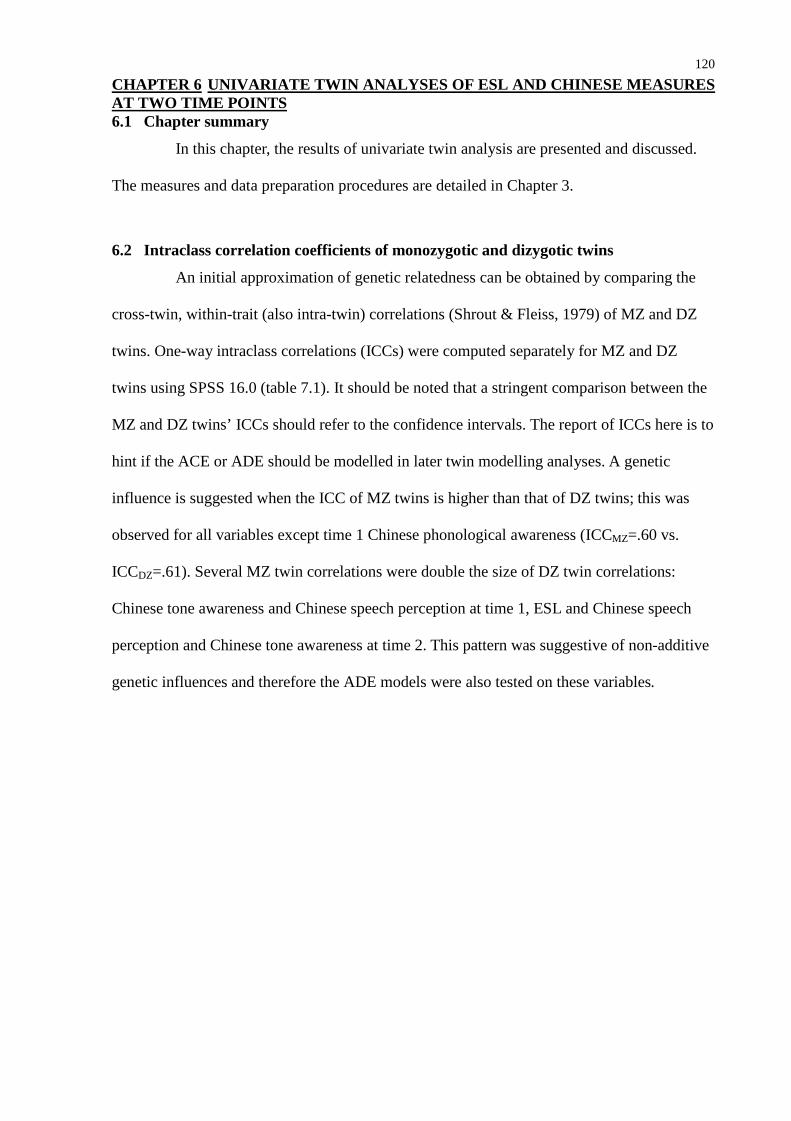
120
CHAPTER 6 UNIVARIATE TWIN ANALYSES OF ESL AND CHINESE MEASURESAT TWO TIME POINTS6.1 Chapter summary
In this chapter, the results of univariate twin analysis are presented and discussed.
The measures and data preparation procedures are detailed in Chapter 3.
6.2 Intraclass correlation coefficients of monozygotic and dizygotic twins
An initial approximation of genetic relatedness can be obtained by comparing the
cross-twin, within-trait (also intra-twin) correlations (Shrout & Fleiss, 1979) of MZ and DZ
twins. One-way intraclass correlations (ICCs) were computed separately for MZ and DZ
twins using SPSS 16.0 (table 7.1). It should be noted that a stringent comparison between the
MZ and DZ twins’ ICCs should refer to the confidence intervals. The report of ICCs here is to
hint if the ACE or ADE should be modelled in later twin modelling analyses. A genetic
influence is suggested when the ICC of MZ twins is higher than that of DZ twins; this was
observed for all variables except time 1 Chinese phonological awareness (ICCMZ=.60 vs.
ICCDZ=.61). Several MZ twin correlations were double the size of DZ twin correlations:
Chinese tone awareness and Chinese speech perception at time 1, ESL and Chinese speech
perception and Chinese tone awareness at time 2. This pattern was suggestive of non-additive
genetic influences and therefore the ADE models were also tested on these variables.
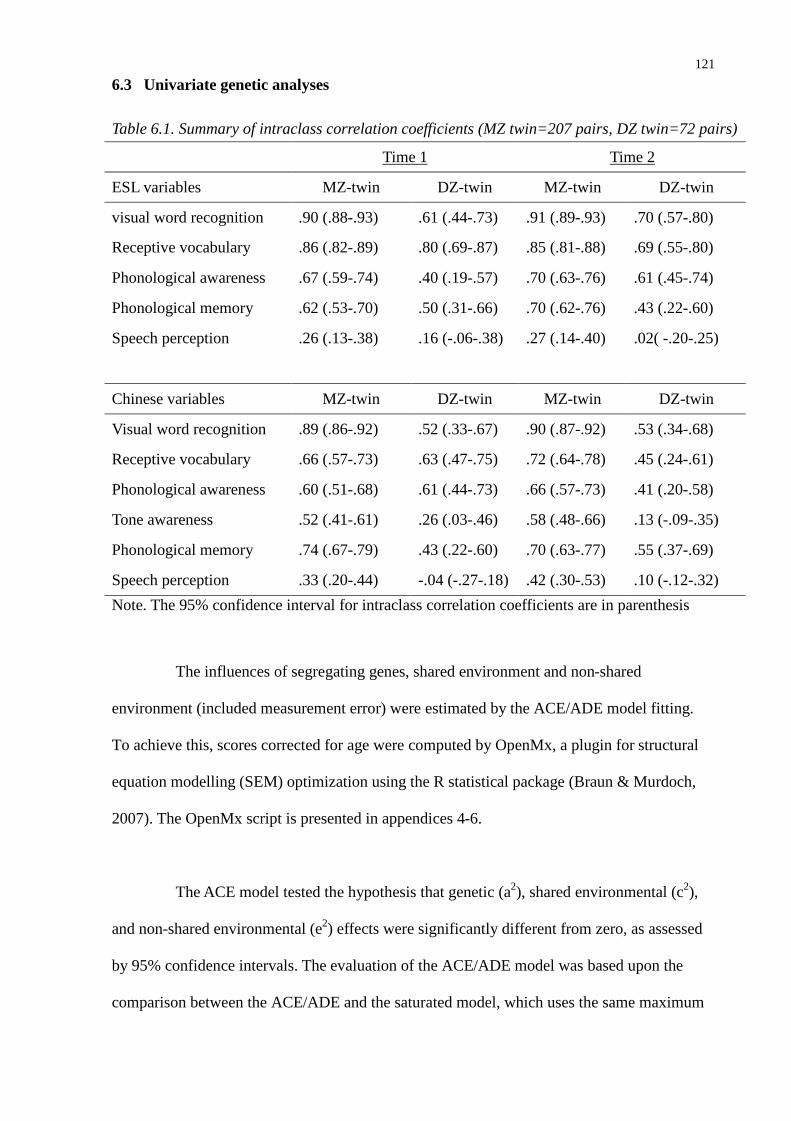
121
6.3 Univariate genetic analyses
The influences of segregating genes, shared environment and non-shared
environment (included measurement error) were estimated by the ACE/ADE model fitting.
To achieve this, scores corrected for age were computed by OpenMx, a plugin for structural
equation modelling (SEM) optimization using the R statistical package (Braun & Murdoch,
2007). The OpenMx script is presented in appendices 4-6.
The ACE model tested the hypothesis that genetic (a2), shared environmental (c2),
and non-shared environmental (e2) effects were significantly different from zero, as assessed
by 95% confidence intervals. The evaluation of the ACE/ADE model was based upon the
comparison between the ACE/ADE and the saturated model, which uses the same maximum
Table 6.1. Summary of intraclass correlation coefficients (MZ twin=207 pairs, DZ twin=72 pairs)
Time 1 Time 2
ESL variables MZ-twin DZ-twin MZ-twin DZ-twin
visual word recognition .90 (.88-.93) .61 (.44-.73) .91 (.89-.93) .70 (.57-.80)
Receptive vocabulary .86 (.82-.89) .80 (.69-.87) .85 (.81-.88) .69 (.55-.80)
Phonological awareness .67 (.59-.74) .40 (.19-.57) .70 (.63-.76) .61 (.45-.74)
Phonological memory .62 (.53-.70) .50 (.31-.66) .70 (.62-.76) .43 (.22-.60)
Speech perception .26 (.13-.38) .16 (-.06-.38) .27 (.14-.40) .02( -.20-.25)
Chinese variables MZ-twin DZ-twin MZ-twin DZ-twin
Visual word recognition .89 (.86-.92) .52 (.33-.67) .90 (.87-.92) .53 (.34-.68)
Receptive vocabulary .66 (.57-.73) .63 (.47-.75) .72 (.64-.78) .45 (.24-.61)
Phonological awareness .60 (.51-.68) .61 (.44-.73) .66 (.57-.73) .41 (.20-.58)
Tone awareness .52 (.41-.61) .26 (.03-.46) .58 (.48-.66) .13 (-.09-.35)
Phonological memory .74 (.67-.79) .43 (.22-.60) .70 (.63-.77) .55 (.37-.69)
Speech perception .33 (.20-.44) -.04 (-.27-.18) .42 (.30-.53) .10 (-.12-.32)
Note. The 95% confidence interval for intraclass correlation coefficients are in parenthesis

122
likelihood estimation method to estimate all the observed variances and covariances, without
making any assumptions about genetic relationships.
6.4 Comparing between the ACE/ADE and its nested models
In order to discover the most parsimonious model to explain the data, the full ACE/
ADE model were compared against their nested models. The alternative univariate nested
models included the CE, AE and E models. The AE and CE models were constructed by
dropping the C and A term respectively. They were used to compare with the ACE model in
order to evaluate the importance of the A and C terms. The importance of the A and C terms in
the AE and CE models were evaluated by comparing the AE and CE models against the
nested E model. In the case of testing an ADE model, the full ADE model was compared to
the AE and E models to evaluate the importance of the D term and the A and D terms
respectively. Although a simpler (nested) model has the advantage of parsimony, the estimates
of the full ACE/ADE model are informative and should not be overlooked. The model fittings
were conducted on raw data (after age-correction). Models yielding a p-value higher than .05
indicate a good fit. The same analytic method was applied to both time 1 and time 2 data.
Note that for the present, differences between languages and between time 1 and time 2
will be described but no statistical comparison is made. The relationship between different
languages and different time points will be considered more fully in chapters 7 and 8.
6.5 Visual word recognition and receptive vocabulary
First, the results of visual word recognition and receptive vocabulary are presented
(table 6.2). It is interesting to note that ESL visual word recognition fitted the ACE model but
not simpler models at both time points, indicating that the genetic, shared and non-shared
environmental effects are all important in explaining the individual variations in this skill. The
genetic and shared environmental effects were moderate and modest respectively (a2=53%,
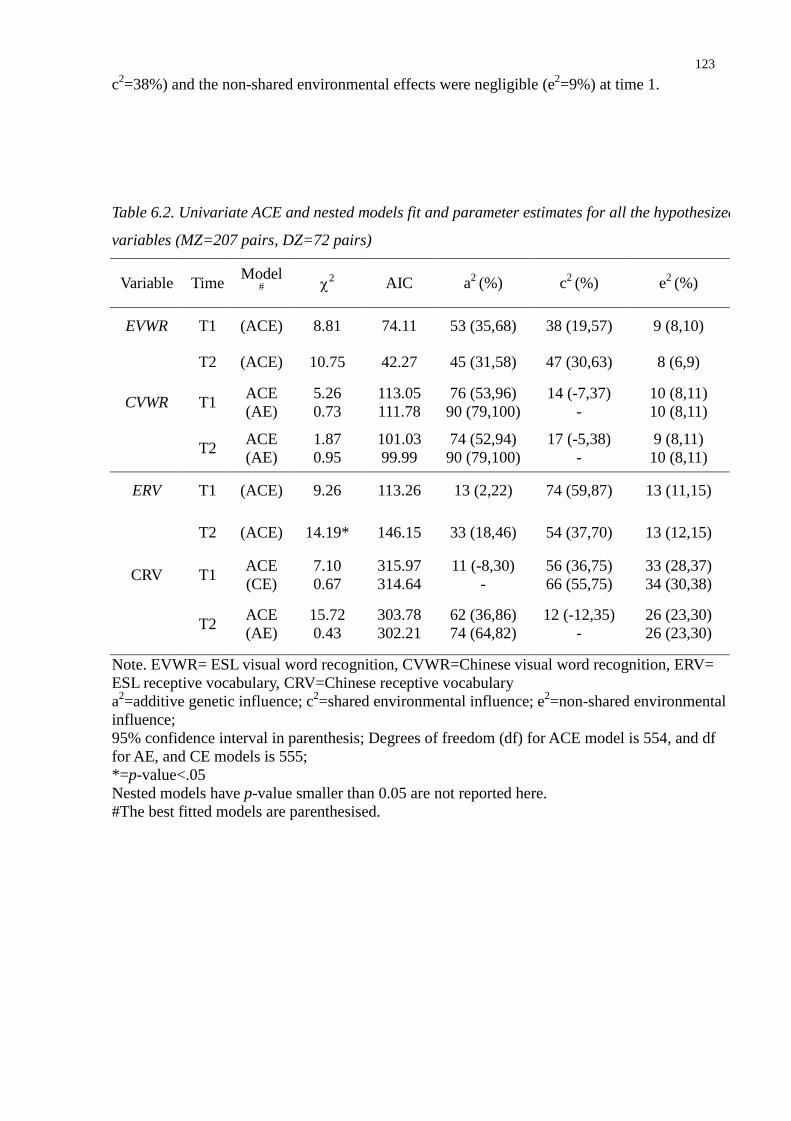
123
c2=38%) and the non-shared environmental effects were negligible (e2=9%) at time 1.
Table 6.2. Univariate ACE and nested models fit and parameter estimates for all the hypothesized
variables (MZ=207 pairs, DZ=72 pairs)
Variable TimeModel
# 2 AIC a2 (%) c2 (%) e2 (%)
EVWR T1 (ACE) 8.81 74.11 53 (35,68) 38 (19,57) 9 (8,10)
T2 (ACE) 10.75 42.27 45 (31,58) 47 (30,63) 8 (6,9)
CVWR T1ACE(AE)
5.260.73
113.05111.78
76 (53,96)90 (79,100)
14 (-7,37)-
10 (8,11)10 (8,11)
T2ACE(AE)
1.870.95
101.0399.99
74 (52,94)90 (79,100)
17 (-5,38)-
9 (8,11)10 (8,11)
ERV T1 (ACE) 9.26 113.26 13 (2,22) 74 (59,87) 13 (11,15)
T2 (ACE) 14.19* 146.15 33 (18,46) 54 (37,70) 13 (12,15)
CRV T1ACE(CE)
7.100.67
315.97314.64
11 (-8,30)-
56 (36,75)66 (55,75)
33 (28,37)34 (30,38)
T2ACE(AE)
15.720.43
303.78302.21
62 (36,86)74 (64,82)
12 (-12,35)-
26 (23,30)26 (23,30)
Note. EVWR= ESL visual word recognition, CVWR=Chinese visual word recognition, ERV=ESL receptive vocabulary, CRV=Chinese receptive vocabularya2=additive genetic influence; c2=shared environmental influence; e2=non-shared environmentalinfluence;95% confidence interval in parenthesis; Degrees of freedom (df) for ACE model is 554, and dffor AE, and CE models is 555;*=p-value<.05Nested models have p-value smaller than 0.05 are not reported here.#The best fitted models are parenthesised.

124
At time 2, the genetic effects on ESL visual word recognition were moderate
(a2=45%). The shared environmental effects were moderate (c2=47%) and the non-shared
environmental effects were negligible (e2=8%). It is interesting to note that only a full ACE
model could adequately explain the variances of ESL visual word recognition.
Regarding Chinese visual word recognition, the data fitted the ACE and AE models
at time 1 and 2. In the ACE models at the two time points, the C terms were not significant
and it seems that shared environmental factor was not important to explain the individual
variations in Chinese visual word recognition. In the time 1 and 2 AE models, the genetic
effects were substantial (a2=90% at time 1 and 2) and the non-shared environmental effects
were negligible (e2=10% at time 1 and 2).
For ESL receptive vocabulary at time 1, the data fitted the ACE model only. In the
ACE model, it showed modest genetic effects (a2=13%), strong shared environmental effects
(c2=74%) and modest non-shared environmental effects (e2=13%). At time 2, the data did not
fit any model and this will be discussed at the end of this chapter.
For Chinese receptive vocabulary at time 1, the data fitted the ACE (but the A term
was not significant) and CE models (c2=66% and e2=34% in the CE model). It seems that
genetic factor was not important to explain the individual variations in this skill. However,
this pattern changed at time 2 when the C term became non-significant and the genetic effects
became substantial (a2=74% in the AE model). This shift of effects led to the speculation that
genetic and environmental changes would be present across time in Chinese receptive
vocabulary. The stability of genetic and environmental influences will be tested in chapter 8.
6.6 Phonological awareness and memory
Next, I report and discuss the results of genetic analyses of phonological skills

125
important to reading and vocabulary acquisition, namely phonological awareness and
phonological memory (table 6.3). Phonological awareness taps the understanding of the
segmental nature of spoken word (phoneme, onset-rime and syllable).
For ESL phonological awareness, the shared environmental effects were not
significant at time 1 while the genetic effects in the AE model were strong (a2=68%) and the
non-shared environmental effects were modest (e2=32%). At time 2, the shared environmental
effects became significant and were moderate (c2=47%). The genetic effects of the ACE
model became modest (a2=23%) and the non-shared environmental effects remained modest
(e2=28%). The speculation that significant new shared environmental influences emerged at
time 2 will be considered further in Chapter 8.
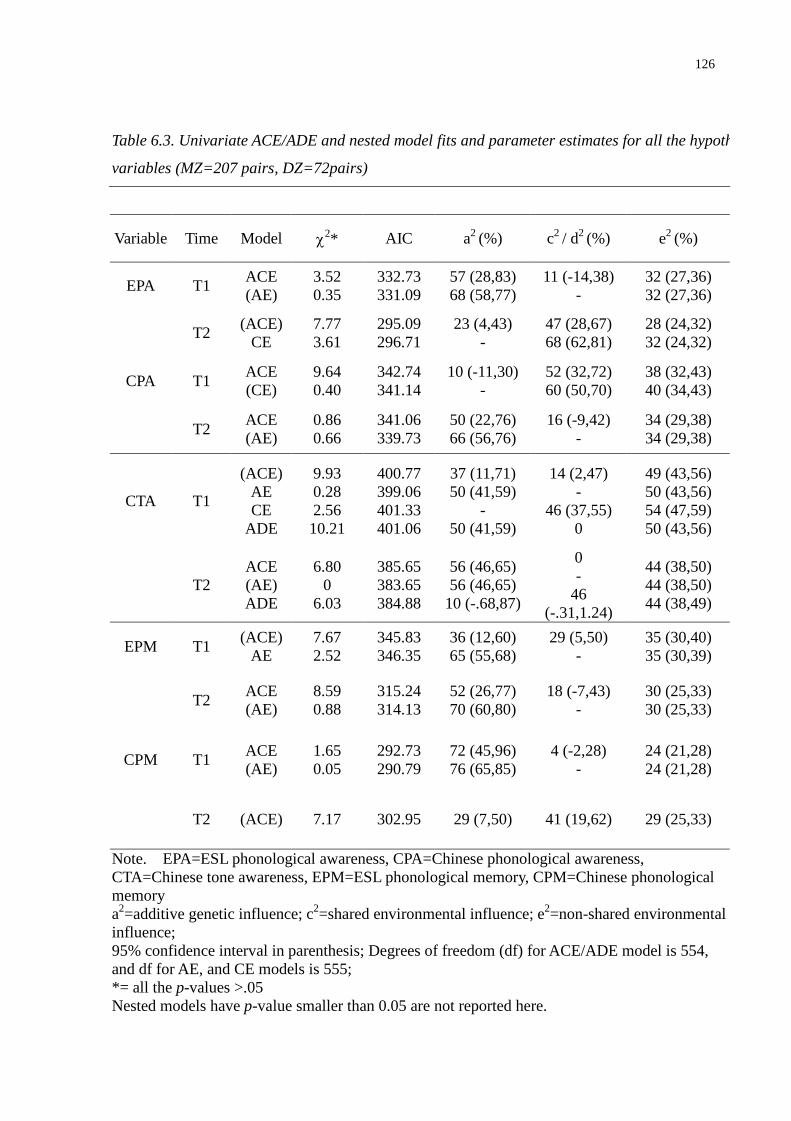
126
Table 6.3. Univariate ACE/ADE and nested model fits and parameter estimates for all the hypothesized
variables (MZ=207 pairs, DZ=72pairs)
Variable Time Model 2* AIC a2 (%) c2 / d2 (%) e2 (%)
EPA T1ACE(AE)
3.520.35
332.73331.09
57 (28,83)68 (58,77)
11 (-14,38)-
32 (27,36)32 (27,36)
T2(ACE)
CE7.773.61
295.09296.71
23 (4,43)-
47 (28,67)68 (62,81)
28 (24,32)32 (24,32)
CPA T1ACE(CE)
9.640.40
342.74341.14
10 (-11,30)-
52 (32,72)60 (50,70)
38 (32,43)40 (34,43)
T2ACE(AE)
0.860.66
341.06339.73
50 (22,76)66 (56,76)
16 (-9,42)-
34 (29,38)34 (29,38)
CTA T1
(ACE)AECE
ADE
9.930.282.5610.21
400.77399.06401.33401.06
37 (11,71)50 (41,59)
-50 (41,59)
14 (2,47)-
46 (37,55)0
49 (43,56)50 (43,56)54 (47,59)50 (43,56)
T2ACE(AE)ADE
6.800
6.03
385.65383.65384.88
56 (46,65)56 (46,65)
10 (-.68,87)
0-
46(-.31,1.24)
44 (38,50)44 (38,50)44 (38,49)
EPM T1(ACE)
AE7.672.52
345.83346.35
36 (12,60)65 (55,68)
29 (5,50)-
35 (30,40)35 (30,39)
T2ACE(AE)
8.590.88
315.24314.13
52 (26,77)70 (60,80)
18 (-7,43)-
30 (25,33)30 (25,33)
CPM T1ACE(AE)
1.650.05
292.73290.79
72 (45,96)76 (65,85)
4 (-2,28)-
24 (21,28)24 (21,28)
T2 (ACE) 7.17 302.95 29 (7,50) 41 (19,62) 29 (25,33)
Note. EPA=ESL phonological awareness, CPA=Chinese phonological awareness,CTA=Chinese tone awareness, EPM=ESL phonological memory, CPM=Chinese phonologicalmemorya2=additive genetic influence; c2=shared environmental influence; e2=non-shared environmentalinfluence;95% confidence interval in parenthesis; Degrees of freedom (df) for ACE/ADE model is 554,and df for AE, and CE models is 555;*= all the p-values >.05Nested models have p-value smaller than 0.05 are not reported here.
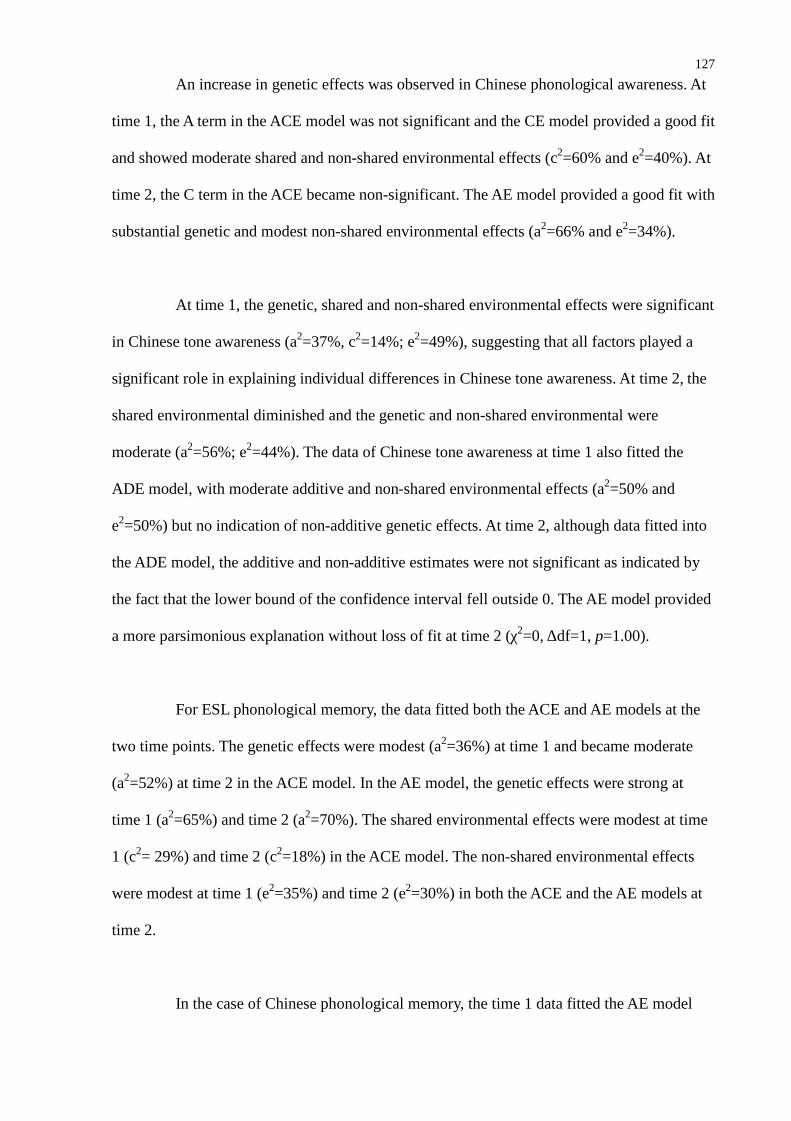
127
An increase in genetic effects was observed in Chinese phonological awareness. At
time 1, the A term in the ACE model was not significant and the CE model provided a good fit
and showed moderate shared and non-shared environmental effects (c2=60% and e2=40%). At
time 2, the C term in the ACE became non-significant. The AE model provided a good fit with
substantial genetic and modest non-shared environmental effects (a2=66% and e2=34%).
At time 1, the genetic, shared and non-shared environmental effects were significant
in Chinese tone awareness (a2=37%, c2=14%; e2=49%), suggesting that all factors played a
significant role in explaining individual differences in Chinese tone awareness. At time 2, the
shared environmental diminished and the genetic and non-shared environmental were
moderate (a2=56%; e2=44%). The data of Chinese tone awareness at time 1 also fitted the
ADE model, with moderate additive and non-shared environmental effects (a2=50% and
e2=50%) but no indication of non-additive genetic effects. At time 2, although data fitted into
the ADE model, the additive and non-additive estimates were not significant as indicated by
the fact that the lower bound of the confidence interval fell outside 0. The AE model provided
a more parsimonious explanation without loss of fit at time 2 (χ2=0, Δdf=1, p=1.00).
For ESL phonological memory, the data fitted both the ACE and AE models at the
two time points. The genetic effects were modest (a2=36%) at time 1 and became moderate
(a2=52%) at time 2 in the ACE model. In the AE model, the genetic effects were strong at
time 1 (a2=65%) and time 2 (a2=70%). The shared environmental effects were modest at time
1 (c2= 29%) and time 2 (c2=18%) in the ACE model. The non-shared environmental effects
were modest at time 1 (e2=35%) and time 2 (e2=30%) in both the ACE and the AE models at
time 2.
In the case of Chinese phonological memory, the time 1 data fitted the AE model
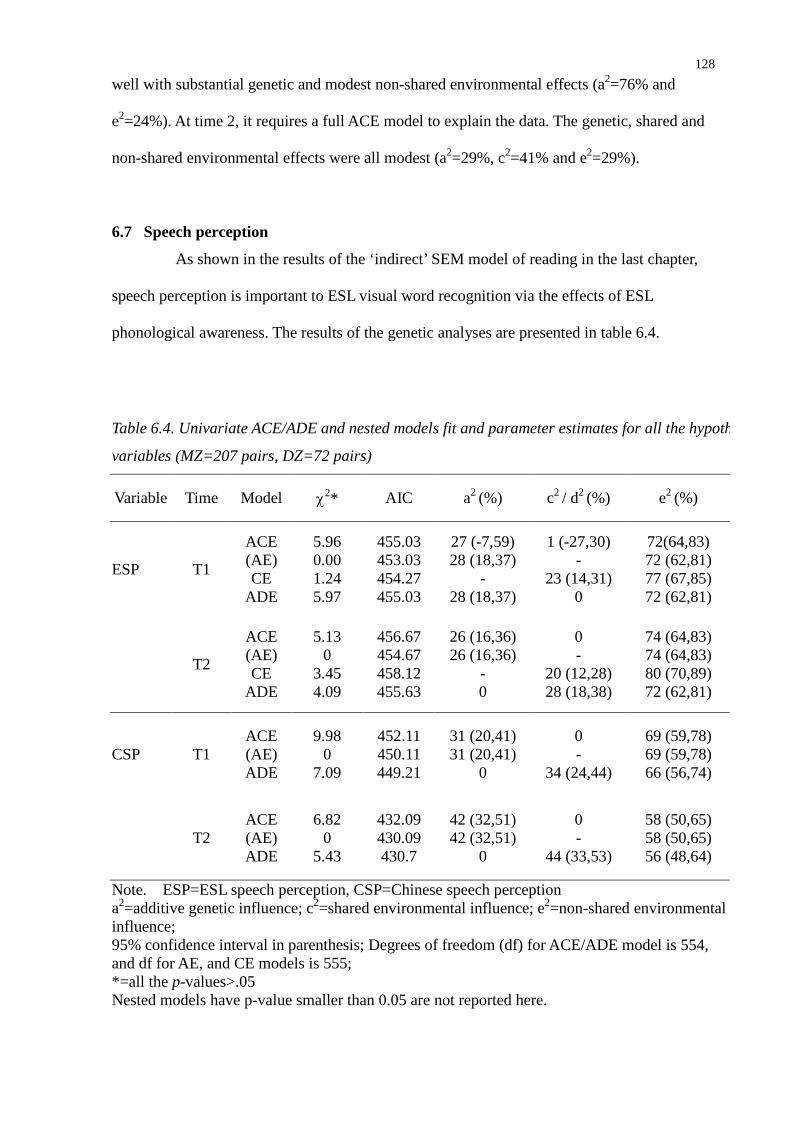
128
well with substantial genetic and modest non-shared environmental effects (a2=76% and
e2=24%). At time 2, it requires a full ACE model to explain the data. The genetic, shared and
non-shared environmental effects were all modest (a2=29%, c2=41% and e2=29%).
6.7 Speech perception
As shown in the results of the ‘indirect’ SEM model of reading in the last chapter,
speech perception is important to ESL visual word recognition via the effects of ESL
phonological awareness. The results of the genetic analyses are presented in table 6.4.
Table 6.4. Univariate ACE/ADE and nested models fit and parameter estimates for all the hypothesized
variables (MZ=207 pairs, DZ=72 pairs)
Variable Time Model 2* AIC a2 (%) c2 / d2 (%) e2 (%)
ESP T1
ACE(AE)CE
ADE
5.960.001.245.97
455.03453.03454.27455.03
27 (-7,59)28 (18,37)
-28 (18,37)
1 (-27,30)-
23 (14,31)0
72(64,83)72 (62,81)77 (67,85)72 (62,81)
T2
ACE(AE)CE
ADE
5.130
3.454.09
456.67454.67458.12455.63
26 (16,36)26 (16,36)
-0
0-
20 (12,28)28 (18,38)
74 (64,83)74 (64,83)80 (70,89)72 (62,81)
CSP T1ACE(AE)ADE
9.980
7.09
452.11450.11449.21
31 (20,41)31 (20,41)
0
0-
34 (24,44)
69 (59,78)69 (59,78)66 (56,74)
T2ACE(AE)ADE
6.820
5.43
432.09430.09430.7
42 (32,51)42 (32,51)
0
0-
44 (33,53)
58 (50,65)58 (50,65)56 (48,64)
Note. ESP=ESL speech perception, CSP=Chinese speech perceptiona2=additive genetic influence; c2=shared environmental influence; e2=non-shared environmentalinfluence;95% confidence interval in parenthesis; Degrees of freedom (df) for ACE/ADE model is 554,and df for AE, and CE models is 555;*=all the p-values>.05Nested models have p-value smaller than 0.05 are not reported here.
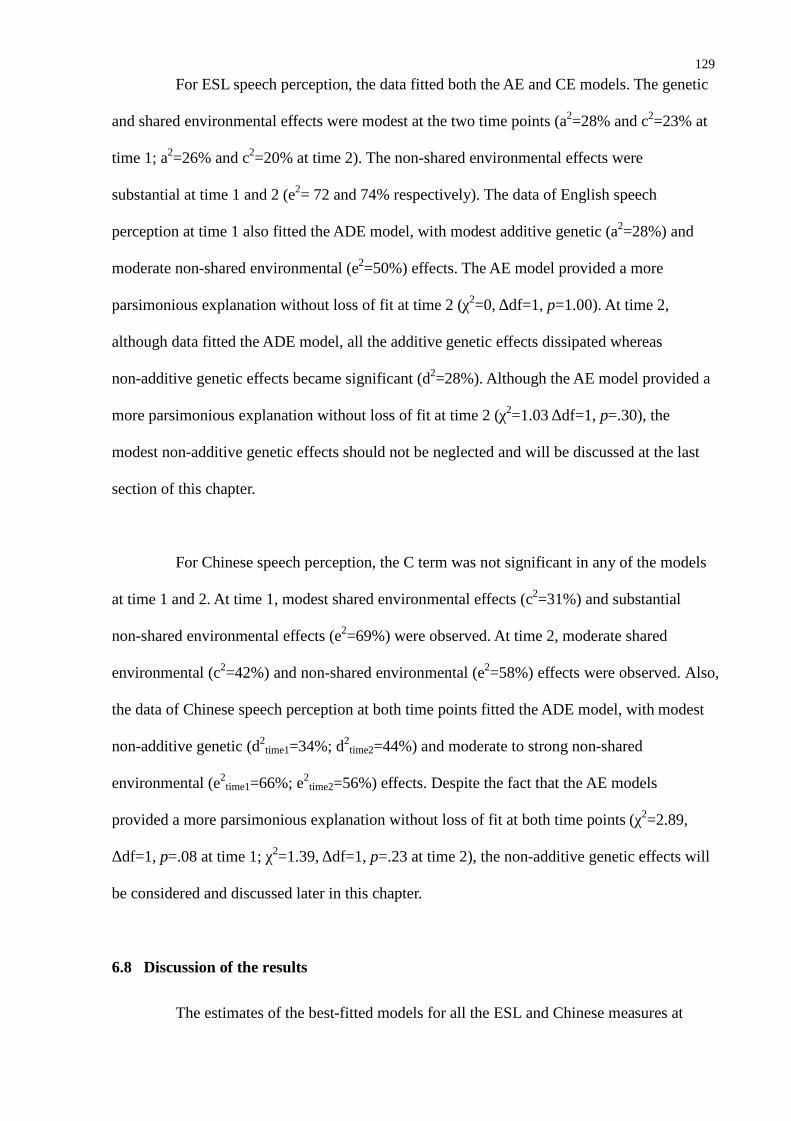
129
For ESL speech perception, the data fitted both the AE and CE models. The genetic
and shared environmental effects were modest at the two time points (a2=28% and c2=23% at
time 1; a2=26% and c2=20% at time 2). The non-shared environmental effects were
substantial at time 1 and 2 (e2= 72 and 74% respectively). The data of English speech
perception at time 1 also fitted the ADE model, with modest additive genetic (a2=28%) and
moderate non-shared environmental (e2=50%) effects. The AE model provided a more
parsimonious explanation without loss of fit at time 2 (χ2=0, Δdf=1, p=1.00). At time 2,
although data fitted the ADE model, all the additive genetic effects dissipated whereas
non-additive genetic effects became significant (d2=28%). Although the AE model provided a
more parsimonious explanation without loss of fit at time 2 (χ2=1.03 Δdf=1, p=.30), the
modest non-additive genetic effects should not be neglected and will be discussed at the last
section of this chapter.
For Chinese speech perception, the C term was not significant in any of the models
at time 1 and 2. At time 1, modest shared environmental effects (c2=31%) and substantial
non-shared environmental effects (e2=69%) were observed. At time 2, moderate shared
environmental (c2=42%) and non-shared environmental (e2=58%) effects were observed. Also,
the data of Chinese speech perception at both time points fitted the ADE model, with modest
non-additive genetic (d2time1=34%; d2
time2=44%) and moderate to strong non-shared
environmental (e2time1=66%; e2
time2=56%) effects. Despite the fact that the AE models
provided a more parsimonious explanation without loss of fit at both time points (χ2=2.89,
Δdf=1, p=.08 at time 1; χ2=1.39, Δdf=1, p=.23 at time 2), the non-additive genetic effects will
be considered and discussed later in this chapter.
6.8 Discussion of the results
The estimates of the best-fitted models for all the ESL and Chinese measures at
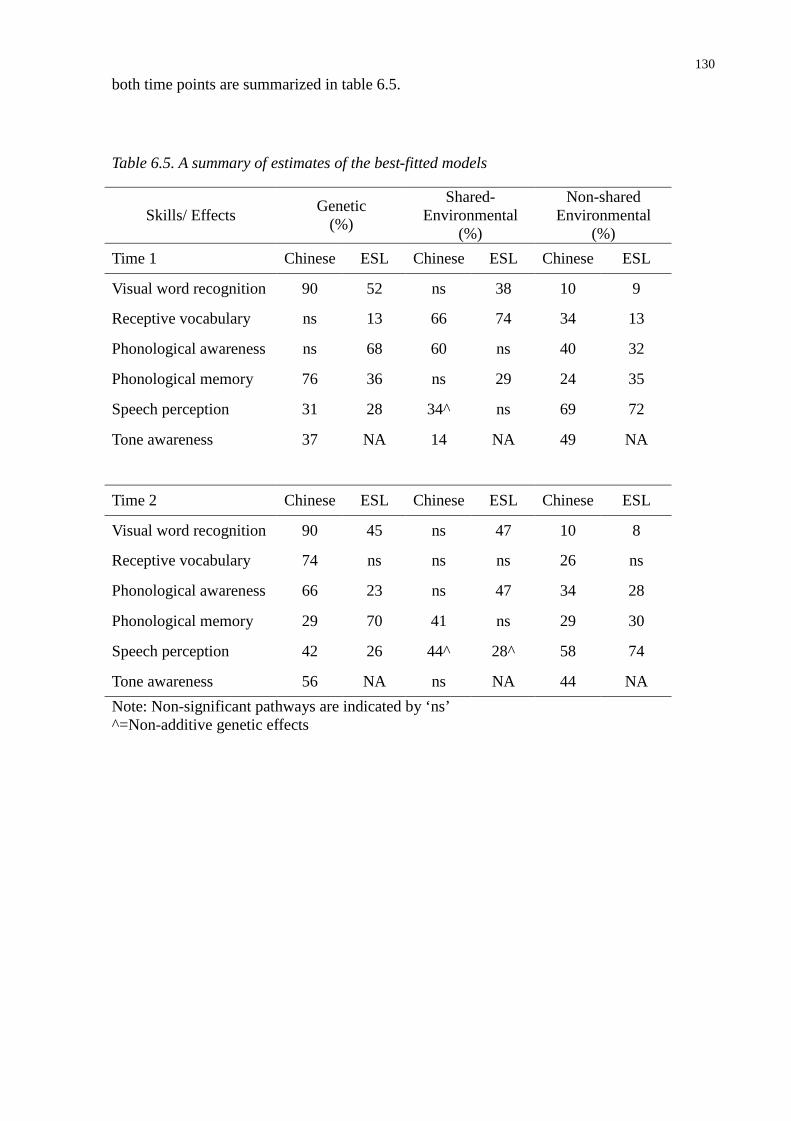
130
both time points are summarized in table 6.5.
Table 6.5. A summary of estimates of the best-fitted models
Skills/ EffectsGenetic
(%)
Shared-Environmental
(%)
Non-sharedEnvironmental
(%)
Time 1 Chinese ESL Chinese ESL Chinese ESL
Visual word recognition 90 52 ns 38 10 9
Receptive vocabulary ns 13 66 74 34 13
Phonological awareness ns 68 60 ns 40 32
Phonological memory 76 36 ns 29 24 35
Speech perception 31 28 34^ ns 69 72
Tone awareness 37 NA 14 NA 49 NA
Time 2 Chinese ESL Chinese ESL Chinese ESL
Visual word recognition 90 45 ns 47 10 8
Receptive vocabulary 74 ns ns ns 26 ns
Phonological awareness 66 23 ns 47 34 28
Phonological memory 29 70 41 ns 29 30
Speech perception 42 26 44^ 28^ 58 74
Tone awareness 56 NA ns NA 44 NA
Note: Non-significant pathways are indicated by ‘ns’^=Non-additive genetic effects

131
Figure 6.1: Proportion of variance explained (%) by additive genetic (A)/ non-additive genetic (D),
shared environmental (C) nd non-shared environmental (E) on Chinese measures at time 1 and 2
0%
10%
20%
30%
40%
50%
60%
70%
80%
90%
100%
T1 CVW
R
T2 CVW
R
T1 CRV
T2 CRV
T1 CPA
T2 CPA
T1 CPM
T2 CPM
T1 CSP
T2 CSP
T1 CSP (A
DE)
T2 CSP (A
DE)
T1 CTA
T2 CTA
E
C/ D
A
Note: CVWR=Chinese visual word recognition; CRV=ESL receptive vocabulary;
CPA=Chinese phonological awareness; CTA=Chinese tone awareness;
CPM=Chinese phonological memory; CSP=Chinese speech perception.
Confidence intervals and the values of goodness-of-fit indices can be found in tables 6.2-4
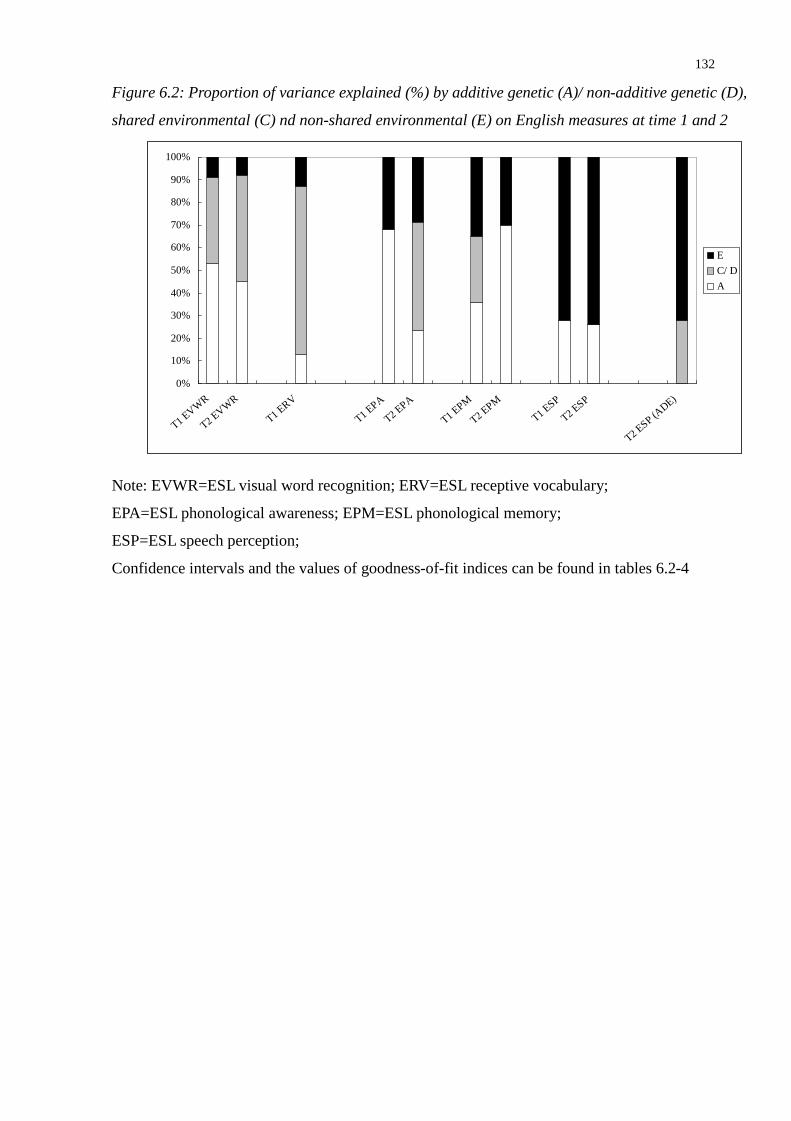
132
Figure 6.2: Proportion of variance explained (%) by additive genetic (A)/ non-additive genetic (D),
shared environmental (C) nd non-shared environmental (E) on English measures at time 1 and 2
0%
10%
20%
30%
40%
50%
60%
70%
80%
90%
100%
T1 EVWR
T2 EVWR
T1 ERV
T1 EPA
T2 EPA
T1 EPM
T2 EPM
T1 ESP
T2 ESP
T2 ESP (ADE)
E
C/ D
A
Note: EVWR=ESL visual word recognition; ERV=ESL receptive vocabulary;
EPA=ESL phonological awareness; EPM=ESL phonological memory;
ESP=ESL speech perception;
Confidence intervals and the values of goodness-of-fit indices can be found in tables 6.2-4
133
The non-significant genetic effects in Chinese receptive vocabulary and
phonological awareness at time 1 and ESL receptive vocabulary at time 2 seem to violate
what is called the first Law of behaviour genetics – all behaviours are heritable (Turkheimer,
2000). More studies are needed to verify this. It should be noted that, at time 1, about 16%
more of the participants studied in kindergartens in which the learning environment is
different from primary schools in terms of the homogeneity of Chinese and English literacy
curriculum. In future studies with larger sample size, differences in estimates might be
detected between the kindergarten and the primary school groups.
The genetic effects for Chinese visual word recognition at both time points were
substantial (a2=.90). Similar size of genetic effects was found in the Australia sample in
Samuelsson et al.’s (2007) study and was argued as an effect of intensive literacy training in
New South Wales.
The shared environmental effects of ESL receptive vocabulary were substantial at
the two time points, implying that similar learning environment and materials could produce
similar learning outcomes. Most of the twin studies on English-speaking children also showed
that shared environmental effects were important in vocabulary acquisition (e.g., Dionne et al.,
2003). It highlights the nature of vocabulary learning. In terms of breadth, the environment
(ecology) determines what vocabulary the learner can encounter and whom the learners can
learn from. For example, vocabulary can be learnt when parents bring their children to a
European-style restaurant and introduce them to vocabulary such as ‘starter’ and ‘main
course’. In terms of depth, one vocabulary item can represent more than one meaning (e.g.,
‘well’ means a deep hole for getting water, is the adverb of ‘good’ and is part of a name as in
‘Blackwell’), and only by multiple contextual learning can the multiple meanings of a
vocabulary item be acquired and then applied or understood correctly according to a specific

134
context. Therefore, shared opportunities of vocabulary uses would results in similar
enrichment of the extended meanings of vocabulary. Also, as argued by the Competition
model (Hernandez, Li, & MacWhinney, 2005), sufficient rehearsal of L2 vocabulary use is
necessary to reduce the entrenchment from the strong L1 and consolidate the L2
phonology-and-referent link. Otherwise, the L2 vocabulary is parasitic on L1 vocabulary and
easily forgotten (more details in figure 6.1). Thus, the strong shared environmental effects
might reveal the importance of practice opportunities for L2 vocabulary consolidation.
Furthermore, the genetic factors would increase the propensity for being a self-motivated
learners of a foreign language and reinforce vocabulary learning. This kind of reinforcement
was especially important in a non total-immersion English learning environment where the
use of first language is enough for people to function well enough in the society.
Figure 6.3: Parasitism and advanced word learning in bilinguals.
(a) Parasitism: The English (L2) word ‘potato’ is a word associate of the Chinese word
‘馬鈴薯’ without a direct link to meaning. (b) Later in learning, direct connections form
between the L2 form ‘potato’ and the meaning in L1. As L2 forms gain strength, they can
compete with L1, and be accessed more readily (adapted from Hernandez, Li, & MacWhinney,
2005).
Moderate shared environmental effects on ESL phonological awareness were
135
observed at time 2. This could be related to the introduction of new elements in language
curriculums in Hong Kong. In Hong Kong, increasingly more schools have adapted the
analytic approach, in conjunction with the whole word approach, to teach English vocabulary
knowledge. Mandarin class is now compulsory and there is evidence that knowledge of
Pinyin enhances phonological skills in English among Chinese speakers (Lin, et al., 2010).
The introduction of new teaching elements would result in a more diversified learning
environment and increase the chance of detecting environmental influences. Although the
education reform had been implemented since 2002, the objectives of the first stage of
development (2001-2006) were related to the motivational aspects of learning. Therefore, the
shared environmental effects could be not detected for ESL phonological awareness at time 1
when the second stage of reform which focused on learners’ needs started to take place in
2007.
The patterns of the genetic and shared environmental estimates for Chinese and ESL
phonological memory were not stable over time. While Chinese phonological memory fitted
only the AE model at time 1, it fitted the ACE model at time 2. The emergent of
shared-environmental effects may be a training effect of dictations given regularly and
commonly by the teachers in local schools. At time 1, it was likely that most of the children
were only required to dictate simple words and short phrases, which demanded shorter
memory span. A year later, the children would be expected to be able to recite a whole
passage and their memory span would be increased with trainings. Future research is needed
to verify this speculation. A reverse pattern of estimates was observed in ESL phonological
memory – the data fitted the ACE model at time 1 but only the AE model at time 2. Unlike
Chinese dictation, in more advanced English dictation, the children were asked to spell words
that had not be learnt before rather than reciting a longer passage. If rote learning and
recitation are crucial to phonological memory development, the task demand of English
136
dictation may not contribute to the enhancement of phonological memory but the awareness
of grapheme-phoneme correspondences. It is worth to further investigate the environmental
factors (e.g. school activities) that contribute to phonological memory.
Moderate to substantial non-shared environmental effects were observed in ESL and
Chinese speech perception at time 1 and 2. Despite the sensitivities to strategies, it also
implied that a person’s unique experiences are vital in determining individual variations.
Social interaction is an important aspect for L2 language learning. In an intervention study,
9-month-old American infants were taught a Chinese speech contrast that does not exist in
English (Kuhl, Tsao, & Liu, 2003). The results of the study demonstrated that American
infants who were exposed to live social interaction with speakers of Chinese reading books
and playing with toys performed significantly better on discrimination of a Chinese phonetic
contrast than infants in the control group who did not have the Chinese exposure. More
importantly, exposure to recorded video or audio tapes of the same Chinese speakers via a
television set or speaker showed no signs of phonetic learning. Unlike written materials which
are tangible and transferable from person to person, speech produced in conversation is
usually not recorded and the transmission is limited to real-time interaction between speakers
and listeners. A twin is not likely to meet the same people his cotwin meets all the time. Even
if they share the same talkers, it is not very likely to share the same conversation. Therefore,
twins would share the same reading materials but it is less likely they will share the same
interpersonal oral communication. Therefore, unique personal experiences have a greater
impact on the individual variations in speech perception. Larger non-shared environmental
effects in ESL than Chinese speech perception might reflect the more limited opportunities to
make English conversation in Hong Kong. Apart from speaking practice conducted in the
classroom, extra oral practices are not always available. There is a chance factor involved in
meeting an English speaker or engaging in a conversation with other ESL speakers in English.

137
In Hong Kong, children speak English outside school when they have in-house English
speaking maids, private tutors or interactive learning software. One way to identify the
specific nonshared environmental effects is to have the child participants self-reporting the
nature and amount of interpersonal communication in Chinese and English in their daily life
with structured interviews. With the use of ‘MZ differences’ method (any differences between
the MZ twins’ environment is purely nonshared), we can examine if the variations in
interpersonal communication contribute to the individual differences in speech perception.
Moreover, if interpersonal communication is important for the development of ESL speech
perception, the etiologies of social aspects of communication and personality would be
correlated with that of speech perception. Future research could investigate this.
It is interesting to note that significant non-additive genetic effects were observed in
time 2 ESL speech perception and time 1 and 2 Chinese speech perception. Speech perception
may be a kind of emergenic trait which depends on the configuration of polygenic genes. It is
not clear if the non-additive effects operate at the peripheral level of the auditory system or
the neurological level (auditory cortex and related brain areas). Future research is needed to
test these possibilities. I am not aware of other studies on genetics of tone awareness; the
closest phenotype that has been investigated is pitch perception, usually in the context of
music studies. Drayna, Manichaikul, de Lange, Snieder, and Spector (2001) used a twin study
to investigate the genetic and environmental contributions to differences in musical pitch
perception abilities in humans. They administered a Distorted Tunes Test (DTT), which
requires participants to judge whether simple popular melodies contain notes with incorrect
pitch, to 136 monozygotic twin pairs and 148 dizygotic twin pairs. The correlation of DTT
scores between twins was estimated at 0.67 for monozygotic pairs and 0.44 for dizygotic pairs,
with no dominant genetic effects and no significant effect of shared environment detected.
Musical pitch perception may not be as idiosyncratic as expected by the idea of emergenic
138
trait. Absolute pitch (AP), commonly referred to as perfect pitch, is the rare ability to identify
tones with their corresponding musical note names without the aid of a reference tone. Some
aspects of AP resemble that of second language speech perception. Musical training during a
critical period of childhood development probably contributes to the acquisition of AP
(Baharloo, Johnston, Service, Gitschier, & Freimer,1998), but this training alone is
insufficient; many people receive early musical training but do not develop AP. Interestingly,
one study showed that infants preferentially use AP cues over relative pitch cues in certain
situations, suggesting that all people might be born with AP but that the majority lose their AP
abilities with age (Saffran & Griepentrog, 2001). Genetic makeup of the individual (as
evidenced in twin studies, e.g., Gregersen, Kowalsky, Kohn, & Marvin, 2001) and
environmental factors (type of musical training, e.g., Gregersen, et al., 2001 or the individual’
s tone language fluency, e.g., Deutsch, Dooley, Henthorn, & Head, 2009) have been suggested
to influence whether an individual develops AP. However, as absolute pitch is a rare ability,
twin studies on this topic had very small sample size and non-additive genetic effects could
not be detected easily. We expect more aggregation of multiple datasets from various sources
to come.
At time 1, modest genetic and shared-environmental effects were observed in
Chinese lexical tone awareness. A year later, the shared-environmental effects dissipated and
the data fitted only the AE model. As shown in Chen, Ku, Koyama, Anderson, and Li’s (2008)
study, Cantonese-speaking children’s tone awareness were found to have improved from
grade 1 to 2 but then deteriorated till grade 4. This progressive and then regressive
developmental trajectory would affect the stability of genetic and environmental estimates,
especially as the sample spanned a large age range in this thesis.
For both Chinese and ESL measures, similar patterns of the non-shared

139
environmental effects were observed at time 1 and 2. It is speculated that the systematic
non-shared environmental effects might relate to the strategies adopted by the child for
various experimental tasks. Individuals may handle the same experimental tasks with different
strategies. Some tasks allow more flexible use of strategies, while others are less sensitive to
strategies. Despite shared genetic disposition and shared environment, a twin can develop his
own way for accomplishing the experimental tasks that differ from his cotwin. In visual word
recognition, an accurate pronunciation is expected. Children who have learnt phonics may
give themselves an advantage of reading aloud unfamiliar word correctly. In phoneme
deletion tasks, children may mentally delete the initial phoneme or compare words with
similar rimes by relying on the spelling of the word. In phonological memory, different
mnemonics can be applied. For example, the English sounds could be transcribed into
meaningful Cantonese sounds or visual images. In doing the speech perception task, children
may approach the three auditory stimuli differently when deciding if the first or third sound
matches the second one. They could compare between the first two sounds or between the last
two sounds or compare among the three sounds. Style and strategies could make a difference
if some styles are superior to the others. Further studies are warranted to clarify the effects of
strategy use.
The results showed that time 2 ESL receptive vocabulary did not fit any twin model.
As ESL receptive vocabulary was the only skill in this thesis that did not fit the twin model,
an explanation in terms of ascertainment bias is unlikely. Further studies are needed to
investigate this.
140
CHAPTER 7 BIVARIATE GENETIC ANALYSES
7.1 Chapter summary
In this chapter, the nature and applications of bivariate twin modelling and
Cholesky decomposition analysis will be described and explained. The results of twin
analyses concerning genetic overlap and stabilities will be reported and discussed. This
chapter closes with a general discussion of this chapter’s findings.
7.2 Genetic overlap and distinctiveness
The application of the twin study method is not limited to heritability estimation. It
can be deployed to examine one important question in cognitive psychology – modularity.
Modularity refers to innate and invariant information-processing units (Fodor, 1983).
According to Petrill (1997), a system is molar when a general and unitary process handles a
wide range of cognitive tasks. In contrast, in a modular system, cognitive processes are
relatively independent in their functioning and each of them serves highly specific cognitive
tasks. Traditionally, the principle of differentiation as put forth by Werner (1948) was phrased
in terms of normative development. In the behavioural-genetic framework, the degree of
differentiation can be seen as the magnitude of inter-correlations among measures. Though
bivariate twin modelling is not a direct test of modularity of L1 and L2, the results will
inform us if modularity is associated with etiological overlap between skills.
The modularity issue can also be seen at the neurological level. In a (relatively)
molar system, processing of L1 and L2 would be subsumed by overlapping neural networks
and substrates, as predicted by the ‘system assimilation hypothesis’ (Perfetti, Liu, Fiez,
Nelson, Bolger, & Tan, 2007). Using functional magnetic resonance imaging (fMRI), Tan et al.
(2003) found that phonological processing of Chinese characters among Chinese-English
bilinguals (their dominant language is Chinese) relied on a neural system that was clearly
distinct from that used by monolingual native English speakers. Critically, when processing
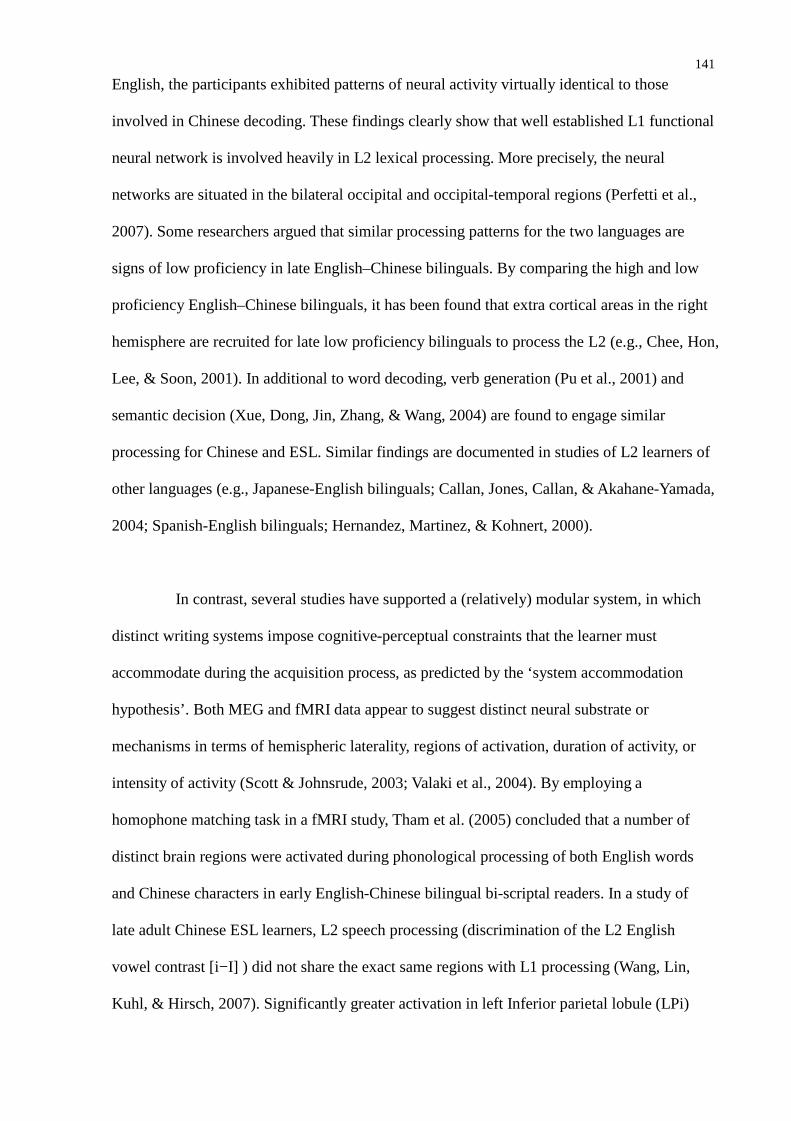
141
English, the participants exhibited patterns of neural activity virtually identical to those
involved in Chinese decoding. These findings clearly show that well established L1 functional
neural network is involved heavily in L2 lexical processing. More precisely, the neural
networks are situated in the bilateral occipital and occipital-temporal regions (Perfetti et al.,
2007). Some researchers argued that similar processing patterns for the two languages are
signs of low proficiency in late English–Chinese bilinguals. By comparing the high and low
proficiency English–Chinese bilinguals, it has been found that extra cortical areas in the right
hemisphere are recruited for late low proficiency bilinguals to process the L2 (e.g., Chee, Hon,
Lee, & Soon, 2001). In additional to word decoding, verb generation (Pu et al., 2001) and
semantic decision (Xue, Dong, Jin, Zhang, & Wang, 2004) are found to engage similar
processing for Chinese and ESL. Similar findings are documented in studies of L2 learners of
other languages (e.g., Japanese-English bilinguals; Callan, Jones, Callan, & Akahane-Yamada,
2004; Spanish-English bilinguals; Hernandez, Martinez, & Kohnert, 2000).
In contrast, several studies have supported a (relatively) modular system, in which
distinct writing systems impose cognitive-perceptual constraints that the learner must
accommodate during the acquisition process, as predicted by the ‘system accommodation
hypothesis’. Both MEG and fMRI data appear to suggest distinct neural substrate or
mechanisms in terms of hemispheric laterality, regions of activation, duration of activity, or
intensity of activity (Scott & Johnsrude, 2003; Valaki et al., 2004). By employing a
homophone matching task in a fMRI study, Tham et al. (2005) concluded that a number of
distinct brain regions were activated during phonological processing of both English words
and Chinese characters in early English-Chinese bilingual bi-scriptal readers. In a study of
late adult Chinese ESL learners, L2 speech processing (discrimination of the L2 English
vowel contrast [i−I] ) did not share the exact same regions with L1 processing (Wang, Lin,
Kuhl, & Hirsch, 2007). Significantly greater activation in left Inferior parietal lobule (LPi)
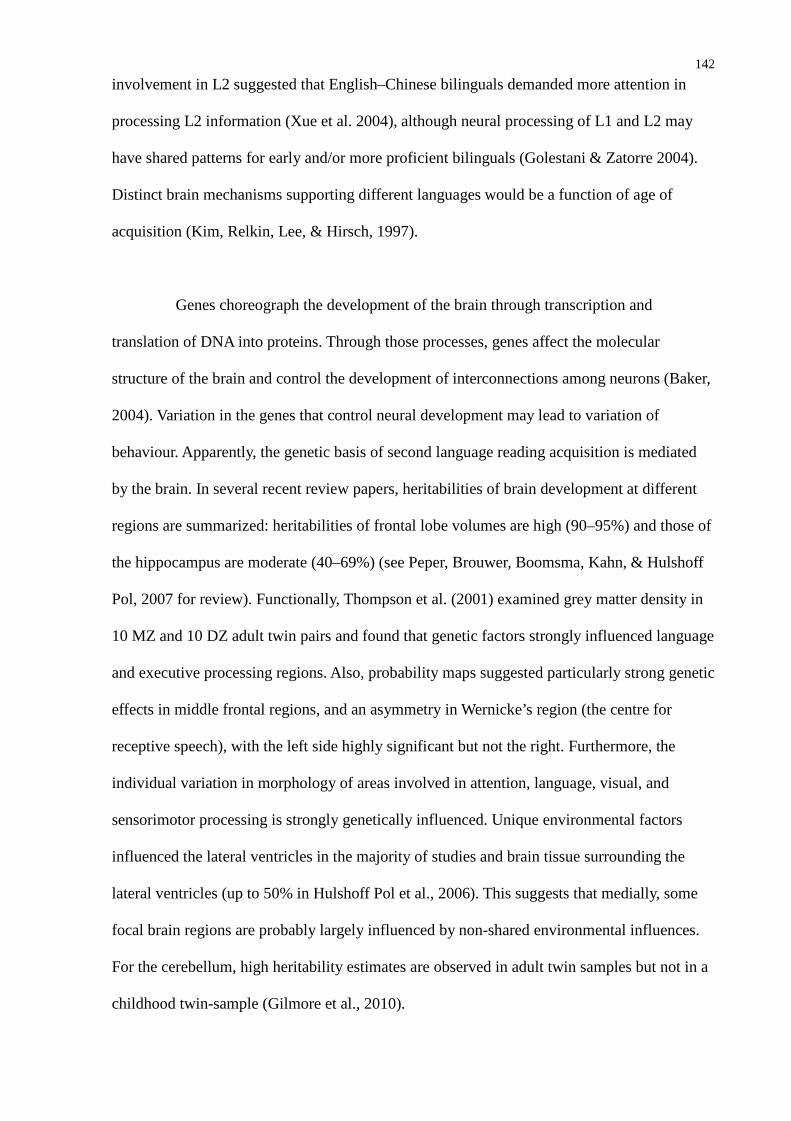
142
involvement in L2 suggested that English–Chinese bilinguals demanded more attention in
processing L2 information (Xue et al. 2004), although neural processing of L1 and L2 may
have shared patterns for early and/or more proficient bilinguals (Golestani & Zatorre 2004).
Distinct brain mechanisms supporting different languages would be a function of age of
acquisition (Kim, Relkin, Lee, & Hirsch, 1997).
Genes choreograph the development of the brain through transcription and
translation of DNA into proteins. Through those processes, genes affect the molecular
structure of the brain and control the development of interconnections among neurons (Baker,
2004). Variation in the genes that control neural development may lead to variation of
behaviour. Apparently, the genetic basis of second language reading acquisition is mediated
by the brain. In several recent review papers, heritabilities of brain development at different
regions are summarized: heritabilities of frontal lobe volumes are high (90–95%) and those of
the hippocampus are moderate (40–69%) (see Peper, Brouwer, Boomsma, Kahn, & Hulshoff
Pol, 2007 for review). Functionally, Thompson et al. (2001) examined grey matter density in
10 MZ and 10 DZ adult twin pairs and found that genetic factors strongly influenced language
and executive processing regions. Also, probability maps suggested particularly strong genetic
effects in middle frontal regions, and an asymmetry in Wernicke’s region (the centre for
receptive speech), with the left side highly significant but not the right. Furthermore, the
individual variation in morphology of areas involved in attention, language, visual, and
sensorimotor processing is strongly genetically influenced. Unique environmental factors
influenced the lateral ventricles in the majority of studies and brain tissue surrounding the
lateral ventricles (up to 50% in Hulshoff Pol et al., 2006). This suggests that medially, some
focal brain regions are probably largely influenced by non-shared environmental influences.
For the cerebellum, high heritability estimates are observed in adult twin samples but not in a
childhood twin-sample (Gilmore et al., 2010).
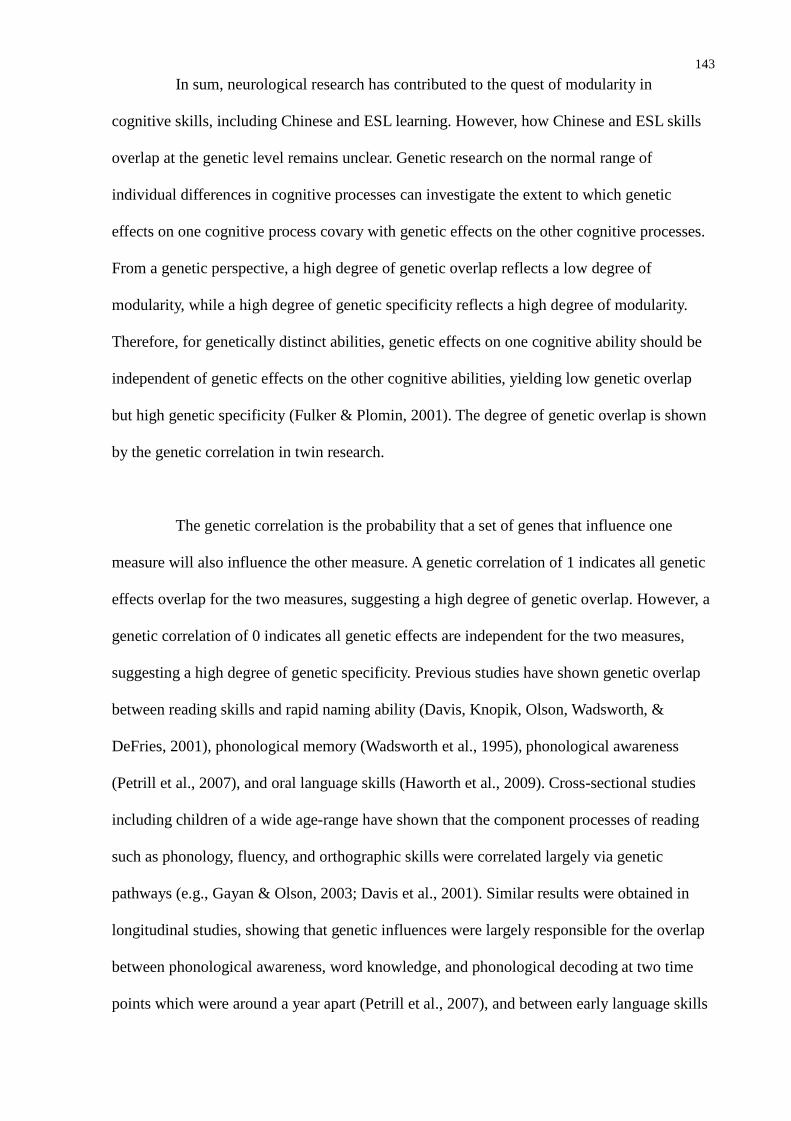
143
In sum, neurological research has contributed to the quest of modularity in
cognitive skills, including Chinese and ESL learning. However, how Chinese and ESL skills
overlap at the genetic level remains unclear. Genetic research on the normal range of
individual differences in cognitive processes can investigate the extent to which genetic
effects on one cognitive process covary with genetic effects on the other cognitive processes.
From a genetic perspective, a high degree of genetic overlap reflects a low degree of
modularity, while a high degree of genetic specificity reflects a high degree of modularity.
Therefore, for genetically distinct abilities, genetic effects on one cognitive ability should be
independent of genetic effects on the other cognitive abilities, yielding low genetic overlap
but high genetic specificity (Fulker & Plomin, 2001). The degree of genetic overlap is shown
by the genetic correlation in twin research.
The genetic correlation is the probability that a set of genes that influence one
measure will also influence the other measure. A genetic correlation of 1 indicates all genetic
effects overlap for the two measures, suggesting a high degree of genetic overlap. However, a
genetic correlation of 0 indicates all genetic effects are independent for the two measures,
suggesting a high degree of genetic specificity. Previous studies have shown genetic overlap
between reading skills and rapid naming ability (Davis, Knopik, Olson, Wadsworth, &
DeFries, 2001), phonological memory (Wadsworth et al., 1995), phonological awareness
(Petrill et al., 2007), and oral language skills (Haworth et al., 2009). Cross-sectional studies
including children of a wide age-range have shown that the component processes of reading
such as phonology, fluency, and orthographic skills were correlated largely via genetic
pathways (e.g., Gayan & Olson, 2003; Davis et al., 2001). Similar results were obtained in
longitudinal studies, showing that genetic influences were largely responsible for the overlap
between phonological awareness, word knowledge, and phonological decoding at two time
points which were around a year apart (Petrill et al., 2007), and between early language skills
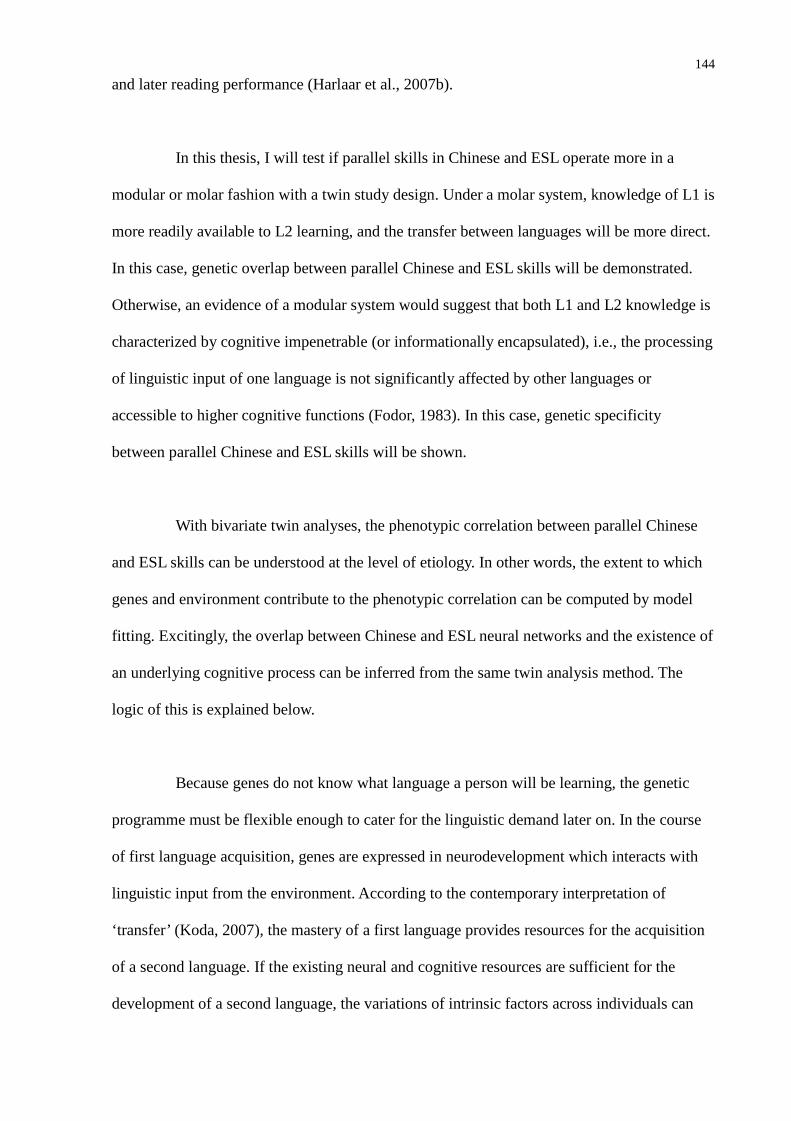
144
and later reading performance (Harlaar et al., 2007b).
In this thesis, I will test if parallel skills in Chinese and ESL operate more in a
modular or molar fashion with a twin study design. Under a molar system, knowledge of L1 is
more readily available to L2 learning, and the transfer between languages will be more direct.
In this case, genetic overlap between parallel Chinese and ESL skills will be demonstrated.
Otherwise, an evidence of a modular system would suggest that both L1 and L2 knowledge is
characterized by cognitive impenetrable (or informationally encapsulated), i.e., the processing
of linguistic input of one language is not significantly affected by other languages or
accessible to higher cognitive functions (Fodor, 1983). In this case, genetic specificity
between parallel Chinese and ESL skills will be shown.
With bivariate twin analyses, the phenotypic correlation between parallel Chinese
and ESL skills can be understood at the level of etiology. In other words, the extent to which
genes and environment contribute to the phenotypic correlation can be computed by model
fitting. Excitingly, the overlap between Chinese and ESL neural networks and the existence of
an underlying cognitive process can be inferred from the same twin analysis method. The
logic of this is explained below.
Because genes do not know what language a person will be learning, the genetic
programme must be flexible enough to cater for the linguistic demand later on. In the course
of first language acquisition, genes are expressed in neurodevelopment which interacts with
linguistic input from the environment. According to the contemporary interpretation of
‘transfer’ (Koda, 2007), the mastery of a first language provides resources for the acquisition
of a second language. If the existing neural and cognitive resources are sufficient for the
development of a second language, the variations of intrinsic factors across individuals can
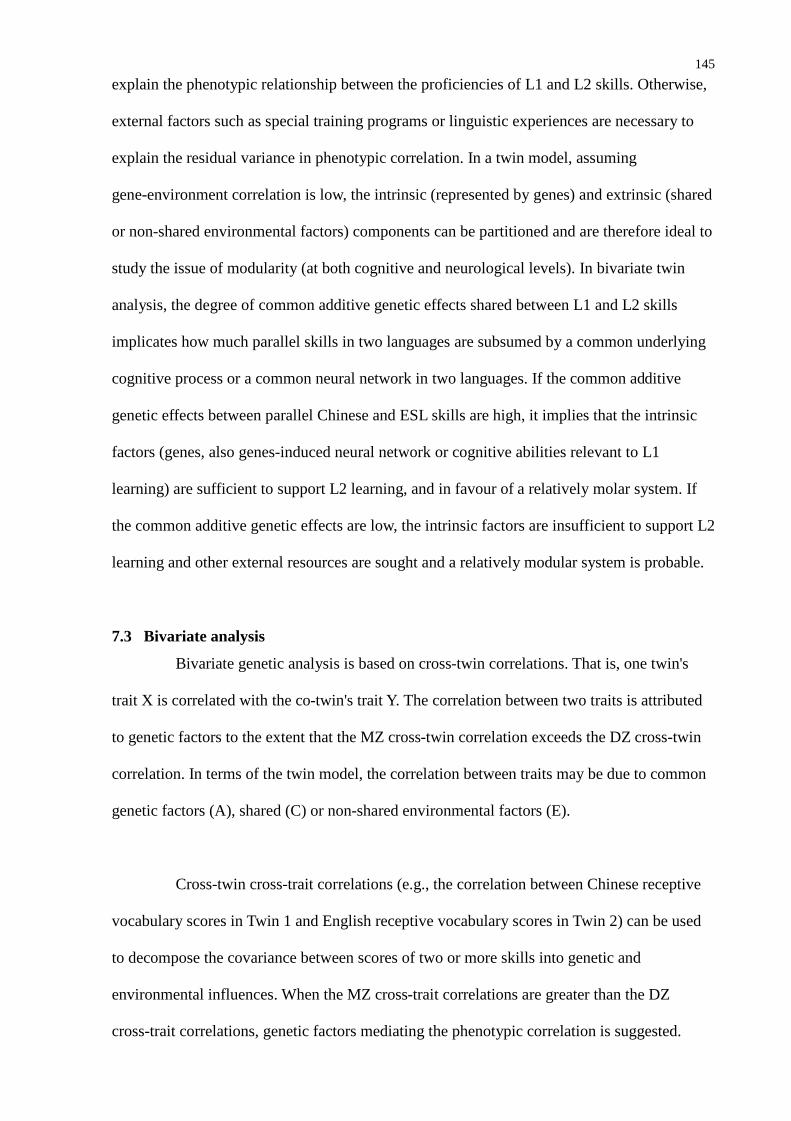
145
explain the phenotypic relationship between the proficiencies of L1 and L2 skills. Otherwise,
external factors such as special training programs or linguistic experiences are necessary to
explain the residual variance in phenotypic correlation. In a twin model, assuming
gene-environment correlation is low, the intrinsic (represented by genes) and extrinsic (shared
or non-shared environmental factors) components can be partitioned and are therefore ideal to
study the issue of modularity (at both cognitive and neurological levels). In bivariate twin
analysis, the degree of common additive genetic effects shared between L1 and L2 skills
implicates how much parallel skills in two languages are subsumed by a common underlying
cognitive process or a common neural network in two languages. If the common additive
genetic effects between parallel Chinese and ESL skills are high, it implies that the intrinsic
factors (genes, also genes-induced neural network or cognitive abilities relevant to L1
learning) are sufficient to support L2 learning, and in favour of a relatively molar system. If
the common additive genetic effects are low, the intrinsic factors are insufficient to support L2
learning and other external resources are sought and a relatively modular system is probable.
7.3 Bivariate analysis
Bivariate genetic analysis is based on cross-twin correlations. That is, one twin's
trait X is correlated with the co-twin's trait Y. The correlation between two traits is attributed
to genetic factors to the extent that the MZ cross-twin correlation exceeds the DZ cross-twin
correlation. In terms of the twin model, the correlation between traits may be due to common
genetic factors (A), shared (C) or non-shared environmental factors (E).
Cross-twin cross-trait correlations (e.g., the correlation between Chinese receptive
vocabulary scores in Twin 1 and English receptive vocabulary scores in Twin 2) can be used
to decompose the covariance between scores of two or more skills into genetic and
environmental influences. When the MZ cross-trait correlations are greater than the DZ
cross-trait correlations, genetic factors mediating the phenotypic correlation is suggested.
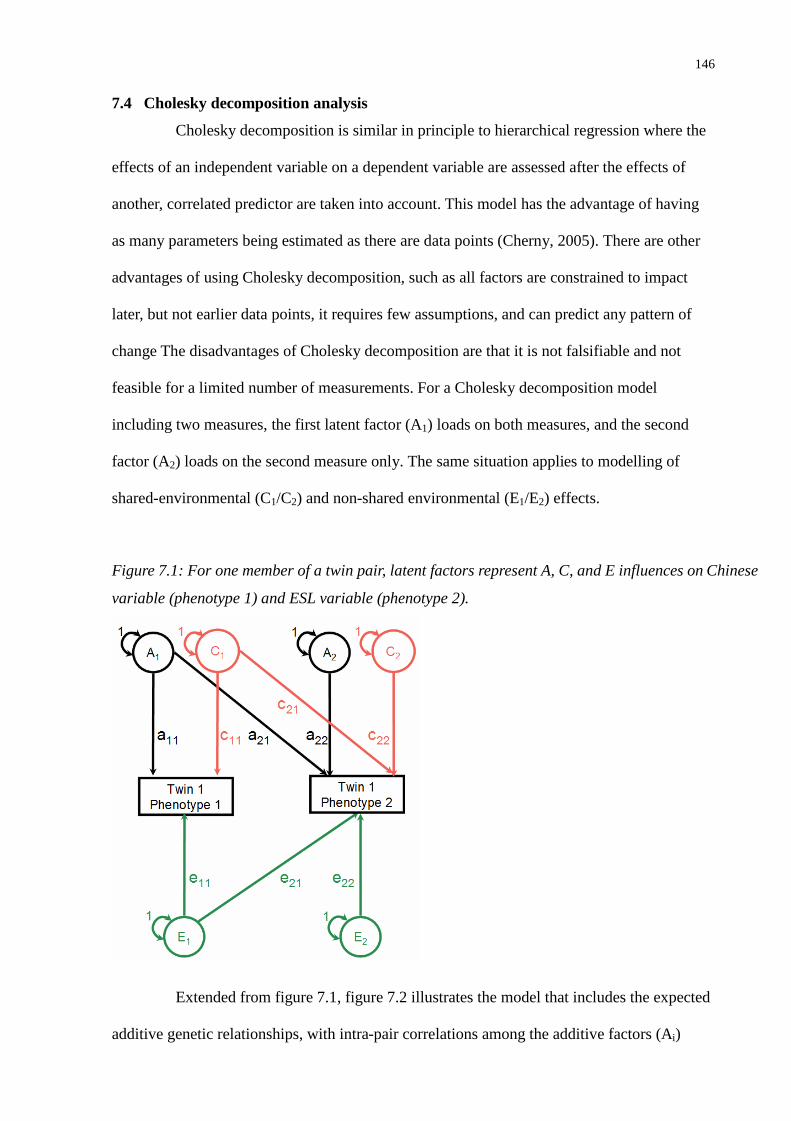
146
7.4 Cholesky decomposition analysis
Cholesky decomposition is similar in principle to hierarchical regression where the
effects of an independent variable on a dependent variable are assessed after the effects of
another, correlated predictor are taken into account. This model has the advantage of having
as many parameters being estimated as there are data points (Cherny, 2005). There are other
advantages of using Cholesky decomposition, such as all factors are constrained to impact
later, but not earlier data points, it requires few assumptions, and can predict any pattern of
change The disadvantages of Cholesky decomposition are that it is not falsifiable and not
feasible for a limited number of measurements. For a Cholesky decomposition model
including two measures, the first latent factor (A1) loads on both measures, and the second
factor (A2) loads on the second measure only. The same situation applies to modelling of
shared-environmental (C1/C2) and non-shared environmental (E1/E2) effects.
Figure 7.1: For one member of a twin pair, latent factors represent A, C, and E influences on Chinese
variable (phenotype 1) and ESL variable (phenotype 2).
Extended from figure 7.1, figure 7.2 illustrates the model that includes the expected
additive genetic relationships, with intra-pair correlations among the additive factors (Ai)
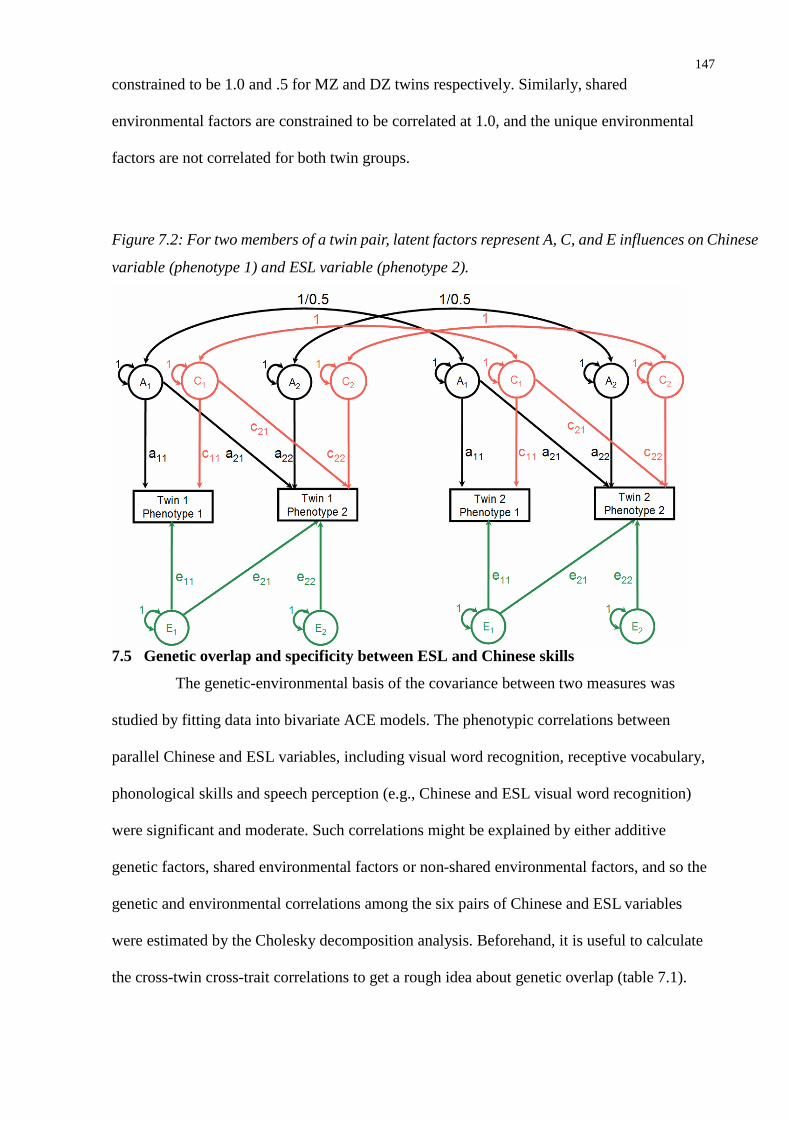
147
constrained to be 1.0 and .5 for MZ and DZ twins respectively. Similarly, shared
environmental factors are constrained to be correlated at 1.0, and the unique environmental
factors are not correlated for both twin groups.
Figure 7.2: For two members of a twin pair, latent factors represent A, C, and E influences on Chinese
variable (phenotype 1) and ESL variable (phenotype 2).
7.5 Genetic overlap and specificity between ESL and Chinese skills
The genetic-environmental basis of the covariance between two measures was
studied by fitting data into bivariate ACE models. The phenotypic correlations between
parallel Chinese and ESL variables, including visual word recognition, receptive vocabulary,
phonological skills and speech perception (e.g., Chinese and ESL visual word recognition)
were significant and moderate. Such correlations might be explained by either additive
genetic factors, shared environmental factors or non-shared environmental factors, and so the
genetic and environmental correlations among the six pairs of Chinese and ESL variables
were estimated by the Cholesky decomposition analysis. Beforehand, it is useful to calculate
the cross-twin cross-trait correlations to get a rough idea about genetic overlap (table 7.1).

148
Table 7.1. Cross-twin cross-trait correlations between Chinese and ESL parallel measures at time 1
The cross-twin cross-trait correlations of MZ twins were larger than that of DZ
twins, indicating that genetic factors were likely to have an influence on the phenotypic
correlations between Chinese and ESL variables. Because the MZ correlation were not greater
than double the DZ correlations, the genetic influences do not account completely for twin
similarity and as such implies that twin resemblance must also partly reflect environmental
influences.
Because the native language develops prior to a second language, in the bi-variate
analyses, Chinese measures were entered first, followed by ESL measures. The first set of
additive genetic (A), shared environmental (C), and non-shared environmental (E)
factors—A1, C1, E1—accounts for the variance in Chinese variable and the covariance
between Chinese and ESL variables. The second set—A2, C2, E2—accounts for the
remaining variance in ESL variables. Table 8.2 shows the standardized unsquared path
coefficients from bivariate Cholesky decomposition.
MZ DZ MZ DZ
ESL and parallel Chineseskills
Twin 1 Trait ATwin 2 Trait B
Twin 2 Trait ATwin 1 Trait B
Twin 1 Trait BTwin 2 Trait A
Twin 2 Trait BTwin 1 Trait A
Visual word recognition .46 (.34-.56) .43 (.23-.60) .46 (.35-.56) .33 (.11-.52)
Receptive vocabulary .28 (.15-.40) .19 (-.03-.40) .35 (.22-.46) .16 (-.06-.38)
Phonological awareness .50 (.39-.60) .37(.15-.55) .56 (.46-.64) .41 (.20-.58)
Chinese tone awareness &ESL phonological awareness
.42 (.30-.53) .15 (-.07-.37) .37 (.24-.48) .14 (-.09-.35)
Phonological memory .41 (.29-.51) .10 (-.12-.33) .52 (.41-.61) .30 (.08-.50)
Speech perception .22 (.09-.34) .17 (-.05-.39) .39 (.27-.50) .30 (-.11-.56)
Note. Non-significant correlations are bolded.
149
The contribution of genetic influences to the covariance between Chinese and ESL
variables is the product of the paths a11 and a21 (see Figure 7.1); if significant, this indicates
genetic overlap. Residual variance in ESL variable is denoted by path a22; if this path
coefficient is significant, this indicates genetic influences on individual differences in an ESL
variable that are independent of the corresponding Chinese variable. As shown in table 7.2,
independent genetic effects were observed only in ESL visual word recognition. Independent
shared environmental effects were found in visual word recognition and receptive vocabulary.
Independent non-shared environmental effects were found in all ESL variables.

150
Table 7.2. Standardized unsquared path coefficients from bivariate Cholesky decomposition (and 95%
confidence intervals in parentheses) of additive genetic (A), shared environment (C), and non-shared
environment (E) correlations between time 1 Chinese and ESL reading-related variables
Variable A1 A2 C1 C2 E1 E2
CVWR.85(.67,1.02)
.40(.02,.78)
.31(.28,.34)
EVWR.63(.46,.80)
.30 (.11,.49)-.04(-.66,.56)
.63(.40,.87)
.07(.03,.11)
.29(.26,.32)
CRV.40(.12,.67)
.71(.55,.88)
.57(.52,.62)
EVR.37(.19,.55)
0 (-.62,.62)
.21 (.02,.40)
.82(.73,.92)
.01(-.02,.06)
.36(.33,.40)
CPA.37(.13,.62)
.69(.54.85)
.61(.56,.66)
EPA.74(.59,.88)
0(-1.31,1.31)
.36(.10,.62)
0(-1.50,.1.50)
.00(-.07,.07)
.57(.51,.62)
CTA.57(.15,1.00)
.41(-.15,.98)
.71(.64,.78)
EPA.52(.00,1.04)
.51(-0.01,1.03)
.17(-.49,.84)
.34(-.13,.82)
.00(-.07,.08)
.57(.51,.63)
CPM.72(.62,.1.05)
.21(-.59,1.01)
.49(.45,.54)
EPM.49(.31,.85)
.11(-1.37,1.6)
-.14(-1.70,1.41)
.51(-.13,1.16)
-.03(-.11,.05)
.59(.54,.65)
CSP.57(.45,.69)
0 (-.47,.47).81(.74,.89)
ESP.55(.43,.67)
0 (-.41,.41) 0 (-.66,.66) 0 (-.38,.38).24(.14,.34)
.79(.73,.85)
Note: EVWR=ESL visual word recognition; ERV=ESL receptive vocabulary;
EPA=ESL phonological awareness; EPM=ESL phonological memory;
ESP=ESL speech perception;
CVWR=Chinese visual word recognition; CRV=Chinese receptive vocabulary;
CPA=Chinese phonological awareness; CTA=Chinese tone awareness;
CPM=Chinese phonological memory; CSP=Chinese speech perception.

151
Are genetic and environmental influences on individual differences common in Chinese
and ESL variables? If yes, to what extent? As shown in Table 7.2, genetic overlap was
observed in all variables, except Chinese tone awareness and English phonological awareness;
shared environmental overlap was found in visual word recognition and phonological
awareness; nonshared environmental overlap was indicated in visual word recognition and
speech perception. The genetic and environmental correlations between Chinese and ESL
variables with significant genetic or environmental overlap were estimated to indicate the
extent to which individual differences in two measures reflect the same genetic or
environmental influences. Genetic and environmental correlations, by definition, are the
probability that a set of genes (or environment) that influence one measure will also influence
the other measure, which may assume any value between –1 and +1. The genetic correlations
between all parallel Chinese and ESL skills with significant genetic links were high (over .90),
indicating that most of the genetic influences on Chinese correlated with those influencing
ESL. The shared environmental correlations were high in phonological awareness and modest
but significant in receptive vocabulary. The non-shared environmental correlations are modest
in visual word recognition and speech perception. Note that the genetic correlations are
independent of the extent to which two traits are each influenced by genetic influences. So, it
is possible that two skills are highly heritable but genetically distinctive. For example, height
and language skills are high in heritability on their own but they seem not to have high
genetic overlap. To take the genetic influences on each trait into account, the bivariate
heritability should be computed.
To what extent genetic and environmental influences contribute to the phenotypic
correlations? The bivariate heritability reflects both the genetic links of and the genetic
contributions to each trait, and it represents the genetic contributions to the phenotypic
correlation. It was computed by multiplying the two squared path coefficients a11 and a12

152
(figure 7.2). The percentage of the phenotypic links explained by genetic effects was
computed by dividing the bivariate heritability by the phenotypic correlation of each pair of
variables.
Genetic factors explained over half of the phenotypic correlations across pairs of
variables (from 54% for phonological awareness to 94% for visual word recognition). Shared
environmental effects contributed to around half of the phenotypic correlations between
Chinese and ESL receptive vocabulary (47%) and phonological awareness (54%). In addition,
non-shared environmental effects were found in the phenotypic link between visual word
recognition and speech perception, but they included measurement errors.
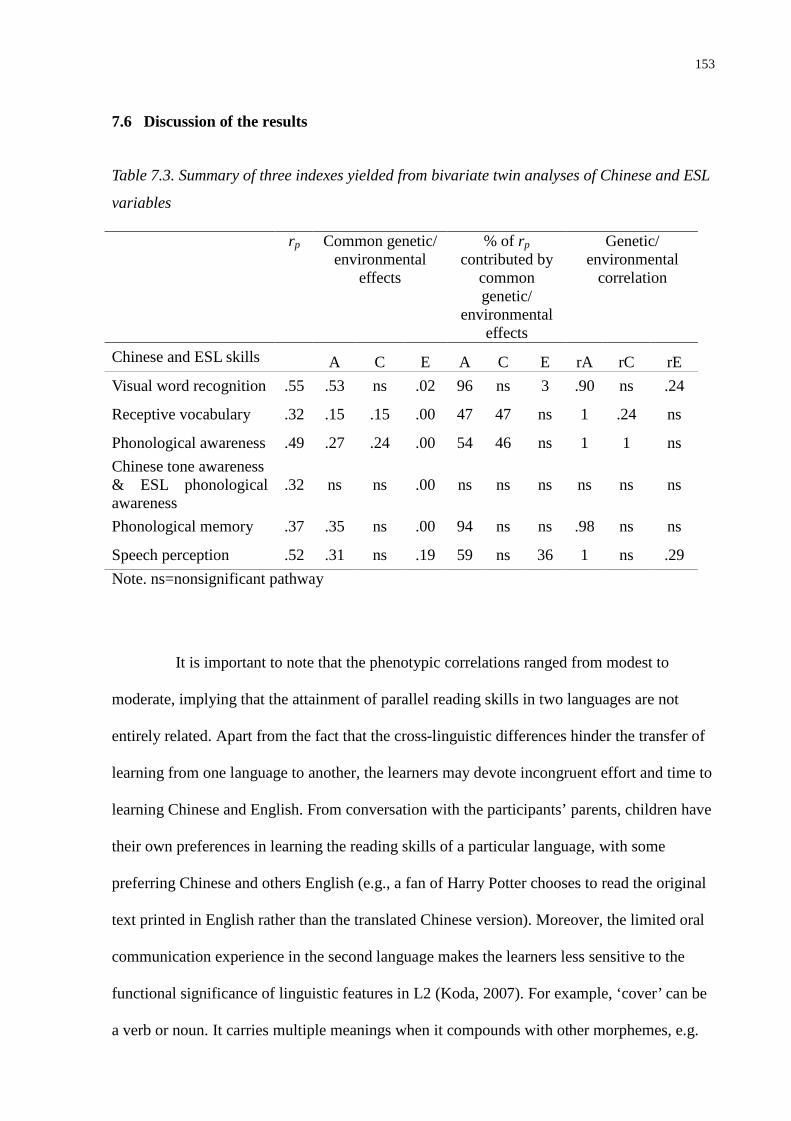
153
7.6 Discussion of the results
Table 7.3. Summary of three indexes yielded from bivariate twin analyses of Chinese and ESL
variables
It is important to note that the phenotypic correlations ranged from modest to
moderate, implying that the attainment of parallel reading skills in two languages are not
entirely related. Apart from the fact that the cross-linguistic differences hinder the transfer of
learning from one language to another, the learners may devote incongruent effort and time to
learning Chinese and English. From conversation with the participants’ parents, children have
their own preferences in learning the reading skills of a particular language, with some
preferring Chinese and others English (e.g., a fan of Harry Potter chooses to read the original
text printed in English rather than the translated Chinese version). Moreover, the limited oral
communication experience in the second language makes the learners less sensitive to the
functional significance of linguistic features in L2 (Koda, 2007). For example, ‘cover’ can be
a verb or noun. It carries multiple meanings when it compounds with other morphemes, e.g.
rp Common genetic/environmental
effects
% of rp
contributed bycommongenetic/
environmentaleffects
Genetic/environmental
correlation
Chinese and ESL skills A C E A C E rA rC rE
Visual word recognition .55 .53 ns .02 96 ns 3 .90 ns .24
Receptive vocabulary .32 .15 .15 .00 47 47 ns 1 .24 ns
Phonological awareness .49 .27 .24 .00 54 46 ns 1 1 ns
Chinese tone awareness& ESL phonologicalawareness
.32 ns ns .00 ns ns ns ns ns ns
Phonological memory .37 .35 ns .00 94 ns ns .98 ns ns
Speech perception .52 .31 ns .19 59 ns 36 1 ns .29
Note. ns=nonsignificant pathway
154
cover letter, cover charge and cover story. To acquire such knowledge, second language
learners have to rely more on rote memorization of lexical information in non-interpersonal
settings (e.g. looking unfamiliar words up in a dictionary). Therefore, additional learning
skills (for instance, paired-associate learning skills) are necessary to compensate vocabulary
learning that supports word learning. Therefore, good reading skills in one language do not
necessarily lead to similar attainment in another language, as competition of time and
attentional resources might occur. Since there are commonalities of reading skills across
languages, reading skills in one language provide a reservoir of resources for the development
of reading skills in another language. Whether such relationship is explained by shared genes
or environment is indicated in my findings.
Genetic correlation and bivariate heritability indicate the cognitive overlap between
parallel Chinese and ESL reading skills. A high degree of genetic overlap and substantial
genetic contribution to the phenotypic link was evidenced in visual word recognition. In
Chinese societies, the ‘look-and-say’ and ‘look-and-copy’ learning methods have been
conventionally used in classroom and home learning. Copying is related to the establishment
of motor programs that lead to the formation of long-term motor memories of Chinese
characters (Tan, Spinks, Eden, Perfetti, & Siok, 2005). In Chinese culture, children’s
educational attainments are usually assessed with their direct fact retrieval skills (Chen &
Stevenson, 1989). This universal educational practice would restrict individual differences in
learning goals and style of learning. As a result, neural networks specialized for copying and
rote memorization are deployed to serve the learning needs of Chinese ESL children
collectively. In addition, great genetic overlap and moderate to strong genetic contributions to
the cross-linguistic phenotypic links were found for receptive vocabulary, phonological
awareness, phonological memory and speech perception. Therefore, various language and
reading skills in Chinese and ESL shared sources of genetic origins, supporting the molar
155
system of processing Chinese and ESL skills.
Common shared environmental origins across Chinese and ESL were found in
receptive vocabulary and phonological awareness. Around half of the phenotypic correlations
between Chinese and ESL receptive vocabulary, and between Chinese and ESL phonological
awareness, were explained by shared environmental influences. In other words, the
environment which influences vocabulary or phonological awareness acquisition in Chinese
could affect those in ESL, or vice versa. These common environmental influences could be
aspects of home literacy environment, such as parent-child reading and parental instructions.
For instance, parent-child reading enhanced both Chinese and English phonological
awareness in Chinese ESL children (Chow, McBride-Chang, & Cheung, 2010).
While phonological awareness in Chinese and ESL showed common genetic and
shared environmental origins, Chinese tone awareness and ESL phonological awareness
shared neither genetic nor environmental effects. The different results highlighted Chinese
lexical tone as a special characteristic in Chinese which English does not possess, and the
ability to distinguish and manipulate Chinese tone and English phonological units involve
different etiology. In the case of Chinese tone awareness, the detection of tone involves the
extraction of acoustic signals that specific the identity of a tone (e.g., fundamental frequency
at different levels and of different contours). In the case of ESL phonological awareness, the
detection of the acoustic boundary between sub-syllable units (e.g., consonant and vowels) of
an English syllable is involved. At the cognitive level, lexical tone is important to extract the
meaning of a Chinese syllable. A Chinese syllable in different tones (six tones in Cantonese)
represents different meanings and each of them is denoted by a different character. Though
some have argued that English stress was comparable to Chinese tone (Gauthier, Shi, & Xu,
2007), these two units are fundamentally different because Chinese tone conveys lexical
156
meaning but English stress does not. The significant and positive phenotypic correlation
between Chinese tone awareness and ESL phonological awareness may suggest similarity
between the mental operations of the two skills at the metalinguistic level. The mental
operations involve in the identification of phoneme constancy (e.g., the first sounds in ‘cat’
and ‘kite’ are the same: /k/) in English is likely to be equivalent to that of the identification of
tone constancy (e.g., the lexical tones of ‘father’ /ba1/ and ‘clothes’ /yi1/ are the same: high
level tone) in Chinese.
Last but not least, findings of genetic correlation have implications for studies that
search for genes influencing first and second language reading abilities and disabilities. It is
commonly acknowledged that many genes of small effect size, called quantitative trait loci
(QTLs; Plomin, Owen, & McGuffin, 1994), contribute to the heritability of individual
differences in complex cognitive traits such as reading. The genetic correlations of .90
between Chinese and ESL visual word recognition and phonological memory can be
interpreted as suggesting that some of the QTLs responsible for genetic effects on Chinese
reading are likely to have pleiotropic effects on ESL reading.
157
CHAPTER 8 LONGITUDINAL GENETIC ANALYSIS
8.1 Continuity and change of genetic and environmental effects
Learning to read is something that happens over time. During the course of reading
development, reading and related skills tend to remain stable (e.g. Catts, Adlof, Hogan, &
Weismer, 2005), but changes are also observed (e.g., Dale & Crain-Thorenson, 1999). The
underlying mechanisms of the stability and change have attracted a great deal of researchers’
attention, and one core area is determining the genetic and environmental contributions. The
stability of various reading skills may be contributed by consistent shared family and school
environmental influences and/or consistent genetic effects. Conversely, instability over time
may be a function of genetic expression or environment changes that respond to the different
demands in reading over time (Cherny et al., 2001).
Demands in reading change across time. Research examining the development of
reading skills has emphasized the distinction between young children who are “learning to
read,” as opposed to older children who are “reading to learn.” For example, Chall (1983)
argued that young children who are learning to read are primarily tasked with learning to read
words that are already present in their oral vocabulary. The main requirements of successfully
learning to read at this stage are phonological awareness, orthography, and visual–analytic
ability (see Dale & Crain-Thoreson, 1999). As reading skills mature, children are able to use
reading to learn new words and to integrate these words into their developing semantic
knowledge. From learning to read to reading to learn is a major milestone in children’s
reading development. This process requires the support of mastered skills in early stages and a
shift in the relative importance of various cognitive skills. Twin research has demonstrated
strong and stable genetic influences across learning to read to reading to learn (Harlaar, Dale,
& Plomin, 2007). The importance of genetic and shared environmental factors on various
reading skills across time have also been demonstrated, (e.g., Byrne et al., 2009; Petrill et al.,
2007).

158
There are a few longitudinal projects investigating the developmental etiology of
normal range development of reading and related skills, and they include: the International
Longitudinal Twin Study (ILTS) involving samples in Colorado, Australia, and Scandinavia,
the Twins Early Development Study (TEDS) and the Western Reserve Reading Project
(WRRP). These projects have involved children of different age ranges, focused on various
reading skills, and tapped these reading skills with different methods.
Despite these differences across projects, they have suggested converging research
findings. For instance, Wadsworth, Corley, Hewitt, Plomin, and DeFries (2002) reported
substantial genetic correlations between reading skills at three time points in the WRRP
sample, and they assessed participants when they were 7, 12, and 16 years of age on a single
measure of reading (i.e., PIAT Reading Recognition). Also, Byrne et al. (2005) found genetic
influences on the stability of reading skills, and they assessed children from preschool to
kindergarten on various reading and related measures, including preschool print knowledge,
preschool phonological awareness, and later oral reading fluency skills in kindergarten. The
roles of genetic influences on reading development have been demonstrated across studies.
However, findings specific to particular samples were also indicated. For instance, shared
environmental contributions to the stability of phonological awareness were found in Petrill et
al. (2007) with the WRRP sample, but not Byrne et al. (2005, 2006) with the ILTS sample.
In general, studies of these projects suggested genetic contributions to the stability
of reading and related skills, including word reading, receptive vocabulary, and phonological
awareness (e.g., Byrne et al., 2005; Byrne et al., 2009; Harlaar et al., 2007a; Petrill et al.,
2007), and shared environmental contributions to the stability of vocabulary knowledge
(Byrne et al., 2009, 2009; Petrill et al., 2007). In addition, new sources of genetic influences
emerged for word reading (Harlaar et al., 2007b; Petrill et al., 2007).
159
8.2 Longitudinal genetic analyses
In this thesis, twins were assessed across two measurement occasions 1 year apart.
The Cholesky decomposition method was used to examine the genetic and
environmental stabilities with the longitudinal data. The statistics logic was basically the same
with the Cholesky decomposition model utilized for the estimation of genetic overlap as in the
last chapter. The etiology of stability was estimated by comparing the cross-time similarity of
members of MZ and DZ twin pairs. If the cross-time MZ correlation (between one twin’s
score at the initial assessment and the other twin’s score at follow-up) is greater than the
cross-time DZ correlation, genetic stability will be indicated.
The cross-twin cross-time correlations between time 1 and 2 are shown in table 8.1.
Except for one pair of ESL speech perception correlations, the MZ correlations were
consistently larger than the DZ correlations, implying that genetic stabilities were likely to be
observed.
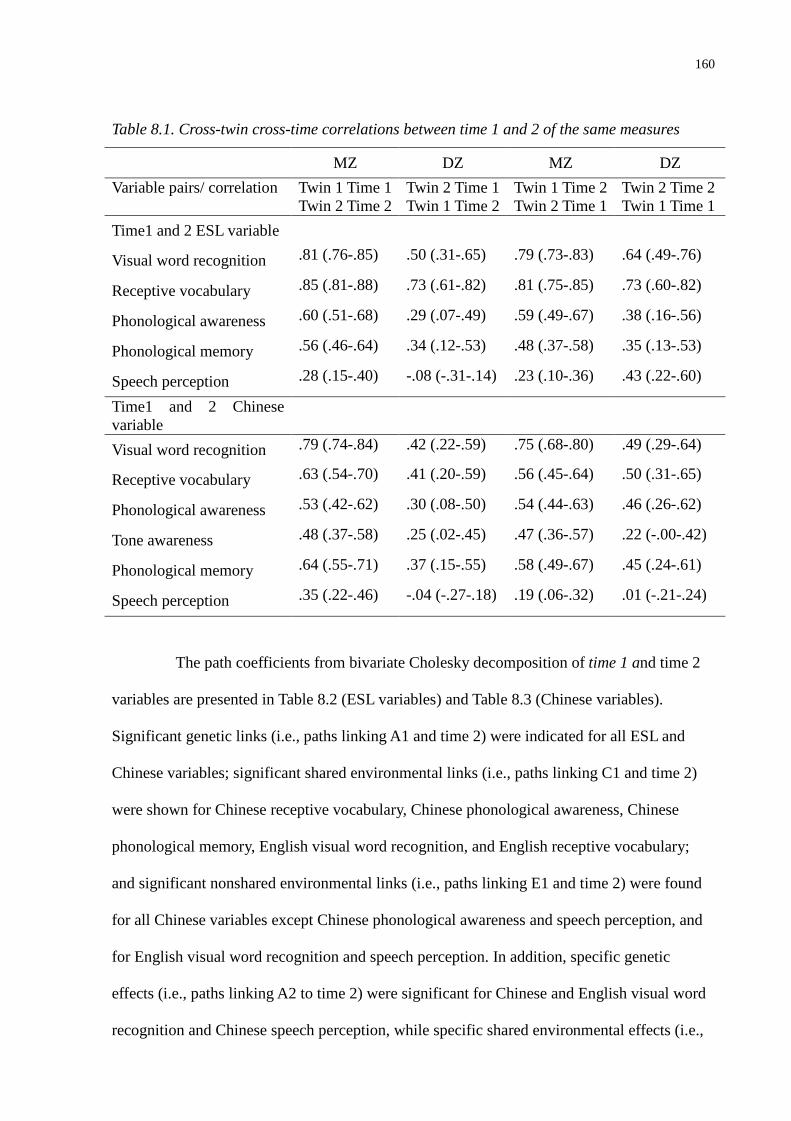
160
Table 8.1. Cross-twin cross-time correlations between time 1 and 2 of the same measures
MZ DZ MZ DZ
Variable pairs/ correlation Twin 1 Time 1Twin 2 Time 2
Twin 2 Time 1Twin 1 Time 2
Twin 1 Time 2Twin 2 Time 1
Twin 2 Time 2Twin 1 Time 1
Time1 and 2 ESL variable
Visual word recognition .81 (.76-.85) .50 (.31-.65) .79 (.73-.83) .64 (.49-.76)
Receptive vocabulary .85 (.81-.88) .73 (.61-.82) .81 (.75-.85) .73 (.60-.82)
Phonological awareness .60 (.51-.68) .29 (.07-.49) .59 (.49-.67) .38 (.16-.56)
Phonological memory .56 (.46-.64) .34 (.12-.53) .48 (.37-.58) .35 (.13-.53)
Speech perception .28 (.15-.40) -.08 (-.31-.14) .23 (.10-.36) .43 (.22-.60)
Time1 and 2 Chinesevariable
Visual word recognition .79 (.74-.84) .42 (.22-.59) .75 (.68-.80) .49 (.29-.64)
Receptive vocabulary .63 (.54-.70) .41 (.20-.59) .56 (.45-.64) .50 (.31-.65)
Phonological awareness .53 (.42-.62) .30 (.08-.50) .54 (.44-.63) .46 (.26-.62)
Tone awareness .48 (.37-.58) .25 (.02-.45) .47 (.36-.57) .22 (-.00-.42)
Phonological memory .64 (.55-.71) .37 (.15-.55) .58 (.49-.67) .45 (.24-.61)
Speech perception .35 (.22-.46) -.04 (-.27-.18) .19 (.06-.32) .01 (-.21-.24)
The path coefficients from bivariate Cholesky decomposition of time 1 and time 2
variables are presented in Table 8.2 (ESL variables) and Table 8.3 (Chinese variables).
Significant genetic links (i.e., paths linking A1 and time 2) were indicated for all ESL and
Chinese variables; significant shared environmental links (i.e., paths linking C1 and time 2)
were shown for Chinese receptive vocabulary, Chinese phonological awareness, Chinese
phonological memory, English visual word recognition, and English receptive vocabulary;
and significant nonshared environmental links (i.e., paths linking E1 and time 2) were found
for all Chinese variables except Chinese phonological awareness and speech perception, and
for English visual word recognition and speech perception. In addition, specific genetic
effects (i.e., paths linking A2 to time 2) were significant for Chinese and English visual word
recognition and Chinese speech perception, while specific shared environmental effects (i.e.,
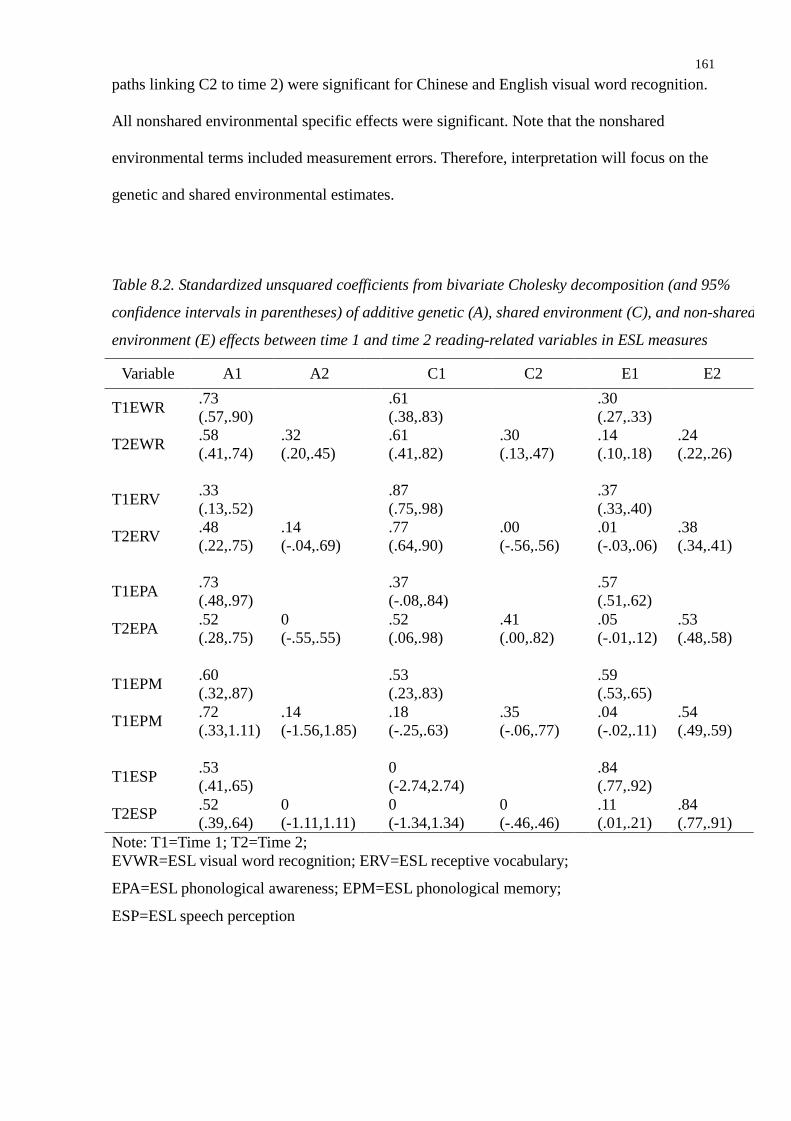
161
paths linking C2 to time 2) were significant for Chinese and English visual word recognition.
All nonshared environmental specific effects were significant. Note that the nonshared
environmental terms included measurement errors. Therefore, interpretation will focus on the
genetic and shared environmental estimates.
Table 8.2. Standardized unsquared coefficients from bivariate Cholesky decomposition (and 95%
confidence intervals in parentheses) of additive genetic (A), shared environment (C), and non-shared
environment (E) effects between time 1 and time 2 reading-related variables in ESL measures
Variable A1 A2 C1 C2 E1 E2
T1EWR.73(.57,.90)
.61(.38,.83)
.30(.27,.33)
T2EWR.58(.41,.74)
.32(.20,.45)
.61(.41,.82)
.30(.13,.47)
.14(.10,.18)
.24(.22,.26)
T1ERV.33(.13,.52)
.87(.75,.98)
.37(.33,.40)
T2ERV.48(.22,.75)
.14(-.04,.69)
.77(.64,.90)
.00(-.56,.56)
.01(-.03,.06)
.38(.34,.41)
T1EPA.73(.48,.97)
.37(-.08,.84)
.57(.51,.62)
T2EPA.52(.28,.75)
0(-.55,.55)
.52(.06,.98)
.41(.00,.82)
.05(-.01,.12)
.53(.48,.58)
T1EPM.60(.32,.87)
.53(.23,.83)
.59(.53,.65)
T1EPM.72(.33,1.11)
.14(-1.56,1.85)
.18(-.25,.63)
.35(-.06,.77)
.04(-.02,.11)
.54(.49,.59)
T1ESP.53(.41,.65)
0(-2.74,2.74)
.84(.77,.92)
T2ESP.52(.39,.64)
0(-1.11,1.11)
0(-1.34,1.34)
0(-.46,.46)
.11(.01,.21)
.84(.77,.91)
Note: T1=Time 1; T2=Time 2;EVWR=ESL visual word recognition; ERV=ESL receptive vocabulary;
EPA=ESL phonological awareness; EPM=ESL phonological memory;
ESP=ESL speech perception
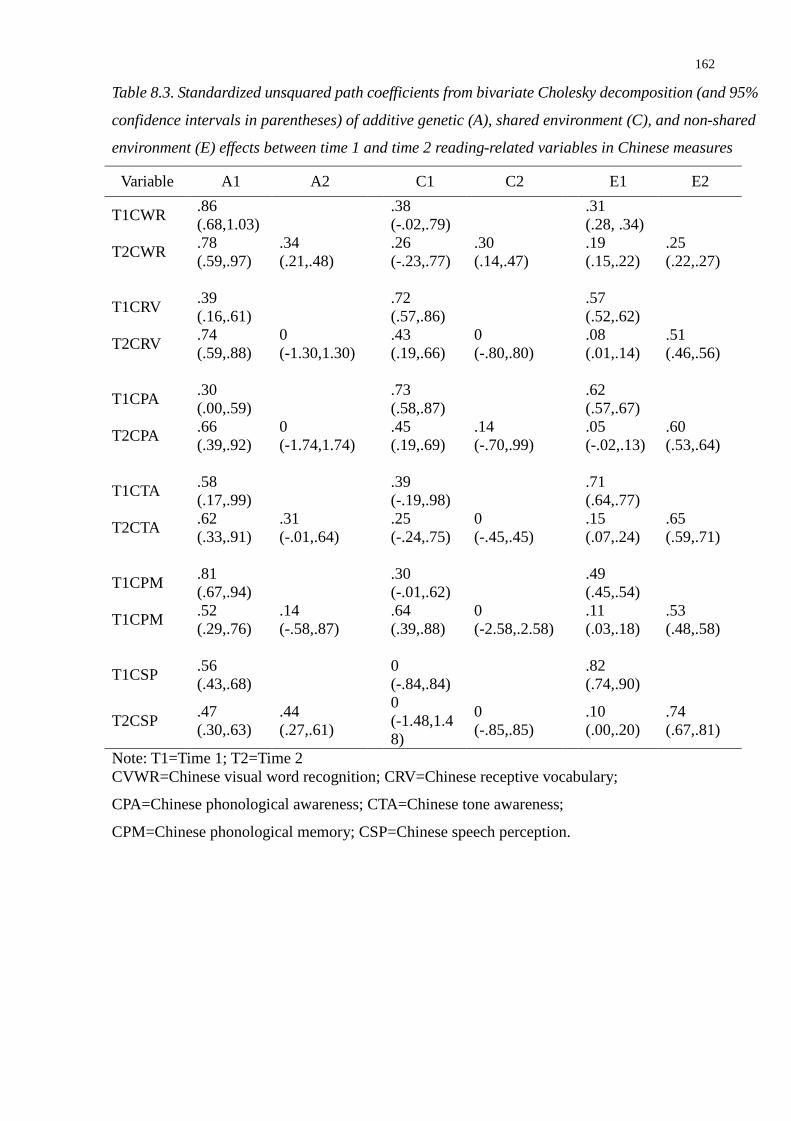
162
Table 8.3. Standardized unsquared path coefficients from bivariate Cholesky decomposition (and 95%
confidence intervals in parentheses) of additive genetic (A), shared environment (C), and non-shared
environment (E) effects between time 1 and time 2 reading-related variables in Chinese measures
Variable A1 A2 C1 C2 E1 E2
T1CWR.86(.68,1.03)
.38(-.02,.79)
.31(.28, .34)
T2CWR.78(.59,.97)
.34(.21,.48)
.26(-.23,.77)
.30(.14,.47)
.19(.15,.22)
.25(.22,.27)
T1CRV.39(.16,.61)
.72(.57,.86)
.57(.52,.62)
T2CRV.74(.59,.88)
0(-1.30,1.30)
.43(.19,.66)
0(-.80,.80)
.08(.01,.14)
.51(.46,.56)
T1CPA.30(.00,.59)
.73(.58,.87)
.62(.57,.67)
T2CPA.66(.39,.92)
0(-1.74,1.74)
.45(.19,.69)
.14(-.70,.99)
.05(-.02,.13)
.60(.53,.64)
T1CTA.58(.17,.99)
.39(-.19,.98)
.71(.64,.77)
T2CTA.62(.33,.91)
.31(-.01,.64)
.25(-.24,.75)
0(-.45,.45)
.15(.07,.24)
.65(.59,.71)
T1CPM.81(.67,.94)
.30(-.01,.62)
.49(.45,.54)
T1CPM.52(.29,.76)
.14(-.58,.87)
.64(.39,.88)
0(-2.58,.2.58)
.11(.03,.18)
.53(.48,.58)
T1CSP.56(.43,.68)
0(-.84,.84)
.82(.74,.90)
T2CSP.47(.30,.63)
.44(.27,.61)
0(-1.48,1.48)
0(-.85,.85)
.10(.00,.20)
.74(.67,.81)
Note: T1=Time 1; T2=Time 2CVWR=Chinese visual word recognition; CRV=Chinese receptive vocabulary;
CPA=Chinese phonological awareness; CTA=Chinese tone awareness;
CPM=Chinese phonological memory; CSP=Chinese speech perception.
163
At the phenotypic level, the performances at time 1 correlated significantly with that
of time 2 (r ranged from .34 to .84; see Table 8.4). Among the ESL measures, the cross-time
phenotypic correlations of visual word recognition and receptive vocabulary were high, those
of phonological memory and phonological awareness were moderate and that of speech
perception was modest. Similar patterns were observed in Chinese measures, except that a
moderate correlation between time 1 and 2 Chinese receptive vocabulary was identified.
Chinese tone awareness correlated moderately across time 1 and time 2.
The genetic and shared environmental correlations were computed for the
aforementioned significant genetic and shared environmental paths to understand the extent of
overlap (see Tables 8.2 and 8.3). As shown in Table 8.4, genetic factors mediated continuity
from time 1 to 2 for all the measures except Chinese phonological awareness. Except for
Chinese phonological awareness, the genetic correlations were strong for various variables,
ranging from .72 to 1.0 In other words, 72% to all genetic factors at time 1 overlapped with
those at time 2 for various Chinese and ESL variables. Also, strong shared environmental
correlations were found in ESL visual word recognition, ESL receptive vocabulary, Chinese
receptive vocabulary and Chinese phonological awareness, varied from .89 to 1.0. Therefore,
89% to all shared environmental factors at time 1 overlapped with those at time 2 for these
variables.

164
Table 8.4. Summary of three indexes yielded from bivariate twin analyses
rp
Time
1-2
Common genetic/environmental
effects
Specificgenetic/
environmentaleffects
Genetic/environmental
correlation
A C E A C E rA rC rE
Time 1 and 2 ESL variable
Visual word recognition .84 .42 .37 .04 .10 .09 .05 .87 .89 .50
Receptive vocabulary .83 .15 .66 ns ns ns .14 .96 1 ns
Phonological awareness .60 .37 ns ns ns ns .28 1 ns ns
Phonological memory .56 .43 ns ns ns ns .29 .98 ns ns
Speech perception .37 .27 ns .09 ns ns .70 1 ns .13
Time 1 and 2 Chinese variable A C E A C E rA rC rE
Visual word recognition .84 .67 ns .05 .11 .09 .06 .91 ns .60
Receptive vocabulary .63 .29 .31 .05 ns ns .26 1 1 .15
Phonological awareness .55 ns .33 ns ns ns .36 ns .94 ns
Tone awareness .57 .35 ns .10 ns ns .42 .89 ns .23
Phonological memory .67 .42 ns .05 ns ns .28 .96 ns .20
Speech perception .34 .26 ns ns .19 ns .54 .72 ns ns
Note. ns=nonsignificant pathway
8.3 Discussion of the results
Results indicated that genetic factors contributed to the stability across time for all
Chinese and ESL variables, except Chinese phonological awareness. Consistent with past
research on learning English as a mother tongue, genetic effects play an important role in the
consistency of reading and related skills across time (e.g., Byrne et al., 2005, 2009; Harlaar et
al., 2007a; Hart, Petrill, DeThorne, et al., 2009; Petrill et al., 2007; Samuelsson et al., 2008).
Shared environment contributed to the stability across time for Chinese and ESL receptive

165
vocabulary, ESL visual word recognition, and Chinese phonological awareness. These shared
environmental effects on vocabulary knowledge were found in past research (Byrne et al.,
2009; Hart, Petrill, DeThorne, et al., 2009; Petrill et al., 2007). However, it is interesting to
note the shared environmental effects on ESL visual word recognition but not Chinese visual
word recognition in this study. Past studies have demonstrated genetic influences on ESL
visual word recognition (e.g., Byrne et al., 2005; Harlaar et al., 2007a; Petrill et al., 2007;
Samuelsson et al., 2008). Environmental overlap on reading ability was shown in a study
(Harlaar et al., 2007b), but reading skills were assessed by teachers’ ratings, and twins in the
same classroom were even assessed by the same teacher in their research, and thus the shared
environmental link might be inflated. These results could reflect the different etiology of
visual word recognition in mother tongue and second language acquisition. Further research is
warranted to confirm the results.
In addition, shared environmental effects but not genetic influences contributed to
the continuity in Chinese phonological awareness . It was inconsistent to past research
findings on English as a mother tongue which showed the genetic mediation in the stability of
phonological awareness, though mixed evidence on the shared environmental mediation was
obtained (e.g., Byrne et al., 2005, 2006; Petrill et al., 2007). Also, no significant shared
environmental link was found for ESL phonological awareness in this thesis. Putting these
results together, it seems the learning ecology of Chinese is relatively stable comparing to that
of ESL. In Hong Kong, increasingly more parents send their children to English-speaking
countries to attend summer schools or intensive courses. Moreover, children have more
opportunities to participate in exchange programmes in foreign countries organized by the
schools. Therefore, the Chinese ESL learners can acquire new peer groups and exposure to
more varieties of English. These new learning experiences could contribute to the instability
in shared environmental influences.

166
Apart from the stability, new sources of genetic and shared environmental effects
emerged for Chinese and ESL visual word recognition, and new sources of genetic influences
emerged for Chinese speech perception. These results reflect the change in cognitive demands
in both Chinese and ESL reading across time, which are best described in Ehri (1995) ’s
model of four phases of reading development. For reading English, beginning readers at the
pre-alphabetic phase look for salient visual cues and connect them to meanings by rote
learning. Progressing to the partial alphabetic phase, through the full alphabetic phase to the
consolidated alphabetic phase, learners are trying to discover the regularities between the
graphical and phonological units of the language. Similar developmental phases have been
observed in Chinese reading acquisition (Ho & Bryant, 1997). The emergent of new genetic
and shared environmental effects on Chinese and ESL reading may be a response to new
learning skills demanded at a new phase of development. As smaller speech units of Chinese
language (consonants and vowels) are introduced in Pinyin class to the children, the new
genetic influences on Chinese speech perception may then come into play in response to a
new learning demand. It would be worthwhile to follow the child participants to further
examine the continuity and discontinuity of the genetic and environmental estimates.
The emergence of new genetic effects at time 2 for ESL and Chinese visual word
recognition may reflect enhanced self-directed learning abilities. When a novice reader starts
learning to read, his reading activities are mostly guided by external factors. For example, the
books the child reads are assigned or recommended by teachers or parents. The words the
child pays attention to are those explicitly taught by teachers based on the syllabus or read by
parents. When the child has mastered a satisfactory level of proficiency and knows how to
access different sources of printed materials, he becomes a self-directed learner. Then, he can
choose from the library, bookshop or internet what he wants to read and then how much time
he wants to invest on reading activities. This learning trajectory has been framed as a shift
from the stage of ‘learning to read’ to ‘reading to learn’ (Chall, 1983). Previous studies have

167
tested the differences in heritability estimates across two stages. In fact, similar etiologies
were found in reading achievement at 7, 9, 10 of years of age (Harlaar, Dale, & Plomin, 2007).
It may be because the self-directed learners’ learning ecologies in the two learning stages
were similar. In contrast, the progression from ‘learning to read’ to ‘reading to learn’ in a
second language would induce a change in the learners’ learning ecology. Being able to read a
second language not only allows the learners to understand the meaning of the language itself,
but get in touch with a new culture and a new community of speakers. The ESL learning
ecology was extended from classroom to chat-rooms, online forums, newsgroups or blogs on
the internet which link English speakers and users from all over the world. Therefore, the
environmental range becomes larger and the heritability estimates reduce accordingly.
168
CHAPTER 9 GENERAL DISCUSSION
Since our writing system represents our spoken language and the aim of reading is
to decode the message conveyed by our speech, the linkage between reading and speech
perception has been thought to be close. Traditionally, reading researchers have focused very
much on the individual differences and learning mechanisms in different aspects of reading.
Although speech perception has been widely studied, the investigative focus is the nature of
speech perception deficits in developmental dyslexia. On the other hand, speech perception
has been a long standing interest for linguists and computer scientists who are interested in
the nature of speech perception, without attending much to individual variations in this skill.
In the last decade, more research has been reported regarding the relationship
between speech perception and reading owing to the quest for the ontogeny of phonological
skills and more multi-disciplinary collaborations. Extending from investigations of reading,
phonological skills and speech perception at the behavioural and cognitive levels, this thesis
studied the etiology of these skills with a special focus on second language reading
acquisition.
In terms of methodology, this thesis has made the first ever attempt to measure
reading and reading-related skills in two languages among twin children who read a
logographic script (Chinese) and learn to read an alphabetic script (English). From the
perspective of behavioural genetics, the sample size of this thesis is not optimal. However, a
sample of this size is sufficient for Path analysis using a structural equation modelling (SEM)
approach. Therefore, collection of twin data allows us to fulfil two goals simultaneously:
estimating heritability and testing SEM structural models. This data collection strategy is
recommended for future research, though the generaliziability of the twin findings to the
wider population needs to be verified.
169
In clarifying the unique role each skill plays in visual word recognition
development, I adopted the component skills analysis (CSA) approach and made reference to
four conventional views of reading and phonology development and then postulated four
testable hypothetical developmental models. By using SEM in a ‘model generating’ manner,
noteworthy findings were yielded. As the models were based on previous research on English
reading of native English speakers, cross-linguistic comparisons could be made. First, ESL
variables alone can account for the variance in ESL visual word recognition, confirming
previous observations that L2 print input is a dominant force in shaping reading sub-skills in
that language and its impact overrides the impacts produced by L1 experience (Koda, 2007).
Second, the strong and significant causal link from ESL receptive vocabulary to ESL visual
word recognition highlights the meaning-based learning in ESL reading development,
especially if no cognate is shared between two languages as in Chinese and English. Third,
ESL speech perception contributes to ESL visual word recognition through multiple pathways.
The effects of speech perception on reading may have been overshadowed because the effects
were not direct but mediated by phonologically-related skills such as phonological awareness,
phonological memory and receptive vocabulary. This finding further encourages researchers
to study speech perception and reading in normative development. Fourth, it is worth noting
the bidirectional relationship between ESL phonological memory and ESL phonological
awareness for theoretical and practical reasons. Theoretically, this significant mutual
transaction between two core phonological skills may imply that the development of the two
skills is not linear. In regard to growth, an exponential increase would be expected.
Concerning underdeveloped phonological skills, it is likely that one phonological skill has a
detrimental effect on the other and vice versa. For therapists and educators, early
identification and training of two core phonological skills concurrently without neglecting
either one is essential for the prevention and remediation of reading disabilities. Everyone
must love to see the positive ‘Snowball’ but not the negative ‘Matthew’ effects (Stanovich,
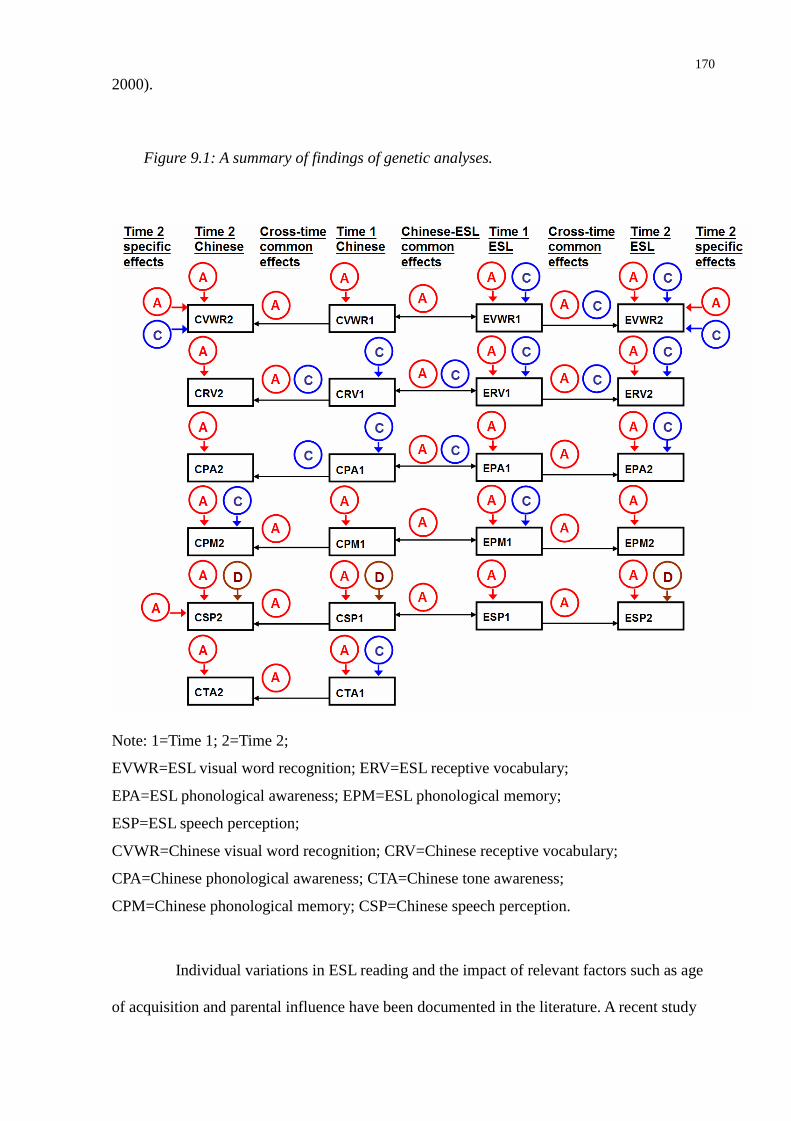
170
2000).
Figure 9.1: A summary of findings of genetic analyses.
Note: 1=Time 1; 2=Time 2;
EVWR=ESL visual word recognition; ERV=ESL receptive vocabulary;
EPA=ESL phonological awareness; EPM=ESL phonological memory;
ESP=ESL speech perception;
CVWR=Chinese visual word recognition; CRV=Chinese receptive vocabulary;
CPA=Chinese phonological awareness; CTA=Chinese tone awareness;
CPM=Chinese phonological memory; CSP=Chinese speech perception.
Individual variations in ESL reading and the impact of relevant factors such as age
of acquisition and parental influence have been documented in the literature. A recent study

171
on second language acquisition indicated that genetic factors are prominent for L2 learning
(Petrill et al., 2010). This thesis provides further evidence for this claim and shows the size of
genetic and environmental influences on measured reading and its related skills. The findings
led to some speculations about causal mechanisms. First, the environmental influences could
reflect the way in which a skill is learnt. For example, incidental learning is essential to
enhance the breath and depth of vocabulary knowledge, and this could explain why the shared
environmental factor is important in explaining the variance of this skill. And, due to the
interpersonal nature of conversation, ESL learners’ exposure to spoken English depends on
whom they meet and how much conversation is engaged. As speech is intangible and
interpersonal relationship is subject to a ‘talker and listener’ context, different communicative
experiences could explain why nonshared environment becomes a more important factor in
explaining speech perception. For phonological awareness, as its performances are largely
dependent on training, shared environmental effects are salient in this skill. Second,
nonadditive genetic effects were observed in ESL and Chinese speech perception. This leads
to a possibility that speech perception is an emergenic trait which depends on the
configuration of polygenic genes. At the behavioural level, it has been suggested that the
individual differences of an emergent trait would not be normally distributed. If it is true, we
need to refine our measurement and statistical approach to categorized typical and atypical
development of speech perception. More studies of speech perception with a sample in a
narrow age range are recommended. At the etiological level, further studies on whether ESL
speech and musical pitch perceptions share a common etiology would enable us to have a
better understanding of the whole auditory system.
Bivariate Cholesky decomposition twin analyses were applied to examine the issues
of genetic overlap and genetic stability.
172
High genetic correlations between ESL and Chinese skills were consistently
observed for all variables. These implicate the existence of common underlying cognitive
processes and a high overlap of neural networks that serve ESL and Chinese processing.
Moreover, high genetic overlap also consolidates the contemporary interpretation of
cross-linguistic transfer which suggests that L1 background provides a reservoir of resources
for L2 learning. Among Chinese ESL learners, the conventional ‘look-and-say’ and
‘look-and-copy’ learning methods would have been applied equally in handling ESL and
Chinese learning tasks. However, significant common shared environmental effects on
Chinese and ESL receptive vocabulary and phonological awareness should not be overlooked.
On one hand, the findings suggest that linguistic environment and literacy activities important
to one language are facilitative to another language. On the other hand, the findings that
Chinese tone awareness and ESL phonological awareness shared neither genetic nor
environmental effects reminds us to be aware that ESL and Chinese respond differentially to
the learning environment. Therefore, a tailor-made teaching programme is critical to success
in ESL learning, especially in a non total-immersion English speaking environment.
As indicated in the chronosystem of the ecological theory, time is prominent in
human development. As shown in my findings, the genetic, shared and nonshared
environmental influences were not entirely stable after 1 year of time. This is not a surprising
result given that reading is a complex skill and changes over time. The new genetic effects
detected in ESL and Chinese visual word recognition at time 2 may reflect an enhancement in
self-learning abilities. The heightening of this skill not only fosters better reading skills but
implies that the learners are potentially self-motivated learners. Furthermore, the continuity
itself may imply the timing of gene expressions; also, it sheds light on the important issue
‘nature of nurture’. By referring to the results, we can better understand if a stimulating or
deprived linguistic environment changes or remains unchanged over time. However, as the
173
age range in this thesis was broad, this would make it difficult to detect changes in genetic or
environmental effects that occurred at a specific age point. The wide age range of this sample
also limits the inference of temporal causality in the longitudinal design. Children at different
ages may be at different stage of language and reading development. There may be qualitative
differences among children at different developmental stages. Children being born and raised
in a particular time and situation may have unique experiences (cohort effects). The testing of
twin models on a sample made up of children in different cohorts would affect the estimation
of environmental effects.
Through the whole research process, I have devoted great effort to maintain the
validity and reliability of the study. There are some uncontrollable factors that lead to several
caveats. First of all, without a well-established twin database, it is difficult to establish the
actual MZ/DZ twin ratio in Hong Kong. An imbalanced number of MZ and DZ twins were
recruited and this would affect the accuracy of heritability estimates. Also, the availability of
twins is an issue. Though the minimal sample size requirement is marginally met, the
restricted sample limits the statistical power, especially for multivariate twin analyses, and
made it impractible to do analyses to detect gender effects. To recruit an adequate sample size
it was necessary to have a sample spanning a large age range, which limits the arguments
centred on developmental change. For future development in behavioural genetics, it would
be worth establishing a twin registry. Second, given limited labour force and time, only single
measures were administered for each construct. In future studies, it would be worth including
multiple measures for a construct to minimize the measurement errors. In future research,
researchers could consider researching other aspects of language and reading abilities such as
reading comprehension, reading fluency, syntactic skills, orthographic processing, etc.
To conclude, this thesis has illustrated that ESL reading is a multi-componential

174
system at the behavioural and cognitive levels. Speech perception, phonological awareness,
phonological memory and receptive vocabulary interact with each other and contribute
significantly to visual word recognition. Reading acquisition in a second language has been
shown empirically to be a heritable trait though also influenced by shared and nonshared
environment. Although the interplay between ESL and Chinese in the course of
developmental is still unknown, it has been shown in this thesis that ESL and Chinese skills
overlap partially but significantly in terms of shared functions and etiology.
175
REFERENCES
Adams, M. (1990). Beginning to read: Thinking and learning about print. Cambridge, MA:
MIT Press.
Akaike, H. (1987). Factor analysis and AIC. Psychometrika, 52(3), 317-332.
Anderson, B., Southern, B. D., & Powers, R. E. (1999). Anatomic asymmetries of the
posterior superior temporal lobes: A postmortem study. Cognitive and Behavioral
Neurology, 12(4), 247-254.
Anderson, J. L., Morgan, J. L., & White, K. S. (2003). A statistical basis for speech sound
discrimination. Language and Speech, 46(2-3), 155-182.
Anthony, J., Williams, J., Aghara, R., Dunkelberger, M., Novak, B., & Mukherjee, A. (2010).
Assessment of individual differences in phonological representation. Reading and
Writing: An Interdisciplinary Journal, 23(8), 969-994.
Arbuckle, J. L. (2006). Amos (version 16.0) [computer program]. Chicago: SPSS.
Aslin, R., & Smith, L. (1988). Perceptual development. Annual Review of Psychology, 39,
435-474.
Atkinson, R. C. (1975). Mnemotechnics in second-language learning. American Psychologist,
30(8), 821-828.
August, D., & Shanahan, T. (2006). Developing literacy in second-language learners: Report
of the national literacy panel on language-minority children and youth. Mahwah, NJ:
Erlbaum.
Baddeley, A. D. (1986). Working memory. Oxford, UK: Oxford University Press.
176
Baharloo, S., Johnston, P. A., Service, S. K., Gitschier, J., & Freimer, N. B. (1998). Absolute
pitch: An approach for identification of genetic and nongenetic components. American
Journal of Human Genetics, 62(2) 224-231.
Baker, C. (2004). Behavioral genetics: An introduction to how genes and environments
interact through development to shape differences in mood, personality, and intelligence.
Washington, DC: AAAS Publication Services.
Bentler, P. M. (1990). Comparative fit indexes in structural models. Psychological Bulletin,
107(2), 238-246.
Best, C. (1995). A direct realist view of cross-language speech. In W. Strange (Ed.), Speech
perception and linguistic experience (pp. 171-204). Baltimore: York Press.
Bialystok, E. (2007). Acquisition of literacy in bilingual children: A framework for research.
Language Learning, 57, 45-77.
Bialystok, E., & Herman, J. (1999). Does bilingualism matter for early literacy?. Bilingualism:
Language and Cognition, 2, 35-44.
Bialystok, E., & Miller, B. (1999). The problem of age in second-language acquisition:
Influences from language, structure, and task. Bilingualism: Language and Cognition,
2(2), 127-145.
Bialystok, E., Luk, G., & Kwan, E. (2005). Bilingualism, biliteracy, and learning to read:
Interactions among languages and writing systems. Scientific Studies of Reading, 9(1),
43.
177
Bialystok, E., McBride-Chang, C., & Luk, G. (2005). Bilingualism, language proficiency, and
learning to read in two writing systems. Journal of Educational Psychology, 97(4),
580-590.
Biemiller, A., & Slonim, N. (2001). Estimating root word vocabulary growth in normative
and advantaged populations: Evidence for a common sequence of vocabulary acquisition.
Journal of Educational Psychology, 93(3), 498-520.
Birdsong, D. (1999). Whys and why nots of the critical period hypothesis for second language.
In D. Birdsong (Ed.), Second language acquisition and the critical period hypothesis (pp.
1-21). Mahwah, New Jersey London: Lawrence Erlbaum Publishers.
Bishop, D. V. M. (2001). Uncommon understanding: Development and disorders of language
comprehension in children (Reprinted ed.). East Sussex: Psychology Press Ltd.
Bishop, D. V. M., & Snowling, M. J. (2004). Developmental dyslexia and specific language
impairment: Same or different? Psychological Bulletin, 130(6), 858-886.
Bishop, D. V. M., Adams, C. V., Nation, K., & Rosen, S. (2005). Perception of transient
nonspeech stimuli is normal in specific language impairment: Evidence from glide
discrimination. Applied Psycholinguistics, 26(2), 175-194.
Boets, B., Wouters, J., van Wieringen, A., De Smedt, B., & Ghesquiere, P. (2008). Modelling
relations between sensory processing, speech perception, orthographic and phonological
ability, and literacy achievement. Brain and Language, 106(1), 29-40.
Borkenau, P., Riemann, R., Angleitner, A., & Spinath, F. M. (2002). Similarity of childhood
experiences and personality resemblance in monozygotic and dizygotic twins: A test of
the equal environments assumption. Personality and Individual Differences, 33, 261-269.

178
Bowey, J. A., & Rutherford, J. (2007). Imbalanced word-reading profiles in eighth-graders.
Journal of Experimental Child Psychology, 96(3), 169-196.
Bradley, L., & Bryant, P. (1983). Categorising sounds and learning to read—A causal
connection. Nature, 301, 419-521.
Brady, S. A. (1997). Ability to encode phonological representations: An underlying difficulty
of poor readers. In B. Blachman (Ed.), Foundations of reading acquisition and dyslexia:
Implications for early intervention (pp. 21-48). Mahwah, New Jersey: Lawrence Erlbaum
Associates.
Brady, S., Fowler, A., Stone, B., & Winbury, N. (1994). Training phonological awareness: A
study with inner-city kindergarten children. Annals of Dyslexia, 44(1), 26-59.
Braun, W. J., & Murdoch, D. J. (2007). A first course in statistical programming with R. New
York: Cambridge University press.
Bronfenbrenner, U. (1979). Ecology of human development. Cambridge, MA: Harvard
University Press.
Bronfenbrenner, U., & Morris, P. A. (2006). The bioecological model of human development.
In W. Damon, & R. M. Lerner (Eds.), Theoretical models of human development. volume
1 of handbook of child psychology (6th ed., ). Hoboken, NJ: Wiley.
Brown, C. (2000). The interrelation between speech perception and phonological acquisition
from infant to adult. In J. Archibald (Ed.), Second language acquisition and linguistic
theory (pp. 4-63). Massachusetts, USA: Blackwell.
Brownell, R. (2000). Expressive one-word picture vocabulary test (3rd ed.). Novato, CA:
Academic Therapy Publications.
179
Bryant, P. E., Maclean, M., & Bradley, L. L. (1990). Rhyme, language, and children’s reading.
Applied Psycholinguistics, 11, 237-252.
Bryant, P. E., MacLean, M., Bradley, L. L., & Crossland, J. (1990). Rhyme and alliteration,
phoneme detection, and learning to read. Developmental Psychology, 26(3), 429-438.
Butcher, L. M., Meaburn, E., Knight, J., Sham, P. C., Schalkwyk, L. C., Craig, I. W., et al.
(2005). SNPs, microarrays and pooled DNA: Identification of four loci associated with
mild mental impairment in a sample of 6000 children. Human Molecular Genetics,
14(10), 1315-1325.
Byrne, B. M. (2010). Structural equation modeling with AMOS: Basic concepts, applications
and programming (2nd ed.). New York: Routledge Academic.
Byrne, B., Coventry, W. L., Olson, R. K., Samuelsson, S., Corley, R., Willcutt, E. G., et al.
(2009). Genetic and environmental influences on aspects of literacy and language in early
childhood: Continuity and change from preschool to grade 2. Journal of Neurolinguistics,
22(3), 219-236.
Byrne, B., Delaland, C., Fielding-Barnsley, R., Quain, P., Samuelsson, S., Høien, T., et al.
(2002). Longitudinal twin study of early reading development in three countries:
Preliminary results. Annals of Dyslexia, 52(1), 47-73.
Byrne, B., Olson, R. K., Samuelsson, S., Wadsworth, S., Corley, R., DeFries, J. C., et al.
(2006). Genetic and environmental influences on early literacy. Journal of Research in
Reading, 29(1), 33-49.
Byrne, B., Wadsworth, S., Corley, R., Samuelsson, S., Quain, P., DeFries, J. C., et al. (2005).
Longitudinal twin study of early literacy development: Preschool and kindergarten
phases. Scientific Studies of Reading, 9(3), 219-235.
180
Calfee, R. C., Lindamood, P., & Lindamood, C. (1973). Acoustic-phonetic skills and reading:
Kindergarten through twelfth grade. Journal of Educational Psychology, 64(3), 293-298.
Callan, D. E., Jones, J. A., Callan, A. M., & Akahane-Yamada, R. (2004). Phonetic perceptual
identification by native- and second-language speakers differentially activates brain
regions involved with acoustic phonetic processing and those involved with
articulatory–auditory/orosensory internal models. NeuroImage, 22(3), 1182-1194.
Carr, T. H., Brown, T. L., & Vavrus, L. G. (1985). Using component skills analysis to
integrate findings on reading development. New Directions for Child and Adolescent
Development, 1985(27), 95-108.
Castles, A., & Coltheart, M. (2004). Is there a causal link from phonological awareness to
success in learning to read? Cognition, 91(1), 77-111.
Catts, H. W., Adlof, S. M., Hogan, T. P., & Weismer, S. E. (2005). Are specific language
impairment and dyslexia distinct disorders? Journal of Speech, Language, and Hearing
Research, 48(6), 1378-1396.
Chall, J. (1983). Stages of reading development. New York: McGraw-Hill.
Chall, J. (1987). Two vocabularies for reading: Recognition and meaning. In M. McKeown,
& M. Curtis (Eds.), The nature of vocabulary acquisition (pp. 7-18). Hillsdale, NJ:
Erlbaum.
Chambers, K. E., Onishi, K. H., & Fisher, C. (2003). Infants learn phonotactic regularities
from brief auditory experience. Cognition, 87(2), B69-B77.
Chan, A. Y. W. (2006). Cantonese ESL learners' pronunciation of English final consonants.
Language, Culture and Curriculum, 19(3), 296-313.
181
Chan, A. Y. W., & Li, D. C. S. (2000). English and cantonese phonology in
contrast:Explaining cantonese ESL learners’ English pronunciation problems. Language,
Culture and Curriculum, 13(1), 67-85.
Chaney, C. (1992). Language development, metalinguistic skills, and print awareness in
3-year-old children. Applied Psycholinguistics, 13(04), 485.
Chaney, C. (1994). Language development, metalinguistic awareness, and emergent literacy
skills of 3-year-old children in relation to social class. Applied Psycholinguistics, 15(3),
371.
Chee, M. W. L., Hon, N., Lee, H. L., & Soon, C. S. (2001). Relative language proficiency
modulates BOLD signal change when bilinguals perform semantic judgments.
NeuroImage, 13(6), 1155-1163.
Chen, C., & Stevenson, H. W. (1989). Homework: A cross-cultural examination. Child
Development, 60(3), 551-561.
Chen, X., Ku, Y.-M., Koyama, E., Anderson, R., & Li, W. (2008). Development of
phonological awareness in bilingual Chinese children. Journal of Psycholinguistic
Research, 37, 405–418.
Cherny, S. S. (2005). Cholesky decomposition. In B. S. Everitt, & D. C. Howell (Eds.),
Encyclopedia of statistics in behavioral science (1st ed., pp. 262-263). Chichester, UK:
John Wiley & Sons.
Cherny, S. S., Fulker, D. W., Emde, R. N., Plomin, R., Corley, R. P., & DeFries, J. C. (2001).
Continuity and change in general cognitive ability from 14 to 36 months. In R. Emde, &
J. Hewitt (Eds.), Infancy to early childhood: Genetic and environmental influences on
developmental change (pp. 206-220). New York: Oxford University Press.
182
Cheung, H. (1996). Nonword span as a unique predictor of second-language vocabulary
language. Developmental Psychology, 32(5), 867-873.
Cheung, H., Chung, K. K. H., Wong, S. W. L., McBride-Chang, C., Penney, T. B., & Ho, C.
S.-H. (2010). Speech perception, metalinguistic awareness, reading, and vocabulary in
Chinese–English bilingual children. Journal of Educational Psychology, 102(2),
367-380.
Chiappe, P., & Siegel, L. S. (1999). Phonological awareness and reading acquisition in
English- and punjabi-speaking canadian children. Journal of Educational Psychology,
91(1), 20-28.
Chiappe, P., Glaeser, B., & Ferko, D. (2007). Speech perception, vocabulary, and the
development of reading skills in English among korean- and English-speaking children.
Journal of Educational Psychology, 99(1), 154-166.
Chiappe, P., Siegel, L. S., & Gottardo, A. (2002). Reading-related skills of kindergartners
from diverse linguistic backgrounds. Applied Psycholinguistics, 23(01), 95.
Chiswick, B. R., Lee, Y. L., & Miller, P. W. (2003). Schooling, literacy, numeracy and labour
market success. Economic Record, 79(245), 165-181.
Cho, J., & McBrideChang, C. (2005). Levels of phonological awareness in Korean and
English: A 1-year longitudinal study. Journal of Educational Psychology, 97(4),
564-571.
Chow, B. W. -Y., McBride-Chang, C., & Cheung, H. (2010). Parent-child reading in English
as a second language: Effects on language and literacy development of Chinese
kindergarteners. Journal of Research in Reading, 33(3), 284-301.

183
Chow, B. W.-Y., McBride-Chang, C., & Burgess, S. (2005). Phonological processing skills
and early reading abilities in Hong Kong Chinese kindergarteners learning to read
English as a second language. Journal of Educational Psychology, 97(1), 81-87.
Cisero, C. A., & Royer, J. M. (1995). The development and cross-language transfer of
phonological awareness. Contemporary Educational Psychology, 20(3), 275-303.
Coltheart, M. (2006). Dual route and connectionist models of reading: An overview. London
Review of Education, 4, 5-17.
Compton, D. L., Fuchs, D., Fuchs, L. S., & Bryant, J. D. (2006). Selecting at-risk readers in
first grade for early intervention: A two-year longitudinal study of decision rules and
procedures. Journal of Educational Psychology, 98(2), 394-409.
Cooper, D., H., Roth, F. P., Speece, D. L., & Schatschneider, C. (2002). The contribution of
oral language skills to the development of phonological awareness. Applied
Psycholinguistics, 23, 399-416.
Cronk, N. J., Slutske, W. S., Madden, P. A., Bucholz, K. K., Reich, W., & Heath, A. (2002).
Emotional and behavioral problems among female twins: An evaluation of the equal
environments assumption. Journal of the American Academy of Child & Adolescent
Psychiatry, 41, 829-837.
Cummins, J. (1979). Linguistic interdependence and the educational development of bilingual
children. Review of Educational Research, 49(2), 222-251.
Cunningham, A. E., & Stanovich, K. E. (1997). Early reading acquisition and its relation to
reading experience and ability 10 years later. Developmental Psychology, 33(6), 934-945.
184
Dale, P. S., & Crain-Thoreson, C. (1999). Language and literacy in a developmental
perspective. Journal of Behavioral Education, 9(1), 23-33.
Dale, P. S., Harlaar, N., Haworth, C. M. A., & Plomin, R. (2010). Two by two: A twin study
of second-language acquisition Psychological Science, 21(5), 635-640.
Davis, C., Knopik, V., Olson, R., Wadsworth, S., & DeFries, J. (2001). Genetic and
environmental influences on rapid naming and reading ability: A twin study. Annals of
Dyslexia, 51(1), 231-247.
De Cara, B., & Goswami, U. (2003). Phonological neighbourhood density: Effects in a rhyme
awareness task in five-year-old children. Journal of Child Language, 30(03), 695.
Department for Education and Skills. (2004). The national curriculum: Handbook for
secondary teachers in england, key stages 3 and 4 (revised). London: Author.
Deterding, D. H., & Poesjosoedarmo, G. R. (1998). The sounds of English. Singapore:
Prentice Hall.
Deutsch, D., Dooley, K., Henthorn, T., & Head, B. (2009). Absolute pitch among students in
an american music conservatory: Association with tone language fluency. The Journal of
the Acoustical Society of America, 125(4), 2398-2403.
Dionne, G., Dale, P. S., Boivin, M., & Plomin, R. (2003). Genetic evidence for bidirectional
effects of early lexical and grammatical development. Child Development, 74(2),
394-412.
Dollaghan, C. A. (1994). Children's phonological neighbourhoods: Half empty or half full?
Journal of Child Language, 21(02), 257.

185
Dollaghan, C. A., Biber, M. E., & Campbell, T. F. (1995). Lexical influences on nonword
repetition. Applied Psycholinguistics, 16(02), 211.
Doyle, A. E., Willcutt, E., Seidman, L., Biederman, J., Chouinard, V. A., & Silva, J. (2005).
Attentiondeficit/hyperactivity disorder endophenotypes. Biological Psychiatry, 27,
1324-1335.
Drayna, D., Manichaikul, A., Lange, M. d., Snieder, H., & Spector, T. (2001). Genetic
correlates of musical pitch recognition in humans. Science, 291(5510), 1969-1972.
Droop, M., & Verhoeven, L. (2003). Language proficiency and reading ability in first- and
second-language learners. Reading Research Quarterly, 38(1), 78-103.
Duncan, L. G., Seymour, P. H. K., & Hill, S. (1997). How important are rhyme and analogy
in beginning reading? Cognition, 63(2), 171-208.
Dunn, L. M., & Dunn, D. M. (2007). Peabody picture vocabulary test (PPVT-4) (4th ed.).
Minneapolis, MN: NCS Pearson.
Durgunoğlu, A. Y., Nagy, W. E., & Hancin-Bhatt, B. (1993). Cross-language transfer of
phonological awareness. Journal of Educational Psychology, 85(3), 453-465.
Edwards, J., Beckman, M. E., & Munson, B. (2004). The interaction between vocabulary size
and phonotactic probability effects on children's production accuracy and fluency in
nonword repetition. Journal of Speech, Language, and Hearing Research, 47(2),
421-436.
Ehri, L.C., Nunes, S.R. Willows, D.M., Schuster, B.V., Yaghoub-Zadeh, Z., & Shanahan, T.
(2001). Phonemic awareness instruction helps children learn to read: Evidence from
the National Reading Panel’s meta-analysis. Reading Research Quarterly, 36,
250–287.
186
Elbro, C. (1996). Early linguistic abilities and reading development: A review and a
hypothesis. Reading and Writing: An Interdisciplinary Journal, 8(6), 453-485.
Farber, S. L. (1981). Identical twins reared apart: A reanalysis. New York: Basic Books.
Fifer, W. P., & Moon, C. (2003). Prenatal development. In A. Slater, & G. Bremner (Eds.),
An introduction to developmental psychology (pp. 95-114). Oxford, UK: Blackwell
Publishers Ltd.
Flege, J. (1995). Second language speech learning: Theory, findings and problems. In W.
Strange (Ed.), Speech perception and linguistic experience: Theoretical and
methodological issues (pp. 233-277). Baltimore: York Press.
Fodor, J. A. (1983). Modularity of mind: An essay on faculty psychology. Cambridge, MA:
Cambridge, Mass.: MIT Press.
Foorman, B. R., Francis, D. J., Fletcher, J. M., Schatschneider, C., & Mehta, P. (1998). The
role of instruction in learning to read: Preventing reading failure in at-risk children.
Journal of Educational Psychology, 90(1), 37-55.
Fowler, A. E. (1991). How early phonological development might set the stage for phoneme
awareness. In S. A. Brady, & D. P. Shankweiler (Eds.), Phonological processes in
literacy:A tribute to isabelle Y. liberman (pp. 97-117). Hillsdale, NJ: Erlbaum.
Fowler, A., Brady, S., & Eisen, A. (1995). The perception and awareness of phonemes in
young five-year olds. The Society for Research in Child Development, Indianapolis, IN.
Fowler, A., Brady, S., & Yehuda, N. (1995, November). On the perceptual basis of phoneme
awareness. The 46th Annual Conference of the Orton Dyslexia Society, Houston, TX.
187
Foy, J. G., & Mann, V. (2001). Does strength of phonological representations predict
phonological awareness in preschool children? Applied Psycholinguistics, 22(03), 301.
Frederickson, N., Frith, U., & Reason, R. (1997). Phonological assessment battery:
Standardisation edition. Windsor: NFER-Nelson.
Fulker, D. W., & Plomin, R. (2001). Cognitive development, cognitive abilities, and
modularity. In R. Emde, & J. Hewitt (Eds.), Infancy to early childhood: Genetic and
environmental influences on developmental change (pp. 181-185). New York: Oxford
University Press.
Garlock, V. M., Walley, A. C., & Metsala, J. L. (2001). Age-of-acquisition, word frequency,
and neighborhood density effects on spoken word recognition by children and adults.
Journal of Memory and Language, 45(3), 468-492.
Gass, S. M., & Selinker, L. (Eds.). (1983). Language transfer in language learning. Rowley,
Massachusetts: Newbury House.
Gathercole, S. E. (1995). Nonword repetition: More than just a phonological output task.
Cognitive Neuropsychology, 12(8), 857.
Gathercole, S. E., & Baddeley, A. D. (1990). The role of phonological memory in vocabulary
acquisition: A study of young children learning new names. British Journal of
Psychology, 81, 439-454.
Gathercole, S. E., & Baddeley, A. D. (1993). Phonological working memory: A critical
building block for reading development and vocabulary acquisition? European Journal
of Psychology of Education, 8(3), 259-272.
188
Gathercole, S. E., & Baddeley, A. D. (1996). Children’s test of nonword repetition. London:
Pearson Assessment.
Gathercole, S. E., Hitch, G. J., Service, E., & Martin, A. J. (1997). Phonological short-term
memory and new word learning in children. Developmental Psychology, 33(6), 966-979.
Gathercole, S. E., Willis, C. S., Emslie, H., & Baddeley, A. D. (1992). Phonological memory
and vocabulary development during the early school years: A longitudinal study.
Developmental Psychology, 28(5), 887-898.
Gayán, J., & Olson, R. K. (2003). Genetic and environmental influences on individual
differences in printed word recognition. Journal of Experimental Child Psychology,
84(2), 97-123.
Genesee, F., Geva, E., Dressler, C., & Kamil, M. (2006). Synthesis: Cross-linguistic
relationships. In D. August, & T. Shanahan (Eds.), Report of the national literacy panel
on language minority youth and children (Lawrence Erlbaum Associates ed., pp.
153-174) Mahwah, NJ.
Gerken, L. (2004). Nine-month-olds extract structural principles required for natural language.
Cognition, 93(3), B89-B96.
Geva, E. (1999). Issues in the development of second language reading: Implications for
instruction and assessment. In T. Nunes (Ed.), Learning to read: An integrated view from
research and practice (pp. 343-367). Dordrecht, The Netherlands: Kluwer Academis
Publishers.
Geva, E., Yaghoub-Zadeh, Z., & Schuster, B. (2000). Understanding individual differences in
word recognition skills of ESL children. Annals of Dyslexia, 50(1), 121-154.
189
Gibbs, S. (1996). Categorical speech perception and phonological awareness in the early
stages of learning to read. Language & Communication, 16(1), 37-60.
Gilmore, J. H., Schmitt, J. E., Knickmeyer, R. C., Smith, J. K., Lin, W., Styner, M., et al.
(2010). Genetic and environmental contributions to neonatal brain structure: A twin
study. Human Brain Mapping, 31(8), 1174-1182.
Goff, D., Pratt, C., & Ong, B. (2005). The relations between Children’s reading
comprehension, working memory, language skills and components of reading decoding in
a normal sample. Reading and Writing, 18(7), 583-616.
Golestani, N., & Zatorre, R. J. (2004). Learning new sounds of speech: Reallocation of neural
substrates. NeuroImage, 21(2), 494-506.
Gombert, J. E. (1992). Metalinguistic development. Hertfordshire, UK: Harvester Wheatsheaf.
Goswami, U. C. (1986). Children’s use of analogy in learning to read: A
developmental study. Journal of Experimental Child Psychology, 42, 73-83.
Goswami, U. C. (1988). Orthographic analogies and reading development. Quarterly Journal
of Experimental Psychology, 40A, 239-268.
Goswami, U. C. (1990). A special link between rhyming skill and the use of orthographic
analogies by beginning readers. Journal of Child Psychology and Psychiatry and Allied
Disciplines, 31, 301-311.
Goswami, U. (1999). Causal connections in beginning reading: The importance of rhyme.
Journal of Research in Reading, 22(3), 217-240.
190
Goswami, U. (2000). Phonological representations, reading development and dyslexia:
Towards a cross-linguistic theoretical framework. Dyslexia, 6(2), 133-151.
Goswami, U., & Bryant, P. E. (1990). Phonological skills and learning to read. Hillsdale, NJ:
Erlbaum.
Gottardo, A., Yan, B., Siegel, L. S., & WadeWoolley, L. (2001). Factors related to English
reading performance in children with Chinese as a first language: More evidence of
cross-language transfer of phonological processing. Journal of Educational Psychology,
93(3), 530-542.
Graddol, D. (2006). English next why global English may mean the end of ‘English as a
foreign language’. UK: British Council.
Gregersen, P. K., Kowalsky, E., Kohn, N., & Marvin, E. W. (2001). Early childhood music
education and predisposition to absolute pitch: Teasing apart genes and environment.
American Journal of Medical Genetics, 98(3), 280-282.
Grigorenko, E. L. (2001). Developmental dyslexia: An update on genes, brains, and
environments. Journal of Child Psychology and Psychiatry, 42(1), 91-125.
Gutknecht, L., Spitz, E., & Carlier, M. (1999). Long-term effect of placental type on
anthropometrical and psychological traits among monozygotic twins: A follow up study.
Twin Research, 2, 212-217.
Guttorm, T. K., Leppänen, P. H. T., Hämäläinen, J. A., Eklund, K. M., & Lyytinen, H. J.
(2010). Newborn event-related potentials predict poorer pre-reading skills in children at
risk for dyslexia. Journal of Learning Disabilities, 43(5), 391-401.
191
Hair, J. F., Anderson, R. E., Tatham, R. L., & Black, W. C. (1998). Multivariate data analysis
(5th ed.). Englewood Cliffs, NJ: Prentice Hall.
Hakes, D. T. (1980). The development of metalinguistic abilities in children. Berlin:
Springer-Verlag.
Hancin-Bhatt, B. (1994). Segment transfer: A consequence of a dynamic system. Second
Language Research, 10(3), 241-269.
Hancin-Bhatt, B., & Nagy, W. (1994). Lexical transfer and second language morphological
development. Applied Psycholinguistics, 15(3), 289-310.
Hansen, J., & Bowey, J. A. (1994). Phonological analysis skills, verbal working memory, and
reading ability in second-grade children. Child Development, 65(3), 938-950.
Harlaar, N., Butcher, L. M., Meaburn, E., Sham, P., Craig, I. W., & Plomin, R. (2005). A
behavioural genomic analysis of DNA markers associated with general cognitive ability
in 7-year-olds. Journal of Child Psychology and Psychiatry, 46(10), 1097-1107.
Harlaar, N., Dale, P. S., & Plomin, R. (2007a). From learning to read to reading to learn:
Substantial and stable genetic influence. Child Development, 78(1), 116-131.
Harlaar, N., Dale, P. S., & Plomin, R. (2007b). Reading exposure: A (largely) environmental
risk factor with environmentally-mediated effects on reading performance in the primary
school years. Journal of Child Psychology and Psychiatry, 48(12), 1192-1199.
Harlaar, N., HayiouThomas, M. E., Dale, P. S., & Plomin, R. (2008). Why do preschool
language abilities correlate with later reading? A twin study. Journal of Speech,
Language, and Hearing Research, 51(3), 688-705.
192
Harm, M. W., & Seidenberg, M. S. (2004). Computing the meanings of words in reading:
Cooperative division of labor between visual and phonological processes. Psychological
Review, 111(3), 662-720.
Harris, A. J., & Sipay, E. R. (1980). How to increase reading ability (7th ed.). New York:
Longman.
Hart, S. A., Petrill, S. A., DeThorne, L. S., Deater-Deckard, K., Thompson, L. A.,
Schatschneider, C., et al. (2009). Environmental influences on the longitudinal
covariance of expressive vocabulary: Measuring the home literacy environment in a
genetically sensitive design. Journal of Child Psychology and Psychiatry, 50(8),
911-919.
Haworth, C. M. A., Dale, P. S., & Plomin, R. (2009). The etiology of science performance:
Decreasing heritability and increasing importance of the shared environment from 9 to 12
years of age. Child Development, 80(3), 662-673.
Healy, J. (1982). The enigma of hyperlexia. Reading Research Quarterly, 17, 319-338.
Heath, A. C., Martin, B. G., Eaves, L. J., & Loesch, D. (1984). Evidence for polygenic
epistatic interactions in man. Genetics, 106, 710-727.
Heredia, R. R. (1997). Bilingual memory and hierarchical models: A case for language
dominance. Current Directions in Psychological Science, 6(2), pp. 34-39.
Hernandez, A. E., Martinez, A., & Kohnert, K. (2000). In search of the language switch: An
fMRI study of picture naming in Spanish–English bilinguals. Brain and Language, 73(3),
421-431.
Hernandez, A., Li, P., & MacWhinney, B. (2005). The emergence of competing modules in
bilingualism [Abstract]. 9(5) 220-225.

193
Ho , C. S. -H., Chan, D. W., Tsang, S., & Lee, S. (2000). The Hong Kong test of specific
learning difficulties in reading and writing (HKT-SpLD) manual[in Chinese] Hong Kong
Hong Kong Specific Learning Difficulties Research Team.
Hoover, W. A., & Gough, P. B. (1990). The simple view of reading. Reading and Writing: An
interdisciplinary journal, 2(2), 127-160.
Hu, L., & Bentler, P. M. (1998). Fit indices in covariance structure modeling: Sensitivity to
underparameterized model misspecification. Psychological Methods, 3(4), 424-453.
Hu, L., & Bentler, P. M. (1999). Cutoff criteria for fit indexes in covariance structure analysis:
Conventional criteria versus new alternatives. Structural Equation Modeling: A
Multidisciplinary Journal, 6(1), 1-55.
Huang, H. S., & Hanley, J. R. (1995). Phonological awareness and visual skills in learning to
read Chinese and English. Cognition, 54(1), 73-98.
Huang, H. S., & Hanley, J. R. (1997). A longitudinal study of phonological awareness, visual
skills, and Chinese reading acquisition among first-graders in Taiwan. International
Journal of Behavioral Development, 20(2), 249-268.
Hulme, C., Hatcher, P. J., Nation, K., Brown, A., Adams, J., & Stuart, G. (2002). Phoneme
awareness is a better predictor of early reading skill than onset-rime awareness. Journal
of Experimental Child Psychology, 82(1), 2-28.
Hulme, C., Snowling, M., Caravolas, M., & Carroll, J. (2005). Phonological skills are
(probably) one cause of success in learning to read: A comment on Castles and Coltheart.
Scientific Studies of Reading, 9(4), 351-365.
194
Hulshoff Pol, H. E., Schnack, H. G., Posthuma, D., Mandl, R. C. W., Baare, W. F., van Oel,
C., et al. (2006). Genetic contributions to human brain morphology and intelligence.
Journal of Neuroscience, 26(40), 10235-10242.
Hurford, D. P. (1990). Training phonemic segmentation ability with a phonemic
discrimination intervention in second- and third- grade children with reading disabilities.
Journal of Learning Disabilities, 23, 564-569.
Hurford, D. P. (1991). The possible use of IBM-compatible computers and digital-to-analog
conversion to assess children for reading disabilities and to increase their phonemic
awareness. Behavior Research Methods, Instruments & Computers, 23(2), 319-323.
Imaizumi, Y. (2003). A comparative study of zygotic twinning and triplet rates in eight
countries, 1972-1999. Journal of Biosocial Science, 35(2), 287-302.
Inglis, L.- Newsome, M.- Tang, Z.- Martin, R. (2002). Language: Speech Perception.
Multimedia Textbook in Behavioral Neuroscience. Rice University: Department of
Psychology and Statistics.
Iverson, P., Kuhl, P. K., Akahane-Yamada, R., Diesch, E., Tohkura, Y., Kettermann, A., et al.
(2003). A perceptual interference account of acquisition difficulties for non-native
phonemes. Cognition, 87(1), B47-B57.
Jackson, D. L. (2003). Revisiting sample size and number of parameter estimates: Some
support for the N:Q hypothesis. Structural Equation Modeling: A Multidisciplinary
Journal, 10(1), 128.
Jacob, N., van Gestel, S., Derom, C., Thiery, E., Vernon, P., Derom, R., et al. (2001).
Heritability estimates of intelligence in twins: Effect of chorion type. Behavior Genetics,
31, 209-217.

195
Jia, G. (2006). Second language acquisition by native Chinese speakers. In P. LI, L. H. Tan, E.
Bates & O. J. L. Tzeng (Eds.), The handbook of East Asian psycholinguistics (volume 1):
Chinese (pp. 61-69). Cambridge: Cambridge University Press.
Joanisse, M. F., Manis, F. R., Keating, P., & Seidenberg, M. S. (2000). Language deficits in
dyslexic children: Speech perception, phonology, and morphology, Journal of
Experimental Child Psychology, 77(1), 30-60.
Johnson, W., Turkheimer, E., Gottesman, I. I., & Bouchard, T. J. J. (2009). Beyond
heritability: Twin studies in behavioral research. Current Directions in Psychological
Science, 18(4), 217-220.
Johnston, C., Prior, M., & Hay, D. (1984). Prediction of reading disability in twin boys.
Developmental Medicine and Child Neurology, 26, 588-595.
Joreskog, K. G. (1993). Testing structural equation models. In K. A. Bollen, & J. S. Long
(Eds.), Testing structural equation models (pp. 294-316). Newbury Park, CA: Sage.
Jöreskog, K. G., & Sörbom, D. (1984). LISREL VI users guide (3rd ed.). Moorsville, IN:
Scientific Software.
Jusczyk, P. W. (1993). From general to language-specific capacities: The WRAPSA model of
how speech perception develops. Journal of Phonetics, 21, 3-28.
Kaiser, H. F. (1960). The application of electronic computers to factor analysis. Educational
and Psychological Measurement, 20(1), 141-151.
Kendler, K. S., Neale, M. C., Kessler, R. C., Heath, A. C., & Eaves, L. J. (1994). Parental
treatment and the equal environment assumption in twin studies of psychiatric illness.
Psychological Medicine, 24, 579-590.

196
Keung, Y., & Ho, C. S.-H. (2009). Transfer of reading-related cognitive skills in learning to
read Chinese (L1) and English (L2) among Chinese elementary school children.34(2),
103-112.
Kim, K. H. S., Relkin, N. R., Lee, K., & Hirsch, J. (1997). Distinct cortical areas associated
with native and second languages. Nature, 388, 171-174.
Kisilevsky, B. S., Hains, S. M. J., Lee, K., Xie, X., Huang, H., Ye, H. H., et al. (2003). Effects
of experience on fetal voice recognition. Psychological Science, 14(3), 220-224.
Kline, R. B. (2005). Principles and practice of structural equation modeling (2nd ed.). New
York: Guilford.
Ko, H. W., & Lee, J. R. (1997). The development of phonological awareness and word
recognition- a longitudinal research. Journal of National Chung Cheng University, 7(1),
49-66.
Koda, K. (1996). L2 word recognition research: A critical review. The Modern Language
Journal, 80(4), 450-460.
Koda, K. (2007). Reading and language learning: Crosslinguistic constraints on second
language reading development. Language Learning, 57, 1-44.
Kovas, Y., & Plomin, R. (2007). Learning abilities and disabilities: Generalist genes,
specialist environments. Current Directions in Psychological Science, 16(5), 284-288.
Kovas, Y., Haworth, C. M. A., Dale, P. S., & Plomin, R. (2007). The genetic and
environmental origins of learning abilities and disabilities in the early school years.
Monographs of the Society for Research in Child Development, 72(3), 1-144.

197
Kovas, Y., HayiouThomas, M. E., Oliver, B., Dale, P. S., Bishop, D. V. M., & Plomin, R.
(2005). Genetic influences in different aspects of language development: The etiology of
language skills in 4.5-year-old twins. Child Development, 76(3), 632-651.
Kuhl, P. K. (2004). Early language acquisition: Cracking the speech code. Nature Reviews
Neuroscience, 5(11), 831-843.
Kuhl, P. K., Tsao, F., & Liu, H. (2003). Foreign-language experience in infancy: Effects of
short-term exposure and social interaction on phonetic learning. Proceedings of the
National Academy of Sciences of the United States of America, 100(15), 9096-9101.
Leong, C. K., Hau, K. T., Cheng, P. W., & Tan, L. H. (2005). Exploring two-wave reciprocal
structural relations among orthographic knowledge, phonological sensitivity, and reading
and spelling of English words by Chinese students. Journal of Educational Psychology,
97(4), 591-600.
Lesaux, N. K., & Siegel, L. S. (2003). The development of reading in children who speak
English as a second language. Developmental Psychology, 39(6), 1005-1019.
Levy, B. A., & Carr, T. H. (1990). Component process analyses: Conclusions and challenges.
In T. H. Carr, & B. A. Levy (Eds.), Reading and its development: Component skills
approaches (pp. 280-284). New York: Academic Press.
Li, C. N., & Thompson, S. A. (1981). Mandarin Chinese: A functional reference grammar.
Berkeley: University of California Press.
Li, D. C. S. (2006). Chinese as a lingua franca in greater China. Annual Review of Applied
Linguistics, 26, 149-176.
198
Li, P., & Farkas, I. (2002). A self-organizing connectionist model of bilingual processing. In
R. Heredia, & J. Altarriba (Eds.), Bilingual sentence processing (pp. 59-85).
North-Holland: Elsevier.
Li, W. L., Anderson, R. C., Nagy, W., & Zhang, H. C. (2002). Facets of metalinguistic
awareness that contribute to Chinese literacy. In W. L. Li, J. S. Gaffney & J. L. Packard
(Eds.), Chinese children's reading acquisition (pp. 87-106) Kluwer Academic Publishers.
Liberman, A. M. (1999). The reading researcher and the reading teacher need the right theory
of speech. Scientific Studies of Reading, 3(2), 95.
Liberman, I. Y., Shankweiler, D., & Liberman, A. M. (1989). The alphabetic principle and
learning to read. In D. Shankweiler, & I. Y. Liberman (Eds.), Phonology and reading
disability: Solving the reading puzzle. research monograph series. (pp. 1-34). Ann Arbor:
University of Michigan Press.
Liberman, I. Y., Shankweiler, D., Fischer, F. W., & Carter, B. (1974). Explicit syllable and
phoneme segmentation in the young child. Journal of Experimental Child Psychology,
18(2), 201-212.
Lin, D., McBride-Chang, C., Shu, H., Zhang, Y., Li, H., Zhang, J., et al. (2010). Small wins
big. Psychological Science, 21(8), 1117-1122.
Lim, C. K. B., Yeung, V. S. Y., Yeung, T. L., Tam, A. C. Y., Ho, C. S.-H., Wong, S. W. L., &
Chow, B. W. Y. (under review). Genotype analyses using SNP (using MALDI-TOF
Mass spectrometry) and STR (microsatellite) markers in the determination of zygosity
status of Chinese Twins.
Lindau, M., & Ladefoged, P. (1986). Variability of feature specification. In J. S. Perkell, & D.
H. Klatt (Eds.), Invariance and variability in speech processes (pp. 465-478) Hillsdale:
Erlbaum.
199
Lundberg, I. (1991). Cognitive aspects of reading. International Journal of Applied
Linguistics, 1(2), 151-163.
Lundberg, I. (1999). Learning to read in Scandinavia. In M. Harris, & G. Hatano (Eds.),
Learning to read: Cross-linguistic perspectives (pp. 157-172). Cambridge: Cambridge
University Press.
Lykken, D. T. (1982). Research with twins: The concept of emergenesis. Psychophysiology,
19, 361-373.
Lykken, D. T., Bouchard, T. J., McGue, M., & Teilegen, A. (1990). The minnesota twin
registry: Some initial findings. Acta Genelicae Medicae Et Gemmellologiae, 39, 35-70.
Lykken, D. T., McGue, M., Tellegen, A., & Bouchard, J., T.J. (1992). Emergenesis: Genetic
traits that may not run in families. American Psychologist, 47(12), 1565-1577.
Lykken, D., Iacono, W., Haroian, K., Mc Gue, M., & Bouchard, T. (1988). Habituation of the
skin conductance response to strong stimuli: A twin study. Psychophysiology, 25(1),
4-15.
MacCallum, R. C., Browne, M. W., & Sugawara, H. M. (1996). Power analysis and
determination of sample size for covariance structure modeling. Psychological Methods,
1, 130-149.
Macmillan, B. M. (2002). Rhyme and reading: A critical review of the research methodology.
Journal of Research in Reading, 25(1), 42.
MacWhinney, B. (1992). Transfer and competition in second language learning. In Richard
Jackson Harris (Ed.), Advances in psychology (pp. 371-390) North-Holland.
200
MacWhinney, B. (2000). The CHILDES project: Tools for analyzing talk. Mahwah, NJ:
Erlbaum.
Malouff, J. M., Rooke, S. E., & Schutte, N. S. (2008). The heritability of human behavior:
Results of aggregating meta-analyses. Current Psychology, 27(3), 153-161.
Mann, V. A., & DiTunno, P. (1990). Phonological deficiencies: Effective predictors of future
reading problems. In G. Pavlides (Ed.), Perspectives on dyslexia (2nd ed., pp. 105-131).
New York: Wiley.
Mann, V., & Wimmer, H. (2002). Phoneme awareness and pathways into literacy: A
comparison of german and american children. Reading and Writing, 15(7), 653-682.
Markman, E. M. (1976). Children's difficulty with word-referent differentiation. Child
Development, 47(3), 742-749.
Masoura, E. V., & Gathercole, S. E. (1999). Phonological short-term memory and foreign
language learning. International Journal of Psychology, 34(5-6), 383-388.
Maye, J., Werker, J. F., & Gerken, L. (2002). Infant sensitivity to distributional information
can affect phonetic discrimination. Cognition, 82(3), B101-B111.
Mayo, C., Scobbie, J. M., Hewlett, N., & Waters, D. (2003). The influence of phonemic
awareness development on acoustic cue weighting strategies in children's speech
perception. Journal of Speech Language and Hearing Research, 46(5), 1184-1196.
McBride-Chang, C. (1995). What is phonological awareness? Journal of Educational
Psychology, 87(2), 179-192.
McBride-Chang, C. (1996). Models of speech perception and phonological processing in
reading. Child Development, 67(4), 1836-1856.

201
McBride-Chang, C. (2004). Children's literacy development (texts in developmental
psychology series). London: Edward Arnold/Oxford Press.
McBride-Chang, C., & Ho, C. S.-H. (2005). Predictors of beginning reading in Chinese and
English: A 2-year longitudinal study of Chinese kindergartners. Scientific Studies of
Reading, 9(2), 117-144.
McBride-Chang, C., & Kail, R. V. (2002). Cross-cultural similarities in the predictors of
reading acquisition. Child Development, 73(5), 1392-1407.
McBride-Chang, C., Tong, X., Shu, H., Wong, A. M. Y., Leung, K., & Tardif, T. (2008).
Syllable, phoneme, and tone: Psycholinguistic units in early Chinese and English word
recognition. Scientific Studies of Reading, 12(2), 171-194.
McBride-Chang, C., Wagner, R. K., & Chang, L. (1997). Growth modeling of phonological
awareness. Journal of Educational Psychology, 89(4), 621-630.
McCardle, P., Scarborough, H. S., & Catts, H. W. (2001). Predicting, explaining, and
preventing children's reading difficulties. Learning Disabilities Research & Practice,
16(4), 230-239.
Metsala, J. L. (1997). An examination of word frequency and neighborhood density in the
development of spoken-word recognition. Memory & Cognition, 25(1), 47-56.
Metsala, J. L. (1999). Young children's phonological awareness and nonword repetition as a
function of vocabulary development. Journal of Educational Psychology, 91(1), 3-19.
Metsala, J. L., & Walley, A. C. (1998). Spoken vocabulary growth and the segmental
restructuring of lexical representations: Precursors to phonemic awareness and early
202
reading ability. In J. L. Metsala, & L. C. Ehri (Eds.), Word recognition in beginning
literacy (pp. 89-120). Mahwah, New Jersey: Erlbaum.
Molfese, D. L., & Molfese, V. J. (1997). Discrimination of language skills at five years of age
using event-related potentials recorded at birth. Developmental Neuropsychology, 13(2),
135.
Molfese, D. L., Molfese, V. J., Key, A. F., & Kelly, S. D. (2003). Influence of environment
on speech-sound discrimination: Findings from a longitudinal study. Developmental
Neuropsychology, 24(2), 541.
Moore, D. R., Rosenberg, J. F., & Coleman, J. S. (2005). Discrimination training of phonemic
contrasts enhances phonological processing in mainstream school children. Brain and
Language, 94(1), 72-85.
Morton, J., & Frith, U. (1995). Causal modeling: A structural approach to developmental
psychopathology. In D. Cichetti, & D. J. Cohen (Eds.), Volume 1 manual of
developmental psychopathology (pp. 357-390). New York: John Wiley.
Moss, G. (1992). Cognate recognition: Its importance in the teaching of ESP reading courses
to Spanish speakers. English for Specific Purposes, 11(2), 141-158.
Muter, V., & Diethelm, K. (2001). The contribution of phonological skills and letter
knowledge to early reading development in a multilingual population. Language
Learning, 51(2), 187-219.
Muter, V., Hulme, C., Snowling, M., & Taylor, S. (1997). Segmentation, not rhyming,
predicts early progress in learning to read. Journal of Experimental Child Psychology,
65(3), 370-396.
203
Nagy, W., Garcia, G. E., Durgonoglu, A. Y., & Hancin-Bhatt, B. (1993). Spanish-English
bilingual students' use of cognates in English reading. Journal of Reading Behavior, 25,
241-259.
Nash, R. (1997). Dictionary of Spanish cognates. Chicago, IL: NTC Publishing.
Nation, K., & Cocksey, J. (2009). The relationship between knowing a word and reading it
aloud in children's word reading development. Journal of Experimental Child
Psychology, 103(3), 296-308.
Nation, K., & Hulme, C. (1997). Phonemic segmentation, not onset-rime segmentation,
predicts early reading and spelling skills. Reading Research Quarterly, 32(2), 154-167.
Nation, K., & Snowling, M. J. (1998). Individual differences in contextual facilitation:
Evidence from dyslexia and poor reading comprehension. Child Development, 69(4),
996-1011.
Nation, K., Allen, R., & Hulme, C. (2001). The limitations of orthographic analogy in early
reading development: Performance on the clue-word task depends on phonological
priming and elementary decoding skill, not the use of orthographic analogy. Journal of
Experimental Child Psychology, 80(1), 75-94.
National Curriculum Assessments. (2007). Key stage 3 assessment and reporting
arrangements 2008. London: Qualifications and Curriculum Authority.
Neale, M. C., & Cardon, L. R. (1992). Methodology for genetic studies of twins and families.
Dordrecht, the Netherlands: Kluwer Academic Publishers.
Norman, J. (1988). Chinese. Cambridge: Cambridge University Press.
204
Olson, R. K., & Byrne, B. (2005). Genetic and environmental influences on reading and
language ability and disability. In H. W. Catts, & A. G. Kamhi (Eds.), The connections
between language and reading disabilities (pp. 173-200). Mahwah, New Jersey:
Lawrence Erlbaum Associates.
Ouellette, G. P. (2006). What's meaning got to do with it: The role of vocabulary in word
reading and reading comprehension. Journal of Educational Psychology, 98(3), 554-566.
Papagno, C., & Vallar, G. (1995). Verbal short-term memory and vocabulary learning in
polyglots. The Quarterly Journal of Experimental Psychology Section A: Human
Experimental Psychology, 48(1), 98.
Payton, A. (2006). Investigating cognitive genetics and its implications for the treatment of
cognitive deficit. Genes, Brain and Behavior, 5(S1), 44-53.
Peper, J. S., Brouwer, R. M., Boomsma, D. I., Kahn, R. S., & Hulshoff Pol, H. E. (2007).
Genetic influences on human brain structure: A review of brain imaging studies in twins.
Human Brain Mapping, 28(6), 464-473.
Perfetti, C. A., Liu, Y., Fiez, J., Nelson, J., Bolger, D. J., & Tan, L. H. (2007). Reading in two
writing systems: Accommodation and assimilation of the brain's reading network.
Bilingualism: Language and Cognition, 10(02), 131.
Petrill, S. A. (1997). Molarity versus modularity of cognitive functioning? A behavioral
genetic perspective. Current Directions in Psychological Science, 6(4, Current Directions
in Behavioral Genetics), 96-99.
Petrill, S. A., DeaterDeckard, K., Thompson, L. A., DeThorne, L. S., & Schatschneider, C.
(2006). Reading skills in early readers: Genetic and shared environmental influences.
Journal of Learning Disabilities, 39(1), 48-55.

205
Petrill, S. A., Deater-Deckard, K., Thompson, L. A., Schatschneider, C., Dethorne, L. S., &
Vandenbergh, D. J. (2007). Longitudinal genetic analysis of early reading: The western
reserve reading project. Reading and Writing, 20(1-2), 127-146.
Phillips, D. I. (1993). Twin studies in medical research: Can they tell us whether diseases are
genetically determined? Lancet, 341, 1008-1009.
Piaget, J. (1985). The equilibration of cognitive structures: The central problem of intellectual.
Chicago: University of Chicago Press.
Plaut, D. C., McClelland, J. L., Seidenberg, M. S., & Patterson, K. (1996). Understanding
normal and impaired word reading: Computational principles in quasi-regular domains.
Psychological Review, 103(1), 56-115.
Plomin, R., & Daniels, D. (1987). Why are children in the same family so different from each
other ? Behavioural Brain Science, 10, 44-54.
Plomin, R., DeFries, J. C., McClearn, G. E., & McGuffin, P. (2008). Behavioral genetics (5th
ed.). New York: Worth Publishers.
Plomin, R., Kennedy, J. K. J., & Craig, I. W. (2006). The quest for quantitative trait loci
associated with intelligence. Intelligence, 34(6), 513-526.
Plomin, R., McClearn, G. E., Smith, D. L., Skuder, P., Vignetti, S., Chorney, M. J., et al.
(1995). Allelic associations between 100 DNA markers and high versus low IQ.
Intelligence, 21(1), 31-48.
Plomin, R., Owen, M., & McGuffin, P. (1994). The genetic basis of complex human
behaviors. Science, 264, 1733-1749.
206
Pollard, R. (1995). Ethnic comparison of twinning rates in california. Annals of Human
Biology, 6(921), 931.
Poole, J. (2003). Dyslexia: A wider view. the contribution of an ecological paradigm to
current issues. Educational Research, 45(2), 167-180.
Prescott, C. A., Johnson, R. C., & McArdle, J. J. (1999). Chorion type as a possible influence
on the results and interpretation of twin study data. Twin Research, 2, 244-249.
Pu, Y., Liu, H., Spinks, J. A., Mahankali, S., Xiong, J., Feng, C., et al. (2001). Cerebral
hemodynamic response in Chinese (first) and English (second) language processing
revealed by event-related functional MRI. Magnetic Resonance Imaging, 19(5), 643-647.
Puolakanaho, A., Ahonen, T., Aro, M., Eklund, K., Leppänen, P. H. T., Poikkeus, A. M., et al.
(2007). Very early phonological and language skills: Estimating individual risk of
reading disability. Journal of Child Psychology and Psychiatry, 48(9), 923-931.
Quiroga, T., Lemos-Britton, Z., Mostafapour, E., Abbott, R. D., & Berninger, V. W. (2002).
Phonological awareness and beginning reading in Spanish-speaking ESL first graders:
Research into practice. Journal of School Psychology, 40(1), 85-111.
Ramsey, S. R. (1987). The languages of China. New Jersey: Princeton University Press.
Randall, M. (2005). Orthographic knowledge and first language reading: Evidence from
single word dictation from Chinese and Malaysian users of English as a foreign language.
In V. Cook, & B. Bassetti (Eds.), Second language writing systems (pp. 122-146).
Clevedon: Multilingual Matters.
Riches, C., & Genesee, F. (2006). Cross-linguistic and cross-modal aspects of literacy
development. In F. Genesee, K. Lindholm-Leary, W. Saunders & D. Christian (Eds.),
207
Educating English language learners: A synthesis of research evidence (pp. 64-108). NY:
Cambridge University Press.
Rigdon, E. E. (1996). CFI versus RMSEA: A comparison of two fit indexes for structural
equation modeling. Structural Equation Modeling: A Multidisciplinary Journal, 3(4),
369.
Ringbom, H. (1992). On L1 transfer in L2 comprehension and L2 production. Language
Learning, 42(1), 85-112.
Rogers, H. (2005). Writing systems: A linguistic approach. Oxford: Blackwell.
Saffran, J. R., & Griepentrog, G. J. (2001). Absolute pitch in infant auditory learning:
Evidence for developmental reorganization. Developmental Psychology, 37, 74-85.
Saffran, J. R., & Thiessen, E. D. (2003). Pattern induction by infant language learners.
Developmental Psychology, 39(3), 484-494.
Saffran, J. R., Johnson, E. K., Aslin, R. N., & Newport, E. L. (1999). Statistical learning of
tone sequences by human infants and adults. Cognition, 70(1), 27-52.
Saffran, J. R., Werker, J. F., & Werner, L. A. (2006). The infant’s auditory world: Hearing,
speech, and the beginnings of language. In R. Siegler, & D. Kuhn (Eds.), Handbook of
child development (6th ed., pp. 58-108). New York: Wiley.
Samuelsson, S., Olson, R., Wadsworth, S., Corley, R., DeFries, J., Willcutt, E., et al. (2007).
Genetic and environmental influences on prereading skills and early reading and spelling
development in the United States, Australia, and Scandinavia. Reading and Writing,
20(1), 51-75.
208
Savage, R., & Stuart, M. (1998). Sublexical inferences in beginning reading: Medial vowel
digraphs as functional units of transfer. Journal of Experimental Child Psychology, 69(2),
85-108.
Scarborough, H. S. (1996 April). Phonological awareness: Some other pieces of the puzzle.
Conference on the Spectrum of Developmental Disorders XVIII, Baltimore, MD.
Scott, S. K., & Johnsrude, I. S. (2003). The neuroanatomical and functional organization of
speech perception. Trends in Neurosciences, 26(2), 100-107.
Seidenberg, M. S., & McClelland, J. L. (1989). A distributed, developmental model of word
recognition and naming. Psychological Review, 96(4), 523-568.
Service, E., & Kohonen, V. (1995). Is the relation between phonological memory and foreign
language learning accounted for by vocabulary acquisition? Applied Psycholinguistics,
16(2), 155-172.
Sham, P., Bader, J. S., Craig, I., O'Donovan, M., & Owen, M. (2002). DNA pooling: A tool
for large-scale association studies. Nature Reviews. Genetics, 3(11), 862-871.
Shaywitz, S. E., Morris, R., & Shaywitz, B. A. (2008). The education of dyslexic children
from childhood to young adulthood. Annual Review of Psychology, 59(1), 451-475.
Shelley-Tremblay, J., O'Brien, N., & Langhinrichsen-Rohling, J. (2007). Reading disability in
adjudicated youth: Prevalence rates, current models, traditional and innovative treatments.
Aggression and Violent Behavior, 12(3), 376-392.
Shrout, P. E., & Fleiss, J. L. (1979). Intraclass correlations: Uses in assessing rater reliability.
Psychological Bulletin, 2, 420-428.

209
Siegel, L. S., & Ryan, E. B. (1988). Development of grammatical-sensitivity, phonological,
and short-term memory skills in normally achieving and learning disabled children.
Developmental Psychology, 24(1), 28-37.
Skehan, P. (1989). Individual differences in foreign language learning. London: Arnold.
Skuse, D. (2001). Endophenotypes and child psychiatry. British Journal of Psychiatry, 178,
395-396.
Smith, C. L., & Tager-Flusberg, H. (1982). Metalinguistic awareness and language
development. Journal of Experimental Child Psychology, 34(3), 449-468.
Smythe, I., Everatt, J., & & Salter, R. (Eds.). (2004). The international book of dyslexia.
London: Wiley.
Snowling, M. J. (2001). From language to reading and dyslexia. Dyslexia, 7, 37-46.
Snowling, M. J. (2008). Specific disorders and broader phenotypes: The case of dyslexia. The
Quarterly Journal of Experimental Psychology, 61(1), 142.
Snowling, M. J., Hulme, C., Smith, A., & Thomas, J. (1994). The effects of phonetic
similarity and list length on Children′s sound categorization performance. Journal of
Experimental Child Psychology, 58(1), 160-180.
Snowling, M., & Hulme, C. (1989). A longitudinal case study of developmental phonological
dyslexia. Cognitive Neuropsychology, 6(4), 379.
Snowling, M., Chiat, S., & Hulme, C. (1991). Words, nonwords, and phonological processes:
Some comments on Gathercole, Willis, Emslie, and Baddeley. Applied Psycholinguistics,
12(03), 369.

210
So, D., & Siegel, L. S. (1997). Learning to read Chinese: Semantic, syntactic, phonological
and working memory skills in normally achieving and poor Chinese readers. Reading
and Writing, 9(1), 1-21.
Sokol, D. K., Moore, C. A., Rose, R. J., Williams, C. J., Reed, T., & Christian, J. C. (1995).
Intrapair differences in personality and cognitive ability among young monozygotic
twins distinguished by chorion type. Behavior Genetics, 25, 457-466.
Stackhouse, J., Vance, M., Pascoe, M., & Wells, B. (2007). Compendium of speech and
auditory tasks: Children’s speech and literacy difficulties. Chichester: John Wiley.
Stager, C. L., & Werker, J. F. (1997). Infants listen for more phonetic detail in speech
perception than in word-learning tasks. Nature, 388, 381-382.
Stanovich, K. E. (2000). Progress in understanding reading: Scientific foundations and new
frontiers. New York: Guilford Press.
Stevenson, H. W., & et al. (1976). Longitudinal study of individual differences in cognitive
development and scholastic achievement. Journal of Educational Psychology, 68(4),
377-400.
Storkel, H. L. (2002). Restructuring of similarity neighbourhoods in the developing mental
lexicon. Journal of Child Language, 29, 251-274.
Stromswold, K. (2001). The heritability of language: A review and metaanalysis of twin,
adoption, and linkage studies. Language, 77(4), 647-723.
Stromswold, K. (2006). Why aren’t identical twins linguistically identical? genetic, prenatal
and postnatal factors. Cognition, 101(2), 333-384.
Stuart, M. (2004). Getting ready for reading: A follow-up study of inner city second language
211
learners at the end of Key Stage 1. British Journal of Educational Psychology, 74,
15-36.
Tan, L. H., Spinks, J. A., Eden, G. F., Perfetti, C. A., & Siok, W. T. (2005). Reading depends
on writing, in Chinese. Proceedings of the National Academy of Sciences of the United
States of America, 102(24), 8781-8785.
Tan, L. H., Spinks, J. A., Feng, C., Siok, W. T., Perfetti, C. A., Xiong, J., et al. (2003). Neural
systems of second language reading are shaped by native language. Human Brain
Mapping, 18(3), 158-166.
Tham, W. W. P., Rickard Liow, S. J., Rajapakse, J. C., Choong Leong, T., Ng, S. E. S., Lim,
W. E. H., et al. (2005). Phonological processing in Chinese–English bilingual biscriptals:
An fMRI study. NeuroImage, 28(3), 579-587.
Thiessen, E. D., & Saffran, J. R. (2003). When cues collide: Use of stress and statistical cues
to word boundaries by 7- to 9-month-old infants. Developmental Psychology, 39(4),
706-716.
Thomas, E. M., & Senechal, M. (1998). Articulation and phoneme awareness of 3-year-old
children. Applied Psycholinguistics, 19(03), 363.
Thompson, P. M., Cannon, T. D., Narr, K. L., van Erp, T., Poutanen, V. P., Huttunen, M., et
al. (2001). Genetic influences on brain structure. Nature Neuroscience, 4, 1253-1258.
Thorn, A. S. C., & Gathercole, S. E. (1999). Language-specific knowledge and short-term
memory in bilingual and non-bilingual children. The Quarterly Journal of Experimental
Psychology Section A: Human Experimental Psychology, 52(2), 303.
Tong, S., Caddy, D., & Short, R. V. (1997). Use of dizygotic to monozygotic twinning ratio
as a measure of fertility. Lancet, 349, 843-845.

212
Tong, X., & McBride-Chang, C. (2010). Chinese-English biscriptal reading: Cognitive
component skills across orthographies. Reading and Writing, 23(3-4), 293-310.
Torgesen, J. K., Wagner, R. K., & Rashotte, C. A. (1999). Test of word reading efficiency.
Austin, TX: PRO-ED Publishing, Inc.
Treiman, R., Zukowski, A., & Richmond-Welty, E. D. (1995). What happened to the “n” of
sink? children's spellings of final consonant clusters. Cognition, 55(1), 1-38.
Tsao, F. M., Liu, H. M., & Kuhl, P. K. (2004). Speech perception in infancy predicts language
development in the second year of life: A longitudinal study. Child Development, 75(4),
1067-1084.
Tunmer, W. E., Herriman, M. L., & Nesdale, A. R. (1988). Metalinguistic abilities and
beginning reading. Reading Research Quarterly, 23(2), 134-158.
Turkheimer, E. (2000). Three laws of behavior genetics and what they mean. Current
Directions in Psychological Science, 9(5), pp. 160-164.
Umbel, V. M., Pearson, B. Z., Fernández, M. C., & Oller, D. K. (1992). Measuring bilingual
children's receptive vocabularies. Child Development, 63(4), 1012-1020.
Valaki, C. E., Maestu, F., Simos, P. G., Zhang, W., Fernandez, A., Amo, C. M., et al. (2004).
Cortical organization for receptive language functions in Chinese, English, and Spanish:
A cross-linguistic MEG study. Neuropsychologia, 42(7), 967-979.
Van Gemert, M. J. C., Umur, A., Tijssen, J. G. P., & Ross, M. G. (2001). Twin-twin
transfusion syndrome: Etiology, severity and rational management. Current Opinion in
Obstetrics and Gynecology, 13(2), 193-206. Retrieved from SCOPUS database.

213
Vellutino, F. R., Tunmer, W. E., Jaccard, J. J., & Chen, R. (2007). Components of reading
ability: Multivariate evidence for a convergent skills model of reading development.
Scientific Studies of Reading, 11(1), 3-32.
Vernon-Feagans, L. (1996). Children's talk and communities and classrooms. Cambridge,
MA: Blackwell.
Vihman, M. M., & Croft, W. (2007). Phonological development: Toward a ‘radical’ templatic
phonology. Linguistics, 45, 683-725.
Wadsworth, S. J., DeFries, J. C., Fulker, D. W., Olson, R. K., & Pennington, B. F. (1995).
Reading performance and verbal short-term memory: A twin study of reciprocal
causation. Intelligence, 20(2), 145-167.
Wadsworth, S., Corley, R., Hewitt, J., Plomin, R., & DeFries, J. (2002). Parent-offspring
resemblance for reading performance at 7, 12 and 16 years of age in the Colorado
adoption project. Journal of Child Psychology and Psychiatry, 43(6), 769-774.
Wagner, R. K., & Torgesen, J. K. (1987). The nature of phonological processing and its
causal role in the acquisition of reading skills. Psychological Bulletin, 101(2), 192-212.
Walley, A. C. (1993). The role of vocabulary development in children's spoken word
recognition and segmentation ability. Developmental Review, 13, 286-350.
Wang, M., & Geva, E. (2003). Spelling performance of Chinese children using English as a
second language: Lexical and visual-orthographic processes. Applied Psycholinguistics,
24(1), 1-25.
214
Wang, M., Cheng, C., & Chen, S. (2006). Contribution of morphological awareness to
Chinese-English biliteracy acquisition. Journal of Educational Psychology, 98(3),
542-553.
Wang, M., Koda, K., & Perfetti, C. A. (2003). Alphabetic and nonalphabetic L1 effects in
English word identification: A comparison of Korean and Chinese English L2 learners.
Cognition, 87(2), 129-149.
Wang, M., Perfetti, C. A., & Liu, Y. (2005). Chinese-English biliteracy acquisition:
Cross-language and writing system transfer. Cognition, 97(1), 67-88.
Wang, Y., Lin, L., Kuhl, P., & Hirsch, J. (2007). Mathematical and linguistic processing
differs between native and second languages: An fMRI study. Brain Imaging and
Behavior, 1, 68-82.
Warrier, C. M., Johnson, K. L., Hayes, E. A., Nicol, T., & Kraus, N. (2004). Learning
impaired children exhibit timing deficits and training-related improvements in auditory
cortical responses to speech in noise. Experimental Brain Research, 157(4), 431-441.
Watson, B. U., & Miller, T. K. (1993). Auditory perception, phonological processing, and
reading Ability/Disability. Journal of Speech and Hearing Research, 36(4), 850-863.
Wells, B. (1995). Phonological considerations in repetition tests. Cognitive Neuropsychology,
12(8), 847.
Werker, J. F., & Yeung, H. H. (2005). Infant speech perception bootstraps word learning.
Trends in Cognitive Sciences, 9(11), 519-527.
Werner, H. (1948). Comparative psychology of mental development. New York: International
Universities Press.
215
Weston, R., & Gore, P. A. (2006). A brief guide to structural equation modeling. The
Counseling Psychologist, 34(5), 719-751.
Whitehurst, G. J., & Lonigan, C. J. (1998). Child development and emergent literacy. Child
Development, 69(3), pp. 848-872.
Whitley, M. S. (2002). Spanish/English contrasts: A course in Spanish linguistics. (2nd ed.).
Washington, DC: Georgetown University Press.
Williams, L. J., & Holahan, P. J. (1994). Parsimony-based fit indices for multiple-indicator
models: Do they work? Structural Equation Modeling: A Multidisciplinary Journal, 1(2),
161.
Wilson, R. S. (1979). Twin growth: Initial deficit, recovery, and trends in concordance from
birth to nine years. Annals of Human Biology, 6, 205-220.
Xue, G., Dong, Q., Jin, Z., Zhang, L., & Wang, Y. (2004). An fMRI study with semantic
access in low proficiency second language learners. NeuroReport, 15(5), 791-796.
Yip, V., & Matthews, S. (2000). Syntactic transfer in a Cantonese-English bilingual child.
Bilingualism, 3, 193-208.
Yule, G. (1985). The study of language: An introduction. Cambridge: Cambridge University
Press.
Zhao, X., & Li, P. (2010). Bilingual lexical interactions in an unsupervised neural network
model. International Journal of Bilingual Education and Bilingualism, 13(5), 505.
Ziegler, J. C., & Goswami, U. (2005). Reading acquisition, developmental dyslexia, and
skilled reading across languages: A psycholinguistic grain size theory. Psychological
Bulletin, 131(1), 3-29.

216
Zietsch, B. P., Hansen, J. L., Hansell, N. K., Geffen, G. M., Martin, N. G., & Wright, M. J.
(2007). Common and specific genetic influences on EEG power bands delta, theta, alpha,
and beta. Biological Psychology, 75(2), 154-164.

217
APPENDIX 1 PROJECT ADVERTISING
Appendix 1a: The project’s website: http://sites/google.com/site/hkoxtwin/english

218
Appendix 1b: A poster for the participant recruitment.
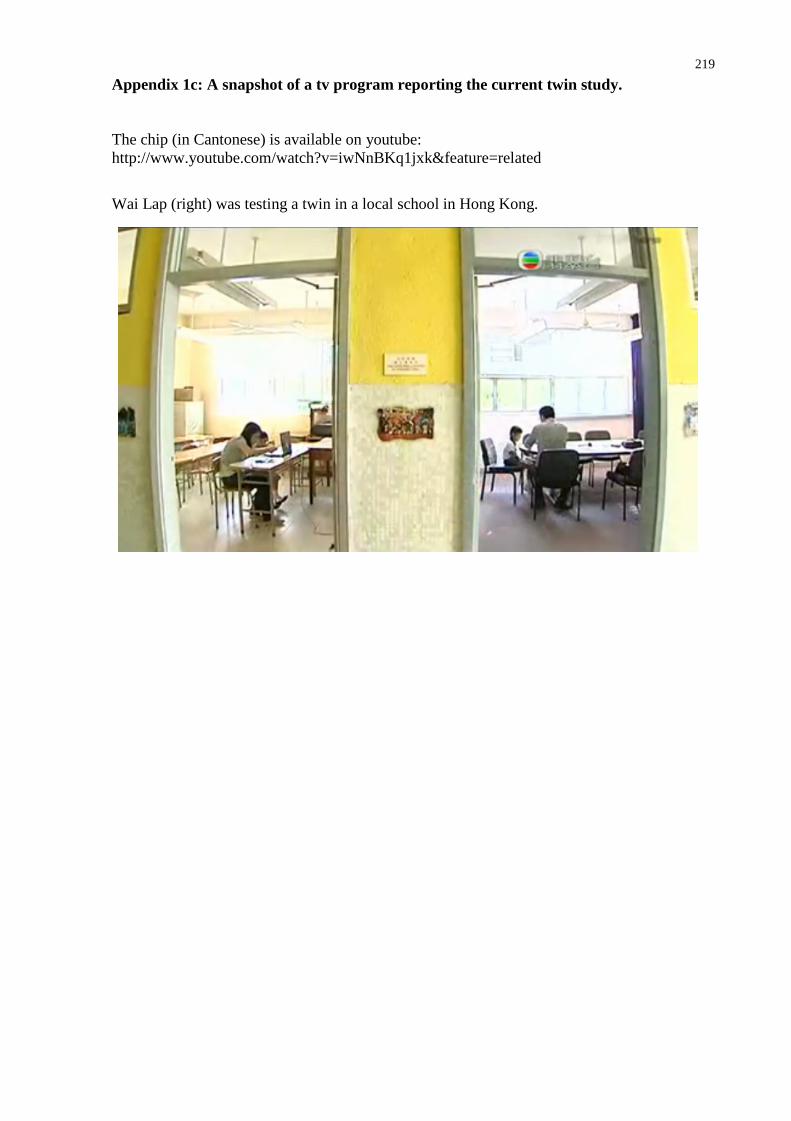
219
Appendix 1c: A snapshot of a tv program reporting the current twin study.
The chip (in Cantonese) is available on youtube:http://www.youtube.com/watch?v=iwNnBKq1jxk&feature=related
Wai Lap (right) was testing a twin in a local school in Hong Kong.
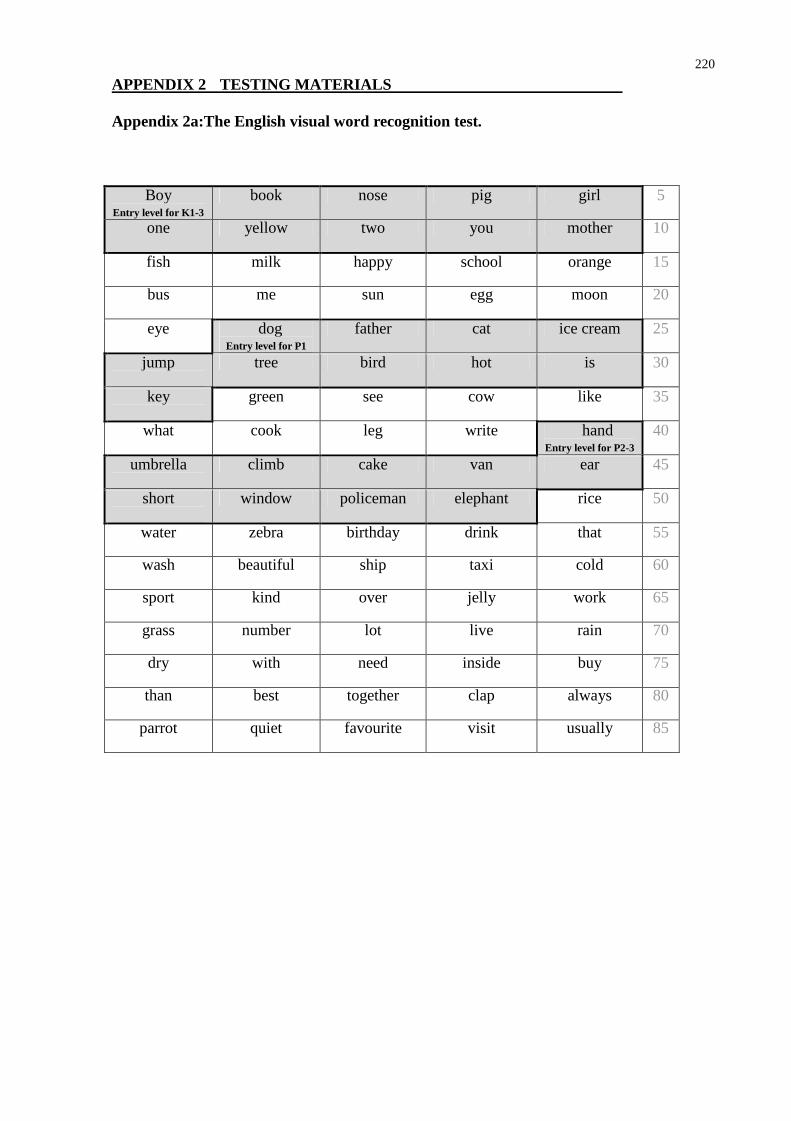
220
APPENDIX 2 TESTING MATERIALS
Appendix 2a:The English visual word recognition test.
BoyEntry level for K1-3
book nose pig girl 5
one yellow two you mother 10
fish milk happy school orange 15
bus me sun egg moon 20
eye dogEntry level for P1
father cat ice cream 25
jump tree bird hot is 30
key green see cow like 35
what cook leg write handEntry level for P2-3
40
umbrella climb cake van ear 45
short window policeman elephant rice 50
water zebra birthday drink that 55
wash beautiful ship taxi cold 60
sport kind over jelly work 65
grass number lot live rain 70
dry with need inside buy 75
than best together clap always 80
parrot quiet favourite visit usually 85
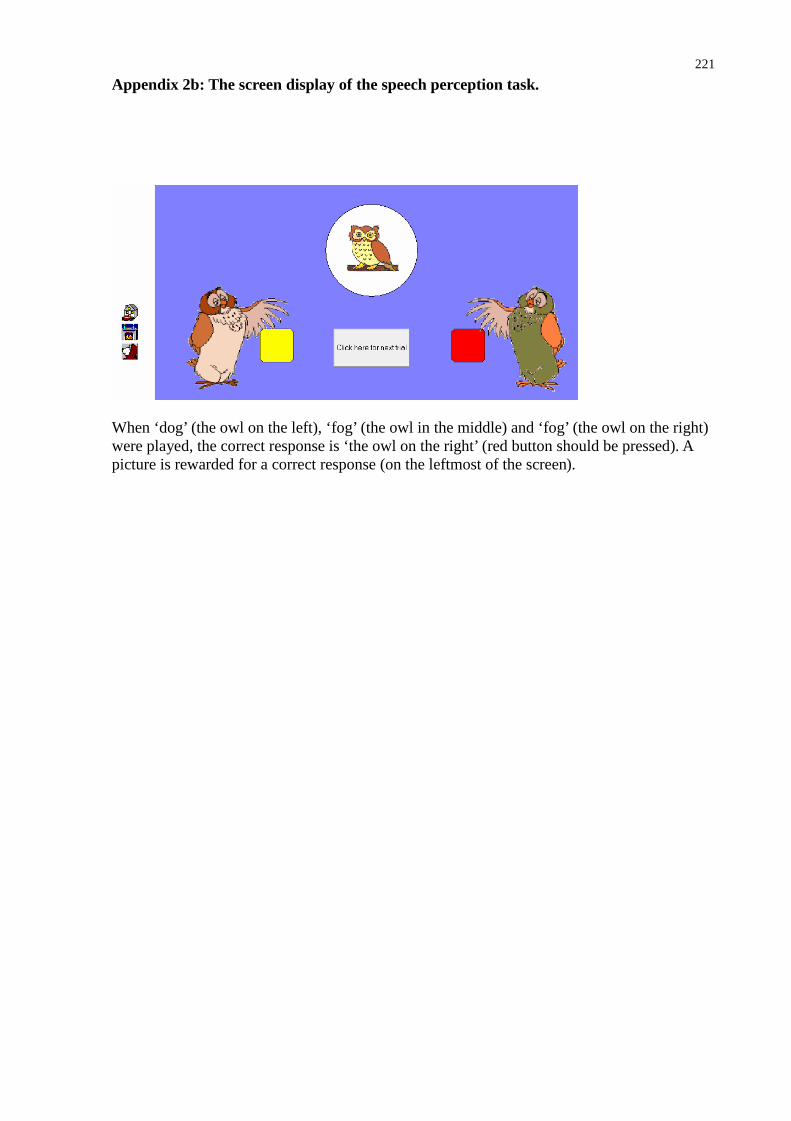
221
Appendix 2b: The screen display of the speech perception task.
When ‘dog’ (the owl on the left), ‘fog’ (the owl in the middle) and ‘fog’ (the owl on the right)were played, the correct response is ‘the owl on the right’ (red button should be pressed). Apicture is rewarded for a correct response (on the leftmost of the screen).

222
Appendix 2c: An example item of the tone awareness task.
a letter ( /seon3/) a lock ( /so2/) a pig ( /zyu1/)
The target is tone 1 (high-level tone), so the correct response is ‘pig (/zyu1/).

223
APPENDIX 3 DETAILS OF GOODNESS-OF-FIT INDICES
(1) Absolute fit measures
Chi-square (2)
It is commonly used for comparing the observed covariance matrix with the
expected covariance matrix. A chi-square value approaches zero indicates that there is no
difference between the observed and the predicted matrices and implies a perfect fit).
Chi-square is sensitive to changes in sample size. As the difference between two chi-squares
can be interpreted in the same way as chi-square, this allows comparison of models with
different degrees of freedom. As non-significant is looked for, higher p-values are better.
The .05 significance level is recommended as the minimum accepted (Hair et al., 1998)
Root Mean Square Error of Approximation (RMSEA)
The RMSEA is the discrepancy per degree of freedom and is relatively insensitive
to changes in the sample size. The value is representative of the goodness-of-fit that that could
be expected if the model were estimated in the population. The closer the index is to zero, the
better the fit indicated. A value of .05-.08 is considered adequate and values between .00-.05
indicate a good fit (Rigdon, 1996).
(2) Incremental fit measure
Comparative Fit Index (CFI)
The CFI represents comparisons between the estimated model and null or
independence model. The values lie between 0 and 1.0, with values close to .95 indicating
superior goodness-of-fit (Bentler, 1990). The CFI has been found to be more appropriate in a
model development strategy.

224
(3) Parsimonious fit measures
Akaike's (1987) Information Criterion (AIC)
AIC is comparative measure between models with different numbers of construct. It
carries a penalty in related to degrees of freedom but not sample size. It is equal to ‘number of
estimated parameters x (chi-square + 2). Zero or a larger negative number indicates a good fit.
It will favour simpler models over more complex ones.
Standardized Root Mean Square Residual (SRMR)
This measure is the standardized difference between the observed covariance and
predicted covariance. A value of zero indicates perfect fit. This measure tends to be smaller as
sample size increases and as the number of parameters in the model increases. A value less
than .08 is considered a good fit (Hu & Bentler, 1999).
Parsimonious Normed Fit Index (PNFI)
Higher values of PNFI are better, and its principle use is for the comparison of
models with differing degrees of freedom. When comparing between models, differences
of .06 to .09 are proposed to be indicative of substantial model differences (Williams &
Holahan, 1994).

225
APPENDIX 4 R SCRIPT (UNIVARIATE ACE MODEL)
Univariate ACE model analysis
# -----------------------------------------------------------------------# Program: Generic Univariate ACE with saturated model comparison# Author: DVM Bishop# Date: 15th March 2010# based on UnivariateTwinAnalysis_MatrixRaw.R by Hermine Maes
# Revision History by DVM Bishop & SWL Wong# 16/3/10: Added standard errors in output# 24/3/10: Amended DF computation for saturated model so will work if missing values# Automatically saves output table as tab-separated text# Added SE for squared unstandardized paths at end# 28/3/10: Added E model# 24/5/10: Added Standardized squared estimates, SE and CI# 25/5/10: Added Standardized squared estimates, SE and CI for ACE, AE, CE and E models# 25/5/10: Added AIC for all models# 05/6/10: Added "Fit Multivariate Model with Equal Means & Variances across Twin Order andZygosity"# Added description [=becomes equ; -becomes neg]# Added xlsReadWrite# -----------------------------------------------------------------------
require(OpenMx)require(psych)source("GenEpiHelperFunctions.R")require(xlsReadWrite)
mydatafile=read.table('file.dat', header = TRUE) # assumes column names in top line (otherwiseheader is FALSE)mycols=colnames(mydatafile)
validmz=mydatafile$zygo==1 validdz=mydatafile$zygo==2
# Specify here the column numbers you want to usecol1=41; col2=42myMZdata=mydatafile[validmz,col1:col2]myDZdata=mydatafile[validdz,col1:col2]
datasetname=c(mydatafile,mycols[col1]," and ",mycols[col2])colnames(myMZdata)=c("phenotype1"," phenotype2") colnames(myDZdata)=c("phenotype1","phenotype2")nucolnames=colnames(myMZdata)
summary(myMZdata)summary(myDZdata)
cov(myMZdata,use="complete") #don't include cases with missing datacov(myDZdata,use="complete")
# Count number of data observations (discarding missing); will be used for DF calculationMZlist=as.vector(as.matrix(myMZdata)) #put all MZ data in a single rowMZfinite=MZlist[is.finite(MZlist)] #retain those with finite valuesDZlist=as.vector(as.matrix(myDZdata)) # do the same with DZDZfinite=DZlist[is.finite(DZlist)]Nobs=length(MZfinite)+length(DZfinite)
# Print Descriptive Statistics

226
# -----------------------------------------------------------------------describe(myMZdata)colMeans(myMZdata,na.rm=TRUE)cov(myMZdata,use="complete")cor(myMZdata,use="complete")describe(myDZdata)colMeans(myDZdata,na.rm=TRUE)cov(myDZdata,use="complete")cor(myDZdata,use="complete")
# -----------------------------------------------------------------------#Fit Saturated Model with RawData and Matrices Input# -----------------------------------------------------------------------
# Model specification starts heremytwinSatModel <- mxModel("twinSat",
mxModel("MZ",mxMatrix(type="Full", nrow=1,ncol= 2, free=TRUE,values=c(0,0),name="expMeanMZ"),mxMatrix("Lower",nrow= 2,ncol=2,free=TRUE,values=.5,name="CholMZ"),mxAlgebra(CholMZ %*% t(CholMZ), name="expCovMZ"),mxData(myMZdata, type="raw"),mxFIMLObjective("expCovMZ", "expMeanMZ", nucolnames),
# Algebra's needed for equality constraints mxAlgebra( expression=expMeanMZ[1,1:1], name="expMeanMZt1"),
mxAlgebra( expression=expMeanMZ[1,2:2], name="expMeanMZt2"),mxAlgebra( expression=t(diag2vec(expCovMZ)), name="expVarMZ"),mxAlgebra( expression=expVarMZ[1,1:1], name="expVarMZt1"),mxAlgebra( expression=expVarMZ[1,2:2], name="expVarMZt2")),
mxModel("DZ",mxMatrix(type="Full", nrow=1,ncol= 2, free=TRUE, values=c(0,0), name="expMeanDZ"),mxMatrix(type="Lower", nrow=2, ncol=2, free=TRUE, values=.5, name="CholDZ"),mxAlgebra(CholDZ %*% t(CholDZ), name="expCovDZ"),mxData(myDZdata, type="raw"),mxFIMLObjective("expCovDZ", "expMeanDZ", nucolnames),
# Algebra's needed for equality constraints mxAlgebra( expression=expMeanDZ[1,1:1], name="expMeanDZt1"),
mxAlgebra( expression=expMeanDZ[1,2:2], name="expMeanDZt2"),mxAlgebra( expression=t(diag2vec(expCovDZ)), name="expVarDZ"),mxAlgebra( expression=expVarDZ[1,1:1], name="expVarDZt1"),mxAlgebra( expression=expVarDZ[1,2:2], name="expVarDZt2")),
mxAlgebra(MZ.objective + DZ.objective, name="twin"), # adds together likelihoods for MZ and DZgroups
mxAlgebraObjective("twin")) # evaluate expression from mxAlgebra, i.e. both submodelstogether#----------------------------------------------------------------------------------------------------------------------------mytwinSatFit <- mxRun(mytwinSatModel) #The mxRun command evaluates the model.
LL_Sat <- mxEval(objective, mytwinSatFit)summary(mxRun(mytwinSatModel))
#--------------------------------------------------------------------------------------------------------------------------# compute DF for this model # N observations (all rows and variables, minus N estimated parameters)DF_Sat=Nobs-nrow(mytwinSatFit@output$standardErrors)
# -----------------------------------------------------------------------
# Fit ACE Model with RawData and Matrices Input# -----------------------------------------------------------------------twinACEModel <- mxModel("twinACE",
# Matrices X, Y, and Z to store a, c, and e path coefficients

227
mxMatrix(type="Full", nrow=1,ncol=1,free=TRUE, values=.6,label="a",name="X",lbound=0),mxMatrix(type="Full", nrow=1, ncol=1,
free=TRUE,values=.6,label="c",name="Y",lbound=0),mxMatrix(type="Full", nrow=1, ncol=1,
free=TRUE,values=.6,label="e",name="Z",lbound=0),# Matrices A, C, and E compute variance components
mxAlgebra(expression=X %*% t(X), name="A"),mxAlgebra(expression=Y %*% t(Y), name="C"),mxAlgebra(expression=Z %*% t(Z), name="E"),mxMatrix(type="Full", nrow=1, ncol=2, free=TRUE, values= 20,label="mean",
name="expMean"),# Algebra for expected variance/covariance matrix in MZ
mxAlgebra(expression= rbind (cbind(A+C+E , A+C), cbind(A+C , A+C+E)),
name="expCovMZ"),# Algebra for expected variance/covariance matrix in DZ# note use of 0.5, converted to 1*1 matrix with Kronecker product
mxAlgebra(expression= rbind (cbind(A+C+E , 0.5%x%A+C), cbind(0.5%x%A+C , A+C+E)),
name="expCovDZ"),
mxModel("MZ", mxData(observed=myMZdata, type="raw"),
mxFIMLObjective(covariance="twinACE.expCovMZ",means="twinACE.expMean",dimnames=nucolnames)),
mxModel("DZ", mxData(observed=myDZdata, type="raw"), mxFIMLObjective(
covariance="twinACE.expCovDZ",means="twinACE.expMean",dimnames=nucolnames)),
mxAlgebra(expression=MZ.objective + DZ.objective, name="twin"),mxAlgebraObjective("twin")
)
#Run ACE model# -----------------------------------------------------------------------twinACEFit <- mxRun(twinACEModel)
DF_ACE=Nobs-nrow(twinACEFit@output$standardErrors)LL_ACE <- mxEval(objective, twinACEFit)mychi_ACE= LL_ACE - LL_Sat #subtract LL for Saturated model from LL for ACEmychi_DF_ACE=DF_ACE-DF_Sat #subtract DF for Saturated model from DF for ACEmychi_p_ACE=1-pchisq(mychi_ACE,mychi_DF_ACE)# compute chi square probability
expMZcov_ACE <- mxEval(expCovMZ, twinACEFit) # expected covariance matrix forMZ'sexpDZcov_ACE <- mxEval(expCovDZ, twinACEFit) # expected covariance matrix forDZ'sexpMeans_ACE <- mxEval(expMean, twinACEFit) # expected meanA_ACE <- mxEval(a*a, twinACEFit) # additive genetic variance, a^2C_ACE <- mxEval(c*c, twinACEFit) # shared environmental variance, c^2E_ACE <- mxEval(e*e, twinACEFit) # unique environmental variance, e^2V <- (A_ACE+C_ACE+E_ACE) # total variancea2_ACE <- A_ACE/V # standardized additive genetic variancec2_ACE <- C_ACE/V # standardized shared environmentalvariancee2_ACE <- E_ACE/V # standardized unique environmentalvariance
ACE_mySE=round(twinACEFit@output$standardErrors,3)
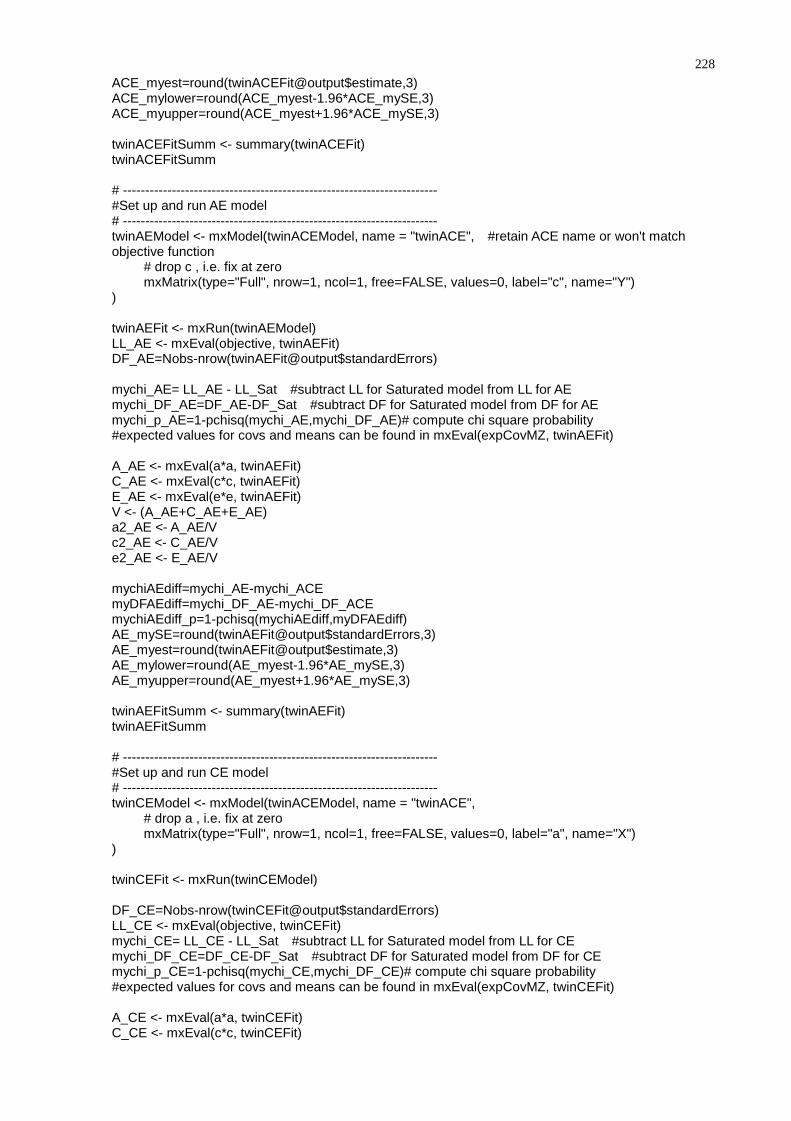
228
ACE_myest=round(twinACEFit@output$estimate,3)ACE_mylower=round(ACE_myest-1.96*ACE_mySE,3)ACE_myupper=round(ACE_myest+1.96*ACE_mySE,3)
twinACEFitSumm <- summary(twinACEFit)twinACEFitSumm
# -----------------------------------------------------------------------#Set up and run AE model# -----------------------------------------------------------------------twinAEModel <- mxModel(twinACEModel, name = "twinACE", #retain ACE name or won't matchobjective function
# drop c , i.e. fix at zeromxMatrix(type="Full", nrow=1, ncol=1, free=FALSE, values=0, label="c", name="Y")
)
twinAEFit <- mxRun(twinAEModel)LL_AE <- mxEval(objective, twinAEFit)DF_AE=Nobs-nrow(twinAEFit@output$standardErrors)
mychi_AE= LL_AE - LL_Sat #subtract LL for Saturated model from LL for AEmychi_DF_AE=DF_AE-DF_Sat #subtract DF for Saturated model from DF for AEmychi_p_AE=1-pchisq(mychi_AE,mychi_DF_AE)# compute chi square probability#expected values for covs and means can be found in mxEval(expCovMZ, twinAEFit)
A_AE <- mxEval(a*a, twinAEFit)C_AE <- mxEval(c*c, twinAEFit)E_AE <- mxEval(e*e, twinAEFit)V <- (A_AE+C_AE+E_AE)a2_AE <- A_AE/Vc2_AE <- C_AE/Ve2_AE <- E_AE/V
mychiAEdiff=mychi_AE-mychi_ACEmyDFAEdiff=mychi_DF_AE-mychi_DF_ACEmychiAEdiff_p=1-pchisq(mychiAEdiff,myDFAEdiff)AE_mySE=round(twinAEFit@output$standardErrors,3)AE_myest=round(twinAEFit@output$estimate,3)AE_mylower=round(AE_myest-1.96*AE_mySE,3)AE_myupper=round(AE_myest+1.96*AE_mySE,3)
twinAEFitSumm <- summary(twinAEFit)twinAEFitSumm
# -----------------------------------------------------------------------#Set up and run CE model# -----------------------------------------------------------------------twinCEModel <- mxModel(twinACEModel, name = "twinACE",
# drop a , i.e. fix at zeromxMatrix(type="Full", nrow=1, ncol=1, free=FALSE, values=0, label="a", name="X")
)
twinCEFit <- mxRun(twinCEModel)
DF_CE=Nobs-nrow(twinCEFit@output$standardErrors)LL_CE <- mxEval(objective, twinCEFit)mychi_CE= LL_CE - LL_Sat #subtract LL for Saturated model from LL for CEmychi_DF_CE=DF_CE-DF_Sat #subtract DF for Saturated model from DF for CEmychi_p_CE=1-pchisq(mychi_CE,mychi_DF_CE)# compute chi square probability#expected values for covs and means can be found in mxEval(expCovMZ, twinCEFit)
A_CE <- mxEval(a*a, twinCEFit)C_CE <- mxEval(c*c, twinCEFit)

229
E_CE <- mxEval(e*e, twinCEFit)V <- (A_CE+C_CE+E_CE)a2_CE <- A_CE/Vc2_CE <- C_CE/Ve2_CE <- E_CE/V
mychiCEdiff=mychi_CE-mychi_ACEmyDFCEdiff=mychi_DF_CE-mychi_DF_ACEmychiCEdiff_p=1-pchisq(mychiCEdiff,myDFCEdiff)CE_mySE=round(twinCEFit@output$standardErrors,3)CE_myest=round(twinCEFit@output$estimate,3)CE_mylower=round(CE_myest-1.96*CE_mySE,3)CE_myupper=round(CE_myest+1.96*CE_mySE,3)
twinCEFitSumm <- summary(twinCEFit)twinCEFitSumm
# -----------------------------------------------------------------------#Set up and run E model# -----------------------------------------------------------------------twinEModel <- mxModel(twinACEModel, name = "twinACE",
# drop a , i.e. fix at zeromxMatrix(type="Full", nrow=1, ncol=1, free=FALSE, values=0, label="a", name="X"),
mxMatrix(type="Full", nrow=1, ncol=1, free=FALSE, values=0, label="c", name="Y"))
twinEFit <- mxRun(twinEModel)
DF_E=Nobs-nrow(twinEFit@output$standardErrors)LL_E <- mxEval(objective, twinEFit)mychi_E= LL_E - LL_Sat #subtract LL for Saturated model from LL for Emychi_DF_E=DF_E-DF_Sat #subtract DF for Saturated model from DF for Emychi_p_E=1-pchisq(mychi_E,mychi_DF_E)# compute chi square probability#expected values for covs and means can be found in mxEval(expCovMZ, twinCEFit)
A_E <- mxEval(a*a, twinEFit)C_E <- mxEval(c*c, twinEFit)E_E <- mxEval(e*e, twinEFit)V <- (A_E+C_E+E_E)a2_E <- A_E/Vc2_E <- C_E/Ve2_E <- E_E/V
mychiEdiff=mychi_E-mychi_ACEmyDFEdiff=mychi_DF_E-mychi_DF_ACEmychiEdiff_p=1-pchisq(mychiEdiff,myDFEdiff)mychiAEvsEdiff=mychi_E-mychi_AEmyDFAEvsEdiff=mychi_DF_E-mychi_DF_AEmychiAEvsEdiff_p=1-pchisq(mychiAEvsEdiff,myDFAEvsEdiff)
E_mySE=round(twinEFit@output$standardErrors,3)E_myest=round(twinEFit@output$estimate,3)E_mylower=round(E_myest-1.96*E_mySE,3)E_myupper=round(E_myest+1.96*E_mySE,3)
twinEFitSumm <- summary(twinEFit)twinEFitSumm
#----------------------------------------------------------------------------------------------# Generate SE, CI for squared paths#----------------------------------------------------------------------------------------------
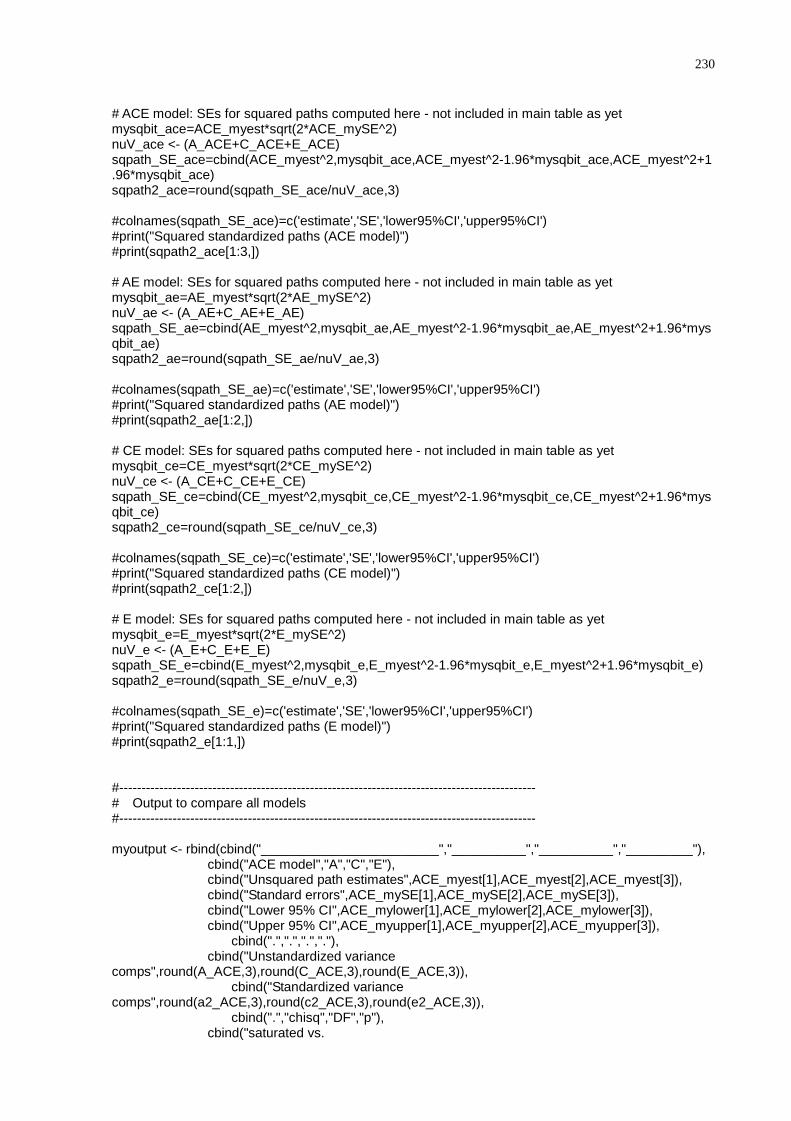
230
# ACE model: SEs for squared paths computed here - not included in main table as yetmysqbit_ace=ACE_myest*sqrt(2*ACE_mySE^2)nuV_ace <- (A_ACE+C_ACE+E_ACE)sqpath_SE_ace=cbind(ACE_myest^2,mysqbit_ace,ACE_myest^2-1.96*mysqbit_ace,ACE_myest^2+1.96*mysqbit_ace)sqpath2_ace=round(sqpath_SE_ace/nuV_ace,3)
#colnames(sqpath_SE_ace)=c('estimate','SE','lower95%CI','upper95%CI')#print("Squared standardized paths (ACE model)")#print(sqpath2_ace[1:3,])
# AE model: SEs for squared paths computed here - not included in main table as yetmysqbit_ae=AE_myest*sqrt(2*AE_mySE^2)nuV_ae <- (A_AE+C_AE+E_AE)sqpath_SE_ae=cbind(AE_myest^2,mysqbit_ae,AE_myest^2-1.96*mysqbit_ae,AE_myest^2+1.96*mysqbit_ae)sqpath2_ae=round(sqpath_SE_ae/nuV_ae,3)
#colnames(sqpath_SE_ae)=c('estimate','SE','lower95%CI','upper95%CI')#print("Squared standardized paths (AE model)")#print(sqpath2_ae[1:2,])
# CE model: SEs for squared paths computed here - not included in main table as yetmysqbit_ce=CE_myest*sqrt(2*CE_mySE^2)nuV_ce <- (A_CE+C_CE+E_CE)sqpath_SE_ce=cbind(CE_myest^2,mysqbit_ce,CE_myest^2-1.96*mysqbit_ce,CE_myest^2+1.96*mysqbit_ce)sqpath2_ce=round(sqpath_SE_ce/nuV_ce,3)
#colnames(sqpath_SE_ce)=c('estimate','SE','lower95%CI','upper95%CI')#print("Squared standardized paths (CE model)")#print(sqpath2_ce[1:2,])
# E model: SEs for squared paths computed here - not included in main table as yetmysqbit_e=E_myest*sqrt(2*E_mySE^2)nuV_e <- (A_E+C_E+E_E)sqpath_SE_e=cbind(E_myest^2,mysqbit_e,E_myest^2-1.96*mysqbit_e,E_myest^2+1.96*mysqbit_e)sqpath2_e=round(sqpath_SE_e/nuV_e,3)
#colnames(sqpath_SE_e)=c('estimate','SE','lower95%CI','upper95%CI')#print("Squared standardized paths (E model)")#print(sqpath2_e[1:1,])
#----------------------------------------------------------------------------------------------# Output to compare all models#----------------------------------------------------------------------------------------------
myoutput <- rbind(cbind("________________________","__________","__________","_________"),cbind("ACE model","A","C","E"),cbind("Unsquared path estimates",ACE_myest[1],ACE_myest[2],ACE_myest[3]),cbind("Standard errors",ACE_mySE[1],ACE_mySE[2],ACE_mySE[3]),cbind("Lower 95% CI",ACE_mylower[1],ACE_mylower[2],ACE_mylower[3]),cbind("Upper 95% CI",ACE_myupper[1],ACE_myupper[2],ACE_myupper[3]),
cbind(".",".",".","."),cbind("Unstandardized variance
comps",round(A_ACE,3),round(C_ACE,3),round(E_ACE,3)), cbind("Standardized variancecomps",round(a2_ACE,3),round(c2_ACE,3),round(e2_ACE,3)), cbind(".","chisq","DF","p"),
cbind("saturated vs.
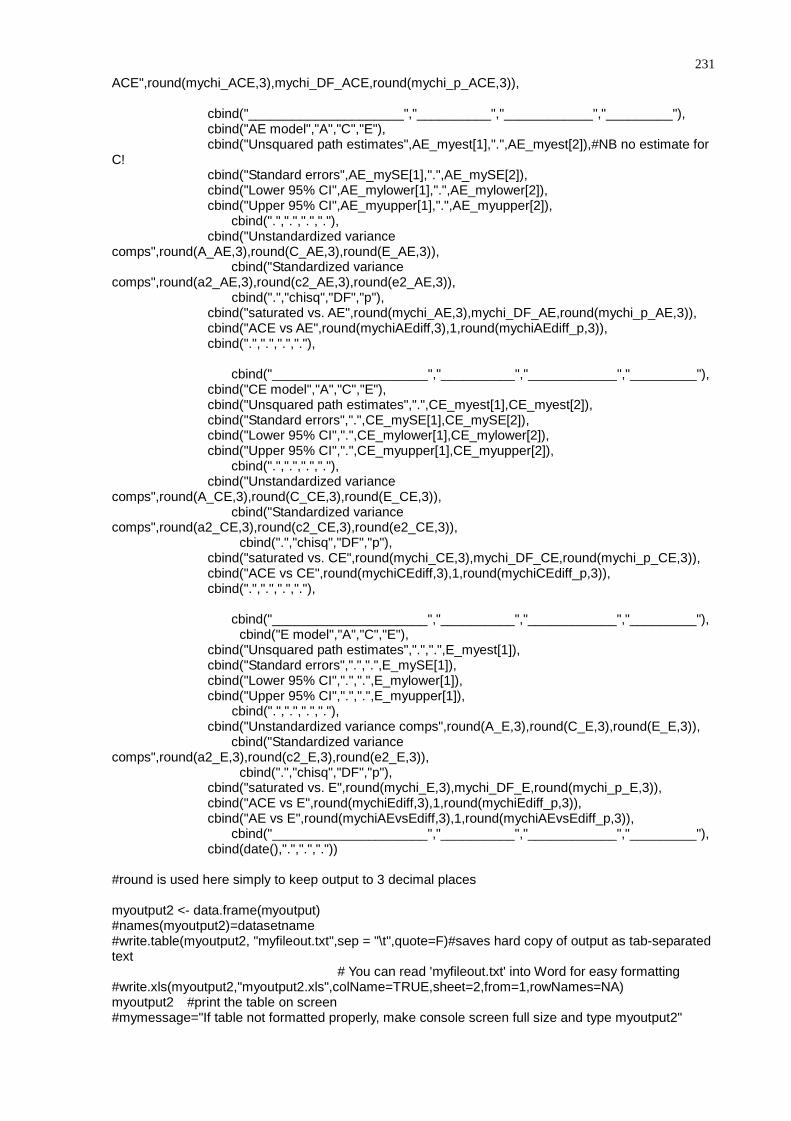
231
ACE",round(mychi_ACE,3),mychi_DF_ACE,round(mychi_p_ACE,3)),
cbind("_____________________","__________","____________","_________"),cbind("AE model","A","C","E"),cbind("Unsquared path estimates",AE_myest[1],".",AE_myest[2]),#NB no estimate for
C!cbind("Standard errors",AE_mySE[1],".",AE_mySE[2]),cbind("Lower 95% CI",AE_mylower[1],".",AE_mylower[2]),cbind("Upper 95% CI",AE_myupper[1],".",AE_myupper[2]),
cbind(".",".",".","."),cbind("Unstandardized variance
comps",round(A_AE,3),round(C_AE,3),round(E_AE,3)), cbind("Standardized variancecomps",round(a2_AE,3),round(c2_AE,3),round(e2_AE,3)),
cbind(".","chisq","DF","p"),cbind("saturated vs. AE",round(mychi_AE,3),mychi_DF_AE,round(mychi_p_AE,3)),cbind("ACE vs AE",round(mychiAEdiff,3),1,round(mychiAEdiff_p,3)),cbind(".",".",".","."),
cbind("_____________________","__________","____________","_________"),cbind("CE model","A","C","E"),cbind("Unsquared path estimates",".",CE_myest[1],CE_myest[2]),cbind("Standard errors",".",CE_mySE[1],CE_mySE[2]),cbind("Lower 95% CI",".",CE_mylower[1],CE_mylower[2]),cbind("Upper 95% CI",".",CE_myupper[1],CE_myupper[2]),
cbind(".",".",".","."),cbind("Unstandardized variance
comps",round(A_CE,3),round(C_CE,3),round(E_CE,3)), cbind("Standardized variancecomps",round(a2_CE,3),round(c2_CE,3),round(e2_CE,3)),
cbind(".","chisq","DF","p"),cbind("saturated vs. CE",round(mychi_CE,3),mychi_DF_CE,round(mychi_p_CE,3)),cbind("ACE vs CE",round(mychiCEdiff,3),1,round(mychiCEdiff_p,3)),cbind(".",".",".","."),
cbind("_____________________","__________","____________","_________"),cbind("E model","A","C","E"),
cbind("Unsquared path estimates",".",".",E_myest[1]),cbind("Standard errors",".",".",E_mySE[1]),cbind("Lower 95% CI",".",".",E_mylower[1]),cbind("Upper 95% CI",".",".",E_myupper[1]),
cbind(".",".",".","."),cbind("Unstandardized variance comps",round(A_E,3),round(C_E,3),round(E_E,3)),
cbind("Standardized variancecomps",round(a2_E,3),round(c2_E,3),round(e2_E,3)),
cbind(".","chisq","DF","p"),cbind("saturated vs. E",round(mychi_E,3),mychi_DF_E,round(mychi_p_E,3)),cbind("ACE vs E",round(mychiEdiff,3),1,round(mychiEdiff_p,3)),cbind("AE vs E",round(mychiAEvsEdiff,3),1,round(mychiAEvsEdiff_p,3)),
cbind("_____________________","__________","____________","_________"),cbind(date(),".",".","."))
#round is used here simply to keep output to 3 decimal places
myoutput2 <- data.frame(myoutput)#names(myoutput2)=datasetname#write.table(myoutput2, "myfileout.txt",sep = "\t",quote=F)#saves hard copy of output as tab-separatedtext # You can read 'myfileout.txt' into Word for easy formatting#write.xls(myoutput2,"myoutput2.xls",colName=TRUE,sheet=2,from=1,rowNames=NA)myoutput2 #print the table on screen#mymessage="If table not formatted properly, make console screen full size and type myoutput2"

232
print(sqpath2_ace[1:3,])print(sqpath2_ae[1:2,])print(sqpath2_ce[1:2,])print(sqpath2_e[1:1,])
twinACENested <- list(twinAEFit, twinCEFit, twinEFit)tableFitStatistics(twinACEFit,twinACENested)

233
APPENDIX 5 R SCRIPT (UNIVARIATE ADE MODEL)
The first part of the scripts for running the ACE and ADE models overlap until ‘Fit ACE
(ADE) Model with RawData and Matrices Input’.
# -----------------------------------------------------------------------
# Fit ADE Model with RawData and Matrices Input# -----------------------------------------------------------------------twinADEModel <- mxModel("twinADE",
# Matrices X, Y, and Z to store a, d, and e path coefficientsmxMatrix(type="Full", nrow=1,ncol=1,free=TRUE,
values=.6,label="a",name="X",lbound=0),mxMatrix(type="Full", nrow=1, ncol=1,
free=TRUE,values=.6,label="d",name="Y",lbound=0),mxMatrix(type="Full", nrow=1, ncol=1,
free=TRUE,values=.6,label="e",name="Z",lbound=0),# Matrices A, D, and E compute variance components
mxAlgebra(expression=X %*% t(X), name="A"),mxAlgebra(expression=Y %*% t(Y), name="D"),mxAlgebra(expression=Z %*% t(Z), name="E"),
mxMatrix(type="Full", nrow=1, ncol=2, free=TRUE, values= 20,label="mean",name="expMean"),
# Algebra for expected variance/covariance matrix in MZmxAlgebra(expression= rbind (cbind(A+D+E , A+D),
cbind(A+D , A+D+E)),name="expCovMZ"),# Algebra for expected variance/covariance matrix in DZ# note use of 0.5, converted to 1*1 matrix with Kronecker product
mxAlgebra(expression= rbind (cbind(A+D+E ,0.5%x%A+0.25%x%D),
cbind(0.5%x%A+0.25%x%D , A+D+E)),name="expCovDZ"),
mxModel("MZ", mxData(observed=myMZdata, type="raw"),
mxFIMLObjective(covariance="twinADE.expCovMZ",means="twinADE.expMean",dimnames=nucolnames)),
mxModel("DZ", mxData(observed=myDZdata, type="raw"), mxFIMLObjective(
covariance="twinADE.expCovDZ",means="twinADE.expMean",dimnames=nucolnames)),
mxAlgebra(expression=MZ.objective + DZ.objective, name="twin"),mxAlgebraObjective("twin")
)

234
#Run ADE model# -----------------------------------------------------------------------twinADEFit <- mxRun(twinADEModel)
DF_ADE=Nobs-nrow(twinADEFit@output$standardErrors)LL_ADE <- mxEval(objective, twinADEFit)mychi_ADE= LL_ADE - LL_Sat #subtract LL for Saturated model from LL for ADEmychi_DF_ADE=DF_ADE-DF_Sat #subtract DF for Saturated model from DF forADEmychi_p_ADE=1-pchisq(mychi_ADE,mychi_DF_ADE)# compute chi squareprobability
expMZcov_ADE <- mxEval(expCovMZ, twinADEFit) # expectedcovariance matrix for MZ'sexpDZcov_ADE <- mxEval(expCovDZ, twinADEFit) # expectedcovariance matrix for DZ'sexpMeans_ADE <- mxEval(expMean, twinADEFit) # expected meanA_ADE <- mxEval(a*a, twinADEFit) # additive genetic variance,a^2D_ADE <- mxEval(d*d, twinADEFit) # shared environmentalvariance, c^2E_ADE <- mxEval(e*e, twinADEFit) # unique environmentalvariance, e^2V <- (A_ADE+D_ADE+E_ADE) # total variancea2_ADE <- A_ADE/V # standardized additive geneticvarianced2_ADE <- D_ADE/V # standardized sharedenvironmental variancee2_ADE <- E_ADE/V # standardized uniqueenvironmental variance
ADE_mySE=round(twinADEFit@output$standardErrors,3)ADE_myest=round(twinADEFit@output$estimate,3)ADE_mylower=round(ADE_myest-1.96*ADE_mySE,3)ADE_myupper=round(ADE_myest+1.96*ADE_mySE,3)
twinADEFitSumm <- summary(twinADEFit)twinADEFitSumm
# -----------------------------------------------------------------------#Set up and run AE model [test significance of D]# -----------------------------------------------------------------------twinAEModel <- mxModel(twinADEModel, name = "twinADE", #retain ADE name orwon't match objective function
# drop c , i.e. fix at zeromxMatrix(type="Full", nrow=1, ncol=1, free=FALSE, values=0, label="d",
name="Y"))
twinAEFit <- mxRun(twinAEModel)LL_AE <- mxEval(objective, twinAEFit)DF_AE=Nobs-nrow(twinAEFit@output$standardErrors)
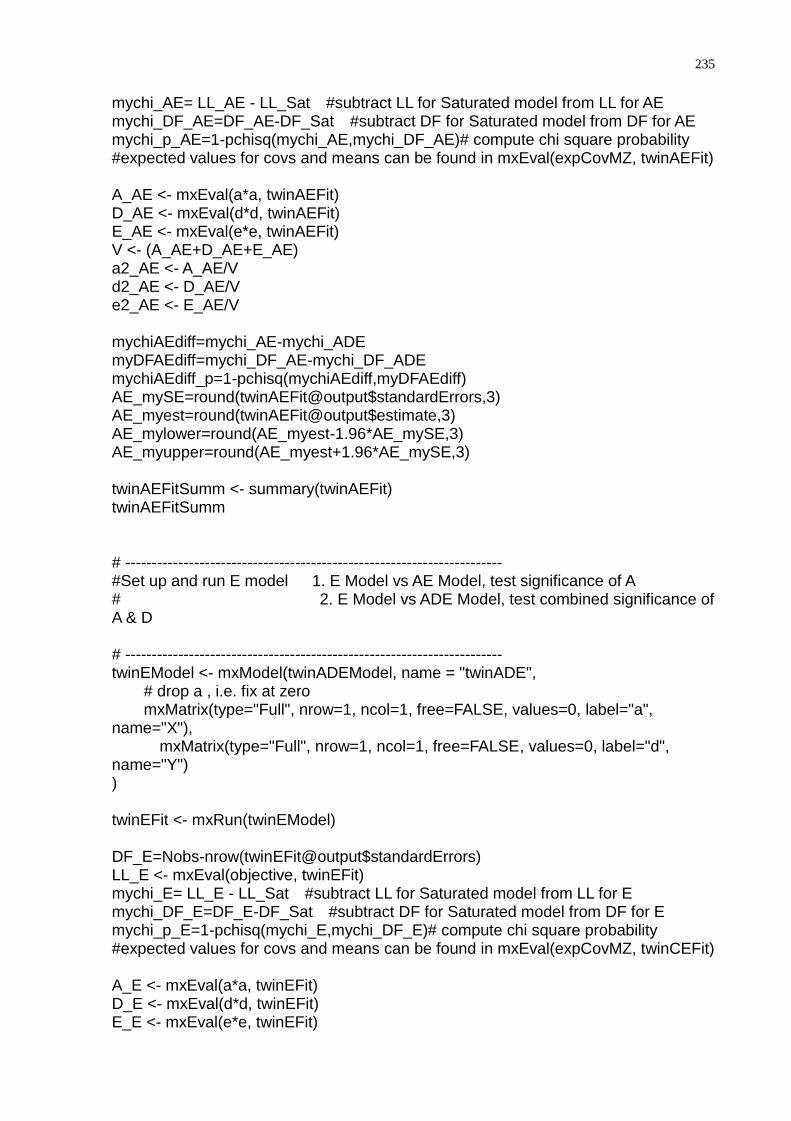
235
mychi_AE= LL_AE - LL_Sat #subtract LL for Saturated model from LL for AEmychi_DF_AE=DF_AE-DF_Sat #subtract DF for Saturated model from DF for AEmychi_p_AE=1-pchisq(mychi_AE,mychi_DF_AE)# compute chi square probability#expected values for covs and means can be found in mxEval(expCovMZ, twinAEFit)
A_AE <- mxEval(a*a, twinAEFit)D_AE <- mxEval(d*d, twinAEFit)E_AE <- mxEval(e*e, twinAEFit)V <- (A_AE+D_AE+E_AE)a2_AE <- A_AE/Vd2_AE <- D_AE/Ve2_AE <- E_AE/V
mychiAEdiff=mychi_AE-mychi_ADEmyDFAEdiff=mychi_DF_AE-mychi_DF_ADEmychiAEdiff_p=1-pchisq(mychiAEdiff,myDFAEdiff)AE_mySE=round(twinAEFit@output$standardErrors,3)AE_myest=round(twinAEFit@output$estimate,3)AE_mylower=round(AE_myest-1.96*AE_mySE,3)AE_myupper=round(AE_myest+1.96*AE_mySE,3)
twinAEFitSumm <- summary(twinAEFit)twinAEFitSumm
# -----------------------------------------------------------------------#Set up and run E model 1. E Model vs AE Model, test significance of A# 2. E Model vs ADE Model, test combined significance ofA & D
# -----------------------------------------------------------------------twinEModel <- mxModel(twinADEModel, name = "twinADE",
# drop a , i.e. fix at zeromxMatrix(type="Full", nrow=1, ncol=1, free=FALSE, values=0, label="a",
name="X"), mxMatrix(type="Full", nrow=1, ncol=1, free=FALSE, values=0, label="d",name="Y"))
twinEFit <- mxRun(twinEModel)
DF_E=Nobs-nrow(twinEFit@output$standardErrors)LL_E <- mxEval(objective, twinEFit)mychi_E= LL_E - LL_Sat #subtract LL for Saturated model from LL for Emychi_DF_E=DF_E-DF_Sat #subtract DF for Saturated model from DF for Emychi_p_E=1-pchisq(mychi_E,mychi_DF_E)# compute chi square probability#expected values for covs and means can be found in mxEval(expCovMZ, twinCEFit)
A_E <- mxEval(a*a, twinEFit)D_E <- mxEval(d*d, twinEFit)E_E <- mxEval(e*e, twinEFit)
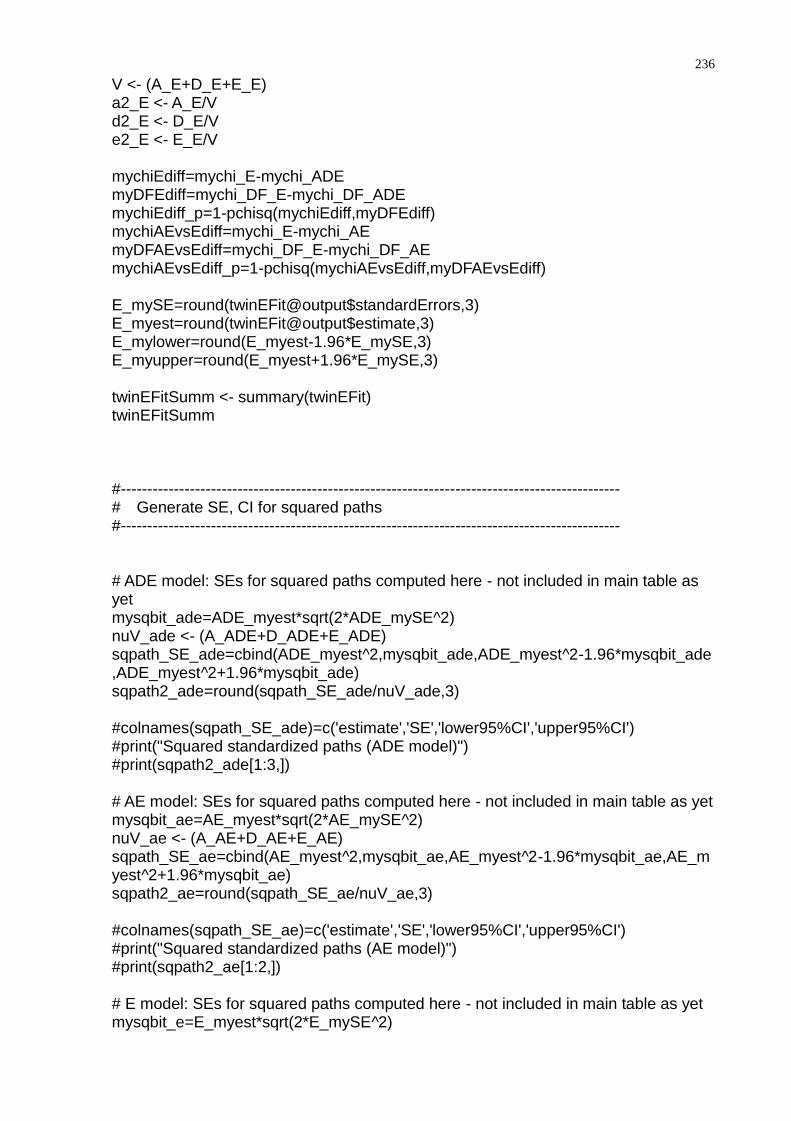
236
V <- (A_E+D_E+E_E)a2_E <- A_E/Vd2_E <- D_E/Ve2_E <- E_E/V
mychiEdiff=mychi_E-mychi_ADEmyDFEdiff=mychi_DF_E-mychi_DF_ADEmychiEdiff_p=1-pchisq(mychiEdiff,myDFEdiff)mychiAEvsEdiff=mychi_E-mychi_AEmyDFAEvsEdiff=mychi_DF_E-mychi_DF_AEmychiAEvsEdiff_p=1-pchisq(mychiAEvsEdiff,myDFAEvsEdiff)
E_mySE=round(twinEFit@output$standardErrors,3)E_myest=round(twinEFit@output$estimate,3)E_mylower=round(E_myest-1.96*E_mySE,3)E_myupper=round(E_myest+1.96*E_mySE,3)
twinEFitSumm <- summary(twinEFit)twinEFitSumm
#----------------------------------------------------------------------------------------------# Generate SE, CI for squared paths#----------------------------------------------------------------------------------------------
# ADE model: SEs for squared paths computed here - not included in main table asyetmysqbit_ade=ADE_myest*sqrt(2*ADE_mySE^2)nuV_ade <- (A_ADE+D_ADE+E_ADE)sqpath_SE_ade=cbind(ADE_myest^2,mysqbit_ade,ADE_myest^2-1.96*mysqbit_ade,ADE_myest^2+1.96*mysqbit_ade)sqpath2_ade=round(sqpath_SE_ade/nuV_ade,3)
#colnames(sqpath_SE_ade)=c('estimate','SE','lower95%CI','upper95%CI')#print("Squared standardized paths (ADE model)")#print(sqpath2_ade[1:3,])
# AE model: SEs for squared paths computed here - not included in main table as yetmysqbit_ae=AE_myest*sqrt(2*AE_mySE^2)nuV_ae <- (A_AE+D_AE+E_AE)sqpath_SE_ae=cbind(AE_myest^2,mysqbit_ae,AE_myest^2-1.96*mysqbit_ae,AE_myest^2+1.96*mysqbit_ae)sqpath2_ae=round(sqpath_SE_ae/nuV_ae,3)
#colnames(sqpath_SE_ae)=c('estimate','SE','lower95%CI','upper95%CI')#print("Squared standardized paths (AE model)")#print(sqpath2_ae[1:2,])
# E model: SEs for squared paths computed here - not included in main table as yetmysqbit_e=E_myest*sqrt(2*E_mySE^2)
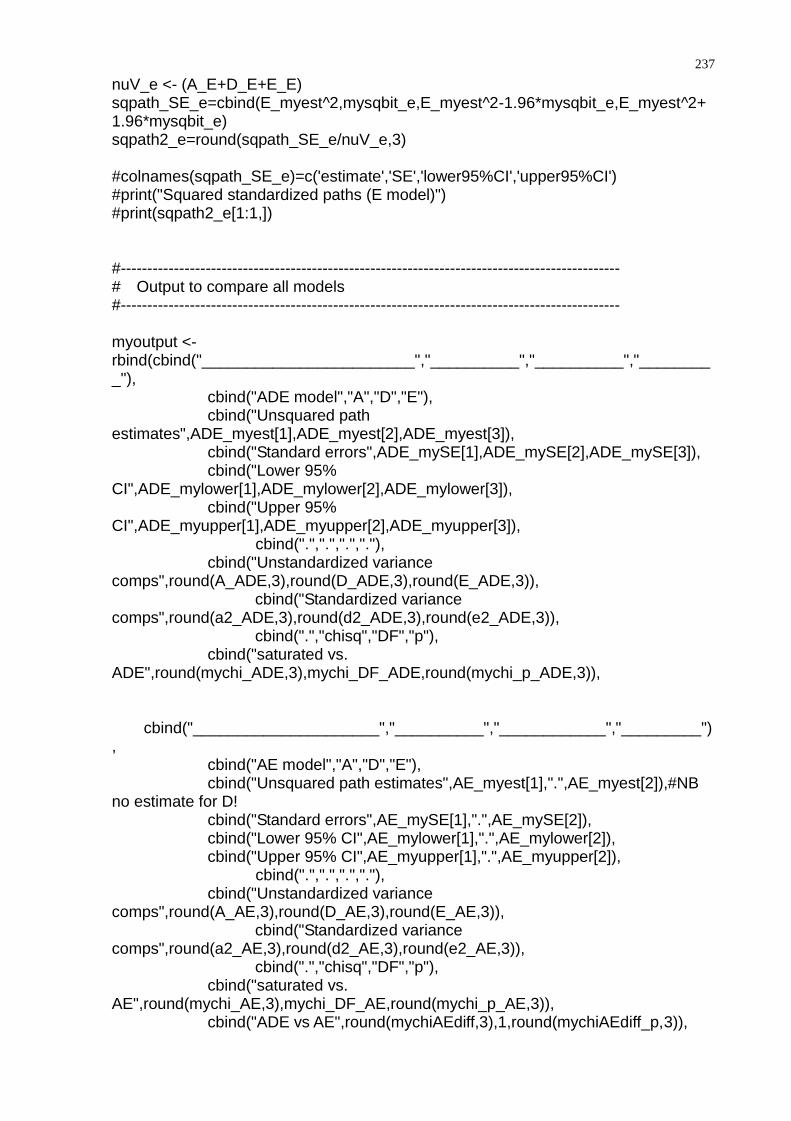
237
nuV_e <- (A_E+D_E+E_E)sqpath_SE_e=cbind(E_myest^2,mysqbit_e,E_myest^2-1.96*mysqbit_e,E_myest^2+1.96*mysqbit_e)sqpath2_e=round(sqpath_SE_e/nuV_e,3)
#colnames(sqpath_SE_e)=c('estimate','SE','lower95%CI','upper95%CI')#print("Squared standardized paths (E model)")#print(sqpath2_e[1:1,])
#----------------------------------------------------------------------------------------------# Output to compare all models#----------------------------------------------------------------------------------------------
myoutput <-rbind(cbind("________________________","__________","__________","_________"),
cbind("ADE model","A","D","E"),cbind("Unsquared path
estimates",ADE_myest[1],ADE_myest[2],ADE_myest[3]),cbind("Standard errors",ADE_mySE[1],ADE_mySE[2],ADE_mySE[3]),cbind("Lower 95%
CI",ADE_mylower[1],ADE_mylower[2],ADE_mylower[3]),cbind("Upper 95%
CI",ADE_myupper[1],ADE_myupper[2],ADE_myupper[3]),cbind(".",".",".","."),
cbind("Unstandardized variancecomps",round(A_ADE,3),round(D_ADE,3),round(E_ADE,3)), cbind("Standardized variancecomps",round(a2_ADE,3),round(d2_ADE,3),round(e2_ADE,3)), cbind(".","chisq","DF","p"),
cbind("saturated vs.ADE",round(mychi_ADE,3),mychi_DF_ADE,round(mychi_p_ADE,3)),
cbind("_____________________","__________","____________","_________"),
cbind("AE model","A","D","E"),cbind("Unsquared path estimates",AE_myest[1],".",AE_myest[2]),#NB
no estimate for D!cbind("Standard errors",AE_mySE[1],".",AE_mySE[2]),cbind("Lower 95% CI",AE_mylower[1],".",AE_mylower[2]),cbind("Upper 95% CI",AE_myupper[1],".",AE_myupper[2]),
cbind(".",".",".","."),cbind("Unstandardized variance
comps",round(A_AE,3),round(D_AE,3),round(E_AE,3)), cbind("Standardized variancecomps",round(a2_AE,3),round(d2_AE,3),round(e2_AE,3)), cbind(".","chisq","DF","p"),
cbind("saturated vs.AE",round(mychi_AE,3),mychi_DF_AE,round(mychi_p_AE,3)),
cbind("ADE vs AE",round(mychiAEdiff,3),1,round(mychiAEdiff_p,3)),
238
cbind(".",".",".","."),
cbind("_____________________","__________","____________","_________"),cbind("E model","A","D","E"),
cbind("Unsquared path estimates",".",".",E_myest[1]),cbind("Standard errors",".",".",E_mySE[1]),cbind("Lower 95% CI",".",".",E_mylower[1]),cbind("Upper 95% CI",".",".",E_myupper[1]),
cbind(".",".",".","."),cbind("Unstandardized variance
comps",round(A_E,3),round(D_E,3),round(E_E,3)), cbind("Standardized variancecomps",round(a2_E,3),round(d2_E,3),round(e2_E,3)),
cbind(".","chisq","DF","p"),cbind("saturated vs.
E",round(mychi_E,3),mychi_DF_E,round(mychi_p_E,3)),cbind("ADE vs E",round(mychiEdiff,3),1,round(mychiEdiff_p,3)),cbind("AE vs
E",round(mychiAEvsEdiff,3),1,round(mychiAEvsEdiff_p,3)),
cbind("_____________________","__________","____________","_________"),cbind(date(),".",".","."))
#round is used here simply to keep output to 3 decimal places
myoutput2 <- data.frame(myoutput)#names(myoutput2)=datasetname#write.table(myoutput2, "myfileout.txt",sep = "\t",quote=F)#saves hard copy of outputas tab-separated text # You can read 'myfileout.txt' into Word foreasy formatting#write.xls(myoutput2,"myoutput2.xls",colName=TRUE,sheet=2,from=1,rowNames=NA)myoutput2 #print the table on screen#mymessage="If table not formatted properly, make console screen full size and typemyoutput2"
print(sqpath2_ade[1:3,])print(sqpath2_ae[1:2,])print(sqpath2_e[1:1,])
twinADENested <- list(twinAEFit, twinEFit)tableFitStatistics(twinADEFit,twinADENested)

239
APPENDIX 6 R SCRIPT (BIVARIATE CHOLESKY MODEL)
# -----------------------------------------------------------------------# Program: DB_5var_chol# based on MultivariateTwinSaturated_MatrixRaw.R by Hermine Maes# Author: DVM Bishop# Date: 17.3.10## Multivariate Twin Saturated model to estimate means and (co)variances acrossmultiple groups# Multivariate Cholesky ACE model to estimate genetic and environmental sources ofvariance# Matrix style model input - Raw data input## Revision History# 19th March 2010: added output for SE and attempted to compute SE for rg# 31st May 2010: revised and streamlined output# 5/6/10: revised to give xls output# -----------------------------------------------------------------------
require(OpenMx)source("GenEpiHelperFunctions.R")
# -----------------------------------------------------------------------# Specify name for a .xls file to hold outputmyfileout="file.xls" #name for xls file
# -----------------------------------------------------------------------# Prepare Data# -----------------------------------------------------------------------mydatafile='datafile.dat'
alldat=read.table(mydatafile, header = FALSE) #This command reads as .dat file #Blanks must be replaced by NAbefore reading #Put header = TRUE if first linehas variable namescolnames(alldat)=c('family','zygo','ewr1','ewr2','evocab1','evocab2','epa1','epa2','epm1','epm2','eaxb1','eaxb2','cwr1','cwr2','cvocab1','cvocab2','cpa1','cpa2','ctone1','ctone2','cpm1','cpm2','caxb1','caxb2','ewr21','ewr22','evocab21','evocab22','epa21','epa22','epm21','epm22','eaxb21','eaxb22','cwr21','cwr22','cvocab21','cvocab22','cpa21','cpa22','ctone21','ctone22','cpm21','cpm2','caxb21','caxb22')
# colnames specified here because not read in as part of file; omit if youhave header = TRUEmycols=colnames(alldat)
#To find column number for variable of interest, run the 3 lines above,# and type mycols on console.
validmz=alldat$zygo==1

240
validdz=alldat$zygo==2
# Specify here the column numbers you want to use# NB. All variables for twin 1 THEN for twin 2mycolnums=c(23,45,24,46) #this format makes it easy to alter variables and rerun
mzData=alldat[validmz,mycolnums]dzData=alldat[validdz,mycolnums]
nv<-2 # number of variables per twin
selVars =c("twin1phenotype1","twin1phenotype2","twin2phenotype1","twin2phenotype2")ntv = nv*2 #number of columnsdatasetname= paste(mydatafile,", columns:",paste(mycols[mycolnums],collapse=","))#paste does string concatenation
#datasetname used as output header to identify the variablesused in analysisoriginalname=colnames(mzData)colnames(mzData)=c("twin1phenotype1","twin1phenotype2","twin2phenotype1","twin2phenotype2")#need to use names without dots in themcolnames(dzData)=colnames(mzData)
meanstartvalue=0 #can alter this value depending on scale of raw datapathstartvalue=.6
# Fit Multivariate Saturated Model# -----------------------------------------------------------------------multivTwinSatModel <- mxModel("multivTwinSat", mxModel("MZ",
mxMatrix( type="Lower", nrow=ntv, ncol=ntv, free=TRUE,values=pathstartvalue, name="CholMZ" ), mxAlgebra( expression=CholMZ %*% t(CholMZ), name="ExpCovMZ" ), mxAlgebra( expression=diag2vec(ExpCovMZ), name="ExpVarMZ"), mxMatrix( type="Full", nrow=1, ncol=ntv, free=T, values=meanstartvalue,name="ExpMeanMZ" ), mxData( observed=mzData, type="raw" ), mxFIMLObjective( covariance="ExpCovMZ", means="ExpMeanMZ",dimnames=selVars) ), mxModel("DZ", mxMatrix( type="Lower", nrow=ntv, ncol=ntv, free=TRUE,values=pathstartvalue, name="CholDZ" ), mxAlgebra( expression=CholDZ %*% t(CholDZ), name="ExpCovDZ" ), mxAlgebra( expression=diag2vec(ExpCovDZ), name="ExpVarDZ"), mxMatrix( type="Full", nrow=1, ncol=ntv, free=T, values=meanstartvalue,name="ExpMeanDZ" ), mxData( observed=dzData, type="raw" ), mxFIMLObjective( covariance="ExpCovDZ", means="ExpMeanDZ",dimnames=selVars)
241
), mxAlgebra( MZ.objective + DZ.objective, name="neg2sumLL" ), #optimizesfunction and computes -2LL mxAlgebraObjective("neg2sumLL"))
multivTwinSatFit <- mxRun(multivTwinSatModel)multivTwinSatSumm <- summary(multivTwinSatFit)
# Generate Saturated Output# -----------------------------------------------------------------------parameterSpecifications(multivTwinSatFit)expectedMeansCovariances(multivTwinSatFit)tableFitStatistics(multivTwinSatFit)
# Fit Multivariate ACE Model with RawData and Matrices Input# -----------------------------------------------------------------------multiCholACEModel <- mxModel("multiCholACE",
mxModel("ACE",# Matrices a, c, and e to store a, c, and e path coefficients
mxMatrix( type="Lower", nrow=nv, ncol=nv, free=TRUE,values=pathstartvalue, name="a" ),
mxMatrix( type="Lower", nrow=nv, ncol=nv, free=TRUE,values=pathstartvalue, name="c" ),
mxMatrix( type="Lower", nrow=nv, ncol=nv, free=TRUE,values=pathstartvalue, name="e" ),
# Matrices A, C, and E compute variance componentsmxAlgebra( expression=a %*% t(a), name="A" ), #square by multiplying by
tracemxAlgebra( expression=c %*% t(c), name="C" ),mxAlgebra( expression=e %*% t(e), name="E" ),
# Algebra to compute total variances and standard deviations (diagonal only)mxAlgebra( expression=A+C+E, name="V" ),mxMatrix( type="Iden", nrow=nv, ncol=nv, name="I"),mxAlgebra( expression=solve(sqrt(I*V)), name="sd"),
## Note that the rest of the mxModel statements do not change forbivariate/multivariate case
# Matrix & Algebra for expected means vectormxMatrix( type="Full", nrow=1, ncol=nv, free=TRUE, values=meanstartvalue,
name="M" ),mxAlgebra( expression= cbind(M,M), name="expMean"),
# Algebra for expected variance/covariance matrix in MZmxAlgebra( expression= rbind ( cbind(A+C+E , A+C),
cbind(A+C , A+C+E)),name="expCovMZ" ), # Algebra for expected variance/covariance matrix in DZ, note use of 0.5,converted to 1*1 matrix
mxAlgebra( expression= rbind ( cbind(A+C+E , 0.5%x%A+C), cbind(0.5%x%A+C , A+C+E)),
name="expCovDZ" )),
mxModel("MZ",

242
mxData( observed=mzData, type="raw" ), mxFIMLObjective( covariance="ACE.expCovMZ", means="ACE.expMean",
dimnames=selVars ) ),mxModel("DZ", mxData( observed=dzData, type="raw" ), mxFIMLObjective( covariance="ACE.expCovDZ", means="ACE.expMean",
dimnames=selVars ) ),
mxAlgebra( expression=MZ.objective + DZ.objective, name="neg2sumLL" ),mxAlgebraObjective("neg2sumLL")
)multiCholACEFit <- mxRun(multiCholACEModel)multiCholACESumm <- summary(multiCholACEFit)
# Generate Multivariate Cholesky ACE Output# -----------------------------------------------------------------------#parameterSpecifications(multiCholACEFit) #uncomment this if you want to checkmodel structureexpectedMeansCovariances(multiCholACEFit) # commands fromGenEpiHelperFunctionstableFitStatistics(multiCholACEFit)
# -------------------------------------------------------------------------------------
# Print Descriptive Statistics and create formatted table for xls# -------------------------------------------------------------------------------------myNMZ=colSums(is.finite(as.matrix(mzData)))myNDZ=colSums(is.finite(as.matrix(dzData)))mymeanMZ=round(colMeans(mzData,na.rm=TRUE),3) #exclude those with missingvaluesmysdMZ=round(sd(mzData,na.rm=TRUE),3)mymeanDZ=round(colMeans(dzData,na.rm=TRUE),3) #exclude those with missingvaluesmysdDZ=round(sd(dzData,na.rm=TRUE),3)mysum=data.frame(cbind(originalname,myNMZ,mymeanMZ,mysdMZ,myNDZ,mymeanDZ,mysdDZ))mysum # print out table of mean and SDwrite.table("Cholesky",myfileout,row.names=F)# just to ensure xls file created if itdoes not existmyheader=matrix(c(".",colnames(mysum)),nrow=1)#need to add blank before namesto format correctlywrite.table(myheader,myfileout,sep="\t",append=TRUE,row.names=FALSE,col.names=FALSE)write.table(mysum,myfileout,sep="\t", append=TRUE,col.names=FALSE)# -------------------------------------------------------------------------------------# Find values for expected covariances and write to xls file# -------------------------------------------------------------------------------------
expcovM=multiCholACEFit@submodels[['ACE']]@algebras[['expCovMZ']]@resultblankbit=matrix(c(".",".",".","."),nrow=1) #need to pad out data table with blanksblankbit2=matrix(c(".",".","."),ncol=1) # blanks to ensure col names are aligned

243
myhead=matrix(c("Expctd Cov" ,"MZ",".","."),nrow=1)myhead=rbind(blankbit,myhead,colnames(expcovM)) #put blank row above title andcolnamesmyhead=cbind(blankbit2,myhead) #insert blank columnwrite.table(myhead,myfileout,sep="\t",append=TRUE ,col.names=FALSE,row.names=FALSE)write.table(round(expcovM,3), myfileout,sep="\t",col.names=FALSE,append=TRUE)
expcovD=multiCholACEFit@submodels[['ACE']]@algebras[['expCovDZ']]@resultmyhead=matrix(c("Expctd Covs", "DZ",".","."),nrow=1)myhead=rbind(blankbit,myhead,colnames(expcovD)) #put blank row above title andcolnamesmyhead=cbind(blankbit2,myhead) #insert blank columnwrite.table(myhead,myfileout,sep="\t",append=TRUE ,col.names=FALSE,row.names=FALSE)write.table(round(expcovD,3), myfileout,sep="\t",col.names=FALSE,append=TRUE)# -------------------------------------------------------------------------------------# Find values for expected means and write to xls file# -------------------------------------------------------------------------------------meanbit=multiCholACEFit@submodels[['ACE']]@algebras[['expMean']]@resultmyhead=matrix(c("Expctd Means",".",".","."),nrow=1)myhead=rbind(blankbit,myhead,colnames(meanbit)) #put blank row above title andcolnames
write.table(myhead,myfileout,sep="\t",append=TRUE ,col.names=FALSE,row.names=FALSE)write.table(round(meanbit,3),myfileout,sep="\t",col.names=FALSE,append=TRUE,row.names=FALSE)
# -------------------------------------------------------------------------------------# Find values for model fit, and write to xls file# -------------------------------------------------------------------------------------estparams=sum(multiCholACEFit@submodels[['ACE']]@matrices[['a']]@free)+
sum(multiCholACEFit@submodels[['ACE']]@matrices[['c']]@free)+sum(multiCholACEFit@submodels[['ACE']]@matrices[['e']]@free)+sum(multiCholACEFit@submodels[['ACE']]@matrices[['M']]@free)
NObs=sum(myNDZ)+sum(myNMZ)myDF=NObs-estparamsmyLL= round(multiCholACEFit@objective@result,2)AIC=round(myLL-2*myDF,2)mytablefit=matrix(c("multiCholACE",estparams,myLL,myDF,AIC))mytablefit=t(mytablefit) #t is transposecolnames(mytablefit)=c("model","N params","-2LL","DF","AIC")myhead="Model Fit"write.table(myhead,myfileout,quote=F,append=T,row.names=F)write.table(mytablefit,myfileout,sep = "\t",quote=F,append=T,row.names=FALSE)# -------------------------------------------------------------------------------------# Find values for a, c and e# -------------------------------------------------------------------------------------mya=multiCholACEFit@submodels[['ACE']]@matrices[['a']]@values #same as X inoriginal MX
244
myc=multiCholACEFit@submodels[['ACE']]@matrices[['c']]@values # same as Y inoriginal MXmye=multiCholACEFit@submodels[['ACE']]@matrices[['e']]@values # same as Z inoriginal MXmyi=multiCholACEFit@submodels[['ACE']]@matrices$I@valuesmyA=mya%*%t(mya) #same as A matrix in original MxmyC=myc%*%t(myc)myE=mye%*%t(mye)# -------------------------------------------------------------------------------------# Standardize values for a, c and e# -------------------------------------------------------------------------------------myv=myA+myC+myE # same as V matrix in original Mx; sum of squared pathsmystanda=(solve(sqrt(myi*myv))%*%mya) #standardized unsquared a pathmystandc=(solve(sqrt(myi*myv))%*%myc) #standardized unsquared c pathmystande=(solve(sqrt(myi*myv))%*%mye) #standardized unsquared e path
# NB variance for variable 1 is sumsq(a11,c11 and e11)# variance for variable 2 is sumsq (a12, c12, e12, a22, c22, e22)# Ie sum of all squared paths to that variable# Standardisation involves dividing estimates by total variance for that variable# -------------------------------------------------------------------------------------# Compute genetic and env correlations# -------------------------------------------------------------------------------------rg=solve(sqrt(myi*myA))%*%myA%*%solve(sqrt(myi*myA))#genetic correlationrc=solve(sqrt(myi*myC))%*%myC%*%solve(sqrt(myi*myC))#shared env correlationre=solve(sqrt(myi*myE))%*%myE%*%solve(sqrt(myi*myE))#nonshared envcorrelation# -------------------------------------------------------------------------------------# Compute h2# -------------------------------------------------------------------------------------SDmatrix=sqrt(vec2diag(diag2vec(myA+myC+myE)))#phenotypic standard dev.matrixmyM=solve(SDmatrix)%*%myA%*%solve(SDmatrix)# the diagonal of M contains h2, ie sum of all squared genetic terms leading to thephenotype#(from matrix mystanda)# h2 is equivalent to the genetic path from correlated factors model
# -------------------------------------------------------------------------------------# Compute standard errors# -------------------------------------------------------------------------------------myest=multiCholACEFit@output$estimatemySE=multiCholACEFit@output$standardErrors
mycounter=0myestimate=matrix(c(1:(3*(nv^2))),nrow=3*nv)#create matrix to hold 3 blocks of nv xnvdim(myestimate)=c(nv,nv,3) # turn into an array that is nv x nv x 3myestimate2=myestimate #dimension for standardized estimatemystanderr=myestimate #dimension for semystanderr2=myestimate #dimension for standardized sefor (mysource in 1:3)

245
{ for (thisrow in 1:nv) { for (thiscol in 1:nv) { if (thiscol<=thisrow) {mycounter=mycounter+1 myestimate[thisrow,thiscol,mysource]=myest[mycounter] mystanderr[thisrow,thiscol,mysource]=mySE[mycounter] } else {myestimate[thisrow,thiscol,mysource]=0 #will later change this to NaN, butneeds to be numeric for the moment mystanderr[thisrow,thiscol,mysource]=NaN } } } }allvar=matrix(c(0,0),nrow=1)for (myn in 1:nv) { allvar[myn]=sum(myestimate[myn,,]^2) #total variance for each variable mystanderr2[myn,,]=mystanderr[myn,,]/allvar[myn] #to standardize just divide bytotal var myestimate2[myn,,]=myestimate[myn,,]/allvar[myn] }
mylower=round(myestimate2-1.96*mystanderr2,3)myupper=round(myestimate2+1.96*mystanderr2,3)myestimate2=round(myestimate2,3)#round to 3 dec placesmystanderr2=round(mystanderr2,3)myCI=paste(mylower,"to",myupper)
write.table("Standardized unsquared pathestimates",myfileout,append=T,row.names=F)header3=matrix(c(".","a1","a2","c1","c2","e1","e2"),nrow=1)write.table(header3,myfileout,sep="\t",quote=F,append=T,row.names=FALSE,col.names=FALSE)write.table(myestimate2,myfileout,sep="\t",quote=F,append=T,col.names=FALSE)header4="SEs"write.table(header4,myfileout,sep="\t",quote=F,append=T,row.names=FALSE,col.names=FALSE)write.table(mystanderr2,myfileout,sep="\t",quote=F,append=T,col.names=FALSE)
# -------------------------------------------------------------------------------------# Write Genetic and env correlations to xls# -------------------------------------------------------------------------------------myhead="Genetic correlations"write.table(myhead,myfileout,quote=F,append=T,row.names=F)write.table(round(rg,3),myfileout,sep ="\t",quote=F,append=T,row.names=FALSE,col.names=FALSE)

246
myhead="Shared env. correlations"write.table(myhead,myfileout,quote=F,append=T,row.names=F)write.table(round(rc,3),myfileout,sep ="\t",quote=F,append=T,row.names=FALSE,col.names=FALSE)myhead="Nonshared env. correlations"write.table(myhead,myfileout,quote=F,append=T,row.names=F)write.table(round(re,3),myfileout,sep ="\t",quote=F,append=T,row.names=FALSE,col.names=FALSE)
print(paste("Estimates and CIs saved in ",myfileout))print("This file can be opened in xls")
Related Documents