A longitudinal study of the body composition of children with cystic fibrosis compared to healthy children using the reference four- component model with an assessment of clinical tools available for body composition measurements Jane Elizabeth Williams University College London Dissertation submitted to University College London for the degree of Doctor of Philosophy (PhD) 2013

Welcome message from author
This document is posted to help you gain knowledge. Please leave a comment to let me know what you think about it! Share it to your friends and learn new things together.
Transcript

A longitudinal study of the body composition
of children with cystic fibrosis compared to
healthy children using the reference four-
component model with an assessment of
clinical tools available for body composition
measurements
Jane Elizabeth Williams
University College London
Dissertation submitted to University College London for the
degree of Doctor of Philosophy (PhD)
2013

2
Statement of originality
I, Jane Williams confirm that the work presented in this thesis is my own. Where information has been derived from other sources, I confirm that this has been indicated in the thesis. Signature………………………………………………………………………… Date…………………………………………………………………………………..

3
Abstract Body composition (BC) is an important prognostic factor in patients with cystic fibrosis
(CF). International guidelines recommend monitoring growth and nutritional status in
children with CF using simple anthropometry. However, methodological issues with
simple techniques are more significant in children due to growth and maturation, and
even more problematic in patients, perhaps accounting for inconsistent findings in
previous BC research in children with CF.
My thesis addressed three aims: 1) comparison of BC in young children with CF and
controls using the criterion four-component model (4CM), cross-sectionally and
longitudinally using pair-, group-match and reference database comparison ; 2)
investigation of relationships between BC and lung function (FEV1); and 3) evaluation
of simpler BC techniques for clinical assessment of children with CF.
Results
1) Using the 4CM I found sex differences not identified by simpler techniques; girls
with CF had abnormal baseline body composition, whilst longitudinal analysis showed
deteriorating fat-free mass (FFM) in both sexes. Conclusions differed according to the
comparison group used, perhaps accounting for some inconsistencies between previous
studies.
2) Contrary to previous research, using the 4CM fat mass was positively associated with
FEV1 in girls; this association was not apparent at 2 year follow-up despite declining
FEV1. FEV1 was associated with FFM in boys and bone mass in girls, in accord with
previous research.
3) Simple BC techniques were not interchangeable, and dual-energy X-ray
absorptiometry (DXA) on its own or in combination with bio-electrical impedance
(BIA) gave results closest to the criterion method.
Conclusion
Using the 4CM, abnormal BC and associations between BC and lung function were
detected, which were not apparent using simple anthropometry. The findings emphasise
the importance of using appropriate techniques to measure BC in children with CF, and
suggest that DXA with or without BIA may be most appropriate in clinical practice.

4
Table of Contents
Statement of originality ...................................................................................................... 2 Abstract .............................................................................................................................. 3 Table of Contents ............................................................................................................... 4 Table of Tables ................................................................................................................. 10
Table of Figures ............................................................................................................... 11 Abbreviations ................................................................................................................... 13
Chapter 1. Introduction ................................................................................................... 15 Chapter 2. Background.................................................................................................... 18
2.1 Cystic fibrosis ........................................................................................................ 18 2.1.1 Incidence and aetiology of cystic fibrosis ....................................................... 18
2.1.2 Symptoms ........................................................................................................ 19 2.1.3 Overview of treatment..................................................................................... 21 2.1.4 Prognosis ......................................................................................................... 23
2.2 Body Composition changes during normal growth ............................................... 24 2.3 The impact of nutrition on body composition ........................................................ 26
2.3.1 Under-nutrition ................................................................................................ 27 2.3.2 Over-nutrition .................................................................................................. 28
2.4 Previous studies investigating the effect of cystic fibrosis on growth and body
composition .................................................................................................................. 29
2.4.1 Anthropometry ................................................................................................ 29 2.4.2 Bio-electrical impedance ................................................................................. 32 2.4.3 Hydrometry ..................................................................................................... 33
2.4.4 Dual-energy X-ray absorptiometry ................................................................. 34 2.4.5 Total body potassium ...................................................................................... 35
2.4.6 Longitudinal studies of body composition in cystic fibrosis .......................... 36
2.5 Relationship between growth, body composition and spirometry ......................... 39 2.5.1 Cross-sectional reports of body composition and spirometry ......................... 39
2.5.2 Longitudinal reports of body composition and spirometry ............................ 41 2.6 Summary ................................................................................................................ 44
Chapter 3. Body composition measurement techniques in children and adolescents ..... 49
3.1 Introduction ............................................................................................................ 49 3.2 Simple measures..................................................................................................... 50
3.2.1 Weight, height and body mass index (Level V) .............................................. 50 3.2.2 Regional skinfold thickness (Level IV) ......................................................... 52 3.2.3 Waist circumference........................................................................................ 53
3.3 Predictive techniques ............................................................................................. 54
3.3.1 Skinfold thickness to derive whole body fat ................................................... 54
3.3.2 Bioelectrical impedance analysis (Level V) .................................................. 54 3.3.3 Total body conductivity (Level V) .................................................................. 57
3.4 Two-component models (2CM) ............................................................................. 57

5
3.4.1 Hydrometry (Level II) ..................................................................................... 58 3.4.2 Densitometry (Level V) .................................................................................. 60
This technique requires the person to be weighed and then completely immersed in
water whilst being weighed again. ............................................................................... 61 3.4.3 Dual-energy X-ray absorptiometry (DXA; Level V) ...................................... 63
3.5 Multi-component models (Level II) ....................................................................... 64 3.5.1 Propagation of error for measurements of FM and FFM ................................ 65
3.6 Other techniques..................................................................................................... 67 3.6.1 Magnetic resonance imaging (Level V) ......................................................... 67 3.6.2 X-ray computed tomography (CT; Level IV) ................................................ 68 3.6.3 Total body potassium (Level I) ...................................................................... 68
3.7 Summary ................................................................................................................ 69 Chapter 4. Hypotheses, recruitment, methods, ethical considerations and study plan ... 70
4.1 Hypotheses ............................................................................................................. 70 4.2 Aims ....................................................................................................................... 71
4.3 Recruitment and exclusion criteria......................................................................... 72
4.4 Methods .................................................................................................................. 73 4.4.1 Anthropometry ................................................................................................ 73
4.4.2 Bio-electrical impedance ................................................................................. 73 4.4.3 Dual-energy X-ray aborptiometry ................................................................... 74 4.4.4 Deuterium oxide dilution ................................................................................ 74
4.4.5 Air-displacement plethysmography ................................................................ 75
4.4.6 Spirometry ....................................................................................................... 76 4.5 Outcome measures used for calculation of body composition.............................. 76
4.5.1 Simple body composition techniques ............................................................ 77
4.5.2 Four-component model ................................................................................... 79 4.6 Assessment of confounding factors ....................................................................... 80
4.6.1 Age .................................................................................................................. 80 4.6.2 Medical data .................................................................................................... 80 4.6.3 Physical activity .............................................................................................. 80
4.6.4 Pubertal status ................................................................................................. 81 4.7 Statistical analyses ................................................................................................. 81
4.7.1 Sample size...................................................................................................... 81 4.7.2 Size adjustment and calculation of standard deviation scores ........................ 83
4.7.3 Cross-sectional comparison of body composition variables ........................... 85 4.7.4 Cross-sectional comparison of body composition and spirometry ................. 85 4.7.5 Longitudinal body composition and spirometry data analysis ........................ 86 4.7.6 Cross-sectional comparison of simple techniques and the 4-component model
.................................................................................................................................. 88
4.7.7 Longitudinal comparison of simple techniques and the 4-component model 89 4.7.8 ‘Wisdom of crowds’ approach to determine whether aggregate predictions
improve accuracy. .................................................................................................... 90 4.8 Study outline .......................................................................................................... 91
4.9 Ethical considerations and study plan .................................................................... 93 Chapter 5. Baseline body composition of 6-12 year old children with cystic fibrosis
compared to healthy children and the relationship with lung function. ........................... 95
5.1 Introduction ............................................................................................................ 95

6
5.2 Study design ........................................................................................................... 95 5.3 Recruitment and exclusion criteria......................................................................... 96
5.4 Methods .................................................................................................................. 96 5.5 Statistical analyses ................................................................................................. 97
5.5.1 Size adjustment and SDS calculation .............................................................. 97 5.5.2 Comparison of body composition variables .................................................... 97 5.5.3 Lung function .................................................................................................. 98
5.6 Results .................................................................................................................... 98 5.6.1 Subjects ........................................................................................................... 98 5.6.2 Anthropometry ................................................................................................ 99 5.6.3 Body composition ........................................................................................... 99
5.6.4 Relationship between body composition and spirometry ............................. 104 5.6.5 Body composition assessed by simple techniques ....................................... 105
5.7 Discussion ............................................................................................................ 111 5.7.1 Body composition ......................................................................................... 111
5.7.2 Spirometry ..................................................................................................... 113
5.8 Study limitations .................................................................................................. 114 5.9 Summary .............................................................................................................. 115
Chapter 6. Cross-sectional comparison of the body composition of children with cystic
fibrosis with that of healthy children at 6-12 and 8-14 years and the relationship with
lung function. ................................................................................................................. 116
6.1 Introduction ......................................................................................................... 116
6.2 Study design ......................................................................................................... 117 6.3 Recruitment and exclusion criteria....................................................................... 117 6.4 Methods ................................................................................................................ 117
6.5 Statistical analyses .............................................................................................. 118 6.5.1 Size adjustment and standard deviation score calculation ............................ 118
6.5.2 Comparison of body composition variables .................................................. 118 6.5.3 Spirometry ..................................................................................................... 119
6.6 Results .................................................................................................................. 119
6.6.1 Subjects ......................................................................................................... 119 6.6.2 Anthropometry .............................................................................................. 122
6.6.3 Body Composition ........................................................................................ 123 6.6.4 Relationship between body composition and spirometry ............................. 136
6.6.5 Body composition assessed by simple techniques ........................................ 138 6.7 Discussion ............................................................................................................ 138
6.7.1 Regarding hypothesis 1; that there will be no significant differences in body
composition at baseline but differences will become apparent over time. ............ 139 6.7.2 Regarding hypothesis 3, that the conclusions are the same regardless of the
mode of analysis. .................................................................................................... 142 6.7.3 Regarding hypothesis 2, that specific components of body composition are
associated with spirometry in children with cystic fibrosis ................................... 143 6.8 Study limitations .................................................................................................. 143
6.9 Summary .............................................................................................................. 144 Chapter 7. Longitudinal comparison of two-year change in body composition of
children with cystic fibrosis with that of healthy children and the relationship between
change in body composition and lung function in children with cystic fibrosis. ........... 145

7
7.1 Introduction ......................................................................................................... 145 7.2 Study design ......................................................................................................... 146
7.3 Recruitment and exclusion criteria....................................................................... 146 7.4 Methods ................................................................................................................ 146 7.5 Statistical analyses ............................................................................................... 147
7.5.1 Size adjustment and standard deviation score calculation ............................ 147 7.5.2 Comparison of change in anthropometric and body composition variables . 147
7.5.3 Effect of predictors of change on anthropometric and body composition
variables ................................................................................................................. 148 7.5.4 Spirometry ..................................................................................................... 149
7.6 Results .................................................................................................................. 150
7.6.1 Subjects ......................................................................................................... 150 7.6.2 Change in anthropometry and body composition ......................................... 150 7.6.3 Predictors of conditional change in fat mass index, fat-free mass index and
mineral mass index standard deviation scores ....................................................... 157
7.6.4 Effect of cystic fibrosis on change in anthropometric and body composition
variables ................................................................................................................. 161 7.6.5 Relationship between two-year change in body composition and two-year
change in spirometry .............................................................................................. 162 7.6.6 Relationship between activity and change in body composition .................. 168
7.7 Discussion ............................................................................................................ 169
7.7.1 Body composition ......................................................................................... 169
7.7.2 Spirometry ..................................................................................................... 172 7.8 Study limitations .................................................................................................. 173 7.9 Summary .............................................................................................................. 174
Chapter 8. An assessment of clinical tools for measuring body composition in children
with cystic fibrosis using standard deviation scores ...................................................... 176
8.1 Introduction .......................................................................................................... 176 8.2 Study design ......................................................................................................... 177 8.3 Recruitment and exclusion criteria....................................................................... 177
8.4 Methods ................................................................................................................ 178 8.5 Statistical analyses ............................................................................................... 178
8.5.1 Size adjustment and standard deviation score calculation ............................ 178 8.5.2 Comparison of the simpler body composition techniques and the 4-component
model ...................................................................................................................... 179 8.5.3 Predictors of bias ........................................................................................... 179 8.5.4 Calculation of a correction factor for bio-electrical impedance .................... 180 8.5.5 Longitudinal comparison .............................................................................. 180 8.5.6 Categorisation of ‘abnormal’ standard deviation scores ............................... 181
8.5.7 ‘Wisdom of crowds’ approach to determine whether aggregate predictions
improve accuracy. .................................................................................................. 181 8.6 Results .................................................................................................................. 182
8.6.1 Subjects ......................................................................................................... 182
8.6.2 Accuracy of simpler body composition techniques compared to the 4-
component model ................................................................................................... 182 8.6.3 Predictors of the bias in fat mass and fat-free mass standard deviation scores
................................................................................................................................ 190

8
8.6.4 Comparison of longitudinal change in body composition by the simpler
techniques compared to change assessed by the 4-component model ................... 194
8.6.5 Assessment of the ability of each technique to distinguish ‘normal’ and
‘abnormal’ body composition in clinical practice. ................................................. 199 8.6.6 Accuracy of an aggregate prediction using the ‘wisdom of crowds’ approach.
................................................................................................................................ 201 8.7 Discussion ............................................................................................................ 208
8.7.1 Cross sectional comparison of simple techniques compared to the 4-
component model and classification of patients .................................................... 209 8.7.2 Longitudinal comparison of simple techniques compared to the 4-component
model ...................................................................................................................... 212
8.7.3 ‘Wisdom of crowds’ aggregate prediction from several simple prediction
techniques ............................................................................................................... 213 8.8 Study limitations .................................................................................................. 214 8.9 Summary .............................................................................................................. 215
Chapter 9. Conclusion ................................................................................................... 216
9.1 Summary of the findings ...................................................................................... 216 9.1.1 Effect of cystic fibrosis on body composition............................................... 216
9.1.2 The relationship between body composition and spirometry as a marker for
clinical status. ......................................................................................................... 218 9.1.3 Simple body composition techniques for use in clinical practice where 4-
component model is not available .......................................................................... 218
9.2 Future Research .................................................................................................... 219 9.3 Limitations ........................................................................................................... 220 9.4 Implications of this research for clinical practice ................................................ 222
Acknowledgements ........................................................................................................ 224 Information about the work in this thesis ....................................................................... 225
Appendices ..................................................................................................................... 227 Appendix 1. Ethical approval ..................................................................................... 227 Appendix 2.1. Child with CF information sheet ........................................................ 230
Appendix 2.2. Control child information sheet .......................................................... 234 Appendix 2.3. Child with CF over 12 y information sheet ........................................ 238
Appendix 2.4. Control over 12y information sheet ................................................... 242 Appendix 2.5. Parent of child with CF information sheet ......................................... 246
Appendix 2.6. Parent of control child information sheet ........................................... 250 Appendix 3. Appointment letter ................................................................................. 254 Appendix 4.1. Child assent form................................................................................ 255 Appendix 4.2. Participant consent form ..................................................................... 256 Appendix 4.3. Parent consent form ............................................................................ 257
Appendix 5.1. Questionnaires for children with CF .................................................. 258 Appendix 5.2. Questionnaire for control children ..................................................... 267 Appendix 6. Saliva collection information ................................................................ 275 Appendix 7. Certificate .............................................................................................. 276
Appendix 8.1. Boys puberty questionnaire ................................................................ 277 Appendix 8.2. Girls puberty questionnaire ................................................................ 278 Appendix 9. Comparison between children with CF that have dropped-out and those
remaining in study after 2 years ................................................................................. 279

9
Appendix 10. Regression of factors impacting on waist circumference. ................... 280 Appendix 11. Regression analyses for the relationship between baseline FEV1 and
change in body composition and baseline body composition and change in FEV1. .. 281 Appendix 12. Bland-Altman analyses for simpler body composition techniques
compared to the 4-component model. ........................................................................ 282 Appendix 13. Bland Altman correlations, unadjusted and adjusted for age, and age
and sex ........................................................................................................................ 288
Appendix 14. Characteristics of children used and not used in generation of a
regression equation to correct for bias in bio-electrical impedance standard deviation
scores. ......................................................................................................................... 289 Bibliography ................................................................................................................... 290
Published papers related to this thesis ........................................................................ 310

10
Table of Tables Table 2.1. Studies of body composition and lung function in patients with cystic
fibrosis. ............................................................................................................................. 45 Table 3.1. Propagation of error on fat mass and fat-free mass values from different
models of body composition. ........................................................................................... 66 Table 5.1. Characteristics of cystic fibrosis and control children in pair-match analyses
and compared to reference data ..................................................................................... 101 Table 5.2. Body composition of cystic fibrosis and control children used in pair-
matched analyses and compared to reference data . ...................................................... 102
Table 5.3. Summary of comparisons (before adjustment for age, height and puberty) 103 Table 5.4. Difference in size and whole-body composition between boys with cystic
fibrosis and control boys. ............................................................................................... 106 Table 5.5. Difference in size and whole-body composition between girls with cystic
fibrosis and control girls................................................................................................. 108
Table 5.6. Simple regression analysis of factors associated with forced expired volume
in 1s standard deviation scores ....................................................................................... 110 Table 6.1. Children with cystic fibrosis not included in this analysis compared to those
remaining........................................................................................................................ 120 Table 6.2. Comparison of control children at baseline in Chapters 5 and 6................. 121
Table 6.3. Characteristics of cystic fibrosis and control boys at baseline and two years
with group comparison and compared to reference data . ............................................. 125
Table 6.4. Characteristics of cystic fibrosis and control girls at baseline and two years
with group comparison and compared to reference data. .............................................. 126 Table 6.5. Body composition of cystic fibrosis and control boys with group comparison
and compared to reference data ..................................................................................... 127 Table 6.6. Body composition of cystic fibrosis and control girls with group comparison
and compared to reference data ..................................................................................... 129 Table 6.7. Difference in size and whole-body composition at baseline and two years.
........................................................................................................................................ 133
Table 6.8. Summary of comparisons ............................................................................. 135 Table 6.9. Simple regression analysis of factors associated with forced expired volume
in 1 sec standard deviation score .................................................................................... 137 Table 7.1. Change between baseline and two years in boys ........................................ 152
Table 7.2. Change between baseline and two years in girls ......................................... 153 Table 7.3. Difference in change between cystic fibrosis and control children............. 156 Table 7.4. Correlation analyses of potential predictors of body composition variables in
children with cystic fibrosis. .......................................................................................... 158 Table 7.5. Dependent and independent variables used in regression analysis to identify
predictors of body composition variables. ..................................................................... 159 Table 7.6. Regression analysis of conditional change in; fat-mass index or fat-free mass
index or mineral mass index standard deviation scores in boys with cystic fibrosis. .... 160 Table 7.7. Regression analysis of conditional change in; fat-mass index or fat-free mass
index or mineral mass index standard deviation scores in girls with cystic fibrosis. .... 160
Table 7.8. Regression analysis of absolute change in; fat mass index or fat-free mass
index or mineral mass index standard deviation scores in control girls. ....................... 161

11
Table 7.9. General linear model for effect of condition on growth and body
composition .................................................................................................................... 162
Table 7.10. Correlation between potential predictors and absolute change in FEV1
standard deviation scores in children with cystic fibrosis .............................................. 165 Table 7.11. Regression analysis of conditional change in FEV1 standard deviation
scores and potential predictors in children with cystic fibrosis. .................................... 166 Table 7.12. Regression analysis of absolute change in FEV1 standard deviation scores
and potential predictors in boys with cystic fibrosis. ..................................................... 166 Table 7.13. Activity rating of children with cystic fibrosis .......................................... 168 Table 8.1. Anthropometry and body composition standard deviation scores by sex .... 183 Table 8.2. Bland-Altman analysis of mean bias in fat mass and fat-free mass standard
deviation scores by simple body composition techniques compared to the 4-component
model. ............................................................................................................................. 185 Table 8.3. Predictors of bias for different simple body composition measurements of (a)
fat mass SDS and (b) fat-free mass SDS compared to the 4-component model. ........... 192
Table 8.4. Baseline measurements and change in longitudinal measurements using
standard deviation scores ............................................................................................... 195 Table 8.5. Bias and limits of agreement of simpler methods compared to the 4-
component model for change in fat mass and fat-free mass standard deviation scores. 196 Table 8.6. Cross-tabulation statistics for agreement in ‘abnormal’ scores assessed by
simpler techniques compared to the 4-CM. ................................................................... 200
Table 8.7. Equations for the prediction of body composition in children ..................... 202
Table 8.8 Characteristics of children whose data was used for the aggregate
prediction………………………………………………………………………………204
Table 8.9. Bland-Altman statistics for bias and limits of agreement for individual or
aggregate equations and reference 4-component fat mass. ............................................ 205
Table of Figures
Figure 2.1. Inheritance pattern in cystic fibrosis ............................................................. 18
Figure 2.2. Components of total energy expenditure ..................................................... 20
Figure 2.3. Hattori graph showing change in fat mass adjusted for height versus fat-free
mass adjusted for height in children from birth to 1 year ................................................ 24 Figure 2.4. Hattori graph showing change in fat mass adjusted for height versus fat-free
mass adjusted for height in children from 1 year to 10 years ......................................... 25
Figure 2.5. Hattori graph showing change in fat mass adjusted for height versus fat-free
mass adjusted for height in children from 10.5 to 18.5 years). ........................................ 26 Figure 2.6. Graphs of body mass index, fat mass index and lean mass index standard
deviations scores for two children with cystic fibrosis. ................................................... 30 Figure 3.1. Five levels of body composition (Wang 1992). ............................................ 50
Figure 3.2. “Data from infant patients with congenital myasthenia, a condition in which
the development of connective tissue is impaired. Despite extremely low BMI SDS, the
patients have body fat levels higher than the average in healthy children. This paradox
can be attributed to extremely low levels of lean mass. ................................................... 51

12
Figure 3.3. “Hattori graph for children aged 8 showing fat mass adjusted for height
versus fat-free mass adjusted for height. The individuals A and B represent 2 girls with
similar BMI but with A having twice the fat mass index of B.. .................................... 522 Figure 3.4. Measurement of bicep skinfold thickness .................................................. 533 Figure 3.5. Bioelectrical impedance analysis ............................................................... 555 Figure 3.6. Under-water weighing apparatus. ............................................................ 6161 Figure 3.7. Air-displacement plethysmography ........................................................... 622
Figure 3.8. Dual-energy X-ray absorptiometry ............................................................ 633 Figure 3.9. Multi-component models of body composition ......................................... 644 Figure 3.10. Magnetic resonance imaging equipment .................................................. 677 Figure 3.11. X-ray computed tomography. .................................................................. 688
Figure 4.1. Correlation between absolute and conditional change in fat mass index in
girls with cystic fibrosis ................................................................................................. 877 Figure 4.2. Correlation between absolute and conditional change in fat mass index in
boys with cystic fibrosis ................................................................................................. 877
Figure 5.1. Relationship between percent predicted FEV1 and fat mass index standard
deviation scores in girls with cystic fibrosis assessed by the 4-component model of body
composition .................................................................................................................. 1055
Figure 6.1. Description of mode of analysis and subjects in Chapters 5 and 6.......... 1166 Figure 6.2. Contribution of body composition, age, sex and height to variability in
waist circumference in children with cystic fibrosis and controls ............................... 1233
Figure 7.1. Description of mode of analyses and subjects in Chapters 5-7. .............. 1455
Figure 7.2. Individual change in fat mass index standard deviation score from baseline
to two years .................................................................................................................. 1544 Figure 7.3. Individual change in fat-free mass index standard deviation score from
baseline to two years .................................................................................................... 1555 Figure 7.4 Two year change in FEV1 and fat mass index standard deviation scores in
children with cystic fibrosis. ........................................................................................ 1633 Figure 7.5 Two year change in FEV1 and fat-free mass index standard deviation scores
in children with cystic fibrosis. .................................................................................... 1644
Figure 7.6. Conceptual framework for the relationship between body composition and
spirometry over time. ................................................................................................... 1677
Figure 8.1. Bias and limits of agreement for ‘fatness’ by simple techniques compared
to the 4–component model. .......................................................................................... 1877
Figure 8.2. Bias and limits of agreement for ‘leanness’ by simple techniques compared
to the 4-component model ............................................................................................ 1888 Figure 8.3. Bias and limits of agreement for change in ‘fatness’ by simple techniques
compared to the 4-component model. .......................................................................... 1977 Figure 8.4 Bias and limits of agreement for change in ‘leanness’ by simple techniques
compared to the 4-component model. .......................................................................... 1988 Figure 8.5. Bland-Altman analysis showing mean bias and limits of agreement in fat
mass and fat-free mass compared to the 4-component model. The graph compares 12
individual predictions and an aggregate average of the 12 equations to the 4-component
fat mass......................................................................................................................... 2066 Figure 8.6 Individual bias and limits of agreement for fat mass by the aggregate
prediction compared to the 4-component fat mass ..................................................... 2077

13
Abbreviations
2CM two-component model
3CM three-component model
4CM four-component model
%IBW percentage of ideal body weight
ADP air-displacement plethmysography
BCM body cell mass
BIA bio-electrical impedance analysis
BMC bone mineral content
BMD bone mineral density
BMAD bone mineral apparent density (size adjusted BMD)
BMI body mass index
CF cystic fibrosis
CT computerised tomography
CFTR cystic fibrosis transmembrane conductance regulator
Cl chlorine
DV dependent variable
DXA dual-energy X-ray absorptiometry
FEV1% percentage of the expected forced expiratory lung volume in 1s
FEV1 SDS forced expiratory lung volume in 1 sec standard deviation score
FFM fat-free mass
FFMI fat-free mass index
FM fat mass
FMI fat mass index
HFFM hydration of fat-free mass
IGF-1 insulin-like growth factor
LS lumbar spine
MM mineral mass

14
MMI mineral mass index
MRI magnetic resonance imaging
µSv micro Sieverts
MUAC mid-upper arm circumference
Na sodium
P:M protein to mineral ratio
PM protein mass
PMI protein mass index
R resistance
REE resting energy expenditure
SD standard deviation
SDS standard deviation (z) score
SE standard error
SFT skinfold thickness
TEE total energy expenditure
TEM technical error of the measurement
TBW total body water
WM water mass
Xc reactance
Z impedance

15
Chapter 1. Introduction
Cystic fibrosis (CF) is a lethal, autosomal recessive genetic disorder most prevalent in
the white populations of Europe, North America and Australasia. A recent survey of the
European CF registry notes 29,000 people affected in 35 countries, 16,500 of whom are
children (1). The disease is characterized by malnutrition due to decreased absorption
and increased nutritional loss and increased work of breathing due to chronic infection
and inflammation. Consequently there is a negative energy balance which is associated
with poor growth, reduced physical activity, lack of appetite and poor lung function.
Improvement in diagnosing and treating children has increased life expectancy and
consequently there is a growing need to address long-term as well as short-term health.
Assessment of growth and nutrition is an important part of the management of patients
with CF, and there is increasing interest in measuring body composition because simple
measures of weight and height cannot distinguish between predominantly metabolically
active tissue (fat-free mass, FFM) and predominantly storage tissue (fat-mass, FM).
Investigation of body composition in children with CF may be beneficial because of the
potential to; (i) aid understanding of the mechanisms that underlie deficits in patients
with CF, (ii) assess the effectiveness of medical and nutritional interventions and (iii)
identify those children at most risk of deterioration. However, body composition
measurements in children with CF are difficult because;
Children are growing and maturation occurs at different rates, therefore, age and
sex specific equations to calculate body composition must be used. However,
these are often generated from healthy children and may not be appropriate for
children with CF.
Reference data on body composition in healthy children has, in the past, been
limited. New reference data from our group, using a wide range of techniques,

16
allows assessment of patients’ body composition by calculating standard
deviation scores (SDS) (2).
The readily available simple techniques used for measuring body composition
either do not give any information about body composition (height, weight and
body mass index (BMI)) or merely predict it from some other characteristic of
the body (skinfold thickness; SFT, bio-electrical impedance; BIA).
The most accurate body composition techniques are expensive, not readily
available, are time consuming and require a high level of compliance from the
child.
Much of the research and monitoring of the growth of children with CF have used
simple measures of height and weight and crude measures of body composition such as
SFT. In recent years there has been a growing use of more sophisticated and clinically
available techniques such as dual-energy X-ray absorptiometry (DXA) in research
studies but no studies have ever used a ‘criterion’ method of assessing body
composition. The use of simple techniques or techniques that are biased in
children/patients have led to inconsistent findings across research studies which have
sometimes been confounded by large age ranges, no consideration of sexual dimorphism
or no adjustment for short stature.
The aim of the work in this thesis is; (i) to investigate the effect of CF on the body
composition of young children and whether this changes with growth and maturity, (ii)
to relate components of body composition to lung function to identify whether baseline
measurements or change over time predict later outcome and (iii) to compare the simple
readily available body composition techniques to a criterion method in order to improve
accuracy of body composition measurement in this group of children.
The organisation of the thesis is as follows: Chapter 2 covers the background to my
research and a review of the previous research and the pertinent issues. Chapter 3
outlines the different techniques for measuring body composition and advantages and
disadvantages of measuring children and patients with these techniques. Chapter 4

17
contains the hypotheses and the methods used to test them and Chapter 5 covers the pair-
matched baseline measurements. The baseline and 2 year group-matched data (with
reduced number) is presented in Chapter 6 and the data for longitudinal change in
Chapter 7. Chapter 8 covers an assessment of clinical tools for measuring body
composition compared to a criterion method in children with CF and Chapter 9 is an
overall discussion and summary of the research with limitations of the study,
recommendations for future research and clinical implications of the findings.

18
Chapter 2. Background
2.1 Cystic fibrosis
2.1.1 Incidence and aetiology of cystic fibrosis
Cystic fibrosis is the most common Caucasian lethal autosomal recessive genetic disorder,
1 in 25 people in the UK are carriers and 1/2500 live births are affected (3). A report of
incidence in 35 European countries found there were 29,000 individuals with CF, 16,500 of
whom were children (1). CF is caused by a mutation on the long arm of chromosome 7 and
results in an abnormal functioning protein in epithelial cells, the CF trans-membrane
conductance regulator (CFTR). The gene responsible is present in all cells but only
expressed in certain cells: airway, sweat gland, pancreatic duct, vas deferens, bile duct and
bowel epithelium and also the kidney and ependymal lining of the brain ventricles.
Figure 2.1. Inheritance pattern in cystic fibrosis

19
Over 1000 different mutations have been identified world-wide but in the UK 58% of
people with CF are homozygous for ΔF508 and 36% have 1 copy of ΔF508 (4). The
ΔF508 mutation is associated with more severe clinical manifestations (5;6). There is a
wide range of clinical presentation and severity with most presenting in early childhood
with persistent respiratory tract infections and failure to thrive and around 15% of infants
presenting with meconium ileus.
2.1.2 Symptoms
Severity of disease is not just related to genotype but is a reflection of a combination of
factors including environment, adherence to therapy and genetic background. The CFTR
protein regulates the movement of chloride (Cl) and sodium (Na) ions across epithelial
surfaces and an inability to re-absorb Cl and Na ions from the sweat gland ducts leads to a
high salt content of sweat and is therefore used as a diagnostic test. The major dysfunction
of interest to the work presented in this thesis is exhibited in;
1) The lung; although the mechanism is not completely understood it is likely that an
inability to secrete Cl and excess re-absorption of Na ions in the lung epithelia may lead to
poor hydration of the airway mucus. This leads to thick sticky mucus which impairs ciliary
clearance and results in plugging and bacterial infection (typically Pseudomonas aeruginosa
and Staphylococcus aureus), in turn inducing a damaging inflammatory response and
irreversible lung damage. Lung disease has the greatest impact on morbidity and mortality
(7) and there is a specific decline in lung function over time dependent on initial lung
function and gender (8). Sex differences in survival of young people with severe CF
related lung disease have been noted by Aurora et al (9) who calculated survival odds were
lower in girls considering several factors in children referred for lung transplantation. The
inter-relationship between lung function and nutritional status has been well documented
but the direction of the relationship is unclear (10;11).

20
2)The pancreas; dehydrated, protein-rich secretions block the proximal ducts and digestive
enzymes are retained in the pancreatic ducts causing a loss of functioning tissue which is
replaced by fibrosis and fatty tissue. Pancreatic insufficiency occurs in 85% of cases with
consequent malabsorption of fat, protein and fat soluble vitamins leading to steatorrhoea
and malnutrition. Malabsorption of carbohydrates is minimal (12). The prevalence of
malnutrition defined by weight for height has been reported as 19% of 2-6 year German
children in 2000 (13), 23% of those children on the US registry in 2005 (14) based on
weight and height <90% expected and data from the UK CF registry revealed that the mean
weight SDS of the males were between −0.25 and −0.5 until the age of 10 years after which
time both weight and BMI SDS declined. The mean weight SDS of females was stable over
time at −0.5 but they had a declining BMI after the age of 5 years (15).
The combination of lung pathology and malabsorption inevitably impacts on overall energy
balance. Approximately 60-70% of total energy expenditure (TEE) is accounted for by
resting energy expenditure (REE) and studies of patients with CF suggest that there is an
increase of 7-35% (16-18).
Figure 2.2. Components of total energy expenditure

21
Magoffin et al (18) studied children with CF and found that REE was elevated compared to
controls and that this was higher in the girls with CF (109% ± 9.5% of predicted) compared
to boys with CF (103% ± 7.0% of predicted) and the difference was apparent throughout
puberty. This sex difference is supported by a study by Allen et al (19). In a study of 19
infants with CF compared to controls Bronstein et al (20) found that increased REE
expenditure may not be associated with increased TEE if differences in body composition
are accounted for. In this study they found that energy expenditure was greater in children
with CF compared to healthy controls if calculated on the basis of weight using kilocalories
per kilogram per day but not if based on FFM using kilocalories per kilogram of FFM per
day. Another explanation for no increase in TEE in children with CF may be that
increased REE is compensated for by reduced physical activity (16;20).
REE may be raised due to pulmonary infection and inflammation (21;22) although a more
recent study reported that pancreatic status is the most influential factor for increased REE
(23) and another suggests that there is no association of REE with lung function or liver
disease either cross-sectionally or longitudinally (18).
In summary, typical symptoms for an untreated person with CF are; recurrent respiratory
infections, coughing, failure to thrive, loose stools and male infertility. In addition
complications including sinusitis, pancreatitis, nasal polyps, liver disease, diabetes,
gallstones, oesophageal reflux, and low bone mineral density and energy imbalance are
possible.
2.1.3 Overview of treatment
At birth the lungs are normal and therefore the primary goal of management is to maintain
good lung function by the prevention of infection, reduction of mucus viscosity and
removal of secretions. A regimen of regular chest physiotherapy or airway clearance is
usually instituted, inhaled medication and antibiotics are usual. For patients with chronic
infections it may additionally be necessary for oral antibiotics, inhaled mucolytics and in

22
some, intra-venous antibiotics. Birth weight is not different from that of healthy children
(24-26) but weight gain is lower if a diagnosis is not made in the neonatal period (27;28)
and one study found that those children diagnosed and treated from birth were heavier,
longer, with larger head circumference after 13 years than those in whom diagnosis was
delayed (28). Another study of infants with CF at birth found lower length SDS (-1.24),
weight SDS (-0.72) and head circumference SDS (-1.82) (29) although a third of the
subjects were affected by meconium ileus which is associated with worse outcomes. After
4 years length and weight SDS had improved although head circumference SDS remained 1
SDS below the mean. Pancreatic damage may occur before birth (30) and dietetic
management is important because of the recognised relationship between optimal
nutritional status and improved lung function, reduced medical intervention and improved
mortality. Whereas malnutrition was once an inevitable outcome, improved treatment and
nutritional support has reduced the prevalence (31).
Dietary management involves an increased energy intake of between 120-140% of the
usual recommended intake to counteract the detrimental effects of the increased respiratory
effort, chronic infection and inflammation, decreased absorption and increased nutritional
loss. To achieve this increased energy intake, some patients may require oral supplements
or enteral nutrition, for example by gastrostomy feeding. Patients with pancreatic
insufficiency take oral pancreatic enzyme supplements to assist in nutrient absorption
although this may not completely correct malabsorption (32). In addition, fat soluble
vitamins are given and calcium supplements may be required.
A study by White at al. (33) found that 58 children with CF aged 5 – 16 years had wide
ranging energy intakes of between 44-163% of the recommended amount and that despite a
higher energy intake per kg of body weight than controls they were unable to achieve
optimal growth. Appetite and energy intake may be deleteriously affected by gastro-
oesophageal reflux, intestinal obstruction, inflammatory response to infection and CF
related diabetes. In addition, psycho-social factors may impact on appetite and energy
intake.

23
Delay in onset of puberty and menarche has been reported in patients with CF and
nutritional problems (34;35) and also in well-nourished females (35). However, other
studies have found that puberty is not significantly delayed in girls with CF compared to
controls (36). As the child grows other issues such as low bone density, gastro-intestinal
and liver complications and CF related diabetes may need to be addressed and lung
transplantation for those with serious lung disease is an option. Survival after
transplantation has been reported as 82% after one year, 70% at three years, 62% at five
years and 51% after 10 years (37). For adults with CF, fertility and pregnancy introduce
more challenges to clinical management. For both children and adults psycho-social
factors may impact on the efficacy of treatment regimens.
2.1.4 Prognosis
Early diagnosis, improved treatment, lung transplantation and overall better understanding
of the disease process have increased life expectancy considerably; the median estimated
life expectancy of children born in 1990 is 40 years (38). However, several long term
complications such as osteoporosis have become apparent in young adults with CF and it
has been recognised that it is important to optimise nutrition in childhood to improve
quality of life and prognosis (39).

24
2.2 Body Composition changes during normal growth
Sexual dimorphism in body composition is evident from foetus to adult but becomes most
apparent during puberty. Wells’(40) comprehensive paper on sexual dimorphism of body
composition explains why, in humans, increased energy needed for lactation which
provides energy for the growth of a large brain in the offspring, has favoured smaller, fatter
females compared to males. At birth, the sexes have similar FM but boys are longer and
have more FFM adjusted for height than girls. This can be seen in the following Hattori
chart of FM index (FMI: FM/height2) plotted against FFM index (FFM/height
2) from birth
to 1 year.
Figure 2.3. Hattori graph showing change in fat mass adjusted for height (fat mass
index; FMI) v fat-free mass adjusted for height (fat-free mass index; FFMI) in children
from birth to 1 year. (41)
(Permission to reproduce this has been granted by Professor JCK Wells).

25
The following 2 graphs from age 1 to 10 years and 10.5 – 18 years demonstrate how the
differences remain throughout childhood and adolsecence.
Figure 2.4. Hattori graph showing change in fat mass adjusted for height (fat mass
index; FMI) v fat-free mass adjusted for height (fat-free mass index; FFMI) in children
from 1 year to 10 years (41)
(Permission to reproduce this has been granted by Professor JCK Wells).
These graphs adjust for the difference in height between the sexes and the males show
greater overall FFM (including mineral mass; MM) and lower FM after age 5 than females.
However, females enter puberty earlier, have more rapid pubertal development whereas
boys have a longer growth period (42). Bone mineral content (BMC) is similar in the sexes
till age 16 years (43) but is significantly different after that age (44;45), males having
greater BMC particularly in the appendicular skeleton. Shape and regional tissue
distribution also differs so that ratios such as waist to hip and SFT measures need to be
compared within a sex.

26
Figure 2.5. Hattori graph showing change in fat mass adjusted for height (fat mass
index; FMI) v fat-free mass adjusted for height (fat-free mass index; FFMI) in children
from 10.5 to 18.5 years(41).
(Permission to reproduce this has been granted by Professor JCK Wells).
2.3 The impact of nutrition on body composition
Childhood and adolescence are periods of rapid growth and development requiring a diet
providing sufficient quantities of the 3 major food groups; fats, carbohydrates and
proteins and minerals and vitamins. Body composition is influenced by many factors;
genetic, hormonal, activity level and state of health but a major factor is that of
nutritional intake. There is little research on the direct impact of nutritional intake on
body composition in children with more likely outcomes of weight, height and BMI.
Monitoring child growth by measuring height and weight gives an indication of under-
and over-nutrition and wasting and stunting may be the first sign of a problem.
10.5y
18.5y
18.5y
18.5y
10.5y
10.5y
18.5y

27
2.3.1 Under-nutrition
Under-nutrition leads to weight loss or failure to increase weight in the growing child
due to an imbalance between nutrient intake and requirements. Chronic under-nutrition
in children may lead to stunting. The imbalance may be due to reduced intake and/or
absorption or increased requirements such as during sepsis, trauma, cancer or
hypermetabolic states (46) or a combination of both. Where there is a deficit between
intake and nutrient needs then body stores are used first to maintain the brain, since
injury is rapid in the absence of glucose or ketones and second to maintain the structural
elements of the body, cells and extracellular fluid containing protein. Energy is stored in
the body as carbohydrates, protein and fat. Carbohydrate stored in the form of glycogen
is only sufficient to provide energy for 24 hours and although body protein is sufficient
to provide for the energy requirements for 30 days the structure of the organs would be
lost. Fat is an expendable source of energy although it is not able to supply essential
glucose for the brain. During periods of inadequate nutrition glucose for the brain is
obtained by gluconoegenesis from protein catabolism and glycerol from lipolysis. If the
energy deficit is prolonged fatty acids being transported to the liver are converted
ketones which the brain can utilise and thus protein is spared. A study by Keys et al (47)
examined the effect of 6 months of famine on a group of conscientious objectors in 1943
and showed that volunteers on this low calorie, low protein diet lost on average 17% of
their lean mass and a marked fat loss of 73%. These volunteers returned to normal body
composition after 1 year on a normal diet but malnutrition in patients may not be so
easily corrected.
In patient groups, malnutrition may not be only be due to inadequate intake or
absorption but may be affected by abnormal hormone and cytokine profiles as a
consequence of sepsis or trauma resulting in an increased metabolic rate or an abnormal
metabolism due to disease. A study of patients with CF from 1 month to 17 years found
that, although 12 infants diagnosed by neonatal screening had low body cell mass that
was corrected by 1 year with therapy, children aged 2-17 years showed an increasing
tendency with age for inadequate accretion of body cell mass (48). This is despite early

28
diagnosis and treatment. The same group report catch-up growth (weight, length and
body cell mass) in 25 neonates with CF receiving conventional pancreatic enzyme and
dietary therapy (24). In this group however, the mean FM remained significantly lower
than expected at 1 year. Shepherd (49) in her review of nutrition in CF identifies the
major consequences of malnutrition in CF as growth retardation, delayed puberty and
specific deficiencies of protein, fatty acids, vitamins and minerals. If left untreated
failure to thrive, growth failure, wasting and gross motor delay are likely. If the infant is
fed a reduced useable protein source such as soya or has a low intake of protein, as in
unsupplemented breast milk, secondary hypoproteinaemia with generalised oedema have
been reported. Therapeutic regimes aim to correct the deficiencies. In a study of 10
growth retarded children with CF given nocturnal feeds of 120-140% of normal
requirement for protein and energy for 1 year it was found that all had catch-up weight
by 6 months and 9 catch-up height. Catabolism was reduced and there was a reversal in
the trend for deteriorating lung function (50).
2.3.2 Over-nutrition
A positive imbalance between intake and expenditure over time will result in the excess
energy being stored. In adults the consequent weight in relation to height (BMI) is used
as a screening tool for overweight (greater or equal to 25) and obesity (greater or equal
to 30). In adults BMI has a U shaped relationship with mortality. In children FM, FFM
and height are changing rapidly, at different rates and particularly around the period of
puberty where the timing may be affected by the amount of FM itself and therefore BMI
cannot be used to classify overweight and obesity. In the paediatric setting BMI adjusted
for age and sex, as centiles or SDS are used. However, even BMI centiles or SDS
cannot distinguish between high FM and low FFM and vice versa for a given weight.
Where nutritional therapy has been based on the weight of a child any weight gain may
mask low FFM, in a study of patients with cerebral palsy given gastrostomy feeds it was
reported that the gain in weight was due to a high FM (51). The universally
recommended dietary intake for a child with CF is 120-140% of that of a healthy child.

29
Without measurements of actual body composition rather than just weight and BMI it is
possible that the targeted weight gain may be excess FM rather than FFM and there is
mounting evidence of obesity in children with CF (52). It is likely that if excess FM in a
child with CF continues into adolescence and adulthood then the risk of complications
such as those associated with cardio-vascular disease will be increased.
The effect of habitual diet on body composition is complicated particularly in children
and patients where energy requirements may vary according to sex, age, puberty,
activity and disease process. An accurate record of dietary intake over time is difficult,
particularly in this group of children where appetite can change frequently. An
experimental intervention with body composition as the outcome is the best way to
investigate this relationship. This thesis does not take account of dietary intake although
it is acknowledged that diet will impact on body composition.
2.4 Previous studies investigating the effect of cystic fibrosis on
growth and body composition
A full explanation of the advantages and disadvantages of different body composition
techniques is presented in Chapter 3. I will present here the findings of previous studies
according to the techniques used with an explanation of the relevance of the technique in
this particular group of patients. A summary of the most pertinent studies is presented in
Table 2.1.
2.4.1 Anthropometry
Measurements of height, weight, circumferences and SFT have been used for many years
for the assessment of growth and body composition. They are not recommended for
evaluating body composition clinically in individuals or for short term changes in FM (53).

30
Indices of height and weight have been, and still are used to assess nutritional status in
children by plotting on centile charts or by the calculation of percentage weight for age,
percentage height for age, percentage weight for height and percentage of ideal body
weight (%IBW). In 2001 in the UK the Royal College of Paediatrics and Child Health
advised the use of BMI centile charts in preference to percentage weight for height and in
2002 the UK CF Trust recommended the use of software that uses UK 1990 growth data to
generate SDS for height, weight and BMI (54). A study by Wiedemann et al (55) found
that 4577 children with CF were reasonably nourished by %IBW but when using BMI
centiles they were below the reference median. Another study (56) reported that %IBW
underestimated malnutrition in children with short stature and overestimated it in those who
are tall. In the United States the CF Foundation recommended the use of BMI centiles for
the assessment of children and adolescents in 2008 (14). However, BMI cannot distinguish
between FM and FFM as evidenced from the following graphs showing the body
composition of 2 children measured for this thesis.
Figure 2.6. Graphs of body mass index (BMI; weight/height2) indicated in blue, fat
mass index (FMI; fat mass/height2) in green and lean mass index (FFMI; fat-free
mass/height2) in orange, standard deviations scores (SDS) for two children with cystic
fibrosis.

31
The first graph illustrates that this child has a higher FFM and lower FM SDS compared
to BMI SDS and the second graph depicts a child with high FM and low FFM compared
to BMI SDS.
Stunting (57) and wasting (58) have been shown to be independent predictors of survival
and the lack of short stature amongst adults may be due to survival of well nourished
patients rather than improved growth in the undernourished (59). Low weight for height in
adults occurs particularly in females and is correlated with more severe lung disease and
reduced survival (60;61). McNaughton et al (62) comparing indices of height and weight
with nutritional status assessed by total body potassium counting found that height and
weight were not sensitive indicators of suboptimal nutritional status defined by total body
potassium SDS of ≤ -2 or < 80% of predicted in 226 children with CF. The literature is
consistent in finding that children with CF tend to be shorter and lighter than their healthy
counterparts (15;55;63-65) and a recent study in Poland (66) noted that the children were
disproportionately shorter in the legs compared to the trunk.
Longitudinal studies suggest that weight for age and height for age decline over time, are
associated with declining lung function and that there are differences between the sexes
(10;13;67;68). However, despite CF being a disease of malabsorption there are now reports
of obesity. Kastner-Cole (52) reviewed the records of 3,000 patients, from infant to adult,
on the UK CF registry and found the incidence of obesity to be 1.4% in boys and 1% in
girls under 18 years and 1.6% in men and 0.2% in women. My own data of BMI SDS in
young children with CF (69) found an obesity level of 10.8% in boys and 0.02% in girls.
However, due to the inability of BMI to distinguish between FM and FFM the proportion
with a high BMI due to elevated FM (assessed by the 4-component model; 4CM) was only
8% of boys. In ‘healthy’ populations high BMI has a negative relationship with forced
expiratory volume in 1 second percentage of expected (FEV1%) in children (70) and adults
(71) although in the CF population a positive relationship has been demonstrated (11;72)
and Forrester et al (73) found that high BMI SDS independent of muscle mass in 2096
clinically stable adults with CF was associated with better FEV1. This study used serum
creatinine as a marker of total skeletal muscle and the authors acknowledged the need for

32
caution when using this marker in those with extremes of muscle mass. However, the fact
that BMI is positively associated with FEV1 regardless of muscle mass is interesting and
the finding that those with BMI ≥ 25 kg/m2 have the highest values for FEV1 may be a
reflection of their better clinical status compared to those with lower BMI. As previously
discussed BMI does not distinguish between FM and FFM and the discordance between the
negative relationship between BMI and spirometry in healthy subjects and the positive
relationship in adults with CF may suggest that a given BMI represents different body
composition in these two groups.
SFT at 3 or 4 sites is often used as a proxy for overall body fat. Some studies
inappropriately quantify FFM using SFT (74;75) (since measuring sub-cutaneous fat does
not give information regarding FFM), whilst other studies introduce error by converting
raw SFT data to % fat using published equations that may not be relevant to children with
CF (76). Indeed, in my own study comparing SFT converted to FM by 2 different
prediction equations, I found that the bias varied between 3 and 21% of the mean value
depending on equation, sex and whether the child was healthy or had CF (69). Arm
anthropometry (mid-upper arm circumference; MUAC and tricep SFT) plotted on centiles
from reference data (77) has been recommended in a US consensus document on the
management of CF (78) to monitor FM and FFM clinically. However, a study by Chomtho
et al (79) comparing arm anthropometry to the criterion 4CM and DXA in 110 healthy
children and 40 children with CF found the measurements predicted FM but not FFM.
2.4.2 Bio-electrical impedance
BIA is a prediction technique, that is to say TBW is predicted by resistance to a flow of
electricty through the body rather than actually measuring FFM. The accuracy of
prediction techniques such as BIA is assessed by comparing to a robust reference method
(one that is not a prediction technique). Thereafter, using regression analysis a population
specific prediction equation can then be generated for use in a similar population. Suitable
reference techniques actually measure FFM or a proxy of FFM such as water or body

33
potassium and include the 4CM, total potassium counting, DXA and hydrometry (described
in Chapter 3). Prediction equations are often generated in healthy populations which may
not be suitable for patient groups and few equations have been derived for patients with CF.
Previous body compositon studies have concluded that BIA predicts total body water
(TBW) (80;81) or total body potassium (82) in children and adolescents with CF and may
be used with equations derived from CF populations to predict FFM. Other studies have
used inappropriate reference methods for comparison with BIA such as SFT and MUAC
and therefore the conclusions can be questioned (83;84). A study of adults with CF by
King et al (75) compared FFM predicted from 2 BIA equations based on healthy adults
(85;86) compared to DXA and found that although FFM by each technique was correlated,
one equation overestimated FFM in women and the other underestimated FFM in men with
CF. Eisenmann et al (87) studied 3-8 year old children and compared BIA to DXA
concluding that BIA has ‘limited utility in estimating body composition’. However,
although several studies have generated prediction equations for FFM in a paediatric
population by the incorporation of the relationship between height2/impedance and factors
such as age, sex and weight (88-91), there is limited research specifically in children with
CF. A literature search revealed only one study that generated a prediction equation for
TBW in CF children and adolsecents by comparing to deuterium dilution (92). Prediction
of TBW and thereby FFM may be affected deleteriously in the CF population by
disturbances in skin electrolyte composition, abnormal fluid distribution, sodium depletion
and hydration level (80;93;94). Using BIA a previous study found the greatest decline in
nutritional status occurs after the onset of puberty, particularly in girls (59) although other
studies using DXA, suggest that deterioration in growth and nutritional status occurs
throughout childhood (36;95).
2.4.3 Hydrometry
Some studies have utilised hydrometry, often in conjunction with other techniques to
investigate body composition of children with CF. Where hydration of the FFM is within
normal range this technique is one of the more accurate ways to calculate FFM. I am not

34
aware of any studies of children with CF that have noted abnormal hydration of the FFM.
Stettler (96) noted a reduction in FFM in boys only and another study found both boys and
girls had less FM and FFM than controls (74) using hydrometry and SFT. Not all studies
identify deficits of body composition in children with CF; Marin et al (97) using
anthropometry and hydrometry found no difference between 15 children with CF and
controls, however, not all subjects were matched with same sex controls.
2.4.4 Dual-energy X-ray absorptiometry
Low bone mineral density (BMD) has been reported in both children (64) and adults (98)
although other studies report normal BMD in young children (99;100). There has been
extensive research into the relationship between bone and clinical outcome in CF but for
the purposes of this thesis I will be concentrating on the relationship between soft tissues
and clinical outcome. Soft tissue assessment by DXA has become more widely used due to
its increased availability in recent years. There are inherent problems for soft tissue
assessment because of the assumptions made in the software and a large study of healthy
children by Shypailo et al (101) concluded that it could not be considered a reference
method. In my own study comparing DXA to the criterion 4CM in healthy children and
those with a variety of diseases I found that bias was affected by size, sex and whether the
subject was healthy, obese or had CF or glycogen storage disease (102). DXA significantly
underestimated FFM in girls with CF but not boys although the age range was narrow (8-11
years) and the numbers small (n=26). However, despite its limitations DXA is the most
sophisticated of the body composition techniques likely to be available in a clinical setting.
There is a paucity of research into the best way to utilise the data from DXA in this group
of patients; whole body and regional bone and soft tissue data is generated but there is a
lack of reference data in children and a lack of research as to whether the components of
body composition should be size adjusted when compared to a reference group.
Several recent studies of children and young people with CF using DXA have noted a
reduction of FM, FFM and BMD (36;65;103). Depletion of these tissues becomes more
severe with increasing age (36;67). Even with normal BMI, FFM and BMD depletion has

35
been noted in adults (75;104) and in one study of children and adolescents 54% were found
to have a lean mass of ≤ -2 SDS with % IBW of ≥ 85% (105) although size adjustment in
this study may not have been ideal. This is referred to as ‘hidden depletion of FFM’
because monitoring using BMI would not reveal a problem.
2.4.5 Total body potassium
Body cell mass (BCM) is the metabolically active part of FFM and therefore if accrual
during growth is suboptimal nutritional status will be affected. 98% of 40K is in BCM so
the most common way to measure BCM is with a total body potassium counter. These are
quite rare and the research using this technique in patients with CF is predominantly from
Toronto where several studies have investigated the effects of different feeding regimens
(106-108) or from Brisbane where the research question often addresses the relationship
between BCM and growth and nutritional status and, more recently, REE (24;48). Because
this technique does not measure absolute values of FM and FFM, direct comparison with
other body composition techniques is difficult. The technique is hampered by the fact that
conversion of total body potassium to BCM uses an equation derived in healthy adults
(109) and in addition there is sparce reference data that allows for adjustment for height and
sex although the Brisbane group have generated their own.
Shepherd et al (89) evaluated total body potassium in 140 patients with CF and found
suboptimal growth was associated with deficits in growth of BCM. Thomson et al (95)
found that in 61 children with CF, those with normal BCM had significantly less decline in
spirometry over 2.4 years and they recommended the use of the technique to predict those
children at risk of greatest decline. Murphy et al (110) assessed BCM in a group of 64
children aged 10.6± 2.9 with CF and using their own reference data found that the children
had a mean BCM SDS of 0.54 with boys slightly higher than girls but with more variability
between individuals. Only 2 children were considered to have suboptimal nutritional
status. Neonatal screening for CF has been common place in Australia for several years,
unlike the UK and this may account for the good nutritional status of these children.

36
2.4.6 Longitudinal studies of body composition in cystic fibrosis
One of the problems of interpretating data from published studies is the different age
ranges, particularly in the growing, maturing child, and particularly with the changes
associated with pubertal development. However, longitudinal studies have the advantage
of investigating body composition at different time points in the child’s development and
may give a clearer picture of the effects of the progress of the disease. There are few
longitudinal studies of body composition in children with CF. Stettler et al (96) using SFT,
deuterium dilution for TBW and total body electrical conductivity to measure 25, 5-10 year
children with CF over 3 years concluded that statural growth, FM and FFM acquisition was
slower in the CF boys compared to the control group. Using SFT the girls with CF
increased in FM compared to controls. However, the control children were chosen to
match the height and weight of the children with CF and therefore may not be
representative of healthy children generally. Bianchi et al (65) used DXA to compare 136
patients with CF ranging in age from 3-24 years over a 2 year period. The study was
predominantly investigating BMD and found deficits occured in all of the 3 sub-groups;
prepubertal, pubertal to age 18 years and adults. At baseline FM and FFM were diminished
in both sexes but it is not clear from the reported data what changes occured in body
composition over time, simply that baseline and change in FFM was significantly
correlated with FEV1%. The findings of this study may not be directly comparable to other
studies because the reported FFM appears to be lean mass by DXA (non-fat soft tissue) and
it is not clear whether the relationship between FFM (lean mass) and FEV1 has been size
adjusted. One would expect absolute values of FFM to correlate with FEV1 since
increasing absolute FFM is related to increasing size and FEV1 increases with increasing
size.
Two longitudinal studies from Brisbane assessed BCM in 25 infants (24) and 64 children
(110). The study of infants found birthweight within the normal range and although weight
SDS dropped initially, after 1 year it was not significantly different from zero; length SDS
was low at baseline and remained low after 1 year (mean ±SD; -0.25±0.12). BCM SDS

37
was depleted initially (-1.42±0.78) and within the normal range by 1 year of age; FM SDS
assessed by anthropometry was low at baseline (-0.74±0.38) and remained low
(-1.13±0.15) after 1 year. Mindful that all these infants had been identified by neonatal
screening and received early treatment the findings of reduced length and low FM after 1
year are interesting. The authors suggest that increasing physical activity and pulmonary
and pancreatic pathology may be a factor and that with growth, increasing BCM reaches a
critical point at which energy intake becomes a limiting factor for normal rates of accretion
of FM. Murphy et al (110) studied 64 children with CF aged from 5 years and found them
to be well nourished assessed by BCM at baseline with only 2 children with suboptimal
nutritional status and after 2 years only 5 children were assessed as suboptimal.
Deterioration in BCM SDS had occured more in boys than girls although the girls at
baseline were lower than the boys (girls; 0.30±0.94, v boys; 0.76±1.39). At baseline the
children were also short (height SDS; mean±SD, -0.59±0.92) and light (weight SDS;
-0.32±0.99) but change in height and weight SDS were not reported. There was no
deterioration in FEV1 over the study period. The authors acknowledge that the equation
used to convert total body potassium to BCM may not be appropriate to either a patient or
paediatric population. The finding that, in this study, boys had greater deterioration in
nutritional status compared to girls is in accord with some previous studies (96;111)
although it is contrary to the findings in other studies (10;112) and to expectations
considering the better prognosis in males compared to females with CF (3;112). As
discussed previously, it is likely that the cohort studied, who were diagnosed following
neonatal screening, would have received early treatment and therefore are likely to have a
better nutritional status than those children with CF who were diagnosed following
symptoms of failure to thrive and persistent chest infections.
The cohort studied by Murphy et al was also part of a larger group including adolescents
and adults (n=153) studied by Buntain et al (100); the children and adolescents were
followed up in 2006 (36). Using DXA and measures of BCM and anthropometry the 2004
study was mainly concerned with bone status finding no bone deficits in the children, some
deficit in adolescents and severe deficits in the adults with CF. They conclude that factors
indicating nutritional status such as BCM and BMI, physical activity and spirometry are

38
postively related to BMD and days in hospital and number of admissions negatively
associated with BMD. Although BCM was reported between the controls and patients the
values were expressed in grams and therefore not comparable between groups since the
numbers of males and females were different and the ages are not clear. The follow-up
study in 2006 using DXA, only examined the children and adolescents (n=85) and found
that the CF children (aged 5-10 years) were not significantly different from controls at the
start but did not increase lumbar spine (LS) BMD as much as the control group. The older
group (11-18 years) started with deficits of total, LS and femoral neck BMD and did not
gain total body and femoral neck BMD at the same rate as the controls. In summary, the
children with CF at age 5-10 years were not significantly different from the controls but
over 2 years they fail to accrue bone at the same rate as the controls at the LS only.
However, the older children at age 11-18 already have lower BMD at all 3 sites, fail to
accrue bone at the neck of femur and total body at the same rate as controls but maintain a
similar rate of gain to controls at the LS. Lean tissue mass (non-fat soft tissue) by DXA was
similar at the start between children with CF and controls and accrual was similar despite a
smaller weight change in the children with CF. The adolescent group had less lean tissue at
the start but accrual was similar and weight change was similar. Interestingly, the
adolescents with CF had a non-significant higher gain in height than the controls which
does not appear to be related to timing of puberty. Pubertal stage and menarche was
reported as similar in both groups of girls however, the boys with CF were reported as
having delayed pubertal development at the start compared to controls and this difference
persisted over 2 years. Lung function was stable in the children over 2 years but declined
in the adolescents. Activity was reported as greater in the CF children at the start of the
study and remained higher whereas adolescents started with a similar activity level which
diminished over time compared to controls
In summary, no previous study has used a criterion technique to assess body composition in
children with CF and different techniques, sexual dimorphism, whether there has been size
adjustment, varying age ranges and the difference in average time of diagnosis related to
neonatal screening programmes make comparison between studies difficult. Available
studies suggest that deficits of FM, FFM and bone are most severe in adults and reports in

39
children vary between no difference from controls to depletion of either or both of FM and
FFM (including bone). There is agreement that deficits become apparent with increasing
age (10;95;100). BMI has been shown to be a poor indicator of nutritional status since
hidden depletion of FFM has become apparent in both adults and young people.
Surprisingly, since this is a disease characterised by undernutrition, obesity is increasingly
becoming a problem that, with longevity is likely to be related to increasing difficulties in
adult life. Sex differences have been noted, some studies reporting worse nutritional status
in boys compared to girls (96;111) and some reporting that girls have poorer nutritional
status than boys (10;112). There are reports of pubertal delay in girls (35) and young boys
(36) and also of no pubertal delay (100).
2.5 Relationship between growth, body composition and
spirometry
A seminal paper by Corey in 1988 (39) comparing growth and lung function between
Boston and Toronto patients showed that although lung function was similar, growth in
patients was greater and survival longer in Toronto compared to Boston patients. This was
attributed to the high fat diet prescribed in Toronto. There is also evidence that improving
nutrition can delay deterioration of lung function and improve survival (50;106) and that
children with short stature have poorer lung function later in life (57). FEV1 predicts
mortality (113) and yearly rate of decline in FEV1 is a better predictor of mortality
(114;115). A study in the UK (58) found that FEV1% and % IBW predicted survival at 5
years.
2.5.1 Cross-sectional reports of body composition and spirometry
Reviews of national databases of CF patients allow for the study of large numbers of
patients and therefore confidence in the findings, although, typically the available data is
limited to weight, height, spirometry and clinical factors. Rather than body composition,
nutritional status is reported in terms of stunting or wasting. Whilst these studies are

40
informative the cross-sectional design cannot reveal the nature of the relationship between
spirometry and nutritional status. The cross-sectional part of a study of the German CF
registry data (n=3298) by Steinkamp et al (13) found that weight, height and lung function
decreased with age, FEV1 was negatively related to malnutrition and Pseudomonas
aeruginosa infection but not related to sex and that those malnourished had lower FEV1 and
higher markers of inflammation regardless of Pseudomonas aeruginosa infection. Kastner-
Cole et al (52) reviewed the UK registry data regarding the prevalence of overweight and
obesity and emphasied the positive relationship between high BMI and lung function
especially in children. However, the large age range and type of data available limits the
conclusions that can be drawn from these retrospective studies. Smaller, prospective
studies that distinguish between differing growth stages such as pre-pubertal, adolescent
and adult and the sexes may give more information about the relationship between growth,
body composition and lung function. A large study which evaluated 114 children and
adolescents in 3 age groups; under 6, 6-10 and 11-18 years using DXA found the mean
value for FFM SDS was < -2 in the 2 youngest groups and -4 in adolescents and was
positively correlated with FEV1 (116). Unfortunately FFM was adjusted for weight not
height which would have been more appropriate given they were all short (children-0.5,
adolescents, -0.9 height SDS). This may account for the very low FFM SDS noted even in
the very young children and the subsequent report of a large proportion of the subjects (50-
60%) with hidden depletion of FFM (% ideal weight for height >85% and FFM SDS <-2).
Many studies have low numbers, crude techniques, do not adjust for short stature or fail to
address the sexes separately. Even so, a consistent positive relationship between lean mass
(bone and FFM) and lung function has been noted in both adults (117-119) and children
(36;65). It has been suggested that lung function is influenced by body muscle mass (8)
and loss of FFM is associated with loss of diaphragm muscle (120). In addition, exercise
improves lung function and sex differences in exercise habit contribute to sex differences in
lung function (121). However, Ahmed et al (111) reports a positive relationship between
spirometry and both FFM and FM in boys only using SFT and Pedreira et al (11) using
DXA report a relationship between FM and and FEV1 (non-significant).

41
2.5.2 Longitudinal reports of body composition and spirometry
The mechanisms of the inter-relationship between lung function and nutritional status are
complex and not completely understood and the direction of the relationship is unclear
(10;11). Although it is not possible to define cause and effect, longitudinal studies have the
advantage of demonstrating the relationship between changes in nutritional status and
changes in clinical status.
A report of the longitudinal data from the German CF registry (13) found that in 536
children and 477 adolescents those with normal weight had a smaller decrease in FEV1%
over 2 years than those who were underweight for their height and those with improved
nutritional status showed improved FEV1%. Another large study (n=931) showed that
those children at age 3 who were at or below the 5th centile for weight-for-age had poorer
lung function at age 6 years compared to those who had a weight-for-age over the 75th
centile at 3 years (122). Those children who had improved weight SDS had improved
FEV1% and no difference was found in growth and nutritional status between the sexes or
between age 3 and 6. This is in accord with another large study (n=319) of children from 6
to 8 years (68) that found baseline weight was significantly associated with FEV1% and
those with at least a 100g weight gain per month had significant increases in FEV1%
compared to those who did not. This is further supported by intervention studies
demonstrating that overnight gastrostomy feeds for just over a year stabilised spirometry in
the treated group whereas in the severity matched control group FEV1 decreased by 13%
(106) and overnight feeds given for 1-2 years resulted in a reversal of declining FEV1 (50).
Zemel et al (10) performed another large analysis (n=968) using the US CF registry data for
children aged 5-8 and found declining FEV1 over 4 years with most decline in those with
FEV1 ≥ 90% at baseline. The authors suggest that young children with good lung function
and intercurrent pulmonary illness may not be treated as aggressively as those with poor
lung function. Deteriorating lung function was worse in girls compared to boys. This study
found clear sex differences in this young age group; height SDS improved in boys but
deteriorated in girls and weight SDS deteriorated in both sexes but more so in the girls.

42
Bianchi et al (65) investigated 136 patients with CF dividing the data into pre-pubertal,
adolescent and adult subjects. Surprisingly they found that 40% had low BMD with no
difference between the age groups and no difference using size adjusted BMD SDS.
Change in BMD over 2 years positively predicted change in FEV1 whereas change in FFM
was only weakly related to change in FEV1. This may, in part, be explained by the fact that
the authors use ‘FFM’ as ‘the soft tissue proportion of non-fat region’. It is likely that if
bone was included in FFM the relationship with FEV1 would be stronger.
The fact that changes in body composition are related to changes in lung function seems
clear but it is difficult to draw conclusions about cause and effect. Some evidence from
animal studies suggest that sub-optimal nutrition has a detrimental effect on the lung. The
malnourished mouse model of respiratory infections in CF suggests that malnutrition
contributes to compromised lung defences, bacterial colonisation and systemic
inflammatory response (123). The timing of undernutrition has an effect in rats, in young
animals causing a retardation of growth and sometimes irreversible non-development of the
lung and in adults an alteration to the architecture of the terminal air spaces similar to
emphysema (124). Fetal undernutrition has been suggested as a cause of lower FEV1 in a
study of men over 60; those with the lowest birthweight had the lowest FEV1 after adjusting
for current height and age (125).
It could also be argued that CF related lung disease affects body composition due to the
inflammatory response to chronic bacterial infection leading to an altered protein-energy
balance, lack of appetite and reduced activity. Much research into the relationship between
severity of lung disease, protein catabolism and systemic inflammation and the detrimental
effect on FFM including bone has been undertaken by a group of researchers from the
University of Wales College of Medicine. Using measures of systemic inflammation
(serum tumour necrosing factor-α and interleukin-6), protein breakdown (urinary
pseudourine) and connective tissue breakdown (cross-linked N telopeptides of type 1
collagen) they found that inflammatory mediators were higher in clinically stable adults
with CF compared to controls and were related to increased protein and connective tissue
breakdown which were in turn related to impaired FEV1 and low FFM as measured by

43
DXA (118). This finding of inflammatory and catabolic response is supported by other
studies of patients with CF concluding that chronic lung disease is a major factor in altered
body composition and metabolic complications (16;126;127). Similarly for patients with
chronic obstructive pulmonary disease (chronic bronchitis and emphysema) lung damage is
followed by an inflammatory response and narowing of the airway and typically weight
loss (128). Studies of patients with CF suggest that loss of FFM generally will impact on
inspiratory lung muscle and its function adding to the difficulties of breathing (120;129-
131) and may reduce response to antibiotic treatment (132) and therefore generate a vicious
cycle of pulmonary inflammation and progressive lung disease (133).
Insulin-like growth factor (IGF-1) is an important hormone that has an anabolic effect on
the body by promoting protein synthesis and inhibiting protein degradation (134). Increase
in muscle mass has been demonstrated where IGF-1 has been given to patients (135) and
animal studies have shown that IGF-1 prevents diaphragm atropy due to malnutrition (136).
A study by Sermut-Gaudelus et al. (105) of 24 children with CF found that those with a
reduction of ≥1 SDS lean mass by DXA after 1 year had the lowest levels of IGF-1 at
baseline and that this was independent from weight and FM. They conclude that reduction
of IGF-1 may not only reflect but contribute to overall nutritional status. Growth hormone
stimulates linear growth and is a potent anabolic agent and has been used clinically to
improve nutritional status and protein catabolism in acquired immune deficiency syndrome
and burns patients (137;138). Its use in patients with CF has been shown to improve
growth and clinical status (139) and protein catabolism (140) in a randomised clinical trial
in pre-pubertal children.
It is likely that the relationship between lung function and body composition is not simply
one of cause and effect but more about inter-dependence, deterioration in either impacting
on the other via complex body mechanisms.

44
2.6 Summary
Age at diagnosis impacts on clinical outcome.
Historically, growth (weight, height and BMI) has been related to morbidity and
mortality, however, the impact of body composition cannot be determined using
these measurements. BMI cannot detect hidden depletion of lean mass and may
not correctly identify obesity.
There is deterioration in growth, nutritional status and body composition in
patients with CF over time which may start at a very young age. Although
research has shown that CF has a detrimental effect on growth, studies have
variously found either no, or deficits in FM, FFM and bone in children and
young people with CF.
Sex differences are apparent but there is no agreement between studies. Given
the poorer prognosis in females this merits attention.
There is not agreement about whether pubertal delay occurs and in which sex.
Consistent findings of a relationship between BMI or FFM (including BMD) and
spirometry are reported.
The differing methodologies in past studies make comparison difficult. Cross-
sectional observational studies have limited utility in defining the multi-factorial
relationship between spirometry and body composition. Longitudinal studies
have the advantage of the ability to relate change in body composition to change
in spirometry.

45
Table 2.1. Studies of body composition and lung function in patients with cystic fibrosis.
Only details relating to body composition and lung function are noted in the table. Study N
Age yrs
Duration/
details
Outcome
variables
Adjusted Sexes
separate
Findings
Cross-sectional studies
Steinkamp
2002 (13)
3298
≥ 2
Cross-sectional
German
CF registry
Weight, height,
FEV1, PA
Yes Weight, height and lung function decrease with age.
FEV1 related to malnutrition & PA but not to sex at all ages
Patient with malnutrition had ↓FEV1, ↑inflammation independent of PA
Kastner-
Cole
2005 (52)
2987
1-56
UK CF registry
Homo ΔF 508
Weight, height,
BMI, FEV1
Yes Prevalence overweight; children, 8% M, 10% F, adults 13% M, 5% F
Prevalence obesity; children, 1% M&F, adults, 1.6% M, 0.2% F
Children; BMI SDS +ve association with FEV1% through entire range of
BMI (-4 to +3)
Adults; + ve association with FEV1 until BMI 23 kg/m2
Rochat
1994 (119)
12
19-24
Cross-sectional
malnourished
CF vs controls
DXA LM, BMC,
FM, FEV1 Weight
Height
normalised
to 170cm
No ↓BMC & LM
FEV1 correlates with weight, LM & BMC but not FM
Stallings
2005 (72)
16 females
8-29
Cross-sectional
Pre & post puberty,
CF vs controls
DXA FM, FFM
arm anthropometry
FEV1 REE
None Only
females
CF ↓height, arm muscle area, ↑REE but not different in FM & FFM
BMI +ve association with FEV1 and age – ve association with FEV1
Conclude; poor growth, nutritional status and delayed menarche associated with
poorer lung function
King
2010 (117)
86
19-59
Cross-sectional
CF vs ref data
DXA FFM, BMI,
FEV1
Height Yes FFM depletion in 14%, low BMI in18.6%
FEV1 associated with FFM in both sexes
Pedriera
2005 (11)
50
7-17
Cross-sectional
Mild lung disease
CF vs ref data
Weight, height,
BMI
DXA FM, FFM
None No BMI SDS strong +ve association with FEV1
FFM SDS weaker significant association with FEV1
FM SDS non-significant +ve association with FEV1
FEV1; forced expiratory volume in 1 sec, PA; pseudomonas aeruginosa, BMI; body mass index, M; male, F; female, SDS; standard deviation score (Z), DXA; dual-energy X-ray absorptiometry,
LM; lean mass (non-bone), CF; cystic fibrosis, BMC; bone mineral content, FM; fat mass, FFM; fat-free mass, REE; resting energy expenditure, BMD; bone mineral density, BCM; body cell
mass, LS lumbar spine, %IBW; percent ideal body weight, BIA; bio-electrical impedance analysis, SFT; skinfold thickness, TBW; total body water, FVC; forced vital capacity, TOBEC; total
body electrical conductivity.

46
Table 2.1 continued. Studies of body composition and lung function in patients with cystic fibrosis.
Only details relating to body composition and lung function are noted in the table.
Study N
Age yrs
Duration/
details
Outcome
variables
Adjusted Sexes
separate
Findings
Cross-sectional studies continued
Henderson
1999 (64)
40
5-20
Cross-sectional
Pair-match
DXA BMD,
FM, LM
None No Mean weight and height SDS -0.7. Reduction of 19% BMC, 18% FM and
12% LM. Weak correlation LM and FEV1
Large age range
Buntain
2004 (100)
153
5-56
Cross-sectional
Child
Adolescent
Adult
CF vs controls
BMD, BCM, FEV1 Height
Sex
No Adolescents ↓weight & height, adults ↓ weight
LS & total BMD ↓ adolescents and adults
BCM ↓ in child/adolescents
Children & adolescent; BMI, BCM and FEV1 predicted BMD
Adults: BCM & no. of days in hospital predicted BMD
No pubertal delay
Sermut-Gaudelus
2007 (116)
114
2-18
Cross-sectional
CF vs ref data
<6,
6-10
11-18yrs
DXA BMD,
FM,FFM
Weight
No All 3 groups had FFM SDS < -2 (adolescents -4), FM was > 0 in the 2
youngest groups and -1.1 in adolescents. All were short <-0.5 with adolescents
shortest -0.9
FFM SDS significantly correlated with FEV1. LS BMD <-1 in all groups.
Mean FEV1 declined after age 10, osteocalcin correlated with FEV1 and FFM
50-60% normal weight (%IWH > 85%) had FFM SDS < -2 ie hidden
depletion FFM
Pubertal delay in both sexes.
Ionescu
2002 (118)
40
23±0.8
Cross-sectional
CF vs control
DXA FM, FFM
FEV1
Height No Clinically stable adults catabolic and this related to lung disease severity,
systemic inflammation and body composition
FEV1 related to FFM
Those with low FFM had lowest FEV1
Ionescu
2003 (104)
56
17-38
Cross-sectional
CF vs control
DXA FM, FFM
BIA FFM
Lung function
Height No Apparent or hidden loss of FFM related to overall disease severity.
Hidden depletion of FFM associated with ↑ loss BMD and systemic
inflammation
FEV1 related to BMI and FFM
FEV1; forced expiratory volume in 1 sec, PA; pseudomonas aeruginosa, BMI; body mass index, M; male, F; female, SDS; standard deviation score (Z), DXA; dual-energy X-ray absorptiometry,
LM; lean mass (non-bone), CF; cystic fibrosis, BMC; bone mineral content, FM; fat mass, FFM; fat-free mass, REE; resting energy expenditure, BMD; bone mineral density, BCM; body cell
mass, LS lumbar spine, %IBW; percent ideal body weight, BIA; bio-electrical impedance analysis, SFT; skinfold thickness, TBW; total body water, FVC; forced vital capacity, TOBEC; total
body electrical conductivity.

47
Table 2.1 continued. Studies of body composition and lung function in patients with cystic fibrosis.
Only details relating to body composition and lung function are noted in the table.
Study N
Age yrs
Duration/
details
Outcome
variables
Adjusted Sexes
separate
Findings
Longitudinal studies
Shepherd
1986 (50)
10
3-13
1 yr supplementary
feeding
Weight, growth
Infections
FEV1 FVC
No Weight↑, height ↑ and fewer infections
Reversal of lung function decline
Initial catabolic state → anabolic by 6-12 months
Zemel
2000 (10)
968
5-8
4 yr longitudinal
US CF registry
Weight, height,
%height for ideal
weight, FEV1
Yes Decline in FEV1 % over time with most decline in those highest at start ≥90%
and girls > boys.
Baseline weight SDS, height SDS +ve association with FEV1%
Sex difference; Δ height SDS boys ↑, girls ↓, Δ weight SDS ↓for both but girls > boys.
Steinkamp
2002 (13)
536 6-12
477 12-18
Longitudinal 1 or 2 yr
German CF registry
Δ weight/height
Δ FEV1
No 1 yr Δ weight/height: ↓→↓FEV1, normal & stable → stable FEV1, ↑→↑FEV1
2 yr child & adolescents with normal nutrition had smaller decreases in FEV1
than malnourished
Fall in weight/height ≥5% predicted associated with ↓FEV1 and vice versa
Improved weight/height → = or ↑ FEV1
Konstan
2003 (122)
931
3yrs
3yr longitudinal
US & Canada
Weight, height
Lung function
Yes Weight and height SDS -0.5 at age 3 & 6 yrs
No difference in growth & nutritional status between sexes and at 3 & 6 yrs
Weight, height status at age 3 strongly associated with lung function at 6 yrs.
Δ weight ↑ → ↑ lung function
Peterson
2003 (141)
319
6-8
2 yr longitudinal Weight, FEV1 No 1kg higher initial weight→ 55ml ↑ FEV1
2yr 1 kg weight gain → 32ml ↑ FEV1
Ahmed
2004 (111)
143
2-18
1-8 yr
longitudinal
CF vs controls
Weight, height,
BMI, SFT, FEV1
Weight Yes Weight, height & BMI SDS ↓ decreasing with age
Girls < FM till 13yrs and then the same, <FFM at all ages
Boys <FM and FFM especially in late puberty.
Boys FEV1 +ve association with FM & FFM & -ve association with age
Girls no association of body composition and FEV1
FEV1; forced expiratory volume in 1 sec, PA; pseudomonas aeruginosa, BMI; body mass index, M; male, F; female, SDS; standard deviation score (Z), DXA; dual-energy X-ray absorptiometry,
LM; lean mass (non-bone), CF; cystic fibrosis, BMC; bone mineral content, FM; fat mass, FFM; fat-free mass, REE; resting energy expenditure, BMD; bone mineral density, BCM; body cell
mass, LS lumbar spine, %IBW; percent ideal body weight, BIA; bio-electrical impedance analysis, SFT; skinfold thickness, TBW; total body water, FVC; forced vital capacity, TOBEC; total
body electrical conductivity.

48
Table 2.1 continued. Studies of body composition and lung function in patients with cystic fibrosis.
Only details relating to body composition and lung function are noted in the table.
Study N
Age yrs
Duration/
details
Outcome
variables
Adjusted Sexes
separate
Findings
Longitudinal studies continued
Zemel
1996 (67)
26
5-10
3 yr longitudinal
CF vs control
mild lung disease
Weight, height,
arm anthropometry,
TBW(FFM), FEV1,
FVC, REE
FM weight
FFM none
Yes ↑REE not associated with declining lung function
Sex differences; girls REE increased, boys lung function decreased in 3 yr,
Δ height SDS ↓ in girls and boys.
%IBW and genotype predict Δ lung function
REE adjusted for FFM was CF>controls, CF boys>CF girls, the differences
increasing with age.
No account of the relationship between body composition and lung function
Stettler
2000 (96)
25
5-10
3 yr longitudinal
CF vs control
matched for weight
mild lung disease
SFT, TBW(FFM),
TOBEC
None Yes Sex difference; boys Δ height SDS ↓, ↓FFM, ↓FM and girls Δ height SDS ↓,
↑FM compared to controls who are atypical.
No account of the relationship between body composition and lung function
Buntain
2006 (36)
85
5-18
2 yr longitudinal
5-10
11-18
CF vs controls
BMD, BMC,
DXA LM
FEV1, FVC
Height
Sex
No
At start weight and height is similar in children and ↓ for CF adolescents
Δ weight ↓ children and same in adolescents who had NS ↑ Δ height
At start no BMD deficit in children but Δ LS BMD ↓ compared to controls
At start adolescents BMD ↓ compared to controls but rate of change the same
for LS and ↓ for total and femoral neck BMD
Children; FVC related to total BMD & LM related to LS BMD
Adolescents; FEV1 & LM related to total and LS BMD
Bianchi
2006 (65)
136
3-24
2 yr longitudinal
Pre-pubertal child
Adolescent
Adult
BMC, BMD
DXA FM, LM
For ‘body
size’
Sex
40% had BMD SDS < -2 no significant difference between age groups even
when size adjusted
BMD correlated with FEV1 and Δ BMD correlated with Δ FEV1
At start both FM & LM ↓ , LM correlated with FEV1
Δ FFM weakly correlated with Δ FEV1
No sex differences
FEV1; forced expiratory volume in 1 sec, PA; pseudomonas aeruginosa, BMI; body mass index, M; male, F; female, SDS; standard deviation score (Z), DXA; dual-energy X-ray absorptiometry,
LM; lean mass (non-bone), CF; cystic fibrosis, BMC; bone mineral content, FM; fat mass, FFM; fat-free mass, REE; resting energy expenditure, BMD; bone mineral density, BCM; body cell
mass, LS lumbar spine, %IBW; percent ideal body weight, BIA; bio-electrical impedance analysis, SFT; skinfold thickness, TBW; total body water, FVC; forced vital capacity, TOBEC; total
body electrical conductivity.

49
Chapter 3. Body composition measurement techniques in
children and adolescents
3.1 Introduction
The gold standard for body composition measurement at the molecular level is
cadaver analysis, whereas in vivo techniques do not measure body composition
directly but rather predict it from measurement of other body properties (142).
Consequently methodological error whilst acquiring the raw data and theoretical
error when converting raw data to body composition variables must be considered
when assessing the value of techniques.
There is increasing interest in measuring body composition because simple measures
of weight and height cannot distinguish between predominantly metabolically active
tissue (FFM) and predominantly storage tissue (FM). The issue is most pertinent in
patients in whom the magnitude of specific components of body composition impact
on disease progression and management. For example, calculating drug dose based
on weight in a normal weight child with low FFM and therefore high FM could mean
that the dose is not metabolised as fast as expected (143). The problem of accurate
assessment of body composition in children is made more difficult because with
growth and chemical maturation of the lean tissue, the relative proportions of protein,
mineral and water change at different rates in individuals and between the sexes. In
addition, for patients there may be a disruption to the ‘normal’ proportions of the
constituents of lean mass.
Investigation of body composition in children with CF may be beneficial because of
the potential to; (i) aid understanding of the mechanisms that underlie deficits in
patients with CF, (ii) assess the effectiveness of medical and nutritional interventions
and (iii) identify those children at most risk of deterioration.

50
Wang (144) proposed a structural framework for studying body composition
describing 5 levels of increasing complexity; I) atomic, II) molecular, III) cellular,
IV) tissue system and V) whole body (see Figure 3.1). Information can be
transformed between levels, for example, using the chemical constant required to
convert nitrogen to protein (Level I to II) or the density of the whole body to derive
FM (Level V to II). This chapter reviews the merits of the most commonly used
methods available to assess growth and body composition in children and
adolescents.
Image removed for copyright purposes
Figure 3.1. Five levels of body composition (Wang 1992).
3.2 Simple measures
3.2.1 Weight, height and body mass index (Level V)
Although weight, height and BMI are commonly used to classify growth by use of
centile charts or by SDS the measures do not actually distinguish the different
components of body weight. There is generally an assumption that BMI relates to
fatness without consideration to the amount of lean tissue present. Therefore in
normal or low BMI patients with low FFM, for example, some patients with CF, the
BMI categorisation masks the high FM component which may be putting them at
higher risk of metabolic syndrome. Indeed Wells et al.(145) reports data on patients
with congenital myasthenia where a low BMI masks high FM (by isotope dilution
and SFT) Figure 3.2

51
.
Figure 3.2. “Data from infant patients with congenital myasthenia, a condition in
which the development of connective tissue is impaired. Despite extremely low BMI
SDS, the patients have body fat levels higher than the average in healthy children.
This paradox can be attributed to extremely low levels of lean mass. Though they
are underweight, energy intake is not itself constraining their growth”. Wells et
al.(146)
(Permission to reproduce this has been granted by Professor JCK Wells).
Another study by Wells et al. (147) (Figure 3.3) shows two-fold variation in fat for a
given BMI in individual children.

52
1514131211100
2
4
6
8
10Boys
Girls
Column 4
Column 5
Column 6
Column 7
Column 8
Column 9
Column 10
Column 11
Column 12
Column 13
Column 14
FFMI (kg/m2)
FMI (kg/m2)
40% fat
30% fat
20% fat
10% fat
BMI = 20 BMI = 22
BMI = 12 BMI = 14
BMI = 16
BMI = 18
BMI = 24
Figure 3.3. “Hattori graph for children aged 8 showing fat mass adjusted for height
(fat mass index; FMI) v fat-free mass adjusted for height (fat-free mass index;
FFMI). The individuals A and B represent 2 girls with similar BMI (approximately
18 kg/m2) but with A having twice the FMI of B. The individuals B and C have
similar percent fat, but very different BMI and FFMI” (Wells et al (148).
(Permission to reproduce this has been granted by Professor JCK Wells).
Similarly, BMI is not a reliable predictor of lean tissue either (149) and there are
several reports of hidden depletion of lean mass (low lean with normal BMI) in
adults (104;117) and children (105;150). Although height and weight indices are
commonly used to calculate weight for height and height for age in paediatric
patients, rarely is genetic potential or pubertal delay, which is common in children
with CF, taken into account.
3.2.2 Regional skinfold thickness (Level IV)
SFT measurement is a cheap, quick and simple technique to rank relative fatness and
assess specific subcutaneous fat depots. The measurements are made usually at 3 or
4 sites by ‘pinching’ a skinfold, pulling it away from the underlying muscle and then
measuring using a calliper.
A
C
B

53
Figure 3.4. Measurement of bicep skinfold thickness
There is an assumption that subcutaneous fat is proportional to total body fat
although it does in fact vary with age, sex and ethnicity (151). Inter and intra-
operator error in general is low compared to individual variation but it is a technique
that requires experience. In obese individuals the precision and accuracy is poorer.
This technique is inappropriate to derive FFM (weight-FM) because only properties
of FM are assessed.
The measurements are usually made at several sites most commonly of the overlying
skin of the sub-scapular, supra-iliac, bicep and tricep sites. Other sites may be used
but may be more difficult to measure. The raw measurements can then be used to
rank fatness or converted to SDS (152;153) to allow longitudinal assessment of
regional fatness. Until recently the SFT reference data was old (154) but more
contemporary data (155) has been used in this study although not yet generally
available.
3.2.3 Waist circumference
Waist circumference is a quick and easy measurement that has been shown to relate
to visceral adiposity (156;157). In adults, increased waist circumference has been

54
shown to relate to obesity related diseases such as cardio-vascular disease (158) and
even in children a relationship with adverse blood lipoprotein profile (159;160).
Waist circumference is a better predictor of central adiposity than waist to hip ratio
(142) and waist to height ratio is more closely linked to morbidity in childhood than
BMI (161). There is a dearth of studies investigating the relationship between FFM
and waist circumference but a large study of adults concluded that increased waist
circumference was more closely associated with increased FM than FFM in both
men and women (162).
3.3 Predictive techniques
Prediction techniques are those which depend on measuring some characteristic of
the body to predict components of body composition.
3.3.1 Skinfold thickness to derive whole body fat
SFT measurements may be used in the raw state or converted to SDS as described
above or may be used as a predictive technique by applying appropriate equations
(151;163-165). The use of predictive equations is problematic because the
equations; (i) are population specific and have generally been derived in healthy
white populations, (ii) convert individuals to the average and (iii) are derived by
regression using some other body composition method which typically, has not been
a criterion technique. Consequently accuracy in individuals is poor (limits of
agreement ± 9% fat) and varies with magnitude of fatness (166;167).
3.3.2 Bioelectrical impedance analysis (Level V)
Single frequency BIA is a quick, easy, non-invasive technique where a small
alternating current is passed through the body from one electrode to another (at hand
and foot) and the voltage drop (by which impedance is derived) is measured by 2
more electrodes. It is based on the principle that FFM contains water and

55
electrolytes and therefore acts as a conductor whereas FM is relatively anhydrous
and therefore resists the flow of the current.
Figure 3.5. Bioelectrical impedance analysis
Impedance (Z) is the frequency dependent opposition of a conductor to the flow of
an alternating electrical current and is composed of resistance (R) and reactance (Xc).
Biological conductors have both resistive and reactive components, however, the
reactive component is so small (<4% of Z) that R is assumed to be equivalent to Z.
The theoretical model also assumes that the body is an isotrophic cylinder of constant
width, with its length proportional to the subject’s height.

56
The resistance of the cylinder is represented by;
Z = K * HT/A Equation 3.1
Where Z is impedance, K is a constant, HT is the length of the cylinder and A is the
cross-sectional area of the cylinder.
Alternatively;
A = K* HT/Z Equation 3.2
Since;
HT * A = Volume Equation 3.3
Multiplying both sides of the equation by HT;
Volume = K * HT2/Z Equation 3.4
The volume or TBW can therefore be calculated from HT and Z once K has been
calculated for that specific population. K is calculated by regressing Z on TBW
measured by a criterion technique.
However, the body is not an isotrophic cylinder and regional body weight does not
match distribution of impedance (168;169) since long thin cylinders such as the arms
have more resistance than the wider cylinder of the trunk. This is a problem where
proportions differ in growing children and patients with altered proportions (142).
One solution is to divide the body into segments of similar sized cylinders (trunk,
right and left arm and leg) and measure the segments separately, thereby improving
accuracy. In addition, the slope of the regression equations between height and Z
may be affected by sex, age and other characteristics and therefore need to be
calculated for specific populations. This is particularly pertinent in patient groups
and although whole body equations have been derived for some patient groups
(89;92;170;171) the accuracy in individuals is poor and may be affected by clinical
status. In healthy populations error is typically ± 8% fat (167) and Puiman (92)
reports an underestimation of 6% of TBW in patients aged 4 to 18 yrs with CF.

57
Since K is proportional to fluid volume and inversely proportional to the number of
free ions, changes in geometry (volume), electrolyte concentration or body
temperature can affect Z (172).
The use of prediction equations, either those used for the equipment print-out or
those derived in specific populations require an assumption that each individual has
an impedance value equal to the mean and thereby may introduce error. An
alternative to this method is to use the raw impedance data (height 2
/Z) and convert
this to SDS compared to a reference population (155).
3.3.3 Total body conductivity (Level V)
Total body electrical conductivity is similar to BIA in that the theoretical assumption
is that body electrical conductivity predicts body composition (173). The body is
passed through a coiled wire (solenoid) and changes in the electromagnetic field are
measured to indicated the conductivity of the tissues and thereby TBW and FFM.
However, the instrument is bulky and affected by environmental factors and
hydration of the subject and performs best after a 6 hr fast, making it unsuitable for
paediatric use. Manufacture of devices stopped in 1994 and therefore availability is
limited.
3.4 Two-component models (2CM)
The two-component (2CM) divides body weight into FM and FFM the former being
homogenous and the latter although heterogeneous, for the purpose of 2CM is
assumed to be of constant density. Accuracy depends on the assumption of
constancy of the FFM which depends on sex, age, pubertal development, ethnicity
and disease state. Therefore, wherever possible population specific values for the
nature of the FFM should be used.

58
3.4.1 Hydrometry (Level II)
Total body water can be measured on the principle that it is equal to the amount of
stable isotope added to the body divided by the concentration of the isotope in the
water compartment of the body after the equilibrium period (174). Deuterium oxide
(2H2
16O) is commonly used but other stable isotopes can also be used such as 18-
oxygen. The fact that deuterium oxide differs from ordinary water (1H2
16O) by 1
neutron means that it is quantifiable by mass spectrometry. Once ingested the
hydrogen atoms of deuterium are exchangeable with the hydrogen atoms of the water
pool (175). The equilibrium period depends on the sample of body fluid used; blood
sampling is problematic in children, urine sampling is unsatisfactory because it is
difficult to predict a time when the urine content of the bladder is typical of the
whole body water and therefore saliva samples are the best option for all except
babies. The equilibrium period is longer for urine (4-6hrs) than saliva (3-4 hrs)
(176), although the saliva equilibrium period is extended in the obese (177;178).
The calculation of TBW will be affected by any isotope leaving the body during the
early equilibrium period due to sweating or voiding although such loss is minimal
and not considered in calculation of TBW. Drinks taken do need to be accounted for
as they will dilute the isotope leading to a lower concentration and therefore
overestimation of TBW.

59
The equation is:
N = TA * (Ea-Et)
A (Es-Ep) Equation 3.5 (179)
Where N = dilution space (ml)
T = amount of tap water in which portion a is diluted (ml)
A = amount of isotope (g)
a = portion of dose used in analysis (g)
E = isotopic enrichments in delta units relative to an international standard,
Vienna Standard Mean Ocean Water (VSMOW)
Ea enrichment of portion of dose
Et enrichment of tap water used
Es enrichment of post dose sample
Ep enrichment of pre-dose sample
There is a difference between TBW and dilution space measured by isotopic
exchange due to non-aqueous exchange of either 18-oxygen or deuterium with
oxygen and hydrogen ions (180;181). This is addressed by applying a correction
factor;
TBW = N/1.044 in mls for deuterium
= N/1.01 in mls for 18-oxygen (180)
Once TBW has been calculated the amount of fluid consumed is subtracted to avoid
an overestimation of water and consequently overestimation of FFM. FFM is
calculated using age and sex specific constants for hydration of FFM;
FFM = TBW
Hydration of FFM Equation 3.6
The constant for adults is considered to be 0.73 and for babies around 0.80 but the
relationship for the period between the two is not linear (182). Fomon’s landmark
paper in 1982 and Lohman’s later merging of data with that of Fomon (183) has been

60
widely used in calculating FFM however, not all age points were measured,
extrapolation being used for the missing time points. Recently, I collected data for a
comprehensive study of more than 500, 4 to 22 year old subjects that provided
measured hydration factors throughout the range (184). The same study provided the
data to generate SDS for TBW. Using a SDS for an individual avoids the problem of
introducing an error by assuming they have an average value for hydration when
converting TBW to FFM.
3.4.2 Densitometry (Level V)
Densitometric techniques are based on the principle that, if the density of two
components are known and the overall density of the two components combined is
known then it is possible to work out the proportion of one to the other. Body
volume and mass are measured to calculate overall density and then assumed
densities of FM and FFM used to calculate %fat:
% fat = (C1/body density – C2) x 100 Equation 3.7
Where C1 = (densitylean x densityfat)
(densitylean – densityfat)
And C2 = densityfat
(densitylean – densityfat)
For adults, the density of fat is considered to be 0.9007 kg/L and the density of lean
1.100 kg/L
Therefore:
% fat = (495/body density) – 450 Equation 3.8 (185)
Fat is homogenous and therefore assumed to be of constant density (186) whereas
lean tissue is heterogeneous, the relative amounts of protein, mineral and water
varying with growth and different between the sexes. This is a severe limitation
when using densitometric techniques to measure children. Until recently reference

61
data for children has been sparse and based on small numbers of limited age range
(182;187) although our recent reference data for 4 to 22 years from our centre should
improve the accuracy of prediction of FM and FFM (155;184).
3.4.2.1 Under-water weighing/ hydro-densitometry
This technique requires the person to be weighed and then completely immersed in
water whilst being weighed again.
Image removed for copyright purposes
Figure 3.6. Under-water weighing apparatus.
Based on Archimedes principle whole body density can be calculated:
Density of an object = Weight
Density of the fluid Weight – apparent immersed weight
The total immersion in a tank of water means that this technique is not suitable for
the young, sick or infirm and is not suitable for field studies.

62
3.4.2.2 Air-displacement plethysmography (ADP)
Figure 3.7. Air-displacement plethysmography
(Boodpod; Cosmed, Rome, Italy)
A newer technique to assess body density relies on Boyle’s Law of the relation
between the volume, pressure and temperature of gases. The volume of gas in the
front measurement chamber is measured; (i) empty, (ii) with the 50 L calibration
cylinder and (iii) with the subject inside. The front chamber is connected to the rear
reference chamber by oscillating diaphragms which induce small pressure changes.
Raw body volume is calculated from the volume of air without and with the subject
present and then an adjustment made for residual lung volume and surface area
artefact generated by the warmer air in contact with the skin. The residual lung
volume may be measured but the technique is very difficult for children to perform
and therefore predicted volume is often calculated. The equations used to calculate
lung volume, surface area artefact and % fat in the machine’s software are not
appropriate for children. When measuring children the raw body volume is adjusted
using age and sex appropriate predicted residual lung volume (188;189) and surface
area artefact (190).
ADP has been shown to correlate well with under water weighing (191;192),
however, ADP has better precision (191;193;194). The equipment is large and
requires a stable temperature in the measuring room making it unsuitable for field
studies. The technique requires the subject to sit still inside the machine for several
periods of about a minute and is therefore not suitable for very young children
(<4yrs) or those who are claustrophobic. In the last few years new equipment has

63
allowed for the measurement of whole body density in infants (<8kg) which,
although similar in principle, is able to accommodate movement and crying (PEA
POD; Cosmed, Rome, Italy).
3.4.3 Dual-energy X-ray absorptiometry (DXA; Level V)
Figure 3.8.
Dual-energy X-ray absorptiometry (Lunar Prodigy, GE Medical Systems, USA)
DXA, first developed for assessment of bone mass has been shown to be both precise
and accurate when used for this purpose. Over the past decade, DXA has
increasingly been used to assess body composition in research and clinical practice
due to the additional information on total FM and FFM and their distribution in the
trunk and upper and lower limbs. Its rapid uptake may be attributed to its ease of
use, availability, and low radiation exposure (less than 2µSv per scan), which is
lower than background radiation. However, although precision and accuracy for
bone is good (<1%) and precision of soft tissue assessment is good (<2%) (195)
accuracy is variable (102;196;197). The principle on which DXA is based is that
different tissues attenuate the photons passing through the body differently. Bone
has high attenuation, lean tissue medium and fat low attenuation. Pixel-by-pixel
estimation of body composition using a series of assumptions is complicated by the
fact that wherever there is bone in the pixel the software is unable to determine the
nature of the soft tissue. More than 40% of a whole body scan contains bone (196)
and therefore in those pixels the machine cannot distinguish between FM and non-

64
bone FFM and an assumption is made that this tissue is in similar proportions to the
half of the body that does not contain bone in the pixels. This is one possible source
of error and studies find that assessment of soft tissue is subject to bias according to
sex, size, fatness, and disease state of those being measured, which indicates that
DXA is unreliable for patient case-control studies and longitudinal studies of persons
who undergo significant changes in nutritional status between measurements
(102;198). The large size and cost of DXA limit its use in non-hospital settings.
3.5 Multi-component models (Level II)
2CM techniques overcome the limitations of the predictive techniques by addressing
both components of body weight, FM and FFM. FM is homogenous but FFM,
composing of mainly protein mass (PM), MM and water varies in the relative
proportions of each depending on growth and maturation and is different in the sexes
and may be disrupted in disease. To improve accuracy of quantifying both
components it is possible to measure one or two of the components of FFM.
2-component 3-component 4-component
model model model
Figure 3.9. Multi-component models of body composition
Fat mass
mass
Fat-free
mass
Fat mass
mass
Fat mass
mass
Fat-free dry
mass
Water mass
Mineral mass
Water mass
Protein mass

65
The 3-component model (3CM) utilises the measurement of total body water and
thereby removes the assumption about constant values for the hydration of FFM
although assumes a constant ratio of PM to MM (199). The 4CM used in this study
additionally utilises the measurement of mineral by DXA and thereby overcomes the
assumptions of the 3CM, although there is still an assumption about the ratio of
osseous to non-osseous mineral (199). The measurement of water and mineral and
overall density quantify both FM and the components of FFM more accurately and
allow for calculation of the hydration of FFM and ratio of PM to MM ratio.
The 4CM is considered a ‘criterion’ method for in vivo techniques because it is the
most robust to detect inter-individual variability in FFM as well as accuracy over a
range of FM (200).
FM (kg) = 2.747 BV – 0.710 TBW + 460 BMC – 2.050 BW
Equation 3.9 (167;199)
BV = body volume (L) from ADP adjusted for surface area artefact and lung volume
TBW = total body water (L) from deuterium dilution
BMC = bone mineral content (Kg) from whole body DXA
BW = body weight (Kg)
3.5.1 Propagation of error for measurements of FM and FFM
One might presume that using measurements from several techniques would
introduce additional error. This was examined by Wells and Fuller (167;194) (see
Table 3.1) and it is clear that the sum of errors associated with multiple
measurements does not mean overall precision is poor. On the contrary, multi-
component models are more accurate because assumptions about the nature of the
FFM are minimal.
Error in measurement may be due to methodological variation, biological variation
and a combination of both. Propagated error is the total observed error as a function

66
of the independent and additive technical errors (methodological and biological) and
is represented by the formula;
Vt2 = Vm
2 + Vb
2 Equation 3.10
Where Vb is the biological variation, Vm is the methodological variation and Vt is the
total observed variation.
Table 3.1. Propagation of error on fat mass and fat-free mass values from different
models of body composition.
Error calculating
FM/FFM (Kg) % FM %FFM
4C model 0.22 3.1 0.50
3C model 0.20 2.8 0.50
2C models:
Deuterium 0.27 3.8 1.3
UWW 1.00 13.8 3.8
BOD POD 0.30 5.2 1.1
DXA 0.20-0.40 3.0 1.5
From Wells et al (167)and Wells and Fuller (194). “The error is calculated from 30
children aged 5-16 years; average weight assumed to be 48.7 kg (41.5 kg FM and
7.2 kg FFM). FM; fat mass; FFM; fat-free mass; UWW; under-water weighing;
DXA; dual-energy X-ray absorptiometry. 4CM uses deuterium, BOD POD and
DXA; 3CM use deuterium and BOD POD”.
(Permission to reproduce this has been granted by Professor JCK Wells).

67
3.6 Other techniques
3.6.1 Magnetic resonance imaging (Level V)
Image removed for copyright purposes
Figure 3.10. Magnetic resonance imaging equipment
Magnetic resonance imaging (MRI) is a technique which measures volume rather
than mass. Images are produced as a result of the alignment of hydrogen protons in
water or fat either with, or against a strong magnetic field around the body. The
absorption or emission of energy by the protons are then analysed to produce cross-
sectional images of the body which can be used to calculate tissue volumes.
Despite good quality imaging, comparison with other techniques is difficult because
MRI quantifies adipose tissue not FM. The proportion of fat in adipose tissue is
variable and it is therefore difficult to calculate FM. The advantage of MRI is that it
can identify regional body composition and is the only current viable technique for
identifying intra-abdominal adipose tissue. Although now widely available it is an
expensive technique and may be difficult for young children unless sedated.

68
3.6.2 X-ray computed tomography (CT; Level IV)
Image removed for copyright purposes
Figure 3.11. X-ray computed tomography.
X-ray computed tomography (CT) uses X-rays to differentiate between tissues and
image quality is superior to MRI although the high radiation doses make it unsuitable
in paediatric research.
3.6.3 Total body potassium (Level I)
Total body potassium scanning is based on measuring the emission of radioactive
40K by the BCM. Scanning takes place with the subject supine and takes about 15
minutes and is a simple procedure although some subjects may experience
claustrophobia. Information about BCM is helpful since it reflects better the
functional component of weight but calculation of FFM is hampered by the
uncertainty of the K component of FFM in children and a lack of reference data in
the UK.

69
3.7 Summary
Measurements of height and weight do not give any information about the
components of body composition.
The method of body composition analysis used will depend on availability,
cost, environment and ease of use for measuring children.
Accuracy and precision are important considerations for longitudinal analysis
if true significant changes are to be identified.
All techniques have limitations although the 4CM is considered a criterion
method because assumptions are minimal;
o Prediction techniques use regional or superficial proxies (sub-
cutaneous SFT or resistance to an electrical current) and assume a
relationship with body components (whole body FM and hydration of
FFM) to predict FM or FFM. The value of predicted techniques is
limited because; (i) they convert everyone to the average and (ii) are
population specific (predominantly healthy).
o 2CM utilise age and sex specific constant values for the nature of the
FFM and therefore convert everyone to the average. Since these
constants are derived from healthy populations the accuracy in
patients who may have altered hydration or mineralisation may be
reduced.
o 3CM have greater accuracy than 2CM because they address the
hydration of FFM, however, there is an assumption about the
relationship between PM and MM which may be disrupted in illness.

70
Chapter 4. Hypotheses, recruitment, methods, ethical
considerations and study plan
4.1 Hypotheses
Based on the issues highlighted in Chapter 2, I propose the following hypotheses to
be tested in this thesis:
Hypothesis 1: There is no significant difference in body composition between children
with CF and healthy children at baseline but differences will become apparent over
time, with reductions in FM and FFM in CF patients.
This hypothesis was tested by matching each 6-12 year old CF child with a healthy
child of the same sex and ethnic background and within 1 year of age and performing
4CM body composition measurements to establish baseline data. Group comparison
was also made between CF and healthy children at 2 years from baseline using all
available control children.
The research and analyses addressing this hypothesis can be found in Chapters 5, 6
and 7.
Hypothesis 2: Specific components of body composition at baseline and changes over
time are associated with spirometry in children with CF and predict clinical outcome.
Since FEV1 has been an outcome measure in many previous studies this was chosen as
the primary clinical outcome measure. Furthermore, studies have shown a relationship
between FEV1 and mortality in patients with CF (39;113). In addition, genotype and
pancreatic insufficiency was recorded. Physical activity was assessed by questionnaire
given at the time of body composition measurements. A second measurement after 2
years allowed for the relationship between changes in body composition and change in
spirometry to be investigated.
The research and analyses addressing this hypothesis can be found in Chapters 5, 6
and 7.

71
Hypothesis 3: The conclusions are the same regardless of whether matched- pairs,
group comparisons or comparison with reference data are used.
To test this hypothesis I analysed the data using; (i) matched-pair controls at baseline
and group comparisons at baseline and longitudinally and (ii) reference data derived
from a large cohort of contemporary children aged 4 to 22 years.
The research and analyses addressing this hypothesis can be found in Chapters 5, 6
and 7.
Hypothesis 4: The simple prediction techniques to assess body composition (BIA and
SFT) and 2CM techniques (hydrometry and DXA) will not be accurate enough to
identify depletion or change in body composition over time in this group of children
with CF due to systematic and/or random bias.
This hypothesis was tested by comparing SDS (derived from our previously measured
large contemporary reference population) for FM assessed by DXA and SFT and FFM
assessed by DXA, TBW and BIA with values from the 4CM.
The research and analyses addressing this hypothesis can be found in Chapter 8.
4.2 Aims This thesis had 3 aims;
1. To investigate the effect of CF on body composition in young children with
CF and whether this changes with growth and maturity. In addition, to
investigate whether the type of comparison (pair-, group-match or compared
to a reference population) affects the outcome of the analysis.
2. To investigate the relationship between body composition and clinical status
assessed by FEV1.
3. To investigate simple body composition techniques to define which would be
most appropriate in clinical practice where 4CM is not available.

72
4.3 Recruitment and exclusion criteria
Children with CF aged 6 to 12 years under the care of Great Ormond Street Hospital
NHS Trust, London were approached to take part in the study. The children with CF
were diagnosed on the basis of confirmatory genetics or a positive sweat test with
chloride values of > 60 mmol/L. Those recruited were clinically stable, that is to say
free from lower respiratory tract infections and not requiring a change in antibiotics,
steroids or bronchodilator treatment during the previous 14 days and emotionally able to
undergo the measurements. Children with other conditions affecting body composition
such as growth hormone therapy, diabetes and liver disease were excluded.
Healthy children for pair-matched, group-matched and cross-sectional reference
comparison were recruited for another study of body composition at University
College London, Institute of Child Health, London via schools and adverts in two
London newspapers. The study started in February 2002 and those recruited were
not premature (<36 weeks gestation), had a birth weight ≥ 2 kg and did not have any
medical conditions or medication affecting body composition. The measurements
were performed by myself using identical techniques and equipment. Measurements
in 533, 4-22 year healthy subjects were used to generate SDS for SFT, BIA, TBW,
4C FM, 4C FFM, 4C PM, 4CMM, DXA FM and DXA FFM and 100 (6 – 12 years)
of the original cohort were measured after 2 years for comparison with the children
with CF. Measuring age-matched control children longitudinally allows adjustment
for factors such as activity level and pubertal status and additionally has the benefit
of comparing both groups of children longitudinally at similar points in time and not
just as a cross-sectional comparison with a cohort who may or may not be
contemporary.

73
4.4 Methods
4.4.1 Anthropometry
Body weight was measured as an integral stage of the Bodpod procedure to within
0.01kg with the child dressed in a swimsuit. Accuracy was confirmed by use of two
solid weights of known mass. Standing height was measured to within 0.1cm with a
wall-mounted digital display stadiometer (Holtain, Dyfed, United Kingdom). BMI
was calculated as weight (kg) divided by the square of height (m). Waist, hip and
MUAC were measured to 1 mm using a fibreglass tape and bicep, tricep, subscapular
and supra-iliac SFT were taken in triplicate to nearest 2 mm and averaged. The waist
was measured at the ‘natural waist’, half way between the 10th
rib and iliac crest
Measurements were taken on the left side according to the method of Lohman et al
(1988) using a Holtain skinfold calliper. Intra-operator technical error of
measurement (TEM) was calculated on 50 children with CF and 50 control children
using measurements made at the beginning of the study. The TEM varied according
to the measurement type ranging from zero for weight, 0.2 mm (0.1%) for height and
0.8mm (10.6%) to 0.1mm (0.6%) for skinfold thickness depending on site.
4.4.2 Bio-electrical impedance
The Tanita Body Fat Analyzer (BC-418 MA), measures impedance using a constant
current source (50kHz, 90µA) and 8 electrodes (2 on each foot and hand) which allows
measurement of resistance in the whole body and segmentally (trunk, right and left arm
and leg. A print-out of impedance and %fat, FM, FFM and TBW for these segments is
obtained after the subject stands bare-foot on the foot plates and holds the hand grips for
about one minute. Only impedance is measured, the other outcomes being calculated
from equations in the machine’s software. Only raw impedance from the print-out was
used and converted to SDS (155) for the purposes of this thesis.

74
4.4.3 Dual-energy X-ray aborptiometry
Whole body bone mineral content (BMC), bone mineral density (BMD), FM and
lean mass (non-osseous fat-free mass) was determined using a Lunar Prodigy whole-
body fan beam scanner (GE Medical Systems, USA) in conjunction with software
v.8.2 or 12.1. The scan was performed with the subject lying supine and took 5 to 10
minutes depending on height. In addition a scan of the LS (L2-L4) was performed
with the subject supine and with the legs elevated on a soft padded block to derive
LS BMC, BMD and bone area. The position of the legs aids contact of the lower
spine with the scanner bed. All scans were performed with the subject wearing light
indoor clothing and with no removable metal objects present. The scans are analysed
automatically although manual changes by the operator may be made if the regions
are inaccurate. The radiation exposure per whole-body scan is estimated to be 2Sv,
lower than daily background level. All scans were performed by one operator.
Precision of bone density, established by repeat measurements of phantoms on 6
successive days, was <2%.
As mentioned previously, DXA has limitations when measuring soft tissue
(102;196;197). However, soft tissue analysis by DXA is a readily available, practical
alternative to more expensive methods such as CT and MRI. Regional soft tissue
analysis (trunk, arms and legs) as well as whole body was therefore compared to
4CM in this thesis. Data from DXA was used for modelling the 4CM and for
comparisons of simpler techniques compared to the 4CM in Chapter 8. In addition
DXA FM was used as a covariate instead of 4C FM when investigating change in
4C FFM and DXA FFM used instead of 4C FFM for change in 4C FM, thereby
using two independent outcomes in the analyses.
4.4.4 Deuterium oxide dilution
TBW was assessed by deuterium dilution, using a dose equivalent to 0.05 g
deuterium per kg body weight (99.9 atom percent excess, Sigma Chemical Co.
Chemicals, Poole, UK)). Doses were made up with water to approximately 100ml.
Saliva samples were taken pre-dose and 4-5 hours post dose using absorbent

75
salivettes (Sarstedt, Rommelsdorf, Germany) at least 30 minutes after the last
ingestion of food or drink. Samples were spun as soon as possible using a centrifuge
and stored at -200C until analysed by Iso-Analytical Ltd (Sandbach, UK) using the
equilibration method of Scrimgeour (1993). Briefly, 0.3 ml of liquid, along with a
vial of 5% platinum on alumina powder (Sigma-Aldrich, Poole, UK), was placed in a
septum sealed container (Labco, High Wycombe, UK) and flushed for 2 minutes
with hydrogen. Low enrichment and high enrichment standard waters were similarly
prepared, in order to normalise data against Vienna Standard Mean Ocean Water
standards. Samples equilibrated at room temperature for 3 days prior to analysis.
The head spaces in the containers were then analysed for deuterium enrichment on a
continuous flow isotope ratio mass spectrometer (Geo20-20, Europa Scientific,
Crewe, UK). The accuracy of analyses was checked by measuring an intermediate
water standard within each batch of samples. All samples were prepared and
analysed in duplicate. The mean standard deviation of deuterium analyses by the
equilibration technique in the laboratory is < 2.5 %.
Deuterium dilution space was assumed to overestimate TBW by a factor of 1.044
(180) and correction was made for fluid intake during the equilibrium period to
derive actual body water. Data was used in modelling the 4CM and also in the
comparison of 2CM techniques in Chapter 8. An example of the saliva collection
information sheet may be found in Appendix 6.
4.4.5 Air-displacement plethysmography
Body volume was measured using air displacement plethysmography (ADP;
Bodpod, Cosmed, Rome, Italy) whilst the subject wore a close fitting swimming
costume and hat. The procedure (193) involves warming up the equipment by
several ‘autoruns’ for 30 mins and then calibrating using a 50 litre metal cylinder.
The subject sits in the anterior chamber which is connected to a posterior
measurement chamber by oscillating diaphragms (which induce pressure change in
the anterior chamber) whilst breathing normally. The procedure for one complete
measurement is at least 2 measurements of body volume (taking 50 secs each) unless
they differed by more than 150 mls in which case a 3rd
volume measurement is

76
performed automatically by the machine. The raw volume values that appear
transiently on the screen were recorded and to improve precision the whole
procedure was repeated until two mean values for raw density of within 0.007kg/l
were obtained (194). Where it was not possible to achieve two such measurements
(possibly due to breathing irregularities in the CF children) the mean of all raw
volume values was used after values ±2SD were discarded (achieved over four
separate tests of a minimum of 8 and maximum of 12 volumes). An adjustment of
the mean raw volume was then made using predicted lung volume (189;201) and
surface area (190) using children’s equations to obtain the actual body volume. All
measurements were made by one of two operators (JEW, CMW) and the data was
used in the 4CM.
4.4.6 Spirometry
Laboratory spirometry, FEV1 was measured by technicians in the lung function
laboratory at Great Ormond Street Hospital NHS Trust according to protocols based
on American Thoracic Society and European Respiratory Society standards for
spirometry (202) adapted for children (203) using a Jaegar MasterScreen spirometer.
Values for analysis were calculated as FEV1 % and SDS compared to a large
reference population (204). Children with FEV1% <45% were classified as having
severe impairment, FEV1% ≥45 and <65% as moderate impairment, ≥65% and <85%
as mild impairment and ≥85% as normal lung function.
4.5 Outcome measures used for calculation of body
composition
Weight (kg)
Total body BMC (kg) from DXA
TBW (L) from isotope dilution
Body volume (L) from ADP
FM (kg) and FFM (kg) from DXA
Z (Ώ) from BIA
SFT (mm)

77
4.5.1 Simple body composition techniques
4.5.1.1 Anthropometry
SDS for bicep, tricep, subscapular and supra-iliac SFT were calculated compared to
our large contemporary population (4.6.2).
4.5.1.2 Bio-electrical impedance analysis
Whole body BIA was performed and height2/Z calculated and converted to SDS
compared to the reference population (4.6.2). Values of FM and FFM from the
printout were not used due to the assumptions used in generation of the data which
would be inappropriate for this population.
4.5.1.3 Dual-energy X-ray absorptiometry (DXA)
FM and lean mass values were obtained from a whole body DXA scan as described
above and FFM was calculated as:
FFM = lean mass + BMC Equation 4-1
Absolute values of FM and FFM and SDS (4.6.2) were used for whole body and
regional (trunk, legs and arms) body measurements.
4.5.1.4 Deuterium oxide dilution
TBW may be used to calculate FFM, assuming an age and sex specific hydration
factor of FFM, (Hffm) according to published values (183;184).
FFM = TBW/ Hffm Equation 4-2
FM was then calculated as;

78
FM = weight – FFM Equation 4-3
And
%fat = (FM/weight) x 100 Equation 4-4
Weight, FM and FFM in kg, TBW in L
However, as discussed previously this method requires an assumption that the child
has an average hydration. For the purposes of this thesis TBW SDS were also
calculated for comparison of techniques.
4.5.1.5 Air–displacement plethysmography
Whole body density was calculated from body volume (which has been adjusted for
residual lung volume and surface area artefact) and weight.
Body density = weight / volume Equation 4-5
% fat = (527/body density) – 485 (Wells 1999) Equation 4-6
And
FM = (%fat x weight) / 100 Equation 4-7

79
4.5.2 Four-component model
The 4CM uses values of BMC, weight, body volume and TBW to derive values for
MM, TBW mass, FM and PM as described previously (167;199). Assumed densities
of the four components were accounted for when calculating FM from the
measurements;
FM(kg) = [(2.747 x volume) – (0.710 x TBW)] + [(1.460 x BMC) – (2.050 x
weight)]
Equation 4-8
FFM was calculated as the difference between weight and FM:
FFM = weight – FM Equation 4-9
TBWmass = TBW volume x 0.99823 Equation 4-10
Hydration of the FFM (HFFM) can be calculated as the ratio of TBWmass to FFM;
HFFM = TBWmass/FFM Equation 4-11
Mineral mass (MM) can be calculated as:
MM = BMC x 1.2471,
this assumes a constant relationship between osseous to non-osseous mineral and is the
only assumption in the 4CM
PM can then be calculated as;
PM = Weight – FM – TBWmass – MM Equation 4-12

80
4.6 Assessment of confounding factors
Confounding factors were assessed by structured questionnaires.
4.6.1 Age
Age (years) was calculated as:
Date of measurement – date of birth/ 365.25 Equation 4-13
4.6.2 Medical data
A brief medical history (Appendix 5) was obtained from the parent or guardian and
included:
Serious childhood illness or surgery
Medication
Pancreatic status, genotype, presence of liver disease, diabetes, Pseudomonas
aeruginosa and Staphylococcus aureus infection (in children with CF and confirmed
with medical notes).
4.6.3 Physical activity
Physical activity level was assessed by asking the parent to give a rating of the
child’s activity as follows; 1) Much less than peers, 2) Less than peers, 3) Same as
peers, 4) More than peers and 5) Much more than peers. This simple method has
been shown to correlate well with physical fitness and BMI in children (205)
although in a large survey of 13-14 year old children (206) it was fat deposition in
girls and not BMI that was related to physical activity. Due to small numbers the
lower two and upper two categories were combined resulting in three groups; less
than, same as, and more than peers. In addition the number of hours spent in
vigorous physical activity was recorded.

81
Examples of questionnaires and data collection sheets may be found in Appendix 5
and saliva collection information in Appendix 6.
4.6.4 Pubertal status
Pubertal stage was self-assessed using line drawings showing the different Tanner
stages for breast or genital development (Appendix 8). This avoids undressing and
has been shown to be in good agreement with doctor assessment (207). For the
purposes of analysis pre-pubertal (stage1) subjects were considered distinct from
pubertal subjects (stages 2-5).
4.7 Statistical analyses
All analyses were performed using Statistical Package for Social Sciences 18.0
(SPSS Inc., Chicago) and p<0.05 was considered significant.
4.7.1 Sample size
When deciding on the sample size required to show a difference between groups,
type I and II error need to considered. Type I error is the probability of rejecting the
hypothesis when it is true and type II the probability of not rejecting the hypothesis
when it is false (208). Therefore it is important to have sufficient numbers to address
the research question confidently without subjecting more children than necessary to
the research process.
Studies of children with CF have shown a positive relationship between BMI SDS
and spirometry both cross-sectionally (52;72) and longitudinally (13;122) with
Kastner-Cole et al noting an extra 10% of predicted FEV1 for a 1 SDS higher BMI.
The sample size was therefore calculated on the basis that a 0.5 difference in BMI
SDS is likely to impact on clinical outcome and since BMI is a combination of FMI

82
and FFMI the calculated sample size should be sufficient to detect significant
differences in both these tissues.
4.7.1.1 Matched pairs and longitudinal analysis
The conventional formula used to determine the number of children required to detect a
difference between paired groups, and longitudinal comparisons where children are
compared to baseline measurements is:
n = 8(sd2/d
2) Equation 4-14
where; n is the number per group, sd is the standard deviation, d is the difference
between groups. This provides 80% power and a significance cut-off of 0.05 (p < 0.05).
Using this formula the number of subjects needed to detect a given difference can be
calculated or for a given SD of a trait, the magnitude and difference detectable for a
given sample size. Therefore few subjects are needed to detect a large difference and
more subjects are needed to detect a small difference. It would be useful to detect a
small effect since; a) most biological factors create relatively small effects and b)
previous research has not achieved a consensus on the critical values for healthy body
composition in CF children. The difference (d) is expressed as SDS format which
simplifies the formula to n = 8/d². Based on the above power calculations 8 subjects per
group are sufficient to detect a difference of 1 SDS and 32 subjects per group to detect a
difference of 0.5 SDS.
4.7.1.2 Cross-sectional group comparison
Although the intention was to continue with a matched-pair analysis at the 2 year
measurement this was not possible due to either, not all the pairs being measured or
having successful 4CM. Therefore, all available controls of the same age range as the
children with CF were used. The formula to determine the number of children required
to detect a difference with 80% power at 5% significance when using an independent t-
test is:

83
n = 16(sd2/d
2) Equation 4-15
Based on the power calculation above, 16 subjects per group are sufficient to detect a
difference of 1 SDS and 64 per group to detect a difference of 0.5 SDS.
This study aimed to recruit more than 64 (to maintain 64 throughout the study) in order
to fulfill the sample size needed for between-group comparisons. Buntain et al. (36)
quotes 23.5% of CF and 17% of controls dropping out over a 2 year study and Stettler et
al. (96) reported a drop-out rate of 16% in CF children over 3 years. Since this study
was constrained by time and available population (n = 116) all eligible children were
approached for recruitment.
4.7.2 Size adjustment and calculation of standard deviation scores
Characteristics of all the children were compared to 1990 UK reference data (54;209)
to generate SDS for weight, height, BMI and waist circumference using the
lmsGrowth program© (210). A method analogous to that of BMI (weight/height2)
was applied to absolute values of FM, FFM, PM and MM to remove the effect of
height; FM index (FMI; FM/height2), FFM index (FFMI; FM/height
2), PM index
(PMI; PM/height2) and MM index (MMI; MM/height
2) (211;212). The index 2,
although appropriate to remove the relationship of height with FFM (including PM
and MM) may not be the most appropriate for FM because FM is more variable and
the index depends on age, sex and pubertal development. In patients, the appropriate
index may be different from healthy people, for example, for this study at 6-12 years
the index was, boys; CF 2.5, control 3.4 and girls; CF 2.9, control 2.4. At 8-14 years
the index was all boys; 3.9 and girls; CF 4.6 and control girls 3. However, with our
large reference population of 533 aged 4 to 22 years the index was 2.8. The problem
of the appropriate index to use to adjust FM was addressed in a paper by Wells and
Cole (211). They suggest 3 possible approaches; (1) where each group is of similar
height the use of height2 is appropriate, (2) where the groups are slightly different in
height, check for real differences by regressing logn height on logn FM with group
(patient v control) and height as independent variables and (3) where the height
difference is great a log-log regression will give the power by which to raise height

84
in order to remove any effect of height on FMI. Wells and Cole suggest that
approach 1 is valid because both groups are being compared with equal adjustment
and in addition the error in FMI is considered trivial. They calculated that in the
group of 8 year children studied, the variability in FMI due to height was 7.5%,
much less than the variation due to fatness. I used approach (2) to investigate
whether there were any differences in the slopes of data from CF children compared
to controls in my cohort, and when log height was regressed on log FM I found that
only log height was highly significant; group and group x log height interaction term
were not significant. This suggests that the slope of each group does not differ
significantly and approach 1 is valid. I have therefore used height2 to adjust FM in
this thesis, an index which is most likely to be used clinically given the difficulties of
calculation and the variability of the appropriate index. The indices mentioned above
were calculated using approach 3.
Using the lmsGrowth program© (210) the indexed variables were compared to
measurements performed in a contemporary reference population of 533 healthy
children aged 4 to 22 years (155) to produce SDS.
Total LS BMD SDS were generated from the Lunar Prodigy software using machine
reference data matched for age, sex and ethnic group. BMD is a 2-dimensional
measurement, which does not take into account bone size. Small children may have
low BMC or BMD either because they have small bones and/or because they have
less mineral than expected for the size of bone (213). To adjust for size the bone
mineral apparent density (BMAD) a 3-dimensional ‘volumetric’ measurement was
calculated for the LS as follows, from BMC and bone area (214).
BMAD = BMC/ bone area^1.5
Equation 4-16
and then size adjusted SDS were calculated using UK reference data collected for the
GE Lunar Prodigy (215).

85
4.7.3 Cross-sectional comparison of body composition variables
Using one-sided, independent and paired-sample t-tests comparison was made
between; (i) both CF and control children and the 1990 UK reference population for
anthropometric SDS, (ii) both CF and control children and the contemporary
reference population for body composition variables SDS, (iii) between pair-matched
(baseline) and group-matched (baseline and year 2) children with CF and healthy
children for all anthropometry and body composition variables using absolute values
and SDS. Initial analysis indicated a strong significant difference between the sexes
and therefore they were analysed separately.
General linear models were used to examine the difference between children with CF
and healthy controls taking into account factors predicting body composition
variables, with matched-pair or group and puberty as fixed factors and age and height
(for non-indexed variables) as continuous variables. Since total MM is
predominantly bone mineral, MM was also adjusted for bone area to account for the
effect of bone size as well as length (height). The same analysis was performed for
baseline and 2 year measurements and may be found in Chapters5 and 6.
4.7.4 Cross-sectional comparison of body composition and
spirometry
Regression analysis was used to investigate the relationship between body
composition variables and spirometry (FEV1 % or FEV1 SDS) in the children with
CF. Height was included in the model rather than indexed body composition
variables. The same analysis was performed for baseline and 2 year measurements
and may be found in Chapters 5 and 6.

86
4.7.5 Longitudinal body composition and spirometry data analysis
To investigate the predictors of change in body composition variables over a 2 year
period between measurements, it is necessary not only to consider the change but
also the baseline value since the same absolute value of change will be very different
for a child with optimum body composition compared to a child with suboptimal
body composition. One possible way to account for this is to include both the
baseline measurement and the change in the model. An alternative method uses the
conditional change, that is, the amount of change once the effect of the baseline
measurement has been removed. In this method the regression residuals (the values
of the difference between the expected change and the actual change) are calculated
for each child and these are the conditional change (216). The residuals have no
relationship with the baseline measurement and therefore avoid auto-correlations.
The expected change is calculated in the control boys and girls separately by
regressing the baseline value on the 2 year value for each of the body composition
variables. The regression equation is then used in the CF group to calculate the
difference between actual change and the change expected if the child is growing the
same as the healthy group (residual or conditional change). Where there is very little
change from that which is expected, that is, when an individual is tracking the
control group, absolute change and conditional change will be similar, as can be seen
in the girls’ graph (Fig 4.1) of absolute change compared to conditional change in
FMI SDS. However, in the boys the differences are greater (Fig 4.2). Conditional
values were therefore calculated for all the scale dependent variables and
independent variables included in the regression.

87
Figure 4.1. Correlation between absolute and conditional change in fat mass index
(FM/height2;FMI SDS)in girls with cystic fibrosis
Figure 4.2. Correlation between absolute and conditional change in fat mass index
(FM/height2;FMI SDS)in boys with cystic fibrosis
Conditional change in SDS in those who had longitudinal measurements was
calculated as change compared to the control boys or girls in this study (n = 95).
SDS were calculated from a large reference population (n= 533) with only a single

88
measurement, therefore, conditional scores are a comparison within a smaller
population.
Multiple regression analysis was used to investigate predictors of conditional change
in either FMI SDS, FFMI SDS or MMI SDS in CF and control children separately
and also between body composition variables and conditional change in FEV1 SDS
for children with CF. Choice of variables included in the models is discussed in
Chapter 7.
Multiple regression analyses with the 2 year measurement as the dependent variable,
the baseline as the covariate and condition (CF or control) as fixed factor were
performed to discover any significant effects of having CF over the change in body
composition variables. The analyses can be found in Chapters 7.
4.7.6 Cross-sectional comparison of simple techniques and the 4-
component model
Data for males and females and for every available time-point (2001-2011) were pooled
for purposes of the analyses. The accuracy of the simpler methods was assessed using
the criterion 4CM as the reference method for adiposity (4C FM SDS) and leanness (4C
FFM SDS). DXA FM, SFT and BMI SDS were used as simple measures of adiposity
and DXA FFM, TBW and BIA (height2/Z) SDS were used as simple measures of
leanness.
SDS compared to our contemporary reference population (see 4.6.2) for body
composition variables were calculated for absolute values of 4C FM and FFM, DXA
FM and FFM (whole body and regional) TBW, BIA and SFT and BMI compared to
the UK 1990 reference data (54;209). In addition DXA height adjusted values for
FM and FFM (whole body and regional) were calculated as described in 4.6.2.

89
Significance of the mean value for all SDS from zero was tested using independent t-
tests, and paired t- tests were used to compare the mean difference of the simpler
methods with that of the 4CM.
The method of Bland and Altman (217) was used to assess agreement between the
SDS for FM and FFM by the simpler techniques and the criterion 4CM. The mean
difference between techniques (bias; simple technique-4CM) and the ± 2 SD of the
difference between techniques (limits of agreement) were calculated. The bias was
then tested for significance from zero by using a paired t- test. The extent to which
the magnitude of the bias was related to the magnitude of the variable was calculated
as the correlation between the difference and the mean of the measured values.
Correlations were performed unadjusted, adjusted for age and adjusted for age and
sex. This comparison is presented in Chapter 8.
Backward regression analyses were used to identify significant predictors of the bias
in FM(I) and FFM(I) SDS. Analyses were performed with age, sex and BMI SDS as
explanatory variables with sex coded as male = 1 and female = 2.
4.7.6.1 Categorisation of ‘abnormal’ standard deviation scores
A ‘normal’ body composition SDS was classed as an SDS between -2 and +2, the
values typically used in clinical practice. The ability of each technique to categorise
‘normal’ and ‘abnormal’ body composition was assessed by cross-tabulation of the
simple technique with the 4CM and calculation of Cohen’s kappa coefficient (κ) and
% agreement. Whilst % agreement is a measure in absolute terms, Cohen’s kappa
also takes into account the probability of agreement occurring by chance, a value of 1
indicating perfect agreement. This analysis is presented in Chapter 8.
4.7.7 Longitudinal comparison of simple techniques and the 4-
component model
The ability of the simpler techniques to assess longitudinal change in non-indexed
SDS was compared to change assessed by the 4CM. Two-year change in
anthropometric and body composition SDS were compared to no change using

90
independent t- tests. Bland-Altman analyses were used to compare the bias in
change (change by simple technique – change by 4CM) of body composition
variables with limits of agreement of ±2SD. The degree to which the magnitude of
the bias was related to the magnitude of the variable was assessed with correlation
analyses (Chapter 8).
4.7.8 ‘Wisdom of crowds’ approach to determine whether aggregate
predictions improve accuracy.
In a situation where the more sophisticated body composition techniques are not
available it would be helpful to be able to use the simplest, readily available
prediction techniques. Although the underlying assumptions may be flawed and the
equations used to predict body composition may not be derived in the appropriate
population, there is an approach which may allow such prediction techniques to be
used. The ‘wisdom of crowds’ approach (218) is based on the theory that using
many predictions will give an answer closer to the truth than using one or two
predictions. In order to achieve improved accuracy four conditions must be satisfied:
first, many predictions based on diverse criteria must be used; second, the predictions
must be independent of each other; third, they must be based on different underlying
assumptions; and fourth, the independent predictions must then be aggregated. The
theory suggests that error will be randomly spread across the predictions and tend to
cancel out, thereby improving the accuracy of the overall prediction. To test this
hypothesis in this particular population I used 12 different prediction equations based
on height, weight, SFT and BIA to calculate FM for each child and then aggregated
them to compare with the 4CM (Chapter 8).

91
4.8 Study outline
Recruited
Successful
4CM at baseline
Chapter 5
Cross-sectional
at baseline
Cystic
fibrosis
100
Healthy controls
for SDS
572 (4-22 y)
Healthy controls for pair-
and group-match analyses
133
Age 6-12 y at baseline
of whom
Cystic
fibrosis
85
Healthy controls for pair-
and group-match analyses
125
Age 6-12 y at baseline
Cystic
fibrosis
85
Controls
85
Healthy controls
for SDS
533 (4-22y)
140 (6-12y)
1) Pair-match comparison of absolute values and SDS
2) Compared to reference population (SDS)
CF 85, Controls 85

92
Study outline continued
Successful
4CM at baseline
Cystic fibrosis
85
Age 6-12 y at
baseline
Healthy controls for pair-
and group-match analyses
125
Age 6-12 y at baseline
Cystic
fibrosis
69
Controls
93
Healthy controls
for SDS generation
533 (4-22 y)
140 (6-12 y)
Chapter 6, cross-sectional
group-match and compared to
reference population, baseline
and 2 years
Chapter 7, longitudinal change
group-matched and reference
population
Successful 4CM
at baseline and
2 years
1. Group-match comparison of absolute values and SDS
2. Compared to reference population (SDS)
CF 69, Controls 93

93
4.9 Ethical considerations and study plan
Ethical permission was obtained from the ethical committee of the Institute of Child
Health/ Great Ormond Street Hospital for Children NHS Trust. The project
complied to the Data Protection Act 1998 and as such all measurement data was
anonymised and hard copies of names and addresses were kept locked in a separate
drawer from the measurement data sheets which were also kept locked. All
electronic versions were password protected and saliva samples carried the same
anonymised IDs.
Children with CF and their parent(s) were initially asked if they were interested in
taking part by one of the doctors in the Respiratory Medicine department. If they
agreed their contact details were given to me and I telephoned to give information
and answer any questions. The appropriate information sheets were then sent by post
or email and a follow-up call was made after at least 2 weeks to organise an
appointment if they agreed and to answer any questions. Samples of information
sheets and appointment letters can be found in Appendices 2 & 3.
Control children were recruited for an on-going study of the body composition of
healthy children. Originally, ethical approval (Appendix 1) was for 1 measurement
and subsequently those of the appropriate age range (6-12years) were approached for
two yearly measurements under the ethics approval for the CF study. After a
telephone call to ascertain acceptance, the appropriate information sheets were sent
by post or email and 2 weeks later a telephone call was made to answer questions
and arrange an appointment.
Measurements took place in the body composition suite sited in the radiology
department of Great Ormond Street Hospital for Sick Children, taking on average 1hr
45mins. At the appointment, after explanation of the procedures, written consent was
obtained from parents or young people over 16years, written assent was obtained
from children aged 11-15 years and verbal assent was obtained from all the younger
children. See Appendix 4 for copies of parent, participant consent forms and child

94
assent forms. Travel expenses were reimbursed, and all participants received a print-
out of their whole-body DXA scan, a certificate (Appendix 7) and £10 WH Smith
voucher as a token of appreciation.

95
Chapter 5. Baseline body composition of 6-12 year old
children with cystic fibrosis compared to healthy children
and the relationship with lung function.
5.1 Introduction
Previous studies of growth and body composition have found that children with CF
are often shorter and that there may be deficits of FM and FFM although some
studies found the CF children had healthy body composition when young (see
Chapter 2). In addition, the literature notes that FFM is positively related to lung
function. However, there are many inconsistencies in the literature which may be
partly due to the methodologies used. This study uses the more accurate ‘criterion’
4CM in order to avoid some of the problems of the simpler methods. Data from
simpler techniques is discussed in Chapter 8.
In this chapter I present a comparison of body composition between CF and healthy
children using both pair-match and comparison with a reference population with the
aim of testing hypothesis 1, that there will be no significant differences at baseline.
In addition, examining associations between spirometry and body composition in
children with CF to test hypothesis 2, (that specific components of body composition
are associated with lung function).
5.2 Study design
This is a cross-sectional study comparing the body composition of 6-12 year children
with CF to that of healthy children of the same age and sex and will form the
baseline measurements for a subsequent measurement at 2 years. Comparisons were
made firstly, with age (to within 1 year), sex and ethnicity matched healthy controls

96
and secondly, using SDS calculated from a larger contemporary population (see
4.6.2). In addition, the lung function, measured on the same day (or within 4 weeks
if not possible) was related to components of body composition in the children with
CF.
5.3 Recruitment and exclusion criteria
Children with CF were recruited from the patients at Great Ormond Street Hospital
NHS Trust and the control children from an on-going study of healthy children at
University College London, Institute of Child Health. Details can be found in
Chapter 4.
5.4 Methods
Height, weight, waist, hip and MUAC and SFT were measured as described in Chapter
4. Body composition was assessed using the 4CM which uses whole body BMC from
DXA, TBW from isotope dilution and density from ADP. LS and whole body BMC
and BMD were measured by DXA to assess bone status. Confounding factors such as
pubertal status and activity were assessed with questionnaires, the details of all these
can be found in Chapter 4 and Appendices 5 and 6. Due to low numbers in some
groups the classification of physical activity was recategorised in 3 groups; more than,
same as and less than peers. Tanner staging was classified as pre-pubertal (stage 1) or
pubertal (stages 2-5).
The children with CF also had lung function assessed; details can be found in Chapter 4.

97
5.5 Statistical analyses
5.5.1 Size adjustment and SDS calculation
Characteristics of all the children were compared to 1990 UK reference data to
generate SDS for weight, height, BMI and waist circumference using the lmsGrowth
program© (210). Size adjustment of body composition variables was made as
described in Chapter 4. SDS were calculated compared to the contemporary
reference population (see Chapter 4) for FM, FFM, PM, MM, and SFT. Total and LS
BMD SDS were generated from the Lunar Prodigy software using machine reference
data matched for age, sex and ethnic group and a size adjusted BMAD SDS was
calculated as described in Chapter 4.
5.5.2 Comparison of body composition variables
Initial analysis indicated a strongly significant difference between the sexes and
therefore they were analysed separately.
5.5.2.1 Compared to reference data
Using a one-sample t-test comparison was made between; (i) both CF and control
children and the 1990 UK reference population for anthropometric SDS and (ii) both
CF and control children and the contemporary reference population for body
composition variables SDS.
5.5.2.2 Compared to pair-match
Paired sample t- tests were used to compare CF and healthy children for all
anthropometry and body composition variables. General linear models were used
to examine the difference between children with CF and healthy controls taking into
account factors predicting body composition variables, with matched-pair, group and
puberty as fixed factors and age and height (for non-indexed variables) as continuous

98
variables. Since total MM is predominantly bone mineral, MM was also adjusted for
bone area to account for the effect of bone size as well as length (height).
5.5.3 Lung function
Simple regression analysis was used to investigate the relationship between body
composition variables and spirometry (FEV1 % and SDS) in the children with CF.
Height was included in the model rather than using indexed body composition
variables. MM was adjusted for LS bone area to account for the size of the bones.
5.6 Results
5.6.1 Subjects
100 of 116 eligible children with CF were recruited and complete 4CM
measurements were obtained in 90 (4 children (3 girls) refused to enter the Bodpod,
6 post dose isotope dilution samples were inadequate volume for analysis (4 girls)).
However, body water calculation was implausible for 5 children (3 girls), therefore
pair-matching with healthy age, sex and ethnicity matched control children was made
for 85 CF children ((boys; 37 (44%) and girls; 48 (56%)). 85 paired measurements
should be sufficient to detect a 0.31 SDS difference in BMI and body composition
variables between the groups with 80% power at 5% significance. Characteristics of
the children are shown in Table 5.1. Self-assessed pubertal status for the 170
children was pre-pubertal for; boys (CF; 34 (92%), controls; 31 (71%) and girls (CF;
34 (71%), controls; 29 (60%). All subjects with CF except for 1 girl were pancreatic
insufficient; had a wide range of pulmonary disease with a median FEV1% 85.1%,
with values between 32% and 131%; 8 (7 girls) had a gastrostomy in situ; 4 (3 girls)
had liver disease and 1 girl was diabetic. Genotype was homozygous ∆F508 for 59
children, heterozygous ∆F508 for 19 children, 5 children had non ∆F508 genotype
and 2 children were of unknown genotype. There were 21 cases (10 boys) of chronic
pseudomonas aeruginosa of the lungs and 15 cases (7 boys) with chronic

99
staphylococcus aureus infection. Sixteen eligible children with CF (9 girls) who were
not recruited and 15 children (10 girls) who were measured and not included in the
analysis were not significantly different with respect to height SDS, weight SDS and
BMI SDS.
5.6.2 Anthropometry
5.6.2.1 Compared to UK reference data
Characteristics of the children are shown in Table 5.1. The healthy children were
representative of the 1990 UK reference data apart from the girls being significantly
heavier (p<0.01) and both boys and girls having greater waist circumference
(p<0.01). Boys with CF were significantly shorter (p<0.05) but had a higher BMI
SDS (p<0.01) and waist circumference (p<0.01) and girls with CF were lighter
(p<0.001), shorter (p<0.001), had lower BMI SDS (p<0.05) but also had greater
waist circumference (p<0.01) than the 1990 UK reference data.
5.6.2.2 Compared to pair match
Comparison between children with CF and healthy pair-matched controls indicated
that the boys with CF were not significantly different apart from higher BMI SDS
(p<0.01) and waist circumference SDS (p<0.05). The range of BMI SDS was; boys
with CF; -1.5 to 2.4 and control boys; -1.9 to 2.0. The girls with CF were
significantly shorter (p<0.01) and lighter (p<0.01) with lower anthropometric values
for all measures apart from waist circumference (non-significant).
5.6.3 Body composition
Comparison by reference populations and case-control can be found in Table 5.2
with a summary in Table 5.3.

100
5.6.3.1 Compared to reference data
Comparison of CF children with a reference population (Lunar Prodigy reference
data for bone and reference data for body composition (155) indicated a higher total
BMD SDS (p<0.001) and FFMI SDS (p<0.01) in boys with CF and lower LS BMD
SDS (p<0.001), BMAD SDS (size adjusted; p<0.01), FMI SDS (p<0.001), FFMI
SDS (p<0.05) and MMI SDS (p<0.001) in girls.
5.6.3.2 Compared to pair-match
Boys with CF had significantly higher total BMD SDS (p<0.05) and FFMI SDS
(p<0.01) compared to case control boys. Girls with CF had less total BMD SDS
(p<0.05) and LS BMD SDS (p<0.001) and significantly lower FMI SDS (p<0.001)
and MMI SDS (p<0.001).

101
Table 5.1. Characteristics of cystic fibrosis (CF) and control children in pair-match analyses (Pgroup) and compared to reference data (Pref).
CF boys (n=37) CF girls (n=48) Control boys (n=37) Control girls (n=48)
Mean SD Pref Pgroup Mean SD Pref Pgroup Mean SD Pref Mean SD Pref
Age (y) 8.9 1.17 NA 0.336 9.6 1.62 NA 0.570 9.0 1.21 NA 9.6 1.78 NA
Weight (kg) 29.5 6.35 NA 0.518 30.0 7.19 NA <0.001 28.8 6.68 NA 34.6 9.36 NA
Height (m) 1.30 0.08 NA 0.068 1.32 0.11 NA <0.001 1.33 0.10 NA 1.37 0.11 NA
BMI (kg/m2) 17.3 2.10 NA 0.009 16.4 1.99 NA 0.001 16.1 1.76 NA 18.1 2.84 NA
Weight SDS 0.11 1.04 0.505 0.338 -0.56 1.04 0.001 <0.001 -0.11 0.91 0.456 0.42 0.98 0.005
Height SDS -0.41 1.01 0.017 0.118 -0.59 1.12 0.001 0.001 -0.05 0.95 0.740 0.22 0.87 0.084
BMI SDS 0.50 0.95 0.003 0.005 -0.33 0.95 0.020 0.001 -0.11 0.87 0.454 0.39 1.10 0.019
Waist (cm) 63.1 5.92 NA 0.001 60.2 5.5 NA 0.071 58.1 4.41 NA 62.2 7.67 NA
Waist SDS 1.24 0.79 <0.001 0.001 0.69 0.77 <0.001 0.161 0.34 0.70 0.005 0.94 1.05 <0.001
Hip (cm) 67.7 6.17 NA 0.876 68.2 7.06 NA <0.001 67.9 6.70 NA 74.6 8.63 NA
MUAC (cm) 19.8 2.39 NA 0.996 19.7 2.60 NA <0.001 19.8 2.74 NA 22.2 3.31 NA
Sum 4 skinfold thickness (mm) 34.7 19.8 NA 0.236 37.1 14.6 NA 0.007 29.08 11.7 NA 48.4 21.1 NA
4 skinfold thickness SDS 0.14 0.95 0.379 0.185 -0.41 0.83 0.001 0.005 -0.14 0.76 0.270 0.14 0.96 0.326
Pre-pubertal (n,%) 34 92 NA NA 34 71 NA NA 31 84 NA 29 60 NA
FEV1 % 91.3 20.9
NA
NA
NA
NA 77.6 18.4 NA NA NA NA
FEV1 SDS -0.70 1.66 0.017 NA -1.89 1.56 <0.001 NA NA NA
Pancreatic insufficient (n) 37 NA NA 47 NA NA NA NA
Liver disease (cases) 1 NA NA 1 NA NA NA NA
Diabetes (cases) 0 NA NA 1 NA NA NA NA
Ps aeurug (cases) 10 NA NA 11 NA NA NA NA
Staph aureus (cases) 7 NA NA 8 NA NA NA NA
BMI; body mass index (weight/height2), SDS; standard deviation score compared to UK 1990 reference data (54;209), MUAC; mid-upper arm circumference, Sum 4 skinfold thickness;
bicep+tricep+subscapular+ suprailiac, n=79, Pgroup paired t-test, CF boys and Control boys or CF girls and Control girls; Pref; one sample t-test CF and Controls compared to UK 1990 reference
data. FEV1%; forced expired volume in 1s percentage of the expected, FEV1 SDS; compared to reference data (204)). Pre- puberty is based on Tanner staging 1 (pre) to stages 2 – 5 (pubertal),
Pancreatic insufficient; reduced pancreatic function requiring the oral addition of pancreatic enzymes, Ps aerug; chronic pseudomonas aeruginosa infection of the lungs, Staph aureus; chronic
staphylococcus aureus infection of the lungs.

102
Table 5.2. Body composition of cystic fibrosis (CF) and control children used in pair-matched analyses (Pgroup) and compared to reference data
(Pref).
CF boys (n=37) CF girls (n=48) Control boys (n=37) Control girls (n=48)
Mean SD Pref Pgroup Mean SD Pref Pgroup Mean SD Pref Mean SD Pref
Body volume (L) 28.3 6.4
9
NA 0.500 27.8 7.09 NA <0.001 27.5 6.51 NA 33.6 9.41 NA
Total body water (L) 18.0 3.1
2
NA 0.872 17.1 3.72 NA 0.001 17.9 3.71 NA 18.9 4.31 NA
Total bone mineral content (kg) 1.05 0.2
1
NA 0.606 1.01 0.24 NA <0.001 1.07 0.24 NA 1.20 0.33 NA
Total bone mineral density (g/cm2) 0.90 0.0
6
NA 0.020 0.87 0.05 NA 0.009 0.88 0.05 NA 0.90 0.07 NA
Total bone mineral density SDS 0.58 0.6
6
<0.001 0.011 -0.11 0.74 0.329 0.028 0.23 0.50 0.007 0.23 0.62 0.012
LS bone mineral density (g/cm2) 0.73 0.0
8
NA 0.358 0.73 0.10 NA 0.026 0.71 0.08 NA 0.78 0.11 NA
LS bone mineral density SDS -0.03 0.7
4
0.795 0.340 -0.49 1.12 0.004 0.055 -0.19 0.75 0.129 -0.05 0.93 0.688
LS bone mineral apparent density SDS 0.18 0.9
6
0.267 0.149 -0.40 1.19 0.024 0.424 -0.12 0.85 0.413 -0.20 1.06 0.203
4-Component model
Fat mass (kg) 5.95 3.66 NA 0.413 6.13 2.93 NA <0.001 5.31 2.80 NA 9.46 4.71 NA
Fat mass index SDS 0.02 1.01 0.907 0.325 -0.76 0.89 <0.001 0.157 -0.22 0.97 0.166 0.02 0.95 0.861
Fat (%) 19.0 7.84 NA 0.501 20.4 5.47 NA <0.001 17.8 6.14 NA 26.1 7.46 NA
Fat-free mass (kg) 23.5 3.60 NA 0.976 22.7 4.98 NA 0.001 23.5 5.09 NA 25.1 5.60 NA
Fat-free mass index SDS 0.56 1.01 0.002 0.003 -0.39 1.07 0.016 0.157 -0.14 1.04 0.414 -0.08 0.94 0.557
Fat-free mass hydration (%) 75.9 2.07 NA 0.740 74.9 1.97 NA 0.427 76.0 1.49 NA 75.1 1.54 NA
Fat-free mass density (kg/L) 1.087 0.007 NA 1.000 1.090 0.007 NA 0.317 1.087 0.005 NA 1.091 0.005 NA
Protein (kg) 4.31 0.65 NA 0.955 4.46 1.06 NA 0.112 4.30 1.18 NA 4.72 0.99 NA
Protein mass index SDS 0.36 1.36 0.113 0.103 0.08 1.03 0.585 0.528 -0.16 1.11 0.376 -0.05 0.97 0.731
Mineral mass (kg) 1.34 0.28 NA 0.637 1.28 0.28 NA <0.001 1.36 0.30 NA 1.52 0.41 NA
Mineral mas index SDS 0.07 0.84 0.601 0.095 -0.84 1.10 <0.001 0.001 -0.23 0.87 0.11 -0.04 0.92 0.792
SDS; standard deviation score, LS ; Lumbar spine (L2-L4) bone mineral apparent density which is a 3-D ‘volumetric’ measurement that is calculated from the 2-D Bone
Mineral Density (BMD) actually measured by the DXA machine, SDS are calculated from reference data (215). Fat mass index (fat mass/height2), Fat-free mass index (fat-
free mass/height2), Protein mass index (protein mass/height
2), Mineral mass index (fat mass/height
2). SDS are calculated from reference data collected in 533 contemporary
healthy children (155). Pgroup paired t-test, CF boys and Control boys or CF girls and Control girls; Pref one sample t- test CF and Controls compared to reference data

103
Table 5.3. Summary of comparisons (before adjustment for age, height and puberty)
Boys with CF compared to; Girls with CF compared to;
Pair-match Reference Pair-match Reference
Weight SDS NS NS
Height SDS NS
BMI SDS
WAIST SDS NS
FMI SDS NS NS
FFMI SDS NS
PMI SDS NS NS NS NS
MMI SDS NS NS
Paired t-test with pair-match and one sample t-test compared to zero for reference data. Reference data is UK 1990 (54;209) for weight, height,
BMI and waist and reference data from 533 children measured by the 4-component model (155). FMI; fat mass index (FM/height2), FFMI; fat-
free mass index (FFM/height2), PMI; protein mass index (PM/height2), MMI; mineral mass index (MM/height
2).

104
5.6.3.3 Potential confounders affecting body composition outcomes
Table 5.4 (boys) and Table 5.5 (girls) show adjusted mean differences in body
composition (CF - control) before and after adjustment for height and puberty. Boys
with CF had a greater weight (p<0.001) and waist circumference (p<0.001) SDS than
controls. In addition, FFMI SDS was significantly higher (p<0.01) in boys with CF
although the absolute FFM adjusted for actual height was not significantly different.
Girls with CF had lower weight (p<0.05), height (p<0.001), FM (p<0.01), hip and
MUAC (p<0.01) than control girls. In addition, MMI SDS (p<0.01) but not absolute
MM, was significantly less in CF girls. An analysis of only pre-pubertal girls (n= 24
pairs) confirmed the deficit in FM. Additional adjustment of MM for bone area (to
adjust for bone size as well as length) did not affect the outcome in either sex. To
determine whether differences in body composition were due to different levels of
activity the parent’s rating of the child’s activity level was added to the model with
no effect on the outcome (data not shown).
5.6.3.4 Hidden depletion of fat-free mass
Two girls in this study had BMI SDS in the normal range (> -1.64SDS (5th
centile)
and <1.64) with FFMI SDS below -1.64 (5th
centile). Girl A, aged 8 had a BMI SDS
of -0.82 and FFMI SDS -4.60 and girl B, aged 7 had a BMI SDS of -1.37 and FFMI
SDS of -2.53.
5.6.3.5 High BMI
Four boys with CF had a BMI SDS >1.64 (95th
centile). BMI/FMI SDS for these
boys were: (a)1.71/1.49, (b) 1.83/1.49, (c) 1.96/0.32 and (d) 2.42/1.99.
5.6.4 Relationship between body composition and spirometry
The mean (SD) FEV1 SDS for 83 patients (1 boy and 1 girl did not perform
spirometry) was; boys -0.70 (1.66) p<0.05 and girls -1.89 (1.56) p<0.001. A
regression analysis of factors associated with FEV1 SDS is presented in Table 5.6.
FM SDS (p<0.01) and BMI SDS (p<0.05) were significantly positively associated
with FEV1 SDS in girls only. A similar model with either FEV1 or FEV1 % indicated
a similar pattern. A plot of FEV1% and FMI SDS for girls is shown in Figure 5.1

105
indicating a positive relationship (r=0.40, p=0.005) however, four girls had a high
FEV1% with a low FMI SDS.
210-1-2-3-430
50
70
90
110
Fat mass index SDS
FEV1 (% predicted)
Figure 5.1. Relationship between percent predicted forced expiratory volume in 1 s
(FEV1) and fat mass index (FMI; FM/height2) standard deviation scores in girls with
cystic fibrosis assessed by the 4-component model of body composition. Correlation
in 47 girls with cystic fibrosis; r = 0.40, p = 0.005
5.6.5 Body composition assessed by simple techniques
Data for body composition assessed by simple techniques (SFT, BIA, TBW and
DXA) compared to the 4CM is presented in Chapter 8.

106
Table 5.4. Difference in size and whole-body composition between boys with cystic fibrosis and control boys (CF minus control, n=37 matched
pairs). Positive mean values indicate a higher value in the CF group compared to controls.
Adjusted for age Adjusted for age and height Adjusted for age, height and puberty
Mean
SD
SEM
Pgroup
P Mean SEM P Mean SD P
Weight (kg) 0.65 1.10 0.556 2.04 0.74 0.009 2.13 0.82 0.010
Weight SDS 0.18 0.24 0.442 0.51 0.14 0.001 0.51 0.14 0.001
Height (m)1
-0.02 0.01 0.109 -0.01 0.01 0.284
Height SDS1
0.36 0.23 0.129 -0.20 0.20 0.328
BMI (kg/m2)
1 1.01 0.40 0.017 1.13 0.41 0.009
BMI SDS1
0.55 0.20 0.009 0.61 0.20 0.004
Total body water (L) 0.07 0.45 0.882 0.65 0.29 0.034 0.66 0.30 0.033
Body volume (L) 0.73 1.14 0.527 2.12 0.79 0.011 2.13 0.81 0.013
Total body density (kg/L) -0.002 0.004 0.598 -0.004 0.004 0.299 -0.004 0.004 0.328
Fat mass (kg) 0.66 0.79 0.412 1.29 0.73 0.084 1.28 0.74 0.093
Fat mass index (kg/m2)
1 0.47 0.40 0.24 0.55 0.41 0.184
Fat mass index SDS1
0.24 0.25 0.351 0.30 0.26 0.250
Fat-free mass (kg) -0.05 0.62 0.933 0.71 0.43 0.111 0.72 0.44 0.106
Fat-free mass index SDS1
0.60 0.20 0.005 0.64 0.21 0.004
Fat-free mass hydration (%) -0.01 0.46 0.983 -0.02 0.48 0.969 -0.03 0.49 0.941
Fat-free mass density (kg/L) 0.000 0.001 0.770 0.000 0.002 0.837 0.000 0.002 0.862
General linear model, adjusting for group, matched pairs and puberty as fixed factors and age and height as continuous variables. SDS; standard deviation
score, BMI; body mass index (weight/height2),
1 adjusted for age and puberty only. Table continues on next page

107
Table 5.4 continued. Difference in size and whole-body composition between boys with cystic fibrosis and control boys (CF minus control,
n=37 matched pairs). Positive mean values indicate a higher value in the CF group compared to controls.
Adjusted for age Adjusted for age and height Adjusted for age, height and puberty
Mean
SD
SEM
Pgroup
P Mean SEM P Mean SD P
Protein mass (kg) -0.04 0.19 0.817 0.09 0.18 0.619 0.10 0.18 0.597
Protein mass index SDS1
0.38 0.29 0.189 0.42 0.29 0.161
Mineral mass (kg) -0.02 0.04 0.599 0.03 0.02 0.225 0.03 0.02 0.218
Mineral mass adjusted (kg)2
-0.002 0.03 0.940 0.03 0.02 0.239 0.03 0.02 0.238
Mineral mass index SDS1
0.23 0.16 0.173 0.25 0.17 0.140
LS bone mineral density (g/cm2) 0.01 0.02 0.499 0.02 0.02 0.340 0.02 0.02 0.307
LS bone mineral density SDS 0.10 0.16 0.525 0.17 0.16 0.308 0.17 0.16 0.299
LS bone mineral apparent density SDS 0.26 0.20 0.204 0.21 0.21 0.336 0.21 0.21 0.330
Waist circumference (cm) 4.85 1.02 <0.001 5.76 0.90 <0.001 5.76 0.92 <0.001
Waist circumference SDS 0.87 0.18 <0.001 1.05 0.14 <0.001 1.05 0.15 <0.001
Hip circumference (cm) -0.18 1.22 0.883 1.22 0.92 0.196 1.20 0.94 0.209
Mid-upper arm circumference (cm) -0.11 0.54 0.842 0.28 0.51 0.590 0.28 0.52 0.591
Log 4 skinfold thickness3
0.04 0.12 0.753 0.05 0.13 0.678 0.06 0.13 0.643
4 skinfold thickness SDS4
0.29 0.14 0.049 0.43 0.20 0.042 0.43 0.21 0.045
General linear model, adjusting for group, matched pairs and puberty as fixed factors and age and height as continuous variables. SDS; standard deviation
score, LS; lumbar spine bone mineral apparent density (size adjusted bone mineral density) SDS compared to Lunar Prodigy software; anthropometric SDS
compared to UK 1990 data (54;209), body composition and 4 skinfold SDS compared to contemporary reference data (155). 1 Adjusted for age and puberty
only, 2
Adjusted for LS bone area, 3 Log 4 skinfold thicknesses (bicep, tricep, subscapular and supra-iliac) n=36 pairs,
4 Mean of bicep, tricep, subscapular and
supra-iliac SDS n= 36 pairs

108
Table 5.5. Difference in size and whole-body composition between girls with cystic fibrosis and control girls (CF minus control, n=48 matched
pairs). Positive mean values indicate a higher value in the CF group compared to controls.
Adjusted for age Adjusted for age and height Adjusted for age, height and puberty
Mean
SD
SEM
Pgroup
P Mean SEM P Mean SD P
Weight (kg) -5.71 1.31 <0.001 -1.95 1.02 0.063 -1.99 0.87 0.027
Weight SDS -1.01 0.22 <0.001 -0.35 0.15 0.029 -0.35 0.14 0.014
Height (m)1
-0.05 0.01 <0.001 -0.05 0.01 0.001
Height SDS1
-0.36 0.23 0.232 -0.73 0.21 0.001
BMI (kg/m2)
1 -1.76 0.48 0.001 -1.35 0.39 0.001
BMI SDS1
-0.75 0.20 0.001 -0.58 0.17 0.001
Total body water (L) -1.88 0.55 0.001 -0.02 0.30 0.937 -0.04 0.27 0.890
Body volume (L) -5.85 1.34 <0.001 -2.16 1.09 0.053 -2.21 0.93 0.022
Total body density (kg/L) 0.01 0.003 0.001 0.009 0.004 0.015 0.009 0.003 0.008
Fat mass (kg) -3.39 0.75 <0.001 -2.11 0.78 0.009 -2.14 0.69 0.003
Fat mass index (kg/m2)
1 -1.53 0.35 <0.001 -1.26 0.30 <0.001
Fat mass index SDS1
-0.81 0.19 <0.001 -0.69 0.17 <0.001
Fat-free mass (kg) -2.46 0.73 0.002 0.03 0.40 0.939 0.02 0.37 0.965
Fat-free mass index SDS1
-0.34 0.21 0.118 -0.22 0.20 0.284
Fat-free mass hydration (%) -0.28 0.35 0.427 -0.56 0.40 0.172 -0.57 0.38 0.146
Fat-free mass density (kg/L) -0.001 0.001 0.329 0.000 0.001 0.934 0.000 0.001 0.911
General linear model, adjusting for group, matched pairs and puberty as fixed factors and age and height as continuous variables. SDS; standard deviation
score, BMI; body mass index (weight/height2),
1 adjusted for age and puberty only. Table continues on next page

109
Table 5.5. continued. Difference in size and whole-body composition between girls with cystic fibrosis and control girls (CF minus control,
n=48 matched pairs). Positive mean values indicate a higher value in the CF group compared to controls.
Adjusted for age Adjusted for age and height Adjusted for age, height and puberty
Mean
SD
SEM
Pgroup
P Mean SEM P Mean SD P
Protein mass (kg) -0.26 0.16 0.113 0.23 0.18 0.055 0.23 0.12 0.058
Protein mass index SDS1
0.12 0.21 0.567 0.15 0.21 0.475
Mineral mass (kg) -0.25 0.06 <0.001 -0.07 0.04 0.063 -0.07 0.04 0.057
Mineral mass adjusted (kg)2
-0.11 0.05 0.018 -0.07 0.038 0.074 -0.07 0.04 0.067
Mineral mass index SDS1
-0.83 0.22 0.001 -0.71 0.21 0.002
LS bone mineral density (g/cm3) -0.05 0.02 0.028 -0.004 0.02 0.847 -0.01 0.02 0.829
LS bone mineral density SDS -0.45 0.22 0.050 0.01 0.22 0.977 0.002 0.22 0.992
LS bone mineral apparent density SDS -0.21 0.26 0.429 0.08 0.29 0.773 0.08 0.28 0.784
Waist circumference (cm) -2.25 1.08 0.042 -0.33 1.11 0.771 -0.38 0.90 0.675
Waist circumference SDS -0.29 0.16 0.084 0.04 0.16 0.820 0.03 0.14 0.829
Hip circumference (cm) -6.39 1.31 <0.001 -3.00 1.13 0.011 -3.05 0.96 0.003
Mid-upper arm circumference (cm) -2.55 0.56 <0.001 -1.36 0.54 0.015 -1.38 0.48 0.007
Log 4 skinfold thickness3
-0.24 0.09 0.009 -0.11 0.10 0.289 -0.15 0.09 0.124
4 skinfold thickness SDS4
-0.18 0.10 0.082 -0.31 0.21 0.143 -0.36 0.20 0.074
General linear model, adjusting for group, matched pairs and puberty as fixed factors and age and height as continuous variables. SDS; standard deviation
score, LS; lumbar spine bone mineral apparent density (size adjusted bone mineral density) SDS compared to Lunar Prodigy software; anthropometric SDS
compared to UK 1990 data (54;209), body composition and 4 skinfold SDSs compared to contemporary reference data (155). 1 Adjusted for age and puberty
only, 2 Adjusted for LS bone area,
3 Log 4 skinfold thicknesses (bicep, tricep, subscapular and supra-iliac) n=43 pairs,
4 Mean of bicep, tricep, subscapular and
supra-iliac SDS n= 43 pairs

110
Table 5.6. Simple regression analysis of factors (adjusted for height)1 associated with forced expired volume in 1s standard deviation scores
Boys (n=37) Girls (n=48)
B SEM t P r2 B SEM t P r
2
BMI SDS 0.41 0.29 1.40 0.171 0.026 0.52 0.23 2.23 0.031 0.079
Fat mass (kg) 0.10 0.10 1.00 0.324 0.030 0.26 0.09 2.82 0.007 0.124
Fat-free mass (kg) -0.03 0.18 -0.15 0.880 0.059 0.15 0.13 1.14 0.261 0.005
Mineral mass (kg) 2
0.02 0.15 0.14 0.892 0.090 -0.05 0.15 -0.34 0.734 0.032
DXA bone mineral content (kg)2
0.65 3.20 0.20 0.841 0.090 4.17 2.44 1.77 0.094 0.010
DXA bone mineral density (g/m3) -4.14 6.01 -0.69 0.495 0.044 4.52 5.67 0.80 0.430 -0.019
SDS; standard deviation score, DXA; dual-energy X-ray absorptiometry, 1except BMI SDS,
2 additionally adjusted for lumbar spine bone area

111
5.7 Discussion
In this chapter I; (i) compared the body composition of children with CF to healthy
children using both case control and reference populations and (ii) investigated
associations between body composition and lung function in children with CF.
5.7.1 Body composition
Hypothesis 1 cannot be confirmed as this study identified clear sex differences in
body composition in these young patients, indicating that abnormalities in females
may be established much earlier than previously considered (59). Although boys
with CF had body composition similar to healthy controls, girls had a deficit of FM.
It is possible that the method we used to categorise pubertal development may not be
sensitive to early hormonal changes; however, the deficit was seen in pre-pubertal
girls. In accordance with previous research, children with CF in this study were
shorter than healthy children but, surprisingly, boys had higher BMI SDS than
healthy control boys and the reference population. This was mainly due to 4 boys
with BMI SDS > 1.64 (95th
centile) and the BMI/FMI SDS ratio for these boys show
that high BMI SDS does not always reflect excess fat. Simple SFT measurement
identified the boy with high FFM and low FM as having less subcutaneous fat than
the other 3 boys. It may be prudent to identify the nature of high BMI in these
patients and implement dietary interventions to avoid the complications of excess fat
in adult life. There were 2 girls who had a BMI SDS in the normal range but very
low (5th
centile) FFMI SDS termed ‘hidden depletion of lean mass’ which has
previously been reported in adults (104;117) and in children (105;150). The
prevalence in the 2 studies of children were 54% (105) and 14% (150), much higher
than this study however, the age range was much wider and included young adults
and the criteria for normal weight/BMI and FFM varied. Girls with CF were smaller
overall than the control girls, perhaps related to the slightly higher than expected
weight of control girls and the lower proportion of pubertal girls and sub-optimal
health (indicated by poorer lung function) of girls with CF.

112
I found that the control children had mean waist circumferences significantly greater
than the UK reference data. For the girls this was not surprising given that they had
a mean BMI SDS of 0.39 but the boys BMI SDS was -0.11. One explanation might
be that the reference data was collected in 1988 and that the current obesogenic
environment has produced a population of children with higher waist circumference
SDS. Mc Carthy et al (161) who produced the waist circumference SDS used in this
analysis acknowledged the need for more up-to-date data. The fact that SFT SDS
was not high in the control group is likely to be due to the different populations
measured for the reference data, 8,500 children for waist circumference in 1988 and
533 children for SFT from 2002 – 2007. However, the boys with CF had even
higher waist SDS than the controls (1.24±0.79) and the girls with CF had high waist
SDS relative to their smaller size (0.69±0.77) and this is in spite of the fact that FM
SDS is not significantly different in the boys (CF- control; 0.30±0.26) and girls with
CF having significantly less FM (CF-control; -0.69±0.17). One explanation might be
that a distended abdomen commonly seen in children with CF is due to inflammation
and enlargement of the internal organs rather than FM. This issue will be addressed
in subsequent analyses in the following chapters by comparing regional soft tissue
from DXA.
Body composition is influenced by many factors such as genotype, nutrition and
activity. It is likely that nutritional intake impacts greatly on body composition
although for the purposes of this thesis it was not possible to acquire accurate records
of dietary intake and therefore the contribution of diet on body composition has not
been included. The body composition of children with CF may be additionally
affected by the inflammatory response to chronic bacterial infection leading to
altered protein-energy balance, lack of appetite and reduced activity. 25% of
children on this study had chronic infection by pseudomonas aeruginosa and
exacerbations of inflammatory conditions are likely to impact negatively on
nutritional status. Unfortunately it was not possible to acquire accurate data on
inflammatory episodes in the group of children.
Our group previously reported normal BMD and BMAD in 32 8-12 yr old children
with CF (99); although boys in the present study had normal BMD and BMAD the
value for girls was significantly lower. The 24 pre-pubertal girls had normal bone

113
BMAD but low BMD (p<0.001) suggesting low BMD reflects small size and
possible delayed puberty.
Table 5.3 summarises the differences seen when comparing data from patients with
those from either matched controls or a large reference population, and highlights
some of the difficulties of comparing studies of different design. In this study, boys
were identified as shorter compared to the reference population but not by case-
control analysis, while girls had significantly lower FFMI SDS compared to the
reference population but not to matched controls. Previous studies have not been
consistent in accounting for height and puberty and tables 5.4 and 5.5 illustrate the
different findings depending on which factors are accounted for in the analysis. The
method of matching and analysis must be considered when comparing studies.
Tables 5.4 and 5.5 also give an indication of the differences depending on whether
raw values are used as opposed to height adjusted SDS. For example, the girls with
CF have less mineral than control girls and this is non-significant when using the
value of MM but significant when using MMI SDS. This may be in some part due to
the value of the index used to adjust for height being 2 rather than the ideal index to
remove the effect of height which, in this study is 2.1 for CF and 1.6 for control girls.
In addition, there was a difference in outcome depending on comparison using FFMI
SDS or FFM adjusted for age, puberty and height in boys. This may explain some of
the variability in findings of previous studies.
Whereas body composition variables adjusted for height and converted to SDS are
useful to monitor an individual’s progress they may not be appropriate in group
comparisons where adjusting for the individuals’ actual height is an easy alternative.
5.7.2 Spirometry
I chose FEV1 as an outcome measure because it is a good surrogate marker of clinical
status and predicts mortality, and I found clear sex differences in the relationship
between FEV1 and body composition. Contrary to previous research in adults
(117;118) and children (11;64;65), FFM was not associated with FEV1 in either boys
or girls but I identified a significant positive relationship with FM adjusted for height

114
in girls only. This discordance with previous studies may be due to the
methodologies used, the narrow age range of young children studied, adjustment of
FM for stature or analysing the sexes separately. The sex differences may reflect
differences in body composition during growth, with relatively greater gains in FFM
in boys and FM in girls. It is likely that the positive association between FM and
lung function in girls is a reflection of their poor nutritional status, given the
generally low FM in this group. However, some girls with low FM had good lung
function (Figure 5.1); of the 4 girls with FMI SDS <-1.5 and FEV1 > 78%, 3 were
more physically active than their peer group and 1 the same. This finding warrants
further investigation and suggests that nutritional and physical therapy perhaps needs
to be sex specific. It was not possible to analyse the data by genotype due to low
numbers in each group.
5.8 Study limitations
I used predicted rather than measured lung volume when calculating body volume by
ADP due to the difficulty of performing the technique for young children. However,
a study of children with CF deriving FFM from ADP concluded that there was no
significant difference in FFM calculations between measured or predicted lung
volumes (219).
Since exercise will affect the amount of lean tissue we repeated the analyses taking
into account parental reported exercise level; there was no difference in outcome.
However, the parental rating may be affected by differing expectations in healthy and
chronically ill patients and between the sexes and future studies should address this
by using objective measures of physical activity.
This study indicates that the children with CF have larger waist circumferences than
their healthy counterparts and for girls with CF this is despite having less FM than
the control girls. Regional measures of FM may indicate whether the reduction in
whole body FM is generalised throughout the body or restricted to regions. This
issue is addressed in Chapter 6 where whole body and regional DXA soft tissue data
is presented.

115
5.9 Summary
This is the first study to use a ‘criterion’ method to measure body
composition in children with CF.
My findings do not support Hypothesis 1, that there will be no differences at
baseline in young children with CF. I found clear sex differences even in pre-
pubertal children, girls with CF showing deficits of FM and to a lesser degree
MM and boys with CF having body composition similar to controls. Given
the poorer prognosis in girls this warrants further investigation.
Four boys with CF had a BMI SDS in the obese range, and in 3 cases this was
due to excess fat. It would seem prudent to carefully monitor children with
high BMI to avoid future health problems due to excess fat.
Two girls with CF had depleted FFM with normal BMI highlighting the
inability of height and weight measurement to monitor body composition.
Contrary to previous research I found that FM related to FEV1 in girls only.

116
Chapter 6. Cross-sectional comparison of the body
composition of children with cystic fibrosis with that of
healthy children at 6-12 and 8-14 years and the relationship
with lung function.
6.1 Introduction
This chapter presents a cross sectional comparison between children with CF and
control children at age 6-12 years and 8-14 years and includes only those children in
whom there were two consecutive (2 years apart), successful 4CM measurements
thereby insuring that comparison at baseline and 2 years is made in the same group
of children. The analysis is (i) compared to reference populations and (ii) compared
to group-matched (sex and age) and the relationship to the analysis in the previous
chapter is shown in Figure 6.1. A study outline is shown in Chapter 4 (4.5).
Chapter 5 Chapter 6
Figure 6.1. Description of mode of analysis and subjects in Chapters 5 and 6.
Puberty is the time of greatest changes in body composition under the influence of
the sex hormones with relatively greater gains in FFM in boys and FM in girls. Sub-
optimal nutrition at this time is likely to impact negatively on growth and body
composition.
Cross-sectional, compared to
reference data and
pair-matched analyses at baseline
85 CF, 85 Control
Cross-sectional, compared to
reference data and group-matched
analyses at baseline and 2y
69 of 85 CF, 72 of 85 Control + 21

117
The aims of this chapter are to test the hypotheses that; (1) there is no significant
difference in body composition at baseline but differences will become apparent over
time, (2) that specific components of body composition are associated with lung
function in children with CF and hypothesis (3) that the conclusions are the same
regardless of the mode of analysis, that is whether by comparison with reference
population or by matching with a smaller control group.
6.2 Study design
This is a cross-sectional study comparing the body composition of children with CF
and controls at age 6-12 years and two years later. Comparisons were made firstly,
using SDS calculated from a large reference population (see 4.6.2) and secondly,
with sex and age-matched (6-12 years at baseline) control children. In addition, the
lung function, measured on the same day (or within 4 weeks if not possible) was
related to components of body composition in the children with CF. Longitudinal
analysis is presented in Chapter 7.
6.3 Recruitment and exclusion criteria
Children with CF were recruited from patients at Great Ormond Street Hospital for
Children, the control children from an on-going study of healthy children at
University College London, Institute of Child Health. Details can be found in
Chapter 4.
6.4 Methods
Height, weight, waist, hip, MUAC and SFT were measured as described in Chapter 4.
Body composition was assessed using the 4CM which uses whole body BMC from
DXA, TBW from isotope dilution and density from ADP. Simpler techniques (SFT,
BIA, DXA and TBW) are compared in Chapter 8. LS and whole body BMC and BMD

118
were measured by DXA to assess bone status and DXA FM and FFM (lean + bone)
whole body and regional ((trunk and limbs (arms and legs)) to compare tissue
distribution. Confounding factors such as pubertal status and activity were assessed
with questionnaires, the details of all these can be found in Chapter 4 and Appendices 8
and 5. Due to low numbers in some groups the classification of physical activity was
recategorised in 3 groups; more than, same as and less than peers. Tanner staging was
classified as pre-pubertal (stage 1) or pubertal (stages 2-5). The children with CF also
had lung function assessed, described in Chapter 4.
6.5 Statistical analyses
6.5.1 Size adjustment and standard deviation score calculation
Characteristics of all the children were compared to 1990 UK reference data (54;209)
to generate SDS for weight, height, BMI and waist circumference. Size adjustment
of body composition variables was made as described in Chapter 4. SDS were
calculated compared to a contemporary reference population (see Chapter 4) for FM,
FFM, PM, MM and SFT (155). Total and LS BMD SDS were generated from the
Lunar Prodigy software using machine reference data matched for age, sex and
ethnic group and a size adjusted BMAD SDS (215)was calculated as described in
Chapter 4.
6.5.2 Comparison of body composition variables
Initial analysis indicated a strongly significant difference between the sexes and
therefore they were analysed separately.
6.5.2.1 Compared to reference data
Separate comparisons at baseline and 2 years were made using a one-sample t-test
between; (i) both CF and control children and the 1990 UK reference population for

119
anthropometric SDS and (ii) both CF and control children and the contemporary
reference population for body composition variables and SFT.
6.5.2.2 Compared to control group
Comparison between CF and control children was made at baseline and 2 years; (i)
using independent sample t- tests and (ii) using general linear models taking into
account factors predicting body composition variables, with group and puberty as
fixed factors and age and height (for non-indexed variables) as continuous variables.
Since total MM is predominantly bone mineral, MM was also adjusted for bone area
to account for the effect of bone size as well as length (height). Given the findings in
chapter 5 that both control children and children with CF had higher mean waist
circumference than expected, partial correlations were performed to investigate the
proportion of variability in waist circumference that can be attributed to body
composition. The relationship between waist circumference and FM, FFM, age, sex
and height were calculated individually whilst adjusting for all the other factors. In
addition regression analysis was performed with the same factors to determine the
overall contribution to variability in waist circumference.
6.5.3 Spirometry
Simple regression analysis was used to investigate the relationship between body
composition variables and FEV1 SDS at baseline and 2 years. Height was included
in the model rather than using indexed body composition variables.
6.6 Results
6.6.1 Subjects
Of the 100 children measured at baseline there were 16 children who did not have a
second measurement; 6 left the care of Great Ormond Street Hospital (5 boys), 7

120
declined to be re-measured (2 boys) and 3 did not have time at their annual clinic
visit (2 boys). There were no significant differences in respect of height, weight,
BMI and FEV1 between drop-outs and those remaining in the study (Appendix 9).
Of the 84 left in the study 15 were not used in the second analysis; 9 had failed 4CM
at baseline, (2 refused complete 4CM measures (1 boy), 5 failed TBW (2boys), 2
failed ADP (1 boy)) and 6 had failed 4CM at 2years, (2 no saliva sample, 4 failed
TBW (all girls)). There were no significant differences in the girls remaining in the
analysis compared to those who were not included but the boys remaining in the
analysis were significantly lighter with a lower BMI (Table 6.1).
Table 6.1. Children with cystic fibrosis not included in this analysis compared to
those remaining
Removed from baseline analysis Remaining in analysis
Boys n= 6 Girls n=10 Boys n= 31 Girls n=38
Mean SD P Mean SD P Mean SD Mean SD
Age 8.64 1.24 0.537 8.94 0.93 0.321 8.97 1.16 9.67 1.72
Height SDS 0.07 0.89 0.202 -0.59 1.09 0.854 -0.51 1.02 -0.59 1.12
Weight SDS 1.20 0.76 0.004 -0.74 0.96 0.849 -0.10 0.96 -0.51 1.11
BMI SDS 1.59 0.60 0.001 -0.64 1.47 0.570 0.29 0.86 -0.26 0.93
FEV1 SDS -0.61 3.21 0.193 -1.97 1.69 0.693 -1.10 1.54 -1.56 1.44
Of the original 85 control children whose data was used in the previous chapter, 72
had valid 4CM measurements at baseline and 2 years. Pair-matching with the same
pairs as the previous chapter would reduce the numbers for analysis considerably and
therefore, in order to include as many subjects as possible, all available age
appropriate healthy controls with valid measurements at both time-points were
included in a group-match analysis. There was therefore an additional 21 control
children included. Age, height, weight and BMI SDS did not differ between the
control children at baseline in pair-match (Chapters 5) and group-match (Chapter 6)
analyses (Table 6.2).

121
Table 6.2. Comparison of control children at baseline in Chapters 5 and 6.
Chapter 5 analysis
N = 85
Chapter 6 analysis
N=93
Mean SD P Mean SD
Age 9.31 1.58 0.471 9.49 1.74
Height SDS 0.10 0.91 0.617 0.17 0.83
Weight SDS 0.19 0.98 0.878 0.17 0.88
BMI SDS 0.17 1.03 0.578 0.09 0.94
The analysis therefore was performed on data from 69 of the original 85 children
with CF (31 boys and 38 girls) compared to 72 original and 21 additional control
children (44 boys and 49 girls) matched for age. A sample size of 69 would be
sufficient to detect a difference of 0.48 SDS in a group comparison with 80% power
at p=0.05.
At baseline 80% of CF and 66% of control children were pre-pubertal and at the 2
year measurement 45% of CF and 30% of controls were pre-pubertal. For CF
children genotype was homozygous ∆F508 for 48 children, heterozygous ∆F508 for
17 children, 3 children had non ∆F508 genotype and 1 child was of unknown
genotype. All subjects with CF except 1 girl were pancreatic insufficient, had a wide
range of pulmonary disease with a baseline mean FEV1%of 83.2%, with values
between 33% and 123%, 7 (6 girls) had a gastrostomy in situ, 1 girl had liver disease
and 1 girl was diabetic. At the 2-year measurement mean FEV1% was 79.4%, with
values between 32% and 119%, 8 (5 girls) had a gastrostomy in situ, 7 (4 girls) had
liver disease and 3 girls were diabetic. At baseline 14 children (8 boys) had chronic
infection of pseudomonas aeruginosa and 11 (6 boys) had chronic infection of
staphylococcus aureus. The status of 2 girls was unknown. After 2 years 24 (15
boys) had pseudomonas aeruginosa and 14 (6 boys) had chronic staphylococcus
aureus.

122
6.6.2 Anthropometry
Characteristics of all the children at each time point are presented in Table 6.3 for
boys and Table 6.4 for girls.
6.6.2.1 Compared to reference data
At baseline and 2 years the control boys were not significantly different from the
reference population in respect of height, weight, BMI and SFT SDS but had
significantly larger waist SDS (p<0.01). The control girls were significantly heavier
and taller (p≤ 0.01) with larger waist circumference (p<0.001) at baseline and 2
years. Boys with CF were significantly shorter than the reference data but the deficit
although significant (p<0.05) was less at the 2 year measurement and the mean waist
circumference SDS was greater at both time points (p< 0.001) despite SFT SDS
being average. CF girls differed more, being lighter and shorter at baseline (p<0.01)
and 2 year measurement (p<0.05) with larger waist circumference SDS (p<0.001) at
both time points and SFT SDS below zero (non-significant).
6.6.2.2 Compared to control group
Boys with CF were shorter than controls with larger waist circumference at both time
points (p<0.05). At the 2 year measurement the boys with CF had significantly
smaller hip and mid-upper arm circumferences (p<0.05). Girls with CF had
significantly lower weight and height (p<0.001) and BMI SDS, hip and MUAC
(p<0.05) at both measurements. Despite being smaller than the control girls, the girls
with CF had similar waist circumference at both time-points.
Regression analyses and partial correlations of the relationship between waist
circumference and age, height, sex, FM and FFM may be found in Appendix 10.
FM, FFM, age, sex and height explained 86% of the variation in waist circumference
in children with CF and 91% in control children. Adjusted partial correlations can be
found in Figure 6.2.

123
Figure 6.2. Contribution of body composition, age, sex and height to variability in
waist circumference in children with cystic fibrosis and controls. Determined by
partial correlations, each factor adjusted for the others, % is adjusted R2
6.6.3 Body Composition
A comparison of body composition at baseline and 2 years is presented in Table 6.5
(boys) and Table 6.6 (girls) with a summary in Table 6.8.
6.6.3.1 Compared to reference data
Control boys did not differ from the cross sectional reference data in respect of FMI,
FFMI, PMI and MMI SDS, however, they had significantly higher mean total BMD
SDS at baseline (p<0.001) but lower total and LS BMD at 2 years (p<0.05). Size
adjusted LS BMAD was not significantly different from zero at both time-points.
Control girls were typical of the reference population apart from a higher mean total

124
BMD SDS at baseline (p<0.01). Boys with CF had higher mean total BMD SDS
(p<0.001) at both time-points and higher FFMI SDS at baseline (p<0.05) whereas the
girls with CF had lower LS BMD and BMAD, FMI, FFMI and MMI SDS (p<0.05)
at both measurements.

125
Table 6.3. Characteristics of cystic fibrosis (CF) and control boys at baseline and two years with group comparison (Pgroup) and compared
to reference data (Pref).
Baseline Two years
CF n=31 Control n=44 CF n= 31 Control n=44
Mean SD Pref
ref
Pgroup
group
Mean SD Pref
ref
Mean SD Pref
ref
Pgroup
group
Mean SD Pref
ref Age (y) 8.97 1.16 0.108 9.50 1.36 11.0 1.19 0.151 11.5 1.36
Weight (kg) 28.7 6.13 0.244 30.8 6.87 35.1 8.98 0.097 38.7 9.46
Height (m) 1.30 0.09 0.010 1.36 0.08 1.41 0.10 0.011 1.47 0.10
BMI (kg/m2) 16.8 1.81 0.250 16.3 1.72 17.5 2.03 0.883 17.6 2.41
Weight SDS -0.10 0.96 0.579 0.826 -0.05 0.87 0.702 -0.13 0.98 0.454 0.337 0.09 1.00 0.548
Height SDS -0.51 1.02 0.009 0.019 0.03 0.88 0.806 -0.42 1.02 0.032 0.019 0.13 0.91 0.366
BMI SDS 0.29 0.86 0.071 0.058 -0.09 0.84 0.469 0.15 0.94 0.388 0.561 0.01 1.06 0.951
Waist (cm) 62.1 5.43 0.016 59.1 4.88 65.6 5.60 0.214 63.8 6.35
Waist SDS 1.07 0.70 <0.001
0
<0.001 0.35 0.73 0.002 0.88 0.70 <0.001 0.021 0.41 0.83 0.002
Hip (cm) 66.9 5.78 0.120 69.2 6.62 72.7 6.40 0.040 76.3 7.95
MUAC (cm) 19.40 2.26 0.162 20.3 2.74 20.6 2.53 0.043 22.0 3.07
Sum 4 skinfold thickness (mm)1 30.2 12.7 0.985 30.1 11.6 33.4 14.4 0.187 38.7 18.9
4 skinfold thickness SDS1 -0.10 0.85 0.534 0.971 -0.09 0.79 0.448 0.001 0.85 0.997 0.331 0.20 0.89 0.142
FEV1 % 86.6 18.8 86.4 18.3
FEV1 SDS -1.10 1.54 <0.001 -1.15 1.56 <0.001
Activity (hours per week) 9.39 6.95 0.340 8.05 5.14 9.19 5.18 0.767 8.84 4.94
Pre-pubertal (n, %) 29 94% 31 71% 21 68% 14 32%
Pref ; one-sample t- test compared to zero, CF or control compared to reference data (54;155;209). Pgroup; independent sample t-test, CF boys v control boys or CF
girls v control girls, BMI; body mass index (weight/height2), SDS; standard deviation score compared to UK 1990 reference data (54;209), MUAC; mid-upper arm
circumference, Sum 4 skinfold thickness; bicep+tricep+subscapular+ suprailiac, 1CF n=30, control n= 44, FEV1%; forced expired volume in 1s percentage of the
expected, FEV1 SDS; compared to reference data (204), Pre-puberty is based on Tanner staging 1 (pre) to stages 2 – 5 (pubertal), Pancreatic insufficient; reduced
pancreatic function requiring the oral addition of pancreatic enzymes, Ps aerug; chronic pseudomonas aeruginosa infection of the lungs, Staph aureus; chronic
staphylococcus aureus infection of the lungs.

126
Table 6.4. Characteristics of cystic fibrosis (CF) and control girls at baseline and two years with group comparison (Pgroup) and compared
to reference data (Pref).
Baseline Two years
CF n=38 Control n=49 CF n= 38 Control n=49
Mean SD Pref
ref
Pgroup
group
Mean SD Pref
ref
Mean SD Pref
ref
Pgroup
group
Mean SD Pref
ref Age (y) 9.64 1.76 0.757 9.67 2.03 11.07 1.80 0.666 11.6 2.04
Weight (kg) 29.7 7.90 0.027 34.0 9.57 37.7 10.7 0.035 42.6 10.7
Height (m) 1.33 0.11 0.078 1.38 0.13 1.44 0.12 0.061 1.49 0.12
BMI (kg/m2) 16.5 1.97 0.024 17.7 2.44 17.7 2.76 0.051 18.9 2.71
Weight SDS -0.51 1.11 0.007 <0.001 0.36 0.84 0.004 -0.52 1.30 0.017 <0.001 0.39 0.79 0.001
Height SDS -0.59 1.12 0.003 <0.001 0.29 0.77 0.010 -0.53 1.18 0.017 0.001 0.39 0.74 0.004
BMI SDS -0.26 0.93 0.089 0.016 0.25 1.00 0.085 -0.32 1.12 0.091 0.011 0.27 0.97 0.104
Waist (cm) 60.6 5.67 0.719 61.1 6.93 65.6 7.25 0.903 65.4 6.70
Waist SDS 0.72 0.77 <0.001 0.657 0.80 0.93 <0.001 0.96 0.91 <0.001 0.858 0.99 0.85 <0.001
Hip (cm) 69.0 7.72 0.007 73.9 8.74 76.2 9.68 0.019 81.1 9.29
MUAC (cm) 20.0 2.75 0.006 21.8 3.29 21.50 3.24 0.007 23.4 3.09
Sum 4 skinfold thickness (mm)1 38.0 13.4 0.045 45.3 18.2 48.8 21.6 0.225 54.6 21.9
4 skinfold thickness SDS1 -0.35 0.80 0.011 0.074 -0.01 0.92 0.081 -0.14 0.96 0.384 0.157 0.16 0.94 0.251
FEV1 % 80.3 18.1 74.8 19.1
FEV1 SDS -1.56 1.44 <0.001 -2.05 1.58 <0.001
Activity (hours per week) 8.13 4.65 0.957 8.08 3.89 6.76 3.47 0.099 8.02 3.50
Pre-pubertal (n, %) 26 68% 30 61% 10 26% 14 29%
Pref ; one-sample t-test compared to zero, CF or control compared to reference data (54;209). Pgroup; independent sample t-test, CF boys v control boys or CF girls v
control girls, BMI; body mass index (weight/height2), SDS; standard deviation score compared to UK 1990 reference data (54;209), MUAC; mid-upper arm
circumference, Sum 4 skinfold thickness; bicep+tricep+subscapular+ suprailiac, 1CF n=30, control n= 44, FEV1%; forced expired volume in 1s percentage of the
expected, FEV1 SDS; compared to reference data (204), Pre- puberty is based on Tanner staging 1 (pre) to stages 2 – 5 (pubertal), Pancreatic insufficient; reduced
pancreatic function requiring the oral addition of pancreatic enzymes, Ps aerug; chronic pseudomonas aeruginosa infection of the lungs, Staph aureus; chronic
staphylococcus aureus infection of the lungs.

127
Table 6.5. Body composition of cystic fibrosis (CF) and control boys with group comparison (Pgroup) and compared to reference data (Pref).
Baseline Two years
CF n=31 Control n=44 CF n= 31 Control n=44
Mean SD Pref
ref
Pgroup
pp
group
Mean SD Pref
ref
Mean SD Pref
ref
Pgroup
group
Mean SD Pref
ref Body volume (L) 27.4 6.15 0.250 29.1 6.72 33.6 7.93 0.062 37.7 9.85
Total body water (L) 17.7 3.13 0.261 18.6 3.58 21.2 4.26 0.149 22.9 5.20
Total bone mineral content (kg) 1.05 0.23 0.108 1.14 0.24 1.32 0.37 0.114 1.45 0.33
Total bone mineral density (g/cm2)
(g/cm2
0.90 0.06 0.475 0.89 0.06 0.95 0.08 0.001 0.79 0.11
Total bone mineral density SDS 0.53 0.62 0.001 0.096 0.30 0.50 0.001 0.57 0.76 0.001 0.001 -0.27 0.82 0.033
LS bone mineral density (g/cm2) 0.73 0.08 0.652 0.73 0.08 0.78 0.10 0.565 0.79 0.11
LS bone mineral density SDS -0.09 0.68 0.467 0.687 -0.16 0.76 0.173 -0.19 0.73 0.154 0.611 -0.29 0.84 0.029
LS bone mineral apparent density SDS 0.07 0.85 0.656 0.951 0.06 0.90 0.683 0.17 0.93 0.327 0.456 -0.01 1.07 0.938
4-Component model
Fat mass (kg) 5.25 2.98 0.381 5.88 3.11 7.02 3.35 0.242 8.15 4.55
Fat mass index SDS -0.21 0.99 0.242 0.968 -0.20 0.94 0.159 -0.17 0.85 0.286 0.757 -0.10 0.77 0.504
Fat (%) 17.5 6.70 0.477 18.6 6.30 19.3 6.00 0.539 20.3 7.73
Fat-free mass (kg) 23.4 3.84 0.246 24.6 4.90 28.2 5.58 0.119 30.5 6.98
Fat-free mass index SDS 0.49 1.07 0.015 0.003 -0.19 0.89 0.159 0.15 1.03 0.439 0.121 -0.24 1.07 0.140
Fat-free mass hydration (%) 75.6 2.14 0.868 75.7 1.47 75.3 1.65 0.240 74.9 1.38
Fat-free mass density (kg/L) 1.088 0.007 0.407 1.089 0.005 1.090 0.006 0.030 1.093 0.004
Protein mass (kg) 4.33 0.68 0.345 4.55 1.13 5.27 1.01 0.071 5.83 1.48
Protein mass index SDS 0.43 1.45 0.107 0.057 -0.12 1.06 0.427 0.18 1.12 0.375 0.555 0.03 1.04 0.838
Mineral mass (kg) 1.33 0.29 0.114 1.45 0.30 1.69 0.47 0.129 1.84 0.42
Mineral mass index SDS 0.003 0.83 0.983 0.278 -0.22 0.87 0.108 -0.11 0.97 0.546 0.614 -0.23 1.04 0.156
Pgroup independent t-test; CF boys and control boys or CF girls and control girls; Pref one-sample t-test compared to zero, CF and controls compared to reference data.
SDS; standard deviation score, LS ; Lumbar spine (L2-L4) bone mineral apparent density which is a 3-D ‘volumetric’ measurement that is calculated from the 2-D
Bone mineral density (BMD) actually measured by the DXA machine, SDS are calculated from reference data (204). Fat mass index (fat mass/height2), Fat-free mass
index(fat-free mass/height2), Protein mass index (protein mass/height
2), Mineral mass index (fat mass/height
2). SDS are calculated from reference data collected in
533 contemporary healthy children (155). Table continues on next page.

128
Table 6.5 continued. Body composition of cystic fibrosis (CF) and control boys with group comparison (Pgroup) and compared to reference
data (Pref). Baseline Two years
CF n=31 Control n=44 CF n= 31 Control n=44
Mean SD Pref
ref
Pgroup
pp
group
Mean SD Pref
ref
Mean SD Pref
ref
Pgroup
group
Mean SD Pref
ref DXA soft tissue
Whole body fat mass (kg) 5.01 2.99 0.437 5.58 3.20 7.06 3.64 0.223 8.37 5.04
Whole body fat-free mass (kg) 23.4 3.62 0.167 24.8 4.79 28.0 5.50 0.145 30.16 6.86
Trunk fat mass (kg) 2.03 1.38 0.811 2.10 1.36 3.04 1.81 0.290 3.82 3.83
Trunk fat-free mass (kg) 11.2 1.71 0.972 11.3 2.09 13.4 2.48 0.549 13.0 2.90
Limb fat mass (kg) 2.58 1.54 0.235 3.05 1.77 3.58 1.79 0.083 4.58 2.79
Limb fat-free mass (kg) 9.01 1.82 0.021 10.3 2.56 11.4 2.81 0.016 13.3 3.67
Pgroup; independent t-test, CF boys and control boys or CF girls and control girls; Pref ; one sample t-test compared to zero, CF and
controls compared to reference data. SDS; standard deviation score, LS ; Lumbar spine (L2-L4) bone mineral apparent density which a 3-
D ‘volumetric’ measurement that is calculated from the 2-D Bone Mineral Density (BMD) actually measured by the DXA machine, SDS
are calculated from reference data (215). Fat mass index (fat mass/height2), Fat-free mass index(fat-free mass/height
2), Protein mass index
(protein mass/height2), Mineral mass index (fat mass/height
2). SDS are calculated from reference data collected in 533 contemporary
healthy children (155).

129
Table 6.6. Body composition of cystic fibrosis (CF) and control girls with group comparison (Pgroup) and compared to reference data (Pref).
Baseline Two years
CF n=38 Control n=49 CF n= 38 Control n=49
Mean SD Pref
ref
Pgroup
pp
group
Mean SD Pref
ref
Mean SD Pref
ref
Pgroup
group
Mean SD Pref
ref Body volume (L) 28.5 7.75 0.025 32.8 9.45 36.3 10.6 0.039 41.1 10.4
Total body water (L) 17.3 4.10 0.066 19.1 4.90 21.1 5.02 0.026 23.7 5.46
Total bone mineral content (kg) 1.03 0.26 0.014 1.21 0.37 1.35 0.37 0.014 1.59 0.50
Total bone mineral density (g/cm2)
(g/cm2
0.88 0.08 0.272 0.90 0.08 0.94 0.07 0.244 0.90 0.17
Total bone mineral density SDS 0.00 0.74 1.000 0.077 0.27 0.66 0.006 -0.20 0.84 0.148 0.265 0.03 1.03 0.847
LS bone mineral density (g/cm2) 0.74 0.11 0.035 0.79 0.12 0.84 0.14 0.077 0.90 0.17
LS bone mineral density SDS -0.52 1.22 0.013 0.024 0.01 0.94 0.930 -0.66 1.19 0.005 0.005 0.04 1.02 0.804
LS bone mineral apparent density SDS -0.44 1.28 0.042 0.119 -0.04 1.07 0.789 -0.40 1.07 0.026 0.135 -0.05 1.08 0.739
4-Component model
Fat mass (kg) 6.53 3.08 0.010 8.60 4.03 9.28 4.87 0.106 10.9 4.52
Fat mass index SDS -0.63 0.82 0.001 0.026 -0.16 0.94 0.246 -0.55 1.13 0.010 0.126 -0.18 0.93 0.177
Fat (%) 21.2 5.25 0.014 24.4 6.53 23.4 7.31 0.301 25.0 6.71
Fat-free mass (kg) 23.1 5.35 0.080 25.4 6.37 28.4 6.76 0.035 31.7 7.40
Fat-free mass index SDS -0.33 0.90 0.031 0.157 -0.05 0.91 0.715 -0.47 1.02 0.007 0.008 0.07 0.84 0.560
Fat-free mass hydration (%) 74.8 1.81 0.477 75.1 1.52 74.1 1.81 0.182 74.6 1.51
Fat-free mass density (kg/L) 1.091 0.007 0.373 1.092 0.006 1.095 0.006 0.467 1.094 0.007
Protein mass (kg) 4.53 1.16 0.315 4.77 1.12 5.63 1.42 0.185 6.05 1.45
Protein mass index SDS 0.08 1.08 0.662 0.797 0.02 0.95 0.878 0.09 1.14 0.645 0.712 0.17 1.07 0.260
Mineral mass (kg) 1.31 0.32 0.009 1.55 0.47 1.74 0.48 0.019 2.03 0.64
Mineral mass index SDS -0.83 1.14 0.001 0.001 -0.01 0.98 0.965 -0.66 1.06 0.000 0.001 0.10 1.00 0.503
Pref ; one-sample t-test CF and controls compared to zero, CF and controls compared to reference data (155), Pgroup; independent sample t-test; CF boys and control
boys and CF girls and control girls, SDS; standard deviation score, LS ; Lumbar spine (L2-L4) bone mineral apparent density which is a 3-D ‘volumetric’ measurement
that is calculated from the 2-D Bone Mineral Density (BMD) actually measured by the DXA machine, SDS are calculated from reference data (215). Fat mass index
(fat mass/height2), fat-free mass index(fat-free mass/height
2), protein mass index (protein mass/height
2), mineral mass index (fat mass/height
2). SDS are calculated
from reference data collected in 533 contemporary healthy children (155). Table continues on next page.

130
Table 6.6 continued. Body composition of cystic fibrosis (CF) and control girls with group comparison (Pgroup) and compared to reference data
(Pref).
Baseline Two years
CF n=31 Control n=44 CF n= 31 Control n=44
Mean SD Pref
ref
Pgroup
pp
group
Mean SD Pref
ref
Mean SD Pref
ref
Pgroup
group
Mean SD Pref
ref DXA soft tissue
Whole body fat mass (kg) 6.80 3.23 0.019 8.89 4.55 9.80 5.05 0.073 11.8 5.26
Whole body fat-free mass (kg) 22.6 5.13 0.058 24.9 5.89 27.3 6.27 0.044 30.3 6.88
Trunk fat mass (kg) 2.92 1.65 0.113 3.60 2.17 4.50 2.63 0.325 5.06 2.65
Trunk fat-free mass (kg) 11.0 2.69 0.601 11.3 2.76 13.4 3.25 0.775 13.6 3.73
Limb fat mass (kg) 3.44 1.56 0.003 4.78 2.37 4.81 2.38 0.011 6.22 2.60
Limb fat-free mass (kg) 8.71 2.32 0.002 10.5 2.97 10.9 2.90 0.001 13.3 3.34
Pref ; one-sample t-test CF and controls compared to zero, CF and controls compared to reference data (155), Pgroup; independent sample t-
test; CF boys and Control boys or CF girls and Control girls SDS; standard deviation score, LS ; Lumbar spine (L2-L4) bone mineral
apparent density which is a 3-D ‘volumetric’ measurement that is calculated from the 2-D Bone Mineral Density (BMD) actually measured
by the DXA machine, SDS are calculated from reference data (215). Fat mass index (fat mass/height2), fat-free mass index(fat-free
mass/height2), protein mass index (protein mass/height
2), mineral mass index (fat mass/height
2). SDS are calculated from reference data
collected in 533 contemporary healthy children.(155)

131
6.6.3.2 Compared to control group
Boys with CF did not differ significantly from the control boys at baseline apart from
having a higher FFMI SDS (p<0.05), and at the 2 year measurement they had higher
total BMD (p<0.01) and FFM density (p<0.05). Comparison in the girls revealed
more differences than the boys with CF girls lower in total BMC, LS BMD SDS
(p<0.05) and lower MMI SDS (p<0.001) at both time-points. Size adjusting LS
BMD made the difference non-significant although the CF girls had a lower mean
value. The CF girls had lower FM although this was only significant at baseline
(p<0.05) and lower FFM although this was only significant at 2 years (p<0.01).
DXA regional soft tissue analysis revealed that the boys with CF had significantly
less limb FFM at both time points p<0.05 despite whole body and trunk FFM not
being significantly different from controls. Girls with CF had less whole body FM
and FFM which appears to be due to deficits in the limbs at both time-points.
6.6.3.3 Potential confounders affecting body composition outcomes
Table 6.7 shows adjusted mean differences in body composition (CF- control) after
adjustment for age, puberty and height for non-indexed variables at baseline and 2
years with a summary in Table 6.8. CF boys had greater weight, BMI, FFMI SDS
and waist circumference at both time points although this was non-significant for
BMI SDS at 2 years (p<0.05). They were also shorter by on average, 0.3 SDS
although this was non-significant and had lower density of FFM at 2 years (p<0.05).
Girls with CF were significantly shorter with lower BMI SDS, FMI SDS and MMI
SDS at both time points (p<0.05). FFMI SDS and MUAC were lower in CF girls at
baseline (non-significant) and became increasingly lower at 2 years (p<0.05). To
determine whether differences in body composition were due to different levels of
activity the parent’s rating of the child’s activity level was added to the model with
no effect on the outcome (data not shown).

132
DXA regional body composition indicated that boys with CF had significantly more
whole body FFM at baseline (p<0.05) and more at 2 years (non-significant). There
was a much larger difference in the trunk, boys with CF had greater FFM at baseline
and 2 years (p<0.001). Despite whole body FFM being similar in the girls, the girls
with CF appear to have much more FFM in the trunk than control girls (p<0.005) at
both time-points and less in the limbs (p<0.001). The non-significant deficit of
whole body FM is attributable to deficits of FM in the limbs (p<0.05).

133
Table 6.7. Difference in size and whole-body composition (cystic fibrosis (CF) minus control) at baseline and two years. Positive mean
values indicate greater values in children with CF.
Boys (CF = 31, control = 44) Girls (CF = 38, control = 49)
Baseline Year 2 Baseline Year 2
Mean SEM P Mean SEM P Mean SEM P Mean SEM P
Weight (kg) 1.87 0.74 0.013 1.95 1.10 0.079 -0.77 0.92 0.407 -1.55 1.30 0.238
Weight SDS 0.36 0.14 0.013 0.33 0.15 0.036 -0.17 0.15 0.273 -0.31 0.18 0.082
Height (m)1
-1.79 1.26 0.159 -2.34 1.68 0.170 -5.04 1.23 <0.001 -6.22 1.33 <0.001
Height SDS1
-0.32 0.21 0.131 -0.31 0.23 0.183 -0.78 0.20 <0.001 -0.97 0.20 <0.001
BMI (kg/m2)
1 0.87 0.39 0.030 0.76 0.50 0.134 -0.96 0.43 0.030 -1.38 0.53 0.010
BMI SDS1
0.49 0.21 0.020 0.43 0.24 0.072 -0.42 0.21 0.043 -0.63 0.22 0.005
Total body water (L) 1.04 0.36 0.005 1.14 0.57 0.050 -0.03 0.37 0.943 -0.68 0.47 0.150
Body volume (L) 1.85 0.76 0.018 1.35 1.31 0.307 -0.83 0.97 0.391 -1.49 1.35 0.275
4C Fat mass (kg) 0.55 0.61 0.370 0.64 0.89 0.475 -0.88 0.66 0.185 -0.72 0.94 0.447
4CFat mass index (kg/m2)
1 0.17 0.32 0.604 0.17 0.40 0.683 -0.75 0.31 0.016 -0.67 0.38 0.078
4C Fat mass index SDS1
0.08 0.24 0.753 0.16 0.22 0.486 -0.41 0.19 0.033 -0.42 0.21 0.050
4C Fat-free mass (kg) 1.28 0.50 0.013 1.31 0.75 0.085 0.08 0.46 0.865 -0.83 0.65 0.203
4C Fat-free mass index SDS1
0.71 0.24 0.004 0.61 0.25 0.019 -0.21 0.19 0.282 -0.58 0.20 0.005
4C Fat-free mass hydration (%) 0.11 0.44 0.798 0.46 0.38 0.231 -0.33 0.41 0.426 -0.21 0.40 0.594
4C Fat-free mass density (kg/L) -0.001 0.001 0.347 -0.003 0.001 0.029 0.000 0.001 0.721 0.001 0.001 0.360
4C Protein mass (kg) 0.19 0.18 0.285 0.11 0.20 0.574 0.19 0.13 0.133 -0.07 0.20 0.740
4C Protein mass index SDS1
0.50 0.31 0.107 0.28 0.27 0.291 0.07 0.22 0.741 -0.11 0.24 0.657
4C Mineral mass (kg)
0.05 0.03 0.121 0.07 0.06 0.207 -0.09 0.04 0.029 -0.09 0.06 0.139
4C Mineral mass adjusted (kg)2
0.03 0.03 0.402 0.05 0.06 0.394 -0.10 0.04 0.015 -0.10 0.05 0.057
4C Mineral mass index SDS1
0.29 0.21 0.171 0.26 0.25 0.304 -0.74 0.23 0.002 -0.77 0.22 0.001
General linear model, adjusting for group and puberty as fixed factors and age and height as continuous variables. P; independent sample t-test, CF v control, SDS;
standard deviation score, 4C; 4-component model, 1adjusted for age and puberty only,
2adjusted for lumbar spine bone area . Table continues on next page.Table

134
6.7 continued. Difference in size and whole-body composition (CF minus control) at baseline and two years. Positive mean values
indicate greater values in children with CF.
Boys (CF = 31, control = 44) Girls (CF = 38, control = 49)
Baseline Year 2 Baseline Year 2
Mean SEM P Mean SEM P Mean SEM P Mean SEM P
DXA LS bone mineral density 0.01 0.02 0.456 0.01 0.02 0.540 -0.01 0.02 0.609 -0.01 0.02 0.596
DXA LS bone mineral density SDS 0.13 0.18 0.476 0.15 0.21 0.464 -0.01 0.21 0.952 -0.14 0.24 0.554
DXA LS bone mineral apparent density SDS -0.01 0.21 0.947 0.07 0.25 0.794 -0.19 0.27 0.497 -0.16 0.26 0.547
DXA whole body fat mass (kg) 0.72 0.60 0.231 0.72 0.97 0.458 -0.82 0.70 0.246 -1.07 1.00 0.287
DXA whole body fat-free mass (kg) 1.08 0.47 0.026 1.23 0.84 0.151 -0.06 0.40 0.885 -0.35 0.55 0.529
DXA trunk fat mass (kg) 0.48 0.27 0.082 0.19 0.72 0.796 -0.06 0.35 0.866 -0.07 0.52 0.893
DXA trunk fat-free mass (kg) 1.04 0.24 <0.001 1.78 0.51 0.001 0.80 0.22 <0.001 1.16 0.40 0.005
DXA limb fat mass (kg) 0.23 0.32 0.473 0.11 0.51 0.825 -0.73 0.36 0.046 -0.98 0.49 0.048
DXA limb fat-free mass (kg) -0.003 0.25 0.992 -0.10 0.41 0.806 -0.77 0.22 0.001 -1.22 0.31 <0.001
Waist circumference (cm) 5.20 0.94 <0.001 4.96 1.16 <0.001 1.26 1.11 0.261 1.47 1.36 0.285
Waist circumference SDS 0.93 0.15 <0.001 0.69 0.18 <0.001 0.25 0.19 0.185 0.21 0.20 0.311
Hip circumference (cm) 0.80 0.92 0.389 0.60 1.18 0.613 -2.06 1.06 0.056 -2.39 1.25 0.060
Mid-upper arm circumference (cm) 0.03 0.54 0.959 0.11 0.56 0.846 -0.88 0.56 0.118 -1.31 0.61 0.036
Log 4 skinfold thickness3
0.09 0.08 0.250 0.03 0.10 0.774 -0.06 0.09 0.496 -0.10 0.10 0.302
4 skinfold thickness SDS4
0.19 0.19 0.327 0.12 0.20 0.543 -0.12 0.21 0.558 -0.25 0.23 0.265
General linear model, adjusting for group and puberty as fixed factors and age and height as continuous variables. P; independent t-test, CF v control,
SDS; standard deviation score, LS; lumbar spine bone mineral apparent density (size adjusted bone mineral density) SDS. 3Log 4 skinfolds (bicep,
tricep, subscapular and supra-iliac). 4Mean of bicep, tricep, subscapular and supra-iliac SDS,
3,4 n= CF boys 31, control boys 42, CF girls 37, control
girls 46 at baseline and 2 years n= CF boys 31, control boys 43, CF girls 37, control girls 48.

135
Table 6.8. Summary of comparisons (before and after adjustment for age, puberty and height1)
Boys with CF compared to; Girls with CF compared to;
Mode of analysis Unadjusted
Group-match
Unadjusted
Reference
Group-match
adjusted for,
age, puberty
and height1
Unadjusted
Group-match
Unadjusted
Reference
Group-match
adjusted for
age, puberty
and height1
Year 0 2 0 2 0 2 0 2 0 2 0 2
Weight SDS1
NS NS NS NS NS NS
Height SDS NS NS
BMI SDS NS NS NS NS NS NS NS
Waist SDS1
NS NS NS NS
Fat mass index SDS NS NS NS NS NS
NS NS
Fat-free mass index SDS NS NS NS NS
Protein mass index SDS NS NS NS NS NS NS NS NS NS NS NS NS
Mineral mass index SDS NS NS NS NS NS NS
Unadjusted comparisons using independent t-test for group-match and one sample t-test for reference data. Adjusted comparisons are a general linear model adjusted
for age, puberty (pre-pubertal; Tanner stage1 versus Tanner stages 2-5) and 1 height for weight and waist SDS. Reference data is UK 1990 (54;161;209) for weight,
height, BMI and waist and reference data from 533 children measured by the 4-component model (155). Fat mass index (fat mass/height2), fat-free mass index (fat-
free mass/height2), protein mass index (protein mass/height
2), mineral mass index (mineral mass/height
2). Highlights signify disagreement.

136
6.6.4 Relationship between body composition and spirometry
Mean FEV1 SDS was; CF boys, mean (SD), baseline -1.10 (1.54) and 2 years -1.15
(1.56) (Table 2) and CF girls, baseline -1.56 (1.44) and 2 years -2.05 (1.58) (Table
6.3). There was a significant deterioration in the girls lung function (p<0.01)
between baseline and 2 years of 0.5 SDS.
Separate simple regression analysis of FEV1 SDS and BMI SDS or FM or FFM or
MM or whole body BMC or BMD were performed with height in the model (except
for BMI) and additionally adjusting MM, and BMC for LS bone area (Table 6.9) at
baseline and 2 years. There were no significant associations in boys apart from FFM
(p <0.05) at the 2 year measurement. Only FM at baseline and total BMC at 2 years
were associated with lung function in girls (p<0.05). Whole body BMD unadjusted
for height was also included so that this study is comparable with studies that have
not adjusted for height.

137
Table 6.9. Simple regression analysis of factors (adjusted for height)1 associated with forced expired volume in 1 sec standard deviation
score
Boys n=31 Girls n=38
B SEM t P r2
B SEM t P r2
Year 0
BMI SDS 0.30 0.32 0.94 0.355 0.004 0.43 0.25 1.76 0.087 0.055
Fat mass (kg) 0.01 0.13 0.10 0.919 0.067 0.23 0.11 2.21 0.034 0.075
Fat-free mass (kg) 0.02 0.17 0.11 0.912 0.067 -0.03 0.15 -0.23 0.820 0.055
Fat-free mass (kg)
-0.04 0.17 -0.23 0.818 0.022 -0.02 0.16 -0.11 0.911 0.084
Mineral mass (kg)2
1.79 2.42 0.74 0.465 0.040 1.97 2.08 0.94 0.352 0.056
DXA bone mineral content (kg)2
2.29 3.06 0.75 0.460 0.040 4.53 2.71 1.67 0.104 0.001
DXA bone mineral density (g/m3) 0.20 5.98 0.03 0.974 0.067 0.33 3.55 0.09 0.927 0.057
Year 2
BMI SDS 0.47 0.30 1.58 0.126 0.049 0.36 0.23 1.54 0.133 0.037
Fat mass (kg) 0.003 0.11 0.03 0.977 0.061 0.09 0.08 1.17 0.249 0.014
Fat-free mass (kg) 0.31 0.12 2.55 0.017 0.145 0.03 0.12 0.28 0.781 0.052
Fat-free mass (kg)
0.21 0.13 1.60 0.121 0.190 0.06 0.13 0.48 0.634 0.072
Mineral mass (kg)2
2.51 1.55 1.63 0.115 0.192 3.15 1.70 1.86 0.073 0.022
DXA bone mineral content (kg)2
3.12 2.00 1.56 0.131 0.183 4.87 2.01 2.42 0.021 0.084
DXA bone mineral density (g/m3) 7.09 5.14 1.38 0.179 0.009 6.73 6.03 1.12 0.272 0.018
SDS; standard deviation score, DXA; dual-energy X-ray absorptiometry, 1except BMI SDS,
2 additionally adjusted for lumbar spine bone area

138
6.6.5 Body composition assessed by simple techniques
Body composition assessed by SFT, BIA, DXA and TBW and a comparison with the
4CM is presented in Chapter 8.
6.7 Discussion
The findings of this analysis confirm the clear sex differences presented in Chapter 5
where deficits in FM and FFM including MM are apparent in the girls with CF
whereas the boys with CF have body composition much closer to that of controls.
The aims of this chapter were to test the hypotheses that; (1) there is no significant
difference in body composition at baseline but differences will be apparent over time,
(2) that specific components of body composition are associated with lung function
in children with CF and (3) that the conclusions are the same regardless of the mode
of analysis. This chapter relates to chapter 5 because it investigates the body
composition and lung function of children with CF at baseline, albeit a smaller
number of CF children compared to a larger number of control children. The
reduction in numbers of CF children is due to the fact that only children who have 2
complete 4CM measurements at baseline and 2 years are included. The reduced
number of boys in this baseline analysis as opposed to the baseline analysis in
Chapter 5 means that the average FFM has increased and average FM decreased in
boys although this does not affect the outcome of the group comparison. The group
mean for body composition variables in the CF girls are similar.
Analyses in this chapter are cross-sectional at baseline and 2 years using a control
group and using a large reference population. The control group comparison,
although smaller in number than the reference group has the advantage of being
contemporary although may not be considered ‘normal’, for example, control girls in
this study have on average 0.4 SDS greater weight and height than the 1990 UK

139
reference data. The group matching also allows for comparison of change over time
(Chapter 7). Comparison to a reference population assures that the children with CF
are compared to standardised controls but has the disadvantage that reference data
becomes out-of-date. The 1990 UK reference data used in this study for
anthropometric comparison was collected in 1988 and the body composition and SFT
data was collected from 2001-2007. However, in a clinical situation comparison
with a reference population is the most practical method.
Although one study reported that children with CF do not have delayed puberty (36)
others report delayed puberty (35;220). In this study the boys with CF have delayed
puberty compared to the healthy boys but surprisingly, although there are a few more
pre-pubertal CF girls at baseline, (68% compared to 61%) at aged 8-14 years there
are slightly more controls (29% control compared to 27% CF) that are pre-pubertal.
It is difficult to find an explanation since the CF girls are smaller with lower FMI and
FFMI SDS than control girls. If the CF and control girls are divided by Tanner stage
1 and 2 compared to Tanner stage 3 and above then the results are; stage 1 and 2, CF
66%, control 59%, Tanner stage ≥3, CF 34%, control 41%. This indicated that there
are more control girls in the later stages of puberty than girls with CF and this is a
stage when the effect of growth and development are the greatest. It is also possible
that the girls with CF may be overestimating their own development in line with that
of their peer group. An alternative explanation from an evolutionary biology
perspective would suggest that the less likely an organism is to live then the earlier
menarche occurs in order to produce offspring earlier (221).
6.7.1 Regarding hypothesis 1; that there will be no significant
differences in body composition at baseline but differences will
become apparent over time.
The findings that at baseline the girls with CF have altered body composition does
not support hypothesis 1 although the boys with CF appear to be similar to control
children. After 2 years boys with CF had a reduction in FFM and girls remain with
deficits of FM, FFM and MM.

140
In accord with previous research (64;72;100) both boys and girls with CF are short at
both time points. The smaller hip and mid-upper arm circumference of the children
with CF suggests they are less mature than their healthy counterparts.
All the children in this study had waist circumferences greater than the 1990 UK
reference data, however, the group mean was greater in the CF children compared to
controls, possibly reflecting inflammation and/or enlargement of the abdominal
organs. In the absence of higher FM by 4CM or raised SFT it is unlikely that this
large waist circumference is due to fat. Regional FM and FFM by DXA indicated
that boys with CF had more overall FFM and that the difference was totally in the
trunk at both time-points. Despite the girls with CF having similar FFM to controls
they also appeared to have much more FFM in the trunk and an equal deficit in the
limbs. Compared to controls the girls with CF also have a large deficit of FM in the
limbs (-0.7 kg baseline and -1.0 kg at 2 years). DXA regional soft tissue SDS would
aid the understanding of regional differences.
The reason for identifying high FFM in the trunk may be a true increase or due to
methodological problems. It is possible that increased FFM in the trunk is related to
bowel dysfunction; abdominal pain and discomfort are common in CF with long gut
transit times reported (222), sub-mucosal fibrosis and stasis of faecal material (223)
and thickened mucosal covering of the bowel (224) which are all possible reasons for
the enlarged bowel and waist circumference identified in this group. In addition other
organs may be enlarged; right ventricle enlargement as a result of pulmonary
hypertension and liver and spleen enlargement due to hepatobiliary obstruction
(225). One might suppose that since the children in this study are young the number
and severity of these symptoms will be limited; only 1 child had liver disease
diagnosed at baseline and 7 by the second measurement. However, it is also likely
that these problems are preceded by asymptomatic changes and these, combined with
inflammation and oedema may account for the distended abdomen.
Methodological problems may have some impact on these findings. DXA
measurements have been shown to be biased in extremes of fatness and thinness

141
(102;196) which may have several causes. First, an assumed constant for hydration
(226); second, subject size may influence bias through the effect of tissue depth
(196) with increasing tissue depth associated with increasing bias by DXA (227);
third, soft tissue distribution may affect accuracy because pixels containing bone
extrapolate soft tissue composition from adjacent regions which may have a different
composition of FM and FFM from the region overlying the bone (196). In the trunk
region there are many more bone to non-bone pixels than other parts of the body and
this, coupled with a distended abdomen and possible oedema may, in part explain the
findings of large increases in FFM in the trunk of children with CF. Comparative
studies between DXA and MRI may illuminate the question. However, partial
correlations suggest that the variability in the waist circumference of the children
with CF cannot be explained by FM and FFM to the same extent as in controls, (R2;
CF FM 67%, FFM 28% and controls FM 81%, FFM 36%). Body composition is not
exerting the same influence on waist circumference in CF children as in controls.
Once an adjustment for age, height and puberty has been made the boys with CF
differ from the controls at baseline having more FFM. At 2 years there is no longer a
significant difference in FFM except where the comparison is made using FFM
indexed and converted to SDS. This is an indication of the differing outcome
depending on whether raw body composition variables (adjusted for actual height),
indexed variables (adjusted for height2) or SDS are used in the analysis. These
findings are contrary to expectation, the boys with CF have more FFM at baseline
and at 2 years although no longer statistically significant. In this study the girls with
CF have a deficit of FM at baseline which appears stable over time. The girls with
CF group-mean FFMI SDS deteriorates over time although the mineral component is
stable and low suggesting deterioration in the non-mineral lean mass.

142
6.7.2 Regarding hypothesis 3, that the conclusions are the same
regardless of the mode of analysis.
The question of whether it is better to compare the CF children directly to a group of
controls or whether to compare to a larger reference population using SDS is
debatable. Comparison with a smaller contemporary control group has the advantage
of comparing two groups of children measured at a similar time and allows for
comparison of change in one group compared to change in the other over time.
Comparison with a reference population is preferable in a clinical setting.
Comparison between pair and group-match is difficult in this study because there is a
reduced number in the group-match. The boys at baseline in the pair-match (Chapter
5) are heavier and taller than the reduced number of boys in the group-match analysis
(Chapter 6). However, at both analyses they are short (pair-match, -0.41 height SDS,
group-match -0.51). The girls with CF have similar mean BMI SDS in the pair
(-0.33) and group (-0.26) analyses. The question of whether it is better to compare a
patient group (pair or group-match) to a control group or to a reference group is
inevitably affected by how typical the control group is. Clearly, the larger the
number of control children, the more likely their mean value is typical of healthy
children and therefore, the use of large reference populations, particularly when they
are in a similar ethnic group, era or geographic area has even greater benefits. Such
reference populations allow for the calculation of SDS thereby allowing comparison
of the child to a standard and allowing assessment of change over time. In addition,
comparison can still be made by pair or group analysis by first standardizing both
patient and controls to the large reference population by calculating SDS. Table 6.8
based on comparison of SDS against reference and group-match and without and
with adjustment for age, height and puberty indicated that in boys, different
outcomes are obtained dependent on whether adjustment for age, height and puberty
has been made. In the analyses of girls’ data the picture is less clear which may, in
part be due to the control girls being taller and heavier than average.

143
6.7.3 Regarding hypothesis 2, that specific components of body
composition are associated with spirometry in children with cystic
fibrosis
Girls had poorer lung function than boys, which deteriorated over two years. This
may be a reflection of their sub-optimal body composition and prognosis. In accord
with many previous studies FFM was significantly associated with lung function in
boys only at 2 years. There was no such relationship in girls with both FM at
baseline and total BMC at 2 years positively associated with FEV1 possibly a
reflection of, or a contribution to their poor nutritional status.
6.8 Study limitations
As acknowledged in the previous chapter I used predicted rather than measured lung
volume when calculating body volume by ADP. However, a study of children with
CF deriving FM from ADP concluded that there was no significant difference in FM
calculations between measured or predicted lung volumes (219).
Since exercise will affect the amount of lean tissue we repeated the analyses taking
into account parental reported exercise level; there was no difference in outcome.
However, the parental rating may be affected by differing expectations in healthy and
chronically ill patients and between the sexes. In future studies it will be informative
to use an objective measure of physical activity.
This study compares the same children at 6-12 and 8-14 years and therefore the
numbers are reduced from the original analysis of 85 to 69. However, this would be
sufficient to detect a 0.48 SDS difference between groups which is likely to be
clinically important.

144
6.9 Summary
There were clear sex differences at baseline, with CF boys having more FFM
and girls with CF have less FM and MM than the reference population. This
is consistent with the findings in the larger cohort presented in Chapter 5.
After 2 years FFMI SDS is lower in boys (although above zero) and the girls
remain stable for FM and MM but have lower non-osseus FFM.
Increased waist circumference in children with CF is accompanied by
increased FFM in the trunk as assessed by DXA in the absence of increased
FM by 4CM or SFT. The nature of abdominal distension may be better
identified using MRI.
The findings of this study are that, unlike previous research it is FM that relates
to lung function at baseline in the girls only. Consistent with previous studies I
found a relationship between FFM and lung function in boys at age 8-14 years.
Total BMC also related to lung function in 8-14 year old girls with CF.
The sub-optimal body composition in girls may be a reflection of their poor
lung function.
My findings do not support the hypothesis that the conclusions are the same
regardless of whether matched-pairs, group comparisons or comparison with a
reference population are used for comparison. As a consequence it is difficult to
compare the findings of studies using different methods of analysis and for
clinical practice the solution is likely to be a pragmatic one. Clinically, the
simplest method to identify individual children with sub-optimal body
composition and to monitor them over time is to use SDS.
The limitations of each method of analysis need to be acknowledged and the fact
that statistical significance does not necessarily equate to clinical significance
needs to be considered.

145
Chapter 7. Longitudinal comparison of two-year change in
body composition of children with cystic fibrosis with that
of healthy children and the relationship between change in
body composition and lung function in children with cystic
fibrosis.
7.1 Introduction
Although there are several reports of longitudinal growth (height and weight) in
children with CF (10;13;50;122;141) there are few studies that address the changes
in body composition over time (36;65;67;96) and none that use a ‘criterion’ body
composition technique. This chapter outlines the change in body composition over 2
years in CF children age 6-12 years using the 4CM and compares the change to that
of healthy children. The relationship between change in body composition and
change in lung function in CF children is also presented. The subjects and methods
are the same as those presented in the cross-sectional analysis (Chapter 6) and
Figure 7.1 shows the relationship between the analyses and the subjects in Chapters
5, 6 and 7.
Chapter 5 Chapter 6 Chapter 7
Figure 7.1. Description of mode of analyses and subjects in Chapters 5-7.
Longitudinal comparison
with reference data and
group-match analyses.
69 of 85 CF
72 of 85 Control + 21
Cross-sectional, comparison
with reference data and
group-matched analyses 69 of 85CF,
72 of 85Control + 21
Cross-sectional,
comparison with reference
data and pair-match
analyses 85 CF, 85 Control

146
The hypothesis addressed in this chapter is that; baseline and change in specific
components of body composition are associated with disease severity and predict
clinical outcome.
7.2 Study design
This is a longitudinal study comparing the 2 year change in body composition of
both children with CF and age matched (6-12 years at baseline) controls. Change
was investigated in both absolute and conditional (that is unrelated to the baseline)
terms. In addition, baseline and conditional change in lung function, measured on
the same day (or within 4 weeks if not possible) was related to conditional change in
body composition in the children with CF.
7.3 Recruitment and exclusion criteria
Children with CF were recruited from patients at GOSH and the control children
from an on-going study of healthy children at UCL, ICH. Details can be found in
Chapter 4.
7.4 Methods
Measures of anthropometry and BMC, TBW and densitometry for 4CM were
performed as described previously. LS and whole body BMC and BMD were measured
by DXA to assess bone status. Confounding factors such as pubertal status and activity
were assessed with questionnaires, the details of all these can be found in Chapter 4 and
Appendices 5 and 6. The children with CF also had lung function assessed, described in
Chapter 4.

147
7.5 Statistical analyses
7.5.1 Size adjustment and standard deviation score calculation
Characteristics of all the children were compared to 1990 UK reference data to
generate SDS for weight, height, BMI and waist circumference. Size adjustment of
body composition variables was made as described in 4.6.2. and SDS were
calculated compared to a contemporary reference population for FM, FFM, PM, MM
and SFT. Total and LS BMD SDS were generated from the Lunar Prodigy software
using machine reference data matched for age, sex and ethnic group and a size
adjusted BMAD SDS was calculated as described in 4.6.2. Conditional change in
anthropometric and body composition variables were calculated by generating a
prediction equation for each parameter using data from the controls and then
calculating the residuals (predicted – actual) for children with CF as described in
4.6.6. Conditional change in FEV1 was calculated using regression analysis in the
children with CF only.
7.5.2 Comparison of change in anthropometric and body
composition variables
Initial analysis indicated a strongly significant difference between the sexes and
therefore data for males and females were analysed separately.
Change between baseline and two years in CF and controls separately was
investigated; (i) using paired t-tests between baseline and 2 year variables in both CF
and control children (absolute change) and (ii) using one-sample t-tests for the
difference between conditional change (change other than that expected if the CF
child is tracking growth and body composition of the control group) and zero in CF
children only. Group means for absolute and conditional change would be similar in
the control children because the regression equation was derived from this group.

148
(iii) Difference in change (2 year – baseline) between CF and control children was
investigated using independent t-tests.
Summary of comparison of change analysis
1) CF absolute change 0-2 years paired t-test
2) Control absolute change 0-2 years paired t-test
3) CF conditional change 0-2 years 1 sample t-test
4) CF absolute change compared to control absolute change independent t-test
7.5.3 Effect of predictors of change on anthropometric and body
composition variables
To identify possible predictors of conditional change in body composition variables
for inclusion in the regression models, Pearson’s correlation and Spearman’s rho,
(for skewed data) was performed for data of children with CF. Factors included
were; spirometry, activity, anthropometric and body composition variables at
baseline and conditional change. In addition pubertal status at baseline and change
in pubertal status and genotype were included. Multiple backwards regression
analysis was used separately to investigate predictors of conditional change in FMI
or FFMI or MMI SDS.
A general linear model was used to investigate any significant effect of CF on
change in height, weight, BMI, FMI, FFMI or MMI SDS with the 2 year
measurement as the dependent variable and the baseline measurement as the
independent variable with condition (CF=1, control =0) as a fixed factor.
Considering the significant associations a separate general linear model was
performed to investigate any interactions between CF and baseline measurements.

149
Summary of effect of predictors analyses
1) Correlation analysis in CF children to identify possible predictors of
conditional change in body composition variables for inclusion in subsequent
multi-variant analyses.
2) Multiple backwards regression analysis to identify predictors of conditional
change in FMI SDS, FFMI SDS and MMI SDS in CF and control separately.
3) General linear model to investigate the possible effect of having CF on
absolute change in anthropometric and body composition variables.
4) Considering the results of 3), general linear model to test for any interaction
between having CF and the baseline measurement in relation to the final
measurement.
7.5.4 Spirometry
Correlation (Pearson’s for normally distributed and Spearman’s rho for skewed data)
analysis was used to identify significant associations between absolute change in
FEV1 SDS and baseline and conditional change in activity, anthropometric and body
composition variables, puberty and genotype. Significant factors were included in
regression analyses to investigate the relationship between body composition
variables and conditional change in FEV1 SDS in the children with CF. Conditional
change in FEV1 SDS was calculated from the CF children only because the control
children did not perform spirometry.

150
7.6 Results
7.6.1 Subjects
The same 69 (38 girls) CF and 93 (49 girls) control children, who all had 2 complete
4CM measurements and were included in the cross-sectional analysis of Chapter 6
were included in this analysis.
7.6.2 Change in anthropometry and body composition
Group absolute and conditional change in anthropometric and body composition
variables is shown in Table 7.1 (boys) and Table 7.2 (girls). Change in FMI SDS
(Figure 7.2) in children with CF was variable and a graph showing change in FFMI
SDS (Figure 7.3) indicates that many of the children have declining FFMI SDS.
7.6.2.1 Absolute change in body composition
For SDS, which are comparable over time, control boys showed upward centile
crossing in weight SDS (p<0.05) and SFT SDS (p=0.001) and downward centile
crossing for LS BMD SDS (p<0.05) but not size adjusted BMAD. Boys with CF
had, on average, downward centile crossing for waist SDS (p<0.05) and FFMI SDS
(p<0.01). Both control and CF girls showed upward centile crossing waist (p<0.01)
and SFT SDS (p<0.05). Table 7.3 shows the mean difference in absolute change (2
year – baseline) between CF and control children (CF – control). The significant
differences were, boys; age difference (mean (SD), CF; 2.08(0.13), control;
2.03(0.06)), waist SDS, (CF; -0.20 (0.46), control; 0.05 (0.45)), body volume, (CF;
6.25(3.07), control; 8.53(5.56)) and FFMI SDS, (CF;-0.35 (0.67), control; -0.05
(0.51)) and girls FFMI SDS, (CF; -0.14 (0.53), control; 0.11 (0.46).
7.6.2.2 Conditional change in body composition
Conditional change in control children is not presented in the tables 7.1 and 7.2
because, as expected, the group mean is approximately zero. Conditional change in

151
boys with CF indicated significantly lower than expected gain in BMI SDS, waist
SDS (p<0.01) and FFMI SDS (p<0.05), that is to say that they were not following the
control group pattern of growth and lean tissue acquisition. However, SFT SDS
gains were higher than expected (p=0.051). Girls with CF appear to be tracking the
control girls’ growth and body composition (albeit with lower values) apart from
values for FFMI SDS which appear to be reducing (p<0.001). They also have a
lower change in exercise time, an average of 1 hour 20 minutes less than the control
girls (p<0.05).

152
Table 7.1. Change between baseline and two years in boys
CF n=31 Control n= 44
Absolute change Conditional change Absolute change
Mean SD P Mean SD P Mean SD P
Age (y) 2.08 0.13 <0.001 2.03 0.06 <0.00
1 Weight SDS -0.04 0.49 0.682 -0.18 0.50 0.060 0.14 0.38 0.018
Height SDS 0.10 0.29 0.073 -0.01 0.29 0.784 0.09 0.34 0.079
BMI SDS -0.14 0.54 0.153 -0.28 0.57 0.010 0.10 0.53 0.211
Waist SDS -0.20 0.46 0.024 -0.26 0.46 0.004 0.05 0.45 0.443
4 skinfold thickness SDS1
0.06 0.61 0.565 0.21 0.58 0.051 0.29 0.53 0.001
LS bone mineral density SDS -0.10 0.47 0.197 0.02 0.43 0.806 -0.12 0.34 0.018
LS bone mineral apparent density SDS 0.10 0.43 0.254 0.16 0.46 0.072 -0.07 0.66 0.491
Fat mass index SDS 0.05 0.69 0.702 -0.07 0.60 0.534 0.11 0.64 0.279
Fat-free mass index SDS -0.35 0.67 0.007 -0.24 0.66 0.047 -0.05 0.51 0.517
Protein mass index SDS -0.25 1.15 0.236 -0.16 0.88 0.320 0.16 0.93 0.260
Mineral mass index SDS -0.11 0.44 0.171 -0.01 0.44 0.893 -0.01 0.49 0.893
FEV1 SDS -0.06 0.95 0.749
Activity (hours) -0.19 7.58 0.888 -0.27 5.33 0.783 0.80 5.26 0.322
SDS; standard deviation score, 1 n=30 for CF, LS; lumbar spine, bone mineral apparent density; size adjusted (bone area) bone mineral density, FEV1,
forced expiratory volume in 1 sec. P; paired t- test for absolute change and 1 sample t-test against zero for conditional change.

153
Table 7.2. Change between baseline and two years in girls
CF n= 38 Control n=49
Absolute change Conditional change Absolute change
Mean SD P Mean SD P Mean SD P
Age (y) 2.06 0.22 <0.001 2.04 0.14 <0.00
1 Weight SDS -0.01 0.43 0.866 -0.11 0.46 0.170 0.03 0.28 0.420
Height SDS 0.06 0.45 0.422 -0.15 0.47 0.060 0.10 0.39 0.077
BMI SDS -0.05 0.53 0.559 -0.10 0.54 0.261 0.01 0.35 0.799
Waist SDS 0.24 0.51 0.007 0.10 0.57 0.505 0.19 0.46 0.007
4 skinfold thickness SDS1
0.23 0.63 0.036 0.05 0.60 0.595 0.15 0.47 0.036
LS bone mineral density SDS -0.14 0.76 0.279 -0.17 0.74 0.176 0.025 0.59 0.768
LS bone mineral apparent density SDS 0.03 0.72 0.773 0.02 0.66 0.857 -0.01 0.54 0.890
Fat mass index SDS 0.08 0.70 0.473 0.05 0.72 0.688 -0.03 0.45 0.690
Fat-free mass index SDS -0.14 0.53 0.104 -0.30 0.54 0.001 0.12 0.45 0.075
Protein mass index SDS 0.01 1.21 0.965 -0.13 1.09 0.466 0.15 0.85 0.216
Mineral mass index SDS 0.16 0.74 0.185 -0.04 0.69 0.715 0.10 0.50 0.154
FEV1 SDS -0.49 0.92 0.003
Activity (hours) -1.37 4.56 0.073 -1.28 3.23 0.019 -0.06 3.96 0.914
SDS; standard deviation score, 1 n=36 for CF and 48 for control, LS; lumbar spine, bone mineral apparent density; size adjusted (bone area) bone
mineral density, FEV1, forced expiratory volume in 1 sec. P; paired t- test for absolute change and 1 sample t- test against zero for conditional change.

154
Figure 7.2. Individual change in fat mass index standard deviation score from baseline to two years

155
Figure 7.3. Individual change in fat-free mass index standard deviation score from baseline to two years

156
Table 7.3. Difference in change (cystic fibrosis (CF) minus control) between CF and control children.
Positive values denote larger change in children with CF
Boys (CF 31, control 44) Girls (CF38, control 49)
Mean SEM P Mean SEM P
Age yrs 0.05 0.02 0.030 0.02 0.04 0.501
Weight SDS -0.18 0.10 0.081 -0.04 0.08 0.562
Height SDS 0.03 0.07 0.959 -0.02 0.09 0.646
BMI SDS -0.25 0.13 0.056 -0.07 0.09 0.502
Waist SDS -0.25 0.10 0.022 0.07 0.11 0.638
LS BMD SDS 0.02 0.09 0.768 -0.14 0.14 0.271
LS BMAD SDS 0.17 0.14 0.456 0.06 0.13 0.135
FMI SDS -0.06 0.15 0.698 0.08 0.12 0.464
FFMI SDS -0.32 0.14 0.029 -0.26 0.10 0.017
PMI SDS -0.41 0.24 0.093 -0.14 0.22 0.518
MMI SDS -0.10 0.19 0.368 0.04 0.14 0.659
Sum4 skinfold thickness SDS -0.23 0.13 0.091 0.11 0.12 0.352
Activity (hours) -0.99 1.48 0.507 -1.37 0.90 0.157
Independent t-test, mean difference is CF minus control, which were as follows; boys, age difference (mean(SD), CF; 2.08(0.13), control;
2.03(0.06)), waist SDS, (CF; -0.20 (0.46), control; 0.05 (0.45)), body volume, (CF;6.25(3.07), control; 8.53(5.56)) and FFMI SDS,
(CF;-0.35 (0.67), control; -0.05 (0.51)).
Difference in girls FFMI SDS was CF; -0.14 (0.53), control; 0.11 (0.46).

157
7.6.3 Predictors of conditional change in fat mass index, fat-free
mass index and mineral mass index standard deviation scores
7.6.3.1 Choice of variables.
Conditional change in FMI, FFMI, and MMI SDS were chosen as the dependent
variables (DV). Although MM is part of FFM it was included in the analysis
because the girls with CF showed a deficit at baseline. It is more usual to assess
bone mineralisation using BMD SDS obtained by DXA, however, MMI SDS from
the 4CM is included in the analysis for consistency with FM and FFM. Initial
regression analysis in girls suggested that FMI SDS predicts conditional change in
FFMI SDS and FFMI SDS predicts conditional change in FMI SDS. However, if
there is measurement error in FM there will be an equal and opposite error in FFM
since they are both calculated using the 4CM and this may confound the analysis.
Therefore, values of FFM from DXA were used to investigate predictors of 4C FM
and DXA FM to investigate 4C FFM and MM.
Choice of independent variables to enter in a regression model was decided on the
basis of correlation analyses presented in Table 7.4 for children with CF.

158
Table 7.4. Correlation analyses of potential predictors of body composition variables in children with cystic fibrosis.
Conditional
FMI SDS
Conditional
FFMI SDS
Conditional
MMI SDS
Boys Girls Boys Girls Boys Girls
R P R P R P R P R P R P
Weight SDS year 0 NS NS NS NS NS NS
Conditional weight 0.60 <0.001 0.63 <0.001 0.58 <0.001 NS 0.40 <0.05 0.54 <0.01
Height SDS year 0 NS NS NS NS NS NS
Conditional height NS NS NS NS 0.43 <0.05 0.46 <0.01
BMI SDS year 0 NS NS NS NS NS NS
Conditional BMI SDS 0.63 <0.001 0.76 <0.001 0.57 <0.001 NS 0.36 <0.05 NS
Puberty year 0 NS NS NS NS NS NS
Change in puberty NS NS NS NS NS NS
FMI SDS year 0 NS NS NS NS NS NS
Conditional FMI SDS NS NS NS NS
FFMI SDS year 0 NS NS NS NS NS NS
Conditional FFMI SDS NS NS 0.59 <0.001 NS
MMI SDS year 0 NS NS NS 0.36 <0.05 NS NS
Conditional MMI SDS NS NS 0.59 <0.001 NS
Activity year 0 NS NS NS NS NS NS
Hours activity year 0 NS NS NS NS NS NS
Change in hours activity NS NS NS NS NS NS
FEV1 SDS year 0 NS NS 0.42 <0.05 NS 0.38 <0.05 NS
Conditional FEV1SDS 0.41 <0.05 NS NS NS NS NS
Genotype NS NS NS NS NS NS
Correlation analysis is Pearson’s for normally distributed and Spearman’s rho for skewed data, puberty is classed as Tanner stage 1 (pre-pubertal)
compared to stages 2-5. Change in puberty from baseline to 2years is; (1) Tanner stage 1, no change, (2) Change from stage 1, (3) no change from stage
2-5. Activity classed as; less than, same as or more than peers. Genotype is homozygous versus heterozygous ΔF508 (48 v 17)

159
There was correlation between conditional weight and conditional BMI and the
body composition variables as expected, since weight is the total of FM and FFM
and BMI = FMI + FFMI. Weight and BMI were not included in the model.
Although change in pubertal status did not show any correlation with the body
composition variables in this sample, it was included in the regression analysis
because pubertal development affects body composition. The independent variables
included in the backward regression analysis were therefore;
Table 7.5. Dependent and independent variables used in regression analysis to
identify predictors of body composition variables.
Dependent variable
Independent
variable
Conditional change
in FMISDS
Conditional change
in FFMI SDS
Conditional change
in MMI SDS
Baseline height
SDS Yes Yes Yes
Conditional change
in height SDS Yes Yes Yes
Baseline FMI SDS Yes Yes Yes
Conditional change
in FMI SDS Yes Yes
Baseline FFMI
SDS Yes Yes
Conditional change
FFMI SDS Yes
Baseline MMI SDS Yes
Conditional change
MMI SDS
Change in pubertal
stage Yes Yes Yes
In addition the analysis in children with CF included baseline and conditional change
in FEV1 SDS.

160
7.6.3.2 Conditional change in body composition of children with cystic
fibrosis.
Significant predictors from separate multiple backward regression analyses are
presented in Table 7.6 (boys) and Table 7.7 (girls). Conditional change in height
was a positive predictor of conditional change in MMI SDS in all children with CF.
There were no identified predictors of conditional change in FMI or FFMI SDS in
girls.
Table 7.6. Regression analysis of conditional change in; fat-mass index or fat-free
mass index or mineral mass index standard deviation scores in boys with cystic
fibrosis.
Boys n=31
B 95% confidence interval P
Conditional change in 4C FMI SDS (DV)
Conditional change in FEV1SDS 0.27 0.04, 0.51 0.024
Adjusted R2
0.14
Conditional change in 4C FFMI SDS (DV)
DXA conditional change in FMI SDS 0.45 0.09, 0.80 0.016
FFMI SDS year 0 -0.23 -0.42, -0.05 0.016
Adjusted R2
0.37
Conditional change in 4C MMI SDS (DV)
Conditional change in height SDS 0.69 0.21, 1.18 0.007
FEV1 SDS year 0 0.12 0.03, 0.21 0.013
Adjusted R2
0.30
Table 7.7. Regression analysis of conditional change in; fat-mass index or fat-free
mass index or mineral mass index standard deviation scores in girls with cystic
fibrosis.
Girls n=38
B 95% confidence interval P
Conditional change in 4C FMI SDS (DV)
No significant predictors
Conditional change in 4C FFMI SDS (DV)
No significant predictors
Conditional change in 4C MMI SDS (DV)
Height SDS year 0 0.23 0.07, 0.39 0.007
Conditional change in height SDS 0.62 0.26, 0.99 0.001
MMI SDS year 0 -0.21 -0.38, -0.04 0.018
Adjusted R2
0.40

161
7.6.3.3 Absolute change in body composition of control children.
The group mean conditional change in the control group will have a value close to
zero (because the regression equation is generated from the control data) and
therefore finding factors that predict such a small value are unrealistic. In the control
group I used regression analysis to investigate possible predictors of absolute change
in FMI, FFMI and MMI SDS. None of the factors considered were significant for
the body composition variables for boys, the data for girls is shown in (Table 7.8).
Table 7.8. Regression analysis of absolute change in; fat mass index or fat-free mass
index or mineral mass index standard deviation scores in control girls.
Girls n=49
B 95% confidence interval P
Absolute change in 4C FMI SDS (DV)
FMI SDS year 0 -0.13 -0.26, -0.003 0.046
DXA absolute change in FFMI SDS -0.31 -0.60, -0.03 0.032
Adjusted R2 0.16
Absolute change in 4C FFMI SDS (DV)
FFMI SDS year 0 -0.19 -0.33, -0.05 0.010
Adjusted R2 0.14
Absolute change in MMI SDS (DV)
Height SDS year 0 0.17 0.06, 0.29 0.004
DXA FMI SDS year 0 0.11 0.01, 0.21 0.033
MMI SDS year 0 -0.15 -0.25, -0.05 0.003
Adjusted R2
0.27
7.6.4 Effect of cystic fibrosis on change in anthropometric and body
composition variables
In order to determine whether having CF impacts on change in growth and body
composition variables (height, weight, BMI, FMI, FFMI or MMI SDS) regression
analyses were done with the 2 year measurement as the dependent variable, the
baseline measurement as the covariant and condition (CF=1, control=0) as a fixed
factor and the findings are presented in Table 7.9. Boys and girls were analysed
separately. Condition was only significant for FFMI SDS in girls (p<0.01) and
approached significance for BMI SDS in boys (p=0.06).

162
Table 7.9. General linear model for effect of condition (cystic fibrosis=1, control =
0) on growth and body composition
Girls (CF=38, control =49)
B 95% confidence interval P
FFMI SDS year 2 (DV)
FFMI SDS year 0 0.88 0.76, 0.99 <0.001
Condition 0 0.30 0.09, 0.50 0.006
Adjusted R2
0.75
Boys (CF=31, control =44)
B 95% confidence interval P
BMI SDS year 2 (DV)
BMI SDS year 0 1.01 0.86, 1.16 <0.001
Condition 0 0.25 -0.01, 0.51 0.060
Adjusted R2
0.71
Estimated means (SE) FFMI SDS in girls at 2 years after adjusting for baseline
values was; CF -0.33(0.08) and controls -0.04 (0.07) and for BMI SDS at 2 years
after adjusting for baseline values in boys; CF -0.08(0.10) and controls 0.17(0.08).
A separate general linear model was performed to test for any interaction between
CF and baseline measurement of BMI SDS or FFMI SDS. There were no significant
interactions.
7.6.5 Relationship between two-year change in body composition
and two-year change in spirometry
Mean FEV1 SDS was; CF boys, mean (SD), baseline -1.10 (1.54) and 2 years -1.15
(1.56) (Table 7.3) and CF girls, baseline -1.56 (1.44) and 2 years -2.05 (1.58) (Table
4). There was a significant deterioration in the girls’ FEV1 (p<0.01) between
baseline and 2 years of 0.5 SDS. Boys and girls 2 year change in FEV1 SDS
compared to 2 year change in either FMI SDS or FFMI SDS is presented in Figures
7.4 and 7.5. Correlations between change in FEV1 SDS and change in FMI SDS
were boys; R = 0.51, p<0.01, girls; 0.12, NS and between change in FEV1 SDS and
change in FFMI SDS, boys; R = 0.07, NS, girls; -0.001, NS. Correlations between
conditional change in FEV1 SDS and conditional change in either FMI or FFMI SDS
gave similar results.

163
a)
Figure 7.4 Two year change in FEV1 and fat mass index SDS in a) boys and b) girls
with cystic fibrosis.
b)

164
a)
Figure 7.5 Two year change in FEV1 and fat-free mass index SDS in a) boys and b)
girls with cystic fibrosis.
b)

165
In the analysis of factors predicting change in body composition variables
conditional change in FEV1 SDS was a significant predictor of conditional change in
FMI SDS and baseline FEV 1 SDS predicted conditional change in MMI SDS in boys
only. From a clinical perspective it is helpful to know if any body composition,
anthropometric or other variables predict FEV1 SDS. Significant correlations were
therefore investigated and presented in Table 7.10.
Table 7.10. Correlation between potential predictors and absolute change in FEV1
standard deviation scores in children with cystic fibrosis
Boys Girls
R P R P
Weight SDS Yr 0 -0.18 0.341 0.14 0.401
Conditional change in weight SDS 0.36 0.050 0.14 0.420
Height SDS Yr 0 -0.24 0.201 0.11 0.520
Conditional change in height SDS 0.22 0.236 0.20 0.232
BMI SDS Yr 0 -0.02 0.927 0.15 0.372
Conditional change in BMI SDS 0.28 0.139 0.04 0.805
FMI SDS Yr 0 -0.29 0.120 0.01 0.950
Conditional change in FMI SDS 0.47 0.009 0.12 0.493
FFMI SDS Yr 0 0.19 0.313 0.23 0.181
Conditional change in FFMI SDS 0.07 0.697 0.06 0.723
MMI SDS Yr 0 0.03 0.865 -0.10 0.549
Conditional change in MMI SDS 0.15 0.445 0.31 0.069
LS BMD SDS Yr 0 0.08 0.688 0.09 0.608
Conditional change in LS BMD SDS 0.24 0.209 0.25 0.144
LS BMAD SDS Yr0 0.27 0.152 0.07 0.691
Conditional change in LS BMAD SDS 0.29 0.123 0.10 0.580
4 skinfolds SDS Yr 0 -0.07 0.716 0.09 0.611
Conditional change in 4 skinfolds SDS 0.21 0.265 -0.02 0.910
Pre-pubertal Yr 0 -0.09 0.636 0.08 0.664
Pre-pubertal Yr 2 -0.12 0.522 0.002 0.990
Change in pubertal status 0.13 0.491 -0.05 0.761
Activity level Yr 0 0.36 0.054 0.16 0.351
Activity (hrs) 0.10 0.591 0.21 0.224
Conditional activity (hrs) 0.26 0.168 0.14 0.431
Genotype -0.23 0.230 -0.03 0.879
Considering the significant associations above, a regression analysis with conditional
change in FEV1 SDS as the dependent variable and conditional change in weight

166
SDS, FMI SDS, MMI SDS and activity and baseline FEV1 SDS and activity as the
independent variables was performed in the sexes separately. Secondly, conditional
change in FFMI SDS was substituted for MMI SDS in a separate analysis because
many previous studies have identified a relationship between lean tissue and lung
function. The significant predictors of conditional change in FEV1 are presented in
Table 7.11.
Table 7.11. Regression analysis of conditional change in FEV1 standard deviation
scores and potential predictors in children with cystic fibrosis.
Boys (n=31)
B 95% confidence interval P
Conditional change in FEV1 SDS (DV)
Conditional change in FMI SDS 0.69 0.20, 1.17 0.007
Change in activity (hrs) 0.07 0.02, 0.13 0.014
Adjusted R2
0.34
Girls (n=38)
B 95% confidence interval P
Conditional change in FEV1 SDS (DV)
Conditional change in MMI SDS 0.49 0.03, 0.96 0.037
Adjusted R2
0.12
However, in a clinical situation it is not practical to calculate conditional change and
therefore absolute change is more likely to be used. The analysis was repeated with
absolute change in FEV1 as the dependent variable and baseline and change in
weight, FMI SDS, MMI SDS (or FFMI SDS) and activity and baseline FEV1 SDS as
the independent variables (Table 7.12). No significant predictors were identified in
girls.
Table 7.12. Regression analysis of absolute change in FEV1 standard deviation
scores and potential predictors in boys with cystic fibrosis.
Boys (n=31)
B 95% confidence interval P
Absolute change in FEV1 SDS (DV)
Absolute change in FMI SDS 0.69 0.23, 1.15 0.004
Adjusted R2
0.23

167
The relationship between spirometry and body composition and how one influences
the other is conceptualized in the following diagram.
Figure 7.6. Conceptual framework for the relationship between body composition
and spirometry over time.
I was interested to see to what degree, if any, baseline body composition SDS
predicts change in FEV1 SDS compared to the opposite situation where baseline
FEV1 SDS may predict change in body composition SDS. Using regression analysis
with no adjustment I found no significant models of baseline FMI or FFMI SDS
predicting change in FEV1. For the opposite direction only baseline FEV1
significantly predicted change in FFMI SDS in boys such that a 1 SDS higher FEV1
at baseline predicted an additional 0.18 FFMI SDS change with a standard error of
the mean of 0.07. Using conditional change in body composition and FEV1 did not
change the outcome. Data from the regression analyses may be found in Appendix
10. Therefore, in boys with CF change in FM predicts change in lung function and
baseline lung function predicts change in FFM.

168
7.6.6 Relationship between activity and change in body composition
In this study physical activity was assessed in two ways; (1) as hours per week of
vigorous activity (sports and physical education) and (2) as the parent’s rating of
their child compared to other children of the same age (less than, equal to or more
than peers).
Table 7.13. Activity rating of children with cystic fibrosis
Baseline Year 2
Boys Girls Boys Girls
Mean SD Mean SD Mean SD Mean SD
Hours activity per week 8.10 4.29 8.13 4.65 9.21 5.19 6.76 3.48
Activity level
Less than peers 12.9% 7.9% 22.6% 13.2%
Equal to peers 48.4% 50.0% 29.0% 57.9%
More than peers 38.7% 42.1% 48.4% 28.9%
Baseline activity and change in activity did not have an association with change in
any body composition variables. However, there was a correlation between activity
level at 2 years and conditional change in FFMI SDS (r=0.55, p<0.001) and MMI
SDS (r= 0.38, p<0.05) in boys with CF only. Using a general linear model adjusting
for pubertal status at 2 years and conditional change in FEV1, the estimated marginal
means for the relationship between activity level and conditional change in FMI SDS
was 0.68 SDS difference between the most active and least active categories. The
most active group have a less than expected change in FMI SDS than if they were
growing according to the control group and the least active have a higher than
expected gain in FMI SDS. For conditional change in FFMI SDS the most active
have, on average 0.94 SDS difference from the least active and were tracking a
centile compared to the healthy boys, whereas the least active have a less than
expected change in FFMI SDS. There was no relationship between activity and
change in body composition in the girls.

169
7.7 Discussion
In this analysis I have investigated changes in body composition variables and
compared changes in children with CF and controls, and addressed the question of
whether baseline value and changes in components of body composition are
associated with clinical outcome as assessed by spirometry in children with CF. It is
important to emphasise that it is not possible to determine cause and effect in my
observational analysis for example, does improved lung function lead to an
improvement in body composition or vice versa?
7.7.1 Body composition
When comparing patients to a group of control children one would hope that the
controls have a ‘normal’ growth pattern. The controls in this study did not change
SDS for body composition components however the boys increased in weight and
SFT SDS and the girls in waist and SFT SDS. In accord with trends presented in
other studies the boys with CF have a significant reduction in FFMI SDS over 2
years both in absolute terms and compared to that in control children. However
some studies suggest that deficits occur later in adolescence (36;100). The use of
simple, easily available measurements of anthropometry could lead to the conclusion
that the girls with CF are fatter after 2 years because waist and SFT SDS increased.
However, increases in waist SDS in children with inflammatory conditions cannot be
assumed to be as a result of central fat deposition since distention of the abdomen
may be caused by enlarged organs and/or oedema. The fact that 4C FM did not
increase over this period, remaining significantly low, contradicts this supposition.
The girls with CF were depleted in FFM and both boys and girls with CF show
downward centile crossing compared to the controls. The fact that both boys and
girls are not sustaining FFMI SDS over time is likely to be associated with declining
lung function even at this young age (10;116) although this is only apparent at this
time in the girls of this study. The literature reports declining lung function in both
sexes (10;116), and it is likely that other factors also impact on lung function. The
boys in this study perform more vigorous exercise than the girls and this may either

170
contribute to or be in response to their better lung function. The pattern of change in
FFMI can be seen graphically in Figure 7.3; the graph for boys shows that most are
showing a reduction or staying the same, only 4 show a good positive change.
However, the age range of the boys is lower than that of the girls and the graph for
girls indicates that many have declining or the same SDS till around age 11 and
thereafter those with declining and those with improving SDS are about equal. Of
the 7 girls with increasing FFMI SDS after age 11, 6 were classed at Tanner stage 2
or 3, of the 7 remaining stable or declining in FFM, 5 were Tanner stage 1 and 2
stage 2 at baseline. These findings are in accord with reports of normal growth
patterns with increases in FFM, in particular MM in the later stages of puberty in
girls (228). Despite the children with CF not maintaining FFMI SDS this is not due
to declining MM.
In this study, conditional change in body composition was significantly associated
with activity level at 2 years in CF boys, the most active having a difference of 0.68
FMI and 0.94 FFMI SDS compared to the least active group. Conditional SDS for
FMI were negatively and for FFMI positively associated with activity level.
Conditional change in body composition in girls was not associated with activity
level in girls which may, in part, be due to the girls exercising at lower levels than
boys. Mothers of boys with CF rated 48% as having greater physical activity than
peers whereas only 29% of girls with CF were rated as higher. Indeed, the CF girls
were also less active than control girls who maintain the time spent in vigorous
activity from baseline to 2 years whereas the girls with CF had a mean reduction of 1
hour 22 minutes per week. In addition, the fact that the girls have poorer lung
function may be a contributory factor to a reduction of vigorous physical activity.
An objective measure of physical activity would be more accurate than parental
assessment.
It is useful to identify any baseline measurement that predicts change so that
treatment may be targeted appropriately. In addition, change over a period of time
may predict future outcomes and be useful for clinicians. Original height and change
in height above that expected are positive predictors of conditional change in MMI
SDS in boys and girls. This is not surprising since the growth spurt experienced in
mid-puberty is accompanied by a period of peak bone accretion. Typically children

171
with CF have delayed puberty which may, in some part, account for any deficit in
MM, although surprisingly, the girls with CF in this study report similar numbers at
Tanner stage 1 (26.3%) to control girls (28.6%) at aged 8-14 years. However, the
percentage of girls in Tanner stage 3 and above is CF 32.3% and controls 40.8%,
showing that there are more control girls in the mid-pubertal stage, a period during
which peak growth occurs in girls (228).
For boys with CF, baseline FFMI SDS predicted change above the expected in FFMI
SDS; those with the lowest baseline score showing most ‘catch-up’ growth (or least
decline). In addition, a 1 SDS change in FEV1 above that expected for the group was
associated with a 0.27 SDS increase above the expected for FMI SDS. There were
no predictors of conditional change in FFMI SDS despite FFM SDS in girls
decreasing compared to the controls, however, a lower MMI SDS at baseline was
associated with ‘catch-up’ (or less decline) in MM. The fact that low FFM at
baseline in boys predicts the greatest ‘catch-up’ of SDS is encouraging since it is
predominantly FFM that is acquired during normal growth and maturation in boys.
Although girls lowest in FM did not show the most ‘catch-up’, those lowest in MM
did show most ‘catch-up’.
When using SDS in children who are tracking a centile there would be little change
in scores and this may in part explain the lack of predictors of absolute change in
body composition variables in the control boys. However, predictors of change in
MMI SDS in control girls were similar to predictors of change in MMI SDS in girls
with CF (although CF analyses were based on conditional change), those who were
tallest at baseline had the greatest increase in MMI SDS and those with lowest MMI
SDS at baseline had the greatest increase. Unlike the girls with CF, the higher the
FMI SDS at baseline the higher the change in MMI SDS. It is likely that high FM is
acting as a proxy for puberty since the post pubertal females are likely to have the
more positive change in FM. Conversely, low FFMI SDS at baseline is associated
with lowest change in FFM in control girls. Separate general linear models to
examine the effect of having CF on change in body composition revealed that the CF
girls are significantly different from the control girls in respect of FFM but for boys
the only factor that approached significance was BMI SDS despite their reduction in
FFM.

172
7.7.2 Spirometry
Gender differences in lung function in CF are a moot point with some studies
reporting no difference (13;121;229) and others, greater decline in either males
(67;111) or females (10;39). In this study girls, even at a young age had poorer lung
function than boys and it deteriorated over two years. This may be a reflection of
their sub-optimal body composition and is not surprising given the poorer prognosis
in females and may, in some part be related to girls being less active than boys (121).
In a clinical situation it is difficult to calculate conditional change and absolute
change is more likely to be considered. Using absolute change the only factor
predicting FEV1 SDS is change in FMI SDS in boys only with a 1 SDS change in
FMI being associated with a 0.7 change in FEV1 SDS. However, when conditional
change in FEV1 SDS is considered, that is change after removing the effect of the
baseline measurement, a large change in activity of 10 hours per week is associated
with a 0.7 increase in FEV1 SDS in addition to the association with FM. There is a
weak association between conditional change in FEV1 SDS and conditional change
in MMI SDS in girls. There are several reports of an association between FFM and
lung function in the literature (65;230) and in particular bone (36;119) but only
Ahmed et al (111) has found a relationship between FM and FEV1 in boys, however,
it is not clear whether this is a relationship between change in FM and change in lung
function and only a crude prediction technique (SFT) had been used. There may be
several explanations for the fact that in this study a relationship between change in
FM and change in lung function was found in boys. I have used a ‘criterion’
technique whereas many studies use inappropriate techniques to predict FFM such as
SFT (121;231), the age range is narrow, the sexes are analysed separately and an
adjustment for short stature has been made. The differing findings dependent on
whether absolute or conditional change are used are important when considering the
outcome since a 1 SDS change in FEV1 has a different impact dependent on the
baseline value. In this chapter I have investigated the relationship between lung
function and body composition but it is impossible to say to what degree one is a
result of, or influences the other. A randomized controlled trial of a treatment that

173
either impacts on body composition or lung function would be necessary to
investigate the relationship further. However, simple regression analyses to
investigate whether either baseline body composition predicts change in FEV1 or
whether baseline FEV1 predicts change in body composition revealed that only
baseline FEV1 SDS predicted change in FFMI SDS such that a 1 SDS higher FEV1
predicted a 0.18 higher FFMI SDS at 2 years in this group of boys with CF. This of
course does not prove cause and effect but is interesting in the debate about the
relationship between lung function and body composition. In summary, in this group
of boys with CF increased change in FM predicted increased change in lung function
and baseline lung function predicted change in MM. Since those boys who were
exercising the most at 2 years had better FFM it is possible that those with good lung
function are more likely to exercise which is likely to impact positively on FFM.
7.8 Study limitations
Ideally, conditional change in FEV1 SDS would be calculated by generating a
regression equation in the healthy children. Unfortunately, the control children did
not undergo lung spirometry, however, the conditional change calculated in the CF
group represents change that is not associated with the baseline FEV1.
Children with CF can become ill and quickly change in their appetite and exercise
ability. When I asked about the typical amount of time spent in vigorous physical
activity it is likely that, to some degree, the answer will be shaped by the child’s
current medical condition. I have examined change over 2 years by measuring the
children at baseline and 2 years and therefore these measurements represent a
‘snapshot’ in time, with some children fluctuating in body composition, lung
function and activity level and others remaining more stable. Without more frequent
measurements which may be onerous to the child and family it is not possible to
define the pattern of body composition in the interim.
There are many factors that impact on growth and body composition in children with
CF. No account of nutritional intake, cortico-steroid use, lung infections and hospital
admissions have been accounted for in this study. However, obtaining accurate

174
records of clinical details was difficult in some of these children who are managed
predominantly by their local hospital paediatrician. The use of FEV1 allows for an
objective measure of ‘health’ although in some children, particularly the very young
the results are dependent on the child’s motivation. However, the use of FEV1 as a
clinical indicator is typical of many studies and allows for comparison.
7.9 Summary
In this chapter I have investigated change in body composition and lung function in
children with CF over a 2 year period.
Both boys and girls were downward centile crossing compared to control
children in respect of FFM.
There is an indication that FFM is increasing in some of the older girls in the
later stages of puberty but this needs to be confirmed with larger numbers as
the children become older.
Boys who are low in FFM and girls who are low in MM at baseline show the
most ‘catch-up’ (or least decline) in SDS. FFM in boys and MM in girls are
the tissues that are predominantly acquired during puberty.
Change above that expected for FM in boys and MM in girls was associated
positively with a greater conditional change in lung function (more than the
rest of the group). If absolute change is considered, only change in FM in
boys is related to change in lung function which is contrary to the literature.
Level of activity at baseline was not associated with later body composition
but in boys with CF those rated most active at 2 years had a lower than
expected gain in FM and a gain in FFM similar to controls whereas the least
active at 2 years had a greater than expected gain in FM and lower than
expected FFM.
Baseline FEV1 predicts change in FFMI SDS in boys.
Lung function is poorer in girls and may reflect their sub-optimal body
composition which is not surprising given the poorer prognosis in females.
The fact that the girls exercise less than the boys may be one explanation for
their deteriorating lung function or alternatively poorer lung function may be

175
affecting their ability to exercise. It is also likely that sub-optimal body
composition has an impact on lung function and exercise ability.

176
Chapter 8. An assessment of clinical tools for measuring
body composition in children with cystic fibrosis using
standard deviation scores
8.1 Introduction
In Chapter 3 I discussed body composition techniques and the advantages and
disadvantages of each technique. Only cadaver analysis may be considered a gold
standard for body composition measurement and all in-vivo techniques do not
measure body composition directly but predict it from the measurement of other
body properties. In vivo techniques therefore suffer from 2 forms of error,
methodological error in collecting the data and error from the theoretical assumptions
used to convert the data to body composition components (142). The simple
techniques make different assumptions which may affect their suitability in different
conditions and therefore no one technique is appropriate for all subjects at all times.
The 4CM is considered a criterion method because the assumptions made are
minimal, merely that there is a constant relationship between osseous and non-
osseous mineral. In this chapter I will assess the accuracy of the simple techniques
compared to the 4CM using SDS for each technique derived from the same reference
population when measuring children with CF.
Comparison of my data with those of previous studies is complicated by the various
techniques used to assess body composition. Although all techniques suffer from
assumptions about the nature of components of body composition, the simple
prediction and 2CM methods rely heavily on assumptions about the nature of the
FFM which, in children, is constantly changing with maturation and growth.
Hydration, for example, which is highly influential on the outcome in the simpler
models, is not constant across age and sex and does not change linearly from birth to
adulthood. In addition, error is introduced if published constants are used to convert,
for example, TBW to FFM, since in this example, the hydration factor is the mean
value by age and sex that has been derived from healthy populations and therefore

177
assumes that the individual has an average hydration. Comparison between
techniques is important for research purposes but also clinically because it is helpful
to know whether the techniques are suitable in a given patient group or are
interchangeable.
Using the same methods as those used in this study we have recently published
reference data on body composition of 533 children and young people aged 4 to 22
which allows for the calculation of SDS for the 4CM and simpler techniques. In this
chapter I will address the question of whether the same result is achieved using SDS
regardless of the technique used and in addition, to compare longitudinal change in
SDS by the different techniques.
I will also present the findings of a ‘wisdom of crowds’ (218) approach which
postulates that by aggregating several independent predictions the resultant
prediction will be more accurate and precise. If this is the case and if the prediction
is comparable to, or better than that of, for example, a DXA scan it would allow
much simpler, cheaper assessments of the body composition of children with CF and
thereby aid clinical assessment. Even with less accuracy the approach may be useful
when more sophisticated equipment is not available.
8.2 Study design
This is a cross-sectional study comparing the outcome of simple body composition
techniques with that of the 4CM in SDS for all children recruited to the study and for
all time-points. In addition, the longitudinal measurements by different techniques
are compared in the same cohort as that presented in Chapter 7.
8.3 Recruitment and exclusion criteria
Children with CF were recruited from patients at Great Ormond Street Hospital for
Children; details can be found in Chapter 4. In addition, for the cross-sectional

178
analyses a further 27 adolescents with CF who were part of another study using the
same techniques were included to extend the age range.
8.4 Methods
Measures of anthropometry and BMC, TBW and densitometry for 4CM were
performed as described previously.
8.5 Statistical analyses
Data for males and females and for every available time-point were pooled for purposes
of the analysis. The accuracy of the simpler methods was assessed using the criterion
4CM as the reference method for adiposity (4C FM SDS) and leanness (4C FFM SDS).
DXA FM, SFT and BMI SDS were used as simple measures of adiposity and DXA
FFM, TBW and BIA (height2/Z) SDS were used as simple measures of leanness.
8.5.1 Size adjustment and standard deviation score calculation
Characteristics of all the children were compared to 1990 UK reference data to
generate SDS for weight, height, and BMI. SDS compared to our contemporary
reference population for body composition variables were calculated for; (i) absolute
values of 4C FM, 4C FFM, DXA FM, DXA FFM, DXA limb FM, DXA limb FFM,
DXA trunk FM, DXA trunk FFM, TBW, BIA and SFT and (ii) size adjusted
(described in Chapter 4) 4C FMI, 4C FFMI, DXA FMI, DXA FFMI, DXA limb
FMI, DXA limb FFMI, DXA trunk FMI and DXA trunk FFMI. All SDS were
calculated using the lmsGrowth program©(210).
Significance of the mean value from zero was tested using independent t-tests, and
paired t-tests were used to compare the mean difference of the simpler methods with
that of the 4CM.

179
8.5.2 Comparison of the simpler body composition techniques and
the 4-component model
The method of Bland and Altman (217) was used to assess agreement between
absolute values for FM by DXA (whole body and regional), SFT and BMI SDS with
4C FM SDS and for agreement between the absolute values for FFM by DXA
(whole body and regional), TBW and BIA SDS with 4C FFM SDS. In addition,
height adjusted FMI by DXA (whole body and regional) was assessed for agreement
with 4C FMI and FFMI by DXA (whole body and regional) was assessed for
agreement with 4C FFMI SDS. The mean difference between techniques (bias;
simple method - 4CM) and the ± 2 SD of the difference between techniques (limits
of agreement) were calculated. The bias was then tested for significance from zero
by using an independent t- test. The extent to which the magnitude of the bias was
related to the magnitude of the variable was calculated as the correlation between the
difference and the mean of the measured values. Correlations were performed
unadjusted, adjusted for age and adjusted for age and sex. All analyses were
performed using Statistical Package for Social Sciences 18.0 (SPSS Inc., Chicago)
and p<0.05 was considered significant.
8.5.3 Predictors of bias
Backward regression analyses were used to identify significant predictors of the bias
in FM(I) and FFM(I) SDS. Analyses were performed with age, sex and BMI SDS as
explanatory variables with sex coded as male = 1 and female = 2.

180
8.5.4 Calculation of a correction factor for bio-electrical impedance
Preliminary analysis suggested that a correction factor could be applied to the BIA
SDS to improve accuracy (see 8.6.3). I calculated a correction factor in 2 ways;
firstly using regression analysis to investigate the relationship between bias in BIA
(compared to 4CM) and BIA SDS in the whole group of BIA measurements (n=141)
and using the value for the slope as the predicted average of the group. Each
individual BIA SDS was then corrected as follows; average corrected BIA SDS =
actual BIA SDS - predicted average bias in BIA SDS. Secondly, the relationship
between bias in BIA SDS (compared to 4CM) and BIA SDS was investigated taking
into consideration possible significant predictors of bias. I used backward linear
regression with independent variables: age, sex (male=1, female=2), puberty (pre
pubertal=1, post pubertal =2) and BMI SDS in a subset of measurements that were
not used in the longitudinal analyses (n=60). The resultant equation was used to
correct each individual’s BIA SDS as follows; individual corrected BIA SDS =
actual BIA SDS – predicted individual bias in BIA SDS.
.
8.5.5 Longitudinal comparison
The ability of the simpler techniques to assess longitudinal change was compared to
change assessed by the 4CM using SDS that have not been adjusted for height.
Unadjusted (non-indexed) variables were chosen because all simple techniques apart
from DXA do not generate FM or FFM SDS, rather SDS of that particular technique
for example TBW SDS or SFT SDS and therefore it would be inappropriate to adjust
for height. Two-year change in anthropometric and body composition SDS were
compared to zero change using independent t-tests. Bland-Altman analyses were
used to compare the bias in change (change by simple technique – change by 4CM)
of body composition variables with limits of agreement of ±2SD. The degree to
which the magnitude of the bias was related to the magnitude of the variable was
assessed with correlation analyses.

181
8.5.6 Categorisation of ‘abnormal’ standard deviation scores
A ‘normal’ body composition SDS was classed as an SDS between -2 and +2, since
these cut-offs are commonly used in clinical practice to define ‘normality’. The
ability of each technique to categorise ‘normal’ and ‘abnormal’ body composition
was assessed by cross-tabulation of the simple technique with the 4CM and
calculation of Cohen’s kappa coefficient (κ) and % agreement. Whilst % agreement
is a measure in absolute terms, Cohen’s kappa also takes into account the probability
of agreement occurring by chance, a value of 1 indicating perfect agreement.
8.5.7 ‘Wisdom of crowds’ approach to determine whether aggregate
predictions improve accuracy.
The ‘wisdom of crowds’ approach utilises the simplest, readily available prediction
techniques and may be useful when more sophisticated techniques are not available.
This approach is based on the theory that using many predictions will give an answer
closer to the truth than using one or two predictions (a full explanation may be found
in 4.6.8). To test this hypothesis in this particular population I used 12 different
prediction equations based on height, weight, SFT and BIA to calculate FM for each
child and then aggregated them to compare with the 4CM. Values of TBW or body
density from some equations were converted to FFM using our published data on
density and hydration (184). FM was calculated as the difference between FFM and
weight and vice versa. Only equations that spanned at least 6 of the 6-17yrs of those
subjects in this study were selected although most covered the whole range. Only
one equation was specifically derived for children with CF (Johnston). Only children
with a value for FM from the 12 separate equations were used in the analysis, the
number being reduced by lack of BIA data in several and the inability to calculate
some predictions in the younger children for whom the equations were not
appropriate.

182
8.6 Results
8.6.1 Subjects
Data from all children measured from 2001 to 2011 in this study and another of older
children with CF measured using the same techniques, was included in the analysis.
Of the 127 children enrolled, 81 children had subsequent re-measurements of
between 1 and 5 times. 28 measurements were not included due to inadequate data
or failed 4CM. Characteristics of the children are shown in Table 8.1, the age range
was 6.7 to 17 years and the mean value for the group by sex indicates that they are
both short and light for their age. Girls with CF had significantly low values for all
body composition variables by all methods apart from having significantly high
mean DXA trunk FFMI. FMI and FFMI SDS by 4CM were not different from zero
in boys with CF although 4C FM and FFM SDS (unadjusted for height) and many of
the simpler techniques suggest they had a depletion of both FM and FFM with the
exception of higher trunk FMI and FFMI SDS by DXA.
8.6.2 Accuracy of simpler body composition techniques compared to
the 4-component model
The simpler body composition techniques were compared to 4C FM and FFM in
terms of mean bias and limits of agreement in individuals. Table 8.2 and Figure 8.1
(measures of ‘fatness’) and Figure 8.2 (measures of leanness) summarise the mean
bias and limits of agreement for each method. Graphs showing the individual biases
may be found in Appendix 12.

183
Table 8.1. Anthropometry and body composition standard deviation scores by sex
Boys Girls
Measurement
method SDS 1 N Mean SD P
Ref P
4CM N Mean SD P
Ref P
4CM
Age (y) 124 11.8 2.68 142 11.9 2.63
Weight 124 -0.23 1.10 0.023 142 -0.57 1.18 <0.001
Height 124 -0.52 1.08 <0.001 142 -0.57 1.14 <0.001
Measure of ‘fatness’
BMI 124 0.10 1.07 0.324 <0.001 142 -0.32 1.09 0.001 <0.001
4C FM 124 -0.32 1.00 0.001 142 -0.75 1.09 <0.001
4C FMI 124 -0.09 1.18 0.108 142 -0.57 1.05 <0.001
DXA FM 124 -0.29 0.92 0.001 0.394 142 -0.73 0.95 <0.001 0.521
DXA FMI 124 -0.05 0.90 <0.001 0.264 142 -0.46 0.93 <0.001 0.307
DXA limb FM 124 -0.58 1.83 0.001 0.033 142 -1.45 1.91 <0.001 <0.001
DXA limb FMI 124 -0.36 1.81 0.027 <0.001 142 -1.20 1.82 <0.001 <0.001 DXA trunk FM 124 0.02 0.91 0.983 <0.001 142 -0.42 0.95 <0.001 <0.001
DXA trunk FMI 124 0.14 0.89 0.081 <0.001 142 -0.28 0.92 <0.001 <0.001
Bicep SFT 123 -0.02 0.86 0.818 <0.001 142 -0.23 0.85 0.002 <0.001 Tricep SFT 124 -0.02 0.95 0.829 <0.001 141 -0.46 0.96 <0.001 <0.001 Subscapular SFT 124 -0.05 0.98 0.539 <0.001 142 -0.28 1.05 0.002 <0.001 Supra-iliac SFT 123 0.07 0.98 0.464 <0.001 134 -0.31 1.07 0.001 <0.001 Sum 4 SFT 122 -0.01 0.85 0.865 <0.001 133 -0.32 0.87 <0.001 <0.001 1 Standard deviation score except for age, P
Ref; independent t-test for difference from zero, CF compared to reference data (54;155;209),
P4CM
;paired t-test simple technique compared to 4-component model, BMI; body mass index, 4C; 4-component, FM; fat mass, FMI; fat
mass index (FM/height2), DXA; dual-energy X-ray absorptiometry, SFT; skinfold thickness. Table continues on next page.

184
Table 8.1 continued. Anthropometry and body composition standard deviation scores by sex
Boys
Girls
Measurement
method SDS 1 N Mean SD P
Ref P
4CM N Mean SD P
Ref P
4CM
Measure of ‘leanness’
4C FFM 124 -0.44 1.09 <0.001 142 -0.83 1.21 <0.001
4C FFMI 124 0.07 1.13 0.482 142 -0.39 1.00 <0.001
DXA FFM 124 -0.85 1.10 0.527 <0.001 142 -1.36 1.16 <0.001 <0.001 DXA FFMI 124 -0.09 1.18 0.406 <0.001 142 -0.57 1.05 <0.001 <0.001
DXA limb FFM 124 -0.85 1.10 <0.001 <0.001 142 -1.36 1.16 <0.001 <0.001 DXA limb FFMI 124 -0.70 1.06 <0.001 <0.001 142 -1.21 1.11 <0.001 <0.001 DXA trunk FFM 124 -0.09 1.14 0.374 <0.001 142 -0.40 1.09 <0.001 <0.001
DXA trunk FFMI 124 0.65 1.21 <0.001 <0.001 142 0.28 0.94 0.001 <0.001
TBW 124 -0.48 1.09 <0.001 0.075 142 -0.84 1.13 <0.001 0.580
BIA 65 -0.44 1.05 0.001 0.001 76 -1.16 1.21 <0.001 <0.001 1 Standard deviation score except for age, P
Ref; independent t-test for difference from zero, CF compared to reference data, P
4CM ;paired
t-test simple technique compared to 4-component model, 4C; 4-component, FFM; fat-free mass, FFMI; fat-free mass index
(FFM/height2), DXA; dual-energy X-ray absorptiometry, TBW; total body water, BIA; bio-electrical impedance.

185
Table 8.2. Bland-Altman analysis of mean bias in fat mass and fat-free mass standard deviation scores by simple body composition
techniques compared to the 4-component model.
Measurement method SDS N Mean
bias1
95% Limits of
agreement P
bias R P
correlation
Measure of ‘fatness’
DXA fat mass 266 0.15 ±0.71 <0.001 -0.279 <0.001
DXA fat mass index 266 0.13 ±0.71 <0.001 -0.251 <0.001
DXA limb fat mass 266 0.02 ±0.74 0.295 -0.294 <0.001
DXA limb fat mass index 266 -0.001 ±0.80 0.958 -0.233 <0.001
DXA trunk fat mass 266 0.16 ±0.37 <0.001 -0.282 <0.001
DXA trunk fat mass index 266 0.16 ±0.42 <0.001 -0.228 <0.001
Bicep skinfold 265 0.42 ±1.35 <0.001 -0.331 <0.001
Tricep skinfold 265 0.29 ±1.33 <0.001 -0.142 0.021
Subscapular skinfold 266 0.37 ±1.32 <0.001 -0.072 0.245
Supra-iliac skinfold 257 0.42 ±1.39 <0.001 0.001 0.982
Sum 4 skinfold 255 0.38 ±1.04 <0.001 -0.350 <0.001
BMI 266 0.42 ±1.42 <0.001 0.049 0.429
1 Bias is the difference (simple technique – 4-component model (4CM)), 95% limits of agreement ; ±2SD, DXA; dual-energy X-ray
absorptiometry, BMI; body mass index, Pbias
;independent t-test compared to zero, R; Pearson’s correlation, Pcorrelation
; paired sample t-test
between the bias and the mean of simple technique and 4CM.

186
Table 8.2 continued. Bland-Altman analysis of mean bias in fat mass and fat-free mass standard deviation scores by simple body
composition techniques compared to the 4-component model.
Measurement method SDS N Mean
bias1
95% Limits of
agreement P
bias R P
correlation
Measure of ‘leanness’
DXA fat-free mass 266 -0.11 ±0.67 0.002 0.209 0.001
DXA fat-free mass index 266 -0.17 ±0.88 <0.001 0.114 0.064
DXA limb fat-free mass 266 -0.47 ±0.80 <0.001 0.096 0.121
DXA limb fat-free mass index 266 -0.80 ±1.26 <0.001 0.049 0.424
DXA trunk fat-free mass 266 0.20 ±0.39 <0.001 0.004 0.947
DXA trunk fat-free mass index 266 0.31 ±0.63 <0.001 -0.002 0.977
Total body water 266 -0.02 ±0.46 0.111 0.014 0.819
Bio-electrical impedance 141 -0.24 ±0.92 <0.001 0.003 0.975
Corrected bio-electrical impedance2
141 0.41 ±0.92 <0.001 0.003 0.975
Corrected bio-electrical impedance3
81 0.001 ±0.80 0.986 -0.055 0.629
Combined DXA and BIA 141 -0.07 ±0.53 0.560 -0.082 0.337 1 Bias is the difference (simple technique – 4-component model (4CM)), 95% limits of agreement; ±2SD, DXA; dual-energy
X-ray absorptiometry, BMI; body mass index, 2Corrected BIA SDS; BIA SDS – predicted average bias of the group calculated by regressing BIA
SDS on bias BIA SDS, 3Corrected BIA SDS; BIA SDS – predicted bias calculated by regressing BIA SDS on bias BIA SDS adjusting for age and
BMI SDS, Pbias
; independent t-test compared to zero, R; Pearson’s correlation, Pcorrelation
; paired sample t-test between the bias and the
mean of simple technique and 4CM.

187
Figure 8.1. Bias and limits of agreement (±2SD) for ‘fatness’ by simple techniques compared to the 4–component model(4CM;(simple
technique SDS – 4CM FM SDS). All values are SDS, DXA; dual-energy X-ray absorptiometry, BMI; body mass index. Asterisks denote
biases that were significantly different from the 4CM; * p<0.001.

188
Figure 8.2. Bias and limits of agreement (±2SD) for ‘leanness’ by simple techniques compared to the 4-component model (4CM;
simple technique SDS – 4CM FFM SDS). All values are SDS, DXA; dual-energy X-ray absorptiometry, BIA; bio-electrical impedance.
Asterisks denote biases that were significantly different from the 4CM, * p<0.005.

189
8.6.2.1 Measures of ‘fatness’
Compared to 4C FM SDS, DXA provided the most accurate measurement with
lowest limits of agreement with a mean whole body bias of 0.15 (p<0.001) and limits
of agreement of ±0.71. However, although DXA trunk showed a similar bias
(0.16±0.37, P<0.001), DXA limb FM SDS showed insignificant bias from the 4CM
(0.02) with limits of agreement of ±0.74. Children with CF tend to be short for their
age and therefore the relationship between height-adjusted DXA and 4C FMI SDS
was also examined and the results were similar.
BMI significantly overestimated FM SDS with wide limits of agreement (0.42±1.42.
p<0.001). All SFT SDS showed a significant bias and wide limits of agreement,
(0.29-0.42±1.32-1.39). The mean of 4 SFT SDS improved the limits of agreement
slightly but still showed a large significant bias (0.38±1.04).
8.6.2.2 Measures of ‘leanness’
Measurement of FFM SDS by DXA showed a small significant bias, underestimating
by, on average 0.11 SDS with limits of agreement of ±0.67. Regional DXA FFM
SDS gave a greater significant bias which was positive for trunk FFM SDS (mean
bias ±2SD, 0.20±0.39) and negative for limb FFM SDS (-0.47±0.80). Adjusting
DXA FFM for height compared to 4C FFMI SDS increased the bias and limits of
agreement.
Compared to 4C FFM, TBW SDS provided the most accurate and precise value of
FFM SDS, with an insignificant bias and narrow limits of agreement (-0.02±0.46).
When compared to the 4CM, BIA SDS significantly underestimated FFM SDS by
0.24 SDS and with limits of agreement of ±0.92.
Bland-Altman correlations were used to test whether the bias for each technique is
related to the magnitude of the mean FM and FFM (Table 8.2). For DXA FM, bicep
SFT, sum of 4 SFT and DXA FFM there was a highly significant correlation
(p<0.001). The correlation was less but significant for tricep SFT. For all measures

190
of lean except DXA whole body FFM there was no correlation between the
magnitude of FFM and the bias. When age and sex were accounted for there was no
difference in the findings (Appendix 13).
8.6.3 Predictors of the bias in fat mass and fat-free mass standard
deviation scores
Multiple regression analyses were used to identify significant predictors of the bias
in FM and FFM SDS (Table 8.3). Possible predictors considered were age, gender,
pubertal stage and BMI. Pubertal stage (pre-pubertal v pubertal) was not a
significant factor of bias for any technique. The predictive value of the models in
explaining the bias was generally low with the adjusted R2 not exceeding 0.19 except
in the case of DXA FMI and DXA limb FM where the predictive value was 72% and
68% respectively. There was no single variable that was consistently the most
significant predictor of bias across all measurement techniques. Age was
significantly positively associated with DXA FMI, limb FM and BIA biases and
negatively associated with bicep and tricep SFT and DXA whole body and trunk
FFMI biases. The association of gender with bias was variable indicating no
consistent trend for a bias in either FM or FFM in either sex. BMI showed a
significant positive association with DXA whole body FMI, limb FM and negative
association with bicep and tricep SFT and DXA trunk FFM(I).
BIA is a readily available simple technique that, although biased compared to 4C
FFM SDS, displays no relationship in the data between the magnitude of the bias and
magnitude of SDS. This allows for the calculation of a correction factor which may
be calculated by adjusting each individual by the mean bias for the group or,
considering the fact that age is a significant predictor of bias, taking into account
possible predictors. Regression analysis between bias in BIA (compared to 4CM)
and BIA SDS in the whole group of BIA measurements (n=141) gave a value for the
slope of -0.173 which was used as the mean value correction factor for each
individual’s BIA SDS. When the corrected BIA SDS was compared to 4C FFM SDS

191
there was an increase in the bias compared to uncorrected BIA SDS. Secondly, the
relationship between bias in BIA SDS and BIA SDS was investigated taking into
consideration possible significant predictors of bias in 61 children whose data was
not included in the longitudinal analysis. Only age and BMI SDS were significant
and included in the final equation for prediction of bias which was tested in the
remaining 81 measurements. The standard error of the estimate was calculated for
the model to indicate accuracy in individuals. The resultant equation was;
Predicted bias in BIA SDS = -0.783 + 0.155(BIA SDS) + 0.058(age) – 0.176 (BMI
SDS) Equation 8.1
This model has a standard error of the estimate of 0.44 SDS and explains only 20%
of the variation in bias in BIA SDS. Using the above equation a correction was made
in the remaining 81 measurements (Table 8.2) and there was no significant bias
compared to the 4CM for the corrected BIA SDS values. The characteristics of the
group with no BIA data, those used to generate the equation and those used to test
the equation can be found in Appendix 14.
Mindful of the ‘wisdom of crowds’ approach I was interested to see if combining
DXA and corrected BIA would give a lower bias and limits of agreement than for
each technique separately and therefore I calculated the mean SDS (DXA + BIA)/2
and compared that to the 4CM (Table 8.2). The bias of the combined techniques
remained similar to that of corrected BIA and improved compared to the DXA bias
but more importantly the limits of agreement were reduced to ±0.53 in the combined
SDS as opposed to DXA (±0.67) and BIA (±0.80) separately.

192
Table 8.3. Predictors of bias for different simple body composition measurements of (a) fat mass SDS and (b) fat-free mass SDS compared to
the 4-component model.
(a) Bias compared to 4-component fat mass
Measurement
method SDS
Age Sex BMI SDS
B 95%CI P B 95%CI P B 95%CI P Adjusted R2
Measure of ‘fatness’
DXA fat mass 0.005 -0.011,
-0.022 0.512 -0.011
-0.099,
0.077 0.809 -0.023
-0.063,
0.017 0.261 -0.004
DXA fat mass index 0.035 0.013,
0.058 0.002 -0.115
-0.237,
0.008 0.066 0.714
0.658,
0.770 P<0.001 0.718
DXA limb fat mass 0.039 0.015,
0.064 0.002 -0.145
-0.278,
-0.012 0.033 0.713
0.652,
0.773 P<0.001 0.684
DXA limb fat mass index -0.013 -0.031,
0.005 0.162 0.063
-0.035,
0.161 0.208 -0.031
-0.076,
0.013 0.168 0.011
DXA trunk fat mass 0.007 -0.003,
0.016 0.179 -0.004
-0.056,
0.047 0.870 -0.020
-0.043,
0.004 0.101 0.008
DXA trunk fat mass index 0.007 -0.003,
0.016 0.168 0.031
-0.109,
0.173 0.241 -0.008
-0.031,
0.016 0.533 0.005
Bicep skinfold -0.034 -0.062,
-0.006 0.017 0.117
-0.032,
0.267 0.124 -0.256
-0.324,
-0.187 P<0.001 0.191
Tricep skinfold -0.035 -0.064,
-0.005 0.022 -0.072
-0.231,
0.087 0.373 -0.161
-0.233,
-0.088 P<0.001 0.068
Subscapular skinfold -0.029 -0.059,
0.001 0.058 0.190
0.029,
0.350 0.021 -0.043
-0.116,
0.031 0.255 0.029
Supra-iliac skinfold -0.003 -0.036,
0.029 0.842 0.026
-0.148,
0.200 0.771 -0.059
-0.139,
0.020 0.144 -0.002
Sum 4 skinfold -0.023 -0.046,
0.001 0.061 0.074
-0.053,
0.200 0.252 -0.122
-0.179,
-0.064 P<0.001 0.073
BMI -0.046 -0.096,
0.003 0.065 -0.410
-0.674,
-0.152 0.002 0.041
Each line gives the results for a different multiple regression model. Sex coded as male=1, female=2

193
Table 8.3 continued
(b)Bias compared to 4-component fat-free mass
Measurement
method SDS
Age Sex BMI SDS
B 95%CI P B 95%CI P B 95%CI P Adjusted R2
Measure of ‘leanness’
DXA fat-free mass 0.005 -0.010,
0.021 0.492 -0.025
-0.108,
0.058 0.549 0.003
-0.035,
0.041 0.873 -0.008
DXA fat-free mass index -0.024 -0.044,
-0.004 0.019 -0.020
-0.127,
0.088 0.718 0.001
-0.042,
0.056 0.767 0.012
DXA limb fat-free mass 0.004 -0.014,
0.022 0.663 -0.102
-0.201,
-0.004 0.041 0.028
-0.017,
0.073 0.225 0.015
DXA limb fat-free mass index -0.002 -0.031,
0.028 0.911 -0.038
-0.195,
0.119 0.635 0.017
-0.055,
0.089 0.636 -0.009
DXA trunk fat-free mass -0.003 -0.012,
0.005 0.444 0.016
-0.030,
0.063 0.488 -0.047
-0.068,
-0.026 <0.001 0.064
DXA trunk fat-free mass index -0.025 -0.039,
-0.011 <0.001 0.014
-0.059,
0.088 0.699 -0.079
-0.113,
-0.045 <0.001 0.098
Total body water 0.009 -0.002,
0.019 0.115 0.023
-0.034,
0.080 0.435 -0.003
-0.029,
0.023 0.803 0.002
Bio-electrical impedance 0.060 0.033,
0.088 <0.001 -0.091
-0.238,
0.056 0.221 -0.037
-0.104,
0.030 0.278 0.122
Each line gives the results for a different multiple regression model. Sex coded as male=1, female=2.

194
8.6.4 Comparison of longitudinal change in body composition by the
simpler techniques compared to change assessed by the 4-component
model
The group mean increased by (mean±SD); 0.20±0.67, (p=0.016) SDS for 4C FM and
decreased by 0.13±0.50, (p=0.048) SDS for 4C FFM in the 2 year period (Table
8.4). The increase in SDS for 4C FM was replicated most closely by DXA trunk FM
(0.17±0.53, p= 0.01) and the decrease in FFM SDS by 4CM was also identified by
whole body and regional DXA FFM SDS and TBW SDS.
To investigate the difference between the simpler techniques and the 4CM for
quantifying change in SDS a Bland-Altman analysis was preformed (Table 8.5 and
Figures 8.3 and 8.4) with bias (change by simple technique SDS – change by 4C
SDS), mean ([simple technique SDS + 4C]/2) and limits of agreement of ±2SD.
BMI, bicep SFT and uncorrected BIA SDS were the only techniques showing a
significant bias for measuring change compared to the 4CM. Corrected BIA SDS
had insignificant bias. Limits of agreement for measuring change with DXA were
wide; 1SDS for FM and 0.6 SDS for FFM, although combining DXA and corrected
BIA SDS improved the limits of agreement compared to DXA on its own from 0.6
SDS to 0.3 SDS. The magnitude of the bias was significantly inversely related to
change in FM for BMI and DXA FM and there was a positive relationship between
the bias and the magnitude of change in TBW SDS.

195
Table 8.4. Baseline measurements and change in longitudinal measurements using standard deviation scores
Measurement method SDS1
Baseline Two year change
N Mean SD Mean SD Range Pchange-zero
Age (y) 69 9.34 1.55 2.08 0.13 1.84 2.50 <0.001
Weight 69 -0.33 1.06 -0.02 0.45 -1.41 1.24 0.677
Height 69 -0.55 1.07 0.08 0.38 -1.15 0.96 0.106
Measures of ‘fatness’
4CM fat mass 69 -0.64 0.99 0.20 0.67 -1.53 1.98 0.016
DXA fat mass 69 -0.49 0.92 0.13 0.54 -1.19 1.33 0.058
DXA limb fat mass 69 -0.60 0.91 0.14 0.54 -0.95 1.28 0.033
DXA trunk fat mass 69 -0.35 0.92 0.17 0.53 -1.20 1.27 0.010
Bicep skinfold thickness 69 -0.09 0.78 0.03 0.74 -1.90 2.10 0.723
Tricep skinfold thickness 68 -0.30 0.99 0.14 0.68 -1.40 1.60 0.104
Subscapular skinfold thickness 69 -0.21 0.95 0.07 0.81 -1.70 2.70 0.467
Supra-iliac skinfold thickness 66 -0.28 1.04 0.26 0.70 -1.50 2.60 0.003
Sum 4 skinfold thickness 65 -0.24 0.33 0.15 0.61 -1.30 1.55 0.193
BMI 69 -0.01 0.94 -0.09 0.54 -1.37 1.23 0.157
Measures of ‘leanness’
4C fat-free mass 69 -0.50 1.08 -0.13 0.50 -1.21 1.01 0.048
DXA fat-free mass 69 -0.61 1.13 -0.15 0.55 -1.78 1.38 0.039
DXA limb fat-free mass 69 -1.01 1.11 -0.08 0.50 -1.46 1.08 0.166
DXA trunk fat-free mass 69 -0.07 1.10 -0.17 0.61 -1.93 1.44 0.027
Total body water 69 -0.56 1.16 -0.09 0.60 -1.25 1.89 0.029
Bio-electrical impedance 32 -0.77 1.08 0.13 0.55 -0.92 1.32 0.193
Corrected bio-electrical impedance 32 -0.38 1.01 0.03 0.51 -1.01 1.15 0.739 1 Standard deviation score apart from age, 4CM; 4-component model, DXA; dual-energy X-ray absorptiometry, BMI; body mass index,
Pchange - zero
; paired t-test of change compared to zero, corrected bio-electrical impedance is individual bias in BIA SDS corrected for age and BMI SDS.

196
Table 8.5. Bias and limits of agreement of simpler methods compared to the 4-component model for change in fat mass and fat-free
mass standard deviation scores.
Measurement method SDS N Bias1 95% Limits
of agreement P
bias R P
correlation
Measures of ‘fatness’
BMI 69 -0.29 ±0.94 <0.001 -0.317 0.008
DXA fat mass 69 -0.08 ±1.00 0.214 -0.295 0.014
DXA limb fat mass 69 -0.06 ±0.98 0.324 -0.294 0.014
DXA trunk fat mass 69 -0.03 ±1.02 0.619 -0.304 0.011
Bicep skinfold thickness 69 -0.17 ±1.32 0.037 0.118 0.336
Tricep skinfold thickness 68 -0.06 ±1.32 0.473 0.002 0.989
Subscapular skinfold thickness 69 -0.13 ±1.38 0.122 0.214 0.077
Supra-iliac skinfold thickness 66 0.04 ±1.20 0.583 0.032 0.801
Sum 4 skinfold thicknesses 65 -0.06 ±1.04 0.356 -0.160 0.204
Measures of ‘leanness’
DXA fat-free mass 69 -0.02 ±0.60 0.578 0.162 0.183
DXA limb fat-free mass 69 0.04 ±0.68 0.308 0.007 0.953
DXA trunk fat-free mass 69 -0.04 ±0.70 0.360 0.325 0.006
Total body water 69 0.04 ±0.62 0.351 0.271 0.024
Bio-electrical impedance 32 0.19 ±0.72 0.005 0.260 0.151
Corrected bio-electrical impedance2
32 0.07 ±0.68 0.283 0.027 0.884
Combined DXA and BIA 32 0.03 ±0.34 0.283 -0.156 0.394 1 Bias is the difference (simple technique – 4-component model (4CM)), 95% limits of agreement; ±2SD, DXA; dual-energy X-ray absorptiometry, BMI; body
mass index, BIA; bio-electrical impedance. 2Corrected BIA SDS; BIA SDS – predicted bias calculated by regressing BIA SDS on bias BIA SDS adjusting for age
and BMI SDS. Pbias
; independent t-test compared to zero, R; Pearson’s correlation, Pcorrelation
; paired sample t-test between the bias and the mean of simple
technique and 4CM.

197
Figure 8.3. Bias and limits of agreement (±2SD) for change in ‘fatness’ by simple techniques compared to the 4-component model
(4CM; change by simple technique SDS – change by 4CM FM SDS). All values are SDS, DXA; dual-energy X-ray absorptiometry,
BMI; body mass index. Asterisks denote biases that were significantly different from the 4CM, * p<0.05, ** p<0.001.

198
Figure 8.4 Bias and limits of agreement (±2SD) for change in ‘leanness’ by simple techniques compared to the 4-component model
(4CM;change by simple technique SDS – change by 4CM FFM SDS). All values are SDS, DXA; dual-energy X-ray absorptiometry,
BIA; bio-electrical impedance. Asterisks denote biases that were significantly different from the 4CM, * p<0.005.

199
8.6.5 Assessment of the ability of each technique to distinguish
‘normal’ and ‘abnormal’ body composition in clinical practice.
The ability of each simple technique to identify ‘normal’ and ‘abnormal’ body
composition (normal defined as ±2 SDS 4C FM or 4C FFM) was examined by %
agreement and Cohen’s Kappa coefficient (Table 8.6). DXA showed the highest
agreement (96.2%) and kappa value (0.73) with 4C FM SDS. Although agreement
for SFT and BMI was high (91-94%) the kappa coefficient which takes account of
chance agreement was much lower at 26-44%.
Agreement of simple techniques with 4C FFM indicated that TBW had the highest
agreement (97 %) and kappa value 83%. Whole body DXA FFM and FFMI agreed
with 4C FFM and FFMI SDS by approximately 96% with a kappa value of 76.5%.
The ability of regional FFM to agree with 4C FFM was reduced with kappa values of
0.57 for limb and 0.71 for trunk and reduced much further when size adjusted; limb
0.33 and trunk 0.34. Corrected BIA SDS had slightly better agreement with 4C FFM
than unadjusted BIA (72 v 69%) and combined DXA and corrected BIA SDS a
similar agreement to DXA on its own.

200
Table 8.6. Cross-tabulation statistics for agreement in ‘abnormal’ scores assessed by simpler techniques compared to the 4-CM.
Measurement method (SDS) N % agreement k se % abnormal
by 4CM
% abnormal
by other
technique
Measure of ‘fatness’
DXA fat mass 266 96.2 0.73 0.08 8.6 6.4
DXA fat mass index 266 96.6 0.69 0.10 6.8 4.9
DXA limb fat mass 266 95.8 0.72 0.08 8.6 7.5
DXA limb fat mass index 266 96.6 0.71 0.09 6.8 5.6
DXA trunk fat mass 266 94.8 0.64 0.09 8.6 7.1
DXA trunk fat mass index 266 95.8 0.65 0.10 6.8 5.6
Bicep skinfold 265 92.4 0.26 0.11 8.6 1.9
Tricep skinfold 265 91.3 0.37 0.10 8.7 6.0
Subscapular skinfold 266 92.8 0.39 0.11 8.6 3.8
Supra-iliac skinfold 257 93.8 0.44 0.11 8.2 3.5
Sum 4 skinfold 255 93.0 0.29 0.12 8.2 2.0
BMI 266 91.7 0.35 0.11 8.6 4.9
Measure of ‘leanness’
DXA fat-free mass 266 94.8 0.76 0.06 11.3 14.3
DXA fat-free mass index 266 97.0 0.77 0.08 6.0 8.3
DXA limb fat-free mass 266 88.0 0.57 0.07 11.3 21.9
DXA limb fat-free mass index 266 86.8 0.33 0.08 5.7 15.9
DXA trunk fat-free mass 266 94.3 0.71 0.07 11.3 10.9
DXA trunk fat-free mass index 266 94.7 0.34 0.13 6.0 2.3
Total body water 266 96.6 0.83 0.05 11.3 11.7
Bio-electrical impedance 141 92.2 0.69 0.09 13.5 15.6
Corrected bio-electrical impedance 141 84.6 0.72 0.09 13.5 12.8
Combined DXA and BIA 141 93.5 0.74 0.08 13.5 15.7 DXA; dual energy X-ray absorptiometry, BIA; bio-electrical impedance, index is height
2

201
8.6.6 Accuracy of an aggregate prediction using the ‘wisdom of
crowds’ approach.
87 children (41 boys) had data that fitted the criteria for all 12 prediction equations
(Table 8.7). Characteristics of the children are presented in Table 8.8, they were
significantly shorter than the UK reference data (p<0.05) and the girls were
significantly lighter (p<0.01). For the prediction of FM and FFM (since they are
equal and opposite) the aggregate prediction had the third lowest bias (0.8 kg;
p<0.001) and the second lowest limits of agreement (± 4.2 kg) (Table 8.9, Figure
8.5). The individual predictions range in bias from 0.5 to 7.2 kg and limits of
agreement of ± 3.6 kg to ±15.5 kg. For 8 of the prediction equations the magnitude
of the bias was significantly related to the magnitude of FM, this was not the case for
the aggregate prediction or 4 of the individual predictions.
Figure 8.6 shows the bias in FM for individual children for the aggregate equation.
Six children had a bias greater than 4 kg FM which for 5 children was between 47
and 140% of their FM by 4CM.

202
Table 8.7. Equations for the prediction of body composition in children
Raw data Predicted
variable
Age
range y Equation Groupings
Weight and height
Morgenstern et al (232) TBW 0.25-13 0.0846 x 0.95F x (Ht x Wt)0.65
TBW >13 0.0758 x 0.84F x (Ht x Wt)0.69
Mellits and Cheek (233) TBW 0.1-31 -1.927 + (0.465 x Wt) + (0.045 x Ht) Boys ≤132.7cm
TBW -21.933 + (0.406 x Wt) + (0.209 x Ht) Boys ≥ 132.7cm
TBW 0.076 + (0.507 x Wt) + (0.013 x Ht) Girls ≤ 132.7cm
TBW -10.313 + (0.252 x Wt) + (0.154 x Ht) Girls ≥ 132.7cm
BMI
Deurenberg et al (234) % Fat 7-20 1.4 + (1.51 x BMI) – (0.70 x age) – (3.6 x M)
Pietriobelli et al (235) FM 5-19 -29.91 + (2.06 x BMI) Boys
FM -30.65 + (1.90 x BMI) + (0.53 x age) Girls
Skinfold thickness
Slaughter et al (165) % Fat 8-29 (1.21 x SF2) – (0.008 x SF22) – 1.7 Boys SF2 <35 mm
% Fat (1.33 x SF2) – (0.013 x SF2) – 2.5 Girls SF2 <35 mm
% Fat (0.783 x SF2) – 1.7 Boys SF2 >35 mm
% Fat (0.546 x SF2) + 9.7 Girls SF2 >35 mm
Johnston et al (164) BD 8-14 1.279 – (0.121 x log SF4) Boys with CF
BD 1.120 – (0.030 x log SF4) Girls with CF
Deurenberg et al (236) BD Mean 11 1.1133 – (0.0561 x log SF4) + (1.7 x age x 10-3
) Boys
BD Mean 10.5 1.1187 – (0.063 x log SF4) + (1.9 x age x 10-3
) Girls
F; female = 1, male = 0, M; female = 0, male = 1, Wt; weight, Ht; height, TBW; total body water (L), BD; body density (g/cm3), SF2;
sum of tricep and subscapular skinfold thicknesses (mm), log is log to base 10, SF4; sum of bicep, tricep, subscapular and suprailiac
skinfold thicknesses (mm),FM; fat mass, FFM; fat-free mass. Table continues on next page.

203
Table 8.7 continued. Equations for the prediction of body composition in children
Raw data Predicted
variable
Age
range y Equation Groupings
Ht2/Z
Horlick et al (237) TBW 4-18 0.725 + (0.475 x Ht2/Z) + (0.14 x Wt)
Houtkooper et al (90) FFM 10-19 (0.61 x Ht2/Z) + (0.25 x Wt) + 1.31
Schaefer et al (238) FFM 3-19 (0.65 x Ht2/Z) + (0.68 x age) + 0.15
Deurenberg et al (91) FFM 7-15 (0.406 x Ht2/Z) + (0.36 x Wt) + [5.58 Ht (m)] + (0.56 x M) - 6.48
Cordain et al (239) FFM 9-14 6.86 + (0.81 x Ht2/Z)
F; female = 1, male = 0, M; female = 0, male = 1, Wt; weight, Ht; height, TBW; total body water (L), BD; body density (g/cm3), SF2;
sum of tricep and subscapular skinfold thicknesses (mm), log is log to base 10, SF4; sum of bicep, tricep, subscapular and suprailiac
skinfold thicknesses (mm),FM; fat mass, FFM; fat-free mass, Z; impedance (ohms).

204
Table 8.8. Characteristics of children whose data was used for the aggregate prediction
Boys n=41 Girls n=46
Mean SD Range Mean SD Range
Age (y) 12.8 1.91 10.1 16.0 12.68 1.76 10.0 15.7
Weight (kg) 44.0 12.2 25.8 86.6 40.8 10.1 22.2 61.4
Height (m) 1.52 0.14 1.29 1.83 1.48 0.11 1.21 1.68
BMI (kg/height2) 18.6 2.28 13.9 25.9 18.4 2.68 13.2 24.5
Weight SDS -0.02 0.98 -1.89 2.07 -0.56**
1.31 -4.45 1.42
Height SDS -0.39* 1.15 -2.53 1.97 -0.72
*** 1.29 -3.64 1.46
BMI SDS 0.18 0.87 -1.92 1.90 -0.21 1.14 -3.78 1.57
Bicep skinfold (mm) 6.6 3.3 3.2 21.2 8.6 3.4 3.9 18.9
Tricep skinfold (mm) 10.5 3.7 4.7 18.8 13.4 4.6 6.1 24.5
Subscapular skinfold (mm) 7.4 2.6 4.0 17.9 10.5 6.3 4.6 31.6
Supra-iliac skinfold (mm) 12.1 6.8 5.2 34.3 15.9 8.2 5.5 33.7
Resistance (ohms) 695 82 539 867 800 88 584 1065
Total body water (l) 26.5 7.0 16.0 40.4 22.6 4.65 14.2 31.2
4-component fat mass (kg) 8.33 4.68 3.21 28.7 10.3 4.90 3.18 21.9
4-component fat-free mass (kg) 35.7 9.83 21.8 57.9 30.5 6.35 19.0 43.0
*P<0.05,
**P<0.01,
***P<0.001, one sample t-test compared to zero, child with CF compared to reference data.

205
Table 8.9. Bland-Altman statistics for bias and limits of agreement for individual or aggregate equations and reference 4-component fat
mass.
Equation Bias1 Limits of
agreement P R P
correlation
Deurenberg et al, BIA 7.17 ± 8.91 <0.001 0.372 <0.001
Johnston et al -5.84 ±15.47 <0.001 0.488 <0.001
Horlick et al 4.66 ± 6.62 <0.001 0.233 0.030
Schaefer et al 4.19 ± 6.44 <0.001 0.514 <0.001
Morgenstern et al -3.14 ± 8.98 <0.001 -0.140 0.196
Houtkooper et al 2.33 ± 5.28 <0.001 0.013 0.908
Cordain et al 1.22 ± 6.95 0.001 0.500 <0.001
Deurenberg et al, BMI -1.22 ± 5.00 <0.001 -0.599 <0.001
Deurenberg et al, SFT 0.91 ± 7.11 0.002 0.049 0.654
Slaughter et al -0.89 ± 3.56 <0.001 -0.219 0.041
Aggregate 0.77 ± 4.17 0.001 -0.168 0.120
Mellitis and Cheek -0.60 ± 5.61 0.049 -0.029 0.788
Pietrobelli et al 0.46 ± 5.82 0.143 0.150 0.165
1Difference (prediction equation – 4-component model (4CM)), bias in fat-free mass is equal and opposite.
Limits of agreement; ±2SD, P; one-sample t-test of bias compared to zero, R; correlation between the mean value
(4CM and individual prediction equation) and the bias.

206
Figure 8.5. Bland-Altman analysis showing mean bias (predicted – 4CM) and limits of agreement (±2SD) in fat mass and fat-free mass in 107
children with CF compared to the 4-component model. The bias in fat-free mass is equal and opposite to that of fat mass. The graph compares 12
individual predictions and an aggregate average of the 12 equations to the 4-component model. BIA; bio-electrical impedance, BMI; body mass
index, SFT; skinfold thickness. Asterisks denote biases that were significantly different from the 4CM, * p<0.05, ** p<0.005.

207
Figure 8.6 Individual bias and limits of agreement (±2SD) for fat mass(FM) by the aggregate prediction compared to the 4-
component model (4C FM;(aggregate FM – 4CM FM ).

208
8.7 Discussion
The 4CM is the ‘criterion’ in vivo method for the assessment of body composition in
children but is not widely available due to high cost, the need for skilled technicians and
lack of portability of the equipment. Other simpler techniques, which are available in the
hospital setting are therefore the methods of choice for clinical assessment. It is
important that these techniques are assessed against a criterion method in order to
identify the most appropriate for assessing body composition in children with CF and to
determine to what extent they are interchangeable. This is important because not all
techniques may be available at every assessment or suitable for all patients on all
occasions.
DXA may be available in most hospitals but its use in children tends to be in specialist
paediatric centres since interpretation of the data obtained is complicated by body size
and maturity (213). Several studies in adults and children have assessed absolute values
for FM and FFM against the 4CM and found relatively poor agreement in terms of mean
bias and limits of agreement (102;167;198;199;226;240-244) with age, gender, size,
pubertal status and disease state as possible factors influencing the bias. A recent study
from our centre (245) found that when using DXA to assess body composition in obese
children the bias was negligible but the limits of agreement wide for FM (±3.2 kg) and
FFM (±3 kg). These findings suggest that the use of DXA for individual assessment and
longitudinal change has limitations.
The use of body composition measurements in clinical practice is hampered by lack of
reference data, particularly in children. Several datasets have been generated for
techniques such as SFT, BIA and DXA (246-252) but none have generated reference
data in the same population using several different techniques. This issue was recently
addressed at our centre by measuring 533 children, adolescents and young adults to
generate reference curves from which SDS can be calculated for 4C FM and FFM and
many of the simpler methods (155). Using this data I have compared SDS for BMI, SFT

209
and DXA FM to 4C FM and BIA, TBW and DXA FFM to 4C FFM. These comparisons
identify the best simple technique to use to assess FM and FFM in children with CF
aged 6 -17 years.
It is conceivable that there may be occasions when only simple bedside techniques such
as anthropometry, SFT and BIA are available due to lack of resources. Prediction of FM
or FFM from a single prediction technique, particularly in children and patients, is likely
to be inaccurate and imprecise. However, an aggregate prediction in a ‘wisdom of
crowds’ approach has been shown to improve accuracy and precision (253) when
assessing body composition in healthy children and adolescents.
There are 4 aspects to my analysis: (1) cross sectional comparison of simple techniques
and the 4CM, (2) longitudinal comparison, (3) a comparison of the classification of
‘abnormal’ scores by simple techniques and the 4CM and (4) whether an aggregate
prediction is more accurate and precise than individual predictions. These analyses aim
to identify which techniques can be used to measure CF children’s body composition
and monitor change adequately and the extent to which they may be interchangeable.
The ability of a technique to classify patients as ‘normal’ or ‘abnormal’ for FM and FFM
is an important factor when designing treatment and dietary regimens and therefore
these analyses aim to quantify this for all simple techniques. Finally, it must be
acknowledged that many of the options may not be available for all patients at all times
and therefore I have included an assessment of a method using the simplest bedside
techniques.
8.7.1 Cross sectional comparison of simple techniques compared to the
4-component model and classification of patients
I found DXA to be a more accurate predictor of 4C FM than BMI or SFT. Bias in DXA
whole body and regional FM was small (<0.16 SDS) and limits of agreement ranged
from ±0.4 (trunk) to ±0.7 (limbs). The best predictor of 4C FFM was TBW which is

210
unlikely to be used clinically due to its high cost and lengthy analysis time. DXA whole
body and trunk FFM bias was small (<0.2 SDS) and DXA limb FFM underestimated by
on average, 0.5 SDS. Limits of agreement ranged from 0.4 to 0.8. Although whole
body FM and FFM did not show the lowest limits of agreement compared to regional
DXA, it would be wise to use whole body scans in clinical practice because the accuracy
of regional scans will be affected by the positioning of the ‘regions of interest’ by the
operator. Whereas the region of interest is chosen by the operator for regional scans in
whole body scans it is standardised. In addition, the bias in whole body FM and FFM
were not affected by age, sex or BMI SDS in this group of children.
For assessing FFM, corrected BIA showed no bias but wider limits of agreement than
DXA whole body. However, a combination of DXA whole body FFM and BIA SDS
gave no bias and narrower limits of agreement (0.53 SDS) than most of the other single
techniques. Since BIA is a cheap, easy technique which could be performed in the same
room as the DXA it would seem prudent to combine both techniques for the assessment
of FFM. A database to calculate the corrected BIA and combined SDS could be
provided in Excel format although the correction factor would need to be tested in other
populations before being applied to other groups children with CF of the age range in
this study.
Whole body DXA showed good agreement with 4CM for categorising patients as
‘normal’ and abnormal’ with regards to FM and FFM (73% and 76% respectively) and
DXA FFM combined with BIA SDS was similar. The use of DXA (with or without
BIA) in clinical practice as a predictor of 4C FM and FFM SDS and in the identification
of CF children with abnormal body composition is supported by these findings.
However, it is important to note that the limits of agreement were wide with 95% of
values from DXA whole body falling within a 1.5 or 1.3 SD band of those obtained by
4C FM and FFM respectively. This suggests that DXA cannot be considered to be
interchangeable with the 4CM and that the results should be used in conjunction with
other clinical indicators. If BIA is used in combination with whole body DXA FFM,
95% of values fall within a narrower band of 0.5 SDS. DXA was also less accurate in

211
patients with low FM. The finding that the bias and magnitude were correlated for both
whole body and regional FM and whole body FFM is in accord with previous research
demonstrating that size affects the measurement of soft tissue from DXA (102;196;254).
Analysis using indexed (height adjusted) DXA variables compared to 4C FMI and FFMI
did not improve the results although there was an unexpected finding for trunk FFMI. In
both boys and girl it appears that there is a depletion of FFM by 4CM and DXA whole
body (Table 6.1) that is not replicated in the trunk if a height adjustment is made. On
the contrary, there is a positive mean value of 0.65 for boys and 0.28 for girls. One
possible explanation is that although these CF children are short for their age the
shortness may be disproportionate in the limbs and trunk and therefore height2 would not
be the most appropriate power for both trunk and limbs. Data on sitting height is not
available for baseline and some of year 2 measurements although 127 subsequent
measurements of this group of children indicate a mean (SD) for standing height SDS of
-0.57 (1.07) and sitting height SDS of -0.67 (1.11), p=0.452. Another explanation is
that this finding is a reflection of increased density in the trunk area which may be due to
enlarged organs or may be as a result of bowel dysfunction or methodological issues
with DXA instrumentation as discussed in Chapter 6. Height adjusting regional FFM by
DXA reduces agreement on classification of patients by about a half compared to
unadjusted and therefore the use of trunk FFM SDS for clinical assessment cannot be
recommended.
DXA may not always be available in clinical practice and therefore the ability of BMI
and SFT to predict 4C FM and BIA to predict 4C FFM is an important consideration.
BMI and SFT provided much less agreement with 4C FM than DXA whole body FM,
demonstrating large positive biases and wide limits of agreement. Tricep SFT provided
a slightly better ranking of 4C FM than the other 3 SFT or BMI although the limits of
agreement were similar. Agreement with 4CM to categorise patients as ‘abnormal’
was also poor. It is therefore not advisable to use SFT or BMI as an indicator of FM,
even as a crude method to monitor an individual child with CF longitudinally. However,
corrected BIA showed no bias (and good agreement for classification of patients) and

212
therefore when DXA is not available BIA, which is a cheap readily available
technology, can be used to assess FFM, although it should be noted that limits of
agreement are wide at ±0.8 SDS. As previously discussed combining DXA and
corrected BIA SDS improved accuracy and precision compared to DXA on its own.
However, this data is obtained from a single frequency, standing BIA machine and
caution should be taken if using a different make, model, multi-frequency or supine
measurement machine.
All techniques demonstrated an over-estimation of FM compared to 4C FM whereas
bias in FFM estimation was variable.
8.7.2 Longitudinal comparison of simple techniques compared to the 4-
component model
Change in DXA whole body and regional FM and FFM SDS did not show any
significant bias compared to change in the 4CM SDS although bias in DXA FM (whole
body and regional) was greater in those with the least change and bias in change of DXA
trunk FFM greatest in those with the most change. Limits of agreement were about 1
SDS for change in FM and slightly smaller for FFM. The use of DXA whole body scans
is recommended for clinical practice to reduce operator error. Combining DXA FFM
and BIA SDS not only improves the cross sectional outcome but also reduces the limits
of agreement for longitudinal change by half. The use of DXA whole body FM and
FFM with or without corrected BIA in clinical practice to measure body composition
and monitor change is supported by these findings. However, it is important to note that
the limits of agreement for bias in change in DXA whole body FM and FFM are wide
with 95% of values from DXA falling within a 2.0 or 1.2 SD band of those obtained by
4C FM and FFM respectively. For FFM this is reduced by combining BIA with DXA
whole body FFM (0.7 SD). Corrected BIA SDS had an insignificant bias compared to
change in 4C FFM with limits of agreement close to those of DXA and therefore would
be a good alternative to assess FFM when DXA is not available. The limits of

213
agreement suggest that these techniques should not be used interchangeably however;
using the same technique over time will best monitor change in body composition.
8.7.3 ‘Wisdom of crowds’ aggregate prediction from several simple
prediction techniques
As hypothesised by the ‘wisdom of crowds’ theory the aggregate prediction had greater
accuracy than the majority of individual prediction equations in estimating FM and FFM
in this group of children with CF. Accuracy was better than all but 2 individual
prediction equations and precision better than all but 1 individual prediction equation.
Most of the individual prediction equations produced values where the magnitude of the
bias was related to the magnitude of FM or FFM. This was not the case for the aggregate
prediction. Although mean bias in the aggregate prediction compared to 4C FM and
FFM was one of the lowest (0.77 kg), individual bias was as much as 4 kg which, for 6
children was between 50 and 139% of their 4C FM or FFM. Clearly, where better
techniques are available these should be used, but where they are not feasible this
approach has some merit for assessing groups.
The ‘wisdom of crowds’ approach minimises the risk of selecting an equation with a
high bias given that it is not possible to know which equation will perform best in any
given group. Although 2 equations were marginally better than the aggregate for
agreeing with the 4CM this may not be the case in another population of children with
CF. In addition the aggregate prediction had narrower limits of agreement than 11 of the
12 individual prediction equations. It should be noted that all but 1 of the equations used
were generated in healthy populations and therefore further work to generate more CF
specific equations, using several bedside techniques, would be helpful to determine
whether accuracy and precision may be improved.

214
8.8 Study limitations
There are some limitations to this study. Firstly, it should be considered whether the fact
that DXA is compared on its own to the 4CM which utilises DXA BMC measurement
may influence the result. I have previously addressed this issue (102) by analysing data
from both 4CM and the 3CM which does not utilise any DXA measures. The results
remained unchanged. Secondly, no attempt has been made to relate these findings to
clinical outcome so although, for example, SFT are not good at assessing absolute FM
they may be useful clinically to monitor health. Thirdly, these analyses have utilised
standardised scores, and the question of whether there is bias in absolute FM and FFM
kg has not been addressed. Fourthly, I used standing BIA apparatus and the findings
may be different where impedance is measured lying down. Finally, prediction
equations generated with data from children with CF rather than healthy children may
improve the outcome of an aggregate prediction.

215
8.9 Summary
Techniques cannot be used interchangeably.
Standardised FM and FFM measurements from DXA compare most favourably
with those derived from the 4CM and are the most useful clinically for
measuring body composition and monitoring change.
Regional DXA may be affected by operator error whereas whole body DXA is
standardized and therefore whole body scans are recommended for clinical
practice.
BIA may reasonably be used to provide a FFM SDS in place of DXA if a
correction factor is applied. Assessment of FFM is improved by combining
corrected BIA with DXA FFM in terms of agreement with the 4CM in this group
of children.
Despite the short stature of these CF children, agreement with 4CM is not
improved by height adjusting DXA SDS.
BMI and SFT should not be used for assessing individuals due to lack of
accuracy.
Monitoring change in body composition is appropriate with DXA, BIA or a
combination of the 2, although the separate techniques are not interchangeable
over time.
When only simple bedside techniques are available the use of an aggregate
prediction based on a healthy population may be informative when comparing
groups but not individuals. It is likely that the generation of several prediction
equations based on data from children with CF and aggregated will improve the
outcome.
Ultimately, the most appropriate measure should be determined by its predictive
value for clinical outcome.

216
Chapter 9. Conclusion
This chapter will summarise the findings, describe possible future research, outline
the limitations of the thesis and relate the findings to clinical practice.
9.1 Summary of the findings
This thesis had 3 aims;
4. To investigate the effect of CF on body composition in young children with
CF and whether this changes with growth and maturity. In addition, to
investigate whether the type of comparison (pair-, group-match or compared
to a reference population) affects the outcome of the analysis.
5. To investigate the relationship between body composition and clinical status
assessed by FEV1.
6. To investigate simple body composition techniques to define which would be
most appropriate in clinical practice where 4CM is not available.
9.1.1 Effect of cystic fibrosis on body composition
Even at baseline (Chapters 5 and 6), abnormal body composition was apparent with
clear sex differences indicating that abnormalities in females may be established
much earlier than previously considered. The deficit of FM and MM found in this
group of girls with CF was not related to pubertal status. Two girls had hidden
depletion of FFM which is likely to impact greatly on the course of the disease and
response to treatment. Both girls and boys with CF were short but boys had similar
body composition to control boys apart from more FFM once adjustment for stature
was made. However, 3 boys were obese which may present problems for the future
management of these patients. Only by performing body composition measurements
was it possible to identify those boys with high BMI and high FM or FFM and those
girls with ‘normal’ BMI and low FFM indicating that, without these measurements a

217
detrimental body composition may not be identified clinically. The consistent
finding was that the children with CF have, on average, larger waist circumference
than both the reference data and controls which appears from regional DXA
measurements to be a reflection of increased FFM rather than increased FM,
suggesting that waist measurements will not be helpful as a measure of adiposity in
this group.
Longitudinal analysis (Chapter 7) indicated deterioration in FFM in both sexes
although there was an indication of improving FFM in the older girls. Boys lowest
in FFM at baseline and girls lowest in MM at baseline showed the greatest ‘catch-up’
(or least decline) in these tissues over 2 years. Clinically, BMD SDS is monitored
and in children this is size adjusted as BMAD SDS which, for the children in this
study remained stable at 0.2 in boys and -0.4 in girls. I also investigated the role of
physical activity on body composition and although there was no relationship
between baseline activity and body composition at 2 years, the most active boys at 2
years had less than expected gains in FM and FFM gains similar to controls.
However, it must be emphasised the assessment of activity in this study was crude
and a causal relationship between activity and body composition could only be
defined with an intervention study.
None of these effects would have been detected using simple anthropometric
measurements.
Different types of analysis were used to compare the children with CF to a healthy
control group; matched-pair and group comparisons were made with absolute values
of components of body composition and also SDS calculated from a large reference
population. In addition, these SDS indicate how both the children with CF and the
controls compare to the large reference population. I found that the conclusions
differed depending on the type of analysis and this may, in part, explain the differing
conclusions of previous studies.

218
9.1.2 The relationship between body composition and spirometry as
a marker for clinical status.
I found that FM in girls was related to FEV1 at baseline but not at 2 years despite
declining lung function. No relationship between body composition and spirometry
was found in boys at baseline although at 2 years FFM was related to FEV1 and in
girls whole body BMC was related to FEV1 in accord with many previous studies.
These findings are presented in Chapters 5 and 6. In Chapter 7 I showed how a
greater than expected increase in FM in boys was associated with greater increase in
FEV1 over 2 years and that baseline FEV1 in boys predicted change in FFMI SDS
such that a 1 SDS higher FEV1 at baseline predicted an additional 0.18 SDS change
in FFMI over 2 years. These findings suggest that, in boys, improving lung function
is associated with greater than expected gains in FM over the same period, and that
baseline lung function predicts greater than expected subsequent gain in FFM.
However, the relationship between body composition and lung function is clearly
complex and it is impossible to define cause and effect with an observational study.
A randomised controlled intervention trial to improve either body composition or
lung function would be necessary.
This study indicated that BMI SDS was only related to FEV1 when there was a
severe depletion of FM in girls at baseline but it did not relate to change in FEV1
over the 2 years and in addition, does not accurately reflect either obesity or
depletion of FFM. This highlights the importance of using body composition
measurements in clinical practice if the patient is to receive the most appropriate
treatment.
9.1.3 Simple body composition techniques for use in clinical practice
where 4-component model is not available
When deciding which body composition technique to use in clinical practice there
are practical considerations such as cost, availability, ease of use and patient
acceptance and also consideration of the quality of the data derived from the
technique and the applicability to the question being asked. For example, SFT are

219
not appropriate to measure FM in the group of children measured for this thesis but
SFT may be useful to monitor overall health in these children. In addition, a
technique which has wide limits of agreement may not be suitable to assess and
monitor individuals over time but may be useful in large epidemiological studies.
I found that FM and FFM SDS derived from whole body DXA gave results closest to
the criterion method and that assessment of FFM is improved by combining adjusted
BIA with DXA in this group of children. However, the equation generated to
calculate adjusted BIA values in this study would need to be tested in other similar
aged CF populations before its use could be recommended generally. BMI and SFT
are not accurate enough to assess individuals. Monitoring change in body
composition is best achieved with DXA, BIA or a combination of both although
separate techniques are not interchangeable over time. Simple bedside techniques
may be informative when comparing groups if an aggregate prediction (of several
predictions) is used.
9.2 Future Research
From the work in this thesis I have identified possible areas of future research:
1. In the light of the findings of altered body composition in this group of
children there is a need to establish how body composition measurements can
be used clinically, for example:
a. Continued longitudinal follow-up of this cohort into adult life may
identify whether baseline or change in body composition predicts later
prognosis.
b. Could body composition measurements be used as a basis for
nutritional advice, for example, is it better to base calculation of
energy requirement on FFM rather than weight? A randomised
controlled trial of current (based on weight) versus new management
(based on FFM) may be helpful.
c. Whether nutritional interventions lead to greater gains in FM or FFM
and whether gains in FM or gains in FFM have different outcomes.

220
d. Randomised controlled trials of the impact of interventions on lung
function or body composition to better understand the relationship
between the two.
e. Using data from the 4CM to investigate the relationship between PM
and lung infection.
2. Continued longitudinal follow-up of the cohort will also allow for the
investigation of sex differences, not only in body composition but also
activity using activity monitors and measures of behaviour and attitude to
illuminate whether there are other, non-biological factors that contribute to
sex differences. This information could then be used to design sex specific
management.
3. Study of the generalisability of the equation generated to adjust raw values of
impedance from BIA by comparing with deuterium dilution in another group
of CF patients aged 6-17 years.
4. This thesis highlights some of the issues related to different measurement
techniques and study design which may explain inconsistencies of previous
research. Greater attention to these issues in future studies with more
consistency in methods and study design would be an advantage.
9.3 Limitations
Methodological limitations have been discussed in each chapter and are summarised
here;
Spirometry is commonly used as a clinical outcome measure but may not
capture a complete picture of the health of the patient. Ideally other clinical
factors would be incorporated into the analysis although obtaining accurate
records of all possible variables is difficult in this group of children where

221
some are managed at a local hospital and attend Great Ormond Street
Hospital for Children once a year.
I did not measure FEV1 in the control children, however the reference data
for lung function used in this study is from a large reference population and
therefore should accurately depict the lung health of CF children in this study.
However, it must be acknowledged that spirometry outcome is affected by
motivation, particularly in the young.
Consistent body volume measurements using ADP are more difficult to
achieve due to erratic breathing in some of the children with CF. I therefore
made multiple measurements in order to achieve consistency. Measured lung
volumes whilst in the equipment are difficult to perform particularly in
children and more so in children with CF. I therefore used predicted lung
volumes in all the children. However, a previous study of children with CF
using ADP found that there was no significant difference in FFM calculated
using measured as opposed to predicted lung volume.
The use of questionnaires to assess activity could be challenged since they
may be affected by differing parental expectations between parents of
children with CF and parents of healthy children.
Children with CF have large changes in appetite and activity depending on
how well they are. Measurement of body composition gives a ‘snap shot’ of
that period and it is possible that there are changes occurring within the 2
year period that have been missed. However, treatment regimens for patients
with CF are onerous and many take part in several research projects and
therefore to increase the frequency of measurements would be unacceptable.
Although I have found statistically significant differences between children
with CF and controls and between different techniques this does not
necessarily equate to clinical relevance. The -2 SDS cut-off for ‘abnormal’ is
arbitrary and should only be regarded as a guide to be used in conjunction

222
with other clinical factors. Regarding techniques, the most appropriate
measure should ideally be determined by its predictive value for clinical
outcome; SFT may not be good to monitor FM but may be useful clinically to
monitor health.
Observational studies such as mine cannot define cause and effect. Only a
randomised controlled trial of an intervention to improve body composition
or improve lung function would make the picture clearer. However, due to
the multiple factors which impact on overall disease severity in this group
and the way that each is likely to impact upon and be affected by other
factors, a clear answer is unlikely.
SDS used in this study to compare techniques are, as yet, not generally
available and will not be appropriate for all ethnic groups, all makes of DXA
and supine BIA machines.
This study was unable to investigate the important contribution of diet on
body composition.
9.4 Implications of this research for clinical practice
The body composition of children with CF is an important factor influencing
prognosis. Simple anthropometric techniques are internationally recommended to
monitor the growth and nutritional status in these children. However, my findings
suggest that these are not able to detect abnormal body composition. Using more
detailed measurement techniques, abnormal body composition is apparent during
mid-childhood, with gender differences that are in accord with our knowledge about
prognosis. However, these findings would not be apparent unless an appropriate
method is used, for example using simple anthropometry does not identify hidden
depletion of FFM and ‘obesity’ and BMI is not a good predictor of FEV1 in this
group of children.

223
A very important aspect of this study is the information on which techniques are
likely to be most appropriate for clinical use finding that DXA or a combination of
DXA and BIA give results closest to the criterion method. However, the equation
for adjusting BIA SDS would need to be tested in another population of children
with CF before it could be recommended for other groups of CF patients.
The findings in this thesis support the concept that the measurement of body
composition in children with CF is important for both research and clinical practice
however, it must be emphasised that appropriate techniques should be used.

224
Acknowledgements
I cannot fully express my gratitude to my primary supervisor Dr Mary Fewtrell for
her constant support and guidance and endless patience. The guidance of my
secondary supervisors Dr Ranjan Suri and Professor Adam Jaffe has been invaluable
and I am indebted to Professor Jonathan Wells who has given unstintingly of his time
and expert knowledge. I would also like to express my gratitude to the many
members of the respiratory medicine team at Great Ormond Street Hospital for Sick
Children who have helped with recruitment and acquisition of clinical details, and
those who performed lung function assessment and to my colleagues at the
Childhood Nutrition Research Centre for their ongoing help, support and friendship.
I would like to express my appreciation to all the children who volunteered to take
part in this research, some of whom I have watched grow and develop into
adolescence and sadly a few have not. To their parents I thank them for giving time
and encouragement to complete the measurements.
I am indebted to my loved ones for their encouragement and support during the
entire PhD process and for never once saying, why?

225
Information about the work in this thesis
The work in this thesis was carried out at the Childhood Nutrition Centre, Institute of
Child Health, University College London. The measurements were carried out in the
Radiology Department, Great Ormond Street Hospital, London.
The project was conceived and developed with my supervisors and Professor
Jonathan Wells. The children were recruited by Dr Christian Benden who assisted
with collecting clinical details. I measured the children with the help of Catherine
Wilson and the older children with CF, whose data was used in the analysis in
Chapter 8, were measured using the same equipment by Dr Sirinuch Chomtho and
myself. I processed the saliva samples, modeled the 4CM data and performed the
analysis with expert advice from my supervisors, Professor Wells and with statistical
imput from Professor Tim Cole.
The body composition reference data was collected by myself and my colleagues;
Catherine Wilson, Dalia Haroun, Sirinuch Chomtho and Kathy Kennedy using the
same equipment used for this thesis. I modeled the data and contributed to the
writing of two published papers related to the reference children.
Papers related to this thesis
I am the first author on a paper related to the baseline analysis of this group of
children which is referenced as 69 in the bibliography and may be found in full at the
end of the bibliography;
Williams JE, Wells JCK, Benden C, Jaffe A, Suri R, Wilson CM, & Fewtrell MS.
Body composition assessed by the 4-component model and association with lung
function in 6-12-y-old children with cystic fibrosis. Am J Clin Nutr 2010;92:1-12
I am co-author on two papers related to the reference data which are referenced as
184 (2010) and 155 (2012) in the bibliography and may be found in full at the end of
the bibliography;

226
Wells JC, Williams JE, Chomtho S, Darch T, Grijalva-Eternod C, Kennedy K,
Haroun D, Wilson C, Cole TJ, Fewtrell MS. Pediatric reference data for lean tissue
properties: density and hydration from age 5 to 20 y. Am J Clin Nutr 2010; 91: 610-
8
Wells JC, Williams J E, Chomtho S, Darch T, Grijalva-Eternod C, Kennedy K,
Haroun D, Wilson C, Cole T and Fewtrell MS. Body composition reference data for
simple and reference techniques and the four-component model: a new UK reference
child. Am J Clin Nutr 2012 in press
I am first author on a methodological paper related to the techniques used in this
thesis which is referenced as number 96 in the bibliography and may be found in full
at the end of the bibliography;
Williams, J.E., Wells, J.C.K., Wilson, C.M., Haroun, D., Lucas, A. and Fewtrell,
M.S. Evaluation of Lunar Prodigy dual-energy X-ray absorptiometry for assessing
body composition in healthy persons and patients by comparison with the criterion
four-component model. Am J Clin Nutr. 2006;83:1047-54.

227
Appendices
Appendix 1. Ethical approval
Institute of Child Health/Great Ormond Street Hospital Ethics Committee
The Institute of Child Health 30 Guilford Street
London WC1N 1EH
Telephone: 020 7599 4130
Facsimile:
16 September 2008
Dr M S Fewtrell Reader in Childhood Nutrition, Hon Consultant Paediatrician Childhood Nutrition Research Centre, UCL Institute of Child Health 30, Guilford St London
WC1N 1EH
Dear Dr Fewtrell
Full title of study: Body composition and bone health in children with cystic fibrosis compared to healthy children; a longitudinal matched pairs study. REC reference number: 08/H0713/66
Thank you for your letter of 01 August 2008, responding to the Committee's request for further information on the above research and submitting revised documentation.
The further information has been considered on behalf of the Committee by the Vice-Chair. Confirmation of ethical opinion
On behalf of the Committee, 1 am pleased to confirm a favourable ethical opinion for the above research on the basis described in the application form, protocol and supporting documentation as revised, subject to the conditions specified below.
Ethical review of research sites
The Committee has designated this study as exempt from site-specific assessment (SSA). The favourable opinion for the study applies to all sites involved in the research. There is no requirement for other Local Research Ethics Committees to be informed or SSA to be carried out at each site.
Conditions of the favourable opinion
The favourable opinion is subject to the following conditions being met prior to the start of the study.

228
Management permission or approval must be obtained from each host organisation prior to the start of the study at the site concerned.
Management permission at NHS sites ("R&D approval") should be obtained from the relevant care organisation(s) in accordance with NHS research governance arrangements. Guidance on applying for NHS permission is available in the Integrated Research Application System or at http://www.rdforum.nhs.uk.
This Research Ethics Committee is an advisory committee to London Strategic Health Authority
The National Research Ethics Service (NRES) represents the NRES Directorate within
the National Patient Safety Agency and Research Ethics Committees in England
Approved documents
The final list of documents reviewed and approved by the Committee is as follows:
Document , Version Date. Application 1 05 June 2008
Investigator CV 1 04 February 2008
Protocol 1 01 May 2008
Covering Letter 1 27 June 2008
Compensation Arrangements 1 06 June 2008
Letter of invitation to participant 1 26 June 2008
Participant Information Sheet: CF parent information sheet 2 26 July 2008
Participant Information Sheet: Control over 12 yrs participant information sheet
2 26 July 2008
Participant Information Sheet: CF over 12 yrs participant information sheet
2 26 July 2008
Participant Information Sheet: Control child information sheet 2 26 July 2008
Participant Information Sheet: CF child information sheet 2 26 July 2008
Participant Information Sheet: Control parent information sheet 2 26 July 2008
Participant Consent Form: Assent 1 02 May 2008
Participant Consent Form: Parent 1 02 May 2008
Participant Consent Form: Participant 1 02 May 2008
Response to Request for Further Information 1 01 August 2008
CV Jane Williams
Original Ethics Approval Letter 1 26 March 2008
Certificate for Participants 1
Data Protection Form 1
Statement of compliance
The Committee is constituted in accordance with the Governance Arrangements for Research Ethics Committees (July 2001) and complies fully with the Standard Operating Procedures for Research Ethics Committees in the UK.
After ethical review

229
Now that you have completed the application process please visit the National Research Ethics Website > After Review
You are invited to give your view of the service that you have received from the National Research Ethics Service and the application procedure. If you wish to make your views known please use the feedback form available on the website.
The attached document "After ethical review — guidance for researchers" gives detailed guidance on reporting requirements for studies with a favourable opinion, including:
Notifying substantial amendments
Progress and safety reports
Notifying the end of the study
The NRES website also provides guidance on these topics, which is updated in the light of changes in reporting requirements or procedures.
We would also like to inform you that we consult regularly with stakeholders to improve our service. If you would like to join our Reference Group please email
referencedroup nres.npsa.nhs.uk.
081H0713/66 Please quote this number on all correspondence
With the Committee's best wishes for the success of
this project Yours sincerely
rDr Victor Larcher
Chair
Email: [email protected]
Copy to: Dr Tracey Assari R&D office for GOSH/1CH

230
Appendix 2.1. Child with CF information sheet
MRC Childhood Nutrition Research Centre Institute of Child Health 30 Guilford Street London WC1N 1EH Tel 020 7905 2389
Title of project Body composition and bone mineralisation in children with Cystic Fibrosis compared to healthy children.
Children’s Information Sheet ( 6 to 11 yrs). You are being asked to take part in a research study. Take time to decide if you want to say YES or NO to this. Please read this information, or ask someone to read it to you. Don’t worry if you don’t understand it straight away. Your parents have also been told about this, and you can ask them to help you understand. You can find more general information about research on the Great Ormond Street Hospital website: (http://www.gosh.nhs.uk/gosh_families/research)
Why have I been asked to take part? You have cystic fibrosis which means that you are not able to use all the food you eat to grow. We would like to measure you to find out how well you are growing.
Do I have to take part? No, it is up to you to decide whether or not you want to take part. Even if you decide to take part, you can change your mind at any time and you don’t have to give us a reason. If you decide not to take part it will not make any difference to your treatment.

231
What do I have to do? You will be asked to come to the X-ray department at GOSH with your parents. It will take about 1 ½ hours and we will arrange a time when you are coming to the hospital for a routine appointment or are staying on the ward. None of the measurements are dangerous or hurt: We will measure your size and shape with a tape measure. We will ask you to lie on a bed with a camera over the top which takes a picture of your bones. You need to keep still for a few minutes while it takes a picture. You will get a copy of the picture of your skeleton to take home. We will also take a picture of your arm and leg using another machine. We will measure the strength of your arm and leg using sound waves and some slippery gel. We will give you some cotton wool to put in your mouth to get wet and then give you a drink of special water. This will help us to measure how much water you have in your body. We will ask you to sit in an egg shaped pod for a few minutes whilst wearing your swimming costume. There is no water, just air blowing gently around you. We will ask you to stand on a weighing scale whilst you hold onto two handles. We will ask you some questions about how healthy you are and what you eat. We will ask you to wear an activity monitor on a belt around your waist so that we can measure how much you move about. Photos of the machines are shown at the end of this leaflet. You will need to wear loose clothes without any metal – but you will not have to undress. Your parent or guardian will be with you all the time.
Is there anything dangerous? None of the measurements are dangerous and none of them hurt. If you don’t want to do one of the tests you can tell us.
Who will know about me taking part? Only the people doing the research and your doctors at the hospital will know about you doing the measurements.
Who do I speak to if I have any problems? You can speak to your parents who also have information about the study. You can also contact one of the researchers- their details are at the end of this leaflet. No one will be told that you have called and you do not have to give your name if you want to ask a question or talk about the tests.

232
Details of how to contact the researchers: Jane Williams Dr Mary Fewtrell Research Nurse Chief Investigator Childhood Nutrition Research Centre Childhood Nutrition Research Centre Institute of Child Health Institute of Child Health 30 Guilford Street 30 Guilford Street London WC1N 1EH London WC1N 1EH Tel: 0207 905 2389 Tel: 0207 905 2743 Email; [email protected] Email; [email protected]
Thank-you for reading this information sheet! a) Measuring your head
b) Taking a picture of your bones
b) You will be given a copy to keep
c) Taking another picture of your bones

233
d) How strong are your bones?
f) The Bodpod to measure your size and weight g) Measuring your muscles

234
Appendix 2.2. Control child information sheet
MRC Childhood Nutrition Research Centre Institute of Child Health 30 Guilford Street London WC1N 1EH Tel 020 7905 2389
Title of project Body composition and bone mineralisation in children with Cystic Fibrosis compared to healthy children.
Children’s Information Sheet ( 6 to 11 yrs). You are being invited to take part in a research study. Take time to decide if you want to say YES or NO to this. Please read this information, or ask someone to read it to you. Don’t worry if you don’t understand it straight away. Your parents have also been told about this, and you can ask them to help you understand. You can find more general information about research on the Great Ormond Street Hospital website: (http://www.gosh.nhs.uk/gosh_families/research)
Why have I been asked to take part?
We are measuring children with cystic fibrosis, an illness which means they are not able to use all the food they eat to grow. To find out how well they are growing we need to measure children who do not have any illness so we can see the difference. We are asking you to take part because you are healthy.
Do I have to take part? No, it is up to you to decide whether or not you want to take part. Even if you decide to take part, you can still leave the study at any time and you don’t have to give us a reason.

235
What do I have to do? You will be asked to come to the X-ray department at GOSH with your parents. It will take about 1 ½ hours and we will arrange a time that is best for you and your parents. None of the measurements are dangerous or hurt: We will measure your size and shape using a tape measure. We will ask you to lie on a bed with a camera over the top which takes a picture of your bones. You need to keep still for a few minutes while it takes a picture. You will get a copy of the picture of your skeleton to take home. We will also take a picture of your arm and leg using another machine. We will measure the strength of your arm and leg using sound waves and slippery gel. We will give you some cotton wool to put in your mouth to get wet and then give you a drink of special water. This will help us to measure how much water you have in your body. We will ask you to sit in an egg shaped pod for a few minutes whilst wearing your swimming costume. There is no water, just air blowing gently around you. We will ask you to stand on a weighing scale whilst you hold onto two handles. We will ask you some questions about how healthy you are and what you eat. We will ask you to wear an activity monitor on a belt around your waist so that we can measure how much you move about. Photos of the machines are shown at the end of this leaflet. You will need to wear loose clothes without any metal – but you will not have to undress. Your parent or guardian will be with you all the time.
Is there anything dangerous? None of the measurements are dangerous and none of them hurt. If you don’t want to do one of the tests you can tell us.
Who will know about me taking part? Only the people doing the research will know about you doing the measurements.
Who do I speak to if I have any problems? You can speak to your parents who also have information about the study. You can also contact one of the researchers- their details are at the end of this leaflet. No one will be told that you have called and you do not have to give your name if you want to ask a question or talk about the tests.

236
Details of how to contact the researchers: Jane Williams Dr Mary Fewtrell Research Nurse Chief Investigator Childhood Nutrition Research Centre Childhood Nutrition Research Centre Institute of Child Health Institute of Child Health 30 Guilford Street 30 Guilford Street London WC1N 1EH London WC1N 1EH Tel: 0207 905 2389 Tel: 0207 905 2743 Email; [email protected] Email; [email protected]
Thank-you for reading this information sheet! a) Measuring your head
b) Taking a picture of your bones
b) You will be given a copy to keep
c) Taking another picture of your bones

237
d) How strong are your bones?
f) The Bodpod to measure your size and weight g) Measuring your muscles

238
Appendix 2.3. Child with CF over 12 y information sheet
MRC Childhood Nutrition Research Centre Institute of Child Health 30 Guilford Street London WC1N 1EH Tel 020 7905 2389
Title of project Body composition and bone mineralisation in children and with Cystic Fibrosis compared to healthy children.
Participant Information Sheet (12 yrs and older). You are being invited to take part in a research study. Before you decide whether to take part or not, it is important you understand why the research is being done and what it will involve. Please take time to read the following information carefully and discuss it with others if you wish. Ask us if there is anything that is not clear or if you would like more information. You can find more general information about research on the Great Ormond Street Hospital website: (http://www.gosh.nhs.uk/gosh_families/research)
What is the aim of the study? The aim of this study is to measure the amount of fat, muscle and bone in children with cystic fibrosis (CF) and to see if these measurements relate to how well the children are.
Why is the study being done? Some children with CF may develop problems with growth, due to problems with the absorption of food. This may lead to differences in the proportions of fat and muscle in the body, and also with the amount of mineral in their bones. Until recently, it has been difficult to accurately measure the amounts of fat, muscle and bone in children, but we can now do this using some simple measurements that are available at GOSH.
How is the study to be done?

239
We are inviting all children aged 6-17 years with CF who attend GOSH to participate. If you are willing to take part in the study, we will arrange an appointment at a time which is convenient for you (if possible, at the same time as your outpatient appointment). If you agree we will contact you again every 2 years to repeat the measurements. You can decide on each occasion whether to take part. The study will take about 1 ½ hours and will take place in Great Ormond Street Hospital. We will reimburse any travelling expenses. At the appointment we will ask you to do the following: After the study has been explained to you (and we have answered all your questions) we would like you or your parent to sign a consent form. This will give us permission to include you in the study and to obtain information about genotype (your genetic code) and clinical details from the hospital notes. We will measure your standing and sitting height and weight, waist, hip, head, arm and leg circumference and limb length, and skin-folds (by pressing the fat gently on the arm, shoulder and abdomen). You will not be asked to undress completely. We will ask you to lie on a bed with a machine above (DXA scan) that measures bone using very low dose X-rays (much less than the daily background radiation we are all exposed to). This will also take a picture of your skeleton, which you can keep. The scans take a few minutes each, and are performed with you wearing light indoor clothing (such as shorts and a t-shirt) that do not contain metal. These scans give a measurement of the size and amount of mineral in the bones, as well as the proportions of fat and muscle. If there is any possibility that the person being scanned is pregnant, the scan will not be performed. We will measure the strength of the bones in your wrist and lower leg using an ultrasound machine. The measurements take a few minutes, are completely painless and do not use X-rays. We will measure the shape, size and bone mineral content of your tibia (lower leg bone) and radius (lower arm bone) using a pQCT machine. This uses a very low dose of X-rays (much less than the daily background radiation we are all exposed to). We will measure the amount of water in your body. This measurement involves drinking some water containing heavy oxygen molecules (18-oxygen). These molecules are not radioactive, they simply weigh more than most oxygen molecules and they occur naturally in all of us. Before and 4 hours after the drink you will be asked to provide a saliva sample using an absorbent cotton wool swab. We will measure the volume of your body. This measurement involves you sitting still inside a chamber (with a clear window) called a BodPod for about 2 minutes whilst room air is gently blown around you. This measurement will be repeated a second and possibly third time. The test is performed with you wearing a swimming costume and a polyester swimming hat (which we will provide). We will perform a measurement of bioelectrical impedance using a low level of electrical current (that is undetectable), passed between electrodes in contact with your hands and feet. The test is harmless and painless and gives a measure of body water.

240
We will ask you some questions about general health, including any medicines being taken, and use a short questionnaire to measure calcium intake and activity level. To avoid undressing we will give you a leaflet to complete in private, that shows pictures of the different stages of pubertal development and ask you to indicate which is closest to you. All the things we have asked you to do will take about 1 ½ hours. None of the tests will hurt. j) To measure the amount of activity that you do, we will ask you to wear an
activity monitor on a belt during the daytime for 7 days (5 week days and 2 week-end days). This machine can be posted back to us when the measurements are finished.
Are there any risks and discomforts? All of the tests are painless and harmless. DXA and pQCT scans involve a tiny amount of radiation, which is less than half of a day’s background radiation in the United Kingdom (to which we are all exposed), and less than one tenth of the radiation from a flight across the Atlantic.
What are the potential benefits? The study could identify any abnormalities of bone density or in the proportions of fat and lean tissue. Where possible, these would be treated. Most people find the tests interesting and educational and everyone will be given a printout of his/her skeleton to take home.
Who will have access to the research records? Only the researchers will have access to the data collected during this study.
Do I have to take part in this study? No. If you decide, now or at a later stage, that you do not wish to take part in the study, that is entirely your right and it will not affect your clinical care.
What will happen to the results of the research study? The results of this research will be published in a medical journal and presented at scientific meetings. The clinical team will receive the results of the bone density scan.
What if something goes wrong? The research project has been approved by an Independent Research Ethics Committee which believes that it is of minimal risk to you. However, any research can carry unforeseen risks and we want you to be informed of your rights in the unlikely event that any harm should occur as a result of taking part in this project. This research is covered by a no-fault compensation scheme which may apply

241
in the event of any significant harm resulting from involvement in the project. Under this scheme it would not be necessary for you to prove fault. You also have the right to claim damages in a court of law. This would require you to prove fault on the part of the Hospital/Institute and/or any manufacturer involved.
Who do I speak to if problems arise? If you have any complaints about the way in which this research project has been, or is being conducted, please, in the first instance, discuss them with the researcher. If the problems are not resolved, or you wish to comment in any other way, please contact Mrs Jane Clist by post at the Research and Development Office, Institute of Child Health, 30 Guilford Street, London WC1N 1EH, or, if urgent, by telephone on 020 7905 2201.
Details of how to contact the researchers: Jane Williams Research Nurse Childhood Nutrition Research Centre Institute of Child Health 30 Guilford Street London WC1N 1EH Tel: 0207 905 2743 Email; [email protected] Dr Mary Fewtrell Chief Investigator Childhood Nutrition Research Centre Institute of Child Health 30 Guilford Street London WC1N 1EH Tel: 0207 905 2389 Email; [email protected]
Thank-you for reading this information sheet!

242
Appendix 2.4. Control over 12y information sheet
MRC Childhood Nutrition Research Centre Institute of Child Health 30 Guilford Street London WC1N 1EH Tel 020 7905 2389
Title of project Body composition and bone mineralisation in children with cystic fibrosis compared to healthy children.
Participant Information Sheet (12 yrs and older). You are being invited to take part in a research study. Before you decide whether to take part or not, it is important to understand why the research is being done and what it will involve. Please take time to read the following information carefully and discuss it with others if you wish. Ask us if there is anything that is not clear or if you would like more information. You can find more general information about research on the Great Ormond Street Hospital website: (http://www.gosh.nhs.uk/gosh_families/research)
What is the aim of the study? The aim of this study is to measure the amount of fat, muscle and bone in children with cystic fibrosis (CF) and to see if these measurements relate to how well the children are. In order to do this we need to measure healthy children as a comparison.
Why is the study being done? Some children with CF may develop problems with growth, due to problems with the absorption of food. This may lead to differences in the proportions of fat and muscle in the body, and also with the amount of mineral in their bones. Until recently, it has been difficult to accurately measure the amounts

243
of fat, muscle and bone in children, but we can now do this using some simple measurements that are available at GOSH.
How is the study to be done? We are inviting healthy, full term children aged 8-19 years to participate. If you are willing to take part in the study, we will arrange an appointment at a time which is convenient for you. If you agree we will contact you again every 2 years until the age of 19 years to repeat the measurements. You can decide on each occasion whether to take part. The study will take about 1 ½ hours and will take place in Great Ormond Street Hospital. We will reimburse any travelling expenses. At the appointment we will ask you to do the following: After the study has been explained to you (and we have answered all your questions) we would like you or your parent to sign a consent form. This will give us permission to include you in the study. We will measure your standing and sitting height and weight, waist, hip, head, arm and leg circumference and limb length, and skin-folds (by pressing the fat gently on the arm, shoulder and abdomen). You will not be asked to undress completely. We will ask you to lie on a bed with a machine above (DXA scan) that measures bone using very low dose X-rays (much less than the daily background radiation we are all exposed to). This will also take a picture of your skeleton, which you can keep. The scans take a few minutes each, and are performed with you wearing light indoor clothing (such as shorts and a t-shirt) that does not contain metal. These scans give a measurement of the size and amount of mineral in the bones, as well as the proportions of fat and muscle. If there is any possibility that the person being scanned is pregnant, the scan will not be performed. We will measure the strength of the bones in your wrist and lower leg using an ultrasound machine. The measurements take a few minutes, are completely painless and do not use X-rays. We will measure the shape, size and bone mineral content of your tibia (lower leg bone) and radius (lower arm bone) using a pQCT machine. This uses a very low dose of X-rays (much less than the daily background radiation we are all exposed to). We will measure the amount of water in your body. This measurement involves drinking some water containing heavy hydrogen molecules (deuterium). These molecules are not radioactive, they simply weigh more than most hydrogen molecules and they occur naturally in all of us. Before and 4 hours after the drink you will be asked to provide a saliva sample using an absorbent cotton wool swab. We will measure the volume of your body. This measurement involves you sitting still inside a chamber (with a clear window) called a BodPod for about 2 minutes whilst room air is gently blown around you. This measurement will be repeated a second and possibly third time. The test is performed with you wearing a swimming costume and a polyester swimming hat (which we will provide). We will perform a measurement of bioelectrical impedance using a low level of electrical current (that is undetectable), passed between electrodes in

244
contact with your hands and feet. The test is harmless and painless and gives a measure of body water. We will ask you some questions about general health, including any medicines being taken, and use a short questionnaire to measure your calcium intake and activity level. To avoid undressing we will give you a leaflet to complete in private, that shows pictures of the different stages of pubertal development and ask you to indicate which is closest to you. All the things we have asked you to do will take about 1 ½ hours. None of the tests will hurt you. j) To measure the amount of activity that you do, we will ask you to wear an
activity monitor on a belt during the daytime for 7 days (5 week days and 2 week-end days). This machine can be posted back to us when the measurements are finished.
Are there any risks and discomforts? All of the tests are painless and will not harm you. DXA and pQCT scans involve a tiny amount of radiation, which is less than half of a day’s background radiation in the United Kingdom (to which we are all exposed), and less than one tenth of the radiation from a flight across the Atlantic.
What are the potential benefits? The tests that we will use are mainly a research tool. However, if we identify any problems, we will, with your permission, contact your GP so that further investigations or treatment can be arranged if appropriate.
Who will have access to the research records? Only the researchers will have access to the data collected during this study.
Do I have to take part in this study? No. If you decide, now or at a later stage, that you do not wish to take part in the study, that is entirely your right and it will not prejudice any present or future treatment.
What will happen to the results of the research study? The results of this research will be published in a medical journal and presented at scientific meetings. The clinical team will receive the results of the bone density scan.
What if something goes wrong? The research project has been approved by an Independent Research Ethics Committee which believes that it is of minimal risk to you. However, any research can carry unforeseen risks and we want you to be informed of your rights in the unlikely event that any harm should occur as a result of taking part in this project.

245
This research is covered by a no-fault compensation scheme which may apply in the event of any significant harm resulting to you from involvement in the project. Under this scheme it would not be necessary for you to prove fault. You also have the right to claim damages in a court of law. This would require you to prove fault on the part of the Hospital/Institute and/or any manufacturer involved.
Who do I speak to if problems arise? If you have any complaints about the way in which this research project has been, or is being conducted, please, in the first instance, discuss them with the researcher. If the problems are not resolved, or you wish to comment in any other way, please contact Mrs Jane Clist by post at the Research and Development Office, Institute of Child Health, 30 Guilford Street, London WC1N 1EH, or, if urgent, by telephone on 020 7905 2201.
Details of how to contact the researchers: Jane Williams Research Nurse Childhood Nutrition Research Centre Institute of Child Health 30 Guilford Street London WC1N 1EH Tel: 0207 905 2743 Email; [email protected] Dr Mary Fewtrell Chief Investigator Childhood Nutrition Research Centre Institute of Child Health 30 Guilford Street London WC1N 1EH Tel: 0207 905 2389 Email; [email protected]
Thank-you for reading this information sheet!

246
Appendix 2.5. Parent of child with CF information sheet
MRC Childhood Nutrition Research Centre Institute of Child Health 30 Guilford Street London WC1N 1EH Tel 020 7905 2389
Title of project Body composition and bone mineralisation in children with Cystic Fibrosis compared to healthy children.
Parent Information Sheet Your child is being invited to take part in a research study. Before you decide whether he/she should take part or not, it is important to understand why the research is being done and what it will involve. Please take time to read the following information carefully and discuss it with others if you wish. Ask us if there is anything that is not clear or if you would like more information. You can find more general information about research on the Great Ormond Street Hospital website: (http://www.gosh.nhs.uk/gosh_families/research)
What is the aim of the study? The aim of this study is to measure the amount of fat, muscle and bone in children with cystic fibrosis (CF) and to see if these measurements relate to how well the children are.
Why is the study being done? Some children with CF may develop problems with growth, due to problems with the absorption of food. This may lead to differences in the proportions of fat and muscle in the body, and also with the amount of mineral in their bones. Until recently, it has been difficult to accurately measure the amounts of fat, muscle and bone in children, but we can now do this using some simple measurements that are available at GOSH.
How is the study to be done?

247
We are inviting all children aged 6-17 years with CF who attend GOSH to participate. If you are willing to take part in the study, we will arrange an appointment at a time which is convenient for you (if possible, at the same time as your outpatient appointment). If you and your child agree we will contact you again, every 2 years to repeat the measurements. You can decide on each occasion whether to take part. The study will take about 1 ½ hours and will take place in Great Ormond Street Hospital. We will reimburse any travelling expenses. At the appointment we will ask you to do the following: After the study has been explained to you (and we have answered all your questions) we would like you to sign a consent form. This will give us permission to include your child in the study and to obtain information about genotype (the genetic code) and clinical details from the hospital notes. We will also ask for your permission to contact you again in two years time. We will measure your child’s height, sitting height and weight, waist, hip, head, arm and leg circumference and limb length, and skin-folds (by pressing the fat gently on the arm, shoulder and abdomen). Children will not be asked to undress completely. We will ask your child to lie on a bed with a machine above them (DXA scan) that measures bone using very low dose X-rays (much less than the daily background radiation we are all exposed to). This will also take a picture of your child’s skeleton, which you can keep. The scans take a few minutes each, and are performed with your child wearing light indoor clothing (such as shorts and a t-shirt). These scans give a measurement of the size and amount of mineral in the bones, as well as the proportions of fat and muscle. If there is any possibility that the person being scanned is pregnant, the scan will not be performed. We will measure the strength of the bones in your child’s wrist and lower leg using an ultrasound machine. The measurements take a few minutes, are completely painless and do not use X-rays. We will measure the shape, size and bone mineral content of the tibia (lower leg bone) and radius (lower arm bone) using a pQCT machine. This uses a very low dose of X-rays (much less than the daily background radiation we are all exposed to). We will measure the amount of water in the body. This measurement involves drinking some water containing heavy oxygen molecules (18-oxygen). These molecules are not radioactive, they simply weigh more than most oxyogen molecules and they occur naturally in all of us. Before and 4 hours after the drink your child will be asked to provide a saliva sample using an absorbent cotton wool swab. We will measure the volume of the body. This measurement involves your child sitting still inside a chamber (with a clear window) called a BodPod for about 2 minutes whilst room air is gently blown around them. This measurement will be repeated a second and possibly a third time. The test is performed with the child wearing a swimming costume and a polyester swimming hat (which we will provide). We will perform a measurement of bioelectrical impedance using a low level of electrical current (that is undetectable), passed between electrodes in

248
contact with the hands and feet. The test is harmless and painless and gives a measure of body water. We will ask you and your child some questions about general health, including any medicines being taken, and use a short questionnaire to measure his or her calcium intake and activity level. For older children (above about 9 years of age) we also need to know if any pubertal development has taken place as this affects the growth and mineral content of bones. To avoid any undressing, we will show your child some pictures of the different stages of pubertal development (in private) and ask him or her to pick the one which is closest to them. All the things we have asked your child to do will take about 1 ½ hours. None of the tests will hurt your child. j) To measure the amount of activity that your child does, we will ask him or her to wear an activity monitor on a belt during the daytime for 7 days (5 week days and 2 week-end days). This machine can be posted back to us when the measurements are finished.
Are there any risks and discomforts? All of the tests are painless and will not harm your child. DXA and pQCT scans involve a tiny amount of radiation, which is less than half of a day’s background radiation in the United Kingdom (to which we are all exposed), and less than one tenth of the radiation from a flight across the Atlantic.
What are the potential benefits? The study could identify any abnormalities of bone density or in the proportions of fat and lean tissue. Where possible, these would be treated. Most children find the tests interesting and educational and each child will be given a printout of his/her skeleton to take home.
Who will have access to the research records? Only the researchers will have access to the data collected during this study.
Does my child have to take part in this study? No. If you decide, now or at a later stage, that you do not wish to take part in the study, that is entirely your right and it will not affect your child's clinical care.
What will happen to the results of the research study? The results of this research will be published in a medical journal and presented at scientific meetings. The clinical team will receive the results of the bone density scan.

249
What if something goes wrong? The research project has been approved by an Independent Research Ethics Committee which believes that it is of minimal risk to your child. However, any research can carry unforeseen risks and we want you to be informed of your rights in the unlikely event that any harm should occur as a result of taking part in this project. This research is covered by a no-fault compensation scheme which may apply in the event of any significant harm resulting to your child from involvement in the project. Under this scheme it would not be necessary for you to prove fault. You also have the right to claim damages in a court of law. This would require you to prove fault on the part of the Hospital/Institute and/or any manufacturer involved.
Who do I speak to if problems arise? If you have any complaints about the way in which this research project has been, or is being conducted, please, in the first instance, discuss them with the researcher. If the problems are not resolved, or you wish to comment in any other way, please contact Mrs Jane Clist at the Research and Development Office, Institute of Child Health, 30 Guilford Street, London WC1N 1EH, or, if urgent, by telephone on 020 7905 2201.
Details of how to contact the researchers: Jane Williams Research Nurse Childhood Nutrition Research Centre Institute of Child Health 30 Guilford Street London WC1N 1EH Tel: 0207 905 2743 Email; [email protected] Dr Mary Fewtrell Chief Investigator Childhood Nutrition Research Centre Institute of Child Health 30 Guilford Street London WC1N 1EH Tel: 0207 905 2389 Email; [email protected]
Thank-you for reading this information sheet!

250
Appendix 2.6. Parent of control child information sheet
MRC Childhood Nutrition Research Centre Institute of Child Health 30 Guilford Street London WC1N 1EH Tel 020 7905 2389
Title of project Body composition and bone mineralisation in children with Cystic Fibrosis compared to healthy children.
Parent Information Sheet Your child is being invited to take part in a research study. Before you decide whether he/she should take part or not, it is important to understand why the research is being done and what it will involve. Please take time to read the following information carefully and discuss it with others if you wish. Ask us if there is anything that is not clear or if you would like more information. You can find more general information about research on the Great Ormond Street Hospital website: (http://www.gosh.nhs.uk/gosh_families/research)
What is the aim of the study? The aim of this study is to measure the amount of fat, muscle and bone in children with cystic fibrosis (CF) and to see if these measurements relate to how well the children are. In order to do this we need to measure healthy children as a comparison.
Why is the study being done? Some children with CF may develop problems with growth, due to problems with the absorption of food. This may lead to differences in the proportions of fat and muscle in the body, and also with the amount of mineral in their bones. Until recently, it has been difficult to accurately measure the amounts of fat, muscle and bone in children, but we can now do this using some simple measurements that are available at GOSH.

251
How is the study to be done? We are inviting healthy, full term children aged 8-19 years to participate. If you are willing to take part in the study, we will arrange an appointment at a time which is convenient for you. If you and your child agree we will contact you again, every 2 years until your child is 19 years old to repeat the measurements. You can decide on each occasion whether to take part. The study will take about 1 ½ hours and will take place in Great Ormond Street Hospital. We will reimburse any travelling expenses. At the appointment we will ask you to do the following: After the study has been explained to you (and we have answered all your questions) we would like you to sign a consent form. This will give us permission to include your child in the study and to contact you again in two years time. We will measure your child’s height, sitting height and weight, waist, hip, head, arm and leg circumference and limb length, and skin-folds (by pressing the fat gently on the arm, shoulder and abdomen). Children will not be asked to undress completely. We will ask your child to lie on a bed with a machine above them (DXA scan) that measures bone using very low dose X-rays (much less than the daily background radiation we are all exposed to). This will also take a picture of your child’s skeleton, which you can keep. The scans take a few minutes each, and are performed with your child wearing light indoor clothing (such as shorts and a t-shirt). These scans give a measurement of the size and amount of mineral in the bones, as well as the proportions of fat and muscle. If there is any possibility that the person being scanned is pregnant, the scan will not be performed. We will measure the strength of the bones in your child’s wrist and lower leg using an ultrasound machine. The measurements take a few minutes, are completely painless and do not use X-rays. We will measure the shape, size and bone mineral content of the tibia (lower leg bone) and radius (lower arm bone) using a pQCT machine. This uses a very low dose of X-rays (much less than the daily background radiation we are all exposed to). We will measure the amount of water in the body. This measurement involves drinking some water containing heavy hydrogen molecules (deuterium). These molecules are not radioactive, they simply weigh more than most hydrogen molecules and they occur naturally in all of us. Before and 4 hours after the drink your child will be asked to provide a saliva sample using an absorbent cotton wool swab. We will measure the volume of the body. This measurement involves your child sitting still inside a chamber (with a clear window) called a BodPod for about 2 minutes whilst room air is gently blown around them. This measurement will be repeated a second and possibly a third time. The test is performed with the child wearing a swimming costume and a polyester swimming hat (which we will provide). We will perform a measurement of bioelectrical impedance using a low level of electrical current (that is undetectable), passed between electrodes in contact with the hands and feet. The test is harmless and painless and gives a measure of body water.

252
We will ask you and your child some questions about general health, including any medicines being taken, and use a short questionnaire to measure his or her calcium intake and activity level. For older children (above about 9 years of age) we also need to know if any pubertal development has taken place as this affects the growth and mineral content of bones. To avoid any undressing, we will show your child (in private) some pictures of the different stages of pubertal development and ask him or her to pick the one which is closest to them. All the things we have asked your child to do will take about 1 ½ hours. None of the tests will hurt your child. j) To measure the amount of activity that your child does, we will ask him or her to wear an activity monitor on a belt during the daytime for 7 days (5 week days and 2 week-end days). This machine can be posted back to us when the measurements are finished.
Are there any risks and discomforts? All of the tests are painless and will not harm your child. DXA and pQCT scans involve a tiny amount of radiation, which is less than half of a day’s background radiation in the United Kingdom (to which we are all exposed), and less than one tenth of the radiation from a flight across the Atlantic.
What are the potential benefits? The tests that we will use are mainly a research tool. However, if we identify any problems, we will, with your permission, contact your child’s GP so that further investigations or treatment can be arranged if appropriate.
Who will have access to the research records? Only the researchers will have access to the data collected during this study.
Does my child have to take part in this study? No. If you decide, now or at a later stage, that you do not wish to take part in the study, that is entirely your right and it will not prejudice any present or future treatment.
What will happen to the results of the research study? The results of this research will be published in a medical journal and presented at scientific meetings. The clinical team will receive the results of the bone density scan.
What if something goes wrong? The research project has been approved by an Independent Research Ethics Committee which believes that it is of minimal risk to your child. However, any research can carry unforeseen risks and we want you to be informed of your rights in the unlikely event that any harm should occur as a result of taking part in this project.

253
This research is covered by a no-fault compensation scheme which may apply in the event of any significant harm resulting to your child from involvement in the project. Under this scheme it would not be necessary for you to prove fault. You also have the right to claim damages in a court of law. This would require you to prove fault on the part of the Hospital/Institute and/or any manufacturer involved.
Who do I speak to if problems arise? If you have any complaints about the way in which this research project has been, or is being conducted, please, in the first instance, discuss them with the researcher. If the problems are not resolved, or you wish to comment in any other way, please contact Mrs Jane Clist at the Research and Development Office, Institute of Child Health, 30 Guilford Street, London WC1N 1EH, or, if urgent, by telephone on 020 7905 2201.
Details of how to contact the researchers: Jane Williams Research Nurse Childhood Nutrition Research Centre Institute of Child Health 30 Guilford Street London WC1N 1EH Tel: 0207 905 2743 Email; [email protected] Dr Mary Fewtrell Chief Investigator Childhood Nutrition Research Centre Institute of Child Health 30 Guilford Street London WC1N 1EH Tel: 0207 905 2389 Email; [email protected]
Thank-you for reading this information sheet!

254
Appendix 3. Appointment letter
UCL INSTITUTE OF CHILD HEALTH
Name and address
27 August 2013
Dear .........,
Appointment for body composition study on Tuesday 14th
April at 11.30am.
Thank you for volunteering to take part in the study of body composition at Great
Ormond Street Hospital. If you enter the main entrance of the hospital in Gt Ormond
Street I will meet you at the X ray reception which is situated on the same level and
in the Variety Club Building. Tell X ray reception that you are booked in for a
DEXA scan.
If you have any problems attending this appointment please call and leave me a
message, tel: 020 7905 2743 and I will organise another date. If you need to contact
me on the day, then ring the hospital switchboard, tel: 020 7405 9200 and ask them
for extension 2309 or 0559.
The bone density scan can be performed whilst wearing light clothing providing
there are no metal zips, buttons, bra hooks etc. In order to do an accurate
measurement of body volume in the Bodpod, it is necessary to wear a close fitting
swimming costume. Loose fitting shorts will affect the measurement and are not
acceptable but tight fitting shorts are acceptable. If you think you may have a
problem let me know before the appointment.
Please keep your travel tickets for re-imbursement on the day. The nearest
underground stations are Russell Sq and Holborn.
Please call me if you have any questions at all.
Yours sincerely,
Jane Williams
Research Nurse
Tel: 020 7905 2743
Email: [email protected]
Enc; Map and Information sheet

255
Appendix 4.1. Child assent form
ASSENT FORM
Title of the Research project:
Body composition and bone health in children with cystic fibrosis
Sponsor Protocol No: 02NT01
Investigator: Dr Mary Fewtrell
Contact details: : 0207 905 2389/2251 : [email protected]
Subject Identification No for this trial: ________________
Please initial box
to indicate agreement:
1
I have read and understand the information sheet dated 02/05/08 (version 1) for the above study
and have had the chance to ask questions.
2
I understand that taking part is voluntary and that I can decide not to take part at any time.
3
I agree to take part in the above study.
__________________________________ ___________ ______________
Name of young person Date Signature
_________________________________ ___________ ______________
Name of Person taking consent Date Signature
(if different from Investigator)
__________________________________ ___________ ______________
Investigator Date Signature

256
Appendix 4.2. Participant consent form
PARTICIPANT CONSENT FORM
Title of the Research project:
Body composition and bone health in children with cystic fibrosis
Sponsor Protocol No: 02NT01
Investigator: Dr Mary Fewtrell
Contact details: :0207 905 2389/2251 : [email protected]
Subject Identification No for this trial: ________________
Please initial box
to indicate agreement:
1
I confirm that I have read and understand the information sheet dated 02/05/08 (version 1) for the
above study. I have had the opportunity to consider the information, ask questions and have had
these answered satisfactorily.
2
I understand that my participation is voluntary and that I am free to withdraw at
any time, without giving any reason, without my medical care or legal rights being affected.
3
I understand that relevant sections of any of my Medical Notes and data collected during the study,
may be looked at, by employees from Regulatory Authorities or from Great Ormond Street
Hospital/ Institute of Child Health, where it is relevant to my taking part in this research. I give
permission for these individuals to have access to my records.
4 I agree to my GP being informed of any sub-optimal results noted as a result of participating in
this study.
5
I agree to take part in the above study and I understand that I may be contacted in the
future regarding re-measurement. I will be able to decide at that time whether to take
part and give consent.
__________________________________ ___________ ______________
Name of Participant Date Signature
_________________________________ ___________ ______________
Name of Person taking consent Date Signature
(if different from Investigator)
__________________________________ ___________ ______________
Investigator Date Signature

257
Appendix 4.3. Parent consent form
PARENT/GUARDIAN CONSENT FORM
Title of the Research project: Body composition and bone health in children with cystic fibrosis
Sponsor Protocol No: 02NT01 Investigator: Dr Mary Fewtrell
Contact details: :0207 905 2389/2251 : [email protected]
Subject Identification No for this trial: ________________
Please initial box
to indicate agreement:
1
I confirm that I have read and understand the information sheet dated 02/05/08 (version 1) for the
above study. I have had the opportunity to consider the information, ask questions and have had
these answered satisfactorily.
2
I understand that my child’s participation is voluntary and that he/she is free to withdraw at
any time, without giving any reason, without his/her medical care or legal rights being
affected.
3
I understand that relevant sections of any of my child’s Medical Notes and data collected during the
study, may be looked at, by employees from Regulatory Authorities or from Great Ormond Street
Hospital/ Institute of Child Health, where it is relevant to my child’s taking part in this research. I
give permission for these individuals to have access to my child’s records.
4 I agree to my child’s GP being informed of any sub-optimal results noted as a result of participating
in this study.
5
I agree to my child taking part in the above study and I understand that I may be contacted in the
future regarding re-measurement. I will be able to decide at that time whether to take
part and give consent.
__________________________________
Name of Child
__________________________________ ___________ ______________
Name of Parent/Guardian Date Signature
_________________________________ ___________ ______________
Name of Person taking consent Date Signature
(if different from Investigator)
__________________________________ ___________ ______________
Investigator Date Signature

258
Appendix 5.1. Questionnaires for children with CF

259

260

261

262

263

264

265

266

267
Appendix 5.2. Questionnaire for control children

268

269

270

271

272

273

274

275
Appendix 6. Saliva collection information INSTRUCTIONS FOR TAKING SALIVA SAMPLE
Study No.
Date
We need you to take a sample of saliva after you get home and post it back to us in
the envelope provided.
…………. hours after your special drink, at …….……..pm we would like you to do
another saliva sample in the same way you did the first. Do not eat, drink or clean
your teeth for 30 minutes before taking the sample. Move the swab around your
mouth until it is very wet without chewing on it.
It is very important that you take the sample at this time but if it is not possible it is
better that you tell us the time it was taken.
Record time sample taken here………………..
We also need to know how much you drank in the period between the special drink
and the saliva sample you have done at home.
Record the amount of drink you have had:
………………..cups
………………..mugs
………………..small glasses
………………..large glasses
………………..cans (330ml)
………………..bottles (500ml)
Place the cotton swab in the tube and replace the lid firmly. Put the tube in the
plastic bag and seal carefully.
Please return this sheet and the sample in the envelope provided as soon as possible.
THANK YOU FOR TAKING PART IN THIS STUDY
Jane Williams
Research Nurse
MRC Childhood Nutrition Research Centre
Institute of Child Health
30, Guilford Street
London WC1N 1EH
020 7905 2743

276
Appendix 7. Certificate

277
Appendix 8.1. Boys puberty questionnaire

278
Appendix 8.2. Girls puberty questionnaire

279
Appendix 9. Comparison between children with CF that
have dropped-out and those remaining in study after 2
years
Drop-outs Remaining in study
Boys Girls Boys Girls
Mean SD P Mean SD P Mean SD Mean SD
Age 8.85 1.76 NS 9.99 2.15 NS 8.99 1.32 9.36 1.50
Height SDS -0.07 0.80 NS -0.78 1.45 NS -0.55 1.02 -0.62 1.09
Weight SDS 0.62 1.30 NS -0.87 0.97 NS -0.21 1.05 -0.58 1.06
BMI SDS 0.83 1.68 NS -0.57 0.46 NS 0.18 0.94 -0.35 1.09
FEV1 SDS -0.73 2.06 NS -2.36 1.29 NS -0.21 1.46 -1.64 1.49

280
Appendix 10. Regression of factors impacting on waist
circumference.
Regression analysis of effect of body composition, age, sex and height on waist
circumference with sex as male = 0, female =1.
Children with CF;
Waist circumference = 67.518 +1.224 (FM) + 0.838 (FFM) + 0.625 (age) – 2.303
(female) – 28.408 (height)
Adjusted R2 = 0.858
Controls;
Waist circumference = 61.405 + 1.260(FM) + 0.690(FFM) – 0.254 (age) –
1.249(female) – 18.029(height)
Adjusted R2 = 0.913
Partial correlations of the relationship between waist circumference and fat
mass or fat-free mass or age or sex or height each adjusted for the others.
CF Controls
Partial correlation
(adjusted for all other
factors)
R P R P
Waist circumference and fat
mass
0.817 <0.001 0.901 <0.001
Waist circumference and fat-
free mass
0.533 <0.001 0.604 <0.001
Waist circumference and age 0.254 0.022 -0.096 0.392
Waist circumference and sex -0.415 <0.001 -0.262 0.018
Waist circumference and
height
-0.414 <0.001 -0.301 0.006

281
Appendix 11. Regression analyses for the relationship
between baseline FEV1 and change in body composition and
baseline body composition and change in FEV1.
Boys Girls
IV DV B SEM P B SEM P Baseline
FMI SDS
Change
FEV1 SDS
-0.28 0.17 0.120 0.01 0.19 0.950
Baseline
FFMI SDS
Change
FEV1 SDS
0.17 0.16 0.191 0.24 0.17 0.181
Baseline
FEV1
Change
FMI SDS
-0.12 0.08 0.141 -0.05 0.08 0.589
Baseline
FEV1
Change
FFMI SDS
0.18 0.07 0.023 -0.01 0.06 0.851
Baseline
FMI SDS
Conditional
change FEV1 SDS
-0.25 0.17 0.149 0.08 0.18 0.662
Baseline
FFMI SDS
Conditional
change FEV1 SDS
0.18 0.16 0.258 0.22 0.16 0.170
Baseline
FEV1 SDS
Conditional change
FMI SDS
-0.11 0.07 0.146 -0.02 0.09 0.827
Baseline
FEV1 SDS
Conditional
change FFMI SDS
0.18 0.07 0.020 -0.01 0.06 0.557

282
Appendix 12. Bland-Altman analyses for simpler body composition techniques compared to the 4-
component model.
Figure 1 (a-c) shows the results of the Bland-Altman analysis for DXA (whole body and regional), SFTs and BMI for predicting 4C FM SDS,
and for DXA (whole body and regional) FMI for predicting 4C FMI SDS. Using the same analyses, Figure 2 (a-b) shows the assessment for
DXA, TBW and BIA to predict 4C FFM SDS and height adjusted DXA FFMI to predict 4C FFMI SDS.
Graphs are on following pages.

283
Figure 1a. Bland-Altman analyses of agreement between the 4-component model and dual-energy X-ray absorptiometry, skinfold thicknesses and body mass
index in the assessment of fat mass and fat mass index.
DXA FM DXA FMI
DXA limb FM DXA limb FMI

284
Figure 1b. Bland-Altman analyses of agreement between the 4-component model and dual-energy X-ray absorptiometry, skinfold thicknesses
and body mass index in the assessment of fat mass and fat mass index.
DXA trunk FM DXA trunk FMI
BMI Sum 4SFT

285
Figure 1c. Bland-Altman analyses of agreement between the 4-component model and dual-energy X-ray absorptiometry, skinfold thicknesses
and body mass index in the assessment of fat mass and fat mass index.
Bicep SFT Tricep SFT
Subscapular SFT Supra-iliac SFT

286
Figure 2a. Bland-Altman analyses of agreement between the 4-component model and dual-energy X-ray absorptiometry, total body water and
bio-electrical impedance in the assessment of fat-free mass and fat-free mass index.
DXA FFM DXA FFMI
DXA limb FFM DXA limb FFMI

287
Figure 2a. Bland-Altman analyses of agreement between the 4-component model and dual-energy X-ray absorptiometry, total body water and
bio-electrical impedance in the assessment of fat-free mass and fat-free mass index.
DXA trunk FFM DXA trunk FFMI
TBW BIA

288
Appendix 13. Bland Altman correlations, unadjusted and adjusted for age, and age and sex
2
Pearson’s correlation between the bias in individuals and the mean values (unadjusted and adjusted for age and for age and sex).
R
unadjusted
P R
adjusted
for age
P R
Adjusted for
age and sex
P2
SDS
Measure of ‘fatness’
DXA fat mass -0.279 P<0.001 -0.281 P<0.001 -0.288 P<0.001
DXA fat mass index -0.251 P<0.001 -0.251 P<0.001 -0.232 P<0.001
DXA limb fat mass -0.294 P<0.001 -0.294 P<0.001 -0.303 P<0.001
DXA limb fat mass index -0.233 P<0.001 -0.235 P<0.001 -0.220 P<0.001
DXA trunk fat mass -0.282 P<0.001 -0.287 P<0.001 -0.292 P<0.001
DXA trunk fat mass index -0.228 P<0.001 -0.230 P<0.001 -0.218 P<0.001
Bicep skinfold -0.331 P<0.001 -0.334 P<0.001 -0.314 P<0.001
Tricep skinfold -0.142 0.021 -0.145 0.018 -0.150 0.015
Subscapular skinfold -0.072 0.245 -0.074 0.229 -0.049 0.424
Supra-iliac skinfold 0.001 0.982 0.001 0.982 0.009 0.886
Sum 4 skinfold -0.350 P<0.001 -0.354 P<0.001 -0.339 P<0.001
BMI 0.049 0.429 0.039 0.531 0.042 0.492
Measure of ‘leanness’
DXA fat-free mass 0.209 0.001 0.217 P<0.001 0.214 P<0.001
DXA fat-free mass index 0.114 0.064 0.093 0.132 0.089 0.149
DXA limb fat-free mass 0.096 0.121 0.098 0.112 0.072 0.244
DXA limb fat-free mass index 0.049 0.424 0.048 0.435 0.041 0.507
DXA trunk fat-free mass 0.004 0.947 0.003 0.966 0.017 0.788
DXA trunk fat-free mass index -0.002 0.977 -0.036 0.559 -0.022 0.723
Total body water 0.014 0.819 0.025 0.681 0.035 0.577
Bio-electrical impedance 0.003 0.975 0.019 0.826 0.004 0.967

289
Appendix 14. Characteristics of children used and not used in
generation of a regression equation to correct for bias in bio-
electrical impedance standard deviation scores.
N Mean
age y
SD Range
y
Males Females
Included in the regression model 61 12.6 2.8 7.0-
17.0
29 32
Excluded from the equation model
(longitudinal subjects)
81 10.7 2.4 6.7-
16.6
36 45
No bio-electrical impedance data 124 12.2 2.5 6.9-
16.5
59 65

290
Bibliography
Reference List
1. Mehta G, Macek M, Jr., Mehta A. Cystic fibrosis across Europe: EuroCareCF
analysis of demographic data from 35 countries. J Cyst Fibros 2010;9 Suppl
2:S5-S21.
2. Wells JC, Williams JE, Chomtho S et al. Body-composition reference data for
simple and reference techniques and a 4-component model: a new UK reference
child. Am J Clin Nutr 2012.
3. Dodge JA, Morison S, Lewis PA et al. Incidence, population, and survival of
cystic fibrosis in the UK, 1968-95. UK Cystic Fibrosis Survey Management
Committee. Arch Dis Child 1997;77:493-6.
4. Hull J. Basic science of cystic fibrosis. Current Paediatrics 2003;13:253-8.
5. McKone EF, Emerson SS, Edwards KL, Aitken ML. Effect of genotype on
phenotype and mortality in cystic fibrosis: a retrospective cohort study. Lancet
2003;361:1671-6.
6. Kerem E, Corey M, Kerem BS et al. The relation between genotype and
phenotype in cystic fibrosis--analysis of the most common mutation (delta F508).
N Engl J Med 1990;323:1517-22.
7. Kerem E, Corey M, Gold R, Levison H. Pulmonary function and clinical course
in patients with cystic fibrosis after pulmonary colonization with Pseudomonas
aeruginosa. J Pediatr 1990;116:714-9.
8. Schoni MH, Casaulta-Aebischer C. Nutrition and lung function in cystic fibrosis
patients: review. Clinical Nutrition 2000;19:79-85.
9. Aurora P, Wade A, Whitmore P, Whitehead B. A model for predicting life
expectancy of children with cystic fibrosis. Eur Respir J 2000;16:1056-60.
10. Zemel BS, Jawad AF, FitzSimmons S, Stallings VA. Longitudinal relationship
among growth, nutritional status, and pulmonary function in children with cystic
fibrosis: analysis of the Cystic Fibrosis Foundation National CF Patient Registry.
J Pediatr 2000;137:374-80.
11. Pedreira CC, Robert RG, Dalton V et al. Association of body composition and
lung function in children with cystic fibrosis. Pediatr Pulmonol 2005;39:276-80.
12. Hoffman RD, Isenberg JN, Powell GK. Carbohydrate malabsorption is minimal
in school-age cystic fibrosis children. Dig Dis Sci 1987;32:1071-4.

291
13. Steinkamp G, Wiedemann B. Relationship between nutritional status and lung
function in cystic fibrosis: cross sectional and longitudinal analyses from the
German CF quality assurance (CFQA) project. Thorax 2002;57:596-601.
14. Stallings VA, Stark LJ, Robinson KA, Feranchak AP, Quinton H. Evidence-
based practice recommendations for nutrition-related management of children
and adults with cystic fibrosis and pancreatic insufficiency: results of a
systematic review. J Am Diet Assoc 2008;108:832-9.
15. Morison S, Dodge JA, Cole TJ et al. Height and weight in cystic fibrosis: a cross
sectional study. UK Cystic Fibrosis Survey Management Committee. Arch Dis
Child 1997;77:497-500.
16. Bell SC, Saunders MJ, Elborn JS, Shale DJ. Resting energy expenditure and
oxygen cost of breathing in patients with cystic fibrosis. Thorax 1996;51:126-31.
17. Shepherd RW, Greer RM, McNaughton SA, Wotton M, Cleghorn GJ. Energy
expenditure and the body cell mass in cystic fibrosis. Nutrition 2001;17:22-5.
18. Magoffin A, Allen JR, McCauley J et al. Longitudinal analysis of resting energy
expenditure in patients with cystic fibrosis. J Pediatr 2008;152:703-8.
19. Allen JR, McCauley JC, Selby AM et al. Differences in resting energy
expenditure between male and female children with cystic fibrosis. J Pediatr
2003;142:15-9.
20. Bronstein MN, Davies PS, Hambidge KM, Accurso FJ. Normal energy
expenditure in the infant with presymptomatic cystic fibrosis. J Pediatr
1995;126:28-33.
21. Shepherd RW, Holt TL, Cleghorn G, Ward LC, Isles A, Francis P. Short-term
nutritional supplementation during management of pulmonary exacerbations in
cystic fibrosis: a controlled study, including effects of protein turnover. Am J
Clin Nutr 1988;48:235-9.
22. Thomson MA, Wilmott RW, Wainwright C, Masters B, Francis PJ, Shepherd
RW. Resting energy expenditure, pulmonary inflammation, and genotype in the
early course of cystic fibrosis. J Pediatr 1996;129:367-73.
23. Moudiou T, Galli-Tsinopoulou A, Nousia-Arvanitakis S. Effect of exocrine
pancreatic function on resting energy expenditure in cystic fibrosis. Acta Paediatr
2007;96:1521-5.
24. Greer R, Shepherd R, Cleghorn G, Bowling FG, Holt T. Evaluation of growth
and changes in body composition following neonatal diagnosis of cystic fibrosis.
J Pediatr Gastroenterol Nutr 1991;13:52-8.

292
25. Holliday KE, Allen JR, Waters DL, Gruca MA, Thompson SM, Gaskin KJ.
Growth of human milk-fed and formula-fed infants with cystic fibrosis. J Pediatr
1991;118:77-9.
26. Simmonds EJ, Wall CR, Wolfe SP, Littlewood JM. A review of infant feeding
practices at a regional cystic fibrosis unit. Journal of Human Nutrition and
Dietetics 1994;7:31-8.
27. Farrell PM, Kosorok MR, Laxova A et al. Nutritional benefits of neonatal
screening for cystic fibrosis. Wisconsin Cystic Fibrosis Neonatal Screening
Study Group. N Engl J Med 1997;337:963-9.
28. Farrell PM, Kosorok MR, Rock MJ et al. Early diagnosis of cystic fibrosis
through neonatal screening prevents severe malnutrition and improves long-term
growth. Wisconsin Cystic Fibrosis Neonatal Screening Study Group. Pediatrics
2001;107:1-13.
29. Ghosal S, Taylor CJ, Pickering M, McGaw J, Beckles-Willson N, Wales JK.
Disproportionate head growth retardation in cystic fibrosis. Arch Dis Child
1995;72:150-2.
30. Imrie JR, Fagan DG, Sturgess JM. Quantitative evaluation of the development of
the exocrine pancreas in cystic fibrosis and control infants. Am J Pathol
1979;95:697-708.
31. Richardson I, Nyulasi I, Cameron K, Ball M, Wilson J. Nutritional status of an
adult cystic fibrosis population. Nutrition 2000;16:255-9.
32. Murphy JL, Wootton SA, Bond SA, Jackson AA. Energy content of stools in
normal healthy controls and patients with cystic fibrosis. Archives of Disease in
Childhood 1991;66:495-500.
33. White H, Wolfe SP, Foy J, Morton A, Conway SP, Brownlee KB. Nutritional
intake and status in children with cystic fibrosis: does age matter? J Pediatr
Gastroenterol Nutr 2007;44:116-23.
34. Weltman EA, Stern RC, Doershuk CF, Moir RN, Palmer K, Jaffe AC. Weight
and menstrual function in patients with eating disorders and cystic fibrosis.
Pediatrics 1990;85:282-7.
35. Johannesson M, Gottlieb C, Hjelte L. Delayed puberty in girls with cystic
fibrosis despite good clinical status. Pediatrics 1997;99:29-34.
36. Buntain HM, Schluter PJ, Bell SC et al. Controlled longitudinal study of bone
mass accrual in children and adolescents with cystic fibrosis. Thorax
2006;61:146-54.

293
37. Meachery G, De SA, Nicholson A et al. Outcomes of lung transplantation for
cystic fibrosis in a large UK cohort. Thorax 2008;63:725-31.
38. Elborn JS, Shale DJ, Britton JR. Cystic fibrosis: current survival and population
estimates to the year 2000. Thorax 1991;46:881-5.
39. Corey M, McLaughlin FJ, Williams M, Levison H. A comparison of survival,
growth, and pulmonary function in patients with cystic fibrosis in Boston and
Toronto. J Clin Epidemiol 1988;41:583-91.
40. Wells JCK. Sexual dimorphism of body composition. Best Practice & Research
Clinical Endocrinology & Metabolism 2007;21:415-30.
41. Wells JC. A Hattori chart analysis of body mass index in infants and children. Int
J Obes Relat Metab Disord 2000;24:325-9.
42. Bogin B. Patterns of human growth. Cambridge University Press, 1999.
43. Faulkner RA, Bailey DA, Drinkwater DT, Wilkinson AA, Houston CS, McKay
HA. Regional and total body bone mineral content, bone mineral density, and
total body tissue composition in children 8-16 years of age. Calcif Tissue Int
1993;53:7-12.
44. Rico H, Revilla M, Hernandez ER, Villa LF, Alvarez del BM. Sex differences in
the acquisition of total bone mineral mass peak assessed through dual-energy X-
ray absorptiometry. Calcif Tissue Int 1992;51:251-4.
45. Maynard LM, Guo SS, Chumlea WC et al. Total-body and regional bone mineral
content and areal bone mineral density in children aged 8-18 y: the Fels
Longitudinal Study. Am J Clin Nutr 1998;68:1111-7.
46. Jeejeebhoy KN. Body composition in weight loss and pathological states. In:
Roche AF, Heymsfield S, Lohman T, eds. Human Body Composition.
Champaign: Human Kinetics 1996:275-83.
47. Keys A, Brozek J, Hanschel A et al. The Bilogy of Human Starvation.
Minneapolis: University of Minnesota Press 1950.
48. Shepherd RW, Holt TL, Greer R, Cleghorn GJ, Thomas BJ. Total body
potassium in cystic fibrosis. J Pediatr Gastroenterol Nutr 1989;9:200-5.
49. Shepherd RW, Cleghorn G, Ward LC, Wall CR, Holt TL. Nutrition in cystic
fibrosis. Nutrition Research Reviews 1991;4:51-67.
50. Shepherd RW, Holt TL, Thomas BJ et al. Nutritional rehabilitation in cystic
fibrosis: controlled studies of effects on nutritional growth retardation, body
protein turnover, and course of pulmonary disease. J Pediatr 1986;109:788-94.

294
51. Sullivan PB, Alder N, Bachlet AM et al. Gastrostomy feeding in cerebral palsy:
too much of a good thing? Dev Med Child Neurol 2006;48:877-82.
52. Kastner-Cole D, Palmer CN, Ogston SA, Mehta A, Mukhopadhyay S.
Overweight and obesity in deltaF508 homozygous cystic fibrosis. J Pediatr
2005;147:402-4.
53. Burden ST, Stoppard E, Shaffer J, Makin A, Todd C. Can we use mid upper arm
anthropometry to detect malnutrition in medical inpatients? A validation study. J
Hum Nutr Diet 2005;18:287-94.
54. Cole TJ, Freeman JV, Preece MA. Body mass index reference curves for the UK,
1990. Arch Dis Child 1995;73:25-9.
55. Wiedemann B, Paul KD, Stern M, Wagner TO, Hirche TO. Evaluation of body
mass index percentiles for assessment of malnutrition in children with cystic
fibrosis. Eur J Clin Nutr 2007;61:759-68.
56. Zhang Z, Lai HJ. Comparison of the use of body mass index percentiles and
percentage of ideal body weight to screen for malnutrition in children with cystic
fibrosis. Am J Clin Nutr 2004;80:982-91.
57. Beker LT, Russek-Cohen E, Fink RJ. Stature as a prognostic factor in cystic
fibrosis survival. J Am Diet Assoc 2001;101:438-42.
58. Sharma R, Florea VG, Bolger AP et al. Wasting as an independent predictor of
mortality in patients with cystic fibrosis. Thorax 2001;56:746-50.
59. Soutter VL, Kristidis P, Gruca MA, Gaskin KJ. Chronic undernutrition/growth
retardation in cystic fibrosis. Clin Gastroenterol 1986;15:137-55.
60. Corey M, Levison H, Crozier D. Five- to seven-year course of pulmonary
function in cystic fibrosis. Am Rev Respir Dis 1976;114:1085-92.
61. Fogarty A, Hubbard R, Britton J. International comparison of median age at
death from cystic fibrosis. Chest 2000;117:1656-60.
62. McNaughton SA, Shepherd RW, Greer RG, Cleghorn GJ, Thomas BJ.
Nutritional status of children with cystic fibrosis measured by total body
potassium as a marker of body cell mass: lack of sensitivity of anthropometric
measures. J Pediatr 2000;136:188-94.
63. Stapleton D, Kerr D, Gurrin L, Sherriff J, Sly P. Height and weight fail to detect
early signs of malnutrition in children with cystic fibrosis. J Pediatr
Gastroenterol Nutr 2001;33:319-25.
64. Henderson RC, Madsen CD. Bone mineral content and body composition in
children and young adults with cystic fibrosis. Pediatr Pulmonol 1999;27:80-4.

295
65. Bianchi ML, Romano G, Saraifoger S, Costantini D, Limonta C, Colombo C.
BMD and body composition in children and young patients affected by cystic
fibrosis. J Bone Miner Res 2006;21:388-96.
66. Umlawska W, Susanne C. Growth and nutritional status in children and
adolescents with cystic fibrosis. Ann Hum Biol 2008;35:145-53.
67. Zemel BS, Kawchak DA, Cnaan A, Zhao H, Scanlin TF, Stallings VA.
Prospective evaluation of resting energy expenditure, nutritional status,
pulmonary function, and genotype in children with cystic fibrosis. Pediatr Res
1996;40:578-86.
68. Peterson ML, Jacobs DR, Jr., Milla CE. Longitudinal changes in growth
parameters are correlated with changes in pulmonary function in children with
cystic fibrosis. Pediatrics 2003;112:588-92.
69. Williams JE, Wells JC, Benden C et al. Body composition assessed by the 4-
component model and association with lung function in 6-12-y-old children with
cystic fibrosis. Am J Clin Nutr 2010;92:1332-43.
70. Lazarus R, Colditz G, Berkey CS, Speizer FE. Effects of body fat on ventilatory
function in children and adolescents: Cross-sectional findings from a random
population sample of school children. Pediatric Pulmonology 1997;24:187-94.
71. Canoy D, Luben R, Welch A et al. Abdominal obesity and respiratory function in
men and women in the EPIC-Norfolk Study, United Kingdom. Am J Epidemiol
2004;159:1140-9.
72. Stallings VA, Tomezsko JL, Schall JI et al. Adolescent development and energy
expenditure in females with cystic fibrosis. Clin Nutr 2005;24:737-45.
73. Forrester D, Knox AJ, Smyth AR, Fogarty AW. Measures of body habitus are
associated with lung function in adults with cystic fibrosis: A population based
study. Journal of Cystic Fibrosis 2012;In press.
74. de Meer K, Gulmans VA, Westerterp KR, Houwen RH, Berger R. Skinfold
measurements in children with cystic fibrosis: monitoring fat-free mass and
exercise effects. Eur J Pediatr 1999;158:800-6.
75. King S, Wilson J, Kotsimbos T, Bailey M, Nyulasi I. Body composition
assessment in adults with cystic fibrosis: comparison of dual-energy X-ray
absorptiometry with skinfolds and bioelectrical impedance analysis. Nutrition
2005;21:1087-94.
76. Tomezsko JL, Scanlin TF, Stallings VA. Body composition of children with
cystic fibrosis with mild clinical manifestations compared with normal children.
Am J Clin Nutr 1994;59:123-8.

296
77. Frisancho AR. New norms of upper limb fat and muscle areas for assessment of
nutritional status. AJCN 1981;34:2540-5.
78. Borowitz D, Baker RD, Stallings V. Consensus report on nutrition for pediatric
patients with cystic fibrosis. J Pediatr Gastroenterol Nutr 2002;35:246-59.
79. Chomtho S, Fewtrell MS, Jaffe A, Williams JE, Wells JC. Evaluation of arm
anthropometry for assessing pediatric body composition: evidence from healthy
and sick children. Pediatr Res 2006;59:860-5.
80. Azcue M, Fried M, Pencharz PB. Use of bioelectrical impedance analysis to
measure total body water in patients with cystic fibrosis. J Pediatr Gastroenterol
Nutr 1993;16:440-5.
81. Borowitz D, Conboy K. Are bioelectric impedance measurements valid in
patients with cystic fibrosis? J Pediatr Gastroenterol Nutr 1994;18:453-6.
82. Quirk PC, Ward LC, Thomas BJ, Holt TL, Shepherd RW, Cornish BH.
Evaluation of bioelectrical impedance for prospective nutritional assessment in
cystic fibrosis. Nutrition 1997;13:412-6.
83. Spicher V, Roulet M, Schaffner C, Schutz Y. Bio-electrical impedance analysis
for estimation of fat-free mass and muscle mass in cystic fibrosis patients. Eur J
Pediatr 1993;152:222-5.
84. Groeneweg M, Tan S, Boot AM, de Jonqste JC, Bouquet J, Sinaasappel M.
Assessment of nutritional status in children with cystic fibrosis: Conventional
anthropometry and bio-electrical impedance analysis. Journal of Cystic Fibrosis
2002;1:276-80.
85. Lukaski HC, Bolonchuk WW. Theory and validation of the tetrapolar bio-
electrical impedance method to assess human body composition. In: Ellis K, ed.
In vivo body composition studies: Proceedings of an international symposium.
New York: 1986:411-4.
86. Segal KR, Van Loan M, Fitzgerald PI, Hodgdon JA, Van Itallie TB. Lean body
mass estimation by bio-electrical impedance analysis: a four-site cross-validation
study. Am J Clin Nutr 1988;47:7-14.
87. Eisenmann JC, Heelan KA, Welk GJ. Assessing body composition among 3- to
8-year-old children: anthropometry, BIA, and DXA. Obes Res 2004;12:1633-40.
88. Haroun D, Taylor SJ, Viner RM et al. Validation of bioelectrical impedance
analysis in adolescents across different ethnic groups. Obesity (Silver Spring)
2010;18:1252-9.

297
89. Haroun D, Croker H, Viner RM et al. Validation of BIA in obese children and
adolescents and re-evaluation in a longitudinal study. Obesity (Silver Spring)
2009;17:2245-50.
90. Houtkooper LB, Going SB, Lohman TG, Roche AF, Van LM. Bioelectrical
impedance estimation of fat-free body mass in children and youth: a cross-
validation study. J Appl Physiol 1992;72:366-73.
91. Deurenberg P, van der Kooy K, Leenen R, Weststrate JA, Seidell JC. Sex and
age specific prediction formulas for estimating body composition from
bioelectrical impedance: a cross-validation study. Int J Obes 1991;15:17-25.
92. Puiman PJ, Francis P, Buntain H, Wainwright C, Masters B, Davies PS. Total
body water in children with cystic fibrosis using bioelectrical impedance. J Cyst
Fibros 2004;3:243-7.
93. Knowles M, Gatzy J, Boucher R. Increased bioelectric potential difference across
respiratory epithelia in cystic fibrosis. N Engl J Med 1981;305:1489-95.
94. Quinton PM, Bijman J. Higher bioelectric potentials due to decreased chloride
absorption in the sweat glands of patients with cystic fibrosis. N Engl J Med
1983;308:1185-9.
95. Sood M, Adams JE, Mughal MZ. Lean body mass in children with cystic
fibrosis. Arch Dis Child 2003;88:836.
96. Stettler N, Kawchak DA, Boyle LL et al. Prospective evaluation of growth,
nutritional status, and body composition in children with cystic fibrosis. Am J
Clin Nutr 2000;72:407-13.
97. Marin VB, Velandia S, Hunter B et al. Energy expenditure, nutrition status, and
body composition in children with cystic fibrosis. Nutrition 2004;20:181-6.
98. Haworth CS, Selby PL, Webb AK et al. Low bone mineral density in adults with
cystic fibrosis. Thorax 1999;54:961-7.
99. Fewtrell MS, Benden C, Williams JE et al. Undercarboxylated osteocalcin and
bone mass in 8-12áyear old children with cystic fibrosis. Journal of Cystic
Fibrosis 2008;7:307-12.
100. Buntain HM, Greer RM, Schluter PJ et al. Bone mineral density in Australian
children, adolescents and adults with cystic fibrosis: a controlled cross sectional
study. Thorax 2004;59:149-55.
101. Shypailo RJ, Butte NF, Ellis KJ. DXA: can it be used as a criterion reference for
body fat measurements in children? Obesity (Silver Spring) 2008;16:457-62.

298
102. Williams JE, Wells JC, Wilson CM, Haroun D, Lucas A, Fewtrell MS.
Evaluation of Lunar Prodigy dual-energy X-ray absorptiometry for assessing
body composition in healthy persons and patients by comparison with the
criterion 4-component model. Am J Clin Nutr 2006;83:1047-54.
103. Reix P, Bellon G, Braillon P. Bone mineral and body composition alterations in
paediatric cystic fibrosis patients. Pediatr Radiol 2010;40:301-8.
104. Ionescu AA, Evans WD, Pettit RJ, Nixon LS, Stone MD, Shale DJ. Hidden
depletion of fat-free mass and bone mineral density in adults with cystic fibrosis.
Chest 2003;124:2220-8.
105. Sermet-Gaudelus I, Souberbielle JC, Azhar I et al. Insulin-like growth factor I
correlates with lean body mass in cystic fibrosis patients. Arch Dis Child
2003;88:956-61.
106. Levy LD, Durie PR, Pencharz PB, Corey ML. Effects of long-term nutritional
rehabilitation on body composition and clinical status in malnourished children
and adolescents with cystic fibrosis. J Pediatr 1985;107:225-30.
107. Pencharz P, Hill R, Archibald E, Levy L, Newth C. Energy needs and nutritional
rehabilitation in undernourished adolescents and young adult patients with cystic
fibrosis. J Pediatr Gastroenterol Nutr 1984;3 Suppl 1:S147-S153.
108. Vaisman N, Clarke R, Pencharz PB. Nutritional rehabilitation increases resting
energy expenditure without affecting protein turnover in patients with cystic
fibrosis. J Pediatr Gastroenterol Nutr 1991;13:383-90.
109. Wang Z, St-Onge MP, Lecumberri B et al. Body cell mass: model development
and validation at the cellular level of body composition. Am J Physiol
Endocrinol Metab 2004;286:E123-E128.
110. Murphy AJ, Buntain HM, Wainwright CE, Davies PS. The nutritional status of
children with cystic fibrosis. Br J Nutr 2006;95:321-4.
111. Ahmed ML, Ong KK, Thomson AH, Dunger DB. Reduced gains in fat and fat-
free mass, and elevated leptin levels in children and adolescents with cystic
fibrosis. Acta Paediatr 2004;93:1185-91.
112. Rosenfeld M, Davis R, FitzSimmons S, Pepe M, Ramsey B. Gender gap in cystic
fibrosis mortality. Am J Epidemiol 1997;145:794-803.
113. Kerem E, Reisman J, Corey M, Canny GJ, Levison H. Prediction of mortality in
patients with cystic fibrosis. N Engl J Med 1992;326:1187-91.
114. Milla CE, Warwick WJ. Risk of death in cystic fibrosis patients with severely
compromised lung function. Chest 1998;113:1230-4.

299
115. Milla CE. Association of nutritional status and pulmonary function in children
with cystic fibrosis. Curr Opin Pulm Med 2004;10:505-9.
116. Sermet-Gaudelus I, Souberbielle JC, Ruiz JC et al. Low bone mineral density in
young children with cystic fibrosis. Am J Respir Crit Care Med 2007;175:951-7.
117. King SJ, Nyulasi IB, Strauss BJ, Kotsimbos T, Bailey M, Wilson JW. Fat-free
mass depletion in cystic fibrosis: Associated with lung disease severity but
poorly detected by body mass index. Nutrition 2010;26:753-9.
118. Ionescu AA, Nixon LS, Luzio S et al. Pulmonary function, body composition,
and protein catabolism in adults with cystic fibrosis. Am J Respir Crit Care Med
2002;165:495-500.
119. Rochat T, Slosman DO, Pichard C, Belli DC. Body composition analysis by
dual-energy x-ray absorptiometry in adults with cystic fibrosis. Chest
1994;106:800-5.
120. Enright S, Chatham K, Ionescu AA, Unnithan VB, Shale DJ. The influence of
body composition on respiratory muscle, lung function and diaphragm thickness
in adults with cystic fibrosis. J Cyst Fibros 2007;6:384-90.
121. Schneiderman-Walker J, Wilkes DL, Strug L et al. Sex differences in habitual
physical activity and lung function decline in children with cystic fibrosis. J
Pediatr 2005;147:321-6.
122. Konstan MW, Butler SM, Wohl ME et al. Growth and nutritional indexes in
early life predict pulmonary function in cystic fibrosis. J Pediatr 2003;142:624-
30.
123. Yu H, Nasr SZ, Deretic V. Innate lung defenses and compromised Pseudomonas
aeruginosa clearance in the malnourished mouse model of respiratory infections
in cystic fibrosis. Infect Immun 2000;68:2142-7.
124. Sahebjami H. Nutrition and lung structure and function. Exp Lung Res
1993;19:105-24.
125. Barker DJ, Godfrey KM, Fall C, Osmond C, Winter PD, Shaheen SO. Relation
of birth weight and childhood respiratory infection to adult lung function and
death from chronic obstructive airways disease. BMJ 1991;303:671-5.
126. Bell SC, Bowerman AM, Nixon LE, Macdonald IA, Elborn JS, Shale DJ.
Metabolic and inflammatory responses to pulmonary exacerbation in adults with
cystic fibrosis. Eur J Clin Invest 2000;30:553-9.
127. Elborn JS, Cordon SM, Western PJ, Macdonald IA, Shale DJ. Tumour necrosis
factor-alpha, resting energy expenditure and cachexia in cystic fibrosis. Clin Sci
(Lond) 1993;85:563-8.

300
128. Wilson DO, Rogers RM, Wright EC, Anthonisen NR. Body weight in chronic
obstructive disease: The National Institute of Health intermittant positive
pressure breathing trials. American Journal of Critical Care Medicine
2012;139:1435-8.
129. Szeinberg A, England S, Mindorff C, Fraser IM, Levison H. Maximal inspiratory
and expiratory pressures are reduced in hyperinflated, malnourished, young adult
male patients with cystic fibrosis. Am Rev Respir Dis 1985;132:766-9.
130. Ionescu AA, Chatham K, Davies CA, Nixon LS, Enright S, Shale DJ. Inspiratory
muscle function and body composition in cystic fibrosis. Am J Respir Crit Care
Med 1998;158:1271-6.
131. Hart N, Tounian P, Clement A et al. Nutritional status is an important predictor
of diaphragm strength in young patients with cystic fibrosis. Am J Clin Nutr
2004;80:1201-6.
132. Ionescu AA, Nixon LS, Evans WD et al. Bone density, body composition, and
inflammatory status in cystic fibrosis. Am J Respir Crit Care Med 2000;162:789-
94.
133. Shale D, Elborn JS. Lung injury. In: Shale D, ed. Cystic Fibrosis. London: BMJ
Publishing Group 1996:62-78.
134. Thissen JP, Ketelslegers JM, Underwood LE. Nutritional regulation of the
insulin-like growth factors. Endocr Rev 1994;15:80-101.
135. Clemmons DR. Role of insulin-like growth factor-1 in reversing catabolism. J
Clin Endocrinol Metab 1992;75:1183-5.
136. Lewis MI, Feinberg AT, Fournier M. IGF-1 and/or growth hormone preserve
diaphragm fiber size with moderate malnutrition. Journal of Applied Physiology
1998;85:189-97.
137. Gore DC, Honeycutt D, Jahoor F, Rutan T, Wolfe RR, Herndon DN. Effect of
exogenous growth hormone on whole-body and isolated-limb protein kinetics in
burned patients. Archives of Surgery 1991;126:38-43.
138. Mulligan K, Grunfeld C, Hellerstein MK, Neese RA, Schambelan M. Anabolic
effects of recombinant human growth hormone in patients with wasting
associated human immunodeficiency virus infection. Journal of Clinical
Endocrinolgy and Metabolism 1993;77:956-62.
139. Hardin DS, Ellis KJ, Dyson M, Rice J, McConnell R, Seilheimer DK. Growth
hormone improves clinical status in prepubertal children with cystic fibrosis:
results of a randomized controlled trial. J Pediatr 2001;139:636-42.

301
140. Hardin DS, Ellis KJ, Dyson M, Rice J, McConnell R, Seilheimer DK. Growth
hormone decreases protein catabolism in children with cystic fibrosis. J Clin
Endocrinol Metab 2001;86:4424-8.
141. Peterson ML, Jacobs DR, Jr., Milla CE. Longitudinal changes in growth
parameters are correlated with changes in pulmonary function in children with
cystic fibrosis. Pediatrics 2003;112:588-92.
142. Wells JC, Fewtrell MS. Measuring body composition. Arch Dis Child
2006;91:612-7.
143. Wells JC, Fewtrell MS. Is body composition important for paediatricians? Arch
Dis Child 2008;93:168-72.
144. Wang ZM, Pierson RN Jn, Heymsfield SB. The five-level model: A new
approach to organizing bodycomposition research. Am J Clin Nutr 1992;56:19-
28.
145. Wells JC, Mok Q, Johnson AW. Nutritional status in children. Lancet
2001;357:1293.
146. Wells JC, Mok Q, Johnson AW. Nutritional status in children. Lancet
2001;357:1293.
147. Wells JC, Chomtho S, Fewtrell MS. Programming of body composition by early
growth and nutrition. Proc Nutr Soc 2007;66:423-34.
148. Wells JC, Chomtho S, Fewtrell MS. Programming of body composition by early
growth and nutrition. Proc Nutr Soc 2007;66:423-34.
149. Rauch F, Bailey DA, Baxter-Jones A, Mirwald R, Faulkner R. The 'muscle-bone
unit' during the pubertal growth spurt. Bone 2004;34:771-5.
150. Engelen MPKJ, Schroder R, Van der Hoorn K, Deutz NEP, Com G. Use of body
mass index percentile to identify fat-free mass depletion in children with cystic
fibrosis. Clinical Nutrition 2012;In press:1-7.
151. Deurenberg P, Pieters JJ, Hautvast JG. The assessment of the body fat percentage
by skinfold thickness measurements in childhood and young adolescence. Br J
Nutr 1990;63:293-303.
152. Paul AA, Cole TJ, Ahmed EA, Whitehead RG. The need for revised standards
for skinfold thickness in infancy. Arch Dis Child 1998;78:354-8.
153. Davies PS, Day JM, Cole TJ. Converting Tanner-Whitehouse reference tricep
and subscapular skinfold measurements to standard deviation scores. Eur J Clin
Nutr 1993;47:559-66.

302
154. Tanner JM, Whitehouse RH. Revised standards for triceps and subscapular
skinfolds in British children. Arch Dis Child 1975;50:142-5.
155. Wells JC, Williams JE, Chomtho S et al. Body-composition reference data for
simple and reference techniques and a 4-component model: a new UK reference
child. Am J Clin Nutr 2012;96:1316-26
156. Bosy-Westphal A, Geisler C, Onur S et al. Value of body fat mass vs
anthropometric obesity indices in the assessment of metabolic risk factors. Int J
Obes (Lond) 2006;30:475-83.
157. Zhu S, Heymsfield SB, Toyoshima H, Wang Z, Pietrobelli A, Heshka S. Race-
ethnicity-specific waist circumference cutoffs for identifying cardiovascular
disease risk factors. Am J Clin Nutr 2005;81:409-15.
158. Lemieux I, Pascot A, Couillard C et al. Hypertriglyceridemic waist: A marker of
the atherogenic metabolic triad (hyperinsulinemia; hyperapolipoprotein B; small,
dense LDL) in men? Circulation 2000;102:179-84.
159. Flodmark CE, Sveger T, Nilsson-Ehle P. Waist measurement correlates to a
potentially atherogenic lipoprotein profile in obese 12-14-year-old children. Acta
Paediatr 1994;83:941-5.
160. Freedman DS, Serdula MK, Srinivasan SR, Berenson GS. Relation of
circumferences and skinfold thicknesses to lipid and insulin concentrations in
children and adolescents: the Bogalusa Heart Study. Am J Clin Nutr
1999;69:308-17.
161. Mc Carthy HD, Ashwell M. A study of central fatness using waist-to-height
ratios in UK children and adolescents over two decades supports this simple
message-'keep your waist circumference to less than half your height'.
International Journal of Obesity 2006;30:988-92.
162. Seidell JC, Perusse L, Despres JP, Bouchard C. Waist and hip circumferences
have independent and opposite effects on cardiovascular disease risk factors: the
Quebec Family Study. Am J Clin Nutr 2001;74:315-21.
163. Brook CGD. Determination of body composition from skinfold measurements.
Archives of Disease in Childhood 1971;74:315-21.
164. Johnston JL, Leong MS, Checkland EG, Zuberbuhler PC, Conger PR, Quinney
HA. Body fat assessed from body density and estimated from skinfold thickness
in normal children and children with cystic fibrosis. Am J Clin Nutr
1988;48:1362-6.
165. Slaughter MH, Lohman TG, Boileau R.A. et al. Skinfold equations for
estimation of body fatness in children and youth. Human Biology 1988;60:709-
23.

303
166. Reilly JJ, Wilson J, Durnin JV. Determination of body composition from
skinfold thickness: a validation study. Arch Dis Child 1995;73:305-10.
167. Wells JC, Fuller NJ, Dewit O, Fewtrell MS, Elia M, Cole TJ. Four-component
model of body composition in children: density and hydration of fat-free mass
and comparison with simpler models. Am J Clin Nutr 1999;69:904-12.
168. Fuller NJ, Fewtrell MS, Dewit O, Elia M, Wells JC. Segmental bioelectrical
impedance analysis in children aged 8-12 y: 2. The assessment of regional body
composition and muscle mass. Int J Obes Relat Metab Disord 2002;26:692-700.
169. Fuller NJ, Fewtrell MS, Dewit O, Elia M, Wells JC. Segmental bioelectrical
impedance analysis in children aged 8-12 y: 1. The assessment of whole-body
composition. Int J Obes Relat Metab Disord 2002;26:684-91.
170. Arpadi SM, Wang J, Cuff PA et al. Application of bioimpedance analysis for
estimating body composition in prepubertal children infected with human
immunodeficiency virus type 1. J Pediatr 1996;129:755-7.
171. Wabitsch M, Braun U, Heinze E et al. Body composition in 5-18-y-old obese
children and adolescents before and after weight reduction as assessed by
deuterium dilution and bioelectrical impedance analysis. Am J Clin Nutr
1996;64:1-6.
172. Baumgartner RN. Electrical impedance and total body electrical conductivity. In:
Roche AF, Heymsfield SB, Lohman TG, eds. Human Body Composition.
Champaign, Illinois, USA: Human Kinetics 1996:79-108.
173. Fiorotto ML, Cochran WJ, Klish WJ. Fat-free mass and total body water of
infants estimated from total body electrical conductivity measurements. Pediatr
Res 1987;22:417-21.
174. Edelman IS. Body composition: Studies in the human being by the dilution
principle. Science 1952;115:447-54.
175. Culebras JM, Moore FD. Total body water and the exchangeable hydrogen. I.
Theoretical calculation of nonaqueous exchangeable hydrogen in man. Am J
Physiol 1977;232:R54-R59.
176. Schoeller DA, Santen E. Measurement of energy expenditure in humans by the
doubly labeled water method. Journal of Applied Physiology 1982;53:955-9.
177. Bray GA, DeLany JP, Harsha DW, Volaufova J, Champagne CM. Body
composition of African American and white children: a 2-year follow-up of the
BAROC study. Obes Res 2001;9:605-21.

304
178. Haroun D, Wells JC, Williams JE, Fuller NJ, Fewtrell MS, Lawson MS.
Composition of the fat-free mass in obese and nonobese children: matched case-
control analyses. Int J Obes Relat Metab Disord 2005;29:29-36.
179. Halliday D, Miller AG. Precise measurement of total body water using trace
quantities of deuterium oxide. Biomed Mass Spectrom 1977;4:82-7.
180. Racette SB, Schoeller DA, Luke AH, Shay K, Hnilicka J, Kushner RF. Relative
dilution spaces of 2H- and 18O-labeled water in humans. Am J Physiol
1994;267:E585-E590.
181. Wells JCK, Ritz P, Davies PSW, Coward WA. Factors affecting the 2H to
18O
dilution space ratio in infants. Paediatric Research 1998;43:467-71.
182. Fomon SJ, Haschke F, Ziegler EE, Nelson SE. Body composition of reference
children from birth to age 10 years. Am J Clin Nutr 1982;35:1169-75.
183. Lohman TG. Assessment of body composition in children. Pediatric Exercise
Science 1989;1:19-30.
184. Wells JC, Williams JE, Chomtho S et al. Pediatric reference data for lean tissue
properties: density and hydration from age 5 to 20 y. Am J Clin Nutr
2010;91:610-8.
185. Siri WE. The gross composition of the body. Adv Biol Med Phys 1956;4:239-80.
186. Fidanza F, Keys A, Anderson JT. Density of body fat in man and other
mammals. J Appl Physiol 1953;6:252-6.
187. Haschke, F. Body composition during adolescence. (98th Conference on
pediatric research, body composition in infants and children), 76-83. 1989.
Columbus, Ohio, Ross Laboratories. 1989.
Ref Type: Conference Proceeding
188. Rosenthal M, Cramer D, Bain SH, Denison D, Bush A, Warner JO. Lung
function in white children aged 4 to 19 years: II--Single breath analysis and
plethysmography. Thorax 1993;48:803-8.
189. Zapletal A, Paul T, Samanek M. Normal values of static pulmonary volumes and
ventilation in children and adolescents. Cesk Pediatr 1976;31:532-9.
190. Haycock GB, Schwartz GJ, Wisotsky DH. Geometric method for measuring
body surface area: A height-weight formula validated in infants, children, and
adults. The Journal of Pediatrics 1978;93:62-6.
191. Fields DA, Goran MI, McCrory MA. Body-composition assessment via air-
displacement plethysmography in adults and children: a review. Am J Clin Nutr
2002;75:453-67.

305
192. Ginde SR, Geliebter A, Rubiano F et al. Air displacement plethysmography:
validation in overweight and obese subjects. Obes Res 2005;13:1232-7.
193. Dewit O, Fuller NJ, Fewtrell MS, Elia M, Wells JC. Whole body air
displacement plethysmography compared with hydrodensitometry for body
composition analysis. Arch Dis Child 2000;82:159-64.
194. Wells JC, Fuller NJ. Precision of measurement and body size in whole-body air-
displacement plethysmography. Int J Obes Relat Metab Disord 2001;25:1161-7.
195. Kiebzak GM, Leamy LJ, Pierson LM, Nord RH, Zhang ZY. Measurement
precision of body composition variables using the lunar DPX-L densitometer. J
Clin Densitom 2000;3:35-41.
196. Laskey MA. Dual-energy X-ray absorptiometry and body composition. Nutrition
1996;12:45-51.
197. Genton L, Karsegard VL, Zawadynski S et al. Comparison of body weight and
composition measured by two different dual energy X-ray absorptiometry
devices and three acquisition modes in obese women. Clin Nutr 2006;25:428-37.
198. Wong WW, Hergenroeder AC, Stuff JE, Butte NF, Smith EO, Ellis KJ.
Evaluating body fat in girls and female adolescents: advantages and
disadvantages of dual-energy X-ray absorptiometry. Am J Clin Nutr
2002;76:384-9.
199. Fuller NJ, Jebb SA, Laskey MA, Coward WA, Elia M. Four-component model
for the assessment of body composition in humans: comparison with alternative
methods, and evaluation of the density and hydration of fat-free mass. Clin Sci
(Lond) 1992;82:687-93.
200. Bray GA, DeLany JP, Harsha DW, Volaufova J, Champagne CC. Evaluation of
body fat in fatter and leaner 10-y-old African American and white children: the
Baton Rouge Children's Study. Am J Clin Nutr 2001;73:687-702.
201. Rosenthal M, Bain SH, Cramer D et al. Lung function in white children aged 4 to
19 years: I--Spirometry. Thorax 1993;48:794-802.
202. Roca J, Burgos F, Sunyer J et al. References values for forced spirometry. Group
of the European Community Respiratory Health Survey. Eur Respir J
1998;11:1354-62.
203. Kirby J, Welsh L, Lum S et al. The EPICure study: Comparison of school
spirometry in community and laboratory settings. Pediatr Pulmonol
2008;43:1233-41.
204. Stanojevic S, Wade A, Stocks J et al. Reference ranges for spirometry across all
ages: a new approach. Am J Respir Crit Care Med 2008;177:253-60.

306
205. Sallis JF, Patterson TL, Buono MJ, Nader PR. Relation of cardiovascular fitness
and physical activity to cardiovascular disease risk factors in children and adults.
Am J Epidemiol 1988;127:933-41.
206. Moreno LA, Fleta J, Mur L. Television watching and fatness in children. JAMA
1998;280:1230-1.
207. Duke PM, Litt IF, Gross RT. Adolescents' self-assessment of sexual maturation.
Pediatrics 1980;66:918-20.
208. Peat J, Barton B. Medical Statistics. A guide to data analysis and critical
appraisal. Sydney: Blackwell Publishing, 2005.
209. Freeman JV, Cole TJ, Chinn S, Jones PR, White EM, Preece MA. Cross
sectional stature and weight reference curves for the UK, 1990. Arch Dis Child
1995;73:17-24.
210. Cole TJ. The LMS method for constructing normalized growth standards. Eur J
Clin Nutr 1990;44:45-60.
211. Wells JC, Cole TJ. Adjustment of fat-free mass and fat mass for height in
children aged 8 y. Int J Obes Relat Metab Disord 2002;26:947-52.
212. VanItallie TB, Yang MU, Heymsfield SB, Funk RC, Boileau RA. Height-
normalized indices of the body's fat-free mass and fat mass: potentially useful
indicators of nutritional status. Am J Clin Nutr 1990;52:953-9.
213. Fewtrell MS. Bone densitometry in children assessed by dual x ray
absorptiometry: uses and pitfalls. Arch Dis Child 2003;88:795-8.
214. Carter DR, Bouxsein ML, Marcus R. New approaches for interpreting projected
bone densitometry data. Journal of Clinical Densitometry 1992;7:137-45.
215. Crabtree NJ, Oldroyd B, Truscott JG et al. UK paediatric reference data (GE
Lunar Prodigy): Effects of ethnicity, gender and pubertal status. Osteoporosis
International 2004;15:S6.
216. Aickin M. Dealing with change: using the conditional change model for clinical
research. Perm J 2009;13:80-4.
217. Bland JM, Altman DG. Statistical methods for assessing agreement between two
methods of clinical measurement. Lancet 1986;1:307-10.
218. Surowiecki J. The wisdom of crowds: Why many are smarter than the few.
London, UK: Little, Brown, 2004.

307
219. Murphy AJ, Buntain HM, Wong JC, Greer RM, Wainwright CE, Davies PS. The
use of air displacement plethysmography in children and adolescents with cystic
fibrosis. Eur J Clin Nutr 2004;58:985-9.
220. Weltman EA, Stern RC, Doershuk CF, Moir RN, Palmer K, Jaffe AC. Weight
and menstrual function in patients with eating disorders and cystic fibrosis.
Pediatrics 1990;85:282-7.
221. Evolutionary Medicine. USA: OUP, 2012.
222. Bali A, Stableforth DE, Asquith P. Prolonged small-intestinal transit time in
cystic fibrosis. Br Med J (Clin Res Ed) 1983;287:1011-3.
223. Oades PJ, Bush A, Ong PS, Brereton RJ. High-strength pancreatic enzyme
supplements and large-bowel stricture in cystic fibrosis. Lancet 1994;343:109.
224. Freye HB, Kurtz SM, Spock A, Capp MP. Light and electron microscopic
examination of the small bowel of children with cystic fibrosis. J Pediatr
1964;64:575-9.
225. Kopelman H. Gastrointestinal and nutritional aspects. In: Shale D, ed. Cystic
Fibrosis. London: BMJ Publishing 1996:103-19.
226. Prior BM, Cureton KJ, Modlesky CM et al. In vivo validation of whole body
composition estimates from dual-energy X-ray absorptiometry. J Appl Physiol
1997;83:623-30.
227. Mitchell AD, Scholz AM, Pursel VG. Dual-energy X-ray absorptiometry
measurements of the body composition of pigs of 90- to 130-kilograms body
weight. Ann N Y Acad Sci 2000;904:85-93.
228. Rogol AD, Clark PA, Roemmich JN. Growth and pubertal development in
children and adolescents: effects of diet and physical activity. Am J Clin Nutr
2000;72:521S-8S.
229. Schaedel C, de M, I, Hjelte L et al. Predictors of deterioration of lung function in
cystic fibrosis. Pediatr Pulmonol 2002;33:483-91.
230. Steinkamp G, von der HH. Improvement of nutritional status and lung function
after long-term nocturnal gastrostomy feedings in cystic fibrosis. J Pediatr
1994;124:244-9.
231. Klijn PH, van der NJ, Kimpen JL, Helders PJ, van der Ent CK. Longitudinal
determinants of peak aerobic performance in children with cystic fibrosis. Chest
2003;124:2215-9.

308
232. Morgenstern BZ, Mahoney DW, Warady BA. Estimating total body water in
children on the basis of height and weight: a reevaluation of the formulas of
Mellits and Cheek. J Am Soc Nephrol 2002;13:1884-8.
233. Mellits ED, Cheek DB. The assessment of body water and fatness from infancy
to adulthood. Monogr Soc Res Child Dev 1970;35:12-26.
234. Deurenberg P, Weststrate JA, Seidell JC. Body mass index as a measure of body
fatness: age- and sex-specific prediction formulas. Br J Nutr 1991;65:105-14.
235. Pietrobelli A, Faith MS, Allison DB, Gallagher D, Chiumello G, Heymsfield SB.
Body mass index as a measure of adiposity among children and adolescents: a
validation study. J Pediatr 1998;132:204-10.
236. Deurenberg P, Pieters JJ, Hautvast JG. The assessment of the body fat percentage
by skinfold thickness measurements in childhood and young adolescence. Br J
Nutr 1990;63:293-303.
237. Horlick M, Arpadi SM, Bethel J et al. Bioelectrical impedance analysis models
for prediction of total body water and fat-free mass in healthy and HIV-infected
children and adolescents. Am J Clin Nutr 2002;76:991-9.
238. Schaefer F, Georgi M, Zieger A, Scharer K. Usefulness of bioelectric impedance
and skinfold measurements in predicting fat-free mass derived from total body
potassium in children. Pediatr Res 1994;35:617-24.
239. Cordain L, Whicker RE, Johnson JE. Body composition determination in
children using bioelectrical impedance. Growth Dev Aging 1988;52:37-40.
240. Roemmich JN, Clark PA, Weltman A, Rogol AD. Alterations in growth and
body composition during puberty. I. Comparing multicompartment body
composition models. J Appl Physiol 1997;83:927-35.
241. Clasey JL, Kanaley JA, Wideman L et al. Validity of methods of body
composition assessment in young and older men and women. J Appl Physiol
1999;86:1728-38.
242. Gately PJ, Radley D, Cooke CB et al. Comparison of body composition methods
in overweight and obese children. J Appl Physiol 2003;95:2039-46.
243. Van Der Ploeg GE, Withers RT, Laforgia J. Percent body fat via DEXA:
comparison with a four-compartment model. J Appl Physiol 2003;94:499-506.
244. Sopher AB, Thornton JC, Wang J, Pierson RN, Jr., Heymsfield SB, Horlick M.
Measurement of percentage of body fat in 411 children and adolescents: a
comparison of dual-energy X-ray absorptiometry with a four-compartment
model. Pediatrics 2004;113:1285-90.

309
245. Wells JC, Haroun D, Williams JE et al. Evaluation of DXA against the four-
component model of body composition in obese children and adolescents aged 5-
21 years. Int J Obes (Lond) 2010;34:649-55.
246. Chumlea WC, Guo SS, Kuczmarski RJ et al. Body composition estimates from
NHANES III bioelectrical impedance data. Int J Obes Relat Metab Disord
2002;26:1596-609.
247. Addo OY, Himes JH. Reference curves for triceps and subscapular skinfold
thicknesses in US children and adolescents. Am J Clin Nutr 2010;91:635-42.
248. Moreno LA, Mesana MI, Gonzalez-Gross M et al. Body fat distribution
reference standards in Spanish adolescents: the AVENA Study. Int J Obes
(Lond) 2007;31:1798-805.
249. Kurtoglu S, Mazicioglu MM, Ozturk A, Hatipoglu N, Cicek B, Ustunbas HB.
Body fat reference curves for healthy Turkish children and adolescents. Eur J
Pediatr 2010;169:1329-35.
250. Nakao T, Komiya S. Reference norms for a fat-free mass index and fat mass
index in the Japanese child population. J Physiol Anthropol Appl Human Sci
2003;22:293-8.
251. Alwis G, Rosengren B, Stenevi-Lundgren S, Duppe H, Sernbo I, Karlsson MK.
Normative dual energy X-ray absorptiometry data in Swedish children and
adolescents. Acta Paediatr 2010;99:1091-9.
252. van der Sluis IM, de Ridder MA, Boot AM, Krenning EP, de Muinck Keizer-
Schrama SM. Reference data for bone density and body composition measured
with dual energy x ray absorptiometry in white children and young adults. Arch
Dis Child 2002;87:341-7.
253. Wells JC, Williams JE, Haroun D, Fewtrell MS, Colantuoni A, Siervo M.
Aggregate predictions improve accuracy when calculating metabolic variables
used to guide treatment. Am J Clin Nutr 2009;89:491-9.
254. Ellis KJ. Human body composition: in vivo methods. Physiol Rev 2000;80:649-
80.

310
Published papers related to this thesis
Published papers related to this thesis (Ref 102, 69, 184 and 155) may be found on the
following pages.
Permission to reproduce these has been granted by The American Journal of Clinical
Nutrition.

Evaluation of Lunar Prodigy dual-energy X-ray absorptiometry forassessing body composition in healthy persons and patients bycomparison with the criterion 4-component model1–3
Jane E Williams, Jonathan CK Wells, Catherine M Wilson, Dalia Haroun, Alan Lucas, and Mary S Fewtrell
ABSTRACTBackground: Dual-energy X-ray absorptiometry (DXA) is widelyused to assess body composition in research and clinical practice.Several studies have evaluated its accuracy in healthy persons; how-ever, little attention has been directed to the same issue in patients.Objective: The objective was to compare the accuracy of the LunarProdigy DXA for body-composition analysis with that of the refer-ence 4-component (4C) model in healthy subjects and in patientswith 1 of 3 disease states.Design: A total of 215 subjects aged 5.0–21.3 y (n � 122 healthynonobese subjects, n � 55 obese patients, n � 26 cystic fibrosispatients, and n � 12 patients with glycogen storage disease). Fatmass (FM), fat-free mass (FFM), and weight were measured by DXAand the 4C model.Results: The accuracy of DXA-measured body-composition out-comes differed significantly between groups. Factors independentlypredicting bias in weight, FM, FFM, and percentage body fat inmultivariate models included age, sex, size, and disease state. Biasesin FFM were not mirrored by equivalent opposite biases in FMbecause of confounding biases in weight.Conclusions: The bias of DXA varies according to the sex, size,fatness, and disease state of the subjects, which indicates that DXAis unreliable for patient case-control studies and for longitudinalstudies of persons who undergo significant changes in nutritionalstatus between measurements. A single correction factor cannotadjust for inconsistent biases. Am J Clin Nutr 2006;83:1047–54.
KEY WORDS Body composition, fat mass, fat-free mass,dual-energy X-ray absorptiometry, DXA, obesity, clinical practice
INTRODUCTION
Assessment of body composition is increasingly used to directthe clinical management of patients. First, an abnormal bodycomposition (eg, high or low amounts of body fat) is often amajor symptom of diseases such as obesity, with changes in bodycomponents reflecting the relative success of treatment. Second,the association of body composition with the risk of diseases,such as coronary heart disease, broadens its clinical significance.Third, body composition can also be used as the basis of require-ments for fluids, nutrition, and dosages of drugs and dialysis.Despite increasing awareness of the value of such information,its measurement in routine practice has remained constrained bythe lack of appropriate technology.
Dual-energy X-ray absorptiometry (DXA), first developed forassessment of bone mass, provides information on total fat mass(FM) and fat-free mass (FFM) and their distribution in the trunkand upper and lower limbs (1). Over the past decade, DXA hasbeen increasingly used to assess body composition in researchand clinical practice, including applications to direct treatment(2–4). Its rapid uptake can be attributed to its ease of use, avail-ability, and low radiation exposure. However, although the pre-cision of the technique for body-composition outcomes is well-established, insufficient attention has been paid to accuracy.Many validation studies have used as the reference method atechnique that itself has unknown accuracy, thereby limitingconfidence in the findings.
In the absence of chemical analysis of body composition, theideal reference method is a multicomponent model of body com-position, which minimizes the need for theoretical assumptionsof biological constancy in tissues (5). A recent study evaluatedHologic Inc (Waltham, MA) DXA instrumentation against the4-component (4C) model for estimating FM in a group of girlsand adolescent females. A large bias and large limits of agree-ment were found between the 2 methods that could not be attrib-uted to age, ethnicity, or fatness, but that could cause a person’sFM to be under- or overestimated by 28% (6). These authorsproposed that the bias could be addressed by a correction factor.
The latter study highlights important issues; however, furtherwork is still required. First, the results may not apply to othermanufacturer’s instrumentation, because instruments differ inthe way in which tissue masses are quantified. Second, manyclinical applications involve extremes of body size and compo-sition; however, the validity of DXA over a wide range of bodysizes and health states has yet to be investigated. The aim of thisstudy was to evaluate the level of agreement between DXA andthe 4C model reference method when estimating FM, FFM, and
1 From the MRC Childhood Nutrition Research Centre, Institute of ChildHealth, London, United Kingdom (JEW, JCKW, DH, AL, and MSF), and theRadiology Department, Great Ormond Street Hospital, London, UnitedKingdom (CMW).
2 The Institute of Child Health and Great Ormond Street Hospital forChildren received funding from the NHS Executive.
3 Address reprint requests to JE Williams, MRC Childhood NutritionResearch Centre, Institute of Child Health, 30 Guilford Street, LondonWC1N 1EH, United Kingdom. E-mail: [email protected].
Received May 23, 2005.Accepted for publication January 17, 2006.
1047Am J Clin Nutr 2006;83:1047–54. Printed in USA. © 2006 American Society for Nutrition
at UC
L Library Services on M
ay 10, 2006 w
ww
.ajcn.orgD
ownloaded from

weight in a diverse group of healthy and unhealthy adults andchildren to determine whether biases are consistent betweenthese groups.
SUBJECTS AND METHODS
Subjects
A total of 215 subjects aged 5.0–21.3 y were recruited intostudies of body composition in healthy subjects, adults bornpreterm, and patient groups from Great Ormond Street Chil-dren’s Hospital and the National Hospital for Neurology andNeurosurgery. The sample consisted of nonobese adults (n �70), obese adults (n � 16), healthy nonobese children (n � 52),obese children (n � 39), children with cystic fibrosis (CF; n �26), and children with glycogen storage disease (GSD; n � 12).Obesity was defined as a body mass index (BMI; in kg/m2) abovethe 95th percentile according to UK 1990 reference data (7). Twoobese boys did not complete the protocol because it was notpossible to scan their whole body because of the inadequate sizeof the scanning area. A separate analysis of data from obese menwas not possible because of small sample sizes (n � 2). Mea-surements were conducted over a 90-min visit to the study centerat Great Ormond Street Children’s Hospital after a light meal.Ethical permission was obtained from the ethical committee ofthe Institute of Child Health and The National Hospital. Writtenconsent was obtained from adults and parents. Written assent wasobtained from children aged �11 y, and verbal assent was ob-tained from children aged �11 y.
Dual-energy X-ray absorptiometry
Bone mineral content (BMC), FM, and FFM were determinedby using a Lunar Prodigy whole-body scanner (GE MedicalSystems, Madison, WI) in conjunction with Encore 2002 soft-ware. The instrument automatically alters scan depth dependingon the thickness of the subject, as estimated from age, height, andweight. All scans were performed while the subjects were wear-ing light indoor clothing and no removable metal objects. Thetypical scan time was 5 min, depending on height. The radiationexposure per whole-body scan is estimated to be 2 �Sv, which islower than the daily background level. All scans were performedby one operator (CMW). The precision of soft tissue analysis fora Lunar DPX-L instrument (regarded by the manufacturers to besimilar to the Lunar Prodigy), established by repeat measure-ments of humans on 4 successive days, has been reported as 1%for FFM and 2% for FM (8).
Body volume
Body volume (BV) was measured by using Bod Pod Instru-mentation (Life Measurement Instruments, Concord, CA) ac-cording to the manufacturer’s instructions as previously de-scribed (9). Measurements were made while the subjects wore aclose-fitting swimming costume and hat. The raw volume valuesthat appear transiently on the screen were recorded, and an ad-justment for thoracic gas volume and surface area artifact wasmade to obtain actual BV as described previously (10). To im-prove precision, the procedure was repeated until 2 values for rawdensity of within 0.007 kg/L were obtained (11). When it was notpossible to achieve 2 such measurements, because of breathingirregularities in 3 of the children with CF, the mean of all rawvolume values was used after values �2 SD were discarded. All
measurements were made by 1 of 3 operators (JEW, CMW, orDH).
Anthropometric measurements
Body weight was measured as an integral stage of the Bod Podprocedure to within 0.01 kg. Accuracy was confirmed by the useof 2 solid weights of known mass. Height was measured to within0.1 cm with a wall-mounted digital display stadiometer (Holtain,Dyfed, United Kingdom). BMI was calculated as weight (kg)divided by the square of height (m). Data on weight, height, andBMI were converted to SD scores (SDS) with the use of UK 1990reference data (7, 12).
Deuterium dilution
Total body water (TBW) was assessed by deuterium (2H-labeled water) dilution with the use of a dose equivalent to 0.05 g2H2O/kg body weight. Doses were made up with water to �100mL for young children and to 150 mL for older children andadults. Saliva samples were taken before the dose was adminis-tered and either 4 (for persons of normal body fatness) or 5 (forobese subjects) h after the dose was administered. Absorbentsalivettes (Sarstedt, Rommelsdorf, Germany) were used to col-lect the saliva �30 min after the last ingestion of food or drink.
Deuterium samples were analyzed by Iso-Analytical Ltd(Sandbach, United Kingdom) by using the equilibration methodof Scrimgeour et al (13). Briefly, 0.3 mL liquid, along with a vialof 5% platinum on alumina powder (Sigma-Aldrich, Poole,United Kingdom), was placed in a septum sealed container(Labco, High Wycombe, United Kingdom) and flushed for 2 minwith hydrogen. Low-enrichment and high-enrichment standardwaters were similarly prepared to normalize data againstSMOW-SLAP (Standard Mean Ocean Water/Standard LightArctic Precipitation) standards. Samples were equilibrated atroom temperature for 3 d before analysis. The head spaces in thecontainers were then analyzed for deuterium enrichment with acontinuous-flow isotope ratio mass spectrometer (Geo20-20;Europa Scientific, Crewe, United Kingdom). The accuracy of theanalyses was checked by measuring an intermediate water stan-dard within each batch of samples. All samples were preparedand analyzed in duplicate. The mean SD of deuterium analysesby the equilibration technique in the laboratory is �2.5‰.
2H dilution space was assumed to overestimate TBW by afactor of 1.044 (14), and a correction was made for fluid intakeduring the equilibrium period to derive actual body water.
Four-component model
The 4C model uses values of BMC, body weight (BW), BV,and TBW to derive values for mineral, water, fat, and protein asdescribed previously (5). Assumed densities of the 4 componentswere accounted for when calculating fat mass from the measure-ments.
FM (kg) � [(2.747 � BV) � (0.710 � TBW)]
� [(1.460 � BMC) � (2.050 � BW)] (1)
FFM was calculated as the difference between weight and FM.We previously propagated error for FFM and FM on the basis ofprecision of the raw measurements and obtained values of 0.5 kgFM or FFM in children (15) and adults (5).
1048 WILLIAMS ET AL
at UC
L Library Services on M
ay 10, 2006 w
ww
.ajcn.orgD
ownloaded from

Statistical analysis
Comparisons for anthropometric and body-composition vari-ables between groups were made by using analysis of variance(ANOVA). Data for males and females were pooled, unless asignificant interaction between group and sex was present. Pair-wise post hoc comparisons between groups were made whereappropriate by using Tukey’s test.
The method of Bland and Altman (16) was used to assessagreement between techniques. The mean difference betweentechniques (bias) and the �2 SDs of the difference betweentechniques (limits of agreement) were calculated. The bias wasthen tested for significance from zero by using a paired t test. Thecorrelation between the bias and the mean of the measured valueswas also determined. To express the bias as a percentage of themean, the bias of the individual natural log value multiplied by100 was calculated (17, 18). We used analysis of covariance(ANCOVA) to examine factors predicting bias in FM, FFM,weight, and percentage body fat, including age, sex, disease state,and either BMI SDS, FM, or percentage body fat as independentvariables. All analyses were performed by using the StatisticalPackage for Social Sciences (version 11.0; SPSS Inc, Chicago,IL), and a P value �0.05 was considered significant.
RESULTS
Subject characteristics and body composition
The population encompassed a wide range of body sizes andnutritional status. The characteristics of the adults (n � 84) areshown in Table 1. The young adults (19–22 y) of normal weightwere representative of the UK population in height and weight.There were no significant differences in age and weight, height,and BMI SDS between the sexes in the nonobese group. Theobese women were significantly shorter and, by definition,heavier than the UK reference data.
Characteristics of the children (n � 127) are shown in Table2. The subjects were deliberately chosen to represent a range ofbody sizes and shapes and, as expected, ANOVA showed sig-nificant differences in weight, height, and BMI SDS betweengroups. Compared with the UK reference data, the nonobeseboys were representative of the general population in terms ofheight and weight SDS, but the nonobese girls were significantlyheavier than expected (P � 0.05). The obese girls were signifi-cantly taller (P � 0.001), whereas the patient groups showed awide range of body sizes: the children with CF were significantlyshorter and the children with GSD were significantly shorter andheavier.
The body-composition data for adults are shown in Table 3.ANOVA showed significant differences between groups for allvariables, and post hoc testing indicated that these significantdifferences were present between all groups for all variablesexcept the BMC and FFM of obese and nonobese women and thedensity of FFM in the nonobese men and women.
Data for the children’s body composition are given in Table4. ANOVA showed significant differences between groupsfor all variables, except for the density of FFM (P � 0.06).Mean percentage fat varied widely between groups, averaging42% in obese girls and 19% in nonobese boys. FFM alsovaried widely between groups. Hydration was significantlyhigher (1.6%; P � 0.01) in the obese children than in thenonobese children.
TABLE 1Characteristics of the adults1
Nonobese men(n � 26)
Nonobese women(n � 44)
Obese women(n � 14)
Age (y) 20.4 � 0.45 20.3 � 0.40 20.4 � 0.41Weight SDS �0.38 � 1.13 �0.19 � 1.17 1.90 � 0.722,3
Height SDS �0.27 � 0.81 �0.17 � 1.28 �1.01 � 0.792,4
BMI SDS �0.27 � 1.14 �0.13 � 0.96 2.35 � 0.542,3
1 All values are x� � SD. SDS, SD score relative to the 1990 UK referencedata (7, 12).
2 Significantly different from zero, P � 0.001 (paired t test).3,4 Significantly different from nonobese women (independent samples
t test): 3P � 0.001, 4P � 0.05.
TABLE 2Characteristics of the children1
Group
Nonobese(n � 30 M, 22 F)
Obese(n � 11 M, 26 F)
CF(n � 12 M, 14 F)
GSD(n � 8 M, 4 F)
Age (y)2
Boys 10.3 � 3.82 12.6 � 2.66 9.47 � 0.67 9.87 � 2.90Girls3 10.2 � 3.28 10.9 � 2.48 10.2 � 1.13 14.5 � 2.30
BMI SDS2,4
Boys 0.22 � 0.89 2.77 � 0.685 0.44 � 1.10 1.70 � 1.266
Girls 0.34 � 0.57 2.77 � 0.735 �0.68 � 1.47 0.77 � 0.85Weight SDS4,7 0.21 � 0.87 2.68 � 0.93 �0.42 � 1.27 0.64 � 1.28Height SDS4,7 0.03 � 0.91 0.81 � 1.015 �0.58 � 1.056 �0.75 � 1.038
1 All values are x� � SD. CF, cystic fibrosis; GSD, glycogen storage disease; SDS, SD score relative to the 1990 UK reference data (7, 12).2 Significant interaction between sex and group (P � 0.05) in 2-factor ANOVA; therefore, the sexes were analyzed separately.3 ANOVA for condition, P � 0.03.4 ANOVA for condition, P � 0.001.5,6,8 Significantly different from zero (paired t test): 5P � 0.001, 6P � 0.01, 8P � 0.05.7 No significant interaction between sex and group (P � 0.05) in 2-factor ANOVA; therefore, the sexes were analyzed together.
EVALUATION OF DXA IN PATIENT GROUPS 1049
at UC
L Library Services on M
ay 10, 2006 w
ww
.ajcn.orgD
ownloaded from

Comparison between DXA and the 4C model
Results of the Bland-Altman analyses are given in Table 5.These results show the variable bias in FM, FFM, body weight,and percentage fat in the different subject groups. DXA-measured weight was significantly underestimated in obesewomen and children, except the nonobese and obese boys, andwas significantly overestimated in nonobese men. FM was sig-nificantly overestimated in all adults and obese boys and wassignificantly underestimated in nonobese boys. However, thebias in FFM did not mirror that in FM, as might have been
expected. This finding was accounted for by variable bias inweight between groups. Correlation analyses showed that themagnitude of the bias was related to the magnitude of the variablein several categories (Table 5). DXA measurement significantlyunderestimated percentage fat in nonobese boys, showed no sig-nificant bias in nonobese girls and children with CF or GSD, andoverestimated it in obese children and all 3 categories of adults.
Factors predicting bias between DXA and the 4C model, byANCOVA, are shown in Table 6. FM bias was significantlypositively associated with both age and BMI SDS. FFM bias was
TABLE 3Body composition of the adults1
Nonobese men(n � 26)
Nonobese women(n � 44)
Obese women(n � 14)
BW (kg) 66.9 � 8.83 57.3 � 9.14 78.1 � 9.52BV (L) 63.0 � 8.84 55.6 � 9.32 78.3 � 9.97TBW (L) 40.9 � 4.34 29.9 � 3.99 33.5 � 3.56BMC by DXA (kg) 2.88 � 0.45 2.31 � 0.38 2.38 � 0.25DXA body composition
FM (kg) 12.1 � 5.80 18.6 � 6.46 36.4 � 6.49FFM (kg) 55.8 � 5.72 38.7 � 5.10 41.3 � 4.41Percentage fat (%) 17.3 � 6.75 32.1 � 6.76 46.6 � 3.59Weight (kg) 67.9 � 8.94 57.3 � 9.14 77.6 � 9.58
4-Component modelFM (kg) 10.8 � 5.27 17.4 � 5.81 34.8 � 6.55FFM (kg) 56.2 � 5.94 39.9 � 5.37 43.3 � 4.55Percentage fat (%) 15.6 � 6.26 29.9 � 6.05 44.4 � 3.9HFFM (%) 72.8 � 1.39 74.7 � 1.60 77.2 � 1.07DFFM (kg/L) 1.101 � 0.005 1.100 � 0.006 1.091 � 0.004
1 All values are x� � SD. BW, body weight; BV, body volume; TBW, total body water; BMC, bone mineral content; DXA, dual-energy X-rayabsorptiometry; FM, fat mass; FFM, fat-free mass; HFFM, hydration of FFM; DFFM, density of FFM. Significant differences between groups for all variables(P � 0.001) by ANOVA and for all variables (P � 0.05) except for BMC and FFM between nonobese and obese women and for DFFM between nonobese menand women by post hoc Tukey’s test.
TABLE 4Body composition of the children1
Group
Nonobese(n � 30 M, 22 F)
Obese(n � 11 M, 26 F)
CF(n � 12 M, 14 F)
GSD(n � 8 M, 4 F)
BW (kg)2 36.1 � 14.03 67.4 � 21.8 30.1 � 6.273,4 42.5 � 12.33
BV (L)2 34.6 � 13.33 67.4 � 22.2 28.9 � 6.463 41.7 � 12.23
TBW (L)2 21.0 � 8.293 29.7 � 8.60 17.9 � 2.513 21.9 � 5.683
BMC by DXA (kg)2 1.35 � 0.643 1.90 � 0.59 1.07 � 0.163 1.29 � 0.513
DXA body compositionFM (kg)2 7.76 � 4.613 29.2 � 12.0 6.45 � 3.603,4 13.7 � 6.303
FFM (kg)2 28.3 � 11.43 37.9 � 11.4 23.4 � 3.203 28.7 � 7.213
Percentage fat (%)2 21.5 � 7.843,4 42.6 � 6.40 20.3 � 7.333,4 31.0 � 8.133
DXA weight (kg)2 36.0 � 14.13 67.1 � 21.9 29.9 � 6.363 42.3 � 13.53
4-component modelFM (kg)2 8.05 � 4.363 28.6 � 12.2 6.42 � 3.743,4 13.7 � 5.593
FFM (kg)2 28.1 � 11.43 38.8 � 11.5 23.7 � 3.163 28.8 � 7.803
Percentage fat (%)2 22.0 � 7.023,4 41.4 � 7.25 20.0 � 7.543,4 31.5 � 6.703
HFFM (%)2 75.1 � 1.993 76.4 � 1.73 75.3 � 2.37 76.1 � 1.98DFFM (kg/L) 1.091 � 0.008 1.089 � 0.006 1.089 � 0.007 1.086 � 0.009
1 All values are x� � SD. CF, cystic fibrosis; GSD, glycogen storage disease; BW, body weight; BV, body volume; TBW, total body water; BMC, bonemineral content; DXA, dual-energy X-ray absorptiometry; FM, fat mass; FFM, fat-free mass; HFFM, hydration of FFM; DFFM, density of FFM.
2 Significant difference across groups, P � 0.001 (ANOVA).3 Significantly different from the obese group, P � 0.006 (post hoc Tukey’s test).4 Significantly different from the GSD group, P � 0.006 (post hoc Tukey’s test).
1050 WILLIAMS ET AL
at UC
L Library Services on M
ay 10, 2006 w
ww
.ajcn.orgD
ownloaded from

significantly associated with age, sex, BMI SDS, and CF, andthere was a significant interaction between age and BMI SDS,which indicated that BMI SDS was associated with decreased
bias with increasing age. Weight bias was significantly associ-ated with age, sex, and BMI SDS. The use of an alternativemodel, in which BMI SDS was replaced with FM or percentage
TABLE 5Bland-Altman analysis of mean bias in fat mass (FM), fat-free mass (FFM), weight, and percentage fat measured by dual-energy X-ray absorptiometry(DXA) compared with the 4-component model1
Absolutebias2
Absolute 95%limits of
agreement
Bias as apercentage
of the mean3
95% limits ofagreement as a
percentage of the mean
P forthe bias
from zero4 r5P for the
correlation
% %FM
AdultsNonobese men (n � 26) 1.35 �2.82 12.4 �25.3 � 0.001 0.38 NSNonobese women (n � 44) 1.21 �2.29 6.19 �14.8 � 0.001 0.58 � 0.01Obese women (n � 14) 1.58 �3.50 4.60 �11.0 � 0.01 �0.04 NS
ChildrenNonobese boys (n � 30) �0.52 �1.17 �10.9 �23.8 � 0.001 0.10 NSNonobese girls (n � 22) 0.01 �1.24 9.72 �10.6 NS 0.46 � 0.05Obese boys (n � 11) 0.93 �1.86 3.52 �7.06 � 0.01 �0.08 NSObese girls (n � 17) 0.46 �2.42 2.26 �9.39 NS �0.24 NSBoys with CF (n � 12) �0.14 �1.83 0.38 �29.9 NS �0.53 NSGirls with CF (n � 14) 0.18 �1.42 0.77 �26.6 NS 0.48 NSBoys and girls with GSD (n � 12) �0.06 �2.28 �3.67 �22.6 NS 0.63 � 0.05
FFMAdults
Nonobese men (n � 26) �0.37 �2.71 �0.62 �4.88 NS �0.18 NSNonobese women (n � 44) �1.19 �2.38 �2.96 �6.06 � 0.01 �0.23 NSObese women (n � 14) �1.97 �3.39 �4.68 �8.45 � 0.001 �0.08 NS
ChildrenNonobese boys (n � 30) 0.56 �1.51 2.06 �4.67 � 0.001 0.19 NSNonobese girls (n � 22) �0.34 �1.38 �0.99 �4.99 � 0.05 �0.56 � 0.01Obese boys (n � 11) �1.02 �1.99 �2.49 �4.38 � 0.01 �0.03 NSObese girls (n � 17) �0.80 �2.49 �2.25 �6.12 � 0.01 �0.05 NSBoys with CF (n � 12) �0.04 �1.76 �0.28 �7.13 NS 0.30 NSGirls with CF (n � 14) �0.53 �1.20 �2.20 �5.14 � 0.01 �0.40 NSBoys and girls with GSD (n � 12) �0.10 �2.28 0.13 �7.71 NS �0.51 NS
WeightAdults
Nonobese men (n � 26) 0.99 �0.92 1.46 �1.33 � 0.001 0.23 NSNonobese women (n � 44) 0.02 �0.50 0.04 �0.88 NS �0.02 NSObese women (n � 14) �0.39 �0.78 �0.52 �1.01 � 0.01 0.16 NS
ChildrenNonobese boys (n � 30) 0.04 �0.70 �0.64 �1.67 NS 0.61 � 0.01Nonobese girls (n � 22) �0.32 �0.50 �0.92 �1.22 � 0.001 �0.47 � 0.05Obese boys (n � 11) �0.09 �0.89 �0.19 �1.10 NS 0.37 NSObese girls (n � 17) �0.33 �0.68 �0.63 �1.31 � 0.001 0.28 NSBoys with CF (n � 12) �0.18 �0.51 �0.67 �2.43 � 0.05 0.21 NSGirls with CF (n � 14) �0.35 �0.70 �1.28 �2.48 � 0.01 0.35 NSBoys and girls with GSD (n � 12) �0.17 �0.41 �0.44 �1.16 � 0.05 0.06 NS
Percentage fat (%)Adults
Nonobese men (n � 26) 1.69 �3.81 — — � 0.001 0.26 NSNonobese women (n � 44) 1.98 �3.94 — — � 0.001 0.25 NSObese women (n � 14) 2.28 �4.72 — — � 0.05 �0.16 NS
ChildrenNonobese boys (n � 30) �1.74 �3.52 — — � 0.001 0.09 NSNonobese girls (n � 22) �0.03 �3.51 — — NS 0.44 � 0.05Obese boys (n � 11) 1.41 �2.59 — — � 0.01 �0.54 NSObese girls (n � 17) 1.03 �3.50 — — � 0.01 �0.52 � 0.01Boys with CF (n � 12) �0.18 �5.54 — — NS �0.42 NSGirls with CF (n � 14) 0.65 �4.55 — — NS 0.41 NSBoys and girls with GSD (n � 12) �0.53 �5.59 — — NS 0.52 NS
1 CF, cystic fibrosis; GSD, glycogen storage disease. Differential bias by group is evaluated by using analysis of covariance in Table 6.2 The mean value measured by DXA minus the mean value measured with the 4-component model.3 The bias of the natural log values multiplied by 100.4 Paired t test.5 Pearson’s correlation between the bias in individuals and the mean values.
EVALUATION OF DXA IN PATIENT GROUPS 1051
at UC
L Library Services on M
ay 10, 2006 w
ww
.ajcn.orgD
ownloaded from

fat, showed that weight bias was associated with age, sex, andeither FM or percentage fat. Bias in percentage fat was associatedwith age, sex, BMI SDS, and CF, and there was a significant
interaction between age and sex, which indicated that the effectof being female on percentage fat bias was greater with increas-ing age. When waist circumference (as an alternative proxy fordepth of scan) was substituted for BMI SDS in the ANCOVA, theresults for all 4 body-composition biases were similar to those forBMI SDS (data not shown).
Propagation of error analysis indicated that methodologic im-precision was equivalent to �0.6 kg of bias. Biases of �0.6 kgcould be attributed to imprecision, but larger biases could beattributed to the combination of imprecision and inaccuracy. Forbiases �1 kg, most of the bias could be attributed to the inaccu-racy of one or other method.
DISCUSSION
DXA was designed for the measurement of bone mass and hasbeen shown to be both accurate and precise when used for thispurpose. However, this method is increasingly being used for themeasurement of body composition. Our study was the first toexamine the validity of DXA in groups differing in body size,fatness, and (due to the effects of disease states) the chemicalcomposition of FFM. We showed that the bias of DXA variedaccording to body size, body fatness, sex, and disease state.These findings indicate that caution is necessary when DXA isused to compare patients with control subjects or to assesschanges in body composition in persons whose relative weightchanges significantly between measurements.
Many studies have investigated the accuracy of DXA. Animalcarcass studies have shown systematic biases in younger agegroups, which required a correction factor to be generated (19)and applied (20, 21). However, most studies in humans have usedreference methods that may not have been accurate. Two-component techniques, such as hydrodensitometry, rely on as-sumed constant properties of FM and FFM. We showed previ-ously that this is not the case in healthy adults (5) or children (15),and the issue is of even greater importance when measuringpatients in whom body-composition variability, especially FFMcomposition, is most extreme.
Recently, several studies have assessed DXA in relation to the4C model. These studies are summarized in Table 7, and theyhighlight 2 issues: 1) the bias varies according to several factors,including subject age and instrumentation, and 2) the vast ma-jority of work has been conducted in healthy adults and children.
TABLE 6Analysis of factors predicting for bias between dual-energy X-rayabsorptiometry and the 4-component (4C) model by analysis ofcovariance1
Factor � Coefficient t P Adjusted r2
FM biasAge 0.14 8.85 � 0.001 0.32BMI SDS 0.21 4.01 � 0.001
FFM biasAge2 �0.099 �6.18 � 0.001 0.29Sex 0.74 4.8 � 0.001BMI SDS �0.26 �4.87 � 0.001CF 0.51 2.02 0.05
Weight biasAge3,4 0.041 7.05 � 0.001 0.45Sex 0.55 9.76 � 0.001BMI SDS5 �0.049 �2.5 0.013
Percentage fat biasAge6 0.25 8.78 � 0.001 0.34Sex �0.89 �3.2 0.002BMI SDS 0.43 4.49 � 0.001CF �1.27 �2.79 0.006
1 For each bias we performed general linear models that included thefollowing factors: age, sex (M � 0, F � 1), CF (healthy � 0, CF � 1), GSD(healthy � 0, GSD � 1), and BMI SDS, FM, or percentage fat. The significantfactors (P � 0.05) for each model are shown. Interactions between significantfactors for each model were then tested and are reported with the adjusted meanvalues for significant categorical variables as follows: FFM bias (male, �0.29;female, �1.03; healthy, �0.4; CF, �0.91); weight bias (male, 0.17; female,�0.37); percentage fat bias (male, 0.50; female, 1.39; healthy, 0.31; CF, 1.58).SDS, SD score relative to the 1990 UK reference data (7, 12); CF, cystic fibrosis;GSD, glycogen storage disease; FM, fat mass; FFM, fat-free mass.
2 Significant interactionbetweenageandBMISDS(coefficient��0.026,P � 0.021).
3 Significant interactionbetweenageandBMISDS(coefficient��0.007,P � 0.04).
4 Significant interaction between sex and age (coefficient � 0.06,P � 0.001).
5 Similar results were also obtained if BMI SDS was replaced with FM(coefficient � �0.009, P � 0.001) or percentage fat (coefficient � �0.015,P � 0.001).
6 Significant interaction between age and sex (coefficient � 0.13,P � 0.03).
TABLE 7Summary of studies that assessed dual-energy X-ray absorptiometry against a 4-component model
Reference Date InstrumentationNo. of
subjects SubjectsPercentage
fat bias SignificancePercentage fat
limits of agreement
%Prior et al (22) 1997 QDR1000W1 172 Adults 0.4 No 5.8Roemmich et al (23) 1997 QDR20001 47 Children 1.88 Yes 8.3Wells et al (15) 1999 QDR1000W1 30 Children �0.2 No 6.5Clasey et al (24) 1999 QDR20001 78 Adults �0.9 to �4.5 Yes 7.8–10.5Wong et al (6) 2002 QDR2000W1 141 9–17 y �3.9 Yes 3.4Fuller et al (5) 1992 DPX2 28 Adults �1.36 Yes 4.95Gately et al (25) 2003 Lunar2 30 Obese children 1.9 Yes 4.0Van der Ploeg et al (26) 2003 DPX-L2 152 Adults �1.8 Yes 4.0Sopher et al (27) 2004 DPX/DPX-L2 411 Children 1.01 Yes 8.9
1 Hologic Inc, Waltham, MA.2 GE Medical Systems, Madison, WI.
1052 WILLIAMS ET AL
at UC
L Library Services on M
ay 10, 2006 w
ww
.ajcn.orgD
ownloaded from

Demonstration of the validity of DXA in healthy subjects is notsufficient justification for its application in patients, and ourfindings are highly relevant to this issue.
Many factors may contribute to the differences between stud-ies. First, DXA assumes a constant value for FFM hydration;however, this may not apply to all categories of subjects and,hence, may represent an inappropriate bias that introduces error(22, 28-32). One study, however, suggested that the magnitude ofthis bias is likely to be small (30). Second, subject size mayinfluence bias through the effect of tissue depth (29), with in-creasing tissue depth associated with greater bias by DXA (33).Third, some DXA instruments have no algorithms specific tochildren. Fourth, accuracy may differ between pencil- and fan-beam DXA instruments (34). Fifth, fat distribution may influ-ence accuracy, because pixels containing bone (approximatelyone-third of the total) extrapolate soft tissue composition fromadjacent regions, which may have a fat content different from theregion overlying the bone (29). Sixth, most of the head soft tissuecomposition is not calculated. Seventh, DXA instruments vary inthe approach used to estimate the fat content of bone, which leadsto generic differences between manufacturers. Finally, it is pos-sible that 4C models differ according to whether BV is measuredby underwater weighing or plethysmography, although moststudies have shown good agreement between these methods (35).Note that our own findings apply only to Lunar Prodigy instru-mentation.
The results of our study highlight variable bias in the mea-surement of FM, FFM, and weight by DXA according to severalkey characteristics of subjects. Clearly, variable bias betweenpatients and healthy subjects presents difficulties for case-control studies. Bias in weight has particular relevance to longi-tudinal studies because it may confound the estimation ofchanges in body composition (36). The sex-difference in bias hasimplications for studies intending to derive body compositioncutoffs for overweight and obesity (37, 38). The difference inbias between obese and nonobese persons indicates that DXAmay be unsuitable for assessing changes in body compositionduring weight loss, as was reported in several studies (24, 39).However, body size and fatness did not fully account for thevariability in bias between groups: children with GSD, thoughfatter than nonobese children, did not have biases similar to thoseof obese children. Because the bias was inconsistent, it would bedifficult to derive a simple single correction factor, as has beenproposed by others working on more homogenous samples (6).
The magnitude of mean biases found in our study was �2 kgof FFM and FM in groups, equivalent to �2% fat. In individuals,the limits of agreement were �3 kg of FFM and FM in adults and�2 kg in children, equivalent to 4–6% fat depending on age andgroup. This range of bias is smaller than that reported by Wonget al (6), but remains a serious issue because it is potentially of theorder of magnitude of difference that might be expected aftertreatment in an individual or between groups. Factors includingsize, age, sex, and disease state all showed an independent effectin ANCOVA, which suggests that qualitatively different factorscontribute to DXA bias. Our data indicate that DXA has limita-tions for measurement of body composition in clinical practice,but our findings are also important in the context of researchstudies. The literature contains increasing numbers of studiesusing DXA to undertake clinical research intended to provide
evidence appropriate as the basis for clinical practice. Our find-ings challenge the validity of this approach and suggest that otherapproaches, such as multicomponent models, are preferable.
The main limitation of our study, which is common to allstudies comparing DXA with the 4C model, was that DXA pro-vides data for both measurements. The measurement of BMC isintegral to DXA calculations of FFM and FM, and the same dataare also used in the 4C model. However, we believe that our studyis not adversely affected by this scenario. First, we calculated thatBMC would need to be measured with �30% error to induce a2% error in percentage fat. Thus, we think it highly unlikely thatour finding of variable bias between category of subjects can beentirely attributed to an effect of BMC error on both methods.Second, we reran our Bland-Altman calculations using the3-component model, which incorporates no data from DXA andis therefore fully independent, and obtained similar results. Wechose the 4C model as the reference because only this method canaddress the variability in mineralization that occurs within andbetween groups. Although the results are limited to the groupsbeing studied, it is sufficient to highlight that the accuracy withwhich DXA measures body composition varies depending onseveral factors.
In conclusion, our study suggests that caution is required in theapplicationof this instrumentation in themeasurementofbodycom-position in medical research and clinical practice. Our findings maybe particularly challenging for randomized controlled trials, inwhich differences in body composition at follow-up may induceinconsistent accuracy between 2 groups. We suggest that multicom-ponentmodels remain thebest existingmethodforunderpinning theevidence base for body-composition studies.
We thank the children, their families, and the adults who participated inthis study and P Lee and A Jaffe for assistance with recruitment.
JCKW and MSF conceived the study. JEW, CMW, and DH measured thesubjects and modeled the body-composition data. JEW, JCKW, and MSFconducted the statistical analyses. JEW wrote the first draft of the manuscript.All authors contributed to the revision of the manuscript. None of the authorshad a conflict of interest.
REFERENCES1. Mazess RB, Barden HS, Bisek JP, Hanson J. Dual-energy X-ray absorp-
tiometry for total-body and regional bone-mineral and soft-tissue com-position. Am J Clin Nutr 1990;51:1106–12.
2. Sood M, Adams JE, Mughal MZ. Lean body mass in children with cysticfibrosis. Arch Dis Child 2003;88:836.
3. Schmelzle H, Schroder C, Armbrust S, Unverzagt S, Fusch C. Restingenergy expenditure in obese children aged 4 to 15 years: measured versuspredicted data. Acta Paediatr 2004;93:739–46.
4. Packianathan IC, Fuller NJ, Peterson DB, Wright A, Coward WA, FinerN. Use of a reference four-component model to define the effects ofinsulin treatment on body composition in type 2 diabetes: the ‘Darwinstudy’. Diabetologia 2005;48:222–9.
5. Fuller NJ, Jebb SA, Laskey MA, Coward WA, Elia M. Four-componentmodel for the assessment of body composition in humans: comparisonwith alternative methods, and evaluation of the density and hydration offat-free mass. Clin Sci (Lond) 1992;82:687–93.
6. Wong WW, Hergenroeder AC, Stuff JE, Butte NF, Smith EO, Ellis KJ.Evaluating body fat in girls and female adolescents: advantages anddisadvantages of dual-energy X-ray absorptiometry. Am J Clin Nutr2002;76:384–9.
7. Cole TJ, Freeman JV, Preece MA. Body mass index reference curves forthe UK, 1990. Arch Dis Child 1995;73:25–9.
8. Kiebzak GM, Leamy LJ, Pierson LM, Nord RH, Zhang ZY. Measure-ment precision of body composition variables using the lunar DPX-Ldensitometer. J Clin Densitom 2000;3:35–41.
9. Dewit O, Fuller NJ, Fewtrell MS, Elia M, Wells JC. Whole body air
EVALUATION OF DXA IN PATIENT GROUPS 1053
at UC
L Library Services on M
ay 10, 2006 w
ww
.ajcn.orgD
ownloaded from

displacement plethysmography compared with hydrodensitometry forbody composition analysis. Arch Dis Child 2000;82:159–64.
10. Wells JC, Fuller NJ, Wright A, Fewtrell MS, Cole TJ. Evaluation ofair-displacement plethysmography in children aged 5–7 years using athree-component model of body composition. Br J Nutr 2003;90:699–707.
11. Wells JC, Fuller NJ. Precision of measurement and body size in whole-body air-displacement plethysmography. Int J Obes Relat Metab Disord2001;25:1161–7.
12. Freeman JV, Cole TJ, Chinn S, Jones PR, White EM, Preece MA. Crosssectional stature and weight reference curves for the UK, 1990. Arch DisChild 1995;73:17–24.
13. Scrimgeour CM, Rollo MM, Mudambo SM, Handley LL, Prosser SJ. Asimplified method for deuterium/hydrogen isotope ratio measurementson water samples of biological origin. Biol Mass Spectrom 1993;22:383–7.
14. Racette SB, Schoeller DA, Luke AH, Shay K, Hnilicka J, Kushner RF.Relative dilution spaces of 2H- and 18O-labeled water in humans. Am JPhysiol 1994;267:E585–90.
15. Wells JC, Fuller NJ, Dewit O, Fewtrell MS, Elia M, Cole TJ. Four-component model of body composition in children: density and hydra-tion of fat-free mass and comparison with simpler models. Am J ClinNutr 1999;69:904–12.
16. Bland JM, Altman DG. Statistical methods for assessing agreementbetween two methods of clinical measurement. Lancet 1986;1:307–10.
17. Cole TJ. Sympercents: symmetric percentage differences on the 100log(e) scale simplify the presentation of log transformed data. Stat Med2000;19:3109–25.
18. Cole TJ, Kryakin YV. Sympercents: symmetric percentage differenceson the 100 log(e) scale simplify the presentation of log transformed data.Stat Med 2002;21:2287–90.
19. Pintauro SJ, Nagy TR, Duthie CM, Goran MI. Cross-calibration of fatand lean measurements by dual-energy X-ray absorptiometry to pigcarcass analysis in the pediatric body weight range. Am J Clin Nutr1996;63:293–8.
20. Koo WW, Hammami M, Shypailo RJ, Ellis KJ. Bone and body compo-sition measurements of small subjects: discrepancies from software forfan-beam dual energy X-ray absorptiometry. J Am Coll Nutr 2004;23:647–50.
21. Hammami M, Koo WW, Hockman EM. Technical considerations forfan-beam dual-energy x-ray absorptiometry body composition measure-ments in pediatric studies. JPEN J Parenter Enteral Nutr 2004;28:328–33.
22. Prior BM, Cureton KJ, Modlesky CM, et al. In vivo validation of wholebody composition estimates from dual-energy X-ray absorptiometry.J Appl Physiol 1997;83:623–30.
23. Roemmich JN, Clark PA, Weltman A, Rogol AD. Alterations in growthand body composition during puberty. I. Comparing multicompartmentbody composition models. J Appl Physiol 1997;83:927–35.
24. Clasey JL, Kanaley JA, Wideman L, et al. Validity of methods of body
composition assessment in young and older men and women. J ApplPhysiol 1999;86:1728–38.
25. Gately PJ, Radley D, Cooke CB, et al. Comparison of body compositionmethods in overweight and obese children. J Appl Physiol 2003;95:2039–46.
26. Van der Ploeg GE, Withers RT, Laforgia J. Percent body fat via DEXA:comparison with a four-compartment model. J Appl Physiol 2003;94:499–506.
27. Sopher AB, Thornton JC, Wang J, Pierson RN Jr, Heymsfield SB,Horlick M. Measurement of percentage of body fat in 411 children andadolescents: a comparison of dual-energy X-ray absorptiometry with afour-compartment model. Pediatrics 2004;113:1285–90.
28. Testolin CG, Gore R, Rivkin T, et al. Dual-energy X-ray absorptiometry:analysis of pediatric fat estimate errors due to tissue hydration effects.J Appl Physiol 2000;89:2365–72.
29. Laskey MA. Dual-energy X-ray absorptiometry and body composition.Nutrition 1996;12:45–51.
30. Pietrobelli A, Formica C, Wang Z, Heymsfield SB. Dual-energy X-rayabsorptiometry body composition model: review of physical concepts.Am J Physiol 1996;271:E941–51.
31. Speakman JR, Booles D, Butterwick R. Validation of dual energy X-rayabsorptiometry (DXA) by comparison with chemical analysis of dogsand cats. Int J Obes Relat Metab Disord 2001;25:439–47.
32. Haroun D, Wells JC, Williams JE, Fuller NJ, Fewtrell MS, Lawson MS.Composition of the fat-free mass in obese and non-obese children:matched case-control analyses. Int J Obes Relat Metab Disord 2005;29:29–36.
33. Mitchell AD, Scholz AM, Pursel VG. Dual-energy X-ray absorptiom-etry measurements of the body composition of pigs of 90- to 130-kilograms body weight. Ann N Y Acad Sci 2000;904:85–93.
34. Tylavsky F, Lohman T, Blunt BA, et al. QDR 4500A DXA overesti-mates fat-free mass compared with criterion methods. J Appl Physiol2003;94:959–65.
35. Fields DA, Goran MI, McCrory MA. Body-composition assessment viaair-displacement plethysmography in adults and children: a review.Am J Clin Nutr 2002;75:453–67.
36. Lohman TG, Harris M, Teixeira PJ, Weiss L. Assessing body compo-sition and changes in body composition. Another look at dual-energyX-ray absorptiometry. Ann N Y Acad Sci 2000;904:45–54.
37. Taylor RW, Keil D, Gold EJ, Williams SM, Goulding A. Body massindex, waist girth, and waist-to-hip ratio as indexes of total and regionaladiposity in women: evaluation using receiver operating characteristiccurves. Am J Clin Nutr 1998;67:44–9.
38. Taylor RW, Falorni A, Jones IE, Goulding A. Identifying adolescentswith high percentage body fat: a comparison of BMI cutoffs using ageand stage of pubertal development compared with BMI cutoffs using agealone. Eur J Clin Nutr 2003;57:764–9.
39. Nelson ME, Fiatarone MA, Layne JE, et al. Analysis of body-composition techniques and models for detecting change in soft tissuewith strength training. Am J Clin Nutr 1996;63:678–86.
1054 WILLIAMS ET AL
at UC
L Library Services on M
ay 10, 2006 w
ww
.ajcn.orgD
ownloaded from

Pediatric reference data for lean tissue properties: density andhydration from age 5 to 20 y1–3
Jonathan CK Wells, Jane E Williams, Sirinuch Chomtho, Tegan Darch, Carlos Grijalva-Eternod, Kathy Kennedy,Dalia Haroun, Catherine Wilson, Tim J Cole, and Mary S Fewtrell
ABSTRACTBackground: Hydrometry and densitometry are widely used toassess pediatric body composition due to their ease of application.The accuracy of these techniques depends on the validity of age-and sex-specific constant values for lean tissue hydration or density.Empirical data on these constants, and their variability betweenindividuals, are lacking.Objectives: The objectives were to measure lean tissue hydrationand density in a large sample of children and adolescents and toderive prediction equations.Design: Body composition was measured in 533 healthy individuals(91% white) aged 4–23 y by using the 4-component model. Age-and sex-specific median values for hydration and density were ob-tained by using the LMS (lambda, mu, sigma) method. Regressionanalysis was used to generate prediction equations on the basis ofage, sex, and body mass index SD score (BMI SDS). Values werecompared with those in previously published predictions.Results: Age-associated changes in density and hydration differedbetween the sexes. Compared with our empirical values, use ofpublished values resulted in a mean bias of 2.1% fat (P ,0.0001). Age, sex, and BMI SDS were all significant predictors oflean tissue hydration and density. With adjustment for age and sex,hydration was higher, and density lower, in higher–BMI SDS indi-viduals.Conclusions: The chemical maturation of lean tissue is not a linearprocess and proceeds differently in males and females. Previouslypublished reference values are inaccurate and induce clinically sig-nificant bias in percentage fat. New empirical reference values areprovided for use in pediatric hydrometry and densitometry.Further research that extends to cover nonwhite ethnic groups isneeded. Am J Clin Nutr 2010;91:610–8.
INTRODUCTION
The gold standard for body-composition assessment at themolecular level is cadaver dissection; hence, all in vivo mea-surements in humans are restricted to the measurement of specificphysical parameters, such as body density, body water or po-tassium content, or X-ray attenuation. Raw data on such variablesare converted to final body-composition values by using as-sumptions concerning the biological, chemical, or physical prop-erties of specific body components. Two useful body-compositiontechniques, especially in children, are hydrometry [the mea-surement of total body water (TBW)] and densitometry. Inhydrometry, TBW is converted to lean tissue (used here syn-
onymously with fat-free tissue) by using an assumed constantvalue for lean tissue hydration (1). The same correction is re-quired with the use of most bioelectrical impedance equations,which usually predict TBW from the raw bioelectrical data (2). Indensitometry, the proportion of fat in weight (% fat) is calculatedon the basis of assumed constant densities of fat and lean tissues(3). Although these techniques are regularly used for pediatricbody-composition assessment, their accuracy is dependent notonly on accuracy of the raw data but also on the accuracy of thetissue property values assumed to be constant among individuals.
These issues are of particular importance when studyingchildren due to the well-established process of chemical matu-ration that occurs before adulthood (4, 5). Whereas fat has rel-atively uniform physical properties throughout the life course(zero water content and a density of 0.9007 kg/L), lean tissuedecreases in water content and increases in density during growth(5). At birth, lean tissue has been proposed to be’80% water, incontrast to the adult value of ’73% (5). Lean tissue densitylikewise increases from ’1.063 to ’1.10 kg/L over the sameperiod (5). For almost 3 decades, researchers have relied on 2landmark publications for these tissue constants. In 1982 Fomonet al (5) published a “reference child,” providing such data forthe period from birth to age 10 y. However, these data werebased on actual measurements only in infancy and at age 9 or10 y, with most values in between being extrapolated. In 1989Lohman (6) published similar reference data for the entire pe-diatric age range, merging the data of Fomon et al with furtherempirical data based on simultaneous measurements of TBW,body density, and forearm bone mineral density in 292 in-dividuals aged 8–30 y (7). Simulations for adolescents were alsoreported by Haschke (8).
1 From the Childhood Nutrition Research Centre (JCKW, JEW, SC, TD,
KK, DH, and MSF), Centre for International Health and Development (CG-
E), and MRC Centre of Epidemiology for Child Health (TJC), UCL Institute
of Child Health, London, United Kingdom; and the Radiology Department,
Great Ormond Street Hospital for Sick Children, London, United Kingdom
(CW).2 Supported by the UK Medical Research Council. DH was supported by
the Child Growth Foundation.3 Address correspondence to JCK Wells, Childhood Nutrition Research
Centre, UCL Institute of Child Health, 30 Guilford Street, London WC1N
1EH, United Kingdom. E-mail: [email protected].
Received July 23, 2009. Accepted for publication November 16, 2009.
First published online January 20, 2010; doi: 10.3945/ajcn.2009.28428.
610 Am J Clin Nutr 2010;91:610–8. Printed in USA. � 2010 American Society for Nutrition
at University C
ollege London on February 21, 2010
ww
w.ajcn.org
Dow
nloaded from

Further data on these tissue properties have been reported fornarrow age ranges, and typically in small samples (7, 9–12),although more comprehensive data for the first 2 y of life areavailable (13). Currently, researchers cannot be confident ofselecting appropriate age- and sex-specific values, and there islittle understanding of other factors associated with individualvariability in these tissue properties. For example, we previouslyreported an association between hydration and body mass index(BMI) SD score (BMI SDS) in children (14).
We have recently obtained data on body composition in a large,healthy sample of children and adolescents aged 4–23 y. Here, wereport reference data for the hydration and density of lean tissueand develop prediction equations on the basis of age, sex, andBMI SDS.
SUBJECTS AND METHODS
A total of 565 normal, healthy children and adolescents aged4–23 y were recruited by using flyers and newspaper adver-tisements in London and the southeast of England, starting in2001. There were no exclusion criteria for BMI; hence, someindividuals were categorized as overweight or obese, but theywere not recruited directly from obesity weight-loss clinics andhad no disease that might have adversely affected growthand development. The lower age limit of 4 y was chosen onthe basis of our previous work, in that younger children areunlikely to satisfy the protocol for air-displacement plethys-mography. Data collection was extended to young adults tocover the entire pediatric age range. Ethical approval was grantedby the Ethical Committee of the University College LondonInstitute of Child Health and Great Ormond Street Hospital. Allindividuals attended our body-composition investigation suitelocated at Great Ormond Street Hospital for a 2-h measurementsession.
Weight and height were measured by using standard protocols.Body weight (BW) was measured in duplicate as part of the air-displacement plethysmography protocol (see below). Height wasmeasured by using a wall-mounted stadiometer (Holtain, Dyfed,United Kingdom). BMI was calculated as weight (kg) dividedby the square of height (m). Anthropometric data were con-verted to SDS format by using UK reference data (15, 16).Obesity was defined as a BMI .95th centile (SDS .1.64), andoverweight was defined as a BMI .85th centile (SDS .1.04)(16). Pubertal development was assessed by Tanner staging byself-assessment on the basis of line drawings. Skinfold thicknessmeasurements were performed in triplicate at the biceps, triceps,subscapular, and suprailiac sites, and the mean of the 3 valueswas used.
Measurements of TBW by deuterium dilution, bone mineralcontent (BMC) by dual-energy X-ray absorptiometry (DXA;Lunar Prodigy; GE Medical Systems, Madison, WI), and bodyvolume (BV; in duplicate) by air-displacement plethysmography(Bodpod; Life Measurements, Concord, CA) were obtained asdescribed previously (17). The deuterium dilution space wasconverted to TBW assuming the degree of overestimation at-tributable to proton exchange to be 1.044 (18). Lung volume waspredicted rather than measured in the plethysmography mea-surements, because we have found a large proportion of childrenare unable to complete the lung volume measurement protocol.The 4-component (4C)model was used to calculate lean mass and
fat mass (FM), as described previously (10, 19), using the fol-lowing equation:
FM ¼ ð2:7473BVÞ2 ð0:7103TBWÞþ ð1:4603BMCÞ2 ð2:0503BWÞ ð1Þ
The precision of TBW in our laboratory is 1% (10). Theprecision of BV from duplicate measurements and BMC is 0.24 Land 1.1%, respectively (20). Hydration was calculated as (TBW/lean mass) · 100%. Density was calculated as [(mass of water +mass of mineral + mass of protein)/(volume of water + volumeof mineral + volume of protein)] with the use of values for thedensity of water at 36�C, mineral, and protein of 0.99371,3.0375, and 1.34 kg/L, respectively (17).
Sex-specific values by year of age were obtained for hydrationand density by using Cole’s LMS (lambda, mu, sigma) method(LMS Chart Maker; Medical Research Council, London, UnitedKingdom) (21). This statistical approach, widely used to con-struct reference data for traits that incorporate the effects ofgrowth, provides 3 outputs: 1) a smoothed median (M or mu)curve, which represents how the outcome varies in relation toage; 2) the CV (S or sigma), which models the scatter of valuesaround the mean and adjusts for any nonuniform dispersion;and 3) the skewness (L or lambda), which is addressed by usingage-specific Box-Cox transformation (L) to achieve a normaldistribution. Goodness-of-fit was assessed by comparing con-secutive models and adding complexity only if a significantimprovement to the fit (reduced deviance) was obtained. Be-cause the precision of the M curve at any age depends on datapoints at younger and older ages, precision is lower at the ex-tremes of the age range. We therefore fitted the data for all ages(4–23 y) and derived M values for the age range of 5–20 y.
Derived values for the density of lean tissue (DL) were com-bined with an assumed constant density of fat (DF: 0.9007 kg/L)to generate age-specific constants for application in the genericequation proposed by Siri (3), as undertaken previously byLohman (6):
% Fat ¼ ðC1=BD 2 C2Þ3 100 ð2Þ
where BD is body density, C1 is calculated as (DL · DF)/(DL 2DF), and C2 is calculated as DF/(DL 2 DF) (6).
Multiple regressionanalysiswasundertaken toderivepredictiveequations for hydrationanddensity of lean tissue.The independentvariables comprised age, age squared, sex, and BMI SDS. Thesevalues are readily obtainable in community or clinical studies. Ouraim was to derive appropriate equations and to identify the pro-portion of variance accounted for by the predictors. We alsocompared the utility of sex-specific equations with sex-combinedequations. The association of BMI with hydration and density wasassessed by using partial correlations adjusted for age and sex.
Residual values for hydration and density were calculated asthe measured value minus the average (LMS-derived) value forthe appropriate year age group. Correlation analysis was thenused to investigate possible associations between the residualvalues and BMI SDS or skinfold thicknesses. The effect ofobesity (categorized as yes/no) on hydration and density afteradjustment for age, sex, and ethnicity was also tested for.
The method of Bland and Altman was used to compare ourempirical values of % fat with those that were calculated by using
PEDIATRIC REFERENCE DATA FOR LEAN TISSUE PROPERTIES 611
at University C
ollege London on February 21, 2010
ww
w.ajcn.org
Dow
nloaded from

densitometry in association with the Lohman values for thepediatric version of Siri’s equation (3, 6, 22). We also calculatedthe proportion of our sample that would be incorrectly catego-rized as obese on the basis of % fat [using cutoffs of 20% fat formales and 30% for females (23)] if using the Lohman densityvalues and our own empirical values as the reference. Allanalyses were conducted with the use of Data Desk version 6.1(Data Description Inc, Ithaca, NY).
Finally, we evaluated the agreement between hydrometry anddensitometry used as 2-component techniques (ie, by using dataon TBWor density in combination with our new reference valuesfor hydration or density, respectively) and DXA. Age- and sex-specific values for lean tissue hydration and density were used toconvert TBW to lean mass and density to % fat. Bland-Altmananalysis was then used to compare agreement in lean mass and %fat between DXA and hydrometry or DXA and densitometry. TheDXA lean mass value as used here included both bone and leansoft tissue. Correlations were also calculated to assess the as-sociation between bias and the magnitude of lean mass or % fat.
RESULTS
Valid data were obtained for 533 individuals. Data for 32individuals were discarded in cases in which one or more of themeasurements was unsuccessful (n = 16; mostly very young
children) or if the modeling was unsuccessful (n = 16) indicatedby spurious body-composition data. As indicated in Figure 1,a wide range of BMI SDS was apparent at all ages. There was nosignificant correlation between BMI SDS and age in either sex.
Data on the anthropometric SDS values and the range of % fatby sex are provided in Table 1. On average, our sample washeavier, taller, and relatively heavier for their height than the UKreference data of the early 1990s (P , 0.005 in all cases). Fe-males had significantly greater % fat than males by the 4Cmodel (P, 0.0001, adjusted for age). The prevalence of obesitywas 11.5% and 14.7% in males and females, respectively, andwas uncorrelated with age. The numbers by pubertal stage wereas follows: males: 98, 60, 28, 24, 50 (for pubertal stages 1–5,respectively); females: 87, 48, 34, 22, 80 (for pubertal stages 1–5, respectively); and 2 others not recorded. Age- and sex-specificempirical mean (6SD) values for lean tissue properties, strati-fied in 2-y age groups, are given in Table 2.
Our values for density and hydration with equivalent data fromother studies for each sex are compared in Figure 2. Densityincreased with age in both sexes, but in different patterns.Whereas the increase was relatively consistent in females, inmales the values plateaued between 10 and 15 y, and again from18 y. Hydration decreased with age in both sexes, but againdiffering by sex. The decrease in hydration in males laggedbehind that for females, until a sudden marked drop from ’16 y. Overall, age changes in lean tissue properties were morelinear in females compared with males, but in both sexes thetrend was nonlinear. In comparison with previously reporteddata, our hydration data fit fairly well for males but not forfemales, in whom the simulations produced values ’2% toohigh in mid-childhood. For density, our values are systemati-cally higher than previously modeled values throughout child-hood and adolescence. Our empirical % fat values comparedwith those obtained by using values for body density in com-bination with the Lohman values for lean tissue density areshown in Figure 3. The mean bias was 22.1% (limits of agree-ment 6 4.7%), which was significantly greater in females thanmales (23.3 compared with 21.1%, P , 0.001). The bias in-creased with age in males (r = 0.30, P , 0.0001) but not fe-males (r = 0.11). By using cutoffs of 20% fat in males and 30%fat in females, this error would result in 24 males and 17 fe-males being incorrectly categorized as nonobese, lowering theprevalence of obesity from 36.6% to 27.5% in males and from33.4% to 27.2% in females.
FIGURE 1. BMI SD score (BMI SDS) in the whole sample, by sex.
TABLE 1
Summary statistics for anthropometric measurements and weight status by sex1
Males (n = 261) Females (n = 272)
Mean 6 SD Range Mean 6 SD Range
Weight SDS 0.31 6 1.08 22.42, 3.44 0.42 6 1.10 22.75, 3.46
Height SDS 0.21 6 0.96 22.09, 3.28 0.34 6 1.02 22.77, 3.42
BMI SDS 0.24 6 1.15 22.99, 3.49 0.31 6 1.15 23.33, 3.32
% Fat (4-component model)2 19.2 6 8.0 4.9, 45.5 27.0 6 8.0 11.7, 46.9
Overweight (%) 9.2 10.7
Obese (%) 11.5 14.8
1 SDS, SD score.2 Significantly different between sexes, P , 0.0001 (multiple regression analysis to assess significance of female sex,
adjusted for age).
612 WELLS ET AL
at University C
ollege London on February 21, 2010
ww
w.ajcn.org
Dow
nloaded from

The association between residual hydration or density (theactual value minus the average value for that age-sex group) andBMI SDS was weak but significant (hydration: r = 0.26, P ,0.0001; density: r = 20.14, P = 0.002). With skinfold thickness,with adjustment for age, the associations were weaker (hydra-tion: r = 0.11, P = 0.007; density: r = 20.05, P = 0.2). Fittinga squared BMI term increased the r2 values only slightly, in-dicating that the effect of BMI SDS on lean tissue properties isbroadly consistent across the range of BMIs. Dividing thesample into those above and below a BMI SDS of zero, dif-
ferences in density and hydration were greater at older ages,especially in males (Figure 4). Mean (6SE) values for hydra-tion were 1.0 6 0.2% (P , 0.0001) greater, and density was0.0022 6 0.0007 kg/L (P , 0.002) lower in obese comparedwith nonobese individuals.
Regression equations for density and hydration on age, sex,and BMI SDS are given in Table 3. Age squared did not con-tribute significantly, which indicated a linear association. Thesex-combined equation explained around half of the variance indensity but only a third of the variance in hydration. Given the
FIGURE 2. Comparison of our empirical values for lean tissue properties with those reported from the literature previously (5, 6, 8, 13) by using the meanand SD of 2-y age groups. Density of lean tissue in males (A) and in females (B). Hydration of lean tissue in males (C) and in females (D).
TABLE 2
Age- and sex-specific values for the density and hydration of lean tissue
Age
Males (n = 261) Females (n = 272)
n Density Hydration n Density Hydration
kg/L % kg/L %
4–5.99 y 22 1.0826 6 0.0080 76.6 6 2.4 13 1.0821 6 0.0070 77.3 6 2.0
6–7.99 y 24 1.0865 6 0.0064 76.1 6 1.8 35 1.0899 6 0.0058 75.3 6 1.7
8–9.99 y 40 1.0887 6 0.0049 75.8 6 1.4 31 1.0905 6 0.0058 75.2 6 1.7
10–11.99 y 51 1.0917 6 0.0043 75.2 6 1.4 43 1.0926 6 0.0052 75.0 6 1.7
12–13.99 y 51 1.0914 6 0.0055 75.2 6 1.6 54 1.0951 6 0.0051 74.8 6 1.5
14–15.99 y 18 1.0923 6 0.0066 75.0 6 1.6 32 1.0996 6 0.0050 74.1 6 1.5
16–17.99 y 23 1.0992 6 0.0055 73.1 6 1.6 19 1.1021 6 0.0041 73.7 6 1.7
18–19.99 y 21 1.0995 6 0.0065 73.4 6 2.0 26 1.1034 6 0.0056 73.5 6 1.5
20–22.99 y 11 1.1013 6 0.0055 73.6 6 1.5 19 1.1037 6 0.0057 73.7 6 1.0
PEDIATRIC REFERENCE DATA FOR LEAN TISSUE PROPERTIES 613
at University C
ollege London on February 21, 2010
ww
w.ajcn.org
Dow
nloaded from

sex differences in the age pattern of density and hydration, sex-specific models were also fitted, with similar r2 values as thosefor the sex-combined model. Ethnicity (black or Asian) was notsignificant for hydration or density, except for black females inwhom the mean density of lean tissue was 0.0003 kg/L lowerthan in white females (P, 0.0008). Excluding the effects of age
and sex, the correlations of BMI SDS with hydration and densitywere 0.26 (P , 0.0001) and 20.15 (P , 0.001), respectively.
Age- and sex-specific constants on the basis of our data,obtained from the M curve of the LMS method, are shown inTable 4. These values are for hydration of lean tissue and the C1and C2 constants for the densitometric equation predicting % fatfrom body density. The values for adult males are similar toSiri’s values of 4.95 for C1 and 4.50 for C2. However, for adultfemales our values are slightly lower: 4.90 for C1 and 4.44 forC2 at 20 y. The difference between our adult female equationand that of Siri’s is 1.1% fat.
Agreement between DXA and hydrometry or densitometry as2-component techniques is shown in Table 5. There was a sig-nificant underestimation of lean mass by DXA relative to bothhydrometry and densitometry in females (P , 0.001) but not inmales. Likewise, there was a significant overestimation of % fatby DXA relative to hydrometry and densitometry in females(P , 0.001) but not in males. The limits of agreement wereapproximately 63.1–3.4 kg of lean mass and 66.1–6.6% fat.Bias was in most cases associated with the magnitude of leantissue or % fat.
DISCUSSION
This study provides the first comprehensive empirical data onthe density and hydration of lean tissue, and their variability,across the majority of the growth period. These data will improvethe accuracy of hydrometry and densitometry when applied to the
FIGURE 3. Bland-Altman plot showing the bias in % fat obtained byusing body density from air-displacement plethysmography in combinationwith the lean tissue density values of Lohman (6) in comparison with ourempirical 4-component (4C) values as the reference. The mean bias is shownfor each sex.
FIGURE 4. Mean (6SD) age changes in the properties of lean tissue, stratified according to BMI SD score (BMI SDS) above or below zero. Hydration oflean tissue in males (A) and in females (B). Density of lean tissue in males (C) and in females (D).
614 WELLS ET AL
at University C
ollege London on February 21, 2010
ww
w.ajcn.org
Dow
nloaded from

pediatric population. They also reveal important nonlinear pat-terns of chemical maturation in children, which further differbetween the 2 sexes. Our empirical values were similar to those ofLohman (6) for hydration in males but differed substantially forhydration in females and for density in both sexes. These dif-ferences generate mean errors of approximately21 to22.5% fatin individuals of average fatness according to age, with anoverall mean bias of 22.1% for densitometry. Such errors areclinically significant when, for example, categorizing obesityaccording to adiposity [% fat: .20% in males, 30% in females(23)] rather than BMI.
Maturational changes in hydration and density have beenattributed to a combination of factors. On the one hand, decreases
in the water content of lean tissue correspond to increases inprotein and mineral content (5) and hence to the ratio of ex-tracellular solids to body water (24). However, this absolutedecrease in water content also incorporates a decline in the ratioof extracellular to intracellular water, as cells increase in size andthus in their relative water content (24). It has been generallyassumed that these changes occur fastest in early childhood, andthat the rate of change is slower after 2 y (5, 13). Our data,however, suggest that chemical maturation continues at a fasterrate until’7 y of age and that less maturation takes place duringadolescence than previously assumed.
Our values for male adults aged 18–23 y are extremely similarto those generally assumed, with amean hydration of 73.4–73.6%
TABLE 3
Regression equations for the prediction of lean tissue density and hydration by age, sex, and BMI SD score (BMI SDS)1
Density (·1000) Hydration
B SE t P r2 B SE t P r2
All
Constant 1074.8 0.97 1106 ,0.0001 0.52 77.59 0.28 281 ,0.0001 0.30
Age (y) 1.18 0.05 22.0 ,0.0001 20.19 0.01 212.7 ,0.0001
Female sex 2.79 0.48 5.8 ,0.0001 20.27 0.14 22.0 0.046
BMI SDS 20.90 0.21 24.3 ,0.0001 0.41 0.06 7.0 ,0.0001
Males
Constant 1078.2 1.04 1037 ,0.0001 0.44 77.71 0.30 261 ,0.0001 0.31
Age (y) 1.14 0.08 14.0 ,0.0001 20.23 0.02 29.7 ,0.0001
BMI SDS 21.09 0.30 23.6 0.0004 0.43 0.09 4.9 ,0.0001
Females
Constant 1079.8 0.98 1093 ,0.0001 0.53 76.69 0.28 277 ,0.0001 0.28
Age (y) 1.23 0.07 17.1 ,0.0001 20.17 0.02 28.2 ,0.0001
BMI SDS 20.70 0.28 22.4 0.015 0.42 0.08 5.3 ,0.0001
1 In each model, hydration or density was regressed on predictors that included age, BMI SDS, and female sex as specified.
TABLE 4
Median values for hydration, density, and constants (C1 and C2) for the pediatric version of Siri’s (3) equation, obtained
by using the LMS (lambda, mu, sigma) method1
Age
Males Females
Hydration Density C1 C2 Hydration Density C1 C2
% kg/L % kg/L
5 y 76.5 1.0827 5.36 4.95 76.7 1.0837 5.33 4.92
6 y 76.3 1.0844 5.32 4.90 76.1 1.0865 5.27 4.85
7 y 76.1 1.0861 5.28 4.86 75.5 1.0887 5.22 4.79
8 y 75.9 1.0877 5.24 4.82 75.2 1.0900 5.19 4.76
9 y 75.7 1.0889 5.21 4.79 75.1 1.0909 5.17 4.74
10 y 75.5 1.0900 5.19 4.76 75.0 1.0916 5.15 4.72
11 y 75.3 1.0911 5.16 4.73 75.0 1.0924 5.13 4.70
12 y 75.2 1.0917 5.15 4.72 74.9 1.0937 5.10 4.67
13 y 75.0 1.0920 5.14 4.71 74.6 1.0954 5.07 4.63
14 y 74.8 1.0927 5.13 4.69 74.4 1.0975 5.02 4.58
15 y 74.4 1.0942 5.09 4.66 74.1 1.0996 4.98 4.53
16 y 74.0 1.0960 5.05 4.61 73.8 1.1011 4.95 4.49
17 y 73.7 1.0978 5.02 4.57 73.7 1.1020 4.93 4.47
18 y 73.5 1.0991 4.99 4.54 73.6 1.1027 4.92 4.46
19 y 73.4 1.1000 4.97 4.52 73.6 1.1031 4.91 4.45
20 y 73.3 1.1006 4.96 4.51 73.6 1.1035 4.90 4.44
1 C1 is calculated as (DL · DF)/(DL 2 DF), and C2 is calculated as DF/(DL 2 DF); DL and DF represent density of lean
tissue and density of fat, respectively. % Fat is calculated as [(C1/BD) – C2] · 100, where BD is measured whole-body
density.
PEDIATRIC REFERENCE DATA FOR LEAN TISSUE PROPERTIES 615
at University C
ollege London on February 21, 2010
ww
w.ajcn.org
Dow
nloaded from

and a density of 1.0995–1.1013 kg/L. Our female values aresimilar for hydration (73.5–73.7%) but slightly greater for density(1.1034–1.1037 kg/L). The average value from 9 cadaver studieswas 73.7%, although the range was quite high (68.6–80.8%) (25),whereas the study by Fuller et al (19), using the 4C model, re-ported mean (6SD) values of 73.86 2.1% (19). Our adult valuesfor density are likewise very close to the value of 1.10 kg/Lassumed by Siri (3) and Brozek et al (26) and to the mean(6SD) provided by 8 cadaver studies of 1.099 6 0.015 kg/L(27). From their modeling, Wang et al (27) predicted ’0.002–0.004 kg/L greater density in women compared with men, andour empirical data show very similar differences of 0.004 kg/L atage 18–19.99 y and 0.002 kg/L at age 20–22.99 y. Consequently,our data imply that there should be slightly different versions ofSiri’s equation for adult men and women to calculate bodycomposition from whole-body density.
Although in the past decade many body-composition re-searchers have selected DXA for pediatric research studies,significant bias has been shown in this technique, which furthervaries between instruments, and in relation to sex and nutritionalstatus (28–30). Limits of agreement are also wide in individuals.In the present study, hydration and density have been calibratedagainst the 4C model, thus removing any average biases at eachage. By using this calibration, we found that DXA showedsignificant disagreement with hydrometry and densitometry as2-component techniques in females but not males, which is similarto our previous evaluation of DXA by using the 4C model (29).
However, our study further shows that nutritional status, asindexed by BMI SDS or skinfold thickness, accounts for some ofthe between-individual variability in lean tissue properties afteradjustment for age and sex. This finding is consistent withprevious studies by us (14) and others (12) and is partly explainedfrom a theoretical perspective by the fact that hydration of thecellular component of adipose tissue is greater than that of leantissue (25). In males, this effect of BMI is negligible until lateadolescence, but in females it is significant during pubertal de-velopment from ’10 y old, although it temporarily lessens at’14 y. Failure to take this effect into account will thereforeintroduce bias in the final body-composition values in relation to
nutritional status, whether hydrometry or densitometry is used.A correction factor could be applied on the basis of our linearregression of hydration or density against BMI SDS, and in theabsence of such correction errors of 2–4% fat could arise.
The increase in hydration in obese compared with nonobeseindividuals averaged ’1% after adjustment for age and sex, butin other studies reached ’2% in extreme obesity (14). Thisgreater increase in hydration has been attributed to expansion ofthe extracellular water pool (31). The density of lean tissue islikewise reduced by ’0.015 kg/L in obese individuals, as wehave found previously (32). When high levels of accuracy arerequired, 2-component techniques are inherently limited be-cause of their assumption of constant values for lean tissuecomposition, and multicomponent models are preferred in obeseindividuals, in whom variability in lean tissue properties is alsogreater.
Nevertheless, we have previously shown that around half of thevariability in hydration and density of lean tissue in the normalweight range can be attributed to methodologic imprecision (10).This is likely to account for the limited success (r2 values rangingfrom 0.28 to 0.53) with which factors such as age, sex, and BMISDS accounted for density and hydration variance in our re-gression models. From a theoretical perspective, a narrow rangeof hydration variability is predicted in healthy individuals ofa given age because of limited capacity for variability in cellularand extracellular hydration and in the ratio of extracellularsolids to TBW (25). Because mineral and protein content areclosely related, the scenario for hydration is broadly applicableto density.
Disease can generate marked shifts in the extra- to intracellularratio and change hydration and density to a greater extent. Inpediatric survivors of acute lymphoblastic leukemia, we detecteda 1.8% increase in hydration and a 0.007-kg/L reduced densityrelative to healthy control children (33), some of which may beattributed to the greater adiposity of the patients. In healthyindividuals, however, these tissue properties have a limited rangeof biological variability, and among the range of body-compositiontechniques, hydrometry and densitometry remain relatively ac-curate and perform well when compared against the gold-standard
TABLE 5
Bland-Altman analysis of the agreement between dual-energy X-ray absorptiometry and hydrometry or densitometry as
2-component techniques
Sex Bias1Limits of
agreement2 P3 r4 P5
Hydrometry
Lean mass Male 20.16 63.44 0.1 20.25 ,0.001
Female 21.05 63.28 ,0.001 20.51 ,0.001
% Fat Male 0.1 66.6 0.6 0.31 ,0.001
Female 1.3 63.3 ,0.001 0.41 ,0.001
Densitometry
Lean mass Male 20.10 62.68 0.2 20.33 ,0.001
Female 21.08 63.11 ,0.001 20.51 ,0.001
% Fat Male 20.1 66.3 0.7 20.02 0.9
Female 1.6 66.1 ,0.001 0.08 0.1
1 Calculated as dual-energy X-ray absorptiometry value minus hydrometry or densitometry value.2 Calculated as twice the SD of the bias.3 Refers to significance of bias.4 Correlation between bias and magnitude of lean mass or % fat.5 Refers to significance of r.
616 WELLS ET AL
at University C
ollege London on February 21, 2010
ww
w.ajcn.org
Dow
nloaded from

4C model (10, 34, 35). Furthermore, if the SD of hydration anddensity in patients is similar to that in healthy children, as wefound in our study of leukemia survivors (33), a simple correctionfactor might be used in subsequent evaluation of such patients onthe basis of 2-component methodologies.
Due to practical factors, we were not able to extend our studyto children aged ,4 y. Body density is rarely measured in youngchildren, but there are negligible difficulties in applying hy-drometry across the entire human age range. Butte et al (13)recently published reference values for hydration in the first 2 yof life, although their multicomponent model calculations didnot match exactly with our own due to the difficulty of mea-suring body density in very young age groups. The link betweenthe 2 data sets is not very smooth in females, but it remainsunclear if this is an effect of small sample size or methodologicissues.
A further limitation is that we had limited capacity to in-vestigate possible ethnic variability in lean tissue properties. Over90% of our sample was white, and our nonwhite individuals weredistributed across a range of ethnic categorizations. Others havepreviously reported differences in lean tissue hydration betweenethnic groups in adults (35), although the evidence for density isinconsistent (35–38), but findings in children have generally beennegative (7, 12). Modeling suggests that some ethnic differencesin density may be too small for empirical detection (27), and oursample was able to detect only a small difference in the density oflean tissue in black females. This issue therefore requires furtherinvestigation; however, the differences identified in adult studieswere relatively small, and neither hydrometry nor densitometryare likely to be seriously compromised in accuracy by failing totake ethnicity into account, unless relatively small differencesbetween ethnic groups are themselves the focus of study.
In conclusion, our study provides the first empirical referencedata on lean tissue properties for childhood and adolescence andshould improve the accuracy of hydrometry and densitometry inrelatively healthy members of the pediatric population. Nutri-tional status accounts for variability in these properties over thenormal range of BMI, but the error resulting from this source is ofmoderate magnitude until individuals are relatively obese. Two-component techniques may be less appropriate in individualswith obesity or more severe disease states, in whom multi-component models remain the preferred approach for moleculardata on body composition.
The authors’ responsibilities were as follows—JCKWand MSF: study de-
sign; JEW, SC, DH, KK, CG, and CW: data collection and modeling; TD:
mass spectrometric analysis; JCKW and TJC: statistical analysis with TJC;
and JCKW: writing of first draft of the manuscript. All authors contributed
to subsequent discussions and revisions. None of the authors declared a con-
flict of interest.
REFERENCES1. Schoeller DA. Hydrometry. In: Roche AF, Heymsfield SB, Lohman TG,
eds. Human body composition. Champaign, IL: Human Kinetics, 1996:25–43.
2. Kushner RF, Schoeller DA, Fjeld CR, Danford L. Is the impedanceindex (ht2/R) significant in predicting total body water? Am J Clin Nutr1992;56:835–9.
3. Siri WE. Body composition from fluid spaces and density. In: Brozek J,Henschel A, eds. Techniques for measuring body composition. Wash-ington, DC: National Academy of Sciences, 1961:223–44.
4. Widdowson EM. Chemical composition of newly born mammals. Na-ture 1950;166:626–8.
5. Fomon SJ, Haschke F, Ziegler EE, Nelson SE. Body composition ofreference children from birth to age 10 years. Am J Clin Nutr 1982;35(suppl):1169–75.
6. Lohman TG. Assessment of body composition in children. Pediatr ExercSci 1989;1:19–30.
7. Boileau RA, Lohman TG, Slaughter MH, Ball TE, Going SB, HendrixMK. Hydration of the fat-free body in children during maturation. HumBiol 1984;56:651–66.
8. Haschke F. Body composition during adolescence. Columbus, OH: RossLaboratories, 1989:76–83.
9. Hewitt MJ, Going SB, Williams DP, Lohman TG. Hydration of thefat-free body mass in children and adults: implications for body com-position assessment. Am J Physiol 1993;265:E88–95.
10. Wells JC, Fuller NJ, Dewit O, Fewtrell MS, Elia M, Cole TJ. Four-component model of body composition in children: density and hydra-tion of fat-free mass and comparison with simpler models. Am J ClinNutr 1999;69:904–12.
11. Wells JC, Fuller NJ, Wright A, Fewtrell MS, Cole TJ. Evaluation ofair-displacement plethysmography in children aged 5-7 years usinga three-component model of body composition. Br J Nutr 2003;90:699–707.
12. Bray GA, DeLany JP, Harsha DW, Volaufova J, Champagne CC.Evaluation of body fat in fatter and leaner 10-y-old African Americanand white children: the Baton Rouge Children’s Study. Am J Clin Nutr2001;73:687–702.
13. Butte NF, Hopkinson JM, Wong WW, Smith EO, Ellis KJ. Body com-position during the first 2 years of life: an updated reference. Pediatr Res2000;47:578–85.
14. Wells JC, Fewtrell MS, Williams JE, Haroun D, Lawson MS, Cole TJ.Body composition in normal weight, overweight and obese children:matched case-control analyses of total and regional tissue masses, andbody composition trends in relation to relative weight. Int J Obes (Lond)2006;30:1506–13.
15. Freeman JV, Cole TJ, Chinn S, Jones PR, White EM, Preece MA. Crosssectional stature and weight reference curves for the UK, 1990. Arch DisChild 1995;73:17–24.
16. Cole TJ, Freeman JV, Preece MA. Body mass index reference curves forthe UK, 1990. Arch Dis Child 1995;73:25–9.
17. Chomtho S, Fewtrell MS, Jaffe A, Williams JE, Wells JC. Evaluation ofarm anthropometry for assessing pediatric body composition: evidencefrom healthy and sick children. Pediatr Res 2006;59:860–5.
18. Racette SB, Schoeller DA, Luke AH, Shay K, Hnilicka J, Kushner RF.Relative dilution spaces of 2H- and 18O-labeled water in humans. AmJ Physiol 1994;267:E585–90.
19. Fuller NJ, Jebb SA, Laskey MA, Coward WA, Elia M. Four-componentmodel for the assessment of body composition in humans: comparisonwith alternative methods, and evaluation of the density and hydration offat-free mass. Clin Sci (Lond) 1992;82:687–93.
20. Kiebzak GM, Leamy LJ, Pierson LM, Nord RH, Zhang ZY. Measure-ment precision of body composition variables using the lunar DPX-Ldensitometer. J Clin Densitom 2000;3:35–41.
21. Cole TJ, Freeman JV, Preece MA. British 1990 growth reference centilesfor weight, height, body mass index and head circumference fitted bymaximum penalized likelihood. Stat Med 1998;17:407–29.
22. Bland JM, Altman DG. Statistical methods for assessing agreementbetween two methods of clinical measurement. Lancet 1986;1:307–10.
23. Dwyer T, Blizzard CL. Defining obesity in children by biological end-point rather than population distribution. Int J Obes Relat Metab Disord1996;20:472–80.
24. Wang Z, Deurenberg P, Wang W, Pietrobelli A, Baumgartner RN,Heymsfield SB. Hydration of fat-free body mass: new physiologicalmodeling approach. Am J Physiol 1999;276:E995–1003.
25. Wang Z, Deurenberg P, Wang W, Pietrobelli A, Baumgartner RN,Heymsfield SB. Hydration of fat-free body mass: review and critiqueof a classic body-composition constant. Am J Clin Nutr 1999;69:833–41.
26. Brozek J, Grande F, Anderson JT, Keys A. Densitometric analysis ofbody composition: revision of some quantitative assumptions. Ann N YAcad Sci 1963;110:113–40.
27. Wang Z, Heshka S, Wang J, Wielopolski L, Heymsfield SB. Magnitudeand variation of fat-free mass density: a cellular-level body compositionmodeling study. Am J Physiol Endocrinol Metab 2003;284:E267–73.
PEDIATRIC REFERENCE DATA FOR LEAN TISSUE PROPERTIES 617
at University C
ollege London on February 21, 2010
ww
w.ajcn.org
Dow
nloaded from

28. Wong WW, Hergenroeder AC, Stuff JE, Butte NF, Smith EO, Ellis KJ.Evaluating body fat in females and female adolescents: advantages anddisadvantages of dual-energy X-ray absorptiometry. Am J Clin Nutr2002;76:384–9.
29. Williams JE, Wells JC, Wilson CM, Haroun D, Lucas A, Fewtrell MS.Evaluation of Lunar Prodigy dual-energy X-ray absorptiometry for as-sessing body composition in healthy persons and patients by comparisonwith the criterion 4-component model. Am J Clin Nutr 2006;83:1047–54.
30. Wells JCK, Haroun D, Williams JE, et al. Evaluation of DXA against thefour-component model of body composition in obese children andadolescents aged 5 to 21 years. Int J Obes (in press).
31. Battistini N, Virgili F, Severi S, et al. Relative expansion of extracellularwater in obese vs. normal children. J Appl Physiol 1995;79:94–6.
32. Haroun D, Wells JC, Williams JE, Fuller NJ, Fewtrell MS, LawsonMS. Composition of the fat-free mass in obese and nonobese chil-dren: matched case-control analyses. Int J Obes (Lond) 2005;29:29–36.
33. Murphy AJ, Wells JC, Williams JE, Fewtrell MS, Davies PS, Webb DK.Body composition in children in remission from acute lymphoblasticleukemia. Am J Clin Nutr 2006;83:70–4.
34. Parker L, Reilly JJ, Slater C, Wells JC, Pitsiladis Y. Validity of six fieldand laboratory methods for measurement of body composition in males.Obes Res 2003;11:852–8.
35. Deurenberg-YapM, Schmidt G, van StaverenWA, Hautvast JG, DeurenbergP. Body fat measurement among Singaporean Chinese, Malays and In-dians: a comparative study using a four-compartment model and dif-ferent two-compartment models. Br J Nutr 2001;85:491–8.
36. Visser M, Gallagher D, Deurenberg P, Wang J, Pierson RN Jr, HeymsfieldSB. Density of fat-free body mass: relationship with race, age, and levelof body fatness. Am J Physiol 1997;272:E781–7.
37. Wagner DR, Heyward VH. Measures of body composition in blacks andwhites: a comparative review. Am J Clin Nutr 2000;71:1392–402.
38. Collins MA, Millard-Stafford ML, Evans EM, Snow TK, Cureton KJ,Rosskopf LB. Effect of race and musculoskeletal development on theaccuracy of air plethysmography. Med Sci Sports Exerc 2004;36:1070–7.
618 WELLS ET AL
at University C
ollege London on February 21, 2010
ww
w.ajcn.org
Dow
nloaded from

Body composition assessed by the 4-component model andassociation with lung function in 6–12-y-old children withcystic fibrosis1–3
Jane E Williams, Jonathan CK Wells, Christian Benden, Adam Jaffe, Ranjan Suri, Catherine M Wilson, and Mary S Fewtrell
ABSTRACTBackground: Malnutrition is an indicator of a poor prognosis inpatients with cystic fibrosis (CF). Previous body-composition (BC)studies in children with CF used 2-component models (2CMs) toassess fat mass (FM) and fat-free mass (FFM), but to our knowledgeno study has used the gold-standard 4-component model (4CM),which allows for a more accurate evaluation of the nature of bothelements.Objective: We measured BC by using the 4CM in 6–12-y-old chil-dren with CF to 1) compare findings with those of healthy, matchedcontrol children and reference data; 2) relate BC to lung spirometry[forced expired volume in 1 s (FEV1)]; and 3) compare findingswith those from more commonly used 2CM techniques.Design: One hundred clinically stable children with CF (57% girls)aged 6–12 y were measured by using the 4CM. Children with CFunderwent spirometry (FEV1).Results: Girls with CF had significantly less FM than did healthygirls, even after adjustment for height and pubertal status; boys withCF had higher body mass index SD scores than did healthy boys. FMin girls was positively associated with the FEV1 percentage predicted.The 2CM FM was significantly different from the 4CM FM, withdifferences dependent on sex and condition, although most techni-ques identified a relation between FM and FEV1 in girls.Conclusions: Although shorter than healthy children, boys with CFwere heavier and had a BC within the normal range; however, girlswith CF had lower FM than did healthy girls, and this was associ-ated with poorer lung function. Given the worse prognosis in girls,this finding merits more attention. The reliability of 2CM techniquesvaried with sex and health status. Am J Clin Nutr 2010;92:1332–43.
INTRODUCTION
Cystic fibrosis (CF) is a lethal, autosomal, recessive geneticdisorder that is most common in white individuals. Historically, ithas been considered that children with CF do not grow normallybecause of a negative energy balance caused by the detrimentaleffects of the difficulty in breathing, chronic infection and in-flammation, decreased absorption, and increased nutritional loss(1). When growth has been suboptimal, there is a negative effecton physical activity, appetite, and lung function (2). However,recent research suggests that growth in children with CF hasimproved (3, 4). It is also apparent that with improvements intreatment, life expectancy has increased considerably, and
complications such as osteoporosis have become apparent inyoung adults. Consequently, there is an increased focus onlonger-term health as well as short-term health and survival.
Typically, the growth of children with CF is monitored byusing height, weight, and body mass index (BMI) measurements,but these techniques do not give any indication of the nature ofbody composition. The investigation of body composition isbeneficial because it aids understanding of the disease process,allows for assessment of the effectiveness of medical and nu-tritional interventions, and may identify those children most atrisk of deterioration. Many previous studies used techniques withinherent problems related to poor precision or assumptions aboutthe nature of the fat-free mass (FFM) (5) or inadequate samplesize. In addition, techniques suitable for healthy children arepredicted to be biased when applied to patients (6, 7). The gold-standard 4-component model (4CM) of body composition, whichwas used in this study, allows for a more accurate quantificationof fat mass (FM) and assessment of the nature of FFM (water,protein, and mineral) because actual measurements of compo-nents of body composition are made. In patients with CF, it isimportant to establish whether specific components of bodycomposition are independent predictors of clinical outcomesbecause this would have implications for treatment regimens.
To our knowledge, no previous study of body composition inchildrenwithCFhas adopted the 4CM.The aimsof this studywereto 1) compare young childrenwithCF to their healthy counterpartsby using the 4CM, 2) examine associations between body com-position and lung function in childrenwith CF, and 3) compare the
1 From the Childhood Nutrition Research Centre (JEW, JCKW, CMW,
and MSF) and the Portex Unit (RS), University College London Institute
of Child Health, London, United Kingdom; the Respiratory Unit, Great
Ormond Street Hospital for Children National Health Service Trust, London,
United Kingdom (CB and RS); and the Sydney Children’s Hospital and
University of New South Wales, Sydney, Australia (AJ).2 Supported by research and development funding from the National
Health Service (NHS) Executive to the Institute of Child Health and Great
Ormond Street Hospital for Children NHS Trust.3 Address correspondence to JE Williams, Childhood Nutrition Research
Centre, University College London Institute of Child Health, 30 Guilford
Street, London WC1N 1EH, United Kingdom. E-mail: jane.williams@ich.
ucl.ac.uk.
Received May 20, 2010. Accepted for publication September 7, 2010.
First published online October 6, 2010; doi: 10.3945/ajcn.2010.29847.
1332 Am J Clin Nutr 2010;92:1332–43. Printed in USA. � 2010 American Society for Nutrition
at University C
ollege London on Novem
ber 24, 2010w
ww
.ajcn.orgD
ownloaded from

findings from the gold-standard 4CM to those from commonlyused 2-component model (2CM) techniques.
SUBJECTS AND METHODS
Subjects
Recruitment started in October 2002 for children with CF aged6–12 y under the care of Great Ormond Street Hospital forChildren (London, United Kingdom) who were clinically stableand emotionally able to undergo measurements. The childrenwith CF were diagnosed on the basis of confirmatory genetics ora positive sweat test with sodium and chloride concentrations .60 mmol/L. Healthy children for matched-pair and cross-sectional reference comparison were recruited for another studyof body composition at the Institute of Child Health (London,United Kingdom) that started in February 2002. Measurementswere conducted over a 90-min visit to the study center at GreatOrmond Street Hospital for Children after consumption ofa light meal. Ethical permission was obtained from the ethicalcommittee of the Institute of Child Health. Written consent wasobtained from parents and written assent from children aged�11 y; verbal assent was obtained from children aged ,11 y.
Dual-energy X-ray absorptiometry
Bone mineral content (BMC), bone mineral density (BMD),and bone area (BA) were measured with a Lunar Prodigy whole-body scanner (GEMedical Systems, Slough, United Kingdom) inconjunction with software v.12.1 (2008, Lunar Prodigy; GEMedical Systems). All scans were performed with the subjectwearing light indoor clothing and with no removable metalobjects present. The typical scan time was 5 min depending onheight. The radiation exposure per whole-body scan was esti-mated to be 2 lSv, lower than the daily background level. Allscans were performed by one operator (CMW). The precision ofbone density, which was established by repeated measurementsof phantoms on 6 successive days, was ,2%. The precision ofsoft tissue analysis for a Lunar DPX-L instrument (regarded bythe manufacturer, GE Medical Systems, as similar to our ownmodel) established by repeated measurements of humans on 4successive days was reported as 1% for FFM and 2% for FM (8).
Body volume
Body volume (BV) was measured by using air-displacementplethysmography (ADP) (Bodpod Instrumentation; Life Mea-surement Instruments, Concord, CA) according to the manu-facturer’s instructions as previously described (9). Measurementswere made while the subject wore a close-fitting swimmingcostume and hat. The raw-volume values that appeared tran-siently on the screen were recorded, and to improve precision, theprocedure was repeated until 2 mean values for raw density ofwithin 0.007 kg/L were obtained (10). Where it was not possibleto achieve 2 such measurements because of breathing irregu-larities in 3 of the CF children, the mean of all raw volume valueswas used after values 6 2 SDs were discarded (achieved over 4separate tests of a minimum of 8 and maximum of 12 volumes).An adjustment of the mean raw volume was then made by usingthe predicted lung volume (11, 12) and surface area (13) to
obtain the actual BV. All measurements were made by one of 2operators (JEW and CMW).
Anthropometric measures
Body weight was measured as an integral stage of the BodpodInstrumentation procedure (Life Measurement Instruments) to�0.01 kg with the child dressed in a swimsuit. Accuracy wasconfirmed by the use of 2 solid weights of known mass.Standing height was measured to �0.1 cm with a wall-mounteddigital display stadiometer (Holtain, Dyfed, United Kingdom).BMI was calculated as weight in kilograms divided by the squareof height in meters. Weight, height, and BMI were converted toSD scores (SDSs) by using UK 1990 reference data (14, 15).Waist, hip, and midupper arm circumference were measured witha fiberglass tape, and bicep, tricep, and subscapular and suprailiacskinfold-thickness measurements were taken in triplicate to thenearest 0.2 mm and averaged. Measurements were taken on theleft sides of subjects according to the method of Lohman et al (16)with a Holtain skinfold-thickness caliper.
Deuterium dilution
Total body water (TBW) was assessed by 2H-labeled waterdilution by using a dose equivalent to 0.05 g 2H2O/kg bodyweight (99.9 atom percentage excess). Doses were diluted withwater to ’100 mL. Saliva samples were taken predose and 4 hpostdose with absorbent cotton swabs (Sarstedt, Rommelsdorf,Germany) �30 min after the last ingestion of food or drink.Deuterium samples were analyzed by Iso-Analytic Ltd (Sand-bach, United Kingdom) by using the equilibration method ofScrimgeour et al (17). Briefly, 0.3 mL liquid, along with a vial of5% platinum on alumina powder (Sigma-Aldrich, Poole, UnitedKingdom), was placed in a septum sealed container (Labco,High Wycombe, United Kingdom) and flushed for 2 min withhydrogen. Low-enrichment and high-enrichment standard wa-ters were similarly prepared to normalize data against StandardMean Ocean Water-Standard Light Antarctic Precipitationstandards. Samples equilibrated at room temperature for 3 dbefore analysis. The head spaces in the containers were analyzedfor deuterium enrichment on a continuous flow-isotope ratiomass spectrometer (Geo20-20; Europa Scientific, Crewe, UnitedKingdom). The accuracy of analyses was checked by measuringan intermediate water standard within each batch of samples. Allsamples were prepared and analyzed in duplicate. The mean SDof deuterium analyses by the equilibration technique in thelaboratory was ,2.5%. The 2H-dilution space was assumed tooverestimate TBW by a factor of 1.044 (18), and correction wasmade for fluid intake during the equilibrium period to deriveactual body water.
2CMs
2CMs of body composition, which distinguished FM andFFM, were calculated as follows.
Anthropometric measures
Percentage body fat was estimated from skinfold-thicknessmeasurements by using the age- and sex-specific equations ofSlaughter et al (19) (tricep and subscapular) and Deurenberg et al
BODY COMPOSITION OF 6–12-Y-OLD CHILDREN WITH CF 1333
at University C
ollege London on Novem
ber 24, 2010w
ww
.ajcn.orgD
ownloaded from

(20) (tricep, bicep, subscapular, and suprailiac). FM was cal-culated as
ðPercentage fat3weightÞ=100 ð1Þ
Hydrometry
TBW was used to calculate FFM, with assumption for an age-and sex-specific hydration factor of FFM, (HFFFM) according topublished values of Lohman (21).
FFM ¼ TBW�HFFFM ð2Þ
FM was calculated as
FM ¼ weight2 FFM ð3Þ
and
Percentage fat ¼ FM=weight3 100 ð4Þ
Dual-energy X-ray absorptiometry
FM and lean-mass (LM) values were obtained from a whole-body dual-energy X-ray absorptiometry (DXA) scan as de-scribed, and FFM was calculated as
LMþ BMC ð5Þ
Densitometry
Whole-body density was calculated from BV (which wasadjusted for residual lung volume and surface-area artifact) andweight by using ADP (Bodpod Instrumentation; Life Measure-ment Instruments).
Body density ¼ weight=BV ð6Þ
Percentage fat ¼ ð527=body densityÞ2 485 ð22Þ ð7Þ
and
FM ¼ ðpercentage fat3weightÞ=100 ð8Þ
4CM
The 4CM uses values of BMC, body weight, BV, and TBW toderive values for mineral, water, fat, and protein as describedpreviously (22, 23). Assumed densities of the 4 components wereaccounted for when calculating FM from the measurements
FM ðin kgÞ ¼ ½ð2:7473BVÞ2 0:7103TBWÞ�þ ½ð1:4603BMCÞ2 ð2:0503 body weightÞ�
ð9Þ
and FFM was calculated as the difference between weight andFM.
Pubertal status
Pubertal stage was self-assessed with line drawings thatshowed the different Tanner stages for breast or genital devel-opment (24). For the purposes of analyses, prepubertal (stage 1)was considered distinct from pubertal (stages 2–5).
Physical activity
Physical activity levels were assessed by asking the parent togive a rating of the child’s activity as follows: 1) much less thanpeers, 2) less than peers, 3) same as peers, 4) more than peers,and 5) much more than peers. Because of small numbers, thelower 2 and upper 2 categories were combined and resulted inthe following 3 groups: less than, same as, and more than peers.
Lung function
Laboratory spirometry [forced expired volume in 1 s (FEV1)]was measured according to laboratory protocols on the basis ofAmerican Thoracic Society and European Respiratory Societystandards for spirometry (25) adapted for children (26). Valuesfor analyses were calculated as the FEV1 percentage predictedcompared with a large reference population (27). Children withFEV1 ,45% were classified as having severe impairment,children with FEV1 �45 and ,65% were classified as havingmoderate impairment, children with FEV1 �65% and ,85%were classified as having mild impairment, and children withFEV1 �85% were classified as having normal lung function.
Statistical analyses
Size adjustment and SDS calculation
Characteristics of all children were compared with 1990 UKreference data to generate SDSs forweight, height, BMI, andwaistcircumference. A method analogous to that of BMI (weight di-vided by the square of height) was applied to absolute values ofFM, FFM, protein mass (PM) and mineral mass (MM) to removethe effect of size; the FM index (FMI; FM divided by the square ofheight), FFM index (FFMI; FFM divided by the square of height),PM index (PMI; PM divided by the square of height), and MMindex (MMI;MMdividedby the square of height). Thesevariableswere compared with measurements performed in a contemporaryreference population of 533 healthy subjects aged 4–23 y (JCKWells, JE Williams, and MS Fewtrell, unpublished data, 2002–2007) to produce SDSs. Total and lumbar spine (LS) BMD SDSsweregenerated from theLunarProdigy software (2008, v.12.1;GEMedical Systems) by using machine reference data matched forage, sex, and ethnic group. BMD is a 2-dimensionalmeasurement,which does not take into account bone size. Small children mayhave low BMC or BMD because they have small bones or lessmineral than expected for the size of bone (28). To adjust forsize, the bone mineral apparent density (BMAD), which is a 3-dimensional “volumetric”measurement,was calculated for theLSfrom the BMC and BA as follows (29):
BMAD ¼ BMC=BA1:5�10�
and size-adjusted SDSs were calculated by using reference datacollected for the GE Lunar Prodigy (30).
1334 WILLIAMS ET AL
at University C
ollege London on Novem
ber 24, 2010w
ww
.ajcn.orgD
ownloaded from

Comparison of body-composition variables
With the use of a one-sample t test, comparisons were madebetween 1) all children and the 1990 UK reference populationfor anthropometric SDSs, 2) all children and the contemporaryreference population for body-composition variables SDSs andby using paired sample t tests (3), and pair-matched childrenwith CF and healthy children for all anthropometric measuresand body-composition variables. Initial analyses indicateda strong significant difference between the sexes, and therefore,they were analyzed separately. General linear models were usedto examine differences between children with CF and healthycontrol children by taking into account factors that predictedbody-composition variables with matched pair, group andpuberty as fixed factors and age and height (for nonindexedvariables) as continuous variables. Because total MM is pre-dominantly bone mineral, MM was also adjusted for bone areato account for the effect of bone size.
Lung spirometry
Simple regression analyses were used to investigate the re-lation between body-composition variables and lung spirometry(FEV1 percentage predicted) in children with CF. Height wasincluded in the model.
Comparison of 2CMs and 4CM
The method of Bland and Altman (31) was used to assess theagreement between the values for FM by 4 2CMs and thecriterion 4CM. The mean difference between techniques (bias;2CM 2 4CM) and the 62 SDs of the difference between
techniques (limits of agreement) were calculated. The bias wastested for significance from zero by using a paired t test. Toexpress the bias as a percentage of the mean, the bias of theindividual natural log value · 100 was calculated (32). The ex-tent to which the magnitude of the bias was related to themagnitude of the variable was calculated as the correlation be-tween the difference and the mean of the measured values. Allanalyses were performed with the Statistical Package for SocialSciences 18.0 software (SPSS Inc, Chicago, IL), and P , 0.05was considered significant.
RESULTS
Subjects
One hundred of 116 eligible children with CF were recruited,and complete 4CMmeasurements were obtained in 90 children [4children (3 girls) refused to enter the Bodpod air-displacementplethysmography instrumentation (Life Measurement Instru-ments), and 6 postdose isotope dilution samples had inadequatevolumes for analysis (4 girls)]. However, a body-water calcu-lation was implausible for 5 children (3 girls); therefore, pairmatching with healthy age-, sex-, and ethnicity-matched controlchildren was made for 85 CF children [boys: 37 (44%); girls: 48(56%)]. Characteristics of the children are shown in Table 1. Theself-assessed pubertal status for the 170 children was pre-pubertal for boys [boys with CF: 34 (92%); control boys: 31(71%)] and girls [girls with CF: 34 (71%); control girls: 29(60%)]. All subjects with CF, except one girl, were pancreaticinsufficient and had a wide range of pulmonary disease with
TABLE 1
Characteristics of cystic fibrosis (CF) and control children in case-control analyses (n = 85)1
CF boys (n = 37) CF girls (n = 48) Control boys (n = 37) Control girls (n = 48)
Age (y) 9.28 6 0.922 9.55 6 1.62 9.28 6 1.08 9.57 6 1.78
Weight (kg) 30.2 6 6.64 30.0c 6 7.19 30.1 6 6.38 34.6 6 9.36
Height (m) 1.31 6 0.08 1.32c 6 0.11 1.35 6 0.09 1.37 6 0.11
BMI (kg/m2) 17.3b 6 2.23 16.4c 6 1.99 16.4 6 1.79 18.1 6 2.84
Weight SDS 20.01 6 1.05 20.56cf 6 1.04 0.02 6 0.76 0.42e 6 0.98
Height SDS 20.54d 6 1.04 20.59cf 6 1.12 0.06 6 0.86 0.22 6 0.87
BMI SDS 0.43be 6 0.97 20.33cd 6 0.95 20.03 6 0.85 0.39d 6 1.10
Waist (cm) 63.5a 6 6.25 60.2 6 5.5 58.9 6 4.18 62.2 6 7.67
Waist SDS 1.16af 6 20.79 0.69f 6 0.78 0.40e 6 0.63 0.94f 6 1.05
Hip (cm) 68.4 6 6.37 68.2c 6 7.06 69.2 6 6.39 74.6 6 8.63
MUAC (cm) 19.9 6 2.53 19.7c 6 2.59 20.1 6 2.80 22.2 6 3.31
Sum of 4 skinfold thicknesses 34.7 6 19.8 37.1b 6 14.6 56.6 6 165.5 48.4 6 21.1
FEV1 percentage predicted 91.3 6 20.9 77.6 6 18.4 — —
FVC percentage predicted 99.4 6 18.3 83.5 6 15.9 — —
Prepubertal (%)3 92 71 84 60
Pancreatic insufficient (n) 37 47 — —
Liver disease (cases) 1 1 — —
Diabetes (cases) 0 1 — —
Ps aerug (cases) 10 11 — —
Staph aureus (cases) 7 8 — —
1 SDS, SD score compared with UK reference data 1990 (14, 15); MUAC, midupper arm circumference; Sum of 4 skinfold thicknesses, bicep + tricep +
subscapular + suprailiac (n = 79); FEV1 percentage predicted, forced expired volume in 1 s percentage of the expected (27); FVC percentage predicted, forced
vital capacity percentage of the expected (27); Pancreatic insufficient, reduced pancreatic function that required the oral addition of pancreatic enzymes; Ps
aerug, chronic Pseudomonas aeruginosa infection of the lungs; Staph aureus, chronic Staphylococcus aureus infection of the lungs. a,b,cComparisons of CF
boys and control boys or CF girls and control girls (paired t test): aP , 0.05, bP , 0.01, cP , 0.001; d,e,fCF and control children compared with UK 1990
reference data (14, 15) (one-sample t test): dP , 0.05, eP , 0.01, fP , 0.001.2 Mean 6 SD (all such values).3 Prepuberty was based on Tanner staging 1 (prepubertal) to stages 2–5 (pubertal).
BODY COMPOSITION OF 6–12-Y-OLD CHILDREN WITH CF 1335
at University C
ollege London on Novem
ber 24, 2010w
ww
.ajcn.orgD
ownloaded from

a median FEV1 of the predicted value of 85.1% with valuesbetween 32% and 131%; 8 (7 girls) subjects with CF, hada gastrostomy in situ, 2 (1 girl) subjects with CF had liver dis-ease, and 1 girl with CF was diabetic. The genotype was ho-mozygous DF508 for 59 children and heterozygous DF508 for19 children. Five children had a non-DF508 genotype, and 2children were of unknown genotype. Sixteen eligible childrenwith CF (9 girls) who were not recruited and 15 children (10girls) who were measured and not included in the analyses werenot significantly different with respect to height SDSs, weightSDSs, and BMI SDSs.
Anthropometric measures
Compared with UK reference data
Characteristics of the children are shown in Table 1. Thehealthy children were representative of the 1990 UK referencedata apart from the girls being significantly heavier (P , 0.01)and both boys and girls having greater waist circumferences(P , 0.01). Boys with CF were significantly shorter (P , 0.05)but had a higher BMI SDSs (P , 0.01) and waist circum-ferences (P , 0.01), and girls with CF were lighter (P , 0.001)and shorter (P , 0.001) and had lower BMI SDSs (P , 0.05)and greater waist circumferences (P , 0.01) than the 1990 UKreference data.
Compared with pair-matched children
Comparisons between children with CF and healthy pair-matched control children indicated that boys with CF were not
significantly different apart from higher BMI SDSs (P , 0.01)and waist circumference SDSs (P , 0.05). The range of BMISDSs was 21.5 to 2.4 for boys with CF and 21.9 to 2.0 forcontrol boys. Girls with CF were significantly shorter (P, 0.01)and lighter (P , 0.01), with lower anthropometric values for allmeasures apart from waist circumference (non-significant), thanpair-matched control girls.
Body composition
Comparisons by reference populations and case-control sub-jects are shown in Table 2 with a summary in Table 3.
Compared with reference data
Comparisons of CF children with a reference population(Lunar Prodigy reference data for bone and unpublished refer-ence data for body composition) indicated higher total BMDSDSs (P , 0.001) and FFMI SDSs (P , 0.01) in boys with CFand lower LS BMD SDSs (P , 0.001), BMAD SDSs (sizeadjusted; P , 0.01), FMI SDSs (P , 0.001), FFMI SDSs (P ,0.05), and MMI SDSs (P , 0.001) in girls.
Compared with pair-matched children
Boys with CF had significantly higher total BMD SDSs (P ,0.05) and FFMI SDSs (P , 0.01) than did case-control boys.Girls with CF had less total BMD SDSs (P , 0.05) and LSBMD SDSs (P, 0.001) and significantly lower FMI SDSs (P,0.001) and MMI SDSs (P , 0.001) than did case-control girls.
TABLE 2
Body composition of cystic fibrosis (CF) and control children used in case-matched analyses (n = 85 pairs)1
CF boys (n = 37) CF girls (n = 48) Control boys (n = 37) Control girls (n = 48)
Body volume (L) 28.3 6 6.49 27.8c 6 7.09 27.5 6 6.51 33.6 6 9.41
Total body water (L) 18.0 6 3.12 17.1c 6 3.72 17.9 6 3.71 18.9 6 4.31
Total BMC (kg) 1.05 6 0.21 1.01c 6 0.24 1.07 6 0.24 1.20 6 0.33
Total BMD (g/cm2) 0.90a 6 0.06 20.87b 6 0.05 0.88 6 0.05 0.90 6 0.07
Total BMD SDS 0.58a,f 6 0.66 20.11a 6 0.74 0.23 6 0.05 0.23 6 0.62
LS BMD (g/cm2) 0.73 6 0.08 0.73a 6 0.10 0.71 6 0.08 0.78 6 0.11
LS BMD SDS 20.03 6 0.74 20.49f 6 1.12 20.19 6 0.75 20.05 60.93
LS BMAD SDS 0.18 6 0.96 20.40e 6 1.19 20.12d 6 0.85 20.20 6 1.06
4-Component model
FM (kg) 5.95 6 3.66 6.41c 6 2.93 5.31 6 2.80 9.46 6 4.71
FMI SDS 0.02 6 1.10 20.76c,f 6 0.89 20.22 6 0.97 0.02 6 0.95
Fat (%) 19.0 6 7.84 20.6c 6 5.47 17.8 6 6.14 26.1 6 7.46
FFM (kg) 23.5 6 3.60 22.7c 6 4.98 23.5 6 5.09 25.1 6 5.60
FFMI SDS 0.56b,e 6 0.97 20.39d 6 1.07 20.14 6 1.04 20.08 6 0.94
FFM hydration (%) 75.9 6 2.07 74.9 6 1.97 76.0 6 1.49 75.1 61.54
FFM density (kg/L) 1.087 6 0.007 1.090 60.007 1.087 6 0.005 1.091 6 0.005
Protein (kg) 4.31 6 0.65 4.45 6 1.06 4.30 6 1.18 4.72 6 0.99
PMI SDS 0.36 6 1.36 0.08 6 1.03 20.16 6 1.11 20.05 6 0.97
Mineral (kg) 1.34 6 0.28 1.28c 6 0.28 1.36 6 0.30 1.52 6 0.41
MMI SDS 0.07 6 0.84 20.84c,f 6 1.10 20.23 6 0.87 20.04 6 0.92
Protein:mineral (kg/kg) 3.27 6 0.54 3.51c 6 0.53 3.16 6 0.39 3.16 6 0.41
1 All values are means 6 SDs. BMC, bone mineral content; BMD, bone mineral density; LS BMD, lumbar spine BMD; LS BMAD, LS (L2–L4) bone
mineral apparent density, which is a 3-dimensional “volumetric” measurement that is calculated from the 2-dimensional BMD measured by dual-energy X-ray
absorptiometry [reference data used to calculate LS BMAD SDSs (30)]; SDS, SD score [calculated from 533 contemporary healthy children (JCK Wells, JE
Williams, and MS Fewtrell, unpublished data, 2002–2007)]; FM, fat mass; FMI, FM index (FM divided by the square of height); FFM, fat-free mass; FFMI,
FFM index (FFM divided by the square of height); PMI, protein mass index (protein mass divided by the square of height); MMI, mineral mass index (mineral
mass divided by the square of height). a,b,cComparisons of CF boys and control boys or CF girls and control girls (paired t test): aP , 0.05, bP , 0.01, cP ,0.001; d,e,fCF and control children compared with reference data (one-sample t test): dP , 0.05, eP , 0.01, fP , 0.001.
1336 WILLIAMS ET AL
at University C
ollege London on Novem
ber 24, 2010w
ww
.ajcn.orgD
ownloaded from

Protein-to-mineral ratio
In the absence of any expectation that total PM would beabnormal in children with CF, the protein-to-mineral ratio is anindication of the mineralization of lean tissue. The protein-to-mineral ratio is presented in Table 2 with a significantly highervalue in girls with CF (P, 0.01) than in healthy girls. However,this figure did not reveal whether this result was due to high orlow protein or mineral. Comparisons of PMI SDSs indicated nosignificant difference (mean 6 SD) (boys with CF: 0.36 6 1.36,control boys: 20.16 6 1.11; girls with CF: 0.086 1.03, controlgirls: 20.05 6 0.97). However, there was a difference in sexeswhen MMI SDSs were compared (boys with CF: 0.07 6 0.84,control boys: 20.23 6 0.87, P = 0.09; girls with CF: 20.846
1.10, control girls: 20.046 0.92, P = 0.001). As shown inFigures 1 (boys) and 2 (girls) for control children, PMI SDSsand MMI SDSs were positively correlated (boys: r = 0.39, P =0.018; girls: r = 0.39, P = 0.006) as expected. However, therewas no such correlation in children with CF (boys: r = 0.17, P =0.325; girls: r = 0.08, P = 0.596), and the girls in particular wereundermineralized for any given protein values.
Potential confounders that affected body-compositionoutcomes
Adjusted mean differences in body composition (CF children2control children) before and after adjustment for height andpuberty are shown in Tables 4 (boys) and 5 (girls). Boys withCF had a greater weight (P, 0.1) and waist circumference (P,0.001) than did control boys. Girls with CF had lower weight(P , 0.05), FM (P , 0.01), and hip and midupper arm cir-cumferenc (P , 0.01) than did control girls. An analysis of onlyprepubertal girls (n = 24 pairs) confirmed the deficit in FM.Additional adjustment of MM for bone area (to adjust for bonesize in addition to length) did not affect the outcome in eithersex. To determine whether differences in body composition weredue to different levels of activity, the parent’s rating of thechild’s activity level was added to the model with no effect onthe outcome (data not shown).
Relation between body composition and lung function
The mean (6SD) FEV1 percentage predicted for 83 patients(one boy and one girl did not perform spirometry) was 91.3 620.9% for boys and 77.6 6 18.4% for girls (P , 0.01). A re-gression analysis of factors associated with the FEV1 percentagepredicted is presented in Table 6. Most indexes of whole-bodyfat but not subcutaneous fat were significantly positively asso-ciated with lung function in girls only (P , 0.05). A similarmodel with either FEV1 or FEV1 SDSs indicated a similarpattern. A plot of the FEV1 percentage predicted and FMI SDSsfor girls is shown in Figure 3 and indicated a positive relation(r = 0.40, P = 0.005); however, 4 girls had a high FEV1 per-centage predicted with low FMI SDSs.
TABLE 3
Summary of comparisons (before adjustment for age, height, and puberty)1
Boys with CF
compared with
Girls with CF
compared with
SDS
Pair
match
Reference
population
Pair
match
Reference
population
Weight NS NS Y YHeight NS Y Y YBMI [ [ Y YWaist [ [ NS [FMI NS NS Y YFFMI [ [ NS YPMI NS NS NS NS
MMI NS NS Y Y
1 CF, cystic fibrosis; SDS, SD score; FMI, fat mass index (fat mass divided
by the square of height); FFMI, fat-free mass index (FFM divided by the square
of height); PMI, protein mass index (protein mass divided by the square of
height); MMI, mineral mass index (mineral mass divided by the square of
height); [, denotes that the CF group had significantly higher scores than did
the comparison group; Y, denotes that the CF group had significantly lower
scores than did the comparison group. Paired t test with pair matches and one-
sample t test for reference data were used. Reference data were from UK 1990
(14, 15) data for weight, height, BMI, and waist; reference data for body-com-
position variables were from 533 children measured by the 4-component model
(JCK Wells, JE Williams, and MS Fewtrell, unpublished data, 2002–2007).
FIGURE 1. Relation between protein mass index (PMI) SD scores (SDS)and mineral mass index (MMI) SDS in boys. PMI (protein mass divided by thesquare of height) and MMI (mineral mass divided by the square of height)were assessed by the 4-component model of body composition in 37 boys withcystic fibrosis and 37 healthy control boys. Correlations: for cystic fibrosisboys, r = 0.166 and P = 0.325; for control boys, r = 0.386 and P = 0.018.
FIGURE 2. Relation between protein mass index (PMI) SD scores (SDS)and mineral mass index (MMI) SDS in girls. PMI (protein mass divided by thesquare of height) and MMI (mineral mass divided by the square of height)were assessed by the 4-component model of body composition in 48 girls withcystic fibrosis and 48 healthy control girls. Correlations: for cystic fibrosisgirls, r = 0.079 and P = 0.596; for control girls, r = 0.391 and P = 0.006.
BODY COMPOSITION OF 6–12-Y-OLD CHILDREN WITH CF 1337
at University C
ollege London on Novem
ber 24, 2010w
ww
.ajcn.orgD
ownloaded from

Comparison between 2CMs and 4CM
A bias (2CM FM 2 4CM FM) was calculated for the 4methods described (Table 7). The mean FM from skinfold-thickness measurements was significantly underestimated bybetween 3% and 21% depending on sex and whether the chil-dren had CF or were healthy. Hydrometry was significantlyoverestimated by 8–13% in girls only (P , 0.001). Values fromdensitometry underestimated FM in girls, although this was onlysignificant in control girls (8%, P, 0.001), and DXA estimationof FM was underestimated in control boys by 7% and over-estimated in girls with CF by 3% (P , 0.05). Correlationanalyses indicated a significant relation between the magnitudeof the bias and the magnitude of FM when using skinfold-thickness measurements for all control children and girls withCF and when using DXA in control girls.
DISCUSSION
In this study we 1) compared the body composition of chil-dren with CF to healthy children by using case-control andreference populations 2), investigated associations between bodycomposition and lung function in children with CF, and 3)compared outcomes obtained by using the gold-standard 4CM tothose from more commonly used 2CM techniques for assessingbody composition.
Body composition
Suboptimal growth in patients with CF affects morbidity andmortality with stunting (33) and wasting (34) as independent
predictors of survival. Deficits in body composition are mostsevere in older patients with reduced bone, LM, and FM (35, 36).Even with normal BMI, FFM and BMD depletion has been notedin adults (37, 38) and children and adolescents (39) with CF. Lowweight for height in adults with CF occurs particularly in women(40), who also die at a younger age than men (41). A previousstudy showed that the greatest decline in nutritional status occursafter the onset of puberty, particularly in girls (42), although otherstudies suggest that deterioration in growth and nutritional statusoccurs throughout childhood (4, 43, 44). There is a paucity ofbody-composition studies in children with CF, and comparison isdifficult because of different methodologies used, sexual di-morphism, age ranges, and whether appropriate size adjustmentshave been applied. However, several recent studies that usedDXA noted a reduction of FM and/or FFM (4, 45, 46), andStettler (47) noted a reduction in both FFM by hydrometry andFM by total-body electrical conductivity in boys only, whereasAhmed et al (48), who used skinfold-thickness measurements,suggested that although both sexes have reduced FM, a reductionof FFM occurs in older boys. To our knowledge, no previousstudy has used a gold-standard technique to assess body com-position in children with CF.
Our study identified clear sex differences in body compositionin young patients, which indicated that abnormalities in femalepatients may be established much earlier than previously con-sidered (42). Although boys with CF had body compositionsimilar to healthy control subjects, girls had a deficit of FM. It ispossible that the method we used to categorize pubertal de-velopment may not have been sensitive to early hormonalchanges; however, the deficit was seen in prepubertal girls. In
TABLE 4
Differences in size and whole-body composition between boys with cystic fibrosis and control boys (n = 37 matched pairs)1
Adjusted for age Adjusted for age and height
Adjusted for age,
height, and puberty
Mean 6 SEM P Mean 6 SEM P Mean 6 SEM P
Weight (kg) 0.7 6 1.1 NS 2.0 6 0.7 ,0.01 2.1 6 0.8 ,0.01
Height (m)2 20.02 6 0.01 NS 20.01 6 0.01 NS
BMI (kg/m2)2 1.0 6 0.4 ,0.05 1.1 6 0.4 ,0.01
TBW (L) 0.1 6 0.5 NS 0.7 6 0.3 ,0.05 0.7 6 0.3 ,0.05
BV (L) 0.7 6 1.1 NS 2.1 6 0.8 ,0.05 2.1 6 0.8 ,0.05
FM (kg) 0.7 6 0.8 NS 1.3 6 0.7 NS 1.3 6 0.7 NS
FFM (kg) 20.1 6 0.6 NS 0.7 6 0.4 NS 0.7 6 0.4 NS
FFM (kg)3 20.05 6 0.61 NS 0.71 6 0.43 NS 0.72 6 0.44 NS
FFM hydration (%) 20.01 6 0.5 NS 20.02 6 0.5 NS 20.04 6 0.5 NS
FFM density (kg/L) 0.000 6 0.000 NS 0.000 6 0.000 NS 0.000 6 0.000 NS
PM (kg) 20.04 6 0.2 NS 0.1 6 0.2 NS 0.0 6 0.2 NS
MM (kg) 20.02 6 0.04 NS 0.03 6 0.02 NS 0.03 6 0.02 NS
MM (kg)3 20.02 6 0.04 NS 0.03 6 0.02 NS 0.03 6 0.02 NS
LS BMAD SDS 0.3 6 0.2 NS 0.2 6 0.2 NS 0.2 6 0.2 NS
Waist circumference (cm) 4.9 6 1.0 ,0.001 5.8 6 0.9 ,0.001 5.8 6 0.9 ,0.001
Hip circumference (cm) 20.2 6 1.2 NS 1.2 6 0.9 NS 1.2 6 0.9 NS
MUAC (cm) 20.1 6 0.5 NS 0.3 6 0.5 NS 0.3 6 0.5 NS
Log4 skinfold thickness 0.04 6 0.1 NS 0.1 6 0.1 NS 0.1 6 0.1 NS
1 TBW, total body water; BV, body volume; FM, fat mass; FFM, fat-free mass; PM, protein mass; MM, mineral mass; LS BMAD SDS, lumbar spine
bone mineral apparent density (size-adjusted bone mineral density) SD score; MUAC, midupper arm circumference; Log4 skinfold thickness, bicep + tricep +
subscapular + suprailiac (n = 36 pairs). General linear model adjusted for group, matched pairs, and puberty as fixed factors and age and height as continuous
variables.2 Adjusted for age and puberty only.3 Additionally adjusted for lumbar spine bone area.
1338 WILLIAMS ET AL
at University C
ollege London on Novem
ber 24, 2010w
ww
.ajcn.orgD
ownloaded from

accordance with previous research, children with CF in this studywere shorter than healthy children, but surprisingly, boys hadhigher BMI SDSs than did healthy control boys and the referencepopulation. This was mainly due to 4 boys (boys a through d)with BMI SDSs .1.64 (95th percentile). BMI and FMI SDSsfor these boys were 1.71 and 1.49 (a), 1.83 and 1.49 (b), 1.96 and
0.32 (c), and 2.42 and 1.99 (d), which indicated that high BMISDSs do not always reflect excess fat. Simple skinfold-thicknessmeasurements identified boy c as having less subcutaneous fatthan the other 3 boys. It may be prudent to identify the nature ofhigh BMI in these patients and implement dietary interventionsto avoid the complications of excess fat in adult life. Girls with
TABLE 5
Differences in size and whole-body composition between girls with cystic fibrosis and control girls (n = 48 matched pairs)1
Adjusted for age
Adjusted for
age and height
Adjusted for
age, height, and puberty
Mean 6 SEM P Mean 6 SEM P Mean 6 SEM P
Weight (kg) 25.7 6 1.3 ,0.001 22.0 6 1.0 NS 22.0 6 0.9 ,0.05
Height (m)2 20.05 6 0.01 ,0.001 20.05 6 0.01 ,0.001
BMI (kg/m2)2 21.8 6 0.5 ,0.001 21.4 6 0.4 ,0.001
TBW (L) 21.9 6 0.6 ,0.001 20.02 6 0.3 NS 20.04 6 0.3 NS
BV (L) 25.9 6 1.3 ,0.001 22.2 6 1.1 NS 22.2 6 0.9 ,0.05
FM (kg) 23.4 6 0.8 ,0.001 22.1 6 0.8 ,0.01 22.1 6 0.7 ,0.01
FFM (kg) 22.2 6 0.9 ,0.05 0.3 6 0.5 NS 0.3 6 0.4 NS
FFM (kg)3 22.46 6 0.73 ,0.001 0.03 6 0.40 NS 0.02 6 0.37 NS
FFM hydration (%) 20.3 6 0.4 NS 20.4 6 0.5 NS 20.4 6 0.5 NS
FFM density (kg/L) 20.001 6 0.000 NS 0.000 6 0.000 NS 0.000 6 0.000 NS
PM (kg) 20.3 6 0.2 NS 0.2 6 0.1 NS 0.2 6 0.1 NS
MM (kg) 20.3 6 0.1 ,0.001 20.1 6 0.0 NS 20.1 6 0.0 NS
MM (kg)3 20.25 6 0.06 ,0.001 20.07 6 0.04 NS 20.07 6 0.04 NS
LS BMAD SDS 20.2 6 0.3 NS 0.1 6 0.3 NS 0.1 6 0.3 NS
Waist circumference (cm) 22.3 6 1.1 ,0.05 20.3 6 1.1 NS 20.4 6 0.9 NS
Hip circumference (cm) 26.4 6 1.3 ,0.001 23.0 6 1.1 ,0.05 23.0 6 1.0 ,0.01
MUAC (cm) 22.6 6 0.6 ,0.001 21.4 6 0.5 ,0.05 21.4 6 0.5 ,0.01
Log4 skinfold thicknesses 20.2 6 0.1 ,0.01 20.1 6 0.1 NS 20.2 6 0.1 NS
1 TBW, total body water; BV, body volume; FM, fat mass; FFM, fat-free mass; PM, protein mass; MM, mineral mass; LS BMAD SDS, lumbar spine
bone mineral apparent density (size-adjusted bone mineral density) SD score; MUAC, midupper arm circumference; Log4 skinfold thickness, bicep + tricep +
subscapular + suprailiac (n = 45 pairs). General linear model adjusted for group, matched pairs, and puberty as fixed factors and age and height as continuous
variables.2 Adjusted for age and puberty only.3 Additionally adjusted for lumbar spine bone area.
TABLE 6
Simple regression analysis of factors associated with forced expired volume in 1 s percentage predicted1
Boys (n = 37) Girls (n = 48)
B SEM t P r2 B SEM t P r2
BMI SDS 5.31 3.68 1.44 0.159 0.057 5.91 2.73 2.16 0.036 0.094
4C FM (kg) 1.25 1.25 1.01 0.321 0.030 3.05 1.11 2.76 0.008 0.151
Log sum of 4 skinfold thicknesses2 7.63 9.16 0.83 0.411 0.021 13.6 8.15 1.67 0.103 0.063
DXA FM (kg) 0.15 1.34 0.11 0.910 1.001 2.25 1.14 1.96 0.056 0.084
Hydrometry FM (kg) 1.24 1.19 1.04 0.307 0.032 2.63 1.14 2.31 0.025 0.112
Densitometry FM (kg) 1.39 1.25 1.11 0.276 0.039 3.04 0.96 3.19 0.003 0.191
4C FFM (kg) 20.25 2.26 20.11 0.911 0.001 1.72 1.53 1.12 0.268 0.032
DXA FFM (kg)3 3.58 2.29 1.57 0.126 0.070 2.05 1.42 1.45 0.156 0.049
Hydrometry FFM (kg) 20.42 2.13 20.20 0.846 0.001 0.94 1.46 0.64 0.525 0.013
Densitometry FFM (kg) 20.48 2.12 20.23 0.823 0.004 21.42 1.74 20.82 0.417 0.019
4C MM (kg)4 8.21 31.7 0.26 0.797 0.003 23.7 23.3 1.02 0.316 0.028
DXA BMC (kg)4 10.9 38.5 0.30 0.788 0.003 47.7 28.8 1.66 0.105 0.065
DXA BMD (g/m3) 247.4 75.6 20.06 0.535 0.012 58.3 66.8 0.87 0.387 0.021
1 SDS, SD score; FM, fat mass; FFM, fat-free mass; 4C, 4-component; DXA, dual-energy X-ray absorptiometry; MM, total body mineral mass; BMC,
bone mineral content; BMD, bone mineral density. Factors, except BMI SDS, were adjusted for height. Each line represents a new model (a separate analysis).2 n = 36 boys and 45 girls.3 DXA lean + bone mineral.4 Also adjusted for lumbar spine bone area.
BODY COMPOSITION OF 6–12-Y-OLD CHILDREN WITH CF 1339
at University C
ollege London on Novem
ber 24, 2010w
ww
.ajcn.orgD
ownloaded from

CF were smaller overall than control girls, which was perhapsrelated to the slightly higher than expected weights of controlgirls and the delayed puberty and suboptimal health (indicatedby poorer lung function) of girls with CF.
In healthy individuals, including the healthy children in thisstudy, proteins and minerals were positively correlated. However,children with CF did not exhibit this relation; the range of MMISDSs for boys with CF was similar to that of control subjects, butthe range for girls was much wider and tended toward the lowervalues. Girls with CF showed undermineralization for givenprotein values. This suggests that some aspect of the diseaseaffects the protein-to-mineral relation, particularly in girls, and itis possible that this represents a direct affect of the CFTR gene onbone metabolism. More research is needed to see if the alter-ation in the ratio becomes more pronounced in the boys with ageand whether the difference persists over time.
We previously reported normal BMD and BMAD in thirty-two8–12-y-old children with CF (49); although boys in the currentstudy had normal BMD and BMAD values, the values for girlswere significantly lower. The 24 prepubertal girls had normalbone BMAD but low BMD (P , 0.001), which suggested thatlow BMD reflected small size and delayed puberty.
Differences when data from patients were compared with datafrom either matched control children or a large reference pop-ulation are summarized in Table 3, and these highlight some ofthe difficulties of comparing studies of different designs. In ourstudy, boys were identified as shorter than the reference pop-ulation but not by a case-control analysis, whereas girls hadsignificantly lower FFMI SDSs than did the reference populationbut not compared with matched control subjects. The methods ofmatching and analysis must be considered when studies arecompared.
Lung function
There is evidence that improving nutrition can delay de-terioration in lung function and improve survival (50, 51), butdeficits of bone mass, LM, and FM in young patients with mildlung disease and normal nutritional status have been reported(47, 52). A consistent positive relation between FFM and lung
function has been noted in adults (36, 38) and children (45, 53,54). However, not all studies separated the sexes or size-adjustedcomponents of body composition. We chose FEV1 as an outcomemeasure because it is a good surrogate marker of clinical statusand predicts mortality and showed clear sex differences in therelation between FEV1 and body composition. Contrary toprevious research, FFM was not associated with the FEV1 per-centage predicted in either boys or girls, but we identifieda significant positive relation with FM adjusted for height ingirls with CF. This discordance with previous studies may bebecause of the methodologies used (in our study the relation wasnot identified by skinfold-thickness measurements), the narrowage range of young children studied, the adjustment of FM forstature, or the analysis of sexes separately. The sex differencesmay reflect differences in body composition during growth, withrelatively greater gains in FFM in boys and FM in girls. It islikely that the positive association between FM and lung func-tion in girls is a reflection of their poor nutritional status becauseof the generally low FM in this group. However, some girls withlow FM had good lung function (Figure 3); of the 4 girls withFMI SDSs less than 21.5 and FEV1 .78%, 3 girls were morephysically active than their peer group, and one girl was asphysically active as her peer group. This finding warrants furtherinvestigation and suggests that nutritional and physical therapiesneed to be sex specific. We could not analyze our data by ge-notype and sex because of low numbers in each group.
Methodology
The findings of previous body-composition studies wereinfluenced by the methodology used. Many studies used heightand weight measurements to assess growth, but these measure-ments do not provide information about body composition, andmany 2CM techniques used in previous studies, includingskinfold-thickness measurements, bio-electrical impedance,hydrometry, and densitometry, merely predicted FM and FFM.The assumptions used (derived from healthy populations) aboutthe nature of the FFM are likely to be less valid for patients. Morerecent studies used DXA to quantify BMC, FM, and FFM;however, soft tissue assessments were biased in some individuals(6, 55), which made comparison between patients and controlsubjects or comparisons over time (where there is a change inbody size) problematic. Our findings, which compared com-monly used 2CM techniques with the gold-standard 4CM, il-lustrated the effect of methodology with a significant bias(depending on sex and health status) compared with 4CM for alltechniques under investigation. In addition, limits of agreementfor 2CMs varied from 62 to 3kg for skinfold-thicknessmeasurements to 61 to 2kg for other methods, which indicatedthat the accuracy is poor in individuals. All 2CM techniques,apart from skinfold-thickness measurements, were consistentwith the criterion method in finding FM related to the FEV1
percentage predicted in girls only. However, the comparison ofbody composition between children with CF and controlchildren highlighted different findings with boys having moreFFM by hydrometry and skinfold-thickness measurements.This is a possible explanation for the contradictory findings ofprevious studies.
In the current study, a positive significant relation between FMand FEV1 percentage predicted in girls was identified by using
FIGURE 3. Relation between percentage predicted forced expired volumein 1 s (FEV1% predicted) and fat mass index (FMI) SD scores (SDS) in girlswith cystic fibrosis. FMI (FM divided by the square of height) SDS wereassessed by the 4-component model of body composition. Correlation in 47girls with cystic fibrosis: r = 0.40 and P = 0.005.
1340 WILLIAMS ET AL
at University C
ollege London on Novem
ber 24, 2010w
ww
.ajcn.orgD
ownloaded from

4CM, hydrometry, and densitometry, and FM assessed by usingDXA approached significance. Some studies that used DXAused LM (ie, tissue that is not fat or bone) and reported the LMas FFM (usually defined as any tissue that is not fat). Therefore,we repeated the analyses by using LM from DXA, and still therewas no significant relation in either sex. In addition, with theexception of King et al (38), most studies did not size adjust FMand FFM when investigating the relation with the FEV1 per-centage predicted. Therefore, we repeated our analyses withoutheight adjustment and showed that no components were sig-nificantly related to the FEV1 percentage predicted. This sug-gested that differences in findings between studies may be, insome part, due to whether height adjustments were made.
All children in this study performed �2 measurement pro-cedures to improve accuracy (10), but children with CF gener-ally needed to undergo more ADP measurements to ensureconsistency. It is likely that much of the variation was due toerratic breathing patterns, and therefore, single ADP measure-ments in this group may have been inaccurate.
Limitations
We used predicted rather than measured lung volumewhen wecalculated BV by ADP because of the difficulty of performing the
technique for young children. However, a study of children withCF that derived FFM from ADP concluded that there was nosignificant difference in FFM calculations between measured orpredicted lung volumes (56).
Because exercise affects the amount of lean tissue, we repeatedthe analyses and took into account parental reported exerciselevels, and there were no differences in outcomes. However,parental ratings may have been affected by differing expectationsin healthy and chronically ill patients, and this needs to beaddressed in future research.
Conclusions
To our knowledge, this was the first study to use a gold-standard method to measure body composition in children withCF. We observed clear sex differences, even in prepubertalchildren, and because of the poorer prognosis in girls, thesedifferences warrant further investigation. Four boys with CF hadBMI SDSs in the obese range, and in 3 cases, this was due toexcess fat. It would seem prudent to carefully monitor childrenwith high BMI to avoid future health problems because of excessfat. Finally, our results highlight some of the potential meth-odologic explanations behind inconsistent findings in previous
TABLE 7
Analysis of mean bias in fat mass measured by 2-component models compared with the 4-component model1
n
Absolute
bias2Absolute 95% limits
of agreement
Bias as a percentage
of the mean3P for the
bias from zero4Correlation
bias/mean r5P for
correlation
kg kg %
Skinfold thickness6
CF boys 37 20.75 62.90 213.2 ,0.01 20.07 NS
CF girls 48 20.90 62.10 215.7 ,0.001 20.36 ,0.05
Control boys 37 21.00 61.97 218.6 ,0.001 20.62 ,0.001
Control girls 47 21.65 62.52 221.2 ,0.001 20.50 ,0.001
Skinfold thickness7
CF boys 36 20.64 62.94 25.13 ,0.05 20.78 ,0.001
CF girls 45 20.43 61.30 23.56 ,0.05 20.66 ,0.001
Control boys 37 0.30 62.42 210.1 ,0.001 20.79 ,0.001
Control girls 46 21.35 62.98 213.8 ,0.001 20.82 ,0.001
Hydrometry
CF boys 37 0.16 62.27 4.24 NS 20.17 NS
CF girls 48 0.70 61.31 13.1 ,0.001 20.03 NS
Control boys 37 0.30 62.43 3.84 NS 20.22 NS
Control girls 48 0.59 61.01 7.98 ,0.001 20.26 NS
DXA
CF boys 37 20.25 61.93 24.97 NS 20.05 NS
CF girls 48 0.27 61.50 2.97 ,0.05 0.23 NS
Control boys 37 20.29 61.38 26.89 ,0.05 0.13 NS
Control girls 48 0.19 61.77 0.34 NS 0.43 ,0.01
Densitometry
CF boys 37 0.03 61.25 20.36 NS 0.14 NS
CF girls 48 20.21 61.91 25.92 NS 0.11 NS
Control boys 37 0.05 61.53 0.05 NS 0.15 NS
Control girls 48 20.50 61.24 27.72 ,0.001 0.14 NS
1 CF, cystic fibrosis; DXA, dual-energy X-ray absorptiometry. Analyses were conducted by using the method of Bland and Altman (31).2 The group mean value measured by 2-component models minus the group mean value measured by the 4-component model.3 The bias of the natural log values · 100.4 Paired t test.5 Pearson’s correlation between the bias and mean values in individuals.6 Calculated by using the age- and sex-specific equations of Slaughter et al (19).7 Calculated by using the age- and sex-specific equations of Deurenberg et al (20).
BODY COMPOSITION OF 6–12-Y-OLD CHILDREN WITH CF 1341
at University C
ollege London on Novem
ber 24, 2010w
ww
.ajcn.orgD
ownloaded from

studies. In particular, 2CMs should be used with caution andalways adjusted for age, height, and sex.
We thank the children and families who took part in the research and for the
assistance of Charlotte Dawson, Emma Fettes, Wanda Kozlowska, Cara Ol-
iver, Ammani Prasad, and Denise Sheehan.
The authors’ responsibilities were as follows—JKCW, MSF, AJ, CB and
RS: conceived the study; JEW and CMW: measured subjects; JEW: modeled
body-composition data and wrote the first draft of the manuscript; JEW,
JCKW, and MSF: conducted statistical analyses; and all authors: contributed
to the revision of the manuscript. None of the authors had a conflict of interest.
REFERENCES1. Reilly JJ, Edwards CA, Weaver LT. Malnutrition in children with cystic
fibrosis: the energy-balance equation. J Pediatr Gastroenterol Nutr 1997;25:127–36.
2. Shepherd RW, Cleghorn G, Ward LC, Wall CR, Holt TL. Nutrition incystic fibrosis. Nutr Res Rev 1991;4:51–67.
3. Richardson I, Nyulasi I, Cameron K, Ball M, Wilson J. Nutritional statusof an adult cystic fibrosis population. Nutrition 2000;16:255–9.
4. Buntain HM, Schluter PJ, Bell SC, et al. Controlled longitudinal studyof bone mass accrual in children and adolescents with cystic fibrosis.Thorax 2006;61:146–54.
5. Wells JC, Fewtrell MS. Measuring body composition. Arch Dis Child2006;91:612–7.
6. Williams JE, Wells JC, Wilson CM, Haroun D, Lucas A, Fewtrell MS.Evaluation of Lunar Prodigy dual-energy X-ray absorptiometry for as-sessing body composition in healthy persons and patients by comparisonwith the criterion 4-component model. Am J Clin Nutr 2006;83:1047–54.
7. Chomtho S, Fewtrell MS, Jaffe A, Williams JE, Wells JC. Evaluation ofarm anthropometry for assessing pediatric body composition: evidencefrom healthy and sick children. Pediatr Res 2006;59:860–5.
8. Kiebzak GM, Leamy LJ, Pierson LM, Nord RH, Zhang ZY. Measure-ment precision of body composition variables using the lunar DPX-Ldensitometer. J Clin Densitom 2000;3:35–41.
9. Wells JC, Fuller NJ, Wright A, Fewtrell MS, Cole TJ. Evaluation ofair-displacement plethysmography in children aged 5-7 years usinga three-component model of body composition. Br J Nutr 2003;90:699–707.
10. Wells JC, Fuller NJ. Precision of measurement and body size inwhole-body air-displacement plethysmography. Int J Obes Relat MetabDisord 2001;25:1161–7.
11. Rosenthal M, Cramer D, Bain SH, Denison D, Bush A, Warner JO. Lungfunction in white children aged 4 to 19 years: II–single breath analysisand plethysmography. Thorax 1993;48:803–8.
12. Zapletal A, Paul T, Samanek M. Normal values of static pulmonaryvolumes and ventilation in children and adolescents. Cesk Pediatr 1976;31:532–9.
13. Haycock GB, Schwartz GJ, Wisotsky DH. Geometric method formeasuring body surface area: a height-weight formula validated in in-fants, children, and adults. J Pediatr 1978;93:62–6.
14. Cole TJ, Freeman JV, Preece MA. Body mass index reference curves forthe UK, 1990. Arch Dis Child 1995;73:25–9.
15. Freeman JV, Cole TJ, Chinn S, Jones PR, White EM, Preece MA. Crosssectional stature and weight reference curves for the UK, 1990. Arch DisChild 1995;73:17–24.
16. Lohman T, Roche A, Martorell R. Anthropometric standardization ref-erence manual. Champaign, IL: Human Kinetics Books, 1988.
17. Scrimgeour CM, Rollo MM, Mudambo SM, Handley LL, Prosser SJ. Asimplified method for deuterium/hydrogen isotope ratio measurementson water samples of biological origin. Biol Mass Spectrom 1993;22:383–7.
18. Racette SB, Schoeller DA, Luke AH, Shay K, Hnilicka J, Kushner RF.Relative dilution spaces of 2H- and 18O-labeled water in humans. Am JPhysiol 1994;267:E585–90.
19. Slaughter MH, Lohman TG, Boileau RA, et al. Skinfold equations forestimation of body fatness in children and youth. Hum Biol 1988;60:709–23.
20. Deurenberg P, Pieters JJ, Hautvast JG. The assessment of the body fatpercentage by skinfold thickness measurements in childhood and youngadolescence. Br J Nutr 1990;63:293–303.
21. Lohman TG. Assessment of body composition in children. Pediatr ExercSci 1989;1:19–30.
22. Wells JC, Fuller NJ, Dewit O, Fewtrell MS, Elia M, Cole TJ. Four-component model of body composition in children: density and hydra-tion of fat-free mass and comparison with simpler models. Am J ClinNutr 1999;69:904–12.
23. Fuller NJ, Jebb SA, Laskey MA, Coward WA, Elia M. Four-componentmodel for the assessment of body composition in humans: comparisonwith alternative methods, and evaluation of the density and hydration offat-free mass. Clin Sci (Lond) 1992;82:687–93.
24. Duke PM, Litt IF, Gross RT. Adolescents’ self-assessment of sexualmaturation. Pediatrics 1980;66:918–20.
25. Roca J, Burgos F, Sunyer J, et al. References values for forced spi-rometry. Group of the European Community Respiratory Health Survey.Eur Respir J 1998;11:1354–62.
26. Kirkby J, Welsh L, Lum S, et al. The EPICure study: comparison ofschool spirometry in community and laboratory settings. Pediatr Pul-monol 2008;43:1233–41.
27. Stanojevic S, Wade A, Stocks J, et al. Reference ranges for spirometryacross all ages: a new approach. Am J Respir Crit Care Med 2008;177:253–60.
28. Fewtrell MS. Bone densitometry in children assessed by dual x rayabsorptiometry: uses and pitfalls. Arch Dis Child 2003;88:795–8.
29. Carter DR, Bouxsein ML, Marcus R. New approaches for interpretingprojected bone densitometry data. J Bone Miner Res 1992;7:137–45.
30. Crabtree NJ, Oldroyd B, Truscott JG, et al. UK paediatric reference data(GE Lunar Prodigy): effects of ethnicity, gender and pubertal status.Osteoporos Int 2004;15:S6.
31. Bland JM, Altman DG. Statistical methods for assessing agreementbetween two methods of clinical measurement. Lancet 1986;1:307–10.
32. Cole TJ, Kryakin YV. Sympercents: symmetric percentage differenceson the 100 log(e) scale simplify the presentation of log transformed data.Stat Med 2002;21:2287–90.
33. Beker LT, Russek-Cohen E, Fink RJ. Stature as a prognostic factor incystic fibrosis survival. J Am Diet Assoc 2001;101:438–42.
34. Sharma R, Florea VG, Bolger AP, et al. Wasting as an independentpredictor of mortality in patients with cystic fibrosis. Thorax 2001;56:746–50.
35. Newby MJ, Keim NL, Brown DL. Body composition of adult cysticfibrosis patients and control subjects as determined by densitometry,bioelectrical impedance, total-body electrical conductivity, skinfoldmeasurements, and deuterium oxide dilution. Am J Clin Nutr 1990;52:209–13.
36. Ionescu AA, Nixon LS, Luzio S, et al. Pulmonary function, bodycomposition, and protein catabolism in adults with cystic fibrosis. Am JRespir Crit Care Med 2002;165:495–500.
37. Ionescu AA, Evans WD, Pettit RJ, Nixon LS, Stone MD, Shale DJ.Hidden depletion of fat-free mass and bone mineral density in adultswith cystic fibrosis. Chest 2003;124:2220–8.
38. King SJ, Nyulasi IB, Strauss BJ, Kotsimbos T, Bailey M, Wilson JW.Fat-free mass depletion in cystic fibrosis: associated with lung diseaseseverity but poorly detected by body mass index. Nutrition 2010;26:753–9.
39. Sermet-Gaudelus I, Souberbielle JC, Azhar I, et al. Insulin-like growthfactor I correlates with lean body mass in cystic fibrosis patients. ArchDis Child 2003;88:956–61.
40. Corey M, McLaughlin FJ, Williams M, Levison H. A comparison ofsurvival, growth, and pulmonary function in patients with cystic fibrosisin Boston and Toronto. J Clin Epidemiol 1988;41:583–91.
41. Fogarty A. International comparison of median age at death from cysticfibrosis. Chest 2000;117:1656–60.
42. Soutter VL, Kristidis P, Gruca MA, Gaskin KJ. Chronic under-nutrition/growth retardation in cystic fibrosis. Clin Gastroenterol 1986;15:137–55.
43. Gurwitz D, Corey M, Francis PW, Crozier D, Levison H. Perspectives incystic fibrosis. Pediatr Clin North Am 1979;26:603–15.
44. Sood M, Adams JE, Mughal MZ. Lean body mass in children withcystic fibrosis. Arch Dis Child 2003;88:836.
45. Bianchi ML, Romano G, Saraifoger S, Costantini D, Limonta C, Co-lombo C. BMD and body composition in children and young patientsaffected by cystic fibrosis. J Bone Miner Res 2006;21:388–96.
46. Reix P, Bellon G, Braillon P. Bone mineral and body composition al-terations in paediatric cystic fibrosis patients. Pediatr Radiol 2010;40:301–8.
1342 WILLIAMS ET AL
at University C
ollege London on Novem
ber 24, 2010w
ww
.ajcn.orgD
ownloaded from

47. Stettler N. Prospective evaluation of growth, nutritional status, and bodycomposition in children with cystic fibrosis. Am J Clin Nutr 2000;72:407–13.
48. Ahmed ML, Ong KK, Thomson AH, Dunger DB. Reduced gains in fatand fat-free mass, and elevated leptin levels in children and adolescentswith cystic fibrosis. Acta Paediatr 2004;93:1185–91.
49. Fewtrell MS, Benden C, Williams JE, et al. Undercarboxylated osteo-calcin and bone mass in 8-12 year old children with cystic fibrosis.J Cyst Fibros 2008;7:307–12.
50. Levy LD, Durie PR, Pencharz PB, Corey ML. Effects of long-term nutri-tional rehabilitation on body composition and clinical status in malnourishedchildren and adolescents with cystic fibrosis. J Pediatr 1985;107:225–30.
51. Shepherd RW, Holt TL, Thomas BJ, et al. Nutritional rehabilitationin cystic fibrosis: controlled studies of effects on nutritional growthretardation, body protein turnover, and course of pulmonary disease.J Pediatr 1986;109:788–94.
52. Sermet-Gaudelus I. Low bone mineral density in young children withcystic fibrosis. Am J Respir Crit Care Med 2007;175:951–7.
53. Henderson RC, Madsen CD. Bone mineral content and body composi-tion in children and young adults with cystic fibrosis. Pediatr Pulmonol1999;27:80–4.
54. Pedreira CC, Robert RG, Dalton V, et al. Association of body compo-sition and lung function in children with cystic fibrosis. Pediatr Pul-monol 2005;39:276–80.
55. Gallagher D, Heymsfield SB, Heo M, Jebb SA, Murgatroyd PR,Sakamoto Y. Healthy percentage body fat ranges: an approach for de-veloping guidelines based on body mass index. Am J Clin Nutr 2000;72:694–701.
56. Murphy AJ, Buntain HM, Wong JC, Greer RM, Wainwright CE, DaviesPS. The use of air displacement plethysmography in children and ado-lescents with cystic fibrosis. Eur J Clin Nutr 2004;58:985–9.
BODY COMPOSITION OF 6–12-Y-OLD CHILDREN WITH CF 1343
at University C
ollege London on Novem
ber 24, 2010w
ww
.ajcn.orgD
ownloaded from

Body-composition reference data for simple and reference techniquesand a 4-component model: a new UK reference child1–3
Jonathan CK Wells, Jane E Williams, Sirinuch Chomtho, Tegan Darch, Carlos Grijalva-Eternod, Kathy Kennedy,Dalia Haroun, Catherine Wilson, Tim J Cole, and Mary S Fewtrell
ABSTRACTBackground: A routine pediatric clinical assessment of body com-position is increasingly recommended but has long been hampered bythe following 2 factors: a lack of appropriate techniques and a lack ofreference data with which to interpret individual measurements. Sev-eral techniques have become available, but reference data are needed.Objective: We aimed to provide body-composition reference datafor use in clinical practice and research.Design: Body composition was measured by using a gold standard4-component model, along with various widely used reference andbedside methods, in a large, representative sample of British chil-dren aged from 4 to $20 y. Measurements were made of anthro-pometric variables (weight, height, 4 skinfold thicknesses, and waistgirth), dual-energy X-ray absorptiometry, body density, bioelectricalimpedance, and total body water, and 4-component fat and fat-freemasses were calculated. Reference charts and SD scores (SDSs)were constructed for each outcome by using the lambda-mu-sigmamethod. The same outcomes were generated for the fat-free massindex and fat mass index.Results: Body-composition growth charts and SDSs for 5–20 ywere based on a final sample of 533 individuals. Correlations be-tween SDSs by using different techniques were $0.68 for adiposityoutcomes and $0.80 for fat-free mass outcomes.Conclusions: These comprehensive reference data for pediatricbody composition can be used across a variety of techniques. To-gether with advances in measurement technologies, the data shouldgreatly enhance the ability of clinicians to assess and monitor bodycomposition in routine clinical practice and should facilitate the useof body-composition measurements in research studies. Am JClin Nutr doi: 10.3945/ajcn.112.036970.
INTRODUCTION
Growth charts for weight and height have been the backbone ofpediatric clinical assessment of nutritional status for decades (1–4). However, efforts to obtain more detailed information onbody composition have long been hampered by 2 challenges.First, methods for the measurement of pediatric body compo-sition have taken time to develop. Only within the past decadehave techniques such as dual-energy X-ray absorptiometry(DXA)4, air-displacement plethysmography, bioelectrical im-pedance analysis (BIA), and isotope dilution become widelyapplied in the pediatric population (5). Second, even when suchtechniques are available, interpretation is severely hindered bythe lack of appropriate reference data.
Thus, clinical practice has been strongly influenced by thenature of available data. Reference data for British children’sskinfold-thickness measurements were provided in the 1970s (1).More recently, reference data for UK children’s BMI werepublished in the 1990s (6) by using Cole’s lambda-mu-sigma(LMS) method to take into account age changes in the variabilityand skewness of data (7). These BMI charts have become theprimary UK reference for the interpretation of nutritional status inthe clinic and have been replicated in many other populations (8–11). To aid convergence between these approaches, skinfold-thickness data were also converted to the LMS format (12).
International BMI cutoffs for categorizing overweight andobesity and underweight have also been published (13, 14). SuchBMI data have been widely adopted, in part because of their valuein predicting clinical outcomes. Nevertheless, the data sufferfrom limitations when more-detailed information about fat massor fat-free mass is required. Historically, fat-free tissue has beenconsidered the functional and dynamic component of weight,with fat mass conceptualized as a relatively inert energy store.Recent studies that identified numerous hormonal products ofadipose tissue have challenged this view, and adipose tissue isunderstood to play a complex regulatory role and exerts many ofits effects on fat-free tissue (15). Therefore, there is increasinginterest in the ability to categorize fat-free mass and fat mass andmonitor their changes over time.
1 From the Childhood Nutrition Research Centre (JCKW, JEW, TD, KK,
and MSF), the Centre for International Health and Development (CG-E), and
the Medical Research Council Centre of Epidemiology for Child Health
(TJC), University College London Institute of Child Health, London, United
Kingdom; the Pediatric Department, Faculty of Medicine, Chulalongkorn
University, Bangkok, Thailand (SC); the Department of Nutrition, Zayed
University, Dubai, United Arab Emirates (DH); and the Radiology Depart-
ment, Great Ormond Street Hospital for Sick Children, London, United
Kingdom (CW).2 Supported by the UK Medical Research Council and the Child Growth
Foundation (DH).3 Address reprint requests and correspondence to J Wells, Childhood
Nutrition Research Centre, University College London Institute of Child
Health, 30 Guilford Street, London WC1N 1EH, United Kingdom. E-mail:
[email protected] Abbreviations used: BIA, bioelectrical impedance analysis; DXA, dual-
energy X-ray absorptiometry; LMS, lambda-mu-sigma; SDS, SD score;
TBW, total body water; 4C, 4-component.
ReceivedFebruary 13, 2012. Accepted for publication August 17, 2012.
doi: 10.3945/ajcn.112.036970.
Am J Clin Nutr doi: 10.3945/ajcn.112.036970. Printed in USA. � 2012 American Society for Nutrition 1 of 11
AJCN. First published ahead of print October 17, 2012 as doi: 10.3945/ajcn.112.036970.
Copyright (C) 2012 by the American Society for Nutrition

We previously summarized a number of contexts in whichinformation about body composition could be of value to thepediatrician (16) and also described the methodologies available(5). However, until reference data for children’s body compo-sition are available, measurements of individual patients willremain difficult to interpret (17). Reference data for individualtechniques (eg, skinfold thicknesses, BIA, and DXA), have beenreported in the literature (18–25), but to our knowledge, no studyhas provided comprehensive reference data on a range of tech-niques in any single population. In this article, we describereference data for a number of different measures of bodycomposition, which will allow our reference data set to be usedacross a variety of techniques.
SUBJECT AND METHODS
A total of 565 normal healthy children, adolescents, andyoung adults aged 4–23 y were recruited by using flyers andnewspaper adverts in London and the southeast of Englandstarting in 2001. There were no exclusion criteria for BMI, andthus, some individuals were categorized as overweight orobese, but they were not recruited directly from obesityweight-loss clinics and had no disease that might have ad-versely affected growth and development. The lower age limit
of 4 y was chosen on the basis of our previous work becauseyounger children are unlikely to satisfy the protocol for air-displacement plethysmography. Data collection was extendedto young adults to cover the entire pediatric age range. Ethicalapproval was granted by the Ethical Committee of UniversityCollege London Institute of Child Health and Great OrmondStreet Hospital. All individuals attended our body-compositioninvestigation suite located at Great Ormond Street Hospital fora 2-h measurement session.
Weight and height were measured by using standard pro-tocols. Body weight was measured in duplicate as part of the air-displacement plethysmography protocol. Height was measuredby using a wall-mounted stadiometer (Holtain). BMI (in kg/m2)was calculated as weight divided by the square of height. Dataon weight, height, and BMI were converted to SD score (SDS)format by using UK reference data (6, 26). Obesity was definedas BMI .95th percentile (SDS .1.64), and overweight wasdefined as BMI .85th percentile (SDS .1.04) (6). Pubertaldevelopment was assessed by using Tanner staging with self-assessment based on line drawings.
Skinfold-thickness measurements were performed in triplicateat the biceps, triceps, subscapular, and suprailiac sites, and themean of the 3 values was used.Waist girth was measured by usinga nonstretchable fiberglass tape. BIA was conducted with TanitaBC418MA instrumentation (Tanita Corp); however, this in-strument was available only from 2004 onward, and thus, thesample size was 451 (83% of the total) for this outcome. Withthe use of whole-body values for impedance (Z, inU) at 50 kHz, theimpedance index [height2/Z (cm2/U)] was calculated. Numerouspediatric equations have been published for BIA that have leftusers uncertain as to which equation to select for any givenpopulation. Therefore, the BIA output was analyzed in raw units(in cm2/U) to avoid influencing this outcome by the choice ofone or another equation. This approach prevented the use of BIAdata as an index of adiposity, and therefore, skinfold thicknesseswere the primary bedside approach tested for adiposity. Becauseabsolute body-composition values obtained by using predictiveequations in combination with such bedside techniques havehigh SEEs, our combined skinfold thicknesses plus BIA bedsideapproach had the added advantage that fat-free and fat tissueswere assessed by using independent techniques, and error on theadiposity index should have been independent from error on thefat-free mass outcome.
FIGURE 1. Distribution of BMI SDS against age in the sample. n = 261males and 272 females. SDS, SD score.
TABLE 1
Summary statistics for anthropometric measures and weight status by sex1
M (n = 261) F (n = 272)
Weight SDS 0.31 6 1.08 (22.42 to 3.44)2 0.42 6 1.10 (22.75 to 3.46)
Height SDS 0.21 6 0.96 (22.09 to 3.28) 0.34 6 1.02 (22.77 to 3.42)
BMI SDS 0.24 6 1.15 (22.99 to 3.49) 0.31 6 1.15 (23.33 to 3.32)
Percentage of fat (4C model)3 19.2 6 8.0 (4.9–45.5) 27.0 6 8.0 (11.7–46.9)
Prevalence (%)
Overweight 9.2 10.7
Obese 11.5 14.7
1 SDSs were calculated by using UK reference data (6, 25). Overweight was categorized as BMI SDS .1.04 (85th
percentile). Obese was categorized as BMI SDS .1.64 (95th percentile). SDS, SD score; 4C, 4-component.2Mean 6 SD; range in parentheses (all such values).3The difference in the percentage of fat between sexes was determined by using multiple regression analysis to
assess the significance of female sex with adjustment for age, P , 0.0001.
2 of 11 WELLS ET AL

Measurements of total body water (TBW; in L) by usingdeuterium dilution, bone mineral content (in kg) by using DXA(Lunar Prodigy, software version 6.7; GE Medical Systems), andbody volume (in L) in duplicate by using air-displacementplethysmography (Bodpod; Life Measurements) were obtainedas described previously, with postdose saliva collected after 4–5 h(27). The deuterium-dilution space was converted to TBW withthe assumption that the degree of overestimation that was at-tributable to proton exchange was 1.044 (28). Lung volume waspredicted rather than measured in plethysmography measure-ments because we have shown that a large proportion of childrenare unable to complete the lung-volume measurement protocolsatisfactorily. Values for fat-free mass by using DXA were thesum of lean soft tissue and bone mineral mass.
The 4-component (4C) model is considered the most accuratein vivo approach for the differentiation of fat and fat-free massesand is particularly valuable in patients in whom assumptions ofconstant fat-free tissue composition are not valid (29, 30). The 4Cmodel used in this study to calculate lean mass and fat mass (FM)has been described previously (31, 32) and uses the followingequations:
FM ¼ ð2:7473BVÞ2 ð0:7103TBWÞ1ð1:4603BMCÞ2 ð2:0503WTÞ ð1Þ
FFM ¼ WT2 FM ð2Þ
where FM is fat mass, BV is body volume, BMC is bone mineralcontent, FFM is fat-free mass, and WT is body weight. The pro-portion of fat in weight (percentage of fat) was calculated as
ðFMOWTÞ3 100 ð3Þ
In our laboratory, the precision is 1% for TBW (32) and 0.24 Lfor BV (33). The precision of BMC is 1.1% (34).
Statistics
Analyses were conducted for a range of adiposity and fat-freemass outcomes. For adiposity, the outcomes were 1) each of the 4skinfold thicknesses, 2) waist girth, 3) whole-body, arm, leg, andtrunk fat mass from DXA, 4) body density by air-displacementplethysmography, and 5) 4C fat mass. For fat-free mass, theoutcomes were 1) TBW, 2) height2/Z, 3) whole-body, arm, leg,and trunk fat-free mass by using DXA, and 4) 4C fat-free mass.For the 4C data, the fat-free mass index (fat-free mass/height2)and fat mass index (fat mass/height2) were also calculated, asdescribed and recommended previously (17, 35). Each of thesevariables was converted to an SDS.
Sex-specific values by month of age were obtained for allbody-composition outcomes by using the LMS method (LMSChart Maker; Medical Research Council) (7). This statisticalapproach, which has been widely used to construct reference datafor traits that incorporate the effects of growth, provides thefollowing 3 outputs: 1) a smoothed median (M or mu) curve,which represents how the outcome varies in relation to age, 2)the CV (S or sigma), which models the scatter of values around
the mean and adjusts for any nonuniform dispersion, and 3) theskewness (L or lambda), which is addressed by using age-specific Box-Cox transformation to achieve a normal distri-bution. Adiposity indexes were fitted by using original age, andfat-free mass outcomes were fitted by using rescaled age, whichimproved the goodness of fit for monotonic data by fitting the Mcurve twice. The goodness of fit was assessed by using theBayesian Information Criterion, with the addition of an extra unitof complexity to the model only if it reduced the deviance bymore than loge(N) units, where N was the sample size. As theprecision of the M curve at any age depends on data points atyounger and older ages, precision is lower at the extremes of theage range. Therefore, we fitted the data for all ages (4–23 y) andderived LMS values for the age range 5–20 y.
FIGURE 2. Percentiles of fat-free mass, fat mass, fat-free mass index, andfat mass index by the 4-component model for males (n = 261; left panels)and females (n = 272; right panels). The second, ninth, 25th, 50th, 75th, 91st,and 98th percentiles are displayed in ascending order.
REFERENCE DATA FOR CHILDREN’S BODY COMPOSITION 3 of 11

These data represent new body-composition growth chartsavailable for both the 4Cmodel and individual techniques such asDXA, TBW, body density, BIA, and skinfold thicknesses. Suchcharts allow for the monitoring of adiposity and fat-free massover time to improve the understanding of the effects of diseaseand treatments. We also calculated values for fat-free mass, fatmass, fat-free mass index, and fat mass index by the 4Cmodel foreach sex for the following z-score cutoffs: 22, 21.67, 21.33, 0,1.33, 1.67, and 2, which are equivalent to percentiles of 2.3%,9.2%, 25.2%, 50%, 74.8%, 90.8%, and 97.7% respectively.
With the use of this statistical approach, all data were con-verted to an SDS format, and subsequent analyses on subjectsaged 5–20 y were undertaken by using Datadesk 6.1 software(Data Description Inc). The mean of the 4 individual skinfold-
thickness SDSs was also calculated. We quantified the agree-ment between the individual SDS with the reference 4C SDS. Ifgrowth charts are to be adopted by clinicians, they will need toknow whether rankings from one technique (eg, skinfoldthicknesses) are consistent with ranking by another (eg, DXA orthe 4C model). The expression of the data in the SDS formataids such a comparison because, first, it enables the chart rankingsto be compared rather than the raw data and, second, becausebody-composition techniques produce outputs in different units(eg, kg for DXA, kg/m3 for density, mm for skinfold thicknesses,and cm2/U for BIA), preventing direct comparisons.
Correlation coefficients were calculated for all of the adiposityand fat-free mass outcomes in each sex. Pearson’s correlationcoefficients were calculated on the assumption that associations
TABLE 2
Fat-free mass reference data for males and females by z score or percentile1
Age
Males Females
z = 22.0 z = 21.33 z = 20.67 z = 0 z = 0.67 z = 1.33 z = 2.0 z = 22.0 z = 21.33 z = 20.67 z = 0 z = 0.67 z = 1.33 z = 2.0
5.0 y 12.76 13.89 15.08 16.35 17.70 19.13 20.64 11.24 12.27 13.39 14.60 15.91 17.33 18.86
6.0 y 14.10 15.37 16.72 18.16 19.69 21.31 23.03 12.83 14.02 15.30 16.70 18.21 19.85 21.62
7.0 y 15.32 16.73 18.23 19.83 21.54 23.34 25.26 14.49 15.84 17.31 18.91 20.64 22.51 24.55
8.0 y 16.56 18.12 19.79 21.56 23.45 25.45 27.58 16.23 17.77 19.45 21.26 23.24 25.38 27.71
9.0 y 18.02 19.76 21.62 23.61 25.73 27.98 30.38 17.88 19.61 21.49 23.54 25.77 28.20 30.83
10.0 y 19.66 21.62 23.72 25.98 28.38 30.95 33.68 19.56 21.49 23.60 25.89 28.39 31.12 34.08
11.0 y 21.60 23.85 26.28 28.88 31.67 34.64 37.83 21.62 23.79 26.16 28.74 31.56 34.63 37.98
12.0 y 24.06 26.71 29.56 32.63 35.94 39.48 43.27 24.23 26.66 29.31 32.21 35.37 38.82 42.58
13.0 y 27.24 30.36 33.75 37.41 41.35 45.59 50.14 27.06 29.71 32.61 35.76 39.19 42.93 47.00
14.0 y 31.09 34.72 38.65 42.91 47.50 52.44 57.75 29.67 32.46 35.49 38.77 42.34 46.21 50.41
15.0 y 35.03 39.06 43.41 48.12 53.19 58.64 64.50 31.62 34.46 37.54 40.87 44.48 48.38 52.59
16.0 y 38.55 42.82 47.43 52.39 57.73 63.46 69.59 32.81 35.67 38.76 42.10 45.70 49.59 53.78
17.0 y 41.35 45.74 50.47 55.55 60.99 66.82 73.05 33.46 36.32 39.41 42.75 46.34 50.21 54.38
18.0 y 43.45 47.90 52.68 57.80 63.28 69.13 75.38 33.71 36.57 39.67 43.00 46.58 50.45 54.61
19.0 y 45.02 49.50 54.30 59.43 64.92 70.77 77.00 33.75 36.62 39.71 43.04 46.63 50.49 54.65
20.0 y 46.24 50.73 55.54 60.68 66.17 72.01 78.22 33.86 36.73 39.82 43.15 46.73 50.59 54.75
1 z-score equivalents in percentiles are as follows: 22 = 2.3%, 21.33 = 9.2%, 20.67 = 25.2%, 0 = 50%, 0.67 = 74.8%, 1.33 = 90.8%, and 2 = 97.7%.
TABLE 3
Fat mass reference data for males and females by z score or percentile1
Age
Males Females
z = 22.0 z = 21.33 z = 20.67 z = 0 z = 0.67 z = 1.33 z = 2.0 z = 22.0 z = 21.33 z = 20.67 z = 0 z = 0.67 z = 1.33 z = 2.0
5.0 y 1.37 1.77 2.32 3.11 4.26 6.00 8.72 1.60 2.12 2.87 3.97 5.59 8.09 12.06
6.0 y 1.61 2.09 2.76 3.71 5.11 7.25 10.62 2.02 2.67 3.60 4.95 6.95 9.99 14.78
7.0 y 1.85 2.40 3.18 4.31 5.97 8.52 12.60 2.45 3.23 4.34 5.94 8.29 11.85 17.41
8.0 y 2.08 2.71 3.61 4.91 6.84 9.84 14.66 2.89 3.80 5.09 6.92 9.61 13.66 19.94
9.0 y 2.30 3.01 4.03 5.50 7.72 11.18 16.81 3.34 4.38 5.84 7.91 10.93 15.44 22.37
10.0 y 2.52 3.31 4.44 6.10 8.61 12.56 19.04 3.81 4.97 6.59 8.89 12.23 17.17 24.72
11.0 y 2.73 3.60 4.85 6.70 9.51 13.97 21.37 4.28 5.57 7.36 9.88 13.51 18.86 26.97
12.0 y 2.93 3.89 5.26 7.30 10.42 15.42 23.80 4.76 6.18 8.13 10.86 14.78 20.52 29.15
13.0 y 3.13 4.16 5.66 7.89 11.34 16.90 26.33 5.26 6.80 8.91 11.85 16.04 22.14 31.23
14.0 y 3.32 4.44 6.06 8.49 12.28 18.43 28.96 5.77 7.43 9.69 12.84 17.29 23.72 33.24
15.0 y 3.51 4.71 6.45 9.09 13.22 19.99 31.70 6.29 8.07 10.48 13.82 18.52 25.26 35.17
16.0 y 3.70 4.97 6.84 9.69 14.18 21.59 34.55 6.82 8.72 11.28 14.81 19.74 26.77 37.03
17.0 y 3.87 5.23 7.23 10.28 15.14 23.23 37.53 7.37 9.38 12.09 15.79 20.94 28.24 38.82
18.0 y 4.05 5.48 7.61 10.88 16.12 24.92 40.62 7.93 10.05 12.90 16.78 22.14 29.68 40.53
19.0 y 4.21 5.73 7.99 11.48 17.11 26.64 43.85 8.50 10.74 13.72 17.76 23.32 31.09 42.18
20.0 y 4.38 5.97 8.36 12.08 18.11 28.41 47.21 9.08 11.43 14.55 18.75 24.49 32.46 43.76
1 z-score equivalents in percentiles are as follows: 22 = 2.3%, 21.33 = 9.2%, 20.67 = 25.2%, 0 = 50%, 0.67 = 74.8%, 1.33 = 90.8%, and 2 = 97.7%.
4 of 11 WELLS ET AL

between different z scores were expected to be linear. For centraladiposity, we also calculated correlations of SDSs for DXAtrunk fat and waist girth. A sex-specific regression analysis wasundertaken for the prediction of the 4C fat mass SDS from eachindividual adiposity SDS, and the 4C fat-free mass SDS fromeach individual fat-free mass, TBW, or height2/Z SDS. Slopesand intercepts were assessed for the difference from 1 and 0,respectively, and the SEE was calculated. Bland-Altman anal-ysis (36) was used to illustrate the agreement with 4C SDSvalues for DXA whole-body SDS, BIA SDS, and averageskinfold-thickness SDS. A minority of subjects (27 boys and 23girls; ie, 9.3% of the sample) were of non-European ethnicity;however, this sample size was considered too small to allowethnic variability in body composition to be addressed.
RESULTS
Valid data were obtained on 533 individuals. Data on 32 otherindividuals were discarded because either one or more of thebasic measurements were unsuccessful (n = 16; mostly veryyoung children) or the modeling was unsuccessful (n = 16) asindicated by spurious body-composition data. As shown inFigure 1, a wide range of BMI SDSs was apparent at all ages.There was no significant correlation between BMI SDS and agein either sex.
Data on anthropometric SDS values and the range of per-centage of fat by sex are shown in Table 1. On average, oursample was heavier and taller in comparison with the UK ref-erence data of the early 1990s (P , 0.005 in all cases). Femalesunsurprisingly had a significantly greater percentage fat than did
TABLE 4
Fat-free mass index reference data for males and females by z score or percentile1
Age
Males Females
z = 22.0 z = 21.33 z = 20.67 z = 0 z = 0.67 z = 1.33 z = 2.0 z = 22.0 z = 21.33 z = 20.67 z = 0 z = 0.67 z = 1.33 z = 2.0
5.0 y 11.59 12.13 12.68 13.25 13.84 14.43 15.04 10.75 11.16 11.61 12.11 12.68 13.33 14.07
6.0 y 11.59 12.13 12.69 13.27 13.87 14.49 15.14 10.88 11.32 11.81 12.35 12.94 13.59 14.33
7.0 y 11.50 12.03 12.59 13.17 13.79 14.43 15.11 10.98 11.47 12.00 12.57 13.20 13.89 14.64
8.0 y 11.43 11.95 12.50 13.09 13.72 14.39 15.10 11.05 11.59 12.18 12.81 13.49 14.22 15.03
9.0 y 11.48 11.99 12.55 13.15 13.79 14.49 15.25 11.10 11.69 12.33 13.01 13.76 14.56 15.43
10.0 y 11.61 12.15 12.72 13.35 14.03 14.78 15.59 11.16 11.80 12.49 13.24 14.05 14.93 15.89
11.0 y 11.80 12.38 13.02 13.71 14.48 15.32 16.27 11.31 12.00 12.75 13.56 14.44 15.40 16.45
12.0 y 12.05 12.71 13.44 14.24 15.14 16.15 17.28 11.57 12.29 13.09 13.95 14.91 15.95 17.11
13.0 y 12.45 13.19 14.02 14.95 15.98 17.15 18.49 11.89 12.64 13.47 14.39 15.40 16.52 17.77
14.0 y 12.98 13.81 14.74 15.76 16.91 18.20 19.65 12.24 13.01 13.85 14.80 15.84 17.01 18.33
15.0 y 13.55 14.46 15.46 16.56 17.78 19.13 20.63 12.57 13.33 14.18 15.12 16.18 17.37 18.72
16.0 y 14.07 15.06 16.12 17.28 18.53 19.88 21.36 12.84 13.58 14.41 15.33 16.37 17.56 18.91
17.0 y 14.51 15.57 16.69 17.87 19.13 20.45 21.86 13.03 13.75 14.54 15.43 16.44 17.60 18.93
18.0 y 14.87 15.99 17.15 18.36 19.60 20.88 22.19 13.18 13.85 14.60 15.45 16.41 17.52 18.81
19.0 y 15.14 16.33 17.53 18.74 19.96 21.19 22.42 13.28 13.91 14.61 15.40 16.31 17.37 18.60
20.0 y 15.34 16.60 17.83 19.05 20.24 21.41 22.57 13.35 13.93 14.58 15.32 16.18 17.17 18.35
1 z-score equivalents in centiles are as follows: 22 = 2.3%, 21.33 = 9.2%, 20.67 = 25.2%, 0 = 50%, 0.67 = 74.8%, 1.33 = 90.8%, and 2 = 97.7%
TABLE 5
Fat mass index reference data for males and females by z score or percentile1
Age
Males Females
z = 22.0 z = 21.33 z = 20.67 z = 0 z = 0.67 z = 1.33 z = 2.0 z = 22.0 z = 21.33 z = 20.67 z = 0 z = 0.67 z = 1.33 z = 2.0
5.0 y 1.41 1.79 2.26 2.84 3.56 4.45 5.53 1.59 1.99 2.53 3.30 4.42 6.14 8.90
6.0 y 1.24 1.60 2.06 2.65 3.38 4.32 5.49 1.67 2.11 2.70 3.54 4.77 6.63 9.58
7.0 y 1.11 1.44 1.88 2.45 3.20 4.17 5.45 1.75 2.22 2.86 3.77 5.10 7.10 10.24
8.0 y 1.12 1.46 1.92 2.54 3.38 4.52 6.10 1.83 2.33 3.03 4.01 5.43 7.56 10.87
9.0 y 1.29 1.69 2.23 2.98 4.03 5.55 7.76 1.91 2.45 3.19 4.24 5.75 8.00 11.47
10.0 y 1.45 1.89 2.50 3.37 4.66 6.59 9.61 1.98 2.56 3.35 4.46 6.06 8.42 12.00
11.0 y 1.51 1.95 2.59 3.52 4.93 7.17 10.91 2.07 2.68 3.51 4.68 6.35 8.79 12.44
12.0 y 1.45 1.88 2.49 3.40 4.83 7.20 11.43 2.16 2.80 3.68 4.90 6.63 9.12 12.80
13.0 y 1.35 1.75 2.32 3.18 4.57 6.96 11.49 2.26 2.93 3.85 5.11 6.88 9.41 13.07
14.0 y 1.28 1.65 2.19 3.02 4.37 6.76 11.54 2.36 3.06 4.01 5.32 7.12 9.65 13.26
15.0 y 1.23 1.59 2.10 2.90 4.23 6.61 11.54 2.47 3.20 4.18 5.51 7.33 9.85 13.38
16.0 y 1.20 1.55 2.06 2.84 4.15 6.54 11.53 2.59 3.34 4.35 5.70 7.52 10.01 13.43
17.0 y 1.22 1.58 2.10 2.90 4.24 6.69 11.84 2.71 3.49 4.51 5.88 7.69 10.13 13.43
18.0 y 1.32 1.70 2.27 3.14 4.60 7.25 12.78 2.84 3.64 4.68 6.05 7.84 10.22 13.38
19.0 y 1.48 1.92 2.56 3.55 5.19 8.17 14.31 2.98 3.79 4.85 6.21 7.98 10.29 13.31
20.0 y 1.67 2.16 2.89 4.01 5.87 9.21 16.01 3.12 3.95 5.01 6.37 8.11 10.35 13.22
1 z-score equivalents in centiles are as follows: 22 = 2.3%, 21.33 = 9.2%, 20.67 = 25.2%, 0 = 50%, 0.67 = 74.8%, 1.33 = 90.8%, and 2 = 97.7%.
REFERENCE DATA FOR CHILDREN’S BODY COMPOSITION 5 of 11

males (P , 0.0001, adjusted for age). The prevalence of obesitywas 11.5% and 14.7% in males and females, respectively, andwas uncorrelated with age. The numbers of subjects by pubertalstage 1–5 were 98, 60, 28, 24, and 50 males, respectively, and87, 48, 34, 22, and 80 females, respectively; pubertal stage in 2other subjects was not recorded.
LMS percentiles for 4C fat-free mass, 4C fat mass, 4C fat-freemass index, and 4C fat mass index, respectively, against age foreach sex are shown in Figure 2. Fat-free mass increased with agein an S-shaped association in both sexes but reached sub-stantially higher values in males. This sex difference was re-duced but remained apparent when adjusted for height in theform of the fat-free mass index. Fat mass had no discerniblecurvilinear association with age, which was attributed in part todiffering age-associations of individual fat depots as proxied bythe 4 skinfold thicknesses (data not shown). z score and per-centile reference data for each of fat-free mass, fat mass, fat-freemass index, and fat mass index by the 4C model for each sex areshown in Tables 2–5.
Correlation coefficients for adiposity SDS indexes by sex areshown in Table 6. All coefficients were $0.68 (P , 0.0001).Coefficients and SEs for intercepts and slopes for the regressionof 4C fat mass SDS on each individual adiposity SDS value,
together with SEE values, are shown in Table 7. No interceptdiffered significantly from 0; however, most slopes were sig-nificantly ,1, with the exception of DXA fat mass SDS in fe-males. For DXA fat mass in males, the upper 95% CI of theslope was just ,1 (0.983). The smallest SEE values were ob-tained from DXA fat mass SDS (0.33 SDS in males; 0.21 SDSin females), whereas values for skinfold thicknesses were w0.5to w0.6 SDS. Thus, in most cases, individual SDS under-estimated 4C fat SDS in subjects with higher adiposity, and thiseffect was minimal for DXA whole-body data. Bland-Altmananalysis of agreement between 4C and DXA values for fat massSDS is illustrated in Figure 3 and showed no systematic trend inbias across the range of adiposity but greater random in-consistency in subjects of low adiposity.
Correlation coefficients for SDSs for indexes of fat-free massby sex are shown in Table 8. All correlations were $0.80 (P ,0.0001). Coefficients and SEs for intercepts and slopes for theregression of 4C fat-free mass SDS on each individual proxySDS value, together with SEE values, are shown in Table 9. Nointercept differed significantly from 0; however, most slopeswere significantly ,1, with the exception of DXA fat-free massSDS in both sexes and TBW SDS in both sexes. SEE valueswerew0.2 for DXAwhole-body SDS,w0.2 for TBW SDS, and
TABLE 6
Correlations for adiposity outcomes expressed in SDS format1
M (n = 245) and
F (n = 259) Biceps Triceps Subscapular Suprailiac
Mean
skinfold Density
4C
fat mass
DXA
fat mass
DXA
arm fat
DXA
leg fat
DXA
trunk fat
Biceps — 0.86 0.78 0.76 0.92 20.79 0.84 0.82 0.87 0.81 0.79
Triceps 0.82 — 0.74 0.82 0.93 20.82 0.83 0.83 0.86 0.81 0.81
Subscapular 0.68 0.78 — 0.78 0.90 20.75 0.81 0.84 0.82 0.81 0.83
Suprailiac 0.69 0.80 0.79 — 0.92 20.82 0.83 0.84 0.83 0.81 0.85
Mean skinfold 0.88 0.94 0.90 0.91 — 20.87 0.90 0.91 0.92 0.88 0.89
Density 20.77 20.82 20.76 20.81 20.88 — 20.90 20.87 20.86 20.83 20.86
4C fat mass 0.78 0.84 0.80 0.80 0.89 20.93 — 0.94 0.92 0.93 0.94
DXA fat mass 0.77 0.84 0.81 0.79 0.89 20.88 0.98 — 0.95 0.97 0.98
DXA arm fat 0.81 0.87 0.80 0.79 0.91 20.88 0.95 0.97 — 0.92 0.94
DXA leg fat 0.75 0.82 0.75 0.75 0.85 20.86 0.95 0.97 0.93 — 0.93
DXA trunk fat 0.75 0.82 0.82 0.80 0.88 20.87 0.96 0.98 0.95 0.93 —
1 For Pearson’s correlation coefficients, M values are above the diagonal, and F values are below diagonal. All correlations were significant at P ,0.0001. DXA, dual-energy X-ray absorptiometry; SDS, SD score; 4C, 4-component.
TABLE 7
Intercepts, slopes, and SEEs for regression of 4C fat mass SDS on individual adiposity SDS1
Predictor
Males (n = 245) Females (n = 259)
Intercept SE Slope SE SEE Intercept SE Slope SE SEE
Biceps 0.044 0.036 0.840 0.036 0.55 0.032 0.040 0.802 0.041 0.63
Triceps 0.027 0.036 0.836 0.036 0.56 0.028 0.034 0.856 0.035 0.54
Subscapular 0.046 0.038 0.821 0.038 0.58 0.032 0.038 0.828 0.039 0.60
Suprailiac 0.037 0.037 0.862 0.038 0.58 0.037 0.039 0.820 0.039 0.61
Mean skinfold 0.038 0.026 0.837 0.026 0.40 0.028 0.027 0.826 0.027 0.41
Density 20.017 0.028 20.892 0.027 0.43 0.021 0.024 20.927 0.024 0.38
DXA fat mass 0.018 0.021 0.941 0.021 0.33 0.010 0.013 0.979 0.013 0.21
DXA arm fat 0.002 0.025 0.926 0.025 0.39 0.017 0.018 0.946 0.018 0.30
DXA leg fat 0.006 0.024 0.931 0.024 0.37 20.002 0.019 0.951 0.019 0.30
DXA trunk fat 0.010 0.023 0.923 0.022 0.35 20.004 0.017 0.962 0.017 0.27
1The 4C fat mass SDS regressed on each individual adiposity SDS. All slopes were significantly different from 1 (P , 0.05) except for DXA fat mass in
girls. DXA, dual-energy X-ray absorptiometry; SDS, SD score; 4C, 4-component.
6 of 11 WELLS ET AL

w0.44 for BIA SDS. The Bland-Altman analysis of agreementbetween 4C and DXA values for fat-free mass SDSs in malesand females are illustrated in Figure 3 and showed no variabilityin bias across the range of fat-free mass SDSs.
r2 values calculated from Tables 6 and 8 indicated that DXA fatSDS accounted for 88% and 96% of the variance in 4C fat SDS inmales and females, respectively, whereas DXA fat-free SDS ac-counted for 96% and 94% of the variance in 4C fat-free SDS inmales and females, respectively. In both sexes, agreement wasbetter for fat-free SDS than for fat SDS (Figure 3), which showedpoorer consistency between methods in subjects with low adi-posity. For central fat, the correlation of DXA trunk fat SDS andwaist SDS was 0.81 in males and 0.83 in females. Therefore,waist SDS explained 66% and 69% of the variance in trunk fatSDS in males and females, respectively.
Associations between 4C fat-free mass SDS and BIA SDS ineach sex are shown in Figure 4. r2 values from Table 8 indicatedthat height2/Z SDS accounted for 83% and 81% of the variancein 4C fat-free SDS in males and females, respectively. The as-sociation between 4C fat mass SDS and the mean of 4 skinfold-
thickness SDSs in each sex is also shown in Figure 4. For eachof the sum of 4 skinfold thicknesses, density, DXA indexes,and 4C fat mass, r2 values calculated from Table 6 indicatedthat each individual adiposity SDS accounted for 66–96% and61–96% of the variance in other SDSs in males and females,respectively.
DISCUSSION
Although reference data for children’s body composition havelong been desired, their development is complicated by thedifficulty of obtaining accurate measurements. Advances inmodeling, with the combination of several raw measurements,have allowed accurate 4C data to be obtained in children $4 y(31, 32). This approach is unlikely to be widely applied inclinical practice or research studies because of its expense andrequirement for sophisticated equipment. Several techniques areused more routinely, including skinfold thicknesses, DXA, andBIA; however, each method uses different approaches to convertraw measurements to final body-composition values (37, 38).
FIGURE 3. Bland-Altman plots illustrating the agreement between DXA fat-free mass SDS and 4C fat-free mass SDS (upper panels) and DXA fat SDSand 4C fat mass SDS (lower panels) in males (n = 245, left side) and females (n = 259, right side). The scatter plot shows agreement between techniques inindividuals, and dotted lines show the mean bias and limits of agreement (62 SD of the bias). DXA, dual-energy X-ray absorptiometry; SDS, SD score; 4C, 4-component.
REFERENCE DATA FOR CHILDREN’S BODY COMPOSITION 7 of 11

Over the past 2 decades, various pediatric body-compositionreference data have been reported, including skinfold-thicknessdata in Spain (19) and the United States (18); BIA data in theUnited States (20), Turkey (21) and Japan (22); and DXA data inSweden (23), the Netherlands (24), and the United States (25, 39).These data represent an advance over BMI, which can assessnutritional status but not fat and fat-free masses or their regionaldistribution. However, because of the different theoretical as-sumptions and population variability in body size and nutritionalstatus, these heterogeneous data sets cannot easily be compared.To our knowledge, no study has previously reported referencedata for a wide range of outcomes, which would allow futurestudies to benefit from convergence on a common data set, re-gardless of which technique was used.
We have attempted to resolve this problem by developing ref-erence charts and SDSs for both the accurate 4C model anda number of simpler techniques across the age range from 5 to 20 y.We have further described correlations between SDSs calculated byusing the different techniques and have shown medium-to-highagreement in all cases. Thus, whether measurements are made byusing skinfold-thickness calipers, DXA, BIA, densitometry, iso-topes, or the 4C model, there is relatively good ranking consistency,although different techniques cannot be used interchangeably whenindividuals are monitored over time. These new data will aid bothsingle assessments of children and longitudinal monitoring overtime. They are suitable for use in conditions in which there is noacute perturbation of water distribution (edema).
From our clinical experience, children with specific diseasesare often able to undergo only a subset of body-compositionmeasurements. For example, many patients are too sick to un-dergo plethysmography or DXA but can have BIA or TBWmeasured at the bedside (40, 41). Some obese children are toolarge to be successfully scanned by DXA and are difficult tomeasure by using skinfold-thickness calipers but can undergoplethysmography (42). When hydration varies beyond the normalrange, and when patients are able to undergo a wider range ofmeasurements, the 4C model is ideal, as we have shown forobesity (29), acute lymphoblastic leukemia (30), and cystic fi-brosis (43). Thus, our reference data should substantially increasethe capacity of clinicians to acquire and interpret data in a widerange of diseases, which could contribute to a range of com-ponents of clinical management. For more general communitystudies of nutritional status, TBW is the most accurate fieldmethod (32, 44) and can be applied in combination with ourpublished reference data for hydration (38).
With the comparison between techniques for adiposity, thehighest correlations with 4C fat mass SDS were shown for whole-body DXA fat mass SDS, with coefficients of 0.98 in females and0.94 in males and an SEE w0.2 SDS. The next best techniquewas density SDS, whereas the individual skinfold-thicknessperformed slightly less well (correlations ranged from 0.78 to0.84, with an SEEw0.6 SDS), but the average of the 4 skinfold-thickness SDS values had a correlation very similar to that ofdensity in both sexes and an SEE w0.4 SDS. For 4C fat-free
TABLE 8
Correlations for fat-free mass outcomes expressed in SDS format1
M (n = 245) and
F (n = 259)2Total
body water 4C FFM DXA FFM DXA arm FFM DXA leg FFM DXA trunk FFM Height2/Z
Total body water — 0.98 0.95 0.84 0.92 0.91 0.90
4C FFM 0.99 — 0.98 0.86 0.95 0.94 0.91
DXA FFM 0.96 0.97 — 0.88 0.96 0.97 0.91
DXA arm FFM 0.86 0.88 0.89 — 0.83 0.80 0.86
DXA leg FFM 0.94 0.95 0.96 0.84 — 0.87 0.89
DXA trunk FFM 0.91 0.93 0.97 0.82 0.87 — 0.86
Height2/Z 0.90 0.90 0.90 0.84 0.87 0.86 —
1 For Pearson’s correlation coefficients, M values are above the diagonal, and F values are below diagonal. All correlations were significant at P ,0.0001. DXA, dual-energy X-ray absorptiometry; FFM, fat-free mass; SDS, SD score; 4C, 4-component.
2 For bioelectrical impedance analysis, n = 195 M and 227 F.
TABLE 9
Intercepts, slopes, and SEEs for regression of 4C fat-free mass SDS on individual fat-free mass SDS1
Predictor
Males (n = 245)2 Females (n = 259)2
Intercept SE Slope SE SEE Intercept SE Slope SE SEE
Total body water 0.009 0.013 0.985 0.013 0.20 20.002 0.009 0.987 0.009 0.15
DXA FFM 0.002 0.013 0.973 0.013 0.21 20.006 0.014 0.977 0.014 0.23
DXA arm FFM 0.003 0.033 0.864 0.032 0.51 20.014 0.030 0.881 0.030 0.48
DXA leg FFM 0.000 0.021 0.947 0.021 0.33 20.007 0.020 0.949 0.020 0.32
DXA trunk FFM 0.002 0.022 0.920 0.022 0.34 20.004 0.023 0.933 0.023 0.37
Height2/Z 20.012 0.030 0.911 0.030 0.42 20.012 0.029 0.901 0.029 0.44
1The 4C fat-free mass SDS regressed on each individual fat-free mass SDS. All slopes were significantly different from 1 (P , 0.05), except for total
body water and DXA fat-free mass in both sexes. DXA, dual-energy X-ray absorptiometry; FFM, fat-free mass; SDS, SD score; 4C, 4-component.2 For bioelectrical impedance analysis, n = 195 M and 227 F.
8 of 11 WELLS ET AL
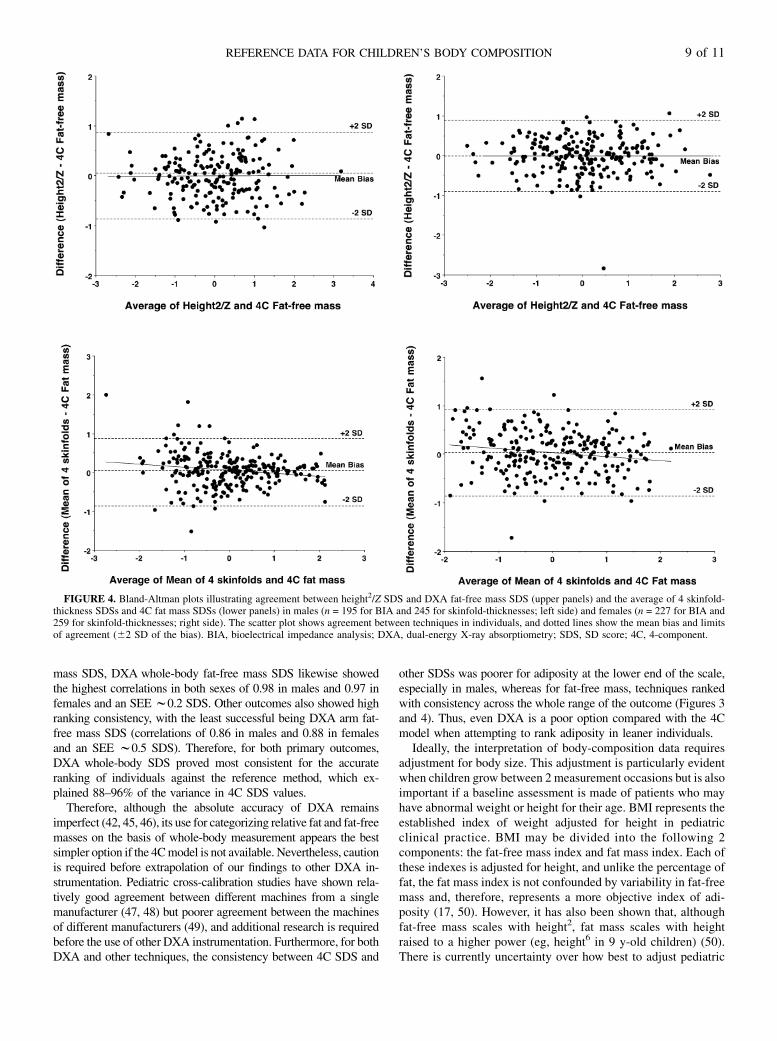
mass SDS, DXA whole-body fat-free mass SDS likewise showedthe highest correlations in both sexes of 0.98 in males and 0.97 infemales and an SEE w0.2 SDS. Other outcomes also showed highranking consistency, with the least successful being DXA arm fat-free mass SDS (correlations of 0.86 in males and 0.88 in femalesand an SEE w0.5 SDS). Therefore, for both primary outcomes,DXA whole-body SDS proved most consistent for the accurateranking of individuals against the reference method, which ex-plained 88–96% of the variance in 4C SDS values.
Therefore, although the absolute accuracy of DXA remainsimperfect (42, 45, 46), its use for categorizing relative fat and fat-freemasses on the basis of whole-body measurement appears the bestsimpler option if the 4Cmodel is not available. Nevertheless, cautionis required before extrapolation of our findings to other DXA in-strumentation. Pediatric cross-calibration studies have shown rela-tively good agreement between different machines from a singlemanufacturer (47, 48) but poorer agreement between the machinesof different manufacturers (49), and additional research is requiredbefore the use of other DXA instrumentation. Furthermore, for bothDXA and other techniques, the consistency between 4C SDS and
other SDSs was poorer for adiposity at the lower end of the scale,especially in males, whereas for fat-free mass, techniques rankedwith consistency across the whole range of the outcome (Figures 3and 4). Thus, even DXA is a poor option compared with the 4Cmodel when attempting to rank adiposity in leaner individuals.
Ideally, the interpretation of body-composition data requiresadjustment for body size. This adjustment is particularly evidentwhen children grow between 2 measurement occasions but is alsoimportant if a baseline assessment is made of patients who mayhave abnormal weight or height for their age. BMI represents theestablished index of weight adjusted for height in pediatricclinical practice. BMI may be divided into the following 2components: the fat-free mass index and fat mass index. Each ofthese indexes is adjusted for height, and unlike the percentage offat, the fat mass index is not confounded by variability in fat-freemass and, therefore, represents a more objective index of adi-posity (17, 50). However, it has also been shown that, althoughfat-free mass scales with height2, fat mass scales with heightraised to a higher power (eg, height6 in 9 y-old children) (50).There is currently uncertainty over how best to adjust pediatric
FIGURE 4. Bland-Altman plots illustrating agreement between height2/Z SDS and DXA fat-free mass SDS (upper panels) and the average of 4 skinfold-thickness SDSs and 4C fat mass SDSs (lower panels) in males (n = 195 for BIA and 245 for skinfold-thicknesses; left side) and females (n = 227 for BIA and259 for skinfold-thicknesses; right side). The scatter plot shows agreement between techniques in individuals, and dotted lines show the mean bias and limitsof agreement (62 SD of the bias). BIA, bioelectrical impedance analysis; DXA, dual-energy X-ray absorptiometry; SDS, SD score; 4C, 4-component.
REFERENCE DATA FOR CHILDREN’S BODY COMPOSITION 9 of 11

body-composition data for size (51), and therefore, our newreference data for the 4C fat-free mass index and fat mass indexrepresent a pragmatic preliminary attempt, which we intend toaddress further in future work.
A limitation of our study is that we were unable to extend theage range below 5 y. We have collected a large amount of isotopeand skinfold-thickness data from 6 wk to 4 y (52); however, thesedata were collected a decade earlier than those reported in thisarticle, and there is a poor statistical fit between the 2 data sets,most likely because of differential exposure to obesogenic envi-ronmental factors. Many patients who require body-compositionassessment are aged ,5 y; however, additional technical ad-vances are required before our approach can be applied in thisage range. A second limitation is that we were unable to includeall possible techniques (eg, MRI and total-body electrical con-ductivity) or instrumentation. Our Lunar DXA data may not beappropriate for the instrumentation of other manufacturers, andour BIA data were collected by using standing instrumentationin combination with foot plates and hand grips and, hence, willnot be entirely consistent with data collected from supine in-dividuals by using adhesive electrodes. However, standing BIAremoves a degree of interobserver error because it avoids theneed to place electrodes on anatomical landmarks. A thirdlimitation is that ethnic variability in our sample was not ade-quate to allow us to explore this issue in our analysis.
In conclusion, building on the pioneering work of Fomon andcolleagues on their original reference child (53), we have de-scribed the measurements available in our new reference data setand provided examples of how the data can be presented; thereare many alternative formats, and a large number of additionaldata are available from each of the 2-component techniques. Weanticipate that the most appropriate use of the reference data willvary in clinical and research settings. To facilitate the use of thereference data by clinicians and researchers, we intend to makethe data available through an Internet portal (http://www.ucl.ac.uk/ich/research-ich/nutrition), which will allow individual rawdata for each technique to be entered with age and sex data tocalculate SDSs (7). The graphs will also be available fordownload. Although for some purposes (eg, evaluation of car-diovascular risk), BMI SDS remains adequate for differentiatingclinical status (54, 55), growth charts that allow the partitioningof weight into its fat and fat-free components are likely to bevaluable for monitoring more-immediate effects of disease andresponses to treatment (16).
The authors’ responsibilities were as follows—JCKW, MSF, and TJC:
designed the study; JEW, DH, SC, KK, and CG-E: collected raw data;
JEW: modeled the data; CW: undertook all DXA scans; TD: undertook mass
spectrometric analysis; JCKW: undertook LMS analyses under the supervi-
sion of TJC; JCKW: conducted statistical analyses and wrote the first draft of
the manuscript; and all authors: contributed to revisions of the manuscript.
None of the authors had a conflict of interest.
REFERENCES1. TannerJM, Whitehouse RH. Revised standards for triceps and sub-
scapular skinfolds in British children. Arch Dis Child 1975;50:142–5.2. Tanner JM. Growth as a monitor of nutritional status. Proc Nutr Soc
1976;35:315–22.3. Tanner JM, Whitehouse RH. Clinical longitudinal standards for height,
weight, height velocity, weight velocity, and stages of puberty. ArchDis Child 1976;51:170–9.
4. TannerJM, Davies PS. Clinical longitudinal standards for height andheight velocity for North American children. J Pediatr 1985;107:317–29.
5. Wells JC, Fewtrell MS. Measuring body composition. Arch Dis Child2006;91:612–7.
6. Cole TJ, Freeman JV, Preece MA. Body mass index reference curvesfor the UK, 1990. Arch Dis Child 1995;73:25–9.
7. Cole TJ, Freeman JV, Preece MA. British 1990 growth referencecentiles for weight, height, body mass index and head circumferencefitted by maximum penalized likelihood. Stat Med 1998;17:407–29.
8. Lindgren G, Strandell A, Cole T, Healy M, Tanner J. Swedish pop-ulation reference standards for height, weight and body mass indexattained at 6 to 16 years (girls) or 19 years (boys). Acta Paediatr 1995;84:1019–28.
9. Luciano A, Bressan F, Zoppi G. Body mass index reference curves forchildren aged 3-19 years from Verona, Italy. Eur J Clin Nutr 1997;51:6–10.
10. Nysom K, Molgaard C, Hutchings B, Michaelsen KF. Body mass indexof 0 to 45-y-old Danes: reference values and comparison with pub-lished European reference values. Int J Obes Relat Metab Disord 2001;25:177–84.
11. Leung SS, Cole TJ, Tse LY, Lau JT. Body mass index reference curvesfor Chinese children. Ann Hum Biol 1998;25:169–74.
12. Davies PS, Day JM, Cole TJ. Converting Tanner-Whitehouse referencetricep and subscapular skinfold measurements to standard deviationscores. Eur J Clin Nutr 1993;47:559–66.
13. Cole TJ, Bellizzi MC, Flegal KM, Dietz WH. Establishing a standarddefinition for child overweight and obesity worldwide: internationalsurvey. BMJ 2000;320:1240–3.
14. Cole TJ, Flegal KM, Nicholls D, Jackson AA. Body mass index cutoffs to define thinness in children and adolescents: international survey.BMJ 2007;335:194.
15. Ahima RS. Adipose tissue as an endocrine organ. Obesity (SilverSpring) 2006;14(suppl 5):242S–9S.
16. Wells JC, Fewtrell MS. Is body composition important for paediatri-cians? Arch Dis Child 2008;93:168–72.
17. Wells JC. A critique of the expression of paediatric body compositiondata. Arch Dis Child 2001;85:67–72.
18. Addo OY, Himes JH. Reference curves for triceps and subscapularskinfold thicknesses in US children and adolescents. Am J Clin Nutr2010;91:635–42.
19. Moreno LA, Mesana MI, Gonzalez-Gross M, Gil CM, Ortega FB, FletaJ, Warnberg J, Leon J, Marcos A, Bueno M. Body fat distributionreference standards in Spanish adolescents: the AVENA Study. Int JObes (Lond) 2007;31:1798–805.
20. Chumlea WC, Guo SS, Kuczmarski RJ, Flegal KM, Johnson CL,Heymsfield SB, Lukaski HC, Friedl K, Hubbard VS. Body compositionestimates from NHANES III bioelectrical impedance data. Int J ObesRelat Metab Disord 2002;26:1596–609.
21. Kurtoglu S, Mazicioglu MM, Ozturk A, Hatipoglu N, Cicek B, Us-tunbas HB. Body fat reference curves for healthy Turkish children andadolescents. Eur J Pediatr 2010;169:1329–35.
22. Nakao T, Komiya S. Reference norms for a fat-free mass index and fatmass index in the Japanese child population. J Physiol Anthropol ApplHuman Sci 2003;22:293–8.
23. Alwis G, Rosengren B, Stenevi-Lundgren S, Duppe H, Sernbo I,Karlsson MK. Normative dual energy X-ray absorptiometry data inSwedish children and adolescents. Acta Paediatr 2010;99:1091–9.
24. van der Sluis IM, de Ridder MA, Boot AM, Krenning EP, de MuinckKeizer-Schrama SM. Reference data for bone density and body com-position measured with dual energy x ray absorptiometry in whitechildren and young adults. Arch Dis Child 2002;87:341–7.
25. Ogden CL, Li Y, Freedman DS, Borrud LG, Flegal KM. Smoothedpercentage body fat percentiles for U.S. children and adolescents,1999-2004. Natl Health Stat Report 2011;43:1–7.
26. Freeman JV, Cole TJ, Chinn S, Jones PR, White EM, Preece MA.Cross sectional stature and weight reference curves for the UK, 1990.Arch Dis Child 1995;73:17–24.
27. Chomtho S, Fewtrell MS, Jaffe A, Williams JE, Wells JC. Evaluationof arm anthropometry for assessing pediatric body composition: evi-dence from healthy and sick children. Pediatr Res 2006;59:860–5.
28. Racette SB, Schoeller DA, Luke AH, Shay K, Hnilicka J, Kushner RF.Relative dilution spaces of 2H- and 18O-labeled water in humans. AmJ Physiol 1994;267:E585–90.
10 of 11 WELLS ET AL

29. Haroun D, Wells JC, Williams JE, Fuller NJ, Fewtrell MS, LawsonMS. Composition of the fat-free mass in obese and nonobese children:matched case-control analyses. Int J Obes (Lond) 2005;29:29–36.
30. Murphy AJ, Wells JC, Williams JE, Fewtrell MS, Davies PS, WebbDK. Body composition in children in remission from acute lympho-blastic leukemia. Am J Clin Nutr 2006;83:70–4.
31. Fuller NJ, Jebb SA, Laskey MA, Coward WA, Elia M. Four-componentmodel for the assessment of body composition in humans: comparisonwith alternative methods, and evaluation of the density and hydrationof fat-free mass. Clin Sci 1992;82:687–93.
32. Wells JC, Fuller NJ, Dewit O, Fewtrell MS, Elia M, Cole TJ. Four-component model of body composition in children: density and hy-dration of fat-free mass and comparison with simpler models. Am JClin Nutr 1999;69:904–12.
33. Wells JC, Haroun D, Williams JE, Darch T, Eaton S, Viner R, FewtrellMS. Evaluation of lean tissue density for use in air displacementplethysmography in obese children and adolescents. Eur J Clin Nutr2011;65:1094–101.
34. Kiebzak GM, Leamy LJ, Pierson LM, Nord RH, Zhang ZY. Mea-surement precision of body composition variables using the lunar DPX-L densitometer. J Clin Densitom 2000;3:35–41.
35. VanItallie TB, Yang MU, Heymsfield SB, Funk RC, Boileau RA.Height-normalized indices of the body’s fat-free mass and fat mass:potentially useful indicators of nutritional status. Am J Clin Nutr 1990;52:953–9.
36. Bland JM, Altman DG. Statistical methods for assessing agreementbetween two methods of clinical measurement. Lancet 1986;1:307–10.
37. Fomon SJ, Haschke F, Ziegler EE, Nelson SE. Body composition ofreference children from birth to age 10 years. Am J Clin Nutr 1982;35(suppl):1169–75.
38. Wells JC, Williams JE, Chomtho S, Darch T, Grijalva-Eternod C,Kennedy K, Haroun D, Wilson C, Cole TJ, Fewtrell MS. Pediatricreference data for lean tissue properties: density and hydration fromage 5 to 20 y. Am J Clin Nutr 2010;91:610–8.
39. Butte NF, Hopkinson JM, Wong WW, Smith EO, Ellis KJ. Bodycomposition during the first 2 years of life: an updated reference. Pe-diatr Res 2000;47:578–85.
40. Wells JC, Mok Q, Johnson AW, Lanigan JA, Fewtrell MS. Energyrequirements and body composition in stable pediatric intensive carepatients receiving ventilatory support. Food Nutr Bull 2002;23(suppl):95–8.
41. Sullivan PB, Alder N, Bachlet AM, Grant H, Juszczak E, Henry J,Vernon-Roberts A, Warner J, Wells J. Gastrostomy feeding in cerebralpalsy: too much of a good thing? Dev Med Child Neurol 2006;48:877–82.
42. Wells JC, Haroun D, Williams JE, Wilson C, Darch T, Viner RM,Eaton S, Fewtrell MS. Evaluation of DXA against the four-component
model of body composition in obese children and adolescents aged5-21 years. Int J Obes (Lond) 2010;34:649–55.
43. Williams JE, Wells JC, Benden C, Jaffe A, Suri R, Wilson CM,Fewtrell MS. Body composition assessed by the 4-component modeland association with lung function in 6-12-y-old children with cysticfibrosis. Am J Clin Nutr 2010;92:1332–43.
44. Parker L, Reilly JJ, Slater C, Wells JC, Pitsiladis Y. Validity of six fieldand laboratory methods for measurement of body composition in boys.Obes Res 2003;11:852–8.
45. Gately PJ, Radley D, Cooke CB, Carroll S, Oldroyd B, Truscott JG,Coward WA, Wright A. Comparison of body composition methods inoverweight and obese children. J Appl Physiol 2003;95:2039–46.
46. Williams JE, Wells JC, Wilson CM, Haroun D, Lucas A, Fewtrell MS.Evaluation of Lunar Prodigy dual-energy X-ray absorptiometry forassessing body composition in healthy persons and patients by com-parison with the criterion 4-component model. Am J Clin Nutr 2006;83:1047–54.
47. Crabtree NJ, Shaw NJ, Boivin CM, Oldroyd B, Truscott JG. Pediatricin vivo cross-calibration between the GE Lunar Prodigy and DPX-Lbone densitometers. Osteoporos Int 2005;16:2157–67.
48. Pludowski P, Jaworski M, Matusik H, Kobylinska M, Klimek P, LorencRS. The evaluation of consistency between body composition assess-ments in pediatric population using pencil beam and fan beam dual-energy x-ray absorptiometers. J Clin Densitom 2010;13:84–95.
49. Pearson D, Horton B, Green DJ. Cross calibration of HologicQDR2000 and GE lunar prodigy for whole body bone mineral den-sity and body composition measurements. J Clin Densitom 2011;14:294–301.
50. Wells JC, Cole TJ. Adjustment of fat-free mass and fat mass for heightin children aged 8 y. Int J Obes (Lond) 2002;26:947–52.
51. Wells JC, Cole TJ. Disentangling the size and adiposity components ofobesity. Int J Obes (Lond) 2011;35:548–9.
52. Wells JC, Fewtrell MS, Davies PS, Williams JE, Coward WA, Cole TJ.Prediction of total body water in infants and children. Arch Dis Child2005;90:965–71.
53. Fomon SJ, Haschke F, Ziegler EE, Nelson SE. Body composition ofreference children from birth to age 10 years. Am J Clin Nutr 1982;35(5 suppl):1169–75.
54. Sun Q, van Dam RM, Spiegelman D, Heymsfield SB, Willett WC, HuFB. Comparison of dual-energy x-ray absorptiometric and anthropo-metric measures of adiposity in relation to adiposity-related biologicfactors. Am J Epidemiol 2010;172:1442–54.
55. Steinberger J, Jacobs DR, Raatz S, Moran A, Hong CP, Sinaiko AR.Comparison of body fatness measurements by BMI and skinfolds vsdual energy X-ray absorptiometry and their relation to cardiovascularrisk factors in adolescents. Int J Obes (Lond) 2005;29:1346–52.
REFERENCE DATA FOR CHILDREN’S BODY COMPOSITION 11 of 11
Related Documents


