REPORT A LIFE-CYCLE COST MODEL TO SUPPORT ASSET MANAGEMENT AT THE TWENTE CHANNEL Diruji Dugarte Manoukian CONSTRUCTION MANAGEMENT AND ENGINEERING FACULTY OF ENGINEERING TECHNOLOGY EXAMINATION COMMITTEE Dr. H. T. (Hans) Voordijk Prof. Dr. ir. A. G. (André) Doree Dr. ir. I (Irina) Stipanovic Gerry Waanders Dr. Ir. A. Martinetti DOCUMENT NUMBER PDENG FINAL PROJECT REPORT - 2016

Welcome message from author
This document is posted to help you gain knowledge. Please leave a comment to let me know what you think about it! Share it to your friends and learn new things together.
Transcript
REPORT
A LIFE-CYCLE COST MODEL TO SUPPORT ASSET MANAGEMENT AT THE TWENTE CHANNEL Diruji Dugarte Manoukian CONSTRUCTION MANAGEMENT AND ENGINEERING FACULTY OF ENGINEERING TECHNOLOGY EXAMINATION COMMITTEE Dr. H. T. (Hans) Voordijk Prof. Dr. ir. A. G. (André) Doree Dr. ir. I (Irina) Stipanovic Gerry Waanders Dr. Ir. A. Martinetti
DOCUMENT NUMBER PDENG FINAL PROJECT REPORT - 2016


i
A Life-Cycle Cost Model to support asset management at the Twente Channel
__________________________________________________________________________________
PDEng Candidate Author Diruji Dugarte Manoukian Employee no. M7660076 Student no. s1612859 Organizational Institute University of Twente Faculty Construction Management & Engineering Trajectory Professional Doctorate in Engineering (PDEng) Civil Engineering Case study organization Gemeenschappelijk Havenbeheer Twentekanaal Examination committee Director PDEng program Dr. H. T. (Hans) Voordijk Professor responsible chair Prof. Dr. ir. A. G. (André) Doree Supervisor at University of Twente Dr. ir. I (Irina) Stipanovic Supervisor at GHT Gerry Waanders Expert from other research chair Dr. Ir. A. Martinetti Rapport Status Final Date 22nd September 2016 __________________________________________________________________________________

ii

iii
Preface This report is the result of 2 years work on my final project. It is the final step in finishing my PDEng degree at the University of Twente. Along this journey, I have had the opportunity to get to know many people. All of them have influenced me either personally or professionally; sometimes even both.
I would like to thank my supervisors in this project. I would like to thank Professor Andre Doree for giving me the chance to pursue this degree. I know we had to deal with many challenges, and I am glad we have overcome all of them with success. I would like to thank Irina for the professional supervision and support provided since the start of my studies. You taught me principles of asset management and guided me in their implementation in my project. I also appreciate the nice chats we had in the coffee corner and for introducing me to the Batavieren race. I would like to show my deepest gratitude to Gerry Wanders for educating me on how the “real world” asset management really happens. I appreciate your enthusiasm in supporting me in this project.
I would like to thank those that supported me in developing my project. I would like to thank Louis Fikkert for all the time you dedicated to understand how asset management works at the municipalities. I would also like to thank Robin, Saad, Andreas Hartmann, Hans Voordijk, Robert Amor and Seirgei for all the valuable help and knowledge you gave me during this learning process. I specially would like to thank Yolanda and Jackelin for your technical and emotional support. I always felt you were there for me, for which I am very grateful.
I would like to thank all the new friends I made in this two years. Thank you Carissa, Ruth, Marc, Fatima, Meisam, Hendric, Alex, Ibsen, Camilo, Frank, Pinnie; the best fishes ever. Thanks to the old fishes for incorporating me into your social activities from day 1, and thanks to the new fishes for keeping as part of your new group. I would like to specially thank Julieta and Leo for your friendship. We shared many special moments together both inside and outside the University.
I would like to thank my family. Thanks to my family in Venezuela for all the love and support you always have given me. Los quiero y extraño mucho. Also thanks to my new family here in The Netherlands. Thanks for always being there for me.
Finally, I would like to thank my husband and my two beautiful kids, Nicolas and Julieta. I love you from the bottom of my heart. Juan, there are no words to describe how thankful I am with you. Thank you for being my love and my best intellectual experience. We have become beautiful stones along these years together. Te amo Lindo!
Diruji Dugarte Manoukian Enschede, 22nd September 2016.

iv

v
Management Summary The Twente Channel is a 65 kilometers long nautical infrastructure and water body in the east of the Netherlands that serves transportation and recreation functions. Coordinating and managing properly its assets is of high importance, as this assures the well-functioning of the companies operating their business in it. The Twente Channel extends over five different municipalities of the Twente region. Each municipality manages its own Twente Channel assets separately. This situation has become a bottleneck to fully exploit the business opportunities of this channel. In order to improve this situation, the municipalities involved in the Twente Channel have set-up a new company, the Gemeenschappelijke Havenbeheer Twentekanalen (GHT), to manage the assets in the Twente Channels in an integrated way. In this context, this PDEng project developed a Life-Cycle Cost (LCC) model to support the GHT Company in deciding on how to allocate efficiently and effectively resources for managing the harbor infrastructure. Table 1 shows the different development phases underwent to realize this project.
Table 1: Process model
Problem definition Requirements &
System definition
Design
Demonstrator Conclusion/
Recommendation -Review of documentation -Literature study -Interviews -Problem statement -Project context
-System requirements -Function analysis
-LCC model design -Taxonomy design & evaluation -Database design
-Case study: LCC of quay walls
-Satisfaction -Contribution -Further development
Chapters 1 Chapter 2 Chapter 3,4 & 5 Chapter 6 Chapter 7
The first phase of this project consisted in understanding the challenges of GHT Company by reviewing the documentation of the asset management activities currently performed by the municipalities and having interviews with the asset managers. The results of this phase are documented in Chapter 1.
The second phase of this project consisted in defining the requirements for implementing LCC at the GHT successfully. In order to do, interviews were performed to understand the current decision making process. The results were used to produce storytelling’s describing the functionalities that a support tool integrating the LCC model should have in order to support decisions makers appropriately during the asset management and maintenance processes. This tool has been termed the Asset Management Support (AMS) Tool. The key functions of the model and how it should be embedded into the current IT infrastructure were defined. It is concluded that in order to successfully implement LCC for asset management at the GHT company, it is required to (1) standardize the structure of the asset data such that all asset managers intuitively understand it; (2) integrate the model to the existing IT infrastructure at the municipalities; (3) base the LCC calculations on Net Present Value concept such that proper value comparisons can be made; and (4) provide the possibility to assess different asset management and maintenance strategies to enable decision making at the tactic and strategic levels. The results of determining the requirements are documented in Chapter 2.
The third phase of this project consisted on (1) designing the LCC model to support asset managers of the GHT Company. The scope of the LCC model includes the costs of the assets in the infrastructure of harbors and it does not include the environmental impact. The LCC model calculates the Net Present

vi
Value by considering the construction cost, the maintenance and operational costs and the end-of-life cost. (2) developing the taxonomy of the elements present in the Twente Channel and their properties; (3) designing a database architecture to enable integrating the LCC model to the database systems already in place at the municipalities involved. The results of this phase is documented in Chapter 3 (taxonomy), Chapter 4 (database architecture) and Chapter 5 (LCC model).
The fourth phase demonstrates the application of the LCC model to the quay wall case. It was developed by first implementing a cost model for the quay walls and then performing calculations for three different maintenance scenarios. The model was also used to make a sensitivity analysis to determine the importance of different maintenance operations on the Net Present Value of a quay wall. The results of this phase are documented in and Chapter 6 (demonstrator).
The calculation performed in the demonstrator probe the benefits of implementing LCC to improve decision making at strategic, tactic and operational levels. Therefore, the final recommendation to the company is to implement the LCC model here developed.
vii
Product Summary The project fulfills the criteria given in the PDEng program (PDEng study guide CE), as described here.
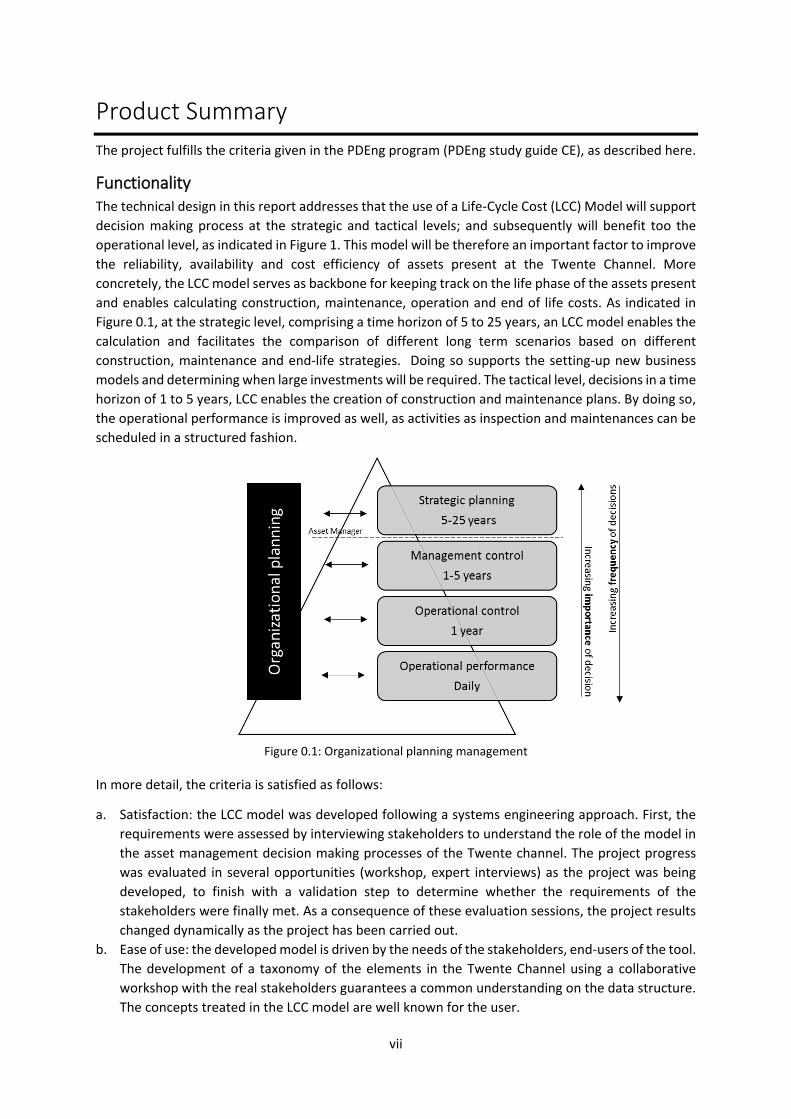
Functionality The technical design in this report addresses that the use of a Life-Cycle Cost (LCC) Model will support decision making process at the strategic and tactical levels; and subsequently will benefit too the operational level, as indicated in Figure 1. This model will be therefore an important factor to improve the reliability, availability and cost efficiency of assets present at the Twente Channel. More concretely, the LCC model serves as backbone for keeping track on the life phase of the assets present and enables calculating construction, maintenance, operation and end of life costs. As indicated in Figure 0.1, at the strategic level, comprising a time horizon of 5 to 25 years, an LCC model enables the calculation and facilitates the comparison of different long term scenarios based on different construction, maintenance and end-life strategies. Doing so supports the setting-up new business models and determining when large investments will be required. The tactical level, decisions in a time horizon of 1 to 5 years, LCC enables the creation of construction and maintenance plans. By doing so, the operational performance is improved as well, as activities as inspection and maintenances can be scheduled in a structured fashion.
Figure 0.1: Organizational planning management
In more detail, the criteria is satisfied as follows:
a. Satisfaction: the LCC model was developed following a systems engineering approach. First, the requirements were assessed by interviewing stakeholders to understand the role of the model in the asset management decision making processes of the Twente channel. The project progress was evaluated in several opportunities (workshop, expert interviews) as the project was being developed, to finish with a validation step to determine whether the requirements of the stakeholders were finally met. As a consequence of these evaluation sessions, the project results changed dynamically as the project has been carried out.
b. Ease of use: the developed model is driven by the needs of the stakeholders, end-users of the tool. The development of a taxonomy of the elements in the Twente Channel using a collaborative workshop with the real stakeholders guarantees a common understanding on the data structure. The concepts treated in the LCC model are well known for the user.

viii
c. Reusability: The developed LCC model can be used at municipalities and institutions that are responsible for management of infrastructure in the harbors (owners of the assets), as well as in the industrial areas in the Netherlands due to the similarities of assets and management processes.
Construction a. Structuring: During the construction of the model three main elements were considered:
a. An inventory of the assets present at the Harbors, which are under the responsibility of the Gemeenschappelijke Havenbeheer Twentekanalen (GHT). This inventory was translated into a tailored taxonomy of their assets. This taxonomy structures the assets at the database system in order to support the LCC Model with better and reliable data.
b. A database system that feeds the LCC model with structured data in order to make the calculations. The processes made at the operational levels, will be registered in order to make a historical data where the LCC tool can based its analysis providing then better results.
c. A LCC Model that is designed based on the elements of interest of this industry area (Construction, Maintenance, Operation and End-of-life) and, the relevant costs related to these elements.
b. Inventively: Interviews with asset managers revealed that currently the asset management and maintenance operations are performed in a reactive way. This means, the municipalities wait for the asset to show deterioration before performing any repair operation. The use of LCC to prepare strategies and investments plans in a structure fashion is in the context of the Twente Channel new, as none of the municipalities are currently applying it.
c. Convincingness: The demonstrator developed in this project shows the comparison between three different strategic plans, each one with different maintenance and end of life strategies. Furthermore, a sensitivity analysis shows which costs elements are more sensitivity to uncertainties and changes. The results are realistic and show clearly how the use of the tool facilitates assessing different investments scenarios.
Realizability a. Technical realizability: The model developed can be realized without facing major technological
challenges. The analysis of the current database systems at the municipalities and the design of a new database system architecture was performed with the goal that he developed LCC model can be implemented given the IT systems currently in place.
b. Economical realizability: A cost-benefit analysis of implementing the LCC at the GHT Company has not been calculated. Yet, the economic realizability draws from the fact that:
• The municipalities in the Twente channel already have databases system that can be used to extract the required date for making the LCC calculations.
• The asset managers and engineers are knowledgeable on this aspects. • The implementation of the model can be done using existing platforms used by asset
managers and planners at the municipalities.
Impact a. Societal impact: The proper management and maintenance of the asset enables long term cost
savings while maintaining the functioning of the Channel with a higher certainty. As a consequence, the business along the channel can improve their competitiveness and new business can be settled. This has the potential to create new jobs and improve the economic

ix
position of the Twente region. Furthermore, by tracking the LCC of the assets, accidents can also be prevented. The tool also reduces probabilities of accidents. Etc.
b. Risks: The risks of implementing the LCC model are related to the ability of the GHT Company to accurately estimate the construction, maintenance and end of live costs. Making wrong calculations may result in selecting the wrong asset management strategy, which can have long term economic impact on the GHT Company. The LCC model cannot be used for making very accurate budgets but rather to study the best option in relation with the total possible costs. The outcomes are highly depended of the independent variable which are to be fed by the operational system. Once this processes are improved, the cost benefits will be bigger and more accurate.

2
3
Table of Contents
Preface .......................................................................................................................................... iii
Management Summary................................................................................................................... v
Product Summary ......................................................................................................................... vii
Functionality ..................................................................................................................................... vii
Construction ..................................................................................................................................... viii
Realizability ...................................................................................................................................... viii
Impact .............................................................................................................................................. viii
Table of Contents ............................................................................................................................ 3
List of Abbreviations ....................................................................................................................... 5
List of Figures .................................................................................................................................. 7
List of Tables ................................................................................................................................... 8
1 Project Context ....................................................................................................................... 9
1.1 Asset Management ................................................................................................................. 9
1.2 Life-Cycle Cost ....................................................................................................................... 10
1.3 Context Description .............................................................................................................. 11
1.4 GHT Business characteristics ................................................................................................ 13
1.5 Project objectives .................................................................................................................. 14
1.6 Development Methodology & report Overview ................................................................... 14
2 Requirements analysis & system definition ........................................................................... 17
2.1 Overview on Use Cases, Storytelling and Functional Requirements .................................... 17
2.2 Interviews Preparation ......................................................................................................... 18
2.3 Outcome from interviews ..................................................................................................... 19
2.4 Use cases, Storytelling and Requirements ............................................................................ 22
2.5 Summary of system requirements ........................................................................................ 24
3 Design of the Life Cycle Cost Model ....................................................................................... 27
3.1 Life-Cycle Cost (LCC) .............................................................................................................. 27
3.2 LCC for infrastructural projects ............................................................................................. 28
3.3 LCC model for infrastructure at the harbor in the Twente Channel ..................................... 29
3.4 Construction costs................................................................................................................. 30
3.5 Maintenance costs ................................................................................................................ 31
3.6 Operational costs .................................................................................................................. 32
3.7 End-of-life costs .................................................................................................................... 33

4
3.8 Conclusions ........................................................................................................................... 34
4 Taxonomy design and evaluation .......................................................................................... 35
4.1 Taxonomy design process ..................................................................................................... 35
4.2 Taxonomy .............................................................................................................................. 35
4.3 Evaluation ............................................................................................................................. 38
4.4 Conclusions ........................................................................................................................... 41
5 Database design .................................................................................................................... 43
5.1 Analysis of existing database architecture at the municipalities .......................................... 43
5.2 New database architecture ................................................................................................... 45
5.3 Database design .................................................................................................................... 47
5.4 Conclusion ............................................................................................................................. 48
6 Demonstrator of LCC Model .................................................................................................. 51
6.1 Case Study: Quay walls ......................................................................................................... 51
6.2 LCC model applied to the steel sheet pile wall ..................................................................... 51
6.3 LCC model implementation .................................................................................................. 55
6.4 Scenario analysis ................................................................................................................... 56
6.5 Sensitivity Analysis ................................................................................................................ 60
6.6 Discussion of sensitivity results............................................................................................. 62
6.7 Conclusions ........................................................................................................................... 63
7 Conclusions & Recommendations .......................................................................................... 65
References .................................................................................................................................... 67
Appendix I: Cost data from Twente Channel ................................................................................. 69
Appendix II: LCC demonstrator calculations .................................................................................. 73
Original scenario cost ........................................................................................................................ 73
COST – Sensitivity on scenario 2: ...................................................................................................... 73
FREQUENCY – Sensitivity on scenario 2: ........................................................................................... 76

5
List of Abbreviations
(LCC) Life-Cycle Cost
(GHT) Gemeenschappelijk Havenbeheer Twentekanalen Company
(AMS) Asset Management Support
(GIS) Geographic information system
(DB) Database
(ER) Entity-Relationship
(UML) Unified Modeling Language

6
7
List of Figures Figure 0.1: Organizational planning management ............................................................................... vii Figure 1.1: Hierarchical structure of asset management activities ...................................................... 10 Figure 1.2: The Twente Channel and its harbors. ................................................................................. 11 Figure 1.3: Schematic representation of organizational structure of the Twentekanaal .................... 12 Figure 1.4: Design process overview: phases, efforts and milestones ................................................. 14 Figure 2.1: General Asset Management policy delivered by the municipality of Hengelo .................. 19 Figure 2.2: Decision making hierarchy and actors. ............................................................................... 20 Figure 2.3: GHT System architecture of the Asset Management Tool (AMS) ....................................... 25 Figure 2.4: The integrated v-model [8] ................................................................................................. 25 Figure 3.1: LCC framework for Twente channel ................................................................................... 30 Figure 4.1: Formulated taxonomy. .................................................................................................... 36 Figure 4.2: (a) Harbor in Hengelo Twente Channel. (b) Harbor at the Twente Channel.. .................... 37 Figure 4.3: Roadway along the Twente Channel .................................................................................. 37 Figure 4.4: Vegetation at the Twente Channel .................................................................................... 37 Figure 4.5: Example of industrial furniture. .......................................................................................... 37 Figure 4.6: The stakeholder in the brainstorming process during the workshop. ............................... 38 Figure 4.7: Team taxonomy design ....................................................................................................... 39 Figure 4.8: Harbor Manager taxonomy design ..................................................................................... 39 Figure 4.9: Presentation and discussion of my taxonomy .................................................................... 40 Figure 4.10: Final taxonomy developed with the stakeholder of the Twente Channel. ...................... 42 Figure 5.1: Database Architecture of the municipality of Hengelo. ..................................................... 44 Figure 5.2: The operation schema of the internal and external clients of the Data Store Hengelo. .... 45 Figure 5.3: GeoBasis working system. .................................................................................................. 45 Figure 5.4: New database architecture for the municipality of Hengelo. ............................................ 46 Figure 5.5: New Database structure for the GHT. ................................................................................ 47 Figure 5.6: Entity-Relationship model................................................................................................... 48 Figure 5.7: UML Class Model................................................................................................................ 50 Figure 6.1 Corrosion on a sheet pile used in a quay wall...................................................................... 53 Figure 6.2: Cathodic protection for quay walls made of steel sheet piles ............................................ 54 Figure 6.3 Anticorrosion protective coating ......................................................................................... 55 Figure 6.4 Cement coating on air exposed part of the sheet pile structure ......................................... 55 Figure 6.5 Example of a cofferdam for performing preventive maintenance to a quay wall .............. 55 Figure 6.6: Input User Interface of the demonstrator tool for the use case of quay walls. ................. 56 Figure 6.7: Investment pattern for scenario 1: corrective policy ......................................................... 58 Figure 6.8: Investment pattern for scenario 2: preventive policy ........................................................ 58 Figure 6.9: User delay costs for each scenario ..................................................................................... 59 Figure 6.10 LCC calculations. ................................................................................................................. 59 Figure 6.11: Results of sensitivity analysis ............................................................................................ 61

8
List of Tables Table 4.1: Comparison of taxonomies .................................................................................................. 40 Table 6.1: Most common failures in steel sheet piles used in quays [9] .............................................. 51 Table 6.2: Costs used for scenario analysis ........................................................................................... 57 Table 6.3: LCC calculations for each scenario. ...................................................................................... 59 Table 6.4: KPIs for each scenario .......................................................................................................... 60 Table 6.5: Input values used for sensitivity analysis ............................................................................. 61 Table 6.6: Total maintenance costs (output parameters) .................................................................... 61
9
1 Project Context The existing infrastructure of a significant number of water channels in The Netherlands and beyond is deteriorated. It is therefore not surprising that many municipalities have too many harbors that are no longer attractive for businesses and that are more and more vacated. All across the Netherlands large efforts are undertaken to revitalize the infrastructure of the channels and its harbors, being the Twente Channel one of them and the subject of study in this development project.
In this context, the primary goal of this PDEng project is to develop a Life-Cycle Cost (LCC) model to support asset management decisions (construction, maintenance, operations and disposal) of the infrastructure of the Twente channel and its harbors. This model aims at supporting the Gemeenschappelijk Havenbeheer Twentekanalen (GHT) Company, which has been recently created to take over the asset management operations of the Twente channel, formerly in hands of the municipalities it is part of.
This Chapter presents first a short review on asset management and Life-Cycle Cost. Second, the current organizational changes at the Twente channel are explained together with the role of the new GHT Company. Lastly, the project objectives and development methodology is described.
1.1 Asset Management As it is described in [Pantelias et.al. 2009], asset management is a strategic approach to the optimal allocation of resources for the management, operation, maintenance and preservation of an infrastructure. It combines engineering and economic principles with sound business practices to support decision making at the strategic, network and project levels. It provides tools to facilitate a more organized, logical approach to decision-making. Thus, asset management provides a framework for handling both short- and long-range planning. Figure 1.1 shows how the activities for asset management are organized in different levels of aggregation. Systematizing asset management decisions requires organizations to formalize their processes according to this structure.
As Figure 1.1. shows, one of the key activities to consider is to have a clear data collection and data storage mechanism as well as having a well formalized list of the supported decision processes [Pantelias et.al. 2009]. In many cases, however, the data collection activities have not been designed specifically to support the decision processes inherent in asset management. As a result, the use of the aforementioned technologies has led agencies to collect large amount of data and create vast databases that have not always been useful or necessary for supporting decision processes. Further, good asset management decisions require a systematic integrated approach to project selection, analysis of trade-offs, resource optimization, programming, and budgeting, as presented in [Frangopol, et. al 2005]. This form of management relies on accurate asset inventory, inspection and condition assessment, shown in Figure 1.1. As described in [ASCE, 2014], experts of the public sector from government entities agree that LCC is an important tool that can improve the decision-making process. This is indicated in Figure 1.1., showing that LCC supports the asset management decision process. Yet, they highlight some barriers to the implementation of LCC at agencies. One is the lack of coordination between parties within their organization from the design to the operation stage. Another is that predicting future costs is extremely difficult for their organization. The ability for agencies to carry out LCC effectively and accurately is a critical component in making them useful in the decision-making and design process and survey results suggest a need for better tools, data and coordination.

10
In the context of this project, the afore described means that implementing an LCC model successfully depends on other factors besides thee model itself. More specifically, the infrastructure’s data related aspects as well as the types of decisions and activities taken by the managers (e.g. management, operation, maintenance and preservation) also need to be carefully considered.
Figure 1.1: Hierarchical structure of asset management activities
1.2 Life-Cycle Cost As concluded in the previous section, asset management decisions can be supported by an Life-Cycle Cost model. For the case of the Twente Channel, the managers need to make decisions on the acquisition and maintenance of many different assets. The initial investment cost of this type of infrastructure is generally well defined, and therefore, it is one key factor influencing the choice of assets given a number of alternatives from where to make a selection. However, this initial costs is only a portion of the total costs, as the activities performed for maintaining the asset in proper conditions during its whole life time (or life cycle, as it is commonly referred to) also represent an important investments that needs to be considered. Therefore, in order to improve the selection of the asset and improve the choice of activities required to keep it functioning properly, both the initial costs and the costs attributed to activities for maintaining the assets have to be taken into account and balanced one with another. This costs is regarded as the total cost of ownership, which for large capital goods -as the infrastructures present in the Twente channel and its harbors- is often far greater than the initial capital investments costs and can vary significantly between different alternative solutions to a given operational need. By considering the costs over the whole life-cycle of these assets, a sound basis is created for decision-making. This information allows to:
• Assess future investment requirements. • Make comparison analysis of different asset options. • Make comparison analysis on different maintenance policies (e.g. preventive vs. corrective). • Improve business models to anticipate future costs into the revenue models.
11
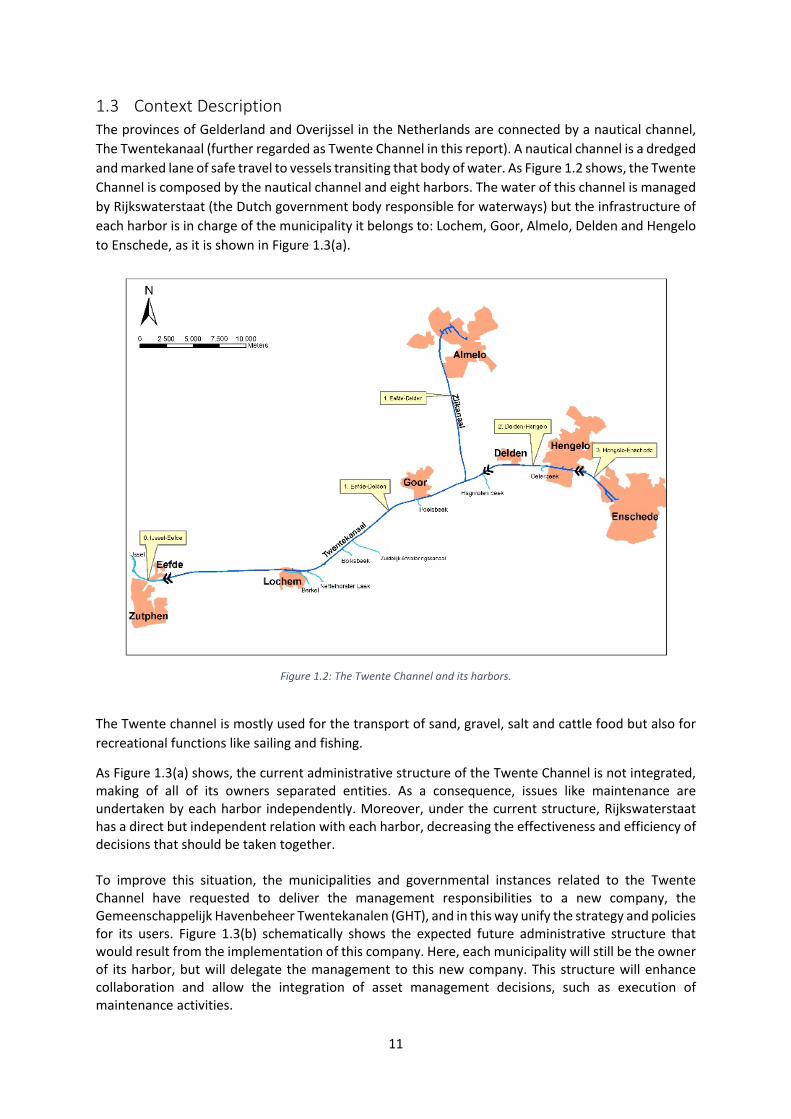
1.3 Context Description The provinces of Gelderland and Overijssel in the Netherlands are connected by a nautical channel, The Twentekanaal (further regarded as Twente Channel in this report). A nautical channel is a dredged and marked lane of safe travel to vessels transiting that body of water. As Figure 1.2 shows, the Twente Channel is composed by the nautical channel and eight harbors. The water of this channel is managed by Rijkswaterstaat (the Dutch government body responsible for waterways) but the infrastructure of each harbor is in charge of the municipality it belongs to: Lochem, Goor, Almelo, Delden and Hengelo to Enschede, as it is shown in Figure 1.3(a).
Figure 1.2: The Twente Channel and its harbors.
The Twente channel is mostly used for the transport of sand, gravel, salt and cattle food but also for recreational functions like sailing and fishing.
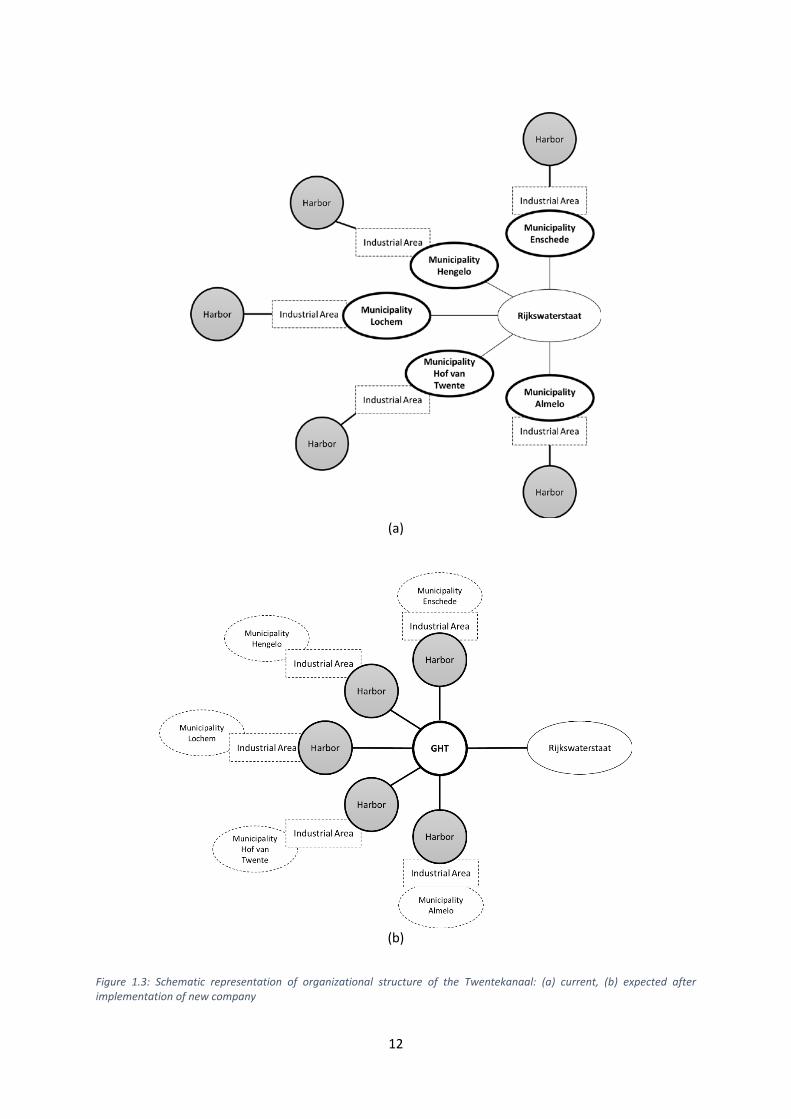
As Figure 1.3(a) shows, the current administrative structure of the Twente Channel is not integrated, making of all of its owners separated entities. As a consequence, issues like maintenance are undertaken by each harbor independently. Moreover, under the current structure, Rijkswaterstaat has a direct but independent relation with each harbor, decreasing the effectiveness and efficiency of decisions that should be taken together. To improve this situation, the municipalities and governmental instances related to the Twente Channel have requested to deliver the management responsibilities to a new company, the Gemeenschappelijk Havenbeheer Twentekanalen (GHT), and in this way unify the strategy and policies for its users. Figure 1.3(b) schematically shows the expected future administrative structure that would result from the implementation of this company. Here, each municipality will still be the owner of its harbor, but will delegate the management to this new company. This structure will enhance collaboration and allow the integration of asset management decisions, such as execution of maintenance activities.
12
(a)
(b)
Figure 1.3: Schematic representation of organizational structure of the Twentekanaal: (a) current, (b) expected after implementation of new company
13
1.4 GHT Business characteristics The harbors from the municipalities Hengelo, Almelo, Enschede, Hof van Twente and Lochem form one of the biggest inland harbors in The Netherlands. This inland harbors are an important component in the region as ‘logistic centrum’ in Northwest Europe. To achieve the desire to increase the water transport in the region, it seems to be necessary to professionalize the management of the harbors at the Twente canal. Therefore, these five municipalities have expressed the desire to unify in a centralized management method the physical and nautical tasks. In January 2014 the five municipalities have approved a development plan, which was to lead to the establishment of a cooperation in the short term. The requirements of the development plan are:
- A cooperation based on a feasible management model, - A central coordination and management of the basic tasks and accountable to the port
managers, - The uniformity / harmonization of some basic tasks and regulations and, - To perform centrally the basic tasks.
Based on the above mentioned points, the Gemeenschappelijk Havenbeheer Twentekanalen (GHT) was created. This company has the responsibility, among others, to manage the infrastructure of the Twente canal. The first steps of the GHT are:
- Setting up the organization, - Design and implement the basic tasks and, - Develop the cooperation towards a more independent company.
The mission of the GHT is:
“Through an effective and efficient development of its basic tasks, in a professional and sustainable method, facilitate an optimum accessibility, quality of life and reliability of the inland harbors and the water-related businesses along the Twente Channel”
The GHT has two types of goals. The first, business focused on the legitimacy of the GHT and the second, organization related to the development of the GHT optimally in order to make a contribution to the company's goals.
The main tasks of the GHT can be classify as follows:
- Nautical management tasks - Physical management tasks - Defend economic interests - Advisory councils and municipalities - Organizational tasks
In the context of this project, only physical management tasks are relevant to consider. The harbors must be equipped and maintained in order to fulfill the requirements of accessibility and safety of the users. Therefore, the GHT should ensure the adequate maintenance of the quays, quay walls and the soil (bottom) of the harbors. Based on this the multi-annual plans are developed. Among the organizational tasks, GHT is responsible for the establishment of long-term visions, the establishment and monitoring of central budget / accounts and the development of annual programs. Under the coordination and management of the port manager the multi-year programs are drawn up. The objective is to ensure proper coordination, timely maintenance of embankments, quay walls and harbor bottoms to ensure safe and accessible channels and harbors.

14
Being GHT a recently set-up company, it is essential for them to stablish an operational system. Therefore, it is important to equip the company with a unified system to manage and control the ownership, management and maintenance of the different components. In this context, this project will consider both the development of the LCC model and the aspects required for its implementation into the new GHT company structure.
1.5 Project objectives This project will develop a model to calculate the life-cycle costs (LCC) of the assets in the Twente Channel and determine how the GHT Company can make it operational and use it to make maintenance planning decisions. The objectives of this project can be formulated as follows:
1. Determine the purpose and application of an LCC model for the GHT Company. 2. Develop the LCC calculation model suiting their requirements. 3. Determine how to structure the asset data for the model in a logical way. 4. Determine how the GHT can implement the data storage system to feed the model. 5. Study the benefits of the model by implementing a demonstrator for a use case.
In agreement with the GHT Company, it has been decided that demonstrator will be implemented to the case study of quay walls, as this is the largest asset they will manage. One of the most important assets types present at the Twente channel.
1.6 Development Methodology & report Overview This project has been developed following a design approach that considers elements from systems engineering. Figure 1.4 describes the development process.
Figure 1.4: Design process overview: phases, efforts and milestones
15
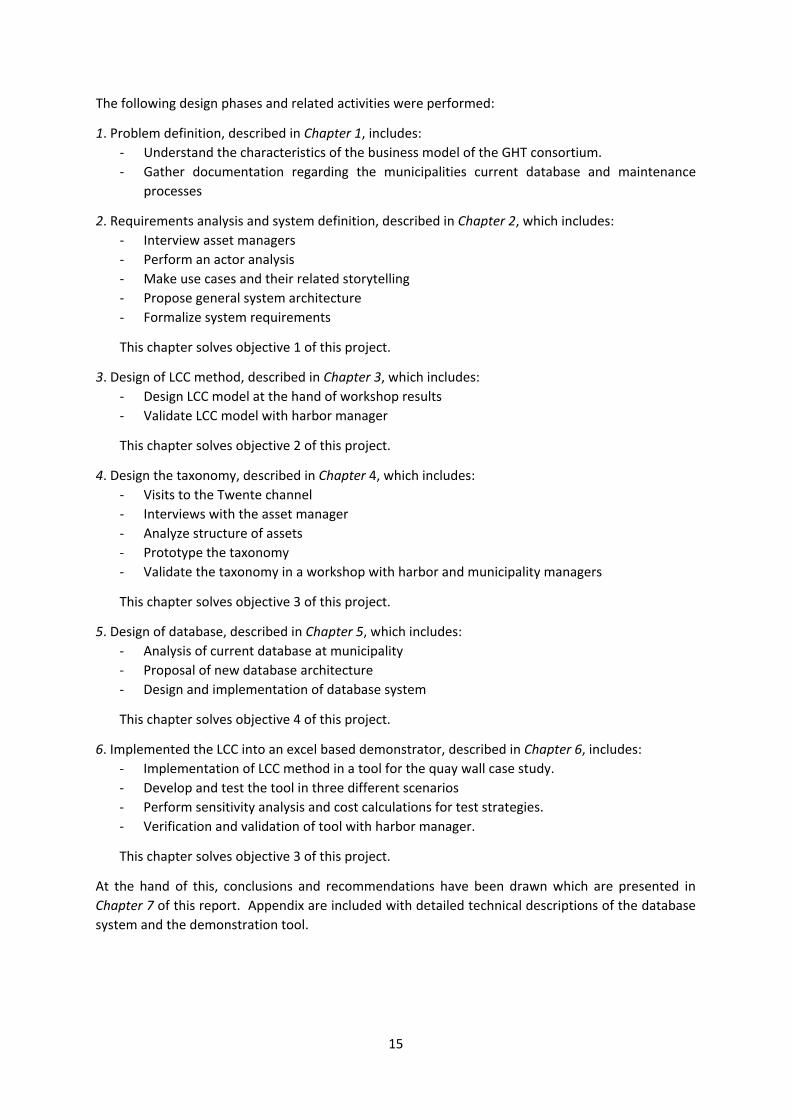
The following design phases and related activities were performed:
1. Problem definition, described in Chapter 1, includes: - Understand the characteristics of the business model of the GHT consortium. - Gather documentation regarding the municipalities current database and maintenance
processes
2. Requirements analysis and system definition, described in Chapter 2, which includes: - Interview asset managers - Perform an actor analysis - Make use cases and their related storytelling - Propose general system architecture - Formalize system requirements
This chapter solves objective 1 of this project.
3. Design of LCC method, described in Chapter 3, which includes: - Design LCC model at the hand of workshop results - Validate LCC model with harbor manager
This chapter solves objective 2 of this project.
4. Design the taxonomy, described in Chapter 4, which includes: - Visits to the Twente channel - Interviews with the asset manager - Analyze structure of assets - Prototype the taxonomy - Validate the taxonomy in a workshop with harbor and municipality managers
This chapter solves objective 3 of this project.
5. Design of database, described in Chapter 5, which includes: - Analysis of current database at municipality - Proposal of new database architecture - Design and implementation of database system
This chapter solves objective 4 of this project.
6. Implemented the LCC into an excel based demonstrator, described in Chapter 6, includes: - Implementation of LCC method in a tool for the quay wall case study. - Develop and test the tool in three different scenarios - Perform sensitivity analysis and cost calculations for test strategies. - Verification and validation of tool with harbor manager.
This chapter solves objective 3 of this project.
At the hand of this, conclusions and recommendations have been drawn which are presented in Chapter 7 of this report. Appendix are included with detailed technical descriptions of the database system and the demonstration tool.

16

17
2 Requirements analysis & system definition This chapter discusses the process of defining the purpose and application that the LCC model should have for the GHT Company. The idea is to define the model requirements by understanding the decision making processes of the asset managers. This chapter defines the LCC model as part of an Asset Management Support (AMS) tool to be used by the asset managers. By doing so, the LCC model is presented in a less abstract way, which simplifies the dialogue with different GHT stakeholders and facilitates the requirements formulation and later evaluation.
2.1 Overview on Use Cases, Storytelling and Functional Requirements This project applied Requirements Engineering [Dhirendra et al. 2010] technologies for determining the LCC model requirements. After gathering documents, interviewing stakeholders of my system and having held brainstorming sessions on how they envision the problem, I have decided to use the storytelling method for formalizing the requirements. The storytelling method has been used to collect and analyze empirical data about organizations, information systems and information system development [Madsen, 2009]. The goal is to identify the requirements of the stakeholder to provide an accurate design for the infrastructure management system I have to develop. Since my PDEng project is an information system development it seems appropriate to use this technique to find the systems requirements.
Storytelling is a logical process that everyone understands naturally [Madsen, 2009]. Relating what the system does to an understandable narrated story is more persuasive, and leads immediately to improving the process of gathering information and structuring requirements. Stories bring life to details in requirements, which are otherwise tedious to follow or to document and consequently might be lost [Boulila et al., 2011].
The elements of storytelling for requirements engineering [Boulila et al., 2011] are:
a. Conflict: is the basic problem to solve, is the central conflict to resolve in the requirements process. Use cases are commonly used to select the conflicts to be solved, and therefore narrated in a storytelling.
b. Theme: is the central concept underlying the solution. c. Setting: includes general information about the technology environment, business, industry and
economic conditions. d. Plot: is a series of processes that occur in the current and future system. e. Actors: are the characters, people, groups of people, machines or programs involved in the
problem and solution system. f. Point of view: consists of integrating different actor’s point of view.
Therefore, in order to apply storytelling successfully, it is important to determine the main stakeholders, perform interviews to understand their challenges and visions of the solutions, select a number of use cases that illustrate in a holistic way the challenges that need to be solved, and finally write the storytelling integrating all this information. Additionally, the storytelling needs to be validated with the stakeholders of the technological development process in order to assure that the later determined requirements are correct.

18
In line with this, this chapter reports on the following steps performed in my project for setting up the requirements:
1. Design and perform interviews 2. An actor analysis to determine how the different actors would interact with the system given their
roles and functions. 3. Analysis of use cases that the system has to be able to support 4. Storytelling, for each use cases based on the actor network, that describes how each actor
interacts with the system in the process of making decisions 5. Distill the requirements from each of the storytelling.
The chapter concludes with a selection of requirements to be addressed in this project, which aims a developing a demonstration level tool that will serve to determine the feasibility of applying a LCC model for improving asset management activities at the harbor.
2.2 Interviews Preparation In order to identify the principal users of the system and their tasks, I have held a total of 8 interviews: three with the Asset Manager, one with the database expert from the municipality of Hengelo and four with the manager of the GHT. These stakeholders were selected as they are currently also in charge of performing asset management operations at the harbors in their municipality. During these interviews, I was provided with substantial information, physically, verbally and graphically, that allowed me to understand the behavior of the channel and its harbors in general. The interviews were structured in two types of questions. The first set of questions targeted the harbor in general, while the second set focused on the quay walls, which have been chosen as specific asset type on which the LCC tool will be demonstrated.
In relation to the harbor, the following questions were made:
Q1: Which are the main asset management activities in the harbor?
Q2: Which are the main actors involved in performing these asset management activities?
Q3: Which are the assets you manage at the harbor?
Q4: Do you use LCC to determine asset management strategies?
As the goal of the tool is to set the focus on the asset management activities of the quay walls, the following specific questions were formulated:
Q5: Which are the main inspection, operations and maintenance activities usually performed on the quay walls?
Q6: Which are the main Key Performance Indicators (KPIs) used to assess the assets’ life cycle of the quay walls?
Q7: What information do you use to determine maintenance actions at the quay walls?
The interviews served to identify the processes they follow to make decision and plans for the short and long term projects at the harbor.
19
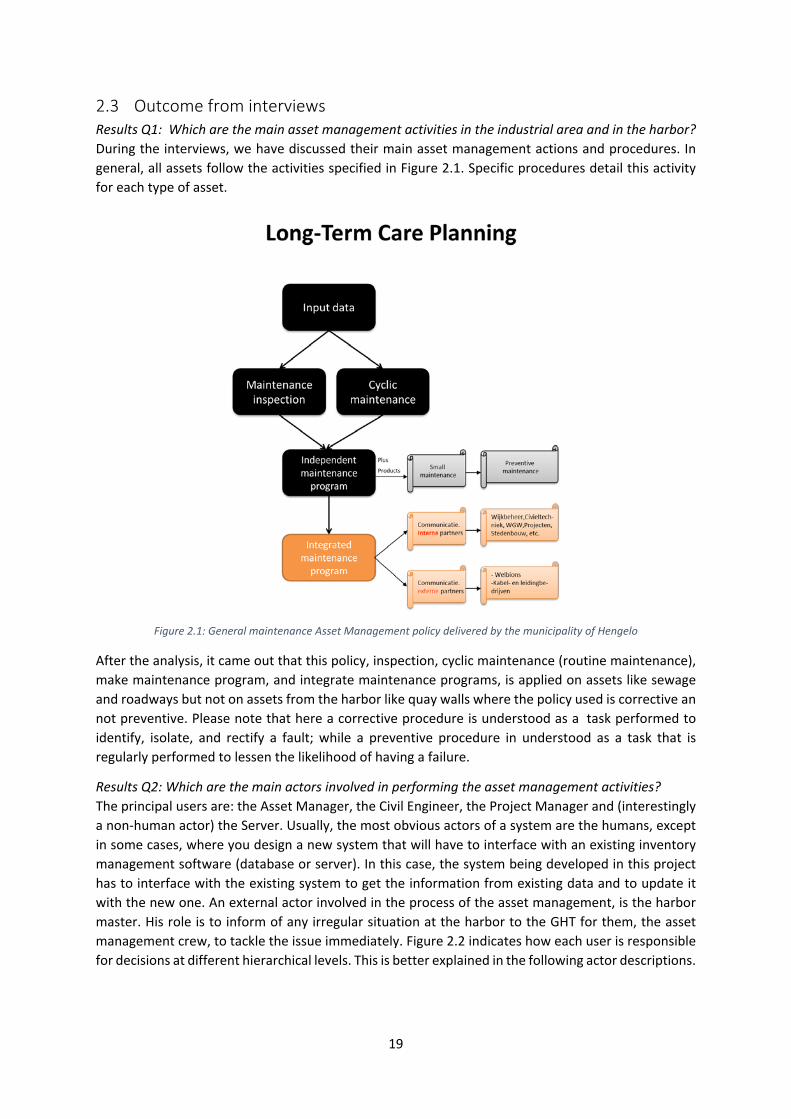
2.3 Outcome from interviews Results Q1: Which are the main asset management activities in the industrial area and in the harbor? During the interviews, we have discussed their main asset management actions and procedures. In general, all assets follow the activities specified in Figure 2.1. Specific procedures detail this activity for each type of asset.
Figure 2.1: General maintenance Asset Management policy delivered by the municipality of Hengelo
After the analysis, it came out that this policy, inspection, cyclic maintenance (routine maintenance), make maintenance program, and integrate maintenance programs, is applied on assets like sewage and roadways but not on assets from the harbor like quay walls where the policy used is corrective an not preventive. Please note that here a corrective procedure is understood as a task performed to identify, isolate, and rectify a fault; while a preventive procedure in understood as a task that is regularly performed to lessen the likelihood of having a failure.
Results Q2: Which are the main actors involved in performing the asset management activities? The principal users are: the Asset Manager, the Civil Engineer, the Project Manager and (interestingly a non-human actor) the Server. Usually, the most obvious actors of a system are the humans, except in some cases, where you design a new system that will have to interface with an existing inventory management software (database or server). In this case, the system being developed in this project has to interface with the existing system to get the information from existing data and to update it with the new one. An external actor involved in the process of the asset management, is the harbor master. His role is to inform of any irregular situation at the harbor to the GHT for them, the asset management crew, to tackle the issue immediately. Figure 2.2 indicates how each user is responsible for decisions at different hierarchical levels. This is better explained in the following actor descriptions.

20
Figure 2.2: Decision making hierarchy and actors.
The Server provides access to the information of the assets stored at the database. Each municipality has a server and its own database system. Therefore, each database of each municipality has a different taxonomy and has different policies on how to access the information and use it to manage the assets of the harbor and the channel. Section 4.1 of this report explains the existing system and its components in more detail. It is important to notice the significance that this system has in structuring the decisions that the different actors take.
The Harbor manager, is the director in charge of managing the business characteristics of the whole harbor. He is responsible for the infrastructure, for the business models and the staff. Therefore, he is responsible for making the strategic decisions of the harbor in the Twente Channel.
The Asset manager is the one that coordinates the activities to be performed at the municipality. This include the assets in the Industrial Park of the harbor. In dependence of the importance and urgency of a task, the budget is allocated. For the Asset Manager to accomplish an important task, he needs to support his decisions on the information stored at the municipality database. That means that the information stored at the Local Database after each accomplished task, has to be transferred to the Main Database with the most relevant information that will support decisions making processes.
The Asset Manager needs to check the yearly cyclic maintenance plan, to see what was done, how it went, and if there is any change related with a major plan that is about to be executed and what needs still to be done. Then he has to check the plans that are not related to a cyclic maintenance processes (like, for instance, a vegetation maintenance process) but to an asset life-cycle program control or an urgent maintenance procedure. He will decide, based on each asset life-cycle and actual conditions of an asset the priority relevance to allocate budget assigned for each task. Once he approves or rejects the tasks to be performed that month, he makes the timetable of activities and inputs it into the database system. This timetable will be the program the other users need to follow each month and it can suffer modification if an emergency occurs. The other users have the task to fill in the system with the current and accurate information while the Asset Manager analyzes it and converts it into a longer term vision.
The Civil Engineer is in charge of gathering and analyzing the technical information of an asset. His function is to inspect the real conditions of an asset. For that he needs to gather the information of its actual situation, analyze it together with the project manager and then input it into the data base system using the server. To do so, he checks the timetable to identify his tasks, extract the valuable information from the server and then proceed to execute them. After the inspection, he interacts one

21
more time with the system to give the input out of his inspection work. This input allows the Asset Manager and the Project Manager to take decisions about when and how will it be executed.
The Project Manager, on the other hand, is responsible for the proper execution of a task or project. He, as well as every user of the system, has to make the first interaction by checking the timetable to identify the tasks he has planned for the week and control then that the tasks will be performed as it should be happening. He is in charge of the tasks of a project and therefore he needs to control the project plan. To be able to deliver a good result after his management, he will analyze the information the civil engineer has gather but in a strategic process, like, how we should proceed, scheduling it, etc.
The harbor master is responsible for informing the mariners the issues related to safety on the harbor. They coordinate the emergencies, inspects the vessels and oversees pilotage services. He may request the vessels to use their integrated sensors to monitor the levels of the channels soil. He is also in charge of the local administrative procedures, like issuing fines, determining which vessels have priorities on the harbor, and eventually even contacting authorities to take over the handling of any offenders or incident once informed. Therefore, if an incident in relation to the infrastructure of the harbor happens, he is the first one to notice and notify the right authorities (e.g. engineering, asset managers, etc.).
Results Q3: Which are the assets you manage at the harbor? The assets that are present are: Roadway, Seaway, Railway, Vegetation, City furniture and Underground infrastructure.
Results Q4: Do you use LCC to determine asset management strategies? Currently, no LCC is being used for making strategic, technical and operational decisions on asset management at the harbor. Results Q5: Which are the main inspection, operations and maintenance activities usually performed on the quay walls? Regarding the general inspection activities, the harbor manager and the engineer perform visual inspections to the quay in general. They only inspect the visible part of the quay walls. The underwater ones requires close visual inspection under water, bathymetric survey and close visual diving inspection. These inspections are currently not being performed in a structured way. Currently, this kind of maintenance procedures are not in the hands of the municipality, as there is a specialized company in charge of maintaining the quay walls.
Regarding the operation activities, the principal activity is that the harbor master requests vessels at the harbor to make use of their sensors to monitor the state of the soil underwater.
Regarding the maintenance activities, there are no predetermined actions, as their current strategy is to make corrective maintenance whenever needed. Therefore, the nature of the maintenance depends on the nature of the damage.
Results Q6: Which are the main KPIs used to assess the assets’ life cycle of the quay walls? No KPIs are being used to assess the asset management decisions. No records are being kept. Results Q7: What information do you use to determine maintenance actions at the quay walls? Unfortunately, there no data is recorded and stored regarding asset life cycle. They have indicated that this is one of the key assets of the harbor, and that given an external party is currently in charge of its asset management, they would like to have knowledge and insights on how to do it themselves. They are specifically interested in knowing the financial impact of considering preventive

22
maintenance, given that currently only corrective maintenance is applied. Therefore, as part of my development, I will have to develop the model for calculating construction, preventive maintenance, corrective maintenance and end of life.
2.4 Use cases, Storytelling and Requirements At the hand of the previous actor analysis and their data exchange interaction with the current database, I have made a number of use cases that describe important and holistic real issues. I have used this use cases to develop storytelling formulating how the system actors and the AMS Tool should interact in the process of finding solutions. From here, the functional requirements of the tool implementing are specified. The shown use cases and storytelling have been verified with the Harbor manager, who has agreed that the problem components of the use cases as well as the expected actor-system interaction corresponds to their workflow.
2.4.1 Use case 1: Accessing to budget document from a movable server Principle Actor: Harbor manager Storytelling: The harbor manager has motivated a meeting with the five representatives of the municipalities that are part of the consortium to present a new project plan for the Twente Channel. During the meeting, the Harbor Manager realizes that one of the budget documents has errors. He thinks it may be a mistake. Therefore, he needs to access the system to check if the document he has printed out is the last version. His problem is that he is not sure if he will be able to get that document information through his movable server. The Harbor manager takes his mobile device and using an internet searching machine he visits the GHT website. Once in the website using his login name and password he enters into the system, there he goes to projects. In the project file he opens the file he is looking for and access to the last version in pdf. He successfully opens the documents and checks the information noticing that the ones he has are indeed the wrong ones. He send these documents to one of the municipality representatives through email where then, he send it to the printer.
Requirements: 1. The AMS tool is accessible via internet 2. The AMS tool provides access to project documentation 3. The AMS tool enables verification of documentation 4. The AMS tool enables users to send and receive specific documents.
2.4.2 Use case 2: collapse of a quay sidewalk Principle Actor: Asset Manager Storytelling: The GHT Company receives a call to report the collapse of a quay sidewalk. The Asset Manager was immediately informed of the situation. The asset manager contacts the engineer to check the damage. He asks for an analysis of the causes of the collapse. Concurrently, he access the database and assesses when the last time the system was inspected. He sees in the system that no inspection has been performed since construction to this part of the quay. Some days later, he gets a report from the engineer, containing pictures, stating that there is a hole in the sheet pile wall. This hole eroded internally the walls of the quay, which resulted in the collapse of sidewalk. The asset manager contacts the project manager to develop, together with the engineer, a repair plan. The project manager prepares a budget of this operation, and sends it to the asset manager for approval and for obtaining the financial resources to perform this action. The asset manager realizes that there is no LCC yet developed for the quay walls. He makes a meeting with the engineer to develop it setting the focus on inspection and assessment activities. Together, they decide on:
23
- Which are the inspection, preventive maintenance, corrective maintenance and end of life activities are required.
- Which are the time intervals between each inspection and assessment activity. - Which are all cost attributed to each activity.
These data is entered into the database and coupled to the LCC calculation engine. Once this is done, the asset manager access the LCC to develop scenarios based on different combinations of inspection, preventive and corrective maintenance to forecasts its costs. He compares the results to the repair costs of the current accident. He discusses the scenarios with the harbor manager. Based on this, he takes a decision on the new asset management policies of the quay, which consist of a new inspection time table and a new preventive maintenance timetable. The results are stored in the database. The harbor manager uses this new insights to redefine the business model to guarantee the competitiveness of the harbor.
Requirements: 5. The AMS tool supports in keeping the history of asset management activities performed for
each asset. 6. The AMS tool has an LCC model programed in a generic way, such that new LCCs of specific
assets can be modeled and introduced into the system. This guarantees the coevolution of the database system and the physical quay.
7. The AMS Tool supports in storing information on the database system about the assets, its properties and the activities required for inspection and maintaining them.
8. The AMS tool enables entering several scenarios concurrently to compare them to form a decision.
9. The AMS tool enables entering different scenarios based on different combinations of inspection, preventive maintenance and corrective maintenance.
10. The AMS tool calculates the net present value and future present value of the assets. 11. The AMS tool enables easy change of unit costs. 12. The AMS tool enables making sensitivity analysis in the process of forming scenarios.
2.4.3 Use case 3: Verification of task information Principal Actor: Engineer Storytelling: Early in the morning, the engineer was going for a cup of coffee when he received a call from the operation team at the Twentekanaal. He was informed that their task was coating the wall sheet piles from the quay but they were already coated. The engineer tells them to wait until he calls them back because he needed to check were the problem was. While the crew were waiting for the call, the engineer who doesn’t know where the problem can be, decides to access the system to verify the task information. He was already login in the system so, he was able to access quicker to the “timetable” where the tasks are allocated. He select the right date to see the task of that specific day. He sees there is a task related to the quay wall sheet pile name so he clicks on it to display the detailed information. He finds out that the task was not to coat the quay wall sheet pile but to make even the sand next to the wall sheet pile. He calls back to the operation team and explain the task assignment.
Requirements: 13. The AMS tool is used by the engineer to access data of the assets. 14. The AMS tool offers access to the asset management activities that need to be performed and
their schedule according to the LCC calculations. 15. The AMS tool offers the information in a structured way, such that all the actors can
understand it intuitively.
24
2.4.4 Use case 4: Reporting the excess of sand next to the quay wall Principal Actor: Harbormaster. Storytelling: In a normal day at the harbor, the captain of a container’s boat was trying to park on the quay as he regularly does when he notices there is something hampering him. He uses the boat’s sensor to measure the button of the water channel. The captain sees from the sensor outcomes that the level of sand is higher than it is supposed to be. He decides to make contact with the harbormaster to communicate the situation. The harbormaster explains to the captain that he will notify to the people in charge of the maintenance because he does not have the tools and specialized people to do that. The Captain accepts the explanation and the harbormaster offers a temporary solution which he has accepted. Then the Harbormaster proceeds to access the system to notify the situation with urgent character. To do so, he enters the system and displays the assets menu, there he select the harbor assets and look for the specific asset. Once he has found the asset he introduces in the comment the situation, and mark it as an urgent task. Then, the maintenance department gets the notification. From that moment, the whole team is aware that new directions will be assigned. The asset manager interrupts for a moment his work to call an engineer and delegate this responsibility. The engineer goes to the place and makes sure that it is repaired and that the outputs will be submitted in the system after the task is done.
Requirements: 16. The AMS Tool enables in determining inspection tasks for a given asset maintenance process 17. The AMS tool enables entering the results if an assessment task into the system for future
management decisions.
2.4.5 Use case 5: Planning a preventive maintenance operation Principal Actor: Project Manager Storytelling: The asset manager is able to assess on the tool which are the inspection and preventive activities for each of the assets. He realizes that the quay requires a special preventive maintenance operation. He contacts the project manager to ask him to make the operation plan. The project manager access the tool to check the characteristics of the activities to be performed. He also checks with the harbor master which vessels are planned on the coming weeks. Based on this, the project managers schedules the activities such that it disturbs passing vessels as little as possible. He continues performing his project management actions to plan this task.
Requirements: 18. The AMS Tool is able to provide an overview of the asset management activities for each asset
during the calculated life cycle. 19. The AMS Tool provides detailed information on the properties of a given activity.
2.5 Summary of system requirements As it has been described before, this project deals with the development of a conceptual solution for an Assess Management Support (AMS) Tool for the GHT Company. The GHT Company has been created with the goal of assuming asset management tasks for the whole Twente Channel, which includes the harbors and quays present at each of the municipalities present in this infrastructure. Two important realizations from the interviews in relation to this integrated solution can be formulated: (1) each municipality has its own asset taxonomy and they use their own processes to manage the infrastructure, and (2) none of municipalities makes a long term strategic plan for the management of the Twente channel infrastructure. Therefore, and as the use cases indicate, the AMS tool has three different types of requirements that need to be taken into account:

25
1. Requirements concerned with the LCC model and the calculations to be supported with it, 2. Requirements concerned with how the assets and their inspection data will be organized in
order to enable the LCC calculations. 3. Requirements concerned with how the AMS Tool will manage the data of the assets that is
already stored in local databases of each municipality.
Besides this three groups, there are other requirements that deal with how the data coming from inspections and assessments is input into the AMS tool and manipulations to the LCC model calculations that support decision making (e.g. sensitivity analysis). Therefore, the AMS tool has been structured in 2.5 different modules, each dealing with a different set of functional requirements, as it is shown in Figure 2.5. The requirements have been associated to each of the modules of the tool, as shown in Table 1.1.
Figure 2.3: GHT System architecture of the Asset Management Tool (AMS)
As this project is concerned with the development of the LCC model, only the requirements attributed to module 2, module 3 and module 4 are further taken into consideration. In this context, Chapter 3 describes an LCC model that satisfies the requirements for module 3, Chapters 4 and 5 describe the structure of the database required to satisfy the requirements for module 2, and Chapter 6 focuses on describing the demonstrator that fulfills the requirements of module 4. Furthermore, I have also made a plan to validate the requirements and check if they have been fulfilled in the project, based on the integrated v-model approach shown in Figure 2.6.
Figure 2.4: The integrated v-model [8]
26
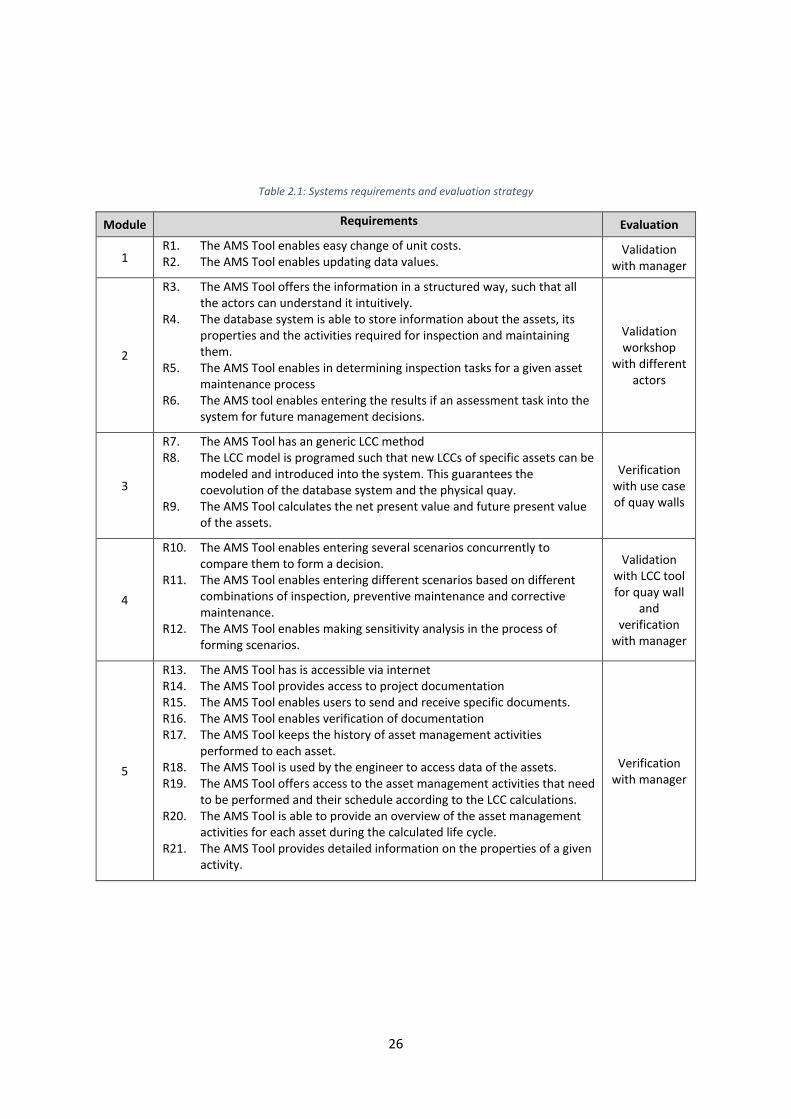
Table 2.1: Systems requirements and evaluation strategy
Module Requirements Evaluation
1 R1. The AMS Tool enables easy change of unit costs. R2. The AMS Tool enables updating data values.
Validation with manager
2
R3. The AMS Tool offers the information in a structured way, such that all the actors can understand it intuitively.
R4. The database system is able to store information about the assets, its properties and the activities required for inspection and maintaining them.
R5. The AMS Tool enables in determining inspection tasks for a given asset maintenance process
R6. The AMS tool enables entering the results if an assessment task into the system for future management decisions.
Validation workshop
with different actors
3
R7. The AMS Tool has an generic LCC method R8. The LCC model is programed such that new LCCs of specific assets can be
modeled and introduced into the system. This guarantees the coevolution of the database system and the physical quay.
R9. The AMS Tool calculates the net present value and future present value of the assets.
Verification with use case of quay walls
4
R10. The AMS Tool enables entering several scenarios concurrently to compare them to form a decision.
R11. The AMS Tool enables entering different scenarios based on different combinations of inspection, preventive maintenance and corrective maintenance.
R12. The AMS Tool enables making sensitivity analysis in the process of forming scenarios.
Validation with LCC tool for quay wall
and verification
with manager
5
R13. The AMS Tool has is accessible via internet R14. The AMS Tool provides access to project documentation R15. The AMS Tool enables users to send and receive specific documents. R16. The AMS Tool enables verification of documentation R17. The AMS Tool keeps the history of asset management activities
performed to each asset. R18. The AMS Tool is used by the engineer to access data of the assets. R19. The AMS Tool offers access to the asset management activities that need
to be performed and their schedule according to the LCC calculations. R20. The AMS Tool is able to provide an overview of the asset management
activities for each asset during the calculated life cycle. R21. The AMS Tool provides detailed information on the properties of a given
activity.
Verification with manager

27
3 Design of the Life Cycle Cost Model Life-cycle cost models for the management of infrastructure are used to predict, calculate and compare different maintenance options in order to choose the optimal one. Nowadays, there are still many companies both in the private and in the public-sector that have not implemented Life-Cycle Cost (LCC) methods to support their decisions making processes [David Woodward, 1997][ASCE, 2014]. For case of harbors, the LCC for maintenance has been less studied than for construction and maintenance of roads. Yet, the construction and maintenance of these assets requires increasingly more and more attention, to the managers, to improve the services at these areas. This chapter explains the LCC model I have made for the infrastructure management of the harbors. The LCC model is developed considering the following requirements of the AMS Tool:
R7.The AMS Tool has a generic LCC method
R9.The AMS Tool calculates the net present value and future present value of the assets.
First, an introduction to LCC is provided with a background description on its implementation to infrastructure projects and harbors. Secondly, the LCC model is presented and its components are detailed into specific cost calculations. To finish, conclusions are presented.
3.1 Life-Cycle Cost (LCC) Several advanced, data-driven economic analysis techniques, exist to help decision-makers in managing their assets. One type of analysis that is particularly used for reducing long-term cost is Life-Cycle Cost (LCC) [ASCE, 2014]. LCC, often performed at the preliminary engineering and planning phase, is a financial and economic tool that examines the up-front development and capital costs, discounted operating and maintenance costs, and end-of-life costs for an asset or project. It can help creating better allocation of sustaining capital for construction, operations, maintenance, and end-of-life procedures. LCC has been proven to create a short-term and long-term savings for transportation agencies and infrastructure owners by helping decision-makers identify the most beneficial and cost effective projects and alternatives. [ASCE, 2014]. LCC was first introduced into the transport decision-making process to help agencies determine the best pavement option for their project. Beyond its implications in the pavement design process, broader use of LCC in infrastructure projects has been limited. While there is widespread agreement among governmental agencies and the private sector that economic and financial analyses such as LCC should inform decision-making, in practice it has had little application [ASCE, 2014].
LCC applications aims at [ASCE, 2014]: • Helping to select the best alternative to meet a maintenance strategy objective • Evaluating a design requirement within a specific maintenance strategy • Comparing overall costs between different types of maintenance strategies to help prioritize
limited funding in an agency-wide program • Calculating the most-effective approaches to maintenance strategy implementation
LCC methods normally assume that future data is available, making options based on future costs and benefits (in regard to uncertainty levels) appropriate to use. However, and as indicated in [PIANC, 2008] (an extensive literature on harbor asset management as well as interviews with harbor personnel), LCC is relatively new for maintenance in harbors, and little has been published in this area, which means that there is a high level of uncertainty on the accuracy of such methods and therefore their validity for supporting asset management decisions. One source of uncertainty is the difficulty in determining the pay-back time, investment costs, operational costs, societal costs and environmental
28
considerations. Another is that long-term contracts imply uncertainties that have to be taken into account in the design phase, and it is there where most of the costs impact of the life-cycle are made.
The main uncertainty in the case of my project is the long-term perspective, which affects both degradation as well as uncertainties in future demands. The uncertainty and thereby variability in values used for different factors can cause large variability in the LCC model calculations, which in turn can have great impact on decision-making processes.
Therefore, I consider that the GHT should make the following considerations when implementing the LCC model as a bases for their asset management support tool:
1. The long term calculations, which rely on future uncertain data, should be considered as indicative rather than absolute. This also means that in order to determine medium and long term strategies, several scenarios considering different levels of uncertainties should be assessed concurrently and compared before making a decision. A powerful and well established method for doing this so is a sensitivity analysis.
2. Asset data should be updated regularly to assure that the calculations become more accurate with time. The afore mentioned analysis can provide insights in the importance of different variables and therefore can be also used to focus the reduction of uncertainty.
Furthermore, LCC calculations for medium and long term decisions should be performed regularly as well and modified according to the new results.
3.2 LCC for infrastructural projects LCC methods are used to explore the possibilities for more efficient investments, by considering the service life costs of an asset. Like in the case of the Twente Channel, the study of their costs allows them to optimize the investments in their infrastructure to offer a reliable service. There are two main types of costs, those directly related to the company (agency costs) and costs that are related to the users of it (non-agency costs).
Agency costs include: • Initial capital cost • Costs of maintenance, rehabilitation, renovation and reconstruction • Residual value at the end of the period (based on the remaining life) • Disposal costs • Engineering and administration costs • Cost of borrowing ( in the case that projects are no financed from current revenues)
Non-agency costs involve the user if the infrastructure or facility, and might include: • Occupancy time in or on the facility • Operating cost • Accidents cost • Time delays due to maintenance, rehabilitation, repair activities • Time delays due to under capacity
In LCC analysis of infrastructures, several types of analysis are often performed [Barringer et al 1996]: • Net Present value methods: NPV is an important economic measure for project or equipment
taking into account discount factors and cash flow. It is often used to determine long term profitability of a capital investment, and therefore, it is more suited for making strategic decisions than short term operational ones.
29
• Rate of return: Is a profit on an investment over a period of time expressed as a portion of the initial investment. NPV method enable easy calculations of ROR. It is usually used for short term investments.
• Benefit-costs analysis: Is a systematic approach to determine the weakness and strength of alternatives that satisfy transaction, activities or functional requirements for a business. They are mainly used when determining whether a new infrastructure should be placed or not.
It is important to notice that one of the limitations in implementing an LCC model to infrastructural projects is the difficulty to accurately predicting future costs, as it is subject to substantial estimating risks that can dramatically alter the calculated outcomes. Therefore, decision-makers should be aware that an LCC is not necessarily a foolproof prediction of the future. Regardless of the limitations, a deeper understanding of the benefits and costs over the complete life-cycle of an asset can provide better information to decision makers and help target limited funds to the most beneficial and cost effective projects.
The LCC model developed in this project focuses specially on maintenance, as this is the primary function of the GHT Company. The LCC should enable the exploration of different scenarios, each consisting of different combinations of maintenance and operational activities. Regarding the benefit and effectiveness variables, the Net Present Value approach is the most appropriate, as it enables managers in testing different scenarios and understanding its costs repercussion at the present moment of time [Gijt, 2011]. Furthermore, this value is well suited to make indicative analysis. While maintenance management is the prime tasks of the GHT, disposable and construction have also been considered in the model, as the harbor infrastructure has varying age and some of its assets are approaching the end of life point, which also results in new constructions. The construction costs provide the GHT with a comparative variable for determining to which extend maintenance is preferred over reconstruction and overhauling.
3.3 LCC model for infrastructure at the harbor in the Twente Channel The elements of interest were analyzed under the LCC technique proposed by Harvey, G. [Woodward, 1997]. This technique involves the study of all costs arising during the service life of an asset. In the harbor these costs include the construction cost, the maintenance and operational costs as well as the end-of-life cost. The scope of the study includes the costs of the assets in the infrastructure of harbors and it does not include the environmental impact. Once having the elements of interest and the scope defined, I have proceeded to estimate the mathematical expression that will display LCC the value of the assets. Figure 3.1 shows the LCC framework of the model here presented. These formulations were formalized in the following algorithms: for the total LCC of the asset at the Twente Channel it will be calculated with the sum of the Net Present Value of its elements of interest.
The formula is as follows:
𝑁𝑁𝑁𝑁𝑁𝑁 = ∑ 𝐶𝐶𝐶𝐶𝐶𝐶𝑛𝑛(1+𝑖𝑖𝑐𝑐𝑐𝑐𝑛𝑛)𝑛𝑛
+ ∑ 𝑀𝑀𝐶𝐶𝐶𝐶𝑛𝑛(1+𝑖𝑖𝑚𝑚𝑚𝑚𝑛𝑛)𝑛𝑛 + ∑ 𝑂𝑂𝑂𝑂𝐶𝐶𝑛𝑛
�1+𝑖𝑖𝑐𝑐𝑜𝑜𝑜𝑜�𝑛𝑛
𝑁𝑁𝐶𝐶=1
𝑁𝑁𝐶𝐶=1
𝑁𝑁𝐶𝐶=1 + ∑ 𝐸𝐸𝐸𝐸𝐸𝐸𝑛𝑛
(1+𝑖𝑖𝐸𝐸𝑐𝑐𝐸𝐸)𝑛𝑛𝑁𝑁𝐶𝐶=1 Equation 1
Where:
NPV = Net present Value (€) N = Period of calculation CnCn = Construction Cost in year n (€/year) icon = Discount rate for construction cost (%) MnCn = Maintenance Cost in year n (€) iman = Discount rate for maintenance cost (%)
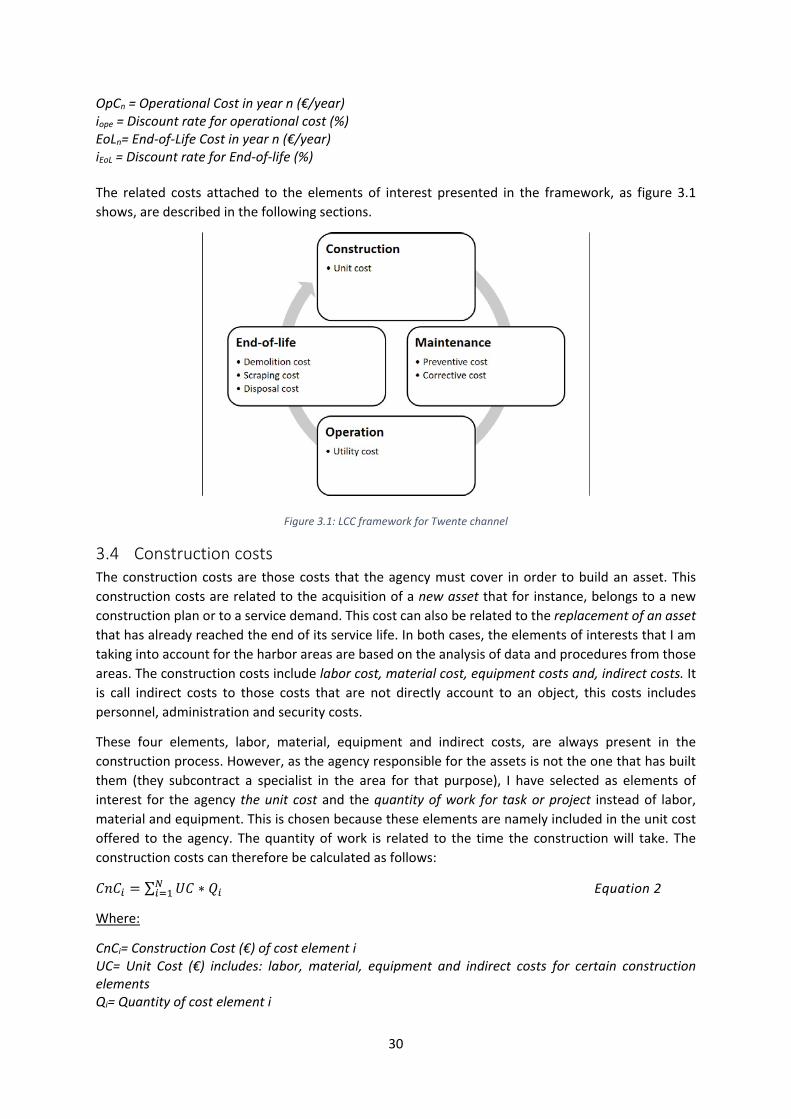
30
OpCn = Operational Cost in year n (€/year) iope = Discount rate for operational cost (%) EoLn= End-of-Life Cost in year n (€/year) iEoL = Discount rate for End-of-life (%) The related costs attached to the elements of interest presented in the framework, as figure 3.1 shows, are described in the following sections.
Figure 3.1: LCC framework for Twente channel
3.4 Construction costs The construction costs are those costs that the agency must cover in order to build an asset. This construction costs are related to the acquisition of a new asset that for instance, belongs to a new construction plan or to a service demand. This cost can also be related to the replacement of an asset that has already reached the end of its service life. In both cases, the elements of interests that I am taking into account for the harbor areas are based on the analysis of data and procedures from those areas. The construction costs include labor cost, material cost, equipment costs and, indirect costs. It is call indirect costs to those costs that are not directly account to an object, this costs includes personnel, administration and security costs.
These four elements, labor, material, equipment and indirect costs, are always present in the construction process. However, as the agency responsible for the assets is not the one that has built them (they subcontract a specialist in the area for that purpose), I have selected as elements of interest for the agency the unit cost and the quantity of work for task or project instead of labor, material and equipment. This is chosen because these elements are namely included in the unit cost offered to the agency. The quantity of work is related to the time the construction will take. The construction costs can therefore be calculated as follows:
𝐶𝐶𝐶𝐶𝐶𝐶𝑖𝑖 = ∑ 𝑈𝑈𝐶𝐶 ∗ 𝑄𝑄𝑖𝑖𝑁𝑁𝑖𝑖=1 Equation 2
Where:
CnCi= Construction Cost (€) of cost element i UC= Unit Cost (€) includes: labor, material, equipment and indirect costs for certain construction elements Qi= Quantity of cost element i

31
3.5 Maintenance costs The Maintenance costs are usually reflected when calculating an asset investment costs. The experience has shown that this cost element is pretty important when calculating the investment costs of a new project or task. It is thought that the most expensive part of an asset is its construction, however, maintenance costs of such assets are sometimes more expensive than the construction itself. When this situation is overlooked, the consequences can unbalance the performance of the agency. What LCC seeks is to identify these future costs to bring it to the present value so it can prevent failures in budgeting planning.
Therefore, the maintenance of the assets needs to be taken into consideration in the LCC. The agency’s responsibility is to offer timely and soundly services to its clients. Since the number of assets is huge the management of its maintenance must be well coordinated and must also flow as planned; any extra time for the maintenance work and unplanned costs will have an expensive consequence.
The elements that I have considered for this cost category are: Preventive Maintenance Costs and Corrective Costs. These two categories of costs are being separated because of their nature. Preventive costs are planned and performed in order to prevent any damage. While corrective costs is the type of maintenance performed as a correction to a certain damage.
When an incident happens, the costs are expected to be much higher than in the case of a planned maintenance procedure. This events cannot be prevented and the chances that any action may influence negatively to a third party are high.
Therefore I calculate these costs separately using the following equation:
𝑀𝑀𝐶𝐶𝐶𝐶𝑖𝑖 = ∑ (𝑁𝑁𝑃𝑃𝐶𝐶𝑖𝑖 + 𝐶𝐶𝑃𝑃𝐶𝐶𝑖𝑖)𝑁𝑁𝑖𝑖=1 Equation 3
Where MnCi=Maintenance Cost of cost element i PVCi=Preventive Cost of cost element i CvCi = Corrective Cost of cost element i 3.5.1 Preventive Maintenance Costs The preventive maintenance costs (PvC), intent to avoid any functional failure that may incur into a vast economic intervention. This kind of approach allows to organize a management plan for the assets improving the allocation of resources and ensuring better services to its clients. To calculate the Preventive Cost for the infrastructure in the harbors, I have included the following expenses:
The Maintenance cost, is the cost of executing the planned maintenance of an asset. The Unit of the Activity Cost (AC) includes: labor, material, inspection and equipment. All these costs depend on the asset condition and the Service Life Plan of the asset [EIC group, 2009] [Frangopol et al, 2005]. In order to support calculation of this costs a database is developed (see in Chapter 5) of typically preventive maintenance activities for each type of asset in the harbor, based on the experience and historical data.
User Delay Cost (UDC) are the expenses caused to third parts due the impediment of normal functioning. It will be calculated separately, to estimate the possible impact to third parties. These are the costs in money for the time a maintenance procedure will take until the normal course of functions in the area are restored, if any. These costs are assume by the third parties as it is considered as own risk. The responsibility of the agency is to avoid this situation and provide to the users a better service.
32
Therefore, the formula to calculate this type of maintenance is:
𝑁𝑁𝑃𝑃𝐶𝐶𝑖𝑖 = ∑ 𝐴𝐴𝐶𝐶𝑁𝑁𝑖𝑖=1 Equation 4
Where:
PvCi= Preventive Cost (€) AC=Activity Cost (€) 𝑈𝑈𝑈𝑈𝐶𝐶𝑖𝑖 = ∑ (𝑁𝑁𝑉𝑉𝑉𝑉𝑖𝑖 ∗ 𝐴𝐴𝑈𝑈𝑖𝑖 ∗ 𝑁𝑁𝑈𝑈𝑈𝑈𝑖𝑖)𝑁𝑁
𝑘𝑘=𝐶𝐶 Equation 6
𝑁𝑁𝑉𝑉𝑉𝑉 = 𝑈𝑈𝐶𝐶𝑖𝑖 ∗ 𝑑𝑑𝑑𝑑𝑑𝑑 Equation 7
Where: UDC= User Delayed Cost VoTi= User Value of Time (€) AD= Activity Duration NUD= Number of User Delayed 3.5.2 Corrective Cost In the case of corrective costs (CvC), this is a reactive approach that some agencies can use as management technique and also are procedures that follows after an event occurs. This means that it is a sudden reaction, which was not planned. For that reason, the calculation of the Corrective Costs category involves all costs for repairing an asset after an accident has occurred. Activity Cost is a cost that involves materials, labor, equipment and indirect costs. The UDC will be calculated only for indication purposes to measure the costs consequences when performing a corrective activity. The formula to calculate this event category is:
𝐶𝐶𝑃𝑃𝐶𝐶𝑖𝑖 = ∑ 𝐴𝐴𝐶𝐶𝑖𝑖𝑁𝑁𝑖𝑖=𝐶𝐶 Equation 8
Where: CvC= Corrective Cost (€) AC=Activity Cost (€) UDC= User Delay Cost (€) 𝑈𝑈𝑈𝑈𝐶𝐶𝑖𝑖 = ∑ (𝑁𝑁𝑉𝑉𝑉𝑉𝑖𝑖 ∗ 𝑁𝑁𝑈𝑈𝑈𝑈𝑖𝑖 ∗ 𝐴𝐴𝑈𝑈𝑖𝑖)𝑁𝑁
𝑖𝑖=𝐶𝐶 Equation 9
Where:
UDC= User Delayed Cost VoTi= User Value of Time (€) AD= Activity Duration NUD= Number of User Delayed 3.6 Operational costs Operational Costs are the recurring costs of operating an equipment, understanding for equipment a component, device or facility. For instance, a movable bridge has the operational cost of the energy used and the operators required for operating it. The operation ensure the effectiveness and efficiency of an asset to meet client’s requirements transforming an asset into a full service. The costs related to this category in the case of harbor and water channels are: Labor Cost and utility costs by the Frequency of the activity. An example of this types of costs is for instance, the energy use for the public
33
lights or traffic lights or the greenery work that keeps the vegetation clean and save. To calculate these costs, I have made the following formula:
𝑂𝑂𝑂𝑂𝐶𝐶𝑖𝑖 = ∑ (𝐿𝐿𝐶𝐶 + 𝑈𝑈𝑈𝑈𝐶𝐶) ∗ 𝐹𝐹𝐹𝐹𝑁𝑁𝑖𝑖=1 Equation 10
Where: OpC= Operational Cost LC=labor Cost UtC=Utility cost Fq=Frequency 3.7 End-of-life costs An asset may have several destinies once it has reached the end of its useful life, one of this is the possibility to be sold for another purpose, and another one is the possibility to be disposed or graved. All of these options cost money and time for an agency. Therefore I have include this category in the LCC of the industrial and business areas. I have create a formula that include the following costs: Demolition Cost, Disposal Costs and Depreciation Costs.
Demolition Costs: in some assets the possibility to sale or reuse components are present. This means that before taking the whole element to disposal is important to separate it into pieces. Therefore, scrapping asset is part of the end-of-life process, the cost involve here are materials, labor costs, time of the total demolition, and equipment necessary to perform this action.
Disposal Costs: when the service life of an asset has been reached and the decision is to dispose it, there are three elements that I have selected to calculate the total cost of disposal: the amount of waste, waste’s taxes and all transport costs based on the volume and weight of the waste.
Depreciation Costs (selling assets), what depreciation costs seek is to estimate the value an asset may have after usage. Therefore the elements I have select are: savage value and the resale taxes as core of the formula.
In my model the depreciation cost is considered because once an asset reach the end-of-life it will be replaced by a new one which means that a new life-cycle cost will start. Saying this, replacement is consider as a construction of an asset.
To calculate the End-of-Life the formula is as follows:
𝐸𝐸𝑉𝑉𝐿𝐿𝑖𝑖 = ∑ 𝑈𝑈𝐷𝐷𝐶𝐶 + 𝑈𝑈𝐷𝐷𝐶𝐶 − 𝑈𝑈𝑂𝑂𝐶𝐶𝑁𝑁𝑖𝑖=1 Equation 11
Where: DmC = Demolition Cost DsC = Disposal Cost DpC = Depreciation Cost 𝑈𝑈𝐷𝐷𝐶𝐶 = (𝑆𝑆𝑆𝑆𝑆𝑆𝐶𝐶 + 𝐸𝐸𝐹𝐹𝐶𝐶) ∗ 𝑑𝑑 Equation 12
𝑈𝑈𝐷𝐷𝐶𝐶 = ((𝑈𝑈𝐶𝐶 ∗ 𝑄𝑄𝑖𝑖) ∗ 𝑉𝑉𝑆𝑆𝐶𝐶) ∗ 𝑊𝑊𝑉𝑉 Equation 13
𝑈𝑈𝑂𝑂𝐶𝐶 = �IoC – SvgV𝑆𝑆𝐸𝐸
� ∗ 𝑅𝑅𝐷𝐷𝑉𝑉 Equation 14
Where: ScrC = Scrapping Cost EqC = Equipment Cost

34
d = Duration Q = Waste Quantity WT = Waste taxes TrC = Transport Cost IoC = Initial Cost SvgV = Savage Value SL= Service life RsT=Resale Taxes 3.8 Conclusions This chapter presented an LCC model that can be applied to the elements in the Twente channel. The goal is to facilitate operation, tactic and strategic decision making for the GHT company managers. The LCC model here presented satisfies the following requirements:
R7.The AMS Tool has a generic LCC method
R9.The AMS Tool calculates the net present value and future present value of the assets.
The model defined generic economic quantities, without detailing calculations for any specific asset, satisfying R7. Furthermore, the model has been made such that the main economic quantities to be calculated are the net present value and the future present value, which were defined as requirements in R9.
35
4 Taxonomy design and evaluation This chapter reports on the design and evaluation of the taxonomy of the assets in the Harbor. The taxonomy is required for standardizing concepts as well as how asset data is structured. Therefore, this chapter deals with the following requirements:
R3. The AMS Tool offers the information in a structured way, such that all the actors can understand it intuitively.
R4. The database system is able to store information about the assets, its properties and the activities required for inspection and maintaining them.
After interviewing the stakeholders, analyzing documentation and visiting the channel I developed the elements and structure for my taxonomy to evaluate it with the experts of the Twente Channel. The resulting taxonomy fits the infrastructure and the experts’ logic for the Twente channel. In this chapter I will explain the process of development and the outcomes.
4.1 Taxonomy design process The origin of the word Taxonomy comes from the Greek, taxis “arrangement” and nomia “method” [Maguire, 2011]. As [Simpson, 2010] has defined, a taxonomy is: “A field of science that encompasses description, identification, nomenclature (naming), and classification”. In other words, taxonomy is the science to classify systems by organization concepts of knowledge. In the case of the harbor’s taxonomy, I have performed interviews with the practitioners. Here, they have described the assets in the infrastructure that they are responsible for. After analyzing the interviews and supporting this information with documentation, I have proceeded to structure the assets based on their general characteristics and properties. Once the taxonomy was created, I have validated it through a workshop with all the stakeholders of the harbor. The goal of this workshop was to verify if all elements were present and to validate if the structure of the assets was equally recognized by all the stakeholders. Please consider that the stakeholders are coming from different municipalizes, and therefore have different views on how the assets are structured in different elements and properties. This was a critical step because they are the one who will feed the system with data that will support the LCC tool. The criteria I have used to classify the elements was based on the physical services of the industrial area at the harbor, which include the roadway, the seaway, the railway, the underground infrastructure, the vegetation structure and the Industrial furniture. In the following part I will explain the hierarchy and elements of the taxonomy.
4.2 Taxonomy As Figure 4.1 shows, the generated taxonomy consists of six main elements or classes located under a main class called Asset. Each class is positioned at the same level of hierarchy. Under these six main elements, I have allocated the elements related to each service. Each of this sub classes contains a number of elements that together represent the subclass. These elements were assigned based on the infrastructure present in the harbor. In the following paragraph I will describe the subclasses with their elements.
The seaway contains assets like quay walls, marine bollard, anchor, backfill, beam, capping and embankment. The logic to allocate these elements under this subclass is as follows: if the marine bollard failed the users of the system can approach the database and think in the following relationship: Marine Bollard bellows to the channel, the channel to the seaway, so, I should go to the seaway in order to find the information of the Marine bollard.
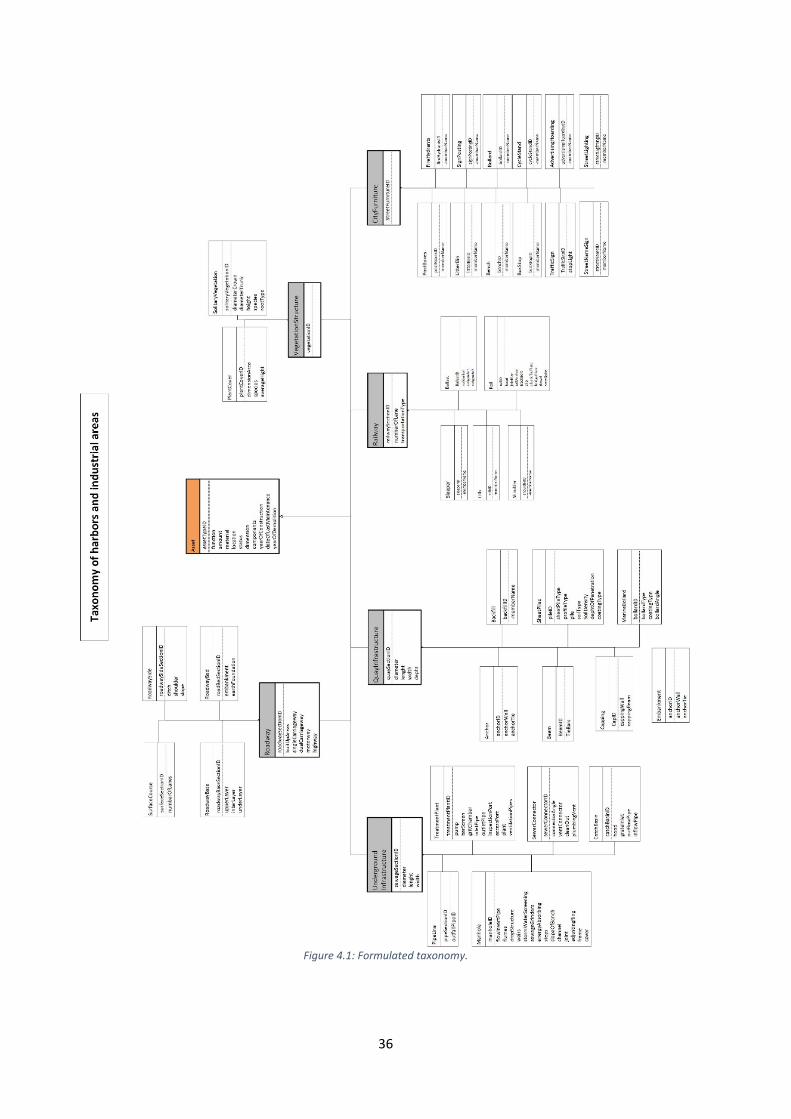
36
Figure 4.1: Formulated taxonomy.
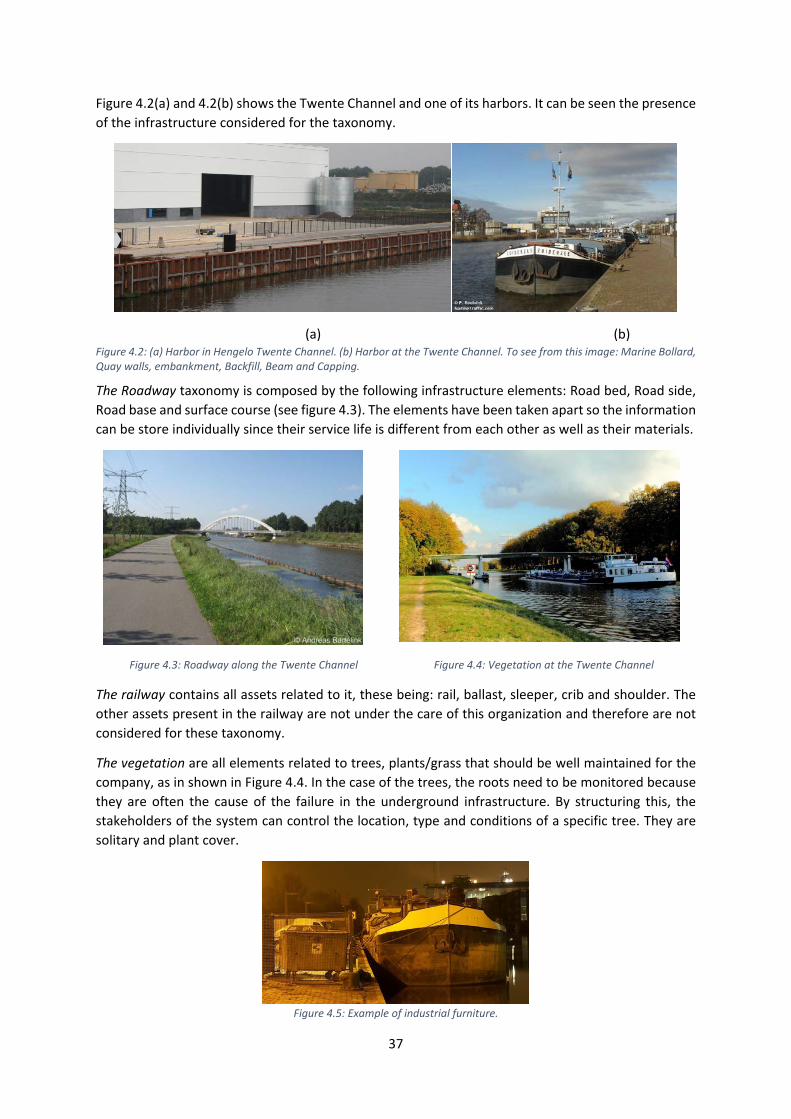
37
Figure 4.2(a) and 4.2(b) shows the Twente Channel and one of its harbors. It can be seen the presence of the infrastructure considered for the taxonomy.
(a) (b) Figure 4.2: (a) Harbor in Hengelo Twente Channel. (b) Harbor at the Twente Channel. To see from this image: Marine Bollard, Quay walls, embankment, Backfill, Beam and Capping.
The Roadway taxonomy is composed by the following infrastructure elements: Road bed, Road side, Road base and surface course (see figure 4.3). The elements have been taken apart so the information can be store individually since their service life is different from each other as well as their materials.
Figure 4.3: Roadway along the Twente Channel Figure 4.4: Vegetation at the Twente Channel
The railway contains all assets related to it, these being: rail, ballast, sleeper, crib and shoulder. The other assets present in the railway are not under the care of this organization and therefore are not considered for these taxonomy.
The vegetation are all elements related to trees, plants/grass that should be well maintained for the company, as in shown in Figure 4.4. In the case of the trees, the roots need to be monitored because they are often the cause of the failure in the underground infrastructure. By structuring this, the stakeholders of the system can control the location, type and conditions of a specific tree. They are solitary and plant cover.
Figure 4.5: Example of industrial furniture.

38
The Industrial furniture are the elements that complement and support the well-functioning of the other services at the industrial area. These are post boxes, litter bin, bench, bus stop, traffic sign, street names sign, fire hydrant, sign posting, bollard, cycle stand, advertising hoarding and street lightening, as it can be seen in Figure 4.5.
4.3 Evaluation In order to validate my taxonomy I have designed a workshop where the stakeholders of the system could determine the structural validity of it. The taxonomy on the one hand has to be logical for the stakeholders, while on the other hand should preserve the structural data of the assets which can be stored accordingly. To make this workshop possible, I gathered information from the stakeholders through interviews, documents and literature. Since I did not wanted to make any influence in the stakeholder perception of the proposed taxonomy, the workshop was based on their own understanding of asset taxonomy lead by a workshop structure.
4.3.1 Workshop design The structure of the workshop consisted out of 5 steps.
The 1st step consisted of a team work process, where the stakeholder would check and discuss a number of predetermined assets. In the case they are missing an asset from the determined ones, the participants had the opportunity to add as many assets as they considered should be incorporated into the list. Once they had agreed, they would go a table and set them in the order they considered convenient. Figure 4.6 reports this process.
Figure 4.6: The stakeholder in the brainstorming process during the workshop.
The 2nd step was similar to the first one. In this case, the stakeholders had to think and select the properties of the assets from the first step. Once they finished the discussion, they had to proceed to set the properties under the correspondent asset. In this step I had to demark the elements that were
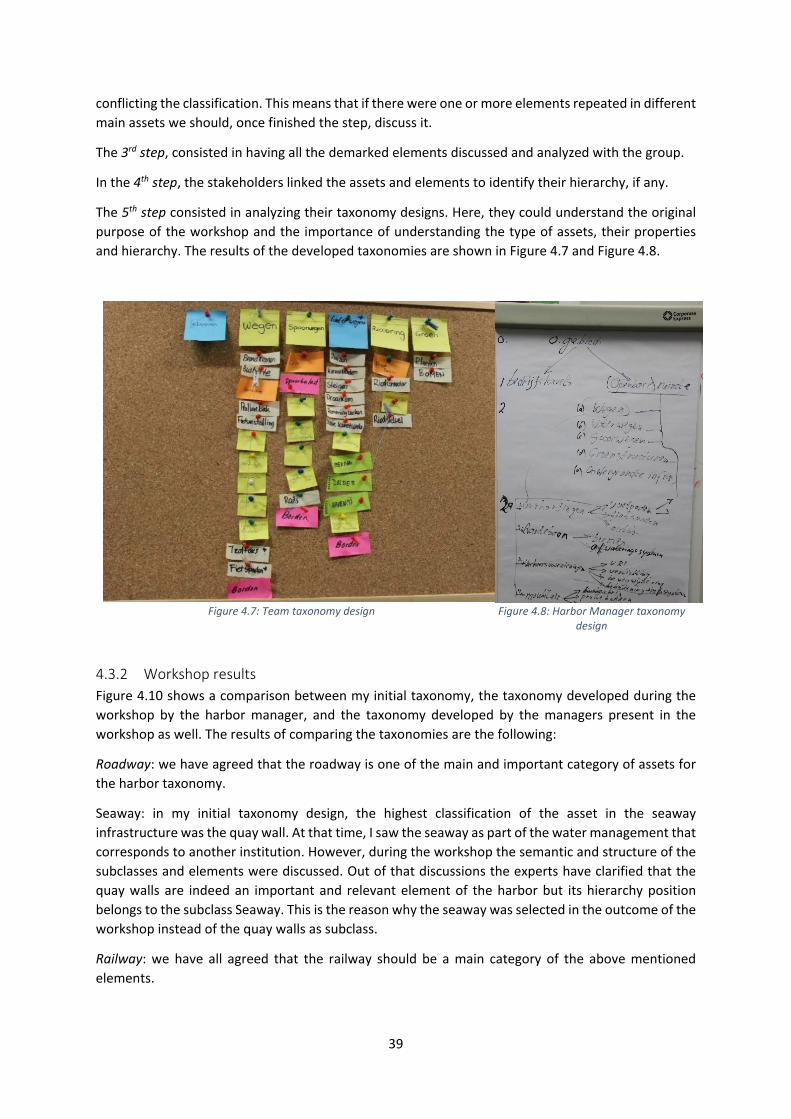
39
conflicting the classification. This means that if there were one or more elements repeated in different main assets we should, once finished the step, discuss it.
The 3rd step, consisted in having all the demarked elements discussed and analyzed with the group.
In the 4th step, the stakeholders linked the assets and elements to identify their hierarchy, if any.
The 5th step consisted in analyzing their taxonomy designs. Here, they could understand the original purpose of the workshop and the importance of understanding the type of assets, their properties and hierarchy. The results of the developed taxonomies are shown in Figure 4.7 and Figure 4.8.
Figure 4.7: Team taxonomy design
Figure 4.8: Harbor Manager taxonomy design
4.3.2 Workshop results Figure 4.10 shows a comparison between my initial taxonomy, the taxonomy developed during the workshop by the harbor manager, and the taxonomy developed by the managers present in the workshop as well. The results of comparing the taxonomies are the following:
Roadway: we have agreed that the roadway is one of the main and important category of assets for the harbor taxonomy.
Seaway: in my initial taxonomy design, the highest classification of the asset in the seaway infrastructure was the quay wall. At that time, I saw the seaway as part of the water management that corresponds to another institution. However, during the workshop the semantic and structure of the subclasses and elements were discussed. Out of that discussions the experts have clarified that the quay walls are indeed an important and relevant element of the harbor but its hierarchy position belongs to the subclass Seaway. This is the reason why the seaway was selected in the outcome of the workshop instead of the quay walls as subclass.
Railway: we have all agreed that the railway should be a main category of the above mentioned elements.
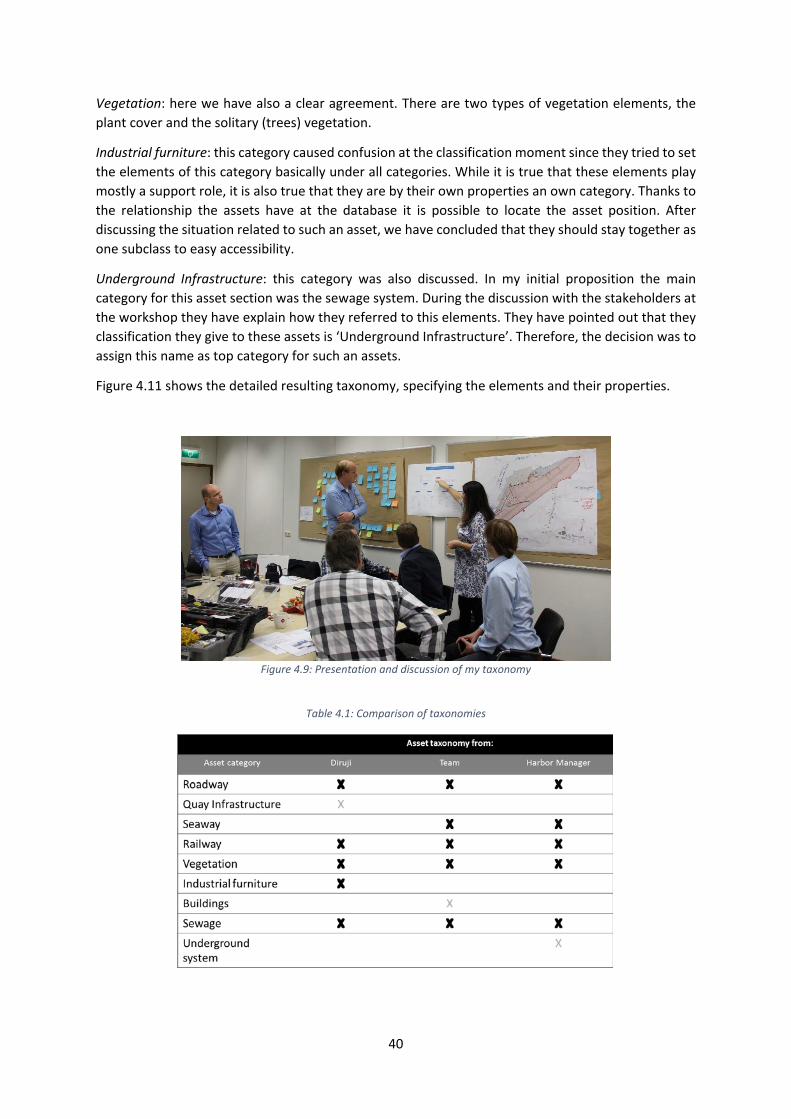
40
Vegetation: here we have also a clear agreement. There are two types of vegetation elements, the plant cover and the solitary (trees) vegetation.
Industrial furniture: this category caused confusion at the classification moment since they tried to set the elements of this category basically under all categories. While it is true that these elements play mostly a support role, it is also true that they are by their own properties an own category. Thanks to the relationship the assets have at the database it is possible to locate the asset position. After discussing the situation related to such an asset, we have concluded that they should stay together as one subclass to easy accessibility.
Underground Infrastructure: this category was also discussed. In my initial proposition the main category for this asset section was the sewage system. During the discussion with the stakeholders at the workshop they have explain how they referred to this elements. They have pointed out that they classification they give to these assets is ‘Underground Infrastructure’. Therefore, the decision was to assign this name as top category for such an assets.
Figure 4.11 shows the detailed resulting taxonomy, specifying the elements and their properties.
Figure 4.9: Presentation and discussion of my taxonomy
Table 4.1: Comparison of taxonomies

41
4.4 Conclusions This chapter presented the design of the taxonomy for the assets at the harbor. The taxonomy has six main categories. This taxonomy provides the solution to the requirement:
R3. The AMS Tool offers the information in a structured way, such that all the actors can understand it intuitively.
This has been validated in a workshop with stakeholders of the harbor. The resulting taxonomy can now be used as input to design the database system. The seaway is seen as the most important asset. The managers also indicate that the quay walls are the most important asset in this category. Yet, the managers have no clear overview of the maintenance and operation activities required to keep it functioning optimally. Therefore, I will demonstrate the tool functionality at the hand of the case study quay walls, which in the case of the Twente channel are made of steel sheet piles.

42
Figure 4.10: Final taxonomy developed in collaboration with the stakeholder of the Twente Channel.

43
5 Database design The objective of the database is to structure and keep data to enable proper and effective asset management. In fact, as it was described in Section 1.1, the data collection activities required to implement a LCC model for an infrastructure have to be designed specifically to support that decision processes. Chapter 3 reported on the design of the LCC model and Chapter 4 developed the taxonomy, and therefore, the structure of the data for the Twente channel. This chapter reports on the design of a database architecture that enables access to the data required for making the LCC model calculations while being connected to the current databases of the municipalities. The four requirements to fulfill by the system are:
R4. The database system is able to store information about the assets, its properties and the activities required for inspection and maintaining them.
R5. The AMS Tool enables in determining inspection tasks for a given asset maintenance process
R6. The AMS tool enables entering the results if an assessment task into the system for future management decisions.
R8.The LCC model is programed such that new LCCs of specific assets can be modeled and introduced into the system. This guarantees the coevolution of the database system and the physical quay.
This Chapter starts with an analysis of the database present at the Municipality of Hengelo to later propose a database architecture for the GHT Company.
5.1 Analysis of existing database architecture at the municipalities All 5 municipalities involved in the GHT have the same database elements. Therefore, in order to clarify the design task for the new database system, I have made an analysis the current database system architecture at the municipality of Hengelo.
Figure 4.1, shows the current architecture of the database system of the municipality of Hengelo. This database system is analyzed to determine its possible drawbacks and to propose possible improvements.
The first element of the system is the Data Store, which holds the central information that can be used by internal and external data clients from the Municipality of Hengelo. This Data Store, that stores data from database repositories to files and emails, supports all the decision processes made for the municipality of Hengelo.
A second element is GeoBasis, shown in Figure 4.3. This is a standard geographic data store that controls the internal and external information of the municipality. This tool plays a central role inside the database architecture of geographic information system (GIS) designed to manage, analyze, capture, store and manipulate all types of geographical data [Esri NL, 2013]. The GeoBasis allows the municipality of Hengelo to manage a big amount of geographical information in its daily activities and leave space for the realization of new ambitions. Loading and refreshing of data occurs automatically in a batch program so the data persist up-dated. GeoBasis is flexible and it can be readapted to the user’s needs. This is really convenient for situations like the new technology implementation or the growth and reorganization of the data at the municipality.
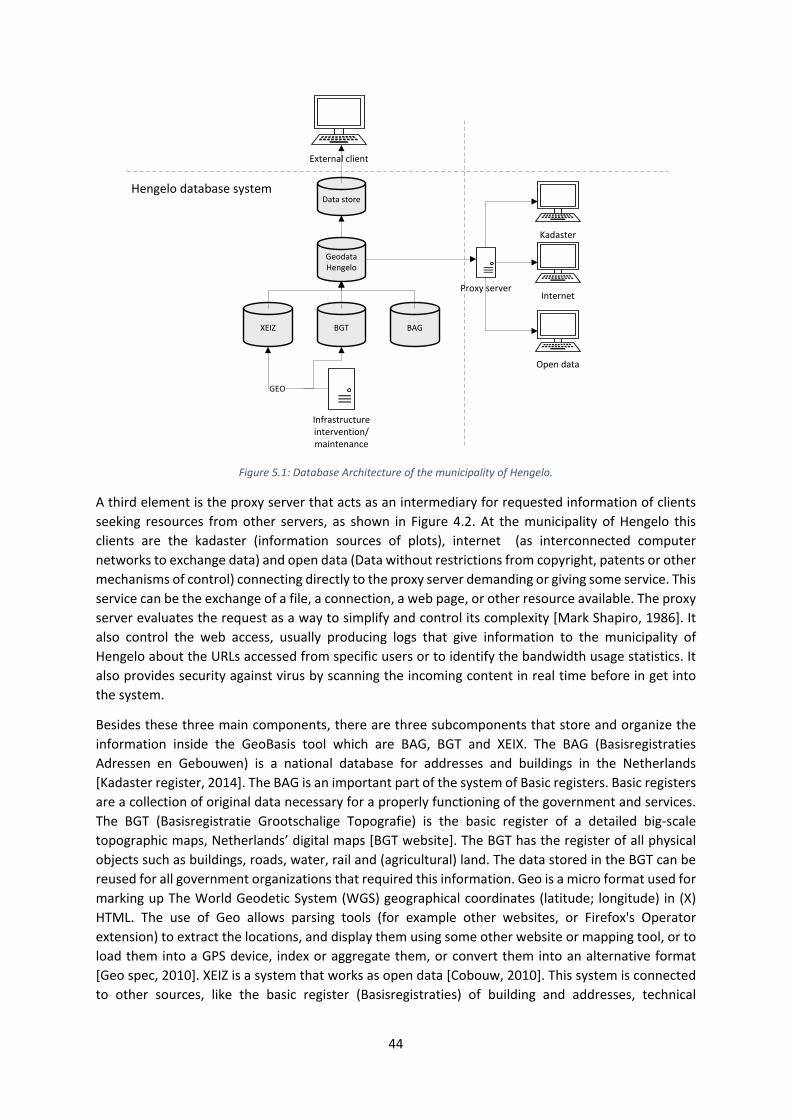
44
Figure 5.1: Database Architecture of the municipality of Hengelo.
A third element is the proxy server that acts as an intermediary for requested information of clients seeking resources from other servers, as shown in Figure 4.2. At the municipality of Hengelo this clients are the kadaster (information sources of plots), internet (as interconnected computer networks to exchange data) and open data (Data without restrictions from copyright, patents or other mechanisms of control) connecting directly to the proxy server demanding or giving some service. This service can be the exchange of a file, a connection, a web page, or other resource available. The proxy server evaluates the request as a way to simplify and control its complexity [Mark Shapiro, 1986]. It also control the web access, usually producing logs that give information to the municipality of Hengelo about the URLs accessed from specific users or to identify the bandwidth usage statistics. It also provides security against virus by scanning the incoming content in real time before in get into the system.
Besides these three main components, there are three subcomponents that store and organize the information inside the GeoBasis tool which are BAG, BGT and XEIX. The BAG (Basisregistraties Adressen en Gebouwen) is a national database for addresses and buildings in the Netherlands [Kadaster register, 2014]. The BAG is an important part of the system of Basic registers. Basic registers are a collection of original data necessary for a properly functioning of the government and services. The BGT (Basisregistratie Grootschalige Topografie) is the basic register of a detailed big-scale topographic maps, Netherlands’ digital maps [BGT website]. The BGT has the register of all physical objects such as buildings, roads, water, rail and (agricultural) land. The data stored in the BGT can be reused for all government organizations that required this information. Geo is a micro format used for marking up The World Geodetic System (WGS) geographical coordinates (latitude; longitude) in (X) HTML. The use of Geo allows parsing tools (for example other websites, or Firefox's Operator extension) to extract the locations, and display them using some other website or mapping tool, or to load them into a GPS device, index or aggregate them, or convert them into an alternative format [Geo spec, 2010]. XEIZ is a system that works as open data [Cobouw, 2010]. This system is connected to other sources, like the basic register (Basisregistraties) of building and addresses, technical
GeodataHengelo
Data store
Infrastructure intervention/maintenance
Kadaster
External client
Proxy serverInternet
Open data
XEIZ BGT BAG
GEO
Hengelo database system
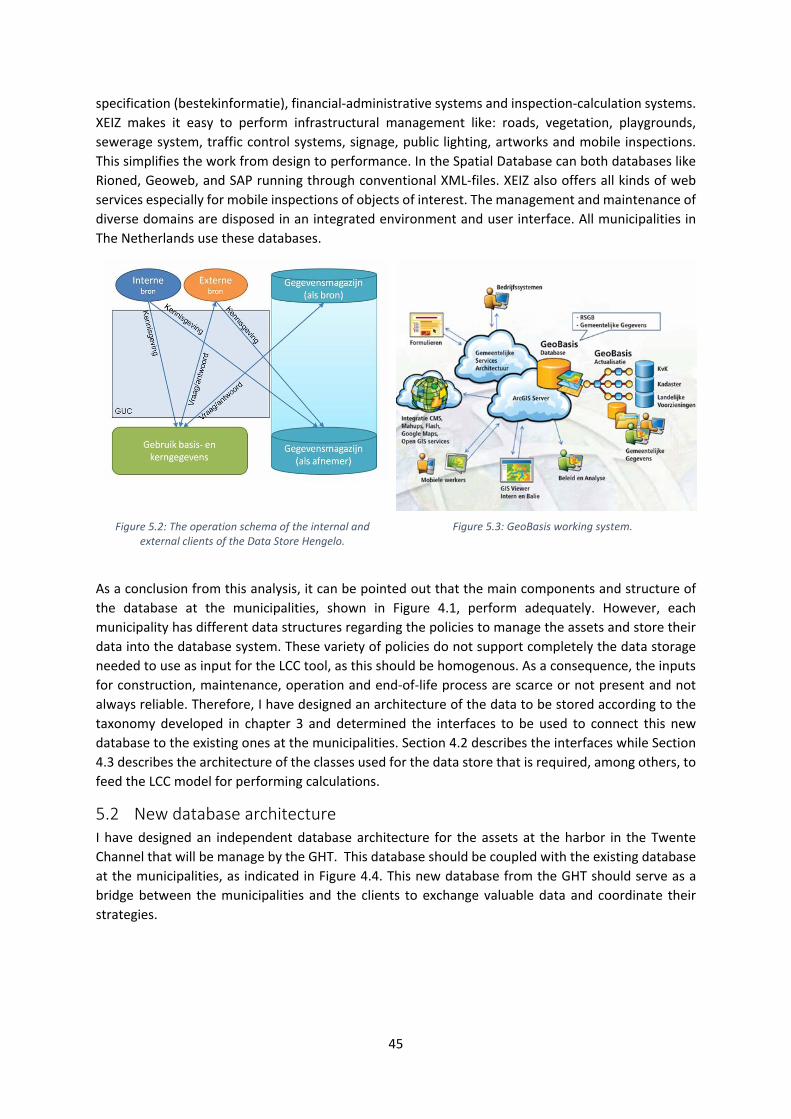
45
specification (bestekinformatie), financial-administrative systems and inspection-calculation systems. XEIZ makes it easy to perform infrastructural management like: roads, vegetation, playgrounds, sewerage system, traffic control systems, signage, public lighting, artworks and mobile inspections. This simplifies the work from design to performance. In the Spatial Database can both databases like Rioned, Geoweb, and SAP running through conventional XML-files. XEIZ also offers all kinds of web services especially for mobile inspections of objects of interest. The management and maintenance of diverse domains are disposed in an integrated environment and user interface. All municipalities in The Netherlands use these databases.
Figure 5.2: The operation schema of the internal and external clients of the Data Store Hengelo.
Figure 5.3: GeoBasis working system.
As a conclusion from this analysis, it can be pointed out that the main components and structure of the database at the municipalities, shown in Figure 4.1, perform adequately. However, each municipality has different data structures regarding the policies to manage the assets and store their data into the database system. These variety of policies do not support completely the data storage needed to use as input for the LCC tool, as this should be homogenous. As a consequence, the inputs for construction, maintenance, operation and end-of-life process are scarce or not present and not always reliable. Therefore, I have designed an architecture of the data to be stored according to the taxonomy developed in chapter 3 and determined the interfaces to be used to connect this new database to the existing ones at the municipalities. Section 4.2 describes the interfaces while Section 4.3 describes the architecture of the classes used for the data store that is required, among others, to feed the LCC model for performing calculations.
5.2 New database architecture I have designed an independent database architecture for the assets at the harbor in the Twente Channel that will be manage by the GHT. This database should be coupled with the existing database at the municipalities, as indicated in Figure 4.4. This new database from the GHT should serve as a bridge between the municipalities and the clients to exchange valuable data and coordinate their strategies.

46
Figure 5.4: New database architecture for the municipality of Hengelo.
The management of the Twente Channel will be in charge of the GHT Company, but this Company is not in charge of the industrial and business areas along the Twente Channel. This situation creates the need to coordinate decisions to ensure the cost efficient, reliable and available infrastructure management. To do so, the GHT database system will be structured adequately based on the taxonomy shown in Chapter 3. This database system will also allow the GHT to stablish their own managerial policies independently from the ones the municipalities have. This is shown in Figure 5.4.
The performance of an asset at the harbor depends on its condition. This condition is mostly depending on the private as much as on the public sector welfares. The GHT database should therefore, organize, store and take care of their data. Figure 4.5 indicates its interface to the existing databases at the municipalities. The users of the harbor, Civil Engineer and the Asset Manager, can access from the client Machine to the GHT Database (DB) through the database server program. The DB server program will identify the user, evaluating its request and, searching into the database passing the information back over the network. It will also gather the data from their users storing them in the Local Database.
The GHT DB will be structure especially for the harbor infrastructure taxonomy. The DB will produce a file that contains the geographical data that will be replicate to the GeoBasis at the municipalitiesThe GeoBasis will do its function of keeping the main DB of the five municipalities up-to-date as well as the Basic Register Information of national infrastructure Data store.

47
Figure 5.5: New Database structure for the GHT.
5.3 Database design Based on the actor analysis in Chapter 2, I have designed an Entity-Relationship (ER), which is shown in Figure 4.6. An ER is used model the relationship between the objects. It defines the conceptual view of the database showing the inter-relation between the elements of interest for this database. This ER design was combined with the results of the Taxonomy to produce a detailed architecture of the GHT database. This was performed by defining classes for each of the assets and defining data variables for each of the asset properties.
The architecture is modeled using the Unified Modeling Language (UML), which is shown in Figure 4.7. The UML is a representation method used by system architects, software engineers, and software developers for analysis, design, and implementation of software based systems as well as for modeling business and similar processes [OMG UML, 2011]. This design technique allowed me to structure my target system. A class is a template for multiple instances with similar features. In the UML class model is described the values the instances may hold, their attributes, operations, methods, relationships, and semantics.
The UML class model distinguishes different parts:
1. The classes employment, placement, site, position, person entity, organization and position assignment are organized following the “Party” pattern (indicated in light green in the figure), which is a well-known structure that models people and organizations and their basic relationship [Robert Muller. 1999]. These classes are used to describe the properties of the employees of the GHT Company. As some of the employees (as described in the actor analysis in Chapter 2) are involved in asset management, these classes are related to the schedule class.
2. The class geographic location and its subclasses is organized according to the “Geographic Location” pattern (indicated with dark green in the figure), which models networks of geographical areas [Robert Muller, 1999]. This classes are related to the class task in order to have also an indication of the exact location of each of the assets managed by the company.
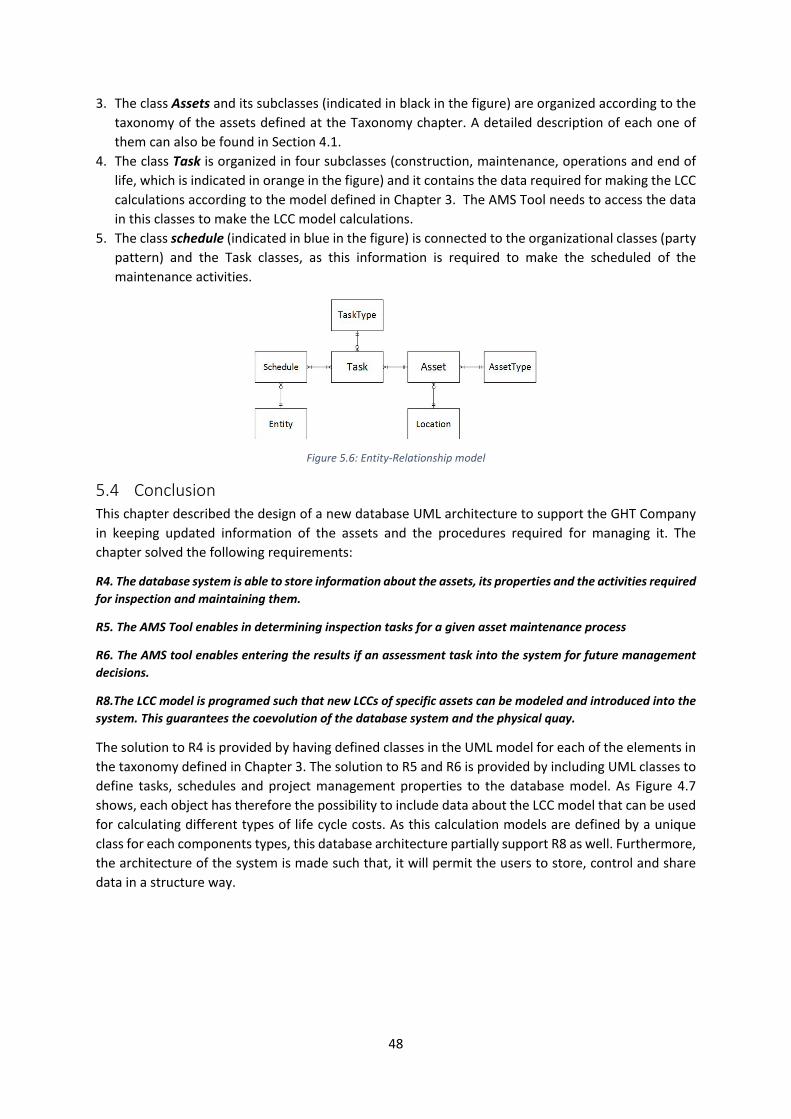
48
3. The class Assets and its subclasses (indicated in black in the figure) are organized according to the taxonomy of the assets defined at the Taxonomy chapter. A detailed description of each one of them can also be found in Section 4.1.
4. The class Task is organized in four subclasses (construction, maintenance, operations and end of life, which is indicated in orange in the figure) and it contains the data required for making the LCC calculations according to the model defined in Chapter 3. The AMS Tool needs to access the data in this classes to make the LCC model calculations.
5. The class schedule (indicated in blue in the figure) is connected to the organizational classes (party pattern) and the Task classes, as this information is required to make the scheduled of the maintenance activities.
Figure 5.6: Entity-Relationship model
5.4 Conclusion This chapter described the design of a new database UML architecture to support the GHT Company in keeping updated information of the assets and the procedures required for managing it. The chapter solved the following requirements:
R4. The database system is able to store information about the assets, its properties and the activities required for inspection and maintaining them.
R5. The AMS Tool enables in determining inspection tasks for a given asset maintenance process
R6. The AMS tool enables entering the results if an assessment task into the system for future management decisions.
R8.The LCC model is programed such that new LCCs of specific assets can be modeled and introduced into the system. This guarantees the coevolution of the database system and the physical quay.
The solution to R4 is provided by having defined classes in the UML model for each of the elements in the taxonomy defined in Chapter 3. The solution to R5 and R6 is provided by including UML classes to define tasks, schedules and project management properties to the database model. As Figure 4.7 shows, each object has therefore the possibility to include data about the LCC model that can be used for calculating different types of life cycle costs. As this calculation models are defined by a unique class for each components types, this database architecture partially support R8 as well. Furthermore, the architecture of the system is made such that, it will permit the users to store, control and share data in a structure way.

49
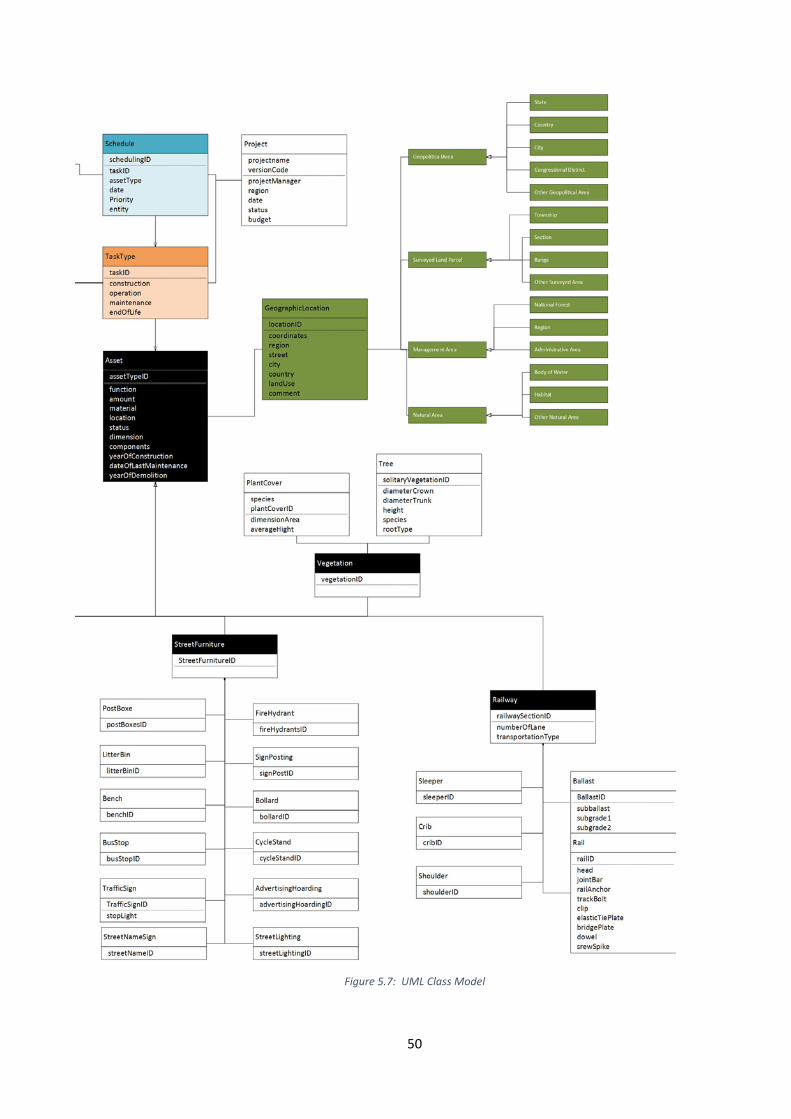
50
Figure 5.7: UML Class Model
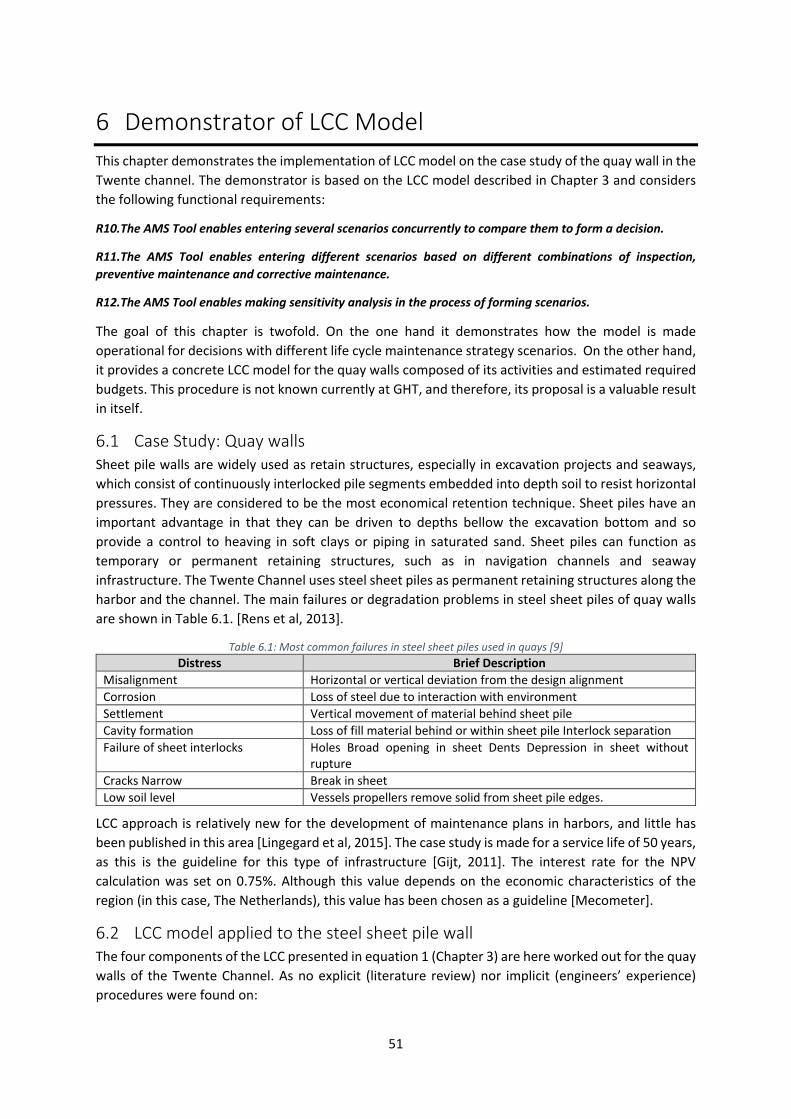
51
6 Demonstrator of LCC Model This chapter demonstrates the implementation of LCC model on the case study of the quay wall in the Twente channel. The demonstrator is based on the LCC model described in Chapter 3 and considers the following functional requirements:
R10.The AMS Tool enables entering several scenarios concurrently to compare them to form a decision.
R11.The AMS Tool enables entering different scenarios based on different combinations of inspection, preventive maintenance and corrective maintenance.
R12.The AMS Tool enables making sensitivity analysis in the process of forming scenarios.
The goal of this chapter is twofold. On the one hand it demonstrates how the model is made operational for decisions with different life cycle maintenance strategy scenarios. On the other hand, it provides a concrete LCC model for the quay walls composed of its activities and estimated required budgets. This procedure is not known currently at GHT, and therefore, its proposal is a valuable result in itself.
6.1 Case Study: Quay walls Sheet pile walls are widely used as retain structures, especially in excavation projects and seaways, which consist of continuously interlocked pile segments embedded into depth soil to resist horizontal pressures. They are considered to be the most economical retention technique. Sheet piles have an important advantage in that they can be driven to depths bellow the excavation bottom and so provide a control to heaving in soft clays or piping in saturated sand. Sheet piles can function as temporary or permanent retaining structures, such as in navigation channels and seaway infrastructure. The Twente Channel uses steel sheet piles as permanent retaining structures along the harbor and the channel. The main failures or degradation problems in steel sheet piles of quay walls are shown in Table 6.1. [Rens et al, 2013].
Table 6.1: Most common failures in steel sheet piles used in quays [9] Distress Brief Description
Misalignment Horizontal or vertical deviation from the design alignment Corrosion Loss of steel due to interaction with environment Settlement Vertical movement of material behind sheet pile Cavity formation Loss of fill material behind or within sheet pile Interlock separation Failure of sheet interlocks
Holes Broad opening in sheet Dents Depression in sheet without rupture
Cracks Narrow Break in sheet Low soil level Vessels propellers remove solid from sheet pile edges.
LCC approach is relatively new for the development of maintenance plans in harbors, and little has been published in this area [Lingegard et al, 2015]. The case study is made for a service life of 50 years, as this is the guideline for this type of infrastructure [Gijt, 2011]. The interest rate for the NPV calculation was set on 0.75%. Although this value depends on the economic characteristics of the region (in this case, The Netherlands), this value has been chosen as a guideline [Mecometer].
6.2 LCC model applied to the steel sheet pile wall The four components of the LCC presented in equation 1 (Chapter 3) are here worked out for the quay walls of the Twente Channel. As no explicit (literature review) nor implicit (engineers’ experience) procedures were found on:

52
- how to calculate the construction costs - which inspection activities are carried with which frequency - which preventive and corrective activities are carried out and with which frequency - which is the disposal costs
I have made a literature review to assemble a new model. The following literature sources were used for doing so:
- Retaining wall comparison, American Steel Sheet pile association [EIC group, 2009] - Maintenance and management of civil infrastructure based on condition, safety, optimization
and LCC [Frangopol et al, 2005] - Cost of quay walls [Gijt, 2011] - Life-Cycle Management of Port Structures Recommended Practices for Implementation
[PIANC, 2008] - A Sustainable Approach for Optimal Steel Sheet Pile Structure Assessment, Maintenance, and
Rehabilitation [Rens et al, 2013] - Life-cycle cost strategies for harbors – a case study [Lingegard, et al, 2015]
Furthermore, I chose to translate all unit costs in surface area (m2) of the quay walls. By doing so, the users of the tool will set the inputs easily and intuitively to input the length and the height of the quay walls to obtain an LCC estimation. The model has been validated with the Gemeenschappelijke Havenbeheer Twentekanalen (GHT) manager during an interview session where the usage of the surface area as a main unit was approved.
6.2.1 Construction cost The GHT has a subcontracting company for performing the construction of quay walls made of steel sheet piles. In this LCC model, the construction price is based on the work presented in [Gijt, 2011]. This paper reports on the total costs of quay walls based on data from the port of Rotterdam. According to it, the construction costs are around €1333/m2 for a 15 meters high quay wall.
6.2.2 Operational costs Generally speaking, quay walls do not have operational costs in the sense that that it does not require operators for using it. Yet, if a cathodic protection is chosen for maintenance treatment to the steel sheet pile walls the power energy is regarded as operational cost. The energy costs for cathodic protection depend on the number of anodes per square meter, the mass of the anodes, the electric consumption per kilograms mass and the energy prices. This study will not consider the implementation of cathodic protection, as interviews with the GHT manager indicate this is not expected to be implement at the Twente channel, as it requires the adaptation of the existing infrastructure to accommodate this technology.
6.2.3 Maintenance As described in [Rens et al, 2013], the most important source of sheet pile degradation is corrosion. As a consequence, preventive and corrective maintenance activities are mostly directed to delaying the corrosion process or repairing when damaged. Figure 6.1 shows an example of a corroded sheet pile. The figures shows how the most critical area is the tidal zone (splashing zone), around the changing level of the water which is visible on Figure 6.1. This is due to the fact that this area is exposed to both water and oxygen, accelerating the corrosion effect. In the proposed LCC model, there are two maintenance activities recognized, preventive and corrective maintenance.

53
Figure 6.1 Corrosion on a sheet pile used in a quay wall.
Preventive maintenance costs Preventive maintenance is the best method to prolong the life of sheet pile structured. Preventive maintenance includes ensuring that the structure is functioning in the way it was designed for. Without a maintenance, the quay walls would not reach 50 years’ service life. Preventive maintenance include inspection and repair activities.
There are three types of inspections performed on quay walls, namely, the routine inspection, detailed inspection and soil displacement monitoring. The routine inspection is performed making a visual assessment of the quay wall. According to the data provided by the GHT (See appendix I), it has a fixed costs of €50 for 100 meters in length. The detailed inspection uses specialized equipment to determine the level of corrosion. Its cost according to the data provided in (see Appendix I) are €250 for a quay wall of 100 meters in length. Soil monitoring is used to assess whether soil movement has taken place. This activity has no cost, as it is performed using the sonar systems installed on the vessels. This was indicated by the asset manager of the GHT Company.
The following activities are recognized as repair activities:
1. Cathodic protection: is an electrical corrosion control method, as shown in Figure 6.2. The process involves impressing a direct current through the environment into the structure. The direct current is introduced through the soil or water by expendable anodes to the structure (cathodes). The corrosion of the structure is transferred to the spendable metal rod, which are easier and less costly to replace than structure repairs or replacement [Meiller, 2000]. Here, the electrical power consumption needed to operate is taken also into account in its costs. This maintenance procedure needs electrical continuity. The costs for installing the cathodic protection infrastructure is part of the construction costs of the sheet piles. From the maintenance point of view, the costs of having this type of anticorrosion system are related to changing the anodes following a certain frequency. This frequency depends on the salinity of the water and electric voltage applied to them. Yet, as it was mentioned previously, cathodic protection will not be further considered in the LCC model calculations.
Air and splashing related corrosion
Tidal zone related corrosion
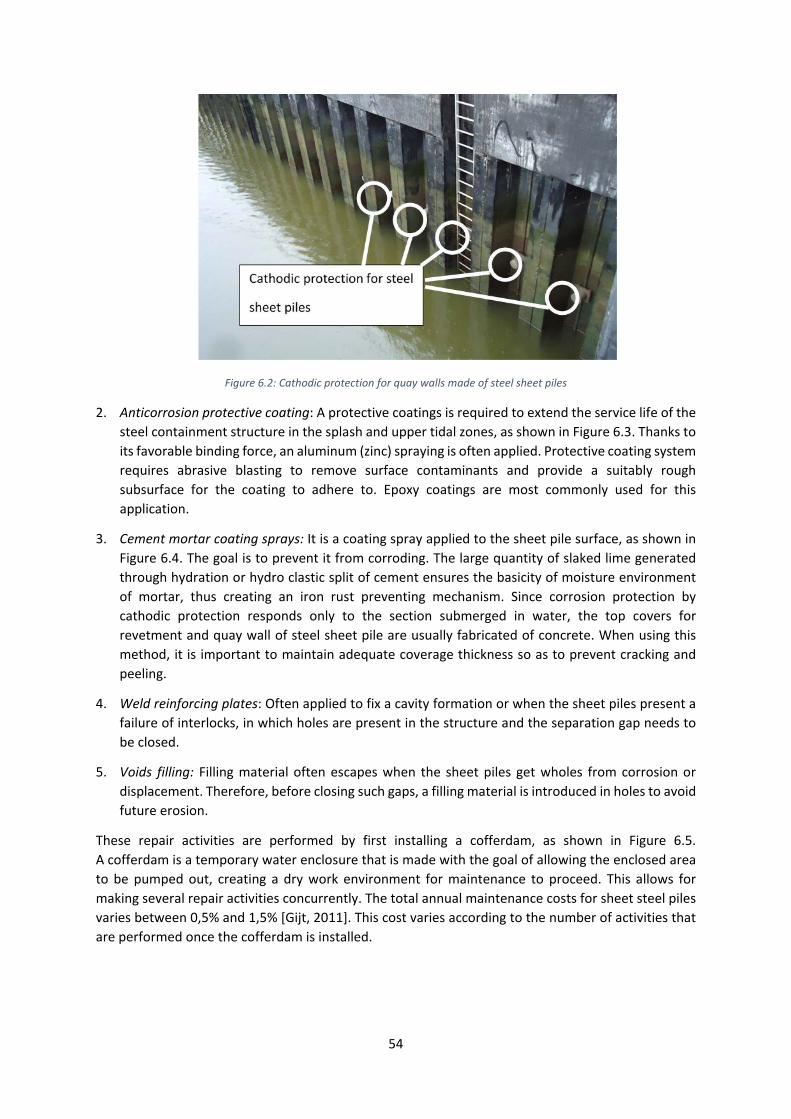
54
Figure 6.2: Cathodic protection for quay walls made of steel sheet piles
2. Anticorrosion protective coating: A protective coatings is required to extend the service life of the steel containment structure in the splash and upper tidal zones, as shown in Figure 6.3. Thanks to its favorable binding force, an aluminum (zinc) spraying is often applied. Protective coating system requires abrasive blasting to remove surface contaminants and provide a suitably rough subsurface for the coating to adhere to. Epoxy coatings are most commonly used for this application.
3. Cement mortar coating sprays: It is a coating spray applied to the sheet pile surface, as shown in Figure 6.4. The goal is to prevent it from corroding. The large quantity of slaked lime generated through hydration or hydro clastic split of cement ensures the basicity of moisture environment of mortar, thus creating an iron rust preventing mechanism. Since corrosion protection by cathodic protection responds only to the section submerged in water, the top covers for revetment and quay wall of steel sheet pile are usually fabricated of concrete. When using this method, it is important to maintain adequate coverage thickness so as to prevent cracking and peeling.
4. Weld reinforcing plates: Often applied to fix a cavity formation or when the sheet piles present a failure of interlocks, in which holes are present in the structure and the separation gap needs to be closed.
5. Voids filling: Filling material often escapes when the sheet piles get wholes from corrosion or displacement. Therefore, before closing such gaps, a filling material is introduced in holes to avoid future erosion.
These repair activities are performed by first installing a cofferdam, as shown in Figure 6.5. A cofferdam is a temporary water enclosure that is made with the goal of allowing the enclosed area to be pumped out, creating a dry work environment for maintenance to proceed. This allows for making several repair activities concurrently. The total annual maintenance costs for sheet steel piles varies between 0,5% and 1,5% [Gijt, 2011]. This cost varies according to the number of activities that are performed once the cofferdam is installed.
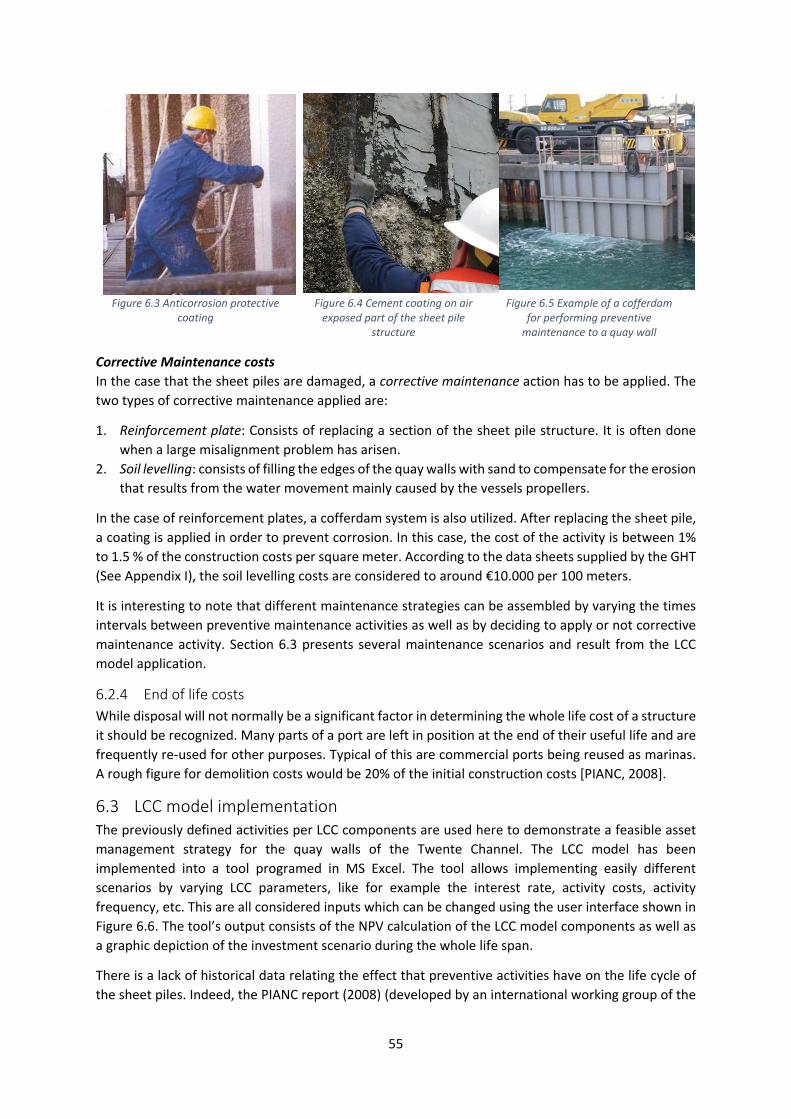
55
Figure 6.3 Anticorrosion protective
coating Figure 6.4 Cement coating on air
exposed part of the sheet pile structure
Figure 6.5 Example of a cofferdam for performing preventive
maintenance to a quay wall
Corrective Maintenance costs In the case that the sheet piles are damaged, a corrective maintenance action has to be applied. The two types of corrective maintenance applied are:
1. Reinforcement plate: Consists of replacing a section of the sheet pile structure. It is often done when a large misalignment problem has arisen.
2. Soil levelling: consists of filling the edges of the quay walls with sand to compensate for the erosion that results from the water movement mainly caused by the vessels propellers.
In the case of reinforcement plates, a cofferdam system is also utilized. After replacing the sheet pile, a coating is applied in order to prevent corrosion. In this case, the cost of the activity is between 1% to 1.5 % of the construction costs per square meter. According to the data sheets supplied by the GHT (See Appendix I), the soil levelling costs are considered to around €10.000 per 100 meters.
It is interesting to note that different maintenance strategies can be assembled by varying the times intervals between preventive maintenance activities as well as by deciding to apply or not corrective maintenance activity. Section 6.3 presents several maintenance scenarios and result from the LCC model application.
6.2.4 End of life costs While disposal will not normally be a significant factor in determining the whole life cost of a structure it should be recognized. Many parts of a port are left in position at the end of their useful life and are frequently re-used for other purposes. Typical of this are commercial ports being reused as marinas. A rough figure for demolition costs would be 20% of the initial construction costs [PIANC, 2008].
6.3 LCC model implementation The previously defined activities per LCC components are used here to demonstrate a feasible asset management strategy for the quay walls of the Twente Channel. The LCC model has been implemented into a tool programed in MS Excel. The tool allows implementing easily different scenarios by varying LCC parameters, like for example the interest rate, activity costs, activity frequency, etc. This are all considered inputs which can be changed using the user interface shown in Figure 6.6. The tool’s output consists of the NPV calculation of the LCC model components as well as a graphic depiction of the investment scenario during the whole life span.
There is a lack of historical data relating the effect that preventive activities have on the life cycle of the sheet piles. Indeed, the PIANC report (2008) (developed by an international working group of the

56
maritime navigation commission of PIANC, the World Association for Waterborne Transport Infrastructure) of the year 2008, that describes how to apply LCC to the management of port structures (including the quay walls), has no grounding research or literature references to their choice applying different combinations of preventive vs. corrective maintenance policies. In addition to this, a recent study [Lingegard, 2015] describes that LCC analysis is relatively new for maintenance at harbors and little has been published in this area. Therefore, the costs of the activities indicated in Table 6.2 are rather indicative and based on the costs averages presented by (Gijt, 2011) and provided by the GHT company based on the data provided by the municipalities (see Appendix I). For an accurate prediction of costs and time degradation as function of different maintenance activities, the GHT should have direct contact with the sheet pile suppliers.
Figure 6.6: Input User Interface of the demonstrator tool programmed in Excel for the use case of quay walls.
6.4 Scenario analysis This section describes two different LCC calculations performed for two different scenarios, presented in Sections 6.3.1and 6.3.2 respectively. Each scenario varies preventive and corrective maintenance tasks in different ways. The general variables and their values used for these scenario analysis are shown in Table 6.2. The idea of considering the control of the asset’s life-cycle is to enable long term planning. A long-term plan or policy will give us the control of where and when to allocate resources to ensure an efficient and effective management. This requires the trade-off between performance of the asset and the cost for maintaining its function, which can be done by assessing different investment scenarios. The chosen scenarios are based on two realistic policies that the GHT Company can apply. While the corrective scenario minimizes costs by avoiding maintenance tasks, the preventive scenario maximizes availability and reliability by applying preventive maintenance measures on a frequent basis.
The scenarios have been discussed with the manager of the GHT Company. Data on failures due to accidents and the user delay costs are based on information provided by the asset managers. For the two scenarios it is forecasted that one accident will occur per year affecting 10 m2 of the quay walls. An example of an accident is a vessel crashing into a sheet pile and causing damage to it. The initial construction and end-of-life costs will be the same for the two scenarios. The identification of the User Delay Cost will assist an asset manager to select the most rapid and adequate policy or method during the conceptual phases of a project planning. The User Delay Costs will not be covered by the GHT but by users of the Twente channel as own risk. However, it is used as an indicator for the planners to
Maintenance Policy
Asset category Asset Type Length (m) Height (m) Area (m2) Service Life (year) Discount rate
Seaway Steel sheet pile wall 100 15 1500 50 0,75%
Yes/No Activity cycle (years) Frequency Measure Unit Measure1,00 Coffedam based corrective maintenance 5 10 m2 90 Assumption1,00 soil_leveling 10 5 m 1000,00 Routine_inspection1,00 Re-construction NA 2 m2 900,00 Detail_Inspection
Maintenance Policy
Asset category Asset Type Length (m) Height (m) Area (m2) Service Life (year) Discount rate
Seaway Steel sheet pile wall 100 15 1500 50 0,75%
Yes/No Activity Cycle (years) Frequency Measure Unit Measure1,00 Coffedam based preventive maintenance 15 3 m2 15001,00 soil_leveling 10 5 m 1001,00 Routine_inspection 3 17 m 1000,00 Re-construction 0 m2 901,00 Detail_Inspection 5 10 m 100
Scenario 2 - Preventive policy
Scenario 1 - Corrective policy

57
avoid major inconvenience to the users of the area. The discount rate of 0.75% applied is based on the current value fixed by the central bank of the Netherlands (mecometer.com).
6.4.1 Scenario 1 – Corrective maintenance policy This scenario seeks to avoid any economical investment unless needed after asset failure. Table 6.1 described possible failures. This scenario is based on the maintenance actions and frequencies applied currently by the asset managers of the Twente channel. As different policies apply, this scenario is an indication and not a reproduction of their exact policies. Currently, the quays are repaired whenever a failure occurs. Therefore, they apply a corrective policy. A corrective policy is a high risk approach because it ignores the real situation of the quay. As a consequences, sections of the quay wall may require a reconstruction, rather than just a corrective maintenance action. Therefore, this scenario considers that two reconstructions will be requested in two different moments, each for a length of 6 meters. Figure 6.7 shows the frequency for each LCC component during the life span of 50 years. Soil leveling is applied every 10 years, as this is the frequency applied currently by the asset managers of the municipalities involved in the Twente Channel. Table 6.2 describes the frequency of each activity for each scenario.
6.4.2 Scenario 2 – Preventive maintenance policy This scenario is designed with the goal of having a low failure risk and accomplishing the full service life of the quay wall. An infrastructure that has failed as a consequence of deterioration requires more time and resources for its reparation. Furthermore, deterioration might affect the users of the channel as well, as it might disrupt the transit of vessels causing delays, which are reflected in economic losses. The main source for deterioration in the steel sheet pile is corrosion. Figure 6.8 shows the frequency for each LCC component during the life span of 50 years. Table 6.2 describes the frequency of each activity for each scenario.
Table 6.2: Costs used for scenario analysis Activity Unit cost Scenario 1 Scenario 2
Construction cost €1333/m2 Year 0: construction Year 25: Reconstruction section
6m x 15m Year 35: Reconstruction section
6m x 15m
Year 0 No
reconstruction
Routine Inspection €50 per time for 100 meters
NA Cycle, 3 years interval
Detailed inspection €250 per time for 100 meters
NA Cyclic, 5 years internal
Cofferdam preventive maintenance
1% per square meters of construction cost per
NA Cyclic, 15 years interval
Cofferdam corrective maintenance
1% per square meter of construction cost per
Cycle, 5 years interval NA
Soil levelling €10.000 per 100 meters Cycle, 10 years interval Cycle, 10 years interval
End of life 20% per square meter of construction cost
1 at year 50
Discount rate 0.75% Length of quay wall 100 meters
High of quay wall 15 meters Life cycle length 50 years
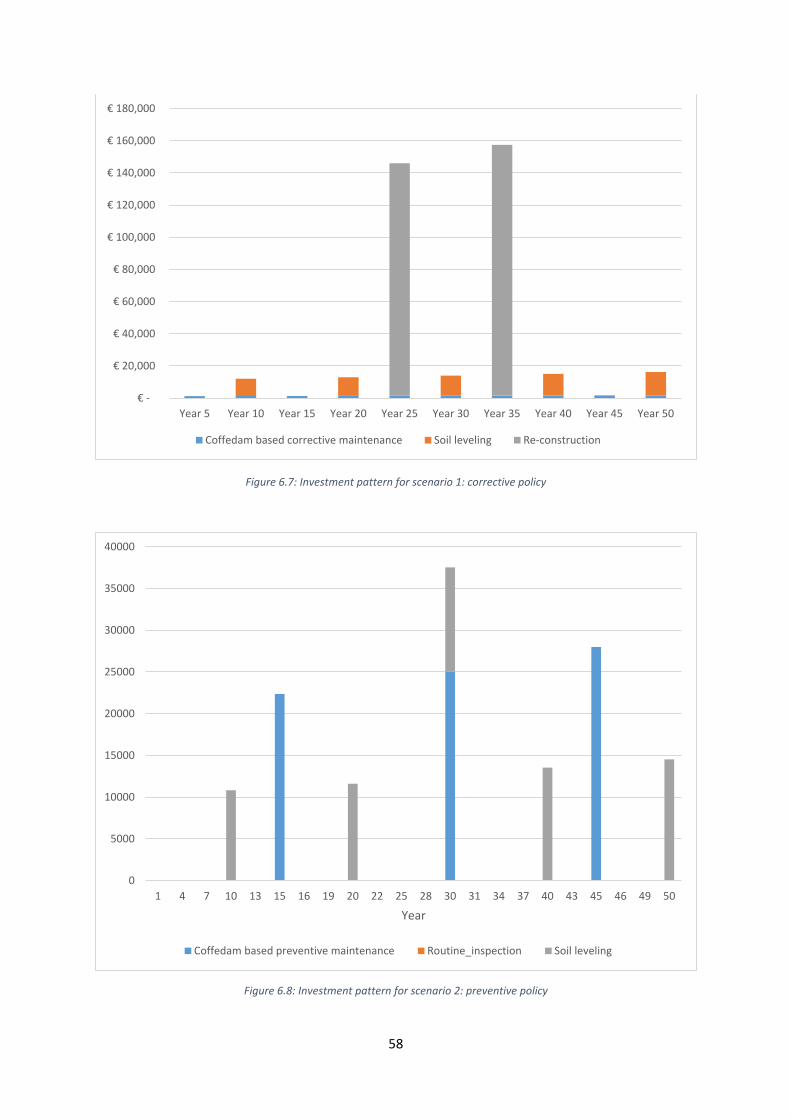
58
Figure 6.7: Investment pattern for scenario 1: corrective policy
Figure 6.8: Investment pattern for scenario 2: preventive policy
€ -
€ 20,000
€ 40,000
€ 60,000
€ 80,000
€ 100,000
€ 120,000
€ 140,000
€ 160,000
€ 180,000
Year 5 Year 10 Year 15 Year 20 Year 25 Year 30 Year 35 Year 40 Year 45 Year 50
Coffedam based corrective maintenance Soil leveling Re-construction
0
5000
10000
15000
20000
25000
30000
35000
40000
1 4 7 10 13 15 16 19 20 22 25 28 30 31 34 37 40 43 45 46 49 50
Year
Coffedam based preventive maintenance Routine_inspection Soil leveling
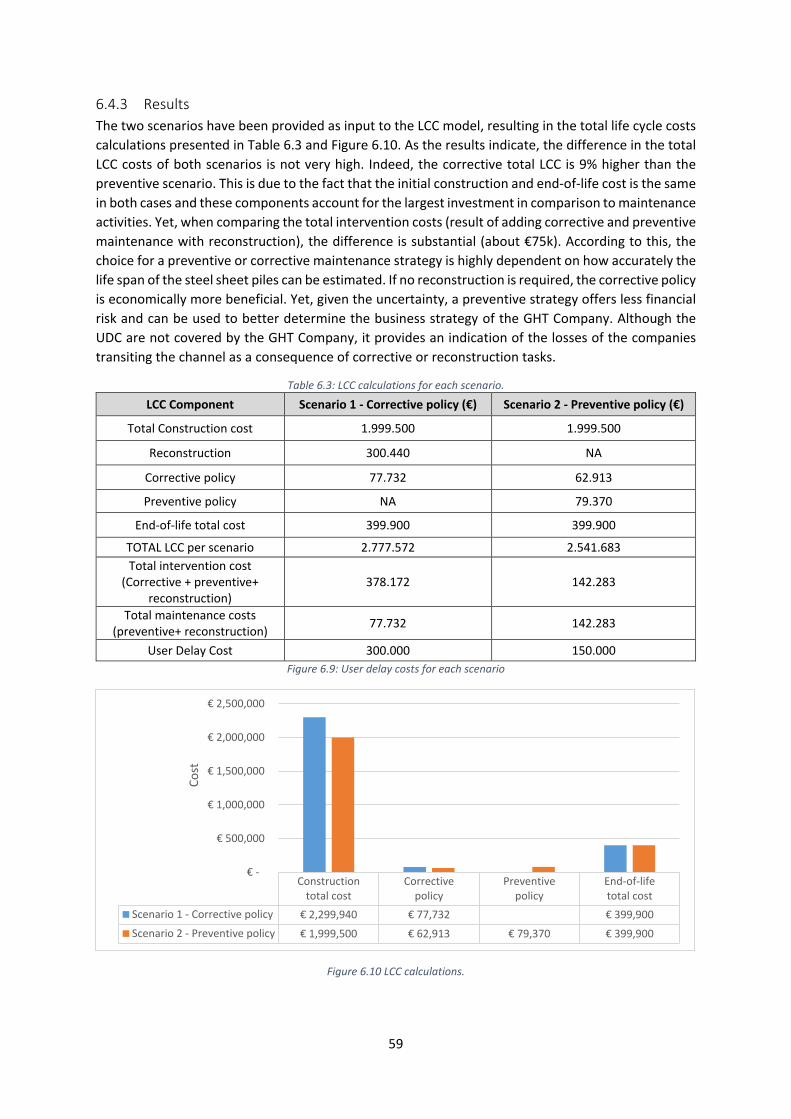
59
6.4.3 Results The two scenarios have been provided as input to the LCC model, resulting in the total life cycle costs calculations presented in Table 6.3 and Figure 6.10. As the results indicate, the difference in the total LCC costs of both scenarios is not very high. Indeed, the corrective total LCC is 9% higher than the preventive scenario. This is due to the fact that the initial construction and end-of-life cost is the same in both cases and these components account for the largest investment in comparison to maintenance activities. Yet, when comparing the total intervention costs (result of adding corrective and preventive maintenance with reconstruction), the difference is substantial (about €75k). According to this, the choice for a preventive or corrective maintenance strategy is highly dependent on how accurately the life span of the steel sheet piles can be estimated. If no reconstruction is required, the corrective policy is economically more beneficial. Yet, given the uncertainty, a preventive strategy offers less financial risk and can be used to better determine the business strategy of the GHT Company. Although the UDC are not covered by the GHT Company, it provides an indication of the losses of the companies transiting the channel as a consequence of corrective or reconstruction tasks.
Table 6.3: LCC calculations for each scenario.
LCC Component Scenario 1 - Corrective policy (€) Scenario 2 - Preventive policy (€)
Total Construction cost 1.999.500 1.999.500
Reconstruction 300.440 NA
Corrective policy 77.732 62.913
Preventive policy NA 79.370
End-of-life total cost 399.900 399.900
TOTAL LCC per scenario 2.777.572 2.541.683 Total intervention cost
(Corrective + preventive+ reconstruction)
378.172 142.283
Total maintenance costs (preventive+ reconstruction) 77.732 142.283
User Delay Cost 300.000 150.000 Figure 6.9: User delay costs for each scenario
Figure 6.10 LCC calculations.
Constructiontotal cost
Correctivepolicy
Preventivepolicy
End-of-lifetotal cost
Scenario 1 - Corrective policy € 2,299,940 € 77,732 € 399,900 Scenario 2 - Preventive policy € 1,999,500 € 62,913 € 79,370 € 399,900
€ -
€ 500,000
€ 1,000,000
€ 1,500,000
€ 2,000,000
€ 2,500,000
Cost

60
Another way of analyzing these results is by defining two extra Key Performance Indicators (KPIs), namely, the availability and the reliability. Availability indicates the percentage of time that the system is operationally capable of performing its main business functions, and it is expressed as (down time/ (uptime + downtime)) [DoD report, 2009]. The reliability measures the probability that a system will perform without having a failure in a predefined time period [DoD report, 2009]. For the case of the quay walls, these two KPIs cannot be quantified, because of a lack of historic data. Yet, a qualitative indication can be made by considering the corrective and preventive actions that were chosen for each scenario. Scenario 1 assumes that two reconstruction works will be required because of failure of the quay walls due to lack of maintenance. This reconstruction works will cause downtimes, reducing the availability of the quay. Furthermore, the lack of maintenance also results in high uncertainties regarding the actual corrosion state of the steel sheet piles. This in turn translated into a low reliability of the structure. Scenario 2 is based on a preventive maintenance strategy, and as such, it has a higher reliability than the scenario 1. Furthermore, as the preventive actions can be performed by installing small cofferdam systems, the down times of this scenario are also expected to be low, which in turn results in a high availability. A summary of the KPIs for both scenarios is shown in Table 6.4. Based on this results, I recommend to further study scenario 2, as it has the best performances, both economically and performance wise.
Table 6.4: KPIs for each scenario Performance indicators Scenario 1 Scenario 2 Availability Low High Reliability Low High Total intervention cost High Moderate Total Maintenance cost Low Moderate User delay costs High Moderate Good Neutral Bad
6.5 Sensitivity Analysis Sensitivity analysis improves decision making by quantifying how robust a design choice is against (1) errors in the choice of input parameters and (2) future changes of input values. Furthermore, a sensitivity analysis also helps decision makers in determining which should be the parameters to focus on when optimizing a solution strategy. The most sensitive parameters have the largest opportunities of influencing the outputs of a model. For the case of this project, the sensitivity analysis has the following goals:
1. Determining how sensitive is scenario 2 to the uncertainty of the input values. This is important to determine because the parameter values that have been used for making the LCC calculations could not be defined accurately as neither literature of the GHT provides accurate data.
2. Determine how sensitive is scenario 2 to changes of the input data that are expected to take place in reality. This is important as it allows assessing how robust this solution is on the long term.
The analysis is performed using the One Factor at a Time technique [Hamby, 1994], in which the value of only one factor is changed between a high value and a low value, while keeping all the other factors at their nominal values. Only the total maintenance costs output value is used, as the construction and end of life costs are not influenced by the parameters chosen for this sensitivity analysis. Table 6.5 summarizes the values considered for the sensitivity analysis. Figure 6.12 shows the results of this sensitivity analysis. The following analyze the results and make conclusions on how this results will influence maintenance policy decisions.
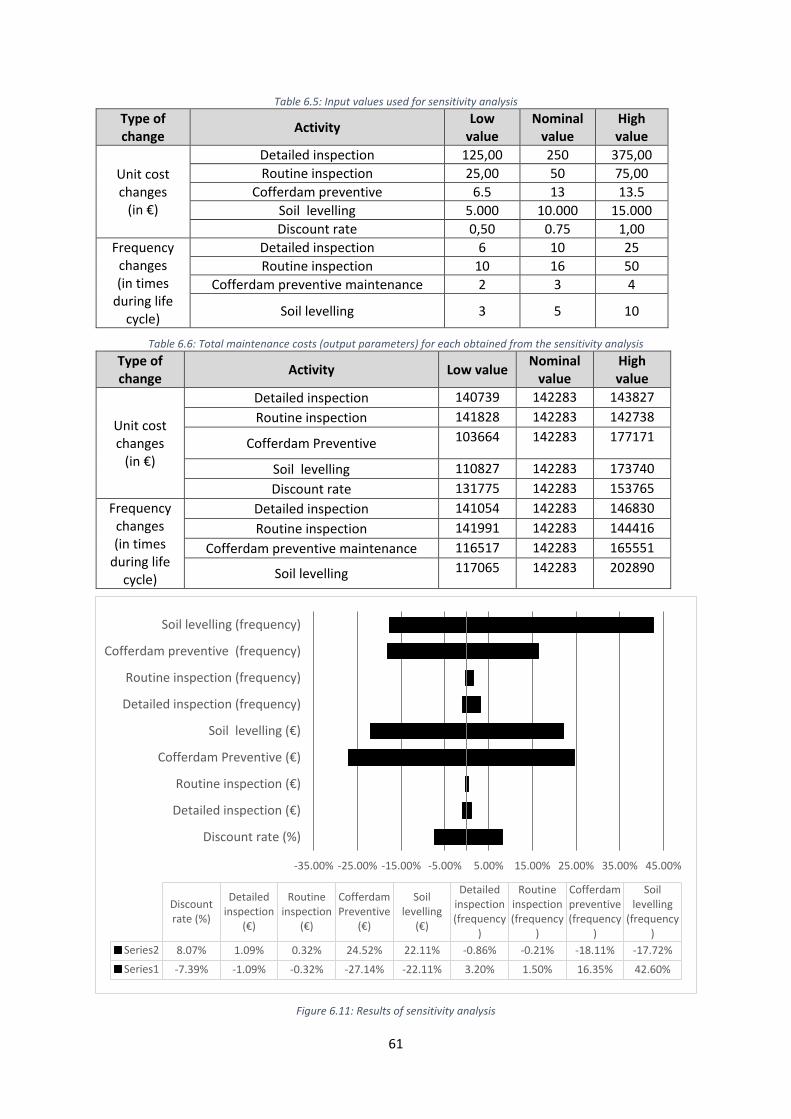
61
Table 6.5: Input values used for sensitivity analysis Type of change Activity Low
value Nominal
value High value
Unit cost changes
(in €)
Detailed inspection 125,00 250 375,00 Routine inspection 25,00 50 75,00
Cofferdam preventive 6.5 13 13.5 Soil levelling 5.000 10.000 15.000 Discount rate 0,50 0.75 1,00
Frequency changes (in times
during life cycle)
Detailed inspection 6 10 25 Routine inspection 10 16 50
Cofferdam preventive maintenance 2 3 4
Soil levelling 3 5 10
Table 6.6: Total maintenance costs (output parameters) for each obtained from the sensitivity analysis Type of change Activity Low value Nominal
value High value
Unit cost changes
(in €)
Detailed inspection 140739 142283 143827 Routine inspection 141828 142283 142738
Cofferdam Preventive 103664 142283 177171
Soil levelling 110827 142283 173740 Discount rate 131775 142283 153765
Frequency changes (in times
during life cycle)
Detailed inspection 141054 142283 146830 Routine inspection 141991 142283 144416
Cofferdam preventive maintenance 116517 142283 165551
Soil levelling 117065 142283 202890
Figure 6.11: Results of sensitivity analysis
-35.00% -25.00% -15.00% -5.00% 5.00% 15.00% 25.00% 35.00% 45.00%
Discount rate (%)
Detailed inspection (€)
Routine inspection (€)
Cofferdam Preventive (€)
Soil levelling (€)
Detailed inspection (frequency)
Routine inspection (frequency)
Cofferdam preventive (frequency)
Soil levelling (frequency)
Discountrate (%)
Detailed inspection
(€)
Routine inspection
(€)
Cofferdam Preventive
(€)
Soil levelling
(€)
Detailedinspection(frequency
)
Routineinspection(frequency
)
Cofferdampreventive(frequency
)
Soillevelling
(frequency)
Series2 8.07% 1.09% 0.32% 24.52% 22.11% -0.86% -0.21% -18.11% -17.72%Series1 -7.39% -1.09% -0.32% -27.14% -22.11% 3.20% 1.50% 16.35% 42.60%
62
6.6 Discussion of sensitivity results This section provides an analysis of the obtained results shown in Section 6.5.
6.6.1 Detailed inspection, routine inspection & soil levelling These parameters share their sources of uncertainty. On the one hand, the unit cost of these activities is based on the historic data that the GHT has on the cost of maintenance activities performed at the Twente channel. According to this data, this unit cost is the same for quay walls varying from 100 meters in length to 300 meters in length. On the other hand, the frequency of occurrence is also different for different quay walls managed by different municipalities. As this information is rather inconsistent, it is important to determine how the maintenance costs for the whole life cycle is influenced by errors in this values.
Detailed inspection The unit cost of the detailed inspection was varied between +50% and -50% of its nominal cost, while the frequency varied between 6 times and 25 times spread during the 50 years life cycle of the asset. As Figure 6.11 shows, neither of both values have an important influence on the total maintenance costs, as the percentages of change is between 1% and 2%. It can be recommended that detailed inspection as a maintenance preventive measure should be implemented, due to the lowering the risk by increasing the knowledge of the structure performance and very low impact on the total cost.
Routine inspection The unit costs of the routine inspection was varied between -50% and +50% of its nominal costs, while the frequency varied between 10 times and 50 times spread during the 50 years life cycle of the asset. The change of maintenance costs for these four calculations were no greater than 1.5% for any of the cases. Therefore, the total preventive maintenance costs is not sensitivity to large changes of the routine cost. This results follow from the fact the unit cost for routine inspections is low in comparison to others. It can be recommended that routine inspection as a maintenance preventive measure should be implemented, due to the lowering the risk by increasing the knowledge of the structure performance and very low impact on the total cost.
Soil leveling The unit cost of the soil levelling activity was also varied between -50% and 50% of the nominal value. This results in a change of total maintenance cost of 22%. Although the sensitivity percentages (22%) is lower than the total change percentage applied (50%), it is an important source for variability of the final cost. Yet, the calculations performed with an increase of 50% of the unit the costs remain lower than the total costs of the corrective maintenance scenario, keeping this policy as the most appropriate one given uncertainties in the soil levelling costs. This results also indicate that the accuracy of the soil leveling cost should be improved in order to improve the accuracy of the LCC calculations.
The frequency of the soil levelling activity was varied between 3 times (15 year cycles) and 10 times (5 years cycles) for the whole life cycle. The results show that the total maintenance costs are rather sensitive to the frequency of this activity. In fact, performing this activity 10 times (5 year cycle) changes the final cost in about 42% of the nominal cost. This indicates that the GHT should carefully determine the optimal cycle time for this activity in order to optimize the investments.
It can be recommended that soil levelling as a maintenance corrective measure should be implemented, as it improves the life span of the asset an avoids having to perform more costly corrective actions, even if the total cost due to an increase of frequency and unit cost.

63
6.6.2 Cofferdam based preventive maintenance The frequency and the unit cost of the cofferdam based preventive maintenance are based on the work presented by [Gijt 2011], who got construction and maintenance costs data of the quay walls of the port of Rotterdam. The unit cost of this activity is strongly related to the combination of maintenance tasks performed in this activity (consider the maintenance tasks described in Section 6.2.3). Here, we follow Gijt’s data that indicates an uncertainty of 0.5% in the total maintenance activity costs, and assume that this uncertainty in caused by the fact that different combinations of cofferdam based maintenance activities may be required for different sections of the quay walls, the maintenance cost can vary from 0.5% of the construction cost up to 1.5% of it. The results shown in Figure 6.11 indicate that this parameter has a strong influence on the total maintenance cost (about 25%). As the source of uncertainty of this parameter is related to not knowing the corrosion state of the sheet piles, the GHT should consider that even if having an accurate cost estimation of maintenance tasks, the final cost can vary considerably. Yet, even in this case, the preventive scenario remains more economically efficient than the corrective one.
As no study has been found during this project that predicts the life span of the sheet piles as a function of the maintenance provided, the frequency is a parameter with a high uncertainty, and therefore, that can have a large impact on the total LCC cost. Indeed, the results in Figure 6.11 shows that an increase or decrease of one in the number of times maintenance is applied can change between 16% and 18% the final life cycle cost. Although this uncertainty does not change the preference of the preventive scenario (scenario 2) over the corrective scenario (scenario 1), it is important for the GHT to carefully track the degradation of the sheet piles in relation to the frequency of maintenance. Furthermore, improving this value, by for example keeping historic data, will also help the company in improving its reliability.
It is recommended to apply cofferdam based preventive maintenance measure, as it improves the availability and reliability of the quay, even in the case the costs are higher than the nominal value because of an increase in frequency and unit cost of this activity.
6.6.3 Discount rate The discount rate is a variable that the GHT cannot control, and therefore it represents an external source of uncertainty. Analyzing the discount rate data of the Netherlands for the past 10 years, shows that this value can change significantly, especially over a life span of 50 years. For the case of this study, I have analyzed the effects of a 50% change of this value. Results in Figure 6.11 show that the change in LCC is about 5%.
6.7 Conclusions This chapter demonstrated the application of the LCC model by implementing it for the quay walls. The following requirements have been addressed:
R10.The AMS Tool enables entering several scenarios concurrently to compare them to form a decision.
R11.The AMS Tool enables entering different scenarios based on different combinations of inspection, preventive maintenance and corrective maintenance.
R12.The AMS Tool enables making sensitivity analysis in the process of forming scenarios.
The tool enables changing scenarios by considering different combinations of inputs values (as indicated in Section 6.3) like for example maintenance policies, unit price of maintenance activities, and interest rate. The tool also enables making a sensitivity analysis.

64
Based on the results of this demonstrator, two main conclusions can be drawn in relation to the LCC of the quay walls. Firstly, a preventive maintenance policy is preferred over a corrective one, as the LCC costs are lower and the availability and reliability are higher. The sensitivity analysis demonstrates this option is better even in the presence of uncertainty of the input values. Secondly, it is recommended that the GHT Company keeps historical data of maintenance tasks, their costs and the condition state (mostly related to corrosion damage) of the sheet piles in order to estimate better the frequency of maintenance actions and improve the accuracy of the unit costs.
65
7 Conclusions & Recommendations This PDEng project developed an LCC model to support the newly conformed GHT Company, which will be in charge of managing the assets present at the Twente channel.
The first objective of this project was to determine the purpose and application of an LCC model for the GHT Company. This objective has been accomplished by performing interviews with engineers and asset managers of the municipalities involved currently in the Twente channel to understand their decision making process as well as by understanding how the literature positions LCC models for supporting asset management decisions.
The second objective of this project was to develop the LCC calculation model suiting the GHT requirements. The developed model considers construction, operational costs, preventive maintenance costs, corrective costs and end-of life costs. The NPV was selected as main KPI to be calculated, as it is often used to determine long term profitability of a capital investment, and therefore, it is more suited for making strategic decisions.
The third objective of this project was to determine how to structure the asset data for the model in a logical way. This objective was accomplished by developing a taxonomy of the assets (and their attributes) present at the Twente channel. The taxonomy was evaluated in a workshop with stakeholders (both from the municipality as well as from private companies) involved in the asset management of the Twente channel. This workshop helped creating the first unified view on how the GHT should structure their assets information. This is in itself a valuable result for the GHT, as the stakeholders had their own implicit structures, and by making it explicit, an agreement was achieved on how this structure should be. To conclude, it is recommended for the GHT to use this taxonomy to structure the database system in which the LCC model will be implemented as a software.
The fourth objective of this project was to determine how the GHT can implement the data storage system to feed the model. This objective was achieved by designing a database architecture for the GHT Company. The database was designed considering it as part of a larger context of databases of each of the five municipalities involved in the Twente channel. First, interviews with asset managers of the Hengelo municipality were performed to understand which data is available and the different databases used for storing it. Then, a new database architecture was proposed. This new database system considers classes for defining asset management tasks and schedules (e.g. a given corrective maintenance action), for storing assets data, for storing the assets location, for storing the different LCC model cost components and finally for keeping a base of employees that use this data. While most of the data should be gathered and stored by the GHT, data related to the location of the asset should be obtained from the current systems at the municipalities.
The final objective of this project was to study the benefits of the model by implementing a demonstrator for the use case of quay walls made of steel sheet piles. This objective was accomplished by first determining the asset management activities for each of the elements of interest of the LCC model (construction, preventive and corrective maintenance, and end-of life), second by determining how to calculate their cost, and finally by programing an Excel tool able to calculate the NPV for different combinations of model inputs. This was used to define two different long term investment scenarios.

66
The two main conclusions that can be drawn from this study are:
1. A preventive maintenance policy is preferred over a corrective one, as the LCC costs are lower and the availability and reliability are higher. The sensitivity analysis demonstrated that this approach is better choice in the presence of uncertainties of the input values.
2. The GHT Company is recommended to keep historic of maintenance tasks, their costs and the corrosion state of the sheet piles in order to estimate better the frequency of maintenance actions and improve the accuracy of the unit costs.
To conclude, the GHT Company it advised to implement the LCC model developed in this project, as it will enable the company in
- Selecting the best alternative to meet a maintenance strategy objective - Evaluating a design requirement within a specific maintenance strategy - Comparing overall costs between different types of maintenance strategies to help prioritize
limited funding in an agency-wide program - Calculating the most-effective approaches to maintenance strategy implementation
The company is also advised to carefully consider the data gathering and storage mechanism, as the sensitivity analysis demonstrates how errors in unit price calculations and activity frequency can result in large differences in total LCC calculations.

67
References ASCE Report, 2014. “Maximizing the Value of Investment Using Life Cycle Cost Analysis”.
Blessing, Lucienne, T.M., Chakrabarti; Amaresh, 2009. “The Design Research Method”.
Boulila, N., Herrmann, A. 2011. “Using Storytelling to record requirements: Elements for an effective requirements elicitation approach”.
Barringer, P., Weber D., 1996. “Life Cycle Cost Tutorial”
Cobouw, 2010. “Xeiz-concept slaat bruggen in beheer openbare ruimte”.
Dhirendra, P., Ramani, A. K., Suman, U., 2010. “An Effective Requirement Engineering Process Model for Software Development and Requirements Management”
Department of Defense, 2009. “Reliability, Availability, Maintainability, and Cost Rationale Report Manual”
Esri Nederland, 2013. “GeoBasis BRK”.
Frangopol, D. M., liu, M., 2005. “Maintenance and management of civil infrastructure based on condition, safety, optimization and life-cycle cost”.
Frangopol, D. M. 2010. “Life-cycle performance, management, and optimization of structural systems under uncertainty: accomplishments and challenges”.
Greimann, L.F., and J.H. Stecker. 1990b. “Maintenance and Repair of Steel Sheet Pile Structures.” Technical Report REMR-OM-09. Washington, DC: U.S. Army Corps of Engineers.
Gijt, J. de, 2011. “Cost of quay walls”.
Heim, H., 2007. “The resonant interface. HCI foundations for interaction design”.
Hamby, D. M., 1994. “A review of techniques for parameter sensitivity analysis of environmental models”
International institute of business analysis (IIBA), 2009. “Business Analysis Body of Knowledge 2.0”
Kadaster register, 2014. “Basisregistraties Adressen en Gebouwen”.
Lingegard, S., Lindahl, M., Syberg, A., 2015. “Life-cycle Cost strategies for harbors, a case study”.
Madsen S., Nielsen, L., 2009. “Using Storytelling to Identify Requirements – Exploring Persona-Scenarios in Context”.
Maguire, E. 2011. “Taxonomy in Biology and Visualization”.
Mecometer.com
Meillier, A., 2000. “A review of galvanic anode cathodic protection design procedure”.
Microformats community, 2010. "Geo Spec"
Muller, R., 1999. “Database design for smarties”
Boulila N., Hoffmann A., Herrmann A., 2011. “Using Storytelling to record requirements: Elements for an effective requirements elicitation approach”
OMG UML, Superstructure, V2.4.1, 2011 “UML Revision Task Force”.
Osorio, P., Odenbreit, C., Vrouwenvelder, T. 2010. “Structural reliability analysis of quay walls with steel sheet piles”
Pandey, P., Suman, U., Ramani, A. K., 2010. “An Effective Requirement Engineering Process Model for Software Development and Requirements Management”.
Pantelias, A., Flintsch, G. W., Bryant, James W., Chen Chen, 2009. “Asset Management Data Practices for Supporting Project Selection Decisions”.

68
PIANC, Report no 103, 2008. “Life Cycle Management of Port Structures Recommended Practices for Implementation”.
Reggio, G., Leotta, M., Ricca, F., Clerissi, D., 2011. What are the used UML diagrams? A Preliminary Survey
Rens, K., Liu, R., and Foltz, S., 2013. “A Sustainable Approach for Optimal Steel Sheet Pile Structure Assessment, Maintenance, and Rehabilitation”.
Rijksoverheid. Stelsel van basisregistraties. “Basisregistratie Grootschalige Topografie”.
Rijkswaterstaat, 2010. “Leidraad RAMS - Sturen op prestaties van systemen”
Shapiro, M., 1986. Int. Conf. on Dist. Comp. Sys. (ICDCS), Cambridge MA (USA). “Structure and Encapsulation in Distributed Systems: the Proxy Principle”.
Simpson, M., 2010. “Plant Systematics”.
Technical Report EIC group, 2009. “Comparison Retaining Wall Design and Cost Study Steel Sheet Piling vs. Various Walls”.
U.S. Army Center for Public Works, 1992-2011. “Public Works Technical Bulletins”
Wiegers, K. E., 2009. 2nd Edition”Microsoft Press “Software Requirements”
Woodward, D. 1997. “Life cycle costing – theory, information acquisition and application”.
www.CORRPRO.com. “Cathodic Protection Specification”
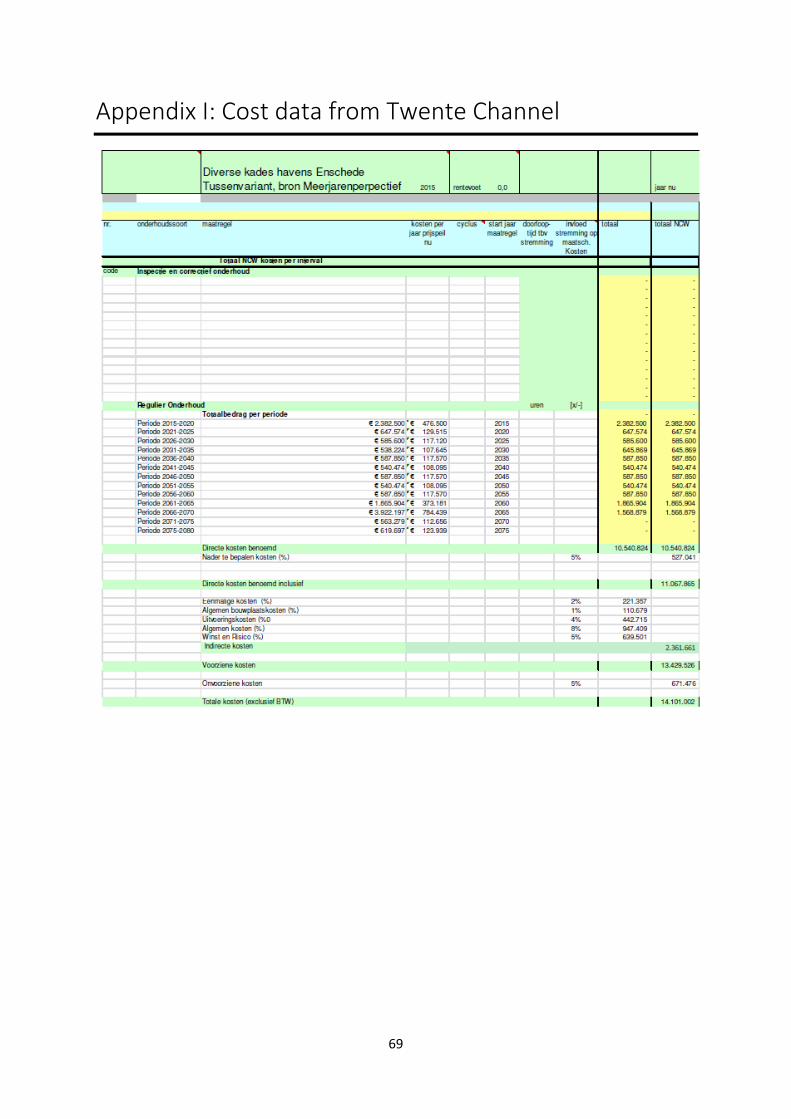
69
Appendix I: Cost data from Twente Channel
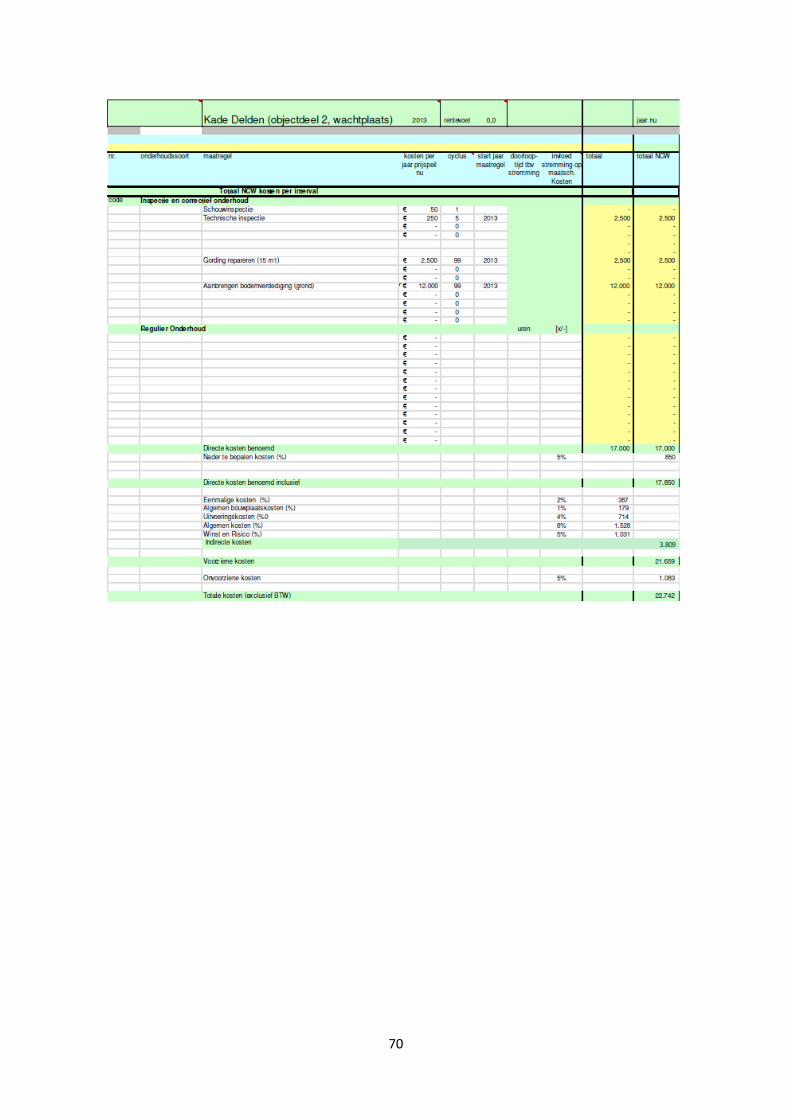
70
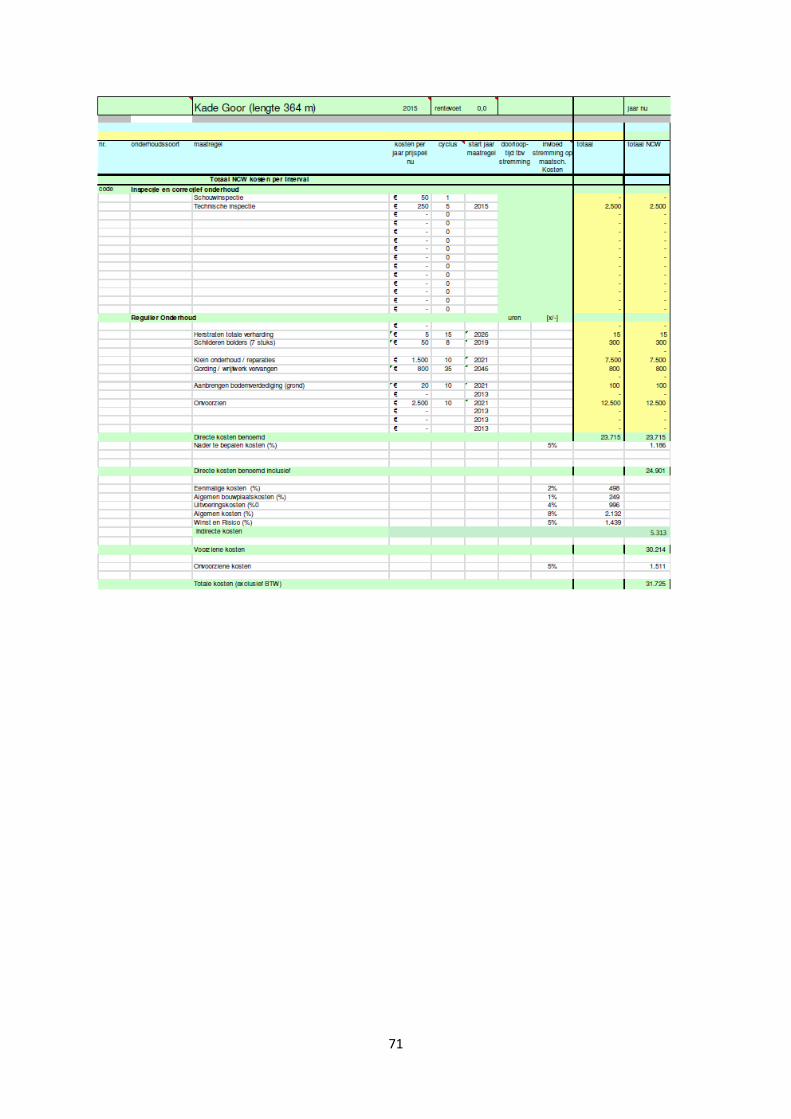
71
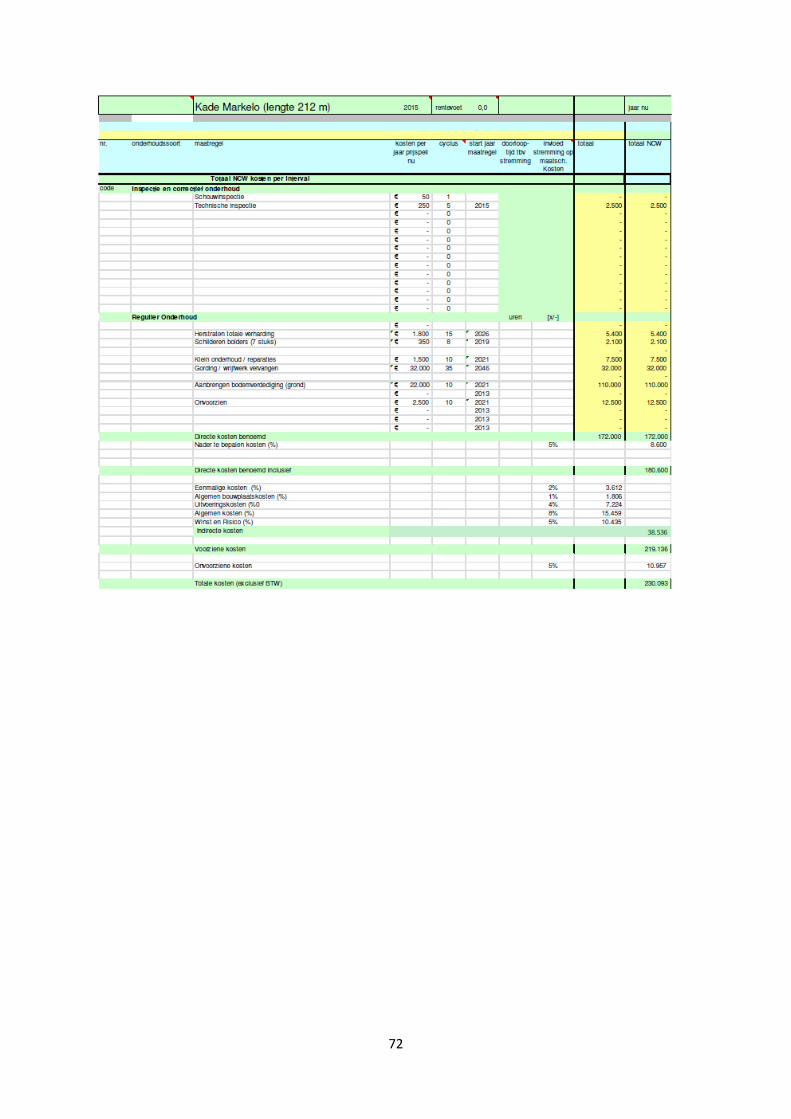
72
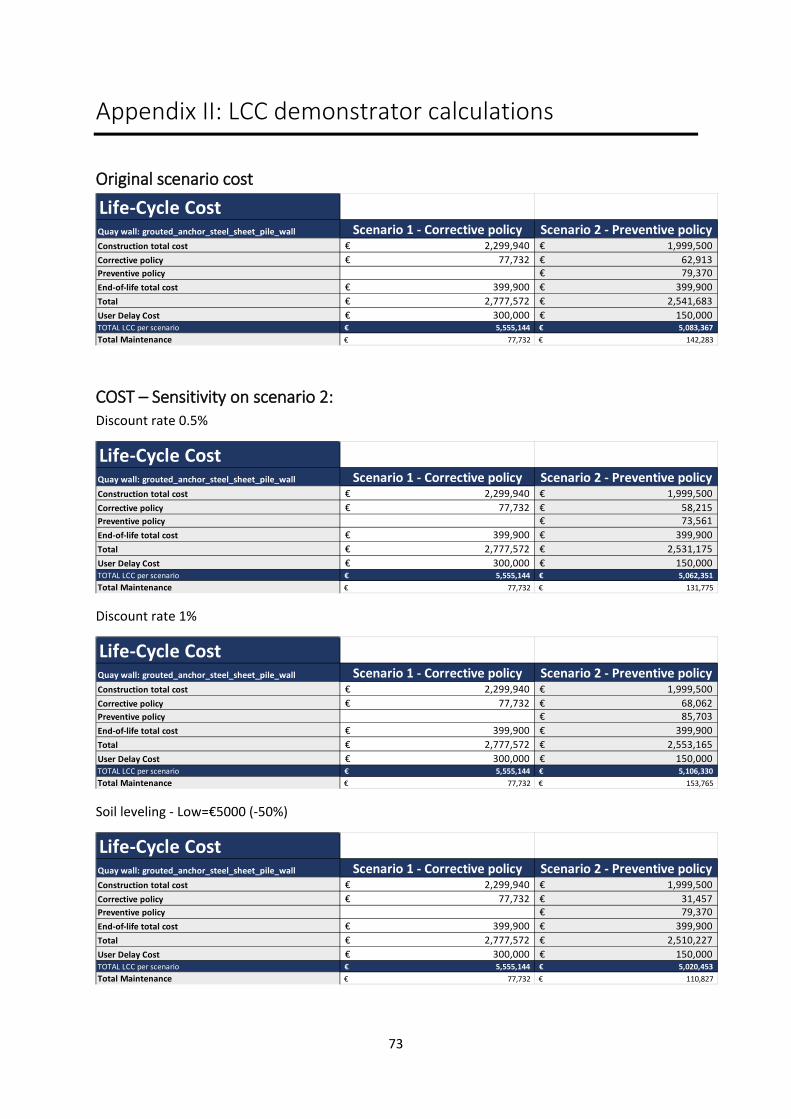
73
Appendix II: LCC demonstrator calculations Original scenario cost
COST – Sensitivity on scenario 2: Discount rate 0.5%
Discount rate 1%
Soil leveling - Low=€5000 (-50%)
Life-Cycle Cost Quay wall: grouted_anchor_steel_sheet_pile_wall Scenario 1 - Corrective policy Scenario 2 - Preventive policyConstruction total cost 2,299,940€ 1,999,500€ Corrective policy 77,732€ 62,913€ Preventive policy 79,370€ End-of-life total cost 399,900€ 399,900€ Total 2,777,572€ 2,541,683€ User Delay Cost 300,000€ 150,000€ TOTAL LCC per scenario 5,555,144€ 5,083,367€ Total Maintenance 77,732€ 142,283€
Life-Cycle Cost Quay wall: grouted_anchor_steel_sheet_pile_wall Scenario 1 - Corrective policy Scenario 2 - Preventive policyConstruction total cost 2,299,940€ 1,999,500€ Corrective policy 77,732€ 58,215€ Preventive policy 73,561€ End-of-life total cost 399,900€ 399,900€ Total 2,777,572€ 2,531,175€ User Delay Cost 300,000€ 150,000€ TOTAL LCC per scenario 5,555,144€ 5,062,351€ Total Maintenance 77,732€ 131,775€
Life-Cycle Cost Quay wall: grouted_anchor_steel_sheet_pile_wall Scenario 1 - Corrective policy Scenario 2 - Preventive policyConstruction total cost 2,299,940€ 1,999,500€ Corrective policy 77,732€ 68,062€ Preventive policy 85,703€ End-of-life total cost 399,900€ 399,900€ Total 2,777,572€ 2,553,165€ User Delay Cost 300,000€ 150,000€ TOTAL LCC per scenario 5,555,144€ 5,106,330€ Total Maintenance 77,732€ 153,765€
Life-Cycle Cost Quay wall: grouted_anchor_steel_sheet_pile_wall Scenario 1 - Corrective policy Scenario 2 - Preventive policyConstruction total cost 2,299,940€ 1,999,500€ Corrective policy 77,732€ 31,457€ Preventive policy 79,370€ End-of-life total cost 399,900€ 399,900€ Total 2,777,572€ 2,510,227€ User Delay Cost 300,000€ 150,000€ TOTAL LCC per scenario 5,555,144€ 5,020,453€ Total Maintenance 77,732€ 110,827€
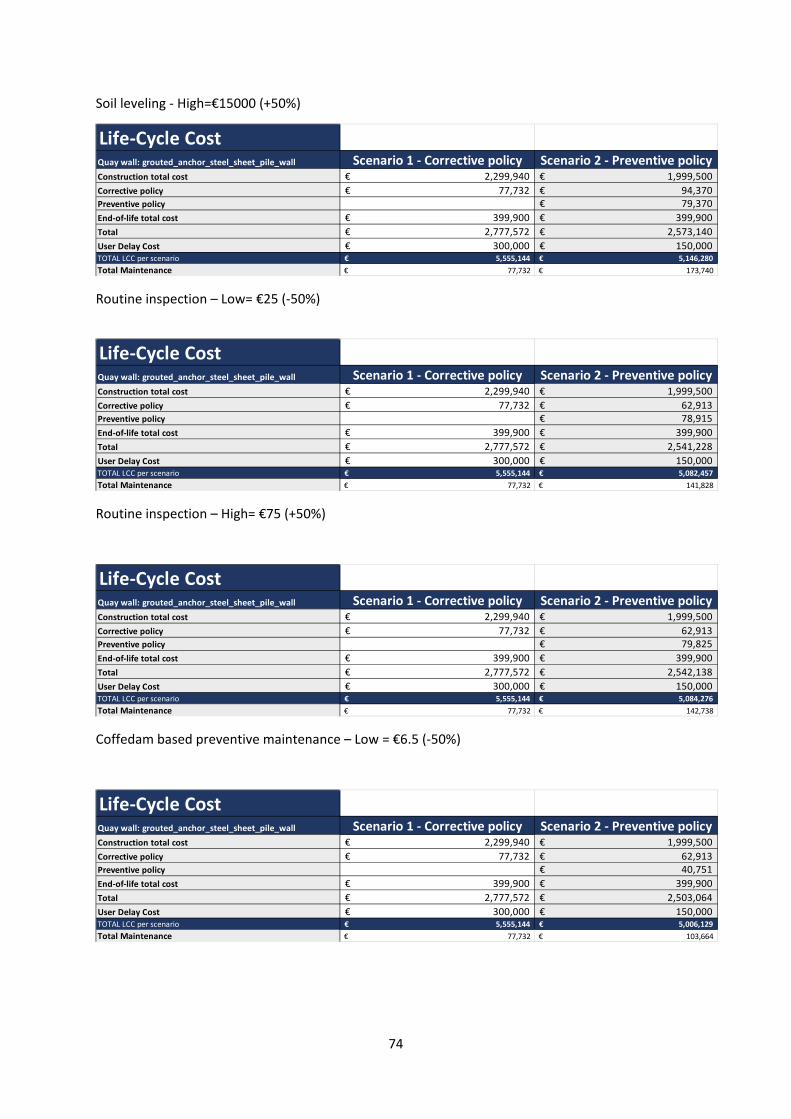
74
Soil leveling - High=€15000 (+50%)
Routine inspection – Low= €25 (-50%)
Routine inspection – High= €75 (+50%)
Coffedam based preventive maintenance – Low = €6.5 (-50%)
Life-Cycle Cost Quay wall: grouted_anchor_steel_sheet_pile_wall Scenario 1 - Corrective policy Scenario 2 - Preventive policyConstruction total cost 2,299,940€ 1,999,500€ Corrective policy 77,732€ 94,370€ Preventive policy 79,370€ End-of-life total cost 399,900€ 399,900€ Total 2,777,572€ 2,573,140€ User Delay Cost 300,000€ 150,000€ TOTAL LCC per scenario 5,555,144€ 5,146,280€ Total Maintenance 77,732€ 173,740€
Life-Cycle Cost Quay wall: grouted_anchor_steel_sheet_pile_wall Scenario 1 - Corrective policy Scenario 2 - Preventive policyConstruction total cost 2,299,940€ 1,999,500€ Corrective policy 77,732€ 62,913€ Preventive policy 78,915€ End-of-life total cost 399,900€ 399,900€ Total 2,777,572€ 2,541,228€ User Delay Cost 300,000€ 150,000€ TOTAL LCC per scenario 5,555,144€ 5,082,457€ Total Maintenance 77,732€ 141,828€
Life-Cycle Cost Quay wall: grouted_anchor_steel_sheet_pile_wall Scenario 1 - Corrective policy Scenario 2 - Preventive policyConstruction total cost 2,299,940€ 1,999,500€ Corrective policy 77,732€ 62,913€ Preventive policy 79,825€ End-of-life total cost 399,900€ 399,900€ Total 2,777,572€ 2,542,138€ User Delay Cost 300,000€ 150,000€ TOTAL LCC per scenario 5,555,144€ 5,084,276€ Total Maintenance 77,732€ 142,738€
Life-Cycle Cost Quay wall: grouted_anchor_steel_sheet_pile_wall Scenario 1 - Corrective policy Scenario 2 - Preventive policyConstruction total cost 2,299,940€ 1,999,500€ Corrective policy 77,732€ 62,913€ Preventive policy 40,751€ End-of-life total cost 399,900€ 399,900€ Total 2,777,572€ 2,503,064€ User Delay Cost 300,000€ 150,000€ TOTAL LCC per scenario 5,555,144€ 5,006,129€ Total Maintenance 77,732€ 103,664€
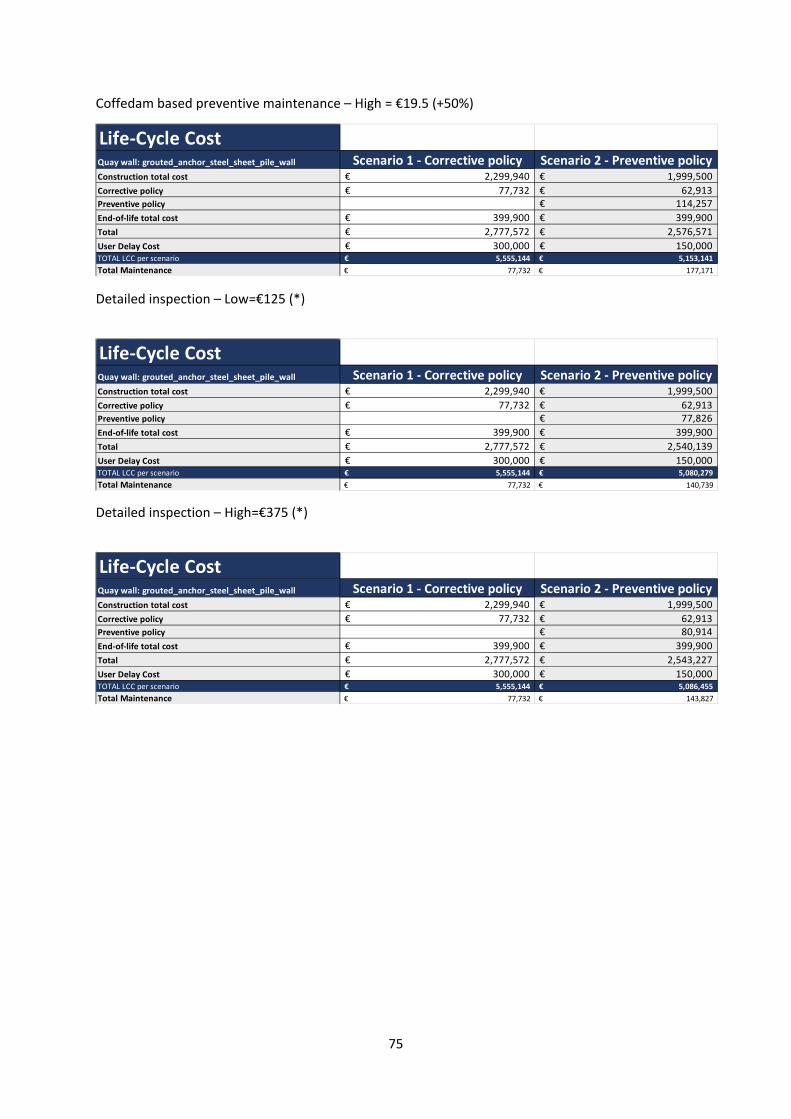
75
Coffedam based preventive maintenance – High = €19.5 (+50%)
Detailed inspection – Low=€125 (*)
Detailed inspection – High=€375 (*)
Life-Cycle Cost Quay wall: grouted_anchor_steel_sheet_pile_wall Scenario 1 - Corrective policy Scenario 2 - Preventive policyConstruction total cost 2,299,940€ 1,999,500€ Corrective policy 77,732€ 62,913€ Preventive policy 114,257€ End-of-life total cost 399,900€ 399,900€ Total 2,777,572€ 2,576,571€ User Delay Cost 300,000€ 150,000€ TOTAL LCC per scenario 5,555,144€ 5,153,141€ Total Maintenance 77,732€ 177,171€
Life-Cycle Cost Quay wall: grouted_anchor_steel_sheet_pile_wall Scenario 1 - Corrective policy Scenario 2 - Preventive policyConstruction total cost 2,299,940€ 1,999,500€ Corrective policy 77,732€ 62,913€ Preventive policy 77,826€ End-of-life total cost 399,900€ 399,900€ Total 2,777,572€ 2,540,139€ User Delay Cost 300,000€ 150,000€ TOTAL LCC per scenario 5,555,144€ 5,080,279€ Total Maintenance 77,732€ 140,739€
Life-Cycle Cost Quay wall: grouted_anchor_steel_sheet_pile_wall Scenario 1 - Corrective policy Scenario 2 - Preventive policyConstruction total cost 2,299,940€ 1,999,500€ Corrective policy 77,732€ 62,913€ Preventive policy 80,914€ End-of-life total cost 399,900€ 399,900€ Total 2,777,572€ 2,543,227€ User Delay Cost 300,000€ 150,000€ TOTAL LCC per scenario 5,555,144€ 5,086,455€ Total Maintenance 77,732€ 143,827€
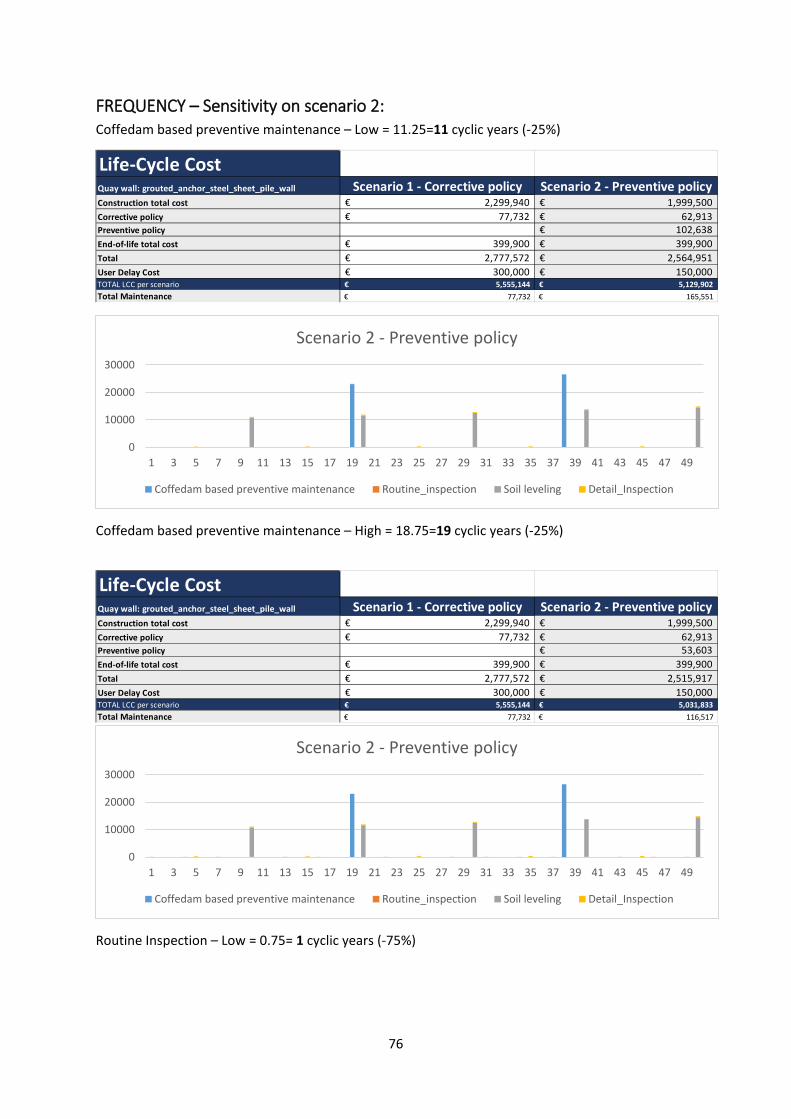
76
FREQUENCY – Sensitivity on scenario 2: Coffedam based preventive maintenance – Low = 11.25=11 cyclic years (-25%)
Coffedam based preventive maintenance – High = 18.75=19 cyclic years (-25%)
Routine Inspection – Low = 0.75= 1 cyclic years (-75%)
Life-Cycle Cost Quay wall: grouted_anchor_steel_sheet_pile_wall Scenario 1 - Corrective policy Scenario 2 - Preventive policyConstruction total cost 2,299,940€ 1,999,500€ Corrective policy 77,732€ 62,913€ Preventive policy 102,638€ End-of-life total cost 399,900€ 399,900€ Total 2,777,572€ 2,564,951€ User Delay Cost 300,000€ 150,000€ TOTAL LCC per scenario 5,555,144€ 5,129,902€ Total Maintenance 77,732€ 165,551€
0
10000
20000
30000
1 3 5 7 9 11 13 15 17 19 21 23 25 27 29 31 33 35 37 39 41 43 45 47 49
Scenario 2 - Preventive policy
Coffedam based preventive maintenance Routine_inspection Soil leveling Detail_Inspection
Life-Cycle Cost Quay wall: grouted_anchor_steel_sheet_pile_wall Scenario 1 - Corrective policy Scenario 2 - Preventive policyConstruction total cost 2,299,940€ 1,999,500€ Corrective policy 77,732€ 62,913€ Preventive policy 53,603€ End-of-life total cost 399,900€ 399,900€ Total 2,777,572€ 2,515,917€ User Delay Cost 300,000€ 150,000€ TOTAL LCC per scenario 5,555,144€ 5,031,833€ Total Maintenance 77,732€ 116,517€
0
10000
20000
30000
1 3 5 7 9 11 13 15 17 19 21 23 25 27 29 31 33 35 37 39 41 43 45 47 49
Scenario 2 - Preventive policy
Coffedam based preventive maintenance Routine_inspection Soil leveling Detail_Inspection

77
Routine Inspection – High = 5.25= 5 cyclic years (+75%)
Detailed inspection – 2 cyclic years (-50%)
Life-Cycle Cost Quay wall: grouted_anchor_steel_sheet_pile_wall Scenario 1 - Corrective policy Scenario 2 - Preventive policyConstruction total cost 2,299,940€ 1,999,500€ Corrective policy 77,732€ 62,913€ Preventive policy 81,503€ End-of-life total cost 399,900€ 399,900€ Total 2,777,572€ 2,543,816€ User Delay Cost 300,000€ 150,000€ TOTAL LCC per scenario 5,555,144€ 5,087,632€ Total Maintenance 77,732€ 144,416€
0
10000
20000
30000
40000
1 3 5 7 9 11 13 15 17 19 21 23 25 27 29 31 33 35 37 39 41 43 45 47 49
Scenario 2 - Preventive policy
Coffedam based preventive maintenance Routine_inspection Soil leveling Detail_Inspection
Life-Cycle Cost Quay wall: grouted_anchor_steel_sheet_pile_wall Scenario 1 - Corrective policy Scenario 2 - Preventive policyConstruction total cost 2,299,940€ 1,999,500€ Corrective policy 77,732€ 62,913€ Preventive policy 79,078€ End-of-life total cost 399,900€ 399,900€ Total 2,777,572€ 2,541,391€ User Delay Cost 300,000€ 150,000€ TOTAL LCC per scenario 5,555,144€ 5,082,782€ Total Maintenance 77,732€ 141,991€
0
10000
20000
30000
40000
5 10 15 20 25 30 35 40 45 50
Scenario 2 - Preventive policy
Coffedam based preventive maintenance Routine_inspection Soil leveling Detail_Inspection
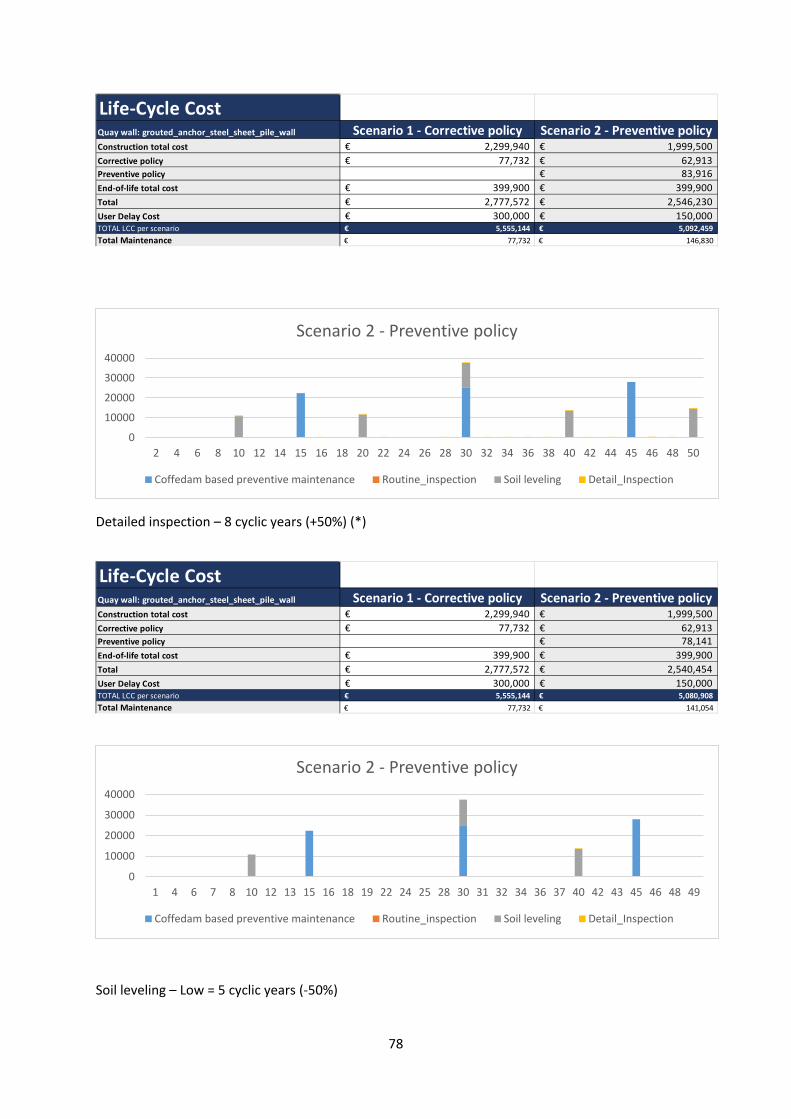
78
Detailed inspection – 8 cyclic years (+50%) (*)
Soil leveling – Low = 5 cyclic years (-50%)
Life-Cycle Cost Quay wall: grouted_anchor_steel_sheet_pile_wall Scenario 1 - Corrective policy Scenario 2 - Preventive policyConstruction total cost 2,299,940€ 1,999,500€ Corrective policy 77,732€ 62,913€ Preventive policy 83,916€ End-of-life total cost 399,900€ 399,900€ Total 2,777,572€ 2,546,230€ User Delay Cost 300,000€ 150,000€ TOTAL LCC per scenario 5,555,144€ 5,092,459€ Total Maintenance 77,732€ 146,830€
0
10000
20000
30000
40000
2 4 6 8 10 12 14 15 16 18 20 22 24 26 28 30 32 34 36 38 40 42 44 45 46 48 50
Scenario 2 - Preventive policy
Coffedam based preventive maintenance Routine_inspection Soil leveling Detail_Inspection
Life-Cycle Cost Quay wall: grouted_anchor_steel_sheet_pile_wall Scenario 1 - Corrective policy Scenario 2 - Preventive policyConstruction total cost 2,299,940€ 1,999,500€ Corrective policy 77,732€ 62,913€ Preventive policy 78,141€ End-of-life total cost 399,900€ 399,900€ Total 2,777,572€ 2,540,454€ User Delay Cost 300,000€ 150,000€ TOTAL LCC per scenario 5,555,144€ 5,080,908€ Total Maintenance 77,732€ 141,054€
0
10000
20000
30000
40000
1 4 6 7 8 10 12 13 15 16 18 19 22 24 25 28 30 31 32 34 36 37 40 42 43 45 46 48 49
Scenario 2 - Preventive policy
Coffedam based preventive maintenance Routine_inspection Soil leveling Detail_Inspection

79
Soil leveling – High = 15 cyclic years (+50%)
Life-Cycle Cost Quay wall: grouted_anchor_steel_sheet_pile_wall Scenario 1 - Corrective policy Scenario 2 - Preventive policyConstruction total cost 2,299,940€ 1,999,500€ Corrective policy 77,732€ 123,520€ Preventive policy 79,370€ End-of-life total cost 399,900€ 399,900€ Total 2,777,572€ 2,602,290€ User Delay Cost 300,000€ 150,000€ TOTAL LCC per scenario 5,555,144€ 5,204,579€ Total Maintenance 77,732€ 202,890€
0
20000
40000
60000
1 4 5 7 10 13 15 16 19 20 22 25 28 30 31 34 35 37 40 43 45 46 49 50
Scenario 2 - Preventive policy
Coffedam based preventive maintenance Routine_inspection Soil leveling Detail_Inspection
Life-Cycle Cost Quay wall: grouted_anchor_steel_sheet_pile_wall Scenario 1 - Corrective policy Scenario 2 - Preventive policyConstruction total cost 2,299,940€ 1,999,500€ Corrective policy 77,732€ 37,696€ Preventive policy 79,370€ End-of-life total cost 399,900€ 399,900€ Total 2,777,572€ 2,516,465€ User Delay Cost 300,000€ 150,000€ TOTAL LCC per scenario 5,555,144€ 5,032,931€ Total Maintenance 77,732€ 117,065€
0
20000
40000
60000
1 4 5 7 10 13 15 16 19 20 22 25 28 30 31 34 35 37 40 43 45 46 49 50
Scenario 2 - Preventive policy
Coffedam based preventive maintenance Routine_inspection Soil leveling Detail_Inspection
Related Documents


