A LAW AND FINANCE ANALYSIS OF HEDGE FUNDS* Douglas Cumming Associate Professor and Ontario Research Chair York University - Schulich School of Business 4700 Keele Street Toronto, Ontario M3J 1P3 Canada Cell: 647-280-3410 Web: http://www.schulich.yorku.ca/ http://Douglas.Cumming.com Email: [email protected] 18 September 2008 * I owe thanks to Sofia Johan, Andrew Karolyi and Michael King for helpful comments and suggestions and to Li Que for research assistance. Also, I owe thanks to the seminar participants at Hofstra University, Vanderbilt Law School, the 2007 American Law and Economics Association Annual Conference at Harvard Law School, the 2007 Western Finance Association Annual Conference, the 2007 Northern Finance Association Conference, the 2007 DeGroote Conference on Market Structure and Market Integrity, the 2008 Financial Intermediation Research Society Conference, and the 2008 Amsterdam Conference on Financial Intermediation at the Crossroads.

Welcome message from author
This document is posted to help you gain knowledge. Please leave a comment to let me know what you think about it! Share it to your friends and learn new things together.
Transcript

A LAW AND FINANCE ANALYSIS OF HEDGE FUNDS*
Douglas Cumming Associate Professor and Ontario Research Chair York University - Schulich School of Business
4700 Keele Street Toronto, Ontario M3J 1P3
Canada Cell: 647-280-3410
Web: http://www.schulich.yorku.ca/ http://Douglas.Cumming.com
Email: [email protected]
18 September 2008
* I owe thanks to Sofia Johan, Andrew Karolyi and Michael King for helpful comments and suggestions and to Li Que for research assistance. Also, I owe thanks to the seminar participants at Hofstra University, Vanderbilt Law School, the 2007 American Law and Economics Association Annual Conference at Harvard Law School, the 2007 Western Finance Association Annual Conference, the 2007 Northern Finance Association Conference, the 2007 DeGroote Conference on Market Structure and Market Integrity, the 2008 Financial Intermediation Research Society Conference, and the 2008 Amsterdam Conference on Financial Intermediation at the Crossroads.
1
A LAW AND FINANCE ANALYSIS OF HEDGE FUNDS
Abstract This paper empirically analyzes the impact of hedge fund regulation on fund structure and
performance using a cross-country dataset of 2137 hedge funds from 24 countries. The data indicate
regulatory requirements in the form of restrictions on the location of key service providers and restrictions
that enable distributions via wrappers tend to be associated with lower manipulation-proof performance
measures, lower fund alphas, lower average monthly returns (as well as lower Sharpe ratios), higher fixed
fees and lower performance fees. Also, the data show standard deviations of monthly returns are lower
among jurisdictions with restrictions on the location of key service providers and higher minimum
capitalization requirements.
Keywords: Hedge Funds; Regulation; Law and Finance
JEL Classification: G23, G24, G28, K22
Word count excluding tables: 7969

2
“Hedge funds are not, should not be, and will not be unregulated!!” - Christopher Cox (Chairman of SEC) in testimony before the Senate Banking Committee - Wall Street Journal 23 June 2006
In the United States (“the US’), hedge funds have been essentially an unregulated investment
vehicle that has accumulated over a trillion dollars in assets as at 2005. With a trillion dollars of capital
under management and at 5% alphas sought/promised by most hedge funds, this implies that there needs
to be at least an aggregate above market return of $50 billion. Given the implausibility of $50 billion
being readily available for hedge fund investors and managers who aim to “beat the market”, it seems
highly likely that many hedge fund participants will be disappointed in the future. Further, the
increasingly large pool of hedge fund capital under management has the potential to move other markets
and impact financial stability. As a result, the tremendous growth of the hedge fund asset class and
potential systemic risk has attracted regulatory attention from the US Securities and Exchange
Commission (“the SEC”).1
Hedge fund registration in the US commenced only in 2006 (Brav et al., 2008; Partnoy and
Thomas, 2007). In other countries around the world, hedge funds face stricter regulations such as
minimum capital requirements, marketing restrictions, and restrictions on retail investor participation,
among other things. The growth of hedge funds worldwide has led regulators to reevaluate the suitability
and effectiveness of their regulatory oversight (see, e.g., PWC, 2006). How has hedge fund regulation
impacted hedge fund structure and performance?
The purpose of this study is to facilitate an understanding of the impact of hedge fund regulation
on fund governance and performance. I measure fund performance along a variety of different metrics,
including Jensen’s alpha, a manipulation-proof performance measure (hereafter “MPPM”) (Goetzmann et
1 http://www.sec.gov/news/speech/spch111704hjg.htm. For industry perspectives on hedge fund regulation,
see, e.g., http://www.hedgeco.net/hedge-fund-regulations.htm and http://www.hedgefundregulation.com/

3
al., 2007) (as an alternative to the Sharpe ratio, which can be manipulated), and average monthly returns.
With regard to fund structure, I focus on management and performance fees since hedge funds are best
defined as a compensation scheme for a pool of money to be collectively managed and invested on behalf
of the capital providers (Hodder and Jackwerth, 2007).2
In theory, there is an ambiguous relation between hedge fund regulation and hedge fund structure
and performance. On one hand, a lack of regulatory oversight may give rise to fund managers that
disguise investment schemes and merely capture the fees. This view is consistent with theory and
evidence in Bebchuk and Fried (2003), at least in other contexts, that the compensation structure is part of
the agency problem rather than its solution. For instance, suppose there are 2 funds managed by the same
group of fund managers: one has a strategy of shorting the Standard and Poor’s 500 Index (“S&P’) while
the other has a strategy of going long on the S&P.3 The additional aspects of the hedge fund marketed to
the hedge funds’ investors hide the true nature of these hedge funds. In the end, half of the investors of
these two hedge funds will lose, while the hedge fund managers reap the profits of the fixed management
fees and carried interest performance fees of both hedge funds. The fund investors remain unaware of the
scheme due to all of the ‘mumbo jumbo’ of the marketing and promotional material of the hedge funds.
Further, without regulatory oversight and/or hedge fund registration requirements, regulatory authors
would also be unaware. Hedge fund registration and oversight would curb against this type of behaviour
and thereby improve hedge fund structure and average performance.
On the other hand, regulatory oversight may hamper fund performance where hedge fund
managers and their investors lose freedom to contract and organize their resources in the way that they
2 Hedge funds may further be categorized by their strategic focus, and in this paper I control for a variety of
different strategies.
3 This example was provided in a discussion at the DeGroote Microstructure Conference by Professor Larry
Harris in November 2006, but does not necessarily reflect his views of the hedge fund industry.

4
deem to be most efficient, and thereby exacerbate agency problems. 4 The most common forms of
regulation in different countries around the world include restrictions on minimum hedge fund size,
restrictions on the location of key service providers such as the administrator, custodian, investment
advisor, auditors, legal and tax advisors, accountants, and consultants (as discussed in section 1 below),
and limitations on the main market channels for hedge fund distribution. Such restrictions may constrain
the fund to an inefficient scale, give rise to inefficient choice of human resources associated with fund
management, create barriers to entry and limit investor participation most suited to the particular hedge
fund’s strategy. If so, I would expect worse hedge fund performance and less efficient hedge fund
structures (that do not as efficiently align interests of investors and managers) in terms of higher
management fees and lower performance fees.
These opposing views suggest the interaction between hedge fund regulation and hedge fund
structure and performance is theoretically ambiguous and subject to whatever effect one believes
dominates in the marketplace. The purpose of this paper therefore is to sort these issues out with an
empirical analysis of pertinent data. In particular, I empirically examine the relation between hedge fund
performance (including Goetzmann et al. (2007) MPPMs, Fung and Hsieh (2004) multifactor alphas,
average monthly returns and the standard deviation of returns), hedge fund structure (fixed management
fees and carried interest performance fees) and various aspects of hedge fund regulation (minimum
capitalization, restrictions on the location of key service providers and restrictions on marketing channels)
with an international dataset of 2137 hedge funds from 24 countries around the world (listed in section 1).
At a broad level, the data indicate regulatory requirements in the form of restrictions on the
location of key service providers and marketing channels that permit wrappers tend to be associated with
lower MPPMs, lower alphas, lower average returns, higher fixed fees and lower performance fees. The
4 Regulation has been shown to exacerbate agency problems in a variety of other contexts. For recent work,
see e.g., Qi and Wald (2008), and Mansi et al. (2007).

5
standard deviation of returns is lower among jurisdictions with restrictions on the location of key service
providers and higher minimum capitalization requirements.
In particular, in jurisdictions with restrictions on the location of key service providers, MPPMs
are approximately 6-8 units lower (which is at least 50% of one standard deviation of MPPM, where the
MPPM is the average monthly welfare of a power utility investor in the portfolio over the 2003-2005
period), and average monthly returns are approximately 0.6-0.9% lower. These effects are statistically
significant at and robust to alternative specifications, including alternative control variables, sample
definitions with different datasets and exclusion of US funds, as well as Heckman sample selection
corrected models for offshore registrations. There is further evidence that multifactor alphas and monthly
standard deviation of returns are lower in jurisdictions that restrict the location of key service providers,
but that evidence is less robust to the particular specification. Also, note that while the standard
deviations of returns are lower in jurisdictions with restrictions on location, this reduction is not enough to
compensate for the decline in returns thereby giving rise to a reduction in Sharpe Ratios.
There is fairly robust evidence that minimum capitalization restrictions lower the standard
deviation of returns. The data indicate that an increase in required minimum capitalization for a hedge
fund from $1 to $2 million tends to be associated with a reduction in standard deviation of monthly
returns by 1%. Minimum capitalization restrictions, however, are statistically unrelated to other aspects
of fund performance.
The evidence indicates that jurisdictions with marketing via wrappers have lower MPPMs by
approximately at least 3.8 units (and this effect is statistically significant in all but one specification) and
lower average monthly returns by at least 0.35% (and this effect is statistically significant in all
specifications).

6
Finally, there is evidence that jurisdictions with restrictions on the location of key service
providers and distributions via wrappers have lower performance fees by 4% and 3%, respectively. There
is further evidence in some specifications that jurisdictions with wrapper distributions have higher fixed
fees by 0.26% - 0.47%. Insofar as lower fixed fees and higher performance fees mitigate agency
problems and better align interests of fund managers and owners, this evidence is consistent with the
related evidence showing a negative relation between performance and jurisdictions with restrictions on
location and distribution via wrappers and restrictions on location. I do note, however, that the evidence
relating performance fees to restrictions on location and wrapper distributions is at times sensitive to the
econometric specification and sample of funds considered.
The analyses build on a large and growing literature on hedge fund structure and performance
(e.g., Ackermann et al., 1999; Agarwal and Naik, 2000a,b, 2004; Agarwal et al., 2006; Amin and Kat,
2003; Baquero et al., 2005; Brown et al., 1999, 2001; Brown and Goetzmann, 2003; Brunnermeier and
Nagel, 2004; Cremers et al., 2005; Edwards and Caglayan, 2001; Getmansky, 2005; Getmansky et al.,
2004; Liang, 1999, 2000, 2003; Gupta and Liang, 2005, Teo, 2007), as well as hedge fund activism (Brav
et al., 2008; Klein and Zur, 2006). The analyses are also related to analyses of hedge fund share
restrictions (e.g., Aragon, 2007) and hedge fund registration (Brown et al., 2006). Prior evidence,
however, has not considered a cross-country law and finance analysis of hedge fund regulation in relation
to fund structure and performance in the spirit of La Porta et al. (1998, 2002, and 2006). The analysis in
this regard builds on evidence relating governance to hedge fund and mutual fund performance (Cremers
et al., 2005; Chevalier and Ellison, 1997; Elton et al., 2003), and the structure of hedge funds and
strategies (Ding et al., 2006; Fung and Hsieh, 1997, 2000, 2001; Goetzmann et al., 2003; Jorion, 2000).
This paper is organized as follows. Section 1 briefly describes hedge fund regulation in the
countries considered. Section 2 introduces the data. Multivariate analyses are presented in section 3.
Section 4 discusses limitations and future research. Policy implications and concluding remarks follow in

7
section 5. Additional robustness checks concerning selection effects for fund location are reported in the
Appendix.
1. Hedge Fund Regulation, Structure and Performance
1.1. Hedge Fund Regulation
In the US, hedge funds are formed as limited partnerships whereby the investors are considered
limited partners and the hedge fund managers are general partners. The limited partners are wealthy
individuals and institutional investors. Compensation for hedge fund managers comprises a 1-2% fixed
management fee based on hedge fund asset size and a 15-20% carried interest performance fee based on
the profits. Incentive fees align interests of hedge fund managers as general partners and the investors as
limited liability partners who only retain their limited liability by not taking part in any aspect of the
management of the fund. Hedge funds are not allowed to advertise in the US. There is no restriction on
the minimum size to operate as a hedge fund, and no restrictions on the location of key service providers.
Hedge funds in the US can avoid the public disclosure requirements of the US Securities Act of 1933 by
claiming the status of a private placement.5 Hedge funds are also exempt from the US Investment
Company Act of 1940 (which regulates mutual funds) by having no more than 499 investors6 with more
than $5 million in assets, and by not making public offerings. Prior to February 2006, hedge funds in the
US were also exempt from any registration requirement. Brown et al. (2006) analyze the impact of this
registration requirement and find favorable quality signals are possible with registration. Verret (2007)
tm
5 In a private placement there must not be more than 35 “non-accredited” investors, whereby a non-
accredited investor is someone with more than $1 million in wealth or earned more than $200,000 in the previous
two years.
6 This restriction was previously set at 99 investors. For a further discussion, see,
e.g., http://faculty.fuqua.duke.edu/~charvey/Teaching/BA453_2001/SAM/SAM.h

8
gives specific commentary on the hedge fund regulatory and presents a model of self-regulation as a
major theme of the policy recommendation.
In other countries around the world, unlike the US, there are minimum capital requirements for
hedge fund managers to operate a hedge fund, as well as different avenues for marketing (not merely
private placements), and restrictions on the location of key service providers (see Figure 1) typically to be
within the same jurisdiction. These regulations are summarized in Table 1 for 24 different countries (see
also PWC, 2006, for an extended discussion for most of these countries7). The focus is on the regulations
in place in the period 2003 to 2005, which are stable for the regulations and countries enumerated in
Table 1.
[Figure 1 and Table 1 About Here]
A typical hedge fund does not have any employees but instead delegates different functions to
service providers of the hedge fund (Figure 1). Outsourcing a hedge fund’s functions minimizes risks of
collusion among hedge fund participants to perpetuate fraud, and also mitigates liability in the event the
hedge fund participants are accused of improperly performing their management duties. A hedge fund’s
board of directors or trustee has a fiduciary duty to the investors to ensure that all parties involved in the
fund can properly carry out their designated tasks. At issue in this paper is whether the form of regulatory
oversight in the countries enumerated in Table 1 provides an additional level of governance and an
additional check that fraud is not perpetuated. If regulatory oversight facilitates additional value-added
governance then I would expect hedge funds in those jurisdictions to have higher alphas, Sharpe ratios
7 The majority of countries and years are available in PWC. For countries/years not available in PWC, we
obtained information about regulation from the hedge funds in a survey sent to selected funds. It is noteworthy that
the broad regulatory categories we use have been stable over time (distribution channels, size and restrictions on
location are rarely modified restrictions), but there have been changes to other areas, particularly taxation.

9
and average returns. In the alternative, one may infer that restrictions on minimum capital requirements
for managers, restrictions on the location of key service providers, and limitations on the main market
channels for hedge fund distribution constrain the fund to an inefficient scale, give rise to inefficient
choice of human resources associated with hedge fund management, create barriers to entry and limit
investor participation most suited to the particular hedge fund’s strategy.8 In that case, one would expect
worse hedge fund performance and less efficient hedge fund structures (that do not as efficiently align
interests of investors and managers) in terms of higher management fees and lower performance fees.
These competing predictions are the focus of the empirical analyses in the remainder of this paper.
1.2. Hedge Fund Location
Hedge fund location depends on economic conditions and proximity to the fund’s investors,
taxation and regulatory burdens. The country of domicile of the fund managers may influence fund
location particularly in reference to countries with restrictions on the location of key service providers.
As well, fund managers that expect better performance may locate in jurisdictions with fewer regulatory
burdens and lower taxes. For instance, offshore locations such as the Bahamas, Bermuda, and the
Cayman Islands have few regulatory burdens and minimal tax for funds and their investors. The absence
of regulatory oversight in such countries would render it difficult for fund managers without a track
record to raise capital from institutional investors, while more established fund managers with a track
record are less likely to experience such problems in fundraising.
8 An alternative interpretation is as follows. It is possible that jurisdictions with more stringent hedge fund
regulation also have more active regulators that monitor hedge fund manager activities. Klein and Zur (2006) find
that activist hedge fund managers achieve their target returns by extracting cash from the investee firms from which
they acquire at least a 5% stake through forcing increased investee debt capacity and higher dividends. If regulatory
oversight curtails this type of activist investment, one may infer that it will also lower expected returns.

10
In the empirical analyses below, I consider econometric models that account for non-random
selection of location. In particular, I provide estimates of location choice with the use of two-step
Heckman corrections (as well as a other specifications that exclude select countries). I find that the
results are quite robust to alternative statistical treatment of location choice.
1.3. Hedge Fund Performance Measures
This paper uses Goetzmann et al.’s (2007) Manipulation-Proof Performance Measure (MPPM),
Fung and Hsieh’s (2004) multifactor alpha, average monthly hedge fund returns and standard deviation of
average monthly returns over the January 2003 to December 2005 period to measure hedge fund
performance. The results are also robust to earlier time periods, albeit the earlier time periods comprise
smaller samples since many funds in the data were formed only recently formed. I consider a variety of
performance measures to show robustness because there is little consensus regarding appropriate
performance measurement for hedge funds among academics and practitioners (Baghi-Wadji and
Klocker, 2007). The results pertaining to regulation are nevertheless quite robust to specifications
reported and otherwise; alternative specifications are available upon request.
The MPPM is analogous to the Sharpe ratio, originally called the "reward-to-variability" ratio,
and has traditionally been one of the most popular measures for risk-adjusted performance. However, it is
now widely known that Sharpe Ratio and other reward-to-risk measures may be manipulated with option-
like strategies (Goetzmann et al., 2007), and this type of manipulation may reasonably be expected to be
commonplace among hedge funds. Therefore, I use the recently proposed MPPM by Goetzmann et al.

11
(2007) for the hedge fund industry to remove bias from potential manipulation of the Sharpe Ratio.9 The
MPPM proposed by Goetzmann et al. is defined as follows:
1 1
1
1 1ˆ ln( [(1 ) (1 )] )(1 )
T
ft ft tt
r r xt T
ρ
ρ− −
=
Θ ≡ + + +− Δ ∑
where ftr and tx is the per-period (not annualized) risk free rate and the excess return of the fund over
period t. The parameter ρ is the relative risk aversion; historically this number ranges from 2 to 4 for the
CRSP value-weighted market portfolio depending on the time and frequency of data used. The Θ̂ can be
interpreted as the annualized continuously-compounded excess return of the portfolio. (Goetzmann et al.,
2007). The MPPM is interpreted as the average per period welfare of a power utility investor in the
portfolio over the time period in question. I found the regression results to be very robust to MPPMs for
three different risk aversions: 2, 3 and 4. I report MPPM values for risk aversion 3, and results for
alternative risk aversion parameters are available upon request.
A second performance measure considered in this paper is known as ‘alpha’. Jensen’s (1968)
alpha is a single factor model based on the classical CAPM developed by Sharpe (1964) and Lintner
(1965). Following the single factor models, a variety of multi-factor models have been developed and
applied in the research of hedge funds (Fung and Hsieh, 1997, 2004; Liang, 2002; Getmansky, Lo, and
Makarov, 2004; Lo, 2006). The multi-factor models could be expressed in a general form as following:
, ,1
Ki i i
t k k ik
r F i tα β ε=
= + +∑
where s the excess return (in excess of the risk-free rate) on hedge fund i for month t, itr
iα is the
abnormal performance of hedge fund i over the regression time period, ikβ is the factor loading of hedge
fund i on factor k during the regression period, Fk,t is the return for factor k for month t, and ,i tε is the
9 In an earlier draft of this paper I reported similar regression analyses with the Sharpe Ratio and found
similar results. Those results are available upon request.

12
error term. The main difference among those models is the selection of factors. Fung and Hsieh (2004)
have developed a seven factor model, which has been shown strong explanatory power in variation of
hedge fund performance. Based on their model, I run the regression as following:
, ,1
ˆˆ ˆK
i i it k k i i t
kr Fα β ε
=
= + +∑
The factors are S&P 500 return minus risk-free rate (SNPMRF), Wilshire small cap minus large cap
return (SCMLC), change in the constant maturity yield of the 10-year Treasury (BD10RET), change in
the spread of Moody's Baa minus the 10-year Treasury (BAAMTSY), bond PTFS (PTFSBD), currency
PTFS (PTFSFX), and commodities PTFS (PTFSCOM), where PTFS denotes primitive trend following
strategy. The estimated intercept ˆ iα is the alpha performance measure or the abnormal performance of
hedge fund i over the regression time period.
A challenge with the multifactor models is they might be sensitive to alternative specifications
and benchmarks (Agarwal et al., 2000a). I take the 3-month LIBOR converted into monthly rate as the
risk-free rate. Alternative benchmarks were also considered and did not materially affect the results;
these are available upon request. As well, note that the results in a prior version of this paper made use of
the single factor Jensen’s alpha, and showed a slightly stronger but consistent relation between the
regulation variables and the alphas as reported herein. Also, it is noteworthy that hedge funds have a
variety of different strategies (the data, described in the next section, considers more than 20 strategies). I
explicitly report results with strategy variables that are used to explain cross-sectional differences in
hedge fund performance. Alternative approaches that account for strategy when estimating alphas and
other performance metrics (such as grouping hedge funds into homogenous categories) did not materially
influence the inferences drawn pertaining to legality and hedge fund regulation.10
10 The only cases where results were affected were for subsamples of funds using strategies where there was a
dearth of funds that fit within the strategy class.

13
1.4. Other Factors Pertinent to Hedge Fund Structure and Performance
In the empirical analyses in the subsequent sections, I control for a variety of characteristics other
than hedge fund regulation that may impact hedge fund performance. First, quality of investor protection
and enforcement differs across countries of different legal origin, and hence I consider the law and
finance legal origin variables in the different countries (as in La Porta et al., 1998, 2002, 2006). I also
control for international differences in GNP per capita in the countries considered.
Second, I control for a variety of hedge fund characteristics, including the frequency with which
investors may withdrawal capital, hedge fund size, hedge fund age, minimum investment amounts per
investor, and performance and management fees. These control variables are used in ways consistent
with prior work measuring hedge fund performance (e.g., Ackermann et al., 1999; Agarwal and Naik,
2000a,b, 2004; Agarwal et al., 2006; Baquero et al., 2005; Brown et al., 1999, 2001; Brown and
Goetzmann, 2003; Brunnermeier and Nagel, 2004; Cremers et al., 2005; Edwards and Caglayan, 2001;
Getmansky, 2005; Getmansky et al., 2004; Liang, 1999, 2000, 2003). As well, in the dataset considered
(described immediately below), there are details regarding the primary fund strategy (24 different
categories), as well as regional variables for the location of assets (for the US, as well as by continent). In
the multivariate empirical analyses I show robustness of the hedge fund regulation results to the
inclusion/exclusion of all of these variables.
2. Data
2.1. Data Source
This paper makes use of two datasets: (1) Center for International Securities and Derivatives
Markets (CISDM), and (2) HedgeFund.Net (“HFN”) DataExport collected by Channel Capital Group Inc.

14
The CISDM data comprise a total of 2462 funds. Of these, 1127 have performance statistics for 2003-
2005. The HFN data comprises a total of 5298 funds. Of these, 1350 have performance statistics for
2003-2005 and complete information on fund domicile and other variables of interest. Among these
funds found an overlap of 340 funds in the HFN data and the CISDM data. In total, therefore, I use 1127
funds from CISDM and 1010 funds from HFN. The total sample comprises 2137 hedge funds from the
24 countries enumerated in Table 1. Summary statistics for the funds are provided in Table 2.
[Table 2 About Here]
Fung and Hsieh (2006) have shown that only 3% of hedge funds appear in 5 of the major hedge
fund databases (CISDM, TASS, EUR, MSCI and HFR). The CISDM sample has 44.6% of funds
domiciled in the US (and the combined CISDM/HFN sample has 68.1% of funds domiciled in the US),
while the TASS sample reported in International Financial Services (2006) has 34% of funds domiciled in
the US. The CISDM sample has 50.4% of funds domiciled in offshore jurisdictions (and the
CISDM/HFN sample has 27.3%), while the TASS sample has 55%. The CISDM sample has 3.1% of
funds from the European Union (and CISDM/HFN sample has 3.3%), while the TASS sample has 9%.
While I cannot say whether the CISDM or combined CISDM/HFN samples are representative of the
worldwide population of hedge funds, I nevertheless do report the results with and without the HFN data,
as well as with and without the US fund, to show robustness to different samples. As well, I report
sample selection models for funds that selected offshore domiciles. I explicitly show the results are very
robust to these different subsamples and econometric methods.
2.2. Potential Biases11
11 Biases in all hedge fund databases are described in a variety of sources, such
as http://faculty.fuqua.duke.edu/~charvey/Teaching/BA453_2001/SAM/SAM.htm

15
Hedge fund databases may exhibit biased performance results through selection bias, survivorship
bias and instant history bias. Selection bias is present where databases do not comprise the universe of
hedge funds. HedgeFund.net uniquely provides comparable international data across a large number of
different countries. As with other prior research using single-country datasets, I cannot rule out selection
bias. I nevertheless consider robustness of the results to excluding different countries, such as the US,
from the regression analyses. Survivorship bias and instant history bias may also be present in the data;
however, the analyses focus on a relatively short window of time, namely 2003 to 2005, in which there
were no extreme market events for which I would expect systemic bias in the data. I have also considered
the robustness of the results to different periods with longer histories, and the results are quite robust
(available upon request). Further, I have considered different populations of funds depending on their
start date and have found similar results (again, available upon request).
2.3. Summary Statistics and Univariate Correlations
Table 2 defines and summarizes the performance measures in the data for the January 2003-
December 2005 period, as well as the regulatory variables and variables for hedge fund characteristics.
The average hedge fund’s alpha was 4.56% [median 2.15] and the average MPPM was 9.07 [median
7.42]. The average monthly percentage return was 0.99 [median 0.80]. The average age for the hedge
funds with performance data in January 2003 to December 2005 was 86.69 months [median 74 months],
and the average hedge fund size was $129.061 million [median $28.249 million] in 2005 US dollars. The
average fixed fee for the hedge funds was 1.37% [median 1.00%], and the average performance fee was
18.09% [median 20.00%]. Additional hedge fund statistics as well as minimum and maximum values are
indicated in Table 2.
Table 3 provides univariate correlations across all of the variables enumerated in Table 2. Hedge
funds with higher performance fees have significantly higher MPPMs (correlation is 0.10) and average

16
monthly returns (correlation is 0.11). Table 3 also indicates high correlations across many of the
variables, and hence I assess the robustness of the results to alternative specifications in the multivariate
analyses.
[Table 3 About Here]
3. Multivariate Analyses
The multivariate empirical tests proceed in 5 sets of regressions which analyze MPPMs (Table 4),
alphas (Table 5), average monthly returns (Table 6), standard deviation of average monthly returns (Table
7), and fixed fees and performance fees (Table 8).
The central focus of the following discussion is on the impact of regulation on hedge fund
performance and structure. Robustness to inclusion/exclusion of control variables for legal origin, GNP
per capita, and various hedge fund characteristics is also considered. Five specifications are presented for
each of Tables 4-7 on performance to show robustness (20 models in total). I report results for the full
sample (Models 1, 2, 6, 7, 11, 12, 16, 17), the subsample excluding US funds (Models 3, 8, 13, 17), the
subsample excluding the HFN data (Models 4, 9, 14, 19), and a Heckman sample selection model for
offshore registrants (Models 5, 10, 15 and 20). I report three specifications are provided for each of
management and performance fees in Table 8 where I use the full sample (Models 21 and 22), the
subsample excluding the US funds (Models 23 and 24) and the subsample excluding the HFN data
(Models 25 and 26). Alternative sets of explanatory variables did not materially impact the results, and
additional specifications not presented are available upon request.
The Heckman (1976, 1979) sample selection models are specified in the following way. I do not
use the traditional approach, but use a modified selection effect approach that is consistent with that in

17
other hedge fund work (most notably, see Baquero et al., 2005). The first step is a logit regression on a
dummy variable equal to one for offshore registrants with explanatory variables that include legal origin
and more than a dozen explanatory variables for the location of the fund’s assets and the fund’s primary
strategy. I had considered taxation variables, but tax benefits for different jurisdictions depend on fund
strategies and characteristics and are not easily quantified into a few variables; as such, I focus on the
fund strategy and asset location dummy variables. The second step of the Heckman regression is
analogous to the companion single step OLS models provided in each of the tables analyzing
performance.
At a broad level, the data indicate that regulatory requirements in the form of restrictions on the
location of key service providers and marketing channels permitting wrappers tend to be associated with
lower MPPMs, lower fund alphas, lower average returns, higher fixed fees and lower performance fees.
The standard deviation of returns is lower among jurisdictions with restrictions on the location of key
service providers and higher minimum capitalization requirements. Specific details are summarized
below.
[Tables 4 – 8 About Here]
3.1. Restrictions on Key Service Providers
The data indicate that jurisdictions with restrictions on the location of key service providers (see
Figure 1 and accompanying text) have worse performance results. Table 4 indicates MPPMs are at least
5.81 lower (Model 1), and up to 8.34 lower (Model 5) depending on the econometric specification, among

18
jurisdictions with restrictions on location of key service providers.12 This effect is statistically significant
at at least the 5% level in all of the specifications (and at the 1% level of significance in Models 1 and 2).
The effect is economically large in that it is at least 50% of one standard deviation of the MPPM for the
most conservative estimate in Model 1. The implication of the data is that a location restriction
inefficiently constrains the human capital availed to a hedge fund thereby leading to worse performance.
There is no apparent corporate governance benefit to a geographic proximity between a hedge fund’s
service providers and the hedge fund’s regulatory body.
The evidence for the other performance indicators in Tables 5 and 6 provides similar results.
Multifactor alphas in Table 5 are 10% (Model 9) – 16.8% (Model 10) lower for restrictions on the
location of key service providers. This effect, however, is not statistically significant in Models 6-8 in
Table 5. Table 6 similarly indicates that for jurisdictions which restrict the location of key service
providers, average monthly returns are significantly lower by at least 0.546% in Model 11 (and up to
0.863% lower in Model 13), and the statistical significance is robust in each specification in Table 6.
Note as well that the restriction on the location of key service providers lowers the standard deviation of
monthly returns in Table 7, but that reduction is not sufficient to compensate for the reduction in returns
and as such the Sharpe ratio is lower.13 This is consistent with the findings when using other risk-
adjusted performance measures such as the MPPM.
12 In related specifications (not explicitly presented in this paper), I also found Sharpe ratios are
approximately 0.10-0.12 lower for funds in jurisdictions with restrictions on the location of key service providers.
13 The change in the Sharpe ratio is
f f(R R )+ R R R R (R R )SharpeRatio=+ ( +
f
)σ σ
σ σ σ σ σ σ− Δ − Δ − − Δ
Δ − =Δ Δ
Regardless of the Models selected in Tables 6 and 7, the change is negative for restrictions on the location of key
service providers.

19
There is no statistically significant relation between fixed management fees and restrictions on
the location of key service providers. But it is noteworthy that jurisdictions with restriction on the
location of key service providers have carried interest performance fees that are 4.2% lower in the
subsample excluding US data (Model 24) (although this effect is not significant in Models 22 and 26).
The data therefore indicate some complementary evidence (at least for the sample of non-US funds) that
restrictions on the location of key service providers give rise to an inefficient wedge in the alignment of
interests between hedge fund investors and hedge fund managers in terms of aligning interests with
performance incentive contracts.
3.2. Minimum Capitalization Requirements
The data indicate some evidence that restrictions on minimum capitalization in a jurisdiction are
associated with differences in hedge fund performance. Table 7 shows that an increase in required
minimum capitalization for a hedge fund from $1 to $2 million is associated with a reduction in standard
deviation of monthly returns by 1%. The statistical significance of this result is robust in the full sample
(Models 16 and 17), and the subsamples excluding US funds (Model 18) and the HFN data (Model 19),
but not robust in the specification with Heckman sample selection corrections for offshore registrants
(Model 20b).
The minimum capitalization restrictions are generally insignificant in the other tables apart from
Table 7.14 One limitation with regards to minimum capitalization (as indicated in Table 2) is that proxies
are needed for some countries, since the requirements are not exact. Note as well that minimum
capitalization requirements appear binding on only a small proportion of the sample (that is, some funds
in countries without minimum capitalization are smaller than the minimum capitalization levels in other
14 The one exception is the positive effect in Model 9, but this effect is not robust to the other specifications in
Table 5.

20
countries); nevertheless, it is possible that some funds face problems associated with first achieving the
minimum capitalization hurdle when they first start the fund.
3.3. Hedge Fund Distribution Restrictions
The data indicate that jurisdictions with marketing restrictions via wrappers show lower MPPMs
by 3.808 (Model 1) – 21.389 (Model 5). This effect is statistically significant in Models 4 and 5 at the
5% level, and at the 1% level in Models 1 and 2, but statistically insignificant in Model 3. Hedge funds
have a Sponsor that has the responsibility for marketing the Sponsor Fund. In the case of wrappers, the
sponsor distributes the offering materials for the Sponsor Fund as well as the disclosure materials for the
affiliated wrapper products. There is a potential conflict of interest between the Sponsor and the Fund
Manager with respect to the disclosure of the wrapper relating to the Fund Manager (Gerstein, 2006).
This conflict of interest is one possible explanation for the negative association between wrappers and
fund performance.
Fund distributions via wrappers do show a statistically significant negative association with
average monthly returns in all of the models in Table 6.15 The economic significance ranges from -0.349
in Model 11 to -1.503 in Model 15. Wrappers are also associated with lower standard deviations in Table
7 Models 17 and 18; however, the reduction in standard deviation is comparatively smaller than the
reduction in average returns, thereby giving rise to a reduction in the Sharpe ratio (for example, based on
Models 12 and 17, the Sharpe ratio is estimated to be 8.7% lower among jurisdictions that permit
wrappers16).
15 By contrast, in Table 5 there is no statistically significant relation between multifactor alphas and wrapper
distributions. Alternative specifications of the multifactor model were considered, and in some cases there was a
negative association.
16 See note 12 for the formula to estimate the change in the Sharpe Ratio.

21
Finally, note that permitted wrapper distributions are associated with significantly higher fixed
fees by 0.263% in Model 21 (for the full sample) and by 0.468% in Model 25 (for the subsample with
CISDM data only). In other words, fund managers appear able to extract higher fixed fees when the fund
is marketed in combination with other products. 17 Also, wrapper distributions are associated with
significantly lower performance fees in Model 24 (among the non US funds) by -2.51%. Non-US fund
managers are afforded fewer performance incentives when the fund is distributed alongside other
products. Table 8 further indicates evidence in Models 22 and 24 of higher performance fees associated
with private placements.18 Note that the included variables for distribution channels were selected based
on minimizing correlations with other variables, as indicated in Table 3; when other distribution variables
are included the results tend to exhibit less statistical significance.
3.4. Control Variables
A number of the control variables are significant in ways consistent with prior research. Most
notably, French and German legal origin countries are negatively associated with MPPMs (Table 4),
alphas (Table 5) and average monthly returns (Table 6). These results are consistent with La Porta et al.
(1998, 2002, 2006) (a dummy variable for English legal origin is suppressed to avoid perfect collinearity).
There is evidence that hedge fund characteristics impact performance and structure. Large hedge
funds tend to have higher MPPMs (Models 1, 2 and 4) and higher alphas (Models 8-10) and lower
standard deviation of monthly returns (Models 16-20). There are other significant variables in Tables 4-8,
df
17 For this reason, tied selling is prohibited in some contexts among financial institutions; see,
e.g., http://www2.bmo.com/bmo/files/images/3/1/CoerciveTiedSelling_eng.p
18 An earlier version of this paper showed a positive relation between fund performance fees and private
placements; however, that result was less robust in the prior paper.

22
albeit not as robust. Other variables were also considered but not reported since there were immaterial.
For instance, in Table 8 I considered the MSCI returns in the year prior to the establishment of the hedge
fund, but this effect was insignificant and did not materially impact the other included variables. These
and any other specifications are available upon request.
4. Extensions and Future Research
This paper introduced for the first time a cross-country law and finance analysis of the impact of
hedge fund regulation on hedge fund performance. The data were based on 24 countries and focused on
performance measures over the January 2003 to December 2005 period. The data indicate hedge fund
regulation in the form of restrictions on the location of key service providers and marketing via wrapper
distribution was negatively related to hedge fund performance and hedge fund manager performance fees.
One potential concern with the analysis of the relation between hedge fund regulation and
governance and performance relates to non-random location choice, as discussed above in subsection 1.2.
I explicitly showed robustness of the results to selection effects with location choice.
A second potential concern is that tax differences for offshore versus onshore funds drive
differences in performance. I explicitly showed results for the subsample of offshore funds accounting
for selection effects, and the results were robust. In specifications not presented but available upon
request, I show robustness to exclusion of offshore funds. Hence, the findings in this paper are not likely
attributable to tax differences.
A third potential concern is in respect of robustness to alternative datasets. In this paper I have
shown robustness to the CISDM dataset and the HedgeFund.Net dataset. I have also shown robustness to
considering the subset of onshore versus offshore funds, and to exclusion of US funds. Most of the

23
results are quite robust, as explicitly shown herein. Other robustness checks were performed but not
reported for reasons of conciseness. For instance, with a more parsimonious model and excluding funds’
first two years performance (for a possible backfilling bias) with the combined dataset, the results are
consistent with the results reported herein. These and other robustness checks are available upon request.
Generalizations from the data are constrained to the markets and market conditions from which
the data are drawn. The analyses focused on performance over 2003-2005. It may be the case that hedge
fund regulation plays are more favorable role on performance in times of market crashes, but the data
examined consider a relatively stable time period. I did consider earlier time periods, which generally
provided results which are similar to those reported herein. However, those results were based on a more
restricted sample and fewer countries due to data limitations. Hedge fund regulation may also play a
more favorable role in other countries. Further research on other time periods and other countries is
warranted. Further research could also investigate the interaction between hedge fund regulation and
hedge fund activism (for US evidence, see Brav et al., 2008, and Klein and Zur, 2006), and other similar
forms of financial intermediation.
Finally, it is worth noting that I do not provide a normative evaluation on the desirability of
regulations that give rise to lower performance measures for investors. A government objective function
may weight more heavily reductions in the standard deviation of returns than anything to do with
performance, for example. Further research could assess governmental or societal objectives to
appropriately assess suitable hedge fund regulations for different countries. The analysis has been
confined to assessing the impact of fund regulation on risk-adjusted performance for investors, and fund
structure in terms of fixed and performance fees.

24
5. Concluding Remarks
This paper empirically analyzed the impact of hedge fund regulation on fund structure and
performance using a cross-country dataset of 2137 hedge funds from 24 countries for the January 2003 to
December 2005 period. The focus on the analysis involved regulatory requirements in the form of
minimum capitalization imposed on hedge fund managers, restrictions on the location of key service
providers and restrictions on marketing channels via private placements in relation to hedge fund alphas, a
manipulation-proof performance measures (MPPMs), average monthly returns, fixed fees and
performance fees.
Restrictions on the location of a hedge fund’s key service providers tend to give rise to worse
performance in terms of lower MPPMs, lower alphas, lower average monthly returns and lower
performance fees. Overall, therefore, in the 2003-2005 period of regular economic conditions for the 24
countries considered, hedge fund regulation in terms of locational restrictions of key service providers has
hampered fund performance and distorted efficient fund compensation structures. I also found that
distribution via wrappers was associated with lower performance results, higher fixed fees and lower
performance fees, which may reflect conflicts of interest associated with the marketing and distribution of
companion products. Nevertheless, I did see some evidence that distributions via wrappers as well as
minimum capital requirements tend to be associated with lower standard deviations of returns. Hence,
while hedge fund regulation tends to inhibit performance and incentive fees, it also has the potential to
lower risks in the market. The current evidence from hedge fund regulation therefore does offer guidance
for the ongoing policy debates on hedge fund regulation. Further research is warranted as more data and
natural experiments arise with the likely upcoming changes in the regulatory environment around the
world.

25
References Ackermann, C., R. McEnally, and D. Ravenscraft, 1999, “The Performance of Hedge Funds: Risk, Return
and Incentives”, Journal of Finance, 54 (3), 833-874. Agarwal, V. and N. Y. Naik, 2000a, “Multi-Period Performance Persistence Analysis of Hedge Funds”,
Journal of Financial and Quantitative Analysis, 35 (3), 327-342. Agarwal, V. and N. Y. Naik, 2000b, “On Taking the Alternative Route: Risks, Rewards and Performance
Persistence of Hedge Funds”, Journal of Alternative Investments, 2(4), 6-23. Agarwal, V. and N. Y. Naik, 2004, “Risks and Portfolio Decisions involving Hedge Funds”, Review of
Financial Studies, 17 (1), 63-98. Agarwal, V., N. Daniel and N. Y. Naik, 2006, “Flows, Performance, and Managerial Incentives in the
Hedge Fund Industry”, London Business School Working Paper. Amin, G. S. and H. M. Kat, 2003. "Hedge Fund Performance 1990-2000: Do the "Money Machines"
Really Add Value?" Journal of Financial & Quantitative Analysis 38(2): 251-274. Aragon, G. O. (2007). "Share restrictions and asset pricing: Evidence from the hedge fund industry."
Journal of Financial Economics 83(1): 33-58. Baghai-Wadji, R. and S. Klocker, 2007. “Performance and style shifts in the hedge fund industry”,
Working Paper, London Business School and Vienna University of Economics and Business Administration.
Baquero, G., J. t. Horst, M. Verbeek, 2005. "Survival, Look-Ahead Bias, and Persistence in Hedge Fund
Performance." Journal of Financial & Quantitative Analysis 40(3): 493-517. Barclay, M.J., C.G. Holderness and D.P. Sheehan, 2006. “Private Placements and Managerial
Entrenchment”, Journal of Corporate Finance, forthcoming. Bebchuk, L.A. and J.M. Fried, 2003. “Executive Compensation as an Agency Problem”, Journal of
Economic Perspectives 17, 71-92. Brav, A., W. Jiang, F. Partnoy, and R. Thomas, 2008. “Hedge Fund Activism, Governance and Firm
Performance”, Journal of Finance 63, 1729 - 1775. Brown, S. J., W. N. Goetzmann, B. Liang and C. Schwarz, 2006. “Lessons from Hedge Fund
Registration”, Journal of Finance, forthcoming. Brown, S. J., W.N. Goetzmann and R.G. Ibbotson, 1999, “Offshore hedge funds: Survival and
performance 1989-1995”, Journal of Business, 72(1), 91-117. Brown, S. J., W. N. Goetzmann and J. Park, 2001, “Careers and Survival: Competition and Risk in the
Hedge Fund and CTA Industry”, Journal of Finance, 56(5), 1869-1886. Brown, S. J. and W. N. Goetzmann, 2003, “Hedge Funds With Style”, The Journal of Portfolio
Management, 29(2), pages 101-112.

26
Brunnermeier, M. K. and S. Nagel, 2004, “Hedge funds and the technology bubble”, Journal of Finance, 59(5), 2013-2040.
Chevalier, J. and Glenn Ellison, 1997, “Risk Taking by Mutual Funds as a Response to Incentives”,
Journal of Political Economy, 105, 1167-1200. Cremers, K., J. Martijn and V. Nair, 2005, “Governance Mechanisms and Equity Prices”, Journal of
Finance, 60(6), pages 2859-2875. Cremers, K.J. Martijn, J. Driessen, P. Maenhout and D. Weinbaum, 2005, “Does Skin in the Game
Matter? Director Incentives and Governance in the Mutual Fund Industry”, Yale School of Management Working Paper Series.
Ding, B., M. Getmansky, B. Liang and R. Wermers, 2006, “Market Volatility, Investor Flows, and the
Structure of Hedge Fund Markets”, University of Massachusetts working paper. Elton, E. J., M. J. Gruber and C. R. Blake, 2003, “Incentive Fees and Mutual Funds”, Journal of Finance,
58 (2), 779-804. Edwards, F. R. and M. O. Caglayan, 2001. “Hedge fund performance and manager skill”, Journal of
Futures Markets 21 (11), 1003-1028. Fung, W. and D.A. Hsieh, 1997, “Empirical characteristics of dynamic trading strategies: The case of
hedge funds”, Review of Financial Studies, 10(2), 275-302. Fung, W. and D.A. Hsieh, 2000, “Performance Characteristics of Hedge Funds and CTA Funds: Natural
Versus Spurious Biases”, Journal of Financial and Quantitative Analysis, 35 (3), 291-307. Fung, W. and D.A. Hsieh, 2001, “The Risk in Hedge Fund Strategies: Theory and Evidence from Trend
Followers”, Review of Financial Studies, 14 (2), 313-341. Fung, W. and D.A. Hsieh, 2004. Hedge fund benchmarks: a risk based approach, Financial Analyst
Journal 60 (2004), pp. 65–80 Fung, W. and D.A. Hsieh, 2006. “Hedge Funds: An Industry in Its Adolescence”, Federal Reserve Bank
of Atlanta Economic Review (Fourth Quarter), 1-34. Gerstein, K.S., 2006. Hedge Fund Distribution: Regulatory Hot Buttons, Schulte Roth & Zabel, LLP Getmansky, M., 2005, “The Life Cycle of Hedge Funds: Fund Flows, Size and Performance”, Working
Paper, University of Massachusetts. Getmansky, M., A. W. Lo and I. Makarov, 2004, “An Econometric Model of Serial Correlation and
Illiquidity in Hedge Fund Returns”, Journal of Financial Economics, 74(3), 529-609. Goetzmann, W. N., J. E. Ingersoll, and S.A. Ross, 2003, “High-water Marks and Hedge fund
Management Contracts”, Journal of Finance, 58(4), 1685-1717. Goetzmann, W. N., J. E. Ingersoll, M. I. Spiegel and I. Welch, 2007, "Portfolio Performance
Manipulation and Manipulation-Proof Performance Measures", Review of Financial Studies, 20(5), 1503-1546

27
Gupta, A. and B. Liang, 2005. "Do hedge funds have enough capital? A value-at-risk approach." Journal
of Financial Economics 77(1): 219-253. Heckman, J., 1976. “The Common Structure of Statistical Models of Truncation, Sample Selection, and
Limited Dependent Variables and a Simple Estimator for Such Models”, Annals of Economic and Social Measurement 5, 475-492.
Heckman, J., 1979. “Sample Selection Bias as a Specification Error”, Econometrica 47, 153-161. Hodder, J.E., and J.C. Jackwerth, 2007. “Incentive contracts and hedge fund management.” Journal of
Financial and Quantitative Analysis 42, 811-826.. International Financial Services (2006), Hedge Funds: City Business Services (March
2006) http://www.ifsl.org.uk/uploads/CBS_Hedge_Funds_2006.pdf Jensen, M. C., 1968, “The Performance of Mutual Funds in the Period 1945-1964”, Journal of Finance
23, 389-416 Jorion, P., 2000, “Risk Management Lessons from Long-Term Capital Management”, European
Financial Management, 6, 277-300. Klein, A. and E. Zur, 2006. “Hedge Fund Activism”, NYU Law and Economics Research Paper No. 06-
41. La Porta, R., F. Lopez-de-Silanes, A. Shleifer and R. Vishny, 1998. “Law and Finance”, Journal of
Political Economy 106, 1113–1155. La Porta, R., F. Lopez-de-Silanes, A. Shleifer and R. Vishny, 2002. “Investor Protection and Corporate
Valuation”, Journal of Finance 57, 1147–1170. La Porta, R., F. Lopez-de-Silanes, A. Shleifer and R. Vishny, 2006. “What Works in Securities Laws?”
Journal of Finance 61, 1-32. Liang, B., 1999, “On the Performance of Hedge Funds”, Financial Analysts Journal 55, 72-85. Liang, B., 2000, “Hedge Funds: The Living and the Dead”, Journal of Financial and Quantitative
Analysis 35, 309-326. Liang, B., 2003, “The Accuracy of Hedge Fund Returns”, Journal of Portfolio Management 29, 111-122. Liang, B., and H. Park., 2007. “Share Restrictions, Liquidity Premium, and Offshore Hedge Funds,
Working Paper, University of Massachusetts, Amherst. Lintner, J., 1965. “The Valuation of Risk Assets and the Selection of Risky Investments in Stock
Portfolio and Capital Budgets”, Review of Economics and Statistics 47, 13-37 Lo, A., 2006, “Where Do Alphas Come From?: A New Measure of the Value of Active Investment
Management”, MIT working paper
28
Mansi, S., W. Maxwell and J. Wald, 2007. “Creditor Protection Laws and the Cost of Debt” Working Paper, Virginia Tech and University of Texas San Antonio.
Partnoy, F. and R.S. Thomas, 2007. "Gap Filling, Hedge Funds, and Financial Innovation". Brookings-
Nomura Papers on Financial Services, Y. Fuchita, R.E. Litan, eds., Brookings Institution Press. PriceWaterhouseCoopers [PWC], 2006. The Regulation, Taxation and Distribution of Hedge Funds in
Europe: Changes and Challenges. London: PriceWaterhouseCoopers June 2006. PriceWaterhouseCoopers [PWC], 2007. Under the spotlight: The Regulation, Taxation and Distribution
of Hedge Funds around the Globe. London: PriceWaterhouseCoopers June 2007. Qi, Y., and J. Wald, 2008. “State Laws and Debt Covenants” Journal of Law and Economics 51, 179-207. Sharpe, W. F., 1964. “Capital Asset Prices: A Theory of Market Equilibrium Under Conditions of Risk”,
Journal of Finance 19, 425-442 Teo, M., 2007. “The Geography of Hedge Funds.” Working Paper, Singapore Management University. Verret, J.W., 2007, "Dr. Jones and the Raiders of Lost Capital: Hedge Fund Regulation, Part II”, Harvard
Law School Law & Economics, Research Paper Series, Forthcoming

Figure 1. Typical Parties Appointed to Operate a Hedge Fund Note: Administrator: record and bookkeeping and independently verify asset value of the fund Registrar / Transfer Agent: process subscriptions and redemptions and maintain registrar of shareholders Custodian: safe-keeping of assets Prime Broker: provides access to stock and loan financing, as well as a host of value-added services Source: PriceWaterhouseCoopers http://www.pwchk.com/home/eng/hedge_fund_operation_jul2005.html

30
Table 1. Regulation of and Channels for Distribution of Hedge Funds by Country
This table summarizes by country the regulation of hedge funds across 24 countries, including the minimum capital requirements, permissible marketing channels and whether there exists restrictions on the location of key service providers (Figure 1). The minimum capital requirements to operate as a hedge fund manager are vary in some countries depending on fund characteristics and as such are proxied, as summarized in this table, for the purpose of empirical analyses in the subsequent tables (and the results are robust to alternative proxies).
Country
# Funds in Combined
CISDM HFN
Dataset
# Funds in
CISDM Dataset
Proxy for minimum
capital requirement to
operate as hedge fund
manager (2005 US $)
Main marketing channels Restrictions on location
of key service
providers?
Legal Origin
GDP per Capita
(2005 US $)
Banks Fund
distribution companies
Wrappers Private placeme
nts
Investment managers
Other regulated financial services
institutions
Non-regulated financial
intermediaries
Total number of marketing channels
English French German
Australia 2 1 0 1 1 1 1 1 1 0 6 0 1 0 0 $30,700
Austria 2 1 $6,750,000 1 1 1 0 0 0 0 3 0 0 0 1 $31,300
Bahamas 19 18 $25,000 0 0 0 1 1 0 0 2 1 1 0 0 $17,700
Bermuda 76 70 $0 1 0 0 1 1 0 0 3 1 1 0 0 $36,000
Brazil 6 4 $362,000 1 1 0 1 1 1 0 5 1 0 1 0 $8,100 British Virgin
Islands 97 97 $500,000 1 0 0 1 1 0 0 3 1 1 0 0 $24,500
Canada 20 13 $0 1 1 1 1 1 1 0 6 0 1 0 0 $31,500
Cayman Islands 372 371 $500,000 1 0 0 1 0 0 0 2 1 1 0 0 $32,300
Channel Islands 4 0 $44,077 1 1 1 1 1 1 1 7 0 1 0 0 $35,264
China 1 0 $0 1 1 1 1 1 1 0 6 1 0 0 1 $5,600
France 8 7 $168,750 0 1 1 1 1 0 0 4 0 0 1 0 $28,700
Hong Kong 1 0 $2,275,000 1 1 0 1 1 1 0 5 0 1 0 0 $34,200
Ireland 24 20 $67,500 1 0 0 1 0 1 0 3 1 1 0 0 $31,900
Isle of Man 1 1 $142,500 0 1 1 1 1 0 0 4 1 1 0 0 $35,000
Japan 2 0 $0 1 1 1 1 1 1 0 6 0 0 0 1 $29,400
Luxembourg 9 9 $168,750 1 0 0 0 0 1 0 2 0 0 1 0 $58,900
Mauritius 2 2 $0 0 0 0 1 0 0 0 1 1 1 0 0 $12,800
Netherlands 1 0 $303,750 0 0 1 0 1 1 0 3 1 0 1 0 $29,500
Netherland Antilles 6 6 $0 0 0 0 1 0 0 0 1 1 0 1 0 $11,400
New Zealand 1 1 $0 1 1 1 1 1 1 0 6 0 1 0 0 $23,200
Switzerland 2 0 $4,300,000 1 1 1 0 1 1 0 5 1 0 0 1 $33,800
UK 20 0 $67,500 1 0 1 1 1 0 0 4 0 1 0 0 $29,600
US 1455 503 $0 0 0 0 1 0 0 0 1 0 1 0 0 $40,100 US Virgin
Islands 6 0 $500,000 1 0 0 1 1 0 0 3 1 1 0 0 $15,000

31
Table 2. Definition of Variables and Summary Statistics
This table defines the main variables used in the paper. Summary statistics are also provided for each variable. The performance data are for the period January 2003 - December 2005. The data comprise 2137 funds, of which 1127 are from CISDM and 1010 are from HFN Data. I have excluded some funds from the HFN Data sample where I discovered conflicting information about the fund's domicile. All regression analyses are reported for the full sample and the subsample of only the CISDM Data. The CISDM hedge fund data are available for free to subscribers of Wharton WRDS, and the HFN Data are available for a fee from HedgeFundData.net.
Variable Definition Mean Median Standard Deviation Minimum Maximum No. of
Observations
Performance Variables
3-Year Alpha Alpha of Multifactor Model (Fung and Hsieh, 2004), expressed in percentages 4.559 2.150 26.263 -100.000 507.307 2137
3-Year Manipulation Proof Performance Measure Manipulation Proof Performance Measure (Goetzmann et al., 2007) 9.067 7.421 11.314 -29.993 79.671 2137
3-Year Average Return 3-Year Average Monthly Return, expressed in percentages 0.993 0.797 0.900 -6.795 10.301 2137
3-Year Standard Deviation of Returns The 3-year standard deviation of returns 2.737 2.099 2.747 0.040 73.103 2137
Hedge Fund Regulation Variables
Log Minimum Capitalization The log of the minimum capitalization required to operate as a hedge fund manager in 2004 US dollars 3.435 0 5.698 0 15.725 2137
Restrictions on Location of Key Service Providers
A dummy variable equal to 1 where the country imposes restrictions on the location of key service providers (Figure 1) 0.287 0 0.452 0 1 2137
Marketing Bank A dummy variable equal to 1 where the country allows fund distribution via banks (as defined in Table 1) 0.302 0 0.459 0 1 2137
Marketing Fund Distribution Company
A dummy variable equal to 1 where the country allows fund distribution via fund distribution companies 0.023 0 0.151 0 1 2137
Marketing Via Wrappers A dummy variable equal to 1 where the country allows fund distribution via wrappers 0.030 0 0.170 0 1 2137
Marketing Private Placement A dummy variable equal to 1 where the country allows fund distribution via private placements 0.994 1 0.075 0 1 2137
Marketing Investment Manager A dummy variable equal to 1 where the country allows fund distribution via investment managers 0.299 0 0.458 0 1 2137 Marketing Other Regulated Financial
Institution A dummy variable equal to 1 where the country allows fund distribution via other regulated
financial institutions 0.034 0 0.182 0 1 2137
Country GNP and Legal Origin
Log GNP Per Capita Log of the country's GNP per capita, expressed in 2004 US dollars 10.506 10.599 0.196 8.631 10.984 2137
French Legal Origin A dummy variable equal to one for French legal origin countries (La Porta et al., 1998) 0.014 0 0.118 0 1 2137
German Legal Origin A dummy variable equal to one for German legal origin countries (La Porta et al., 1998) 0.003 0 0.057 0 1 2137
Fund Characteristics
Yearly Capital Redemptions A dummy variable equal to 1 if capital redemptions are possible only on an annual basis 0.103 0 0.304 0 1 2137
Log Assets The log of the fund's assets in millions of 2004 US dollars 17.134 17.157 1.726 11.028 23.668 2137
Log Age The log of the fund's age in months from the date of formation to December 2005 4.334 4.304 0.496 2.996 6.146 2137
Minimum Investment The minimum investment required for the fund 1181787 500000 11269825 0 500000000 2137
Management Fee The fixed fee in percentages for management compensation 1.367 1 0.896 0 15 2137
Performance Fee The carried interest performance fee in percentages for management compensation 18.094 20 5.770 0 50 2137

32
Table 3. Correlation Matrix
This table presents correlations across the variables defined in Table 2. Correlations significant at the 5% level are highlighted in underline font.
(1) (2) (3) (4) (5) (6) (7) (8) (9) (10) (11) (12) (13) (14) (15) (16) (17) (18) (19) (20) (21) (22)
(1) 3-Year Alpha 1.00
(2) 3-Year Manipulation Proof Performance Measure 0.06 1.00
(3) 3-Year Average Return 0.11 0.83 1.00
(4) 3-Year Standard Deviation of Returns 0.04 0.19 0.37 1.00
(5) Log Minimum Capitalization -0.01 0.16 0.07 -0.04 1.00
(6) Restrictions on Location of Key Service Providers -0.03 0.18 0.08 -0.05 0.86 1.00
(7) Marketing Bank -0.02 0.16 0.06 -0.04 0.86 0.90 1.00 (8) Marketing Fund Distribution
Company -0.03 0.03 0.06 0.04 0.07 -0.03 0.17 1.00 (9) Marketing Via Wrappers -0.01 -0.02 0.00 0.02 0.11 -0.08 0.21 0.75 1.00 (10) Marketing Private
Placement 0.01 0.02 0.03 0.03 -0.12 0.01 -0.10 -0.07 -0.10 1.00 (11) Marketing Investment
Manager -0.02 0.17 0.07 -0.05 0.85 0.90 0.93 0.22 0.26 0.01 1.00 (12) Marketing Other Regulated
Financial Institution -0.02 0.04 0.05 0.03 0.14 0.07 0.28 0.64 0.47 -0.40 0.10 1.00
(13) Marketing Non-Regulated Financial Institution 0.03 0.07 0.07 0.04 0.06 -0.03 0.07 0.28 0.25 0.00 0.07 0.23 1.00
(14) Sum of Marketing Channels -0.03 0.15 0.08 -0.02 0.76 0.75 0.91 0.54 0.54 -0.06 0.90 0.47 0.21 1.00 (15) Log GNP Per Capita 0.01 -0.18 -0.14 -0.03 -0.64 -0.69 -0.58 -0.28 -0.18 -0.13 -0.67 -0.19 -0.01 -0.63 1.00
(16) French Legal Origin 0.00 0.05 0.03 -0.01 0.13 0.04 0.05 0.35 0.19 -0.52 0.05 0.33 -0.01 0.14 -0.28 1.00
(17) German Legal Origin -0.01 -0.03 0.02 0.03 0.05 0.02 0.09 0.37 0.33 -0.21 0.05 0.21 0.00 0.18 -0.12 -0.01 1.00
(18) Yearly Capital Redemptions 0.01 0.08 0.06 -0.02 0.12 -0.04 -0.02 -0.14 -0.15 -0.16 -0.05 -0.06 0.03 -0.16 -0.06 -0.01 -0.16 1.00
(19) Log Assets -0.04 0.17 0.04 -0.20 -0.19 0.08 -0.01 0.29 0.32 0.31 0.00 -0.01 -0.04 0.31 0.01 0.03 0.26 0.09 1.00
(20) Log Age -0.01 0.02 -0.01 0.08 -0.02 0.04 -0.04 -0.06 -0.04 -0.07 -0.02 -0.05 0.01 -0.06 -0.04 0.04 -0.07 0.15 0.20 1.00
(21) Minimum Investment -0.02 -0.02 -0.02 -0.02 0.00 -0.01 0.00 0.02 0.02 0.02 -0.01 -0.01 0.00 0.02 -0.01 0.00 0.01 0.00 0.02 0.01 1.00
(22) Management Fee 0.02 -0.02 0.03 0.08 -0.07 -0.01 0.05 0.08 0.07 0.08 0.06 0.06 0.00 0.08 0.05 0.01 0.09 -0.06 0.03 -0.04 -0.01 1.00
(23) Performance Fee 0.01 0.10 0.11 0.16 -0.14 0.03 -0.03 0.17 0.18 0.19 0.02 0.03 0.03 0.19 0.03 0.00 0.17 -0.11 0.05
-0.07
-0.01 0.07

33
Table 4. Regression Analyses of Manipulation Proof Performance Measure
This table present OLS regression analyses of the determinants of the Manipulation Proof Performance Measure (Goetzmann et al., 2007) for the cross-section of funds in the data. Explanatory variables are as defined in Table 2. Dummy variables are included for the continents in which assets are primarily located, and the funds' primary strategy (30 dummy variables in total). Models (1) and (2) present the full sample and different right-hand-side variable to check for collinearity problems. Models (3) and (4) show robustness exclusion of the US funds and the HFN Data, respectively. Models (5) shows a two-step regression whereby the first step is a logit regression on a dummy variable equal to one for offshore registrations, and the second step is a Heckman sample selection regression given the results in the first step. White's HCCME is used in all regressions.
Variable Model (1): Full Sample Model (2): Full Sample Model (3) Excluding US
Funds Model (4): CISDM Data
only, Excluding HFN Data Model (5a): Heckman
Sample Selection [1st Step] Model (5b): Heckman Sample
Selection [2nd Step] Coefficient t-statistic Coefficient t-statistic Coefficient t-statistic Coefficient t-statistic Coefficient t-statistic Coefficient t-statistic
Constant 119.529 5.310*** 133.238 5.671*** 106.879 3.878*** 137.292 4.410*** -1.916 -6.052*** 201.531 4.869***
Hedge Fund Regulation Variables
Log Minimum Capitalization -0.108 -1.341 -0.107 -1.325 -0.091 -1.132 -0.102 -0.919 Restrictions on Location of Key
Service Providers -5.811 -6.416*** -7.352 -3.623*** -8.128 -2.170** -7.736 -2.365** -8.338 -1.971**
Marketing Bank 2.466 1.392 4.890 1.875* 2.267 0.805 1.794 0.588 Marketing Fund Distribution
Company 1.192 0.444 -0.779 -0.249 12.851 1.665* 23.553 2.905***
Marketing Via Wrappers -3.808 -2.457** -6.114 -2.520** -4.228 -0.890 -15.228 -2.219** -21.389 -2.686***
Marketing Private Placement -2.015 -0.707 -2.322 -0.686 2.038 0.591 -4.050 -0.748 -10.561 -1.347
Country GNP and Legal Origin
Log GNP Per Capita -10.176 -5.281*** -11.383 -5.644*** -11.736 -5.034*** -12.886 -4.552*** -15.792 -4.349***
French Legal Origin -4.212 -1.945* -4.428 -1.839* -2.236 -0.749 -8.126 -2.713*** 1.252 2.741*** -16.066 -3.468***
German Legal Origin -2.061 -0.699 -2.484 -0.676 -1.089 -0.279 -10.215 -3.650*** 0.024 0.021 -19.041 -1.619
Fund Characteristics
Yearly Capital Redemptions 2.650 4.173*** 2.684 4.216*** 1.658 0.804 3.528 3.139*** 4.666 1.846*
Log Assets 0.294 2.234** 0.282 2.146** 0.300 1.296 0.462 2.317** 0.363 1.249
Log Age 0.095 0.229 0.080 0.195 0.673 0.818 0.175 0.271 -0.220 -0.201 Minimum Investment -8.848E-10 -0.027 -6.537E-10 -0.009 -3.347E-09 -0.888 4.093E-09 0.667 -1.206E-08 -0.576
Management Fee 0.221 1.299 0.214 1.261 0.209 0.851 0.092 0.613 0.592 1.244
Performance Fee -0.044 -1.018 -0.044 -1.013 -0.149 -1.124 -0.268 -3.043*** -0.421 -2.860***
HFN Data Dummy -8.258 -9.859*** -8.271 -10.035*** -2.006 -0.563
Heckman's Lambda -7.284 -5.927*** Dummy Variables for Primary
Location of Assets? Yes Yes Yes Yes Yes No
Dummy Variables for Primary Fund Strategy? Yes Yes Yes Yes Yes No
Model Diagnostics Number of Observations 2137 2137 682 1127 2137 553
Adjusted R2 (Pseudo R2 for Model 4a Step 1) 0.374 0.374 0.352 0.288 0.321 0.154
Loglikelihood -7688.666 -7686.443 -2473.886 -4149.271 -829.836 -2078.916 F-Statistic (Chi Square for Model
4a Step 1) 24.62*** 23.41*** 11.28*** 13.65*** 784.075*** 7.29***
Akaike Information Statistic 7.247 7.248 7.363 7.429 7.580

34
Table 5. Regression Analyses of Multifactor Alpha
This table present OLS regression analyses of the determinants of the alpha of the multifactor model (Fung and Hsieh, 2004) for the cross-section of funds in the data. Explanatory variables are as defined in Table 2. Dummy variables are included for the continents in which assets are primarily located, and the funds' primary strategy (30 dummy variables in total). Models (6) and (7) present the full sample and different right-hand-side variable to check for collinearity problems. Models (8) and (9) show robustness exclusion of the US funds and the HFN Data, respectively. Models (10) shows a two-step regression whereby the first step is a logit regression on a dummy variable equal to one for offshore registrations, and the second step is a Heckman sample selection regression given the results in the first step. White's HCCME is used in all regressions.
Variable Model (6): Full Sample Model (7): Full Sample Model (8) Excluding US
Funds Model (9): CISDM Data only,
Excluding HFN Data
Model (10a): Heckman Sample Selection [1st
Step]
Model (10b): Heckman Sample Selection [2nd Step]
Coefficient t-statistic Coefficient t-statistic Coefficient t-statistic Coefficient t-statistic Coefficient t-statistic Coefficient t-statistic
Constant -27.066 -0.514 -17.098 -0.319 -5.140 -0.092 36.731 0.618 -1.916 -6.052*** 175.963 2.540** Hedge Fund Regulation Variables
Log Minimum Capitalization 0.156 0.902 0.151 0.872 0.437 2.819*** 0.143 0.771 Restrictions on Location of Key
Service Providers -0.510 -0.270 -5.299 -1.283 -0.640 -0.078 -10.037 -1.899* -16.757 -2.359**
Marketing Bank 3.043 0.883 3.423 0.753 2.228 0.487 8.358 1.636 Marketing Fund Distribution
Company -14.948 -2.047** -14.303 -2.110** -6.374 -0.526 -0.115 -0.009
Marketing Via Wrappers 1.568 0.385 6.444 1.036 11.951 1.204 -5.118 -0.473 -1.698 -0.128
Marketing Private Placement 4.973 0.587 14.472 1.450 6.123 0.549 11.922 1.158 -2.890 -0.221
Country GNP and Legal Origin
Log GNP Per Capita 1.898 0.441 0.807 0.186 -3.900 -0.819 -5.141 -0.971 -18.027 -2.965***
French Legal Origin 2.868 0.542 10.083 1.681* 7.812 1.359 4.477 0.744 1.252 2.741*** -3.790 -0.498
German Legal Origin -4.711 -0.245 5.607 0.270 1.180 0.049 -29.738 -4.780*** 0.024 0.021 -47.775 -2.476** Fund Characteristics
Yearly Capital Redemptions 0.389 0.257 0.433 0.286 9.239 2.029** 2.334 1.047 4.908 1.156
Log Assets -0.658 -1.103 -0.701 -1.165 1.792 3.763*** 0.918 2.423** 1.620 3.328***
Log Age -0.093 -0.076 0.020 0.016 -4.148 -2.347** -1.821 -1.434 -4.255 -2.319**
Minimum Investment -1.964E-08 -0.156 -2.098E-08 -0.112 -9.819E-09 -1.140 -6.532E-09 -0.551 -2.393E-08 -0.678
Management Fee 1.060 1.963** 1.071 1.969* 0.282 0.411 1.174 3.601*** 1.661 2.083**
Performance Fee 0.087 0.726 0.071 0.578 0.023 0.089 0.119 0.686 0.168 0.681
HFN Data Dummy -3.299 -1.082 -3.648 -1.179 -5.941 -1.068
Heckman's Lambda 8.084 4.028*** Dummy Variables for Primary
Location of Assets? Yes Yes Yes Yes Yes No
Dummy Variables for Primary Fund Strategy? Yes Yes Yes Yes Yes No
Model Diagnostics Number of Observations 2137 2137 682 1127 2137 553
Adjusted R2 (Pseudo R2 for Model 8a Step 1) 0.037 0.039 0.107 0.107 0.321 0.066
Loglikelihood -9948.232 -9944.312 -2969.467 -4869.931 -829.836 -2364.826 F-Statistic (Chi Square for Model
8a Step 1) 2.57*** 2.53*** 3.28*** 4.74*** 784.075*** 3.44***
Akaike Information Statistic 9.361 9.361 8.817 8.708 8.614

35
Table 6. Regression Analyses of Average Monthly Returns
This table present OLS regression analyses of the determinants of the average monthly returns for the cross-section of funds in the data. Explanatory variables are as defined in Table 2. Dummy variables are included for the continents in which assets are primarily located, and the funds' primary strategy (30 dummy variables in total). Models (11) and (12) present the full sample and different right-hand-side variable to check for collinearity problems. Models (13) and (14) show robustness exclusion of the US funds and the HFN Data, respectively. Models (15) shows a two-step regression whereby the first step is a logit regression on a dummy variable equal to one for offshore registrations, and the second step is a Heckman sample selection regression given the results in the first step. White's HCCME is used in all regressions.
Variable Model (11): Full Sample Model (12): Full Sample Model (13) Excluding US
Funds Model (14): CISDM Data only,
Excluding HFN Data Model (15a): Heckman Sample
Selection [1st Step] Model (15b): Heckman Sample
Selection [2nd Step] Coefficient t-statistic Coefficient t-statistic Coefficient t-statistic Coefficient t-statistic Coefficient t-statistic Coefficient t-statistic
Constant 11.752 6.009*** 13.108 6.540*** 10.739 4.922*** 11.996 4.684*** -1.916 -6.052*** 18.447 5.006*** Hedge Fund Regulation Variables
Log Minimum Capitalization -0.010 -1.551 -0.010 -1.452 -0.009 -1.411 -0.011 -1.071 Restrictions on Location of Key
Service Providers -0.546 -7.426*** -0.702 -4.156*** -0.863 -2.660*** -0.598 -2.235** -0.696 -1.847*
Marketing Bank 0.243 1.638 0.391 1.793* 0.177 0.763 0.164 0.606 Marketing Fund Distribution
Company 0.215 1.035 0.120 0.527 0.911 1.369 1.717 2.382**
Marketing Via Wrappers -0.349 -2.977*** -0.634 -3.236*** -0.643 -1.726* -1.109 -1.855* -1.503 -2.124**
Marketing Private Placement -0.031 -0.118 -0.095 -0.309 0.236 0.702 -0.391 -0.830 -0.982 -1.408 Country GNP and Legal Origin
Log GNP Per Capita -0.946 -5.768*** -1.062 -6.354*** -1.082 -5.899*** -1.072 -4.654*** -1.415 -4.376***
French Legal Origin -0.316 -1.621 -0.377 -1.781* -0.295 -1.188 -0.677 -2.591*** 1.252 2.741*** -1.397 -3.400
German Legal Origin 0.471 1.338 0.378 0.904 0.493 0.975 -0.304 -1.244 0.024 0.021 -1.007 -0.965 Fund Characteristics
Yearly Capital Redemptions 0.239 3.988*** 0.242 4.042*** 0.268 1.598 0.339 3.366*** 0.416 1.848*
Log Assets -0.011 -0.876 -0.012 -0.951 -0.011 -0.539 -0.011 -0.617 -0.006 -0.220
Log Age -0.053 -1.429 -0.054 -1.467 0.054 0.802 0.081 1.454 0.016 0.166
Minimum Investment 6.005E-11 0.022 8.399E-11 0.013 -3.936E-10 -1.291 7.909E-11 0.171 -1.247E-09 -0.668
Management Fee 0.019 1.307 0.019 1.253 0.029 1.330 0.012 0.972 0.063 1.485
Performance Fee 0.002 0.523 0.002 0.551 -0.008 -0.867 -0.017 -2.511** -0.034 -2.568**
HFN Data Dummy -0.389 -5.271*** -0.387 -5.291*** 0.060 0.261
Heckman's Lambda -0.614 -5.635*** Dummy Variables for Primary
Location of Assets? Yes Yes Yes Yes Yes No
Dummy Variables for Primary Fund Strategy? Yes Yes Yes Yes Yes No
Model Diagnostics Number of Observations 2137 2137 682 1127 2137 553
Adjusted R2 (Pseudo R2 for Model 12a Step 1) 0.245 0.246 0.312 0.274 0.321 0.134
Loglikelihood -2480.760 -2477.397 -810.639 -1404.041 -829.836 -798.092 F-Statistic (Chi Square for Model 12a
Step 1) 13.80*** 13.21*** 9.56*** 12.80*** 784.075*** 6.35***
Akaike Information Statistic 2.373 2.373 2.486 2.557 2.743
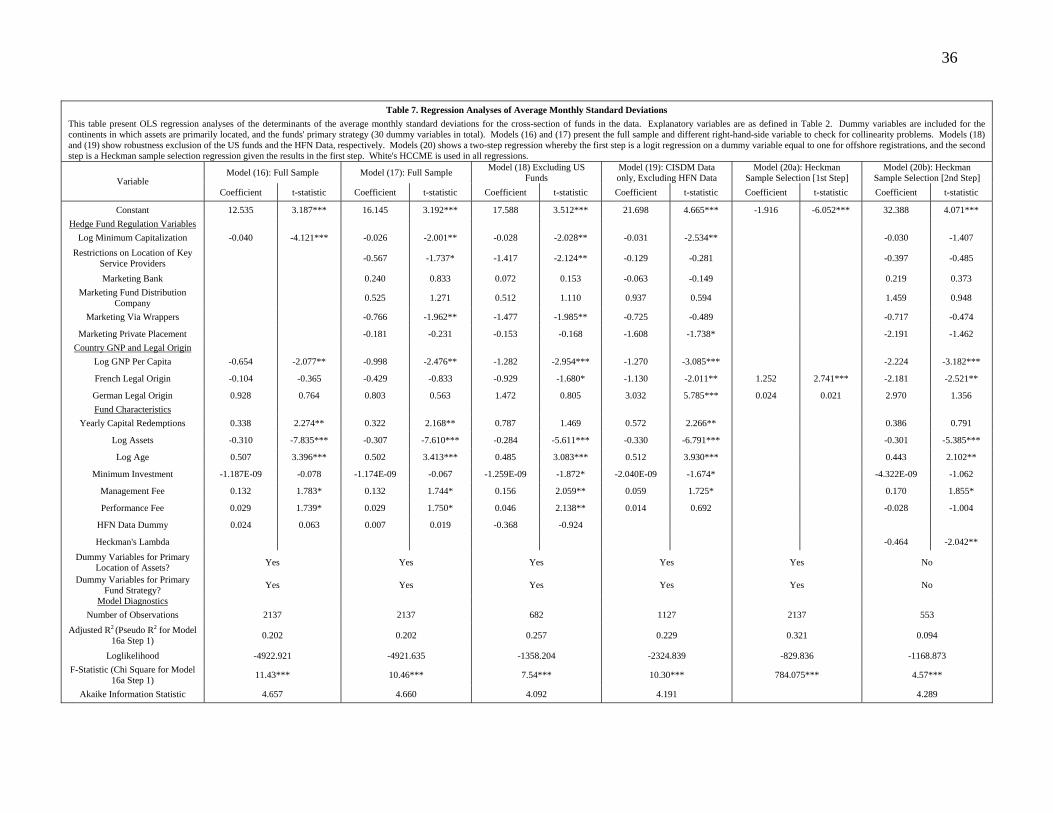
36
Table 7. Regression Analyses of Average Monthly Standard Deviations
This table present OLS regression analyses of the determinants of the average monthly standard deviations for the cross-section of funds in the data. Explanatory variables are as defined in Table 2. Dummy variables are included for the continents in which assets are primarily located, and the funds' primary strategy (30 dummy variables in total). Models (16) and (17) present the full sample and different right-hand-side variable to check for collinearity problems. Models (18) and (19) show robustness exclusion of the US funds and the HFN Data, respectively. Models (20) shows a two-step regression whereby the first step is a logit regression on a dummy variable equal to one for offshore registrations, and the second step is a Heckman sample selection regression given the results in the first step. White's HCCME is used in all regressions.
Variable Model (16): Full Sample Model (17): Full Sample Model (18) Excluding US
Funds Model (19): CISDM Data only, Excluding HFN Data
Model (20a): Heckman Sample Selection [1st Step]
Model (20b): Heckman Sample Selection [2nd Step]
Coefficient t-statistic Coefficient t-statistic Coefficient t-statistic Coefficient t-statistic Coefficient t-statistic Coefficient t-statistic
Constant 12.535 3.187*** 16.145 3.192*** 17.588 3.512*** 21.698 4.665*** -1.916 -6.052*** 32.388 4.071*** Hedge Fund Regulation Variables
Log Minimum Capitalization -0.040 -4.121*** -0.026 -2.001** -0.028 -2.028** -0.031 -2.534** -0.030 -1.407 Restrictions on Location of Key
Service Providers -0.567 -1.737* -1.417 -2.124** -0.129 -0.281 -0.397 -0.485
Marketing Bank 0.240 0.833 0.072 0.153 -0.063 -0.149 0.219 0.373 Marketing Fund Distribution
Company 0.525 1.271 0.512 1.110 0.937 0.594 1.459 0.948
Marketing Via Wrappers -0.766 -1.962** -1.477 -1.985** -0.725 -0.489 -0.717 -0.474
Marketing Private Placement -0.181 -0.231 -0.153 -0.168 -1.608 -1.738* -2.191 -1.462 Country GNP and Legal Origin
Log GNP Per Capita -0.654 -2.077** -0.998 -2.476** -1.282 -2.954*** -1.270 -3.085*** -2.224 -3.182***
French Legal Origin -0.104 -0.365 -0.429 -0.833 -0.929 -1.680* -1.130 -2.011** 1.252 2.741*** -2.181 -2.521**
German Legal Origin 0.928 0.764 0.803 0.563 1.472 0.805 3.032 5.785*** 0.024 0.021 2.970 1.356 Fund Characteristics
Yearly Capital Redemptions 0.338 2.274** 0.322 2.168** 0.787 1.469 0.572 2.266** 0.386 0.791
Log Assets -0.310 -7.835*** -0.307 -7.610*** -0.284 -5.611*** -0.330 -6.791*** -0.301 -5.385***
Log Age 0.507 3.396*** 0.502 3.413*** 0.485 3.083*** 0.512 3.930*** 0.443 2.102**
Minimum Investment -1.187E-09 -0.078 -1.174E-09 -0.067 -1.259E-09 -1.872* -2.040E-09 -1.674* -4.322E-09 -1.062
Management Fee 0.132 1.783* 0.132 1.744* 0.156 2.059** 0.059 1.725* 0.170 1.855*
Performance Fee 0.029 1.739* 0.029 1.750* 0.046 2.138** 0.014 0.692 -0.028 -1.004
HFN Data Dummy 0.024 0.063 0.007 0.019 -0.368 -0.924
Heckman's Lambda -0.464 -2.042** Dummy Variables for Primary
Location of Assets? Yes Yes Yes Yes Yes No
Dummy Variables for Primary Fund Strategy? Yes Yes Yes Yes Yes No
Model Diagnostics Number of Observations 2137 2137 682 1127 2137 553
Adjusted R2 (Pseudo R2 for Model 16a Step 1) 0.202 0.202 0.257 0.229 0.321 0.094
Loglikelihood -4922.921 -4921.635 -1358.204 -2324.839 -829.836 -1168.873 F-Statistic (Chi Square for Model
16a Step 1) 11.43*** 10.46*** 7.54*** 10.30*** 784.075*** 4.57***
Akaike Information Statistic 4.657 4.660 4.092 4.191 4.289

37
Table 8. Regression Analyses of Fixed Fees and Performance Fees
This table present Tobit regression analyses of the determinants of the fixed management fee % and the carried interest performance fee % for the cross-section of funds in the data. Explanatory variables are as defined in Table 2. Dummy variables are included for the continents in which assets are primarily located, and the funds' primary strategy (30 dummy variables in total). Models (21) and (22) show the full sample. Models (23)-(24) and Models (25)-(26) show robustness exclusion of the US funds and the HFN Data, respectively. White's HCCME is used in all regressions.
Variable
Full Sample Excluding US Data CISDM Data Only; Excluding HFN Data
Model (21): Fixed Fees Model (22): Performance Fees Model (23): Fixed Fees Model (24): Performance Fees Model (25): Fixed Fees Model (26): Performance Fees
Coefficient t-statistic Coefficient t-statistic Coefficient t-statistic Coefficient t-statistic Coefficient t-statistic Coefficient t-statistic
Constant 3.380 1.636 13.407 1.251 4.028 1.770* 24.968 3.049*** 4.444 1.565 23.763 2.613*** Hedge Fund Regulation
Variables
Restrictions on Location of Key Service Providers 0.025 0.320 -0.054 -0.133 -0.068 -0.210 -3.935 -3.323*** -0.032 -0.328 0.321 1.011
Marketing Via Wrappers 0.263 2.067** 0.661 0.999 0.187 0.587 -3.968 -3.437*** 0.468 2.185** -0.269 -0.392
Marketing Private Placement -0.136 -0.388 4.729 2.579** -0.137 -0.343 6.043 4.174*** -0.263 -0.528 0.460 0.288
Country GNP and Legal Origin
Log GNP Per Capita -0.188 -1.098 -0.648 -0.729 -0.216 -1.140 -0.551 -0.809 -0.297 -1.272 -0.326 -0.436
French Legal Origin -0.344 -1.485 2.528 2.102** -0.402 -1.600 0.971 1.073 -0.461 -1.461 0.449 0.444
German Legal Origin 0.302 0.811 -4.423 -2.274** 0.361 0.861 -0.814 -0.537 2.683 2.620*** 1.884 0.573
Fund Characteristics
Yearly Capital Redemptions -0.030 -0.464 0.349 1.022 -0.058 -0.258 1.300 1.607 -0.037 -0.328 1.523 4.181***
Log Assets 0.017 1.305 0.123 1.869* 0.006 0.269 -0.020 -0.242 0.037 1.865* 0.011 0.172
Log Age -0.099 -2.426** -1.064 -5.033*** -0.088 -1.072 -0.506 -1.704* -0.204 -2.997*** -0.707 -3.236***
Minimum Investment -1.676E-10 -0.100 -7.873E-09 -0.906 -1.845E-10 -0.099 -8.137E-09 -1.217 2.330E-10 0.118 -6.935E-09 -1.096
HFN Data Dummy 0.035 0.444 -0.680 -1.645* Dummy Variables for Primary
Location of Assets? Yes Yes Yes Yes Yes Yes
Dummy Variables for Primary Fund Strategy? Yes Yes Yes Yes Yes Yes
Model Diagnostics
Number of Observations 2137 2137 682 682 1127 1127
Loglikelihood -2706.560 -6079.098 -895.938 -1766.231 -1585.193 -2899.912
ANOVA based fit measure 0.094 0.486 0.047 0.117 0.075 0.075
Related Documents


