Journal of Atmospheric Chemistry 47: 139–167, 2004. © 2004 Kluwer Academic Publishers. Printed in the Netherlands. 139 A Laser-induced Fluorescence Instrument for Detecting Tropospheric OH and HO 2 : Characteristics and Calibration IAN C. FALOONA 1, 2 , DAVID TAN 1, 3 , ROBERT L. LESHER 1 , NATHAN L. HAZEN 4 , CHRISTOPHER L. FRAME 5 , JAMES B. SIMPAS 1 , HARTWIG HARDER 1, 6 , MONICA MARTINEZ 1, 6 , PIERO DI CARLO 1, 7 , XINRONG REN 1 and WILLIAM H. BRUNE 1 1 Department of Meteorology, Pennsylvania State University, 503 Walker Building, University Park, PA 16802, U.S.A., e-mail: [email protected] 2 Now at Department of Land, Air and Water Resources, University of California at Davis, Davis, CA, U.S.A. 3 Now at School of Earth and Atmospheric Sciences, Georgia Institute of Technology, Atlanta, GA, U.S.A. 4 Greenland, NH, U.S.A. 5 ILC Dover, Inc., Frederica, DE, U.S.A. 6 Now at Max-Planck-Institut für Chemie, D-55116 Mainz, Germany 7 CETEMPS, Dipartimento di Fisica, Università degli Studi di L’Aquila, Coppito, Italy (Received: 11 September 2003; accepted: 19 November 2003) Abstract. Measurement capability for the detection of atmospheric OH and HO 2 has been developed at the Pennsylvania State University over the last decade. The instrument is used in two forms: an aircraft configuration, Airborne Tropospheric Hydrogen Oxides Sensor (ATHOS), and the configura- tion used on towers, Ground-based Tropospheric Hydrogen Oxides Sensor (GTHOS). The instrument uses ultraviolet laser induced fluorescence (LIF) to detect OH in air that is pulled by a vacuum pump through a small inlet into a low-pressure detection chamber; HO 2 is detected by reacting it with NO to form OH, which is detected by LIF in a second detection chamber. In the calibration, equal amounts of OH and HO 2 ranging from 0.15 pptv to 100 pptv are produced via photolysis of water vapor by the 185 nm emission from a low-pressure Hg lamp. Estimated absolute uncertainty at the 2σ confidence level is ±32% for both OH and HO 2 . The dependence of the instrument detection sensitivity has been quantified for changes in ambient water vapor, pressure, laser power, and the flow velocity of ambient air past the inlet. During the last 7 years, the instrument has been deployed in multi-investigator intensive field studies 5 times on the NASA DC-8 aircraft and 8 times on ground- based towers. The descriptions in this manuscript detail our cumulative wisdom of the instrumental response and calibration techniques developed over this time. Key words: calibration, hydroperoxy radical, hydroxyl radical, instrument, laser-induced fluores- cence. Corresponding author.

Welcome message from author
This document is posted to help you gain knowledge. Please leave a comment to let me know what you think about it! Share it to your friends and learn new things together.
Transcript
Journal of Atmospheric Chemistry 47: 139–167, 2004.© 2004 Kluwer Academic Publishers. Printed in the Netherlands.
139
A Laser-induced Fluorescence Instrumentfor Detecting Tropospheric OH and HO2:Characteristics and Calibration
IAN C. FALOONA 1, 2, DAVID TAN 1, 3, ROBERT L. LESHER 1,NATHAN L. HAZEN 4, CHRISTOPHER L. FRAME 5, JAMES B. SIMPAS 1,HARTWIG HARDER 1, 6, MONICA MARTINEZ 1, 6, PIERO DI CARLO 1, 7,XINRONG REN 1 and WILLIAM H. BRUNE 1�
1Department of Meteorology, Pennsylvania State University, 503 Walker Building, University Park,PA 16802, U.S.A., e-mail: [email protected] at Department of Land, Air and Water Resources, University of California at Davis, Davis,CA, U.S.A.3Now at School of Earth and Atmospheric Sciences, Georgia Institute of Technology, Atlanta, GA,U.S.A.4Greenland, NH, U.S.A.5ILC Dover, Inc., Frederica, DE, U.S.A.6Now at Max-Planck-Institut für Chemie, D-55116 Mainz, Germany7CETEMPS, Dipartimento di Fisica, Università degli Studi di L’Aquila, Coppito, Italy
(Received: 11 September 2003; accepted: 19 November 2003)
Abstract. Measurement capability for the detection of atmospheric OH and HO2 has been developedat the Pennsylvania State University over the last decade. The instrument is used in two forms: anaircraft configuration, Airborne Tropospheric Hydrogen Oxides Sensor (ATHOS), and the configura-tion used on towers, Ground-based Tropospheric Hydrogen Oxides Sensor (GTHOS). The instrumentuses ultraviolet laser induced fluorescence (LIF) to detect OH in air that is pulled by a vacuum pumpthrough a small inlet into a low-pressure detection chamber; HO2 is detected by reacting it withNO to form OH, which is detected by LIF in a second detection chamber. In the calibration, equalamounts of OH and HO2 ranging from 0.15 pptv to 100 pptv are produced via photolysis of watervapor by the 185 nm emission from a low-pressure Hg lamp. Estimated absolute uncertainty at the2σ confidence level is ±32% for both OH and HO2. The dependence of the instrument detectionsensitivity has been quantified for changes in ambient water vapor, pressure, laser power, and the flowvelocity of ambient air past the inlet. During the last 7 years, the instrument has been deployed inmulti-investigator intensive field studies 5 times on the NASA DC-8 aircraft and 8 times on ground-based towers. The descriptions in this manuscript detail our cumulative wisdom of the instrumentalresponse and calibration techniques developed over this time.
Key words: calibration, hydroperoxy radical, hydroxyl radical, instrument, laser-induced fluores-cence.
� Corresponding author.
140 IAN C. FALOONA ET AL.
1. Introduction
Nature has been extremely reluctant to directly divulge the abundance of its pri-mary oxidant, the hydroxyl radical. Consequently, the detection of atmospheric OHhas had a long and tortuous history (e.g., Brune et al., 1992; Eisele and Bradshaw,1993). Odd hydrogen radicals (HOx = OH + HO2) have long been identified ascrucial photochemical components of the natural atmosphere (Levy, 1971; Mc-Connell et al., 1971), but accurate measurement of their exact concentrations haveeluded researchers for many years. It has only been during the last decade or sothat instruments have demonstrated successful OH measurement capability (e.g.,Perner et al., 1987; Eisele and Tanner, 1991; Hard et al., 1992; Wennberg et al.,1995; Stevens et al., 1994; Mount and Harder, 1995; Holland et al., 1995; Creaseyet al., 1997; Brune et al., 1998; Kanaya et al., 1999; Creasey et al., 2001; Faloonaet al., 2001). Most OH measurements have been made on surface-based platforms.
Accurate calibration techniques have been one of the major obstacles in the roadto OH measurements, particularly for in situ instruments. The extreme chemicalreactivity of the OH radical makes any given laboratory preparation of a knownconcentration susceptible to heterogeneous wall loss and homogeneous scaveng-ing by impurities within seconds. The extreme reactivity also results in smallatmospheric OH concentrations – typically less than 107 molecules cm−3 – despitea large OH flux through the atmosphere.
This paper is a description of an instrument for measuring OH and HO2 thatwe have developed over the last decade, its ground-based and airborne configura-tions, and our method for calibrations using water photolysis as a source of oddhydrogen radicals. It also summarizes some of our experimental diagnostics fromthe field and the laboratory. Tests for instrument interferences are presented in anaccompanying manuscript (Ren et al., this issue).
2. Instrument Description
The Penn State HOx instrument uses the fluorescent assay by gas expansion(FAGE) technique originally developed by Hard et al. (1984). Earlier versions ofthe Penn State ground-based instrument have been described in detail elsewhere(Stevens et al., 1994; Mather et al., 1997). More recent versions use the sameprinciples but use more advanced technology to achieve better performance, asdescribed briefly by Tan et al. (2001a).
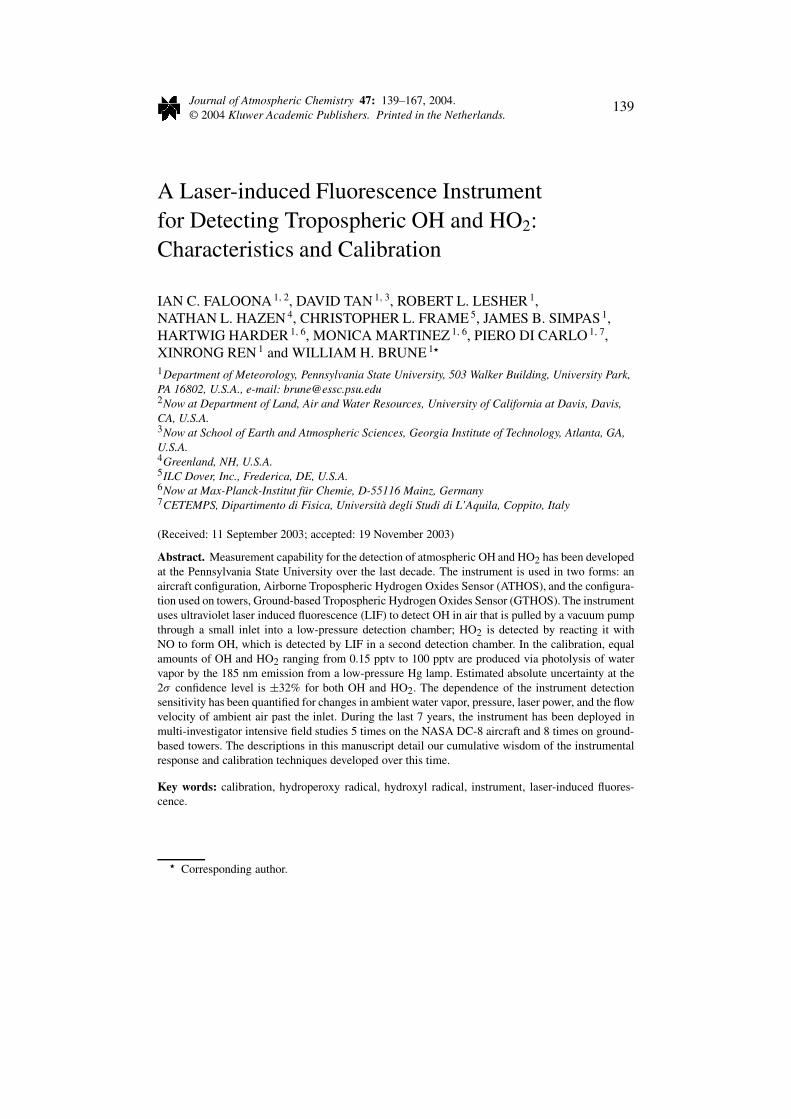
The instrument can be configured for airborne measurements as the AirborneTropospheric Hydrogen Oxides Sensor (ATHOS), which was developed for theNASA DC-8 in 1996, or for tower-based studies as the Ground-based TroposphericHydrogen Oxides Sensor (GTHOS), which was developed in 1998. Schematics ofATHOS and GTHOS, shown in Figure 1, indicate that the two instruments sharemany of the same components. We will first discuss the common characteristicsand then the characteristics that are unique to each.
A FLUORESCENCE INSTRUMENT FOR DETECTING TROPOSPHERIC OH AND HO2 141
Figure 1. Schematics of ATHOS (a) and GTHOS (b). The views of ATHOS are looking aftfrom in front of the electronics rack (top) and from the DC-8’s port side (bottom). In (b), thescaffolding used in different studies has been from 5 m to 40 m high.
2.1. CHARACTERISTICS COMMON TO ATHOS AND GTHOS
The instrument has four main subsystems: A low-pressure detection system, a laser,electronics for system control and data collection, and a vacuum system (Figure 1).
To sample the air, it is pulled by a vacuum pumping system through a smallsharp-edged orifice (0.7–1.5 mm diameter) into a 5-cm diameter sampling tubethat leads to the two detection axes in series. On the aircraft, a 1.5 mm diameterorifice is chosen so that the internal pressure of the system, which varies with theexternal pressure as the aircraft changes altitude, ranges from ∼3 hPa at 12 kmaltitude to ∼12 hPa on the ground. For GTHOS, a 1 mm orifice is usually chosenso that the internal pressure is 4–5 hPa. The vacuum pumping system consistsof a supercharger (Eaton M-90, Cleveland, OH) backed by a rotary mechanicalpump (Leybold D25B, Export, PA) and produces mass flow rates of ∼10 L min−1.Temperature is measured with a thermistor in the center of the sampling tube thatjoins the two detection axes, just below the OH axis. The detection cell pressure ismeasured by two sensors (MKS, 222, 10 Torr and 1000 Torr, Andover, MA).
Air encounters the OH detection axis first and the HO2 detection axis second.In each detection axis, the air stream is probed by a pulsed laser beam. The wave-length of this laser beam corresponds to an A2�(v′ = 0) → X2�(v′′ = 0)
transition for OH, near 308 nm. Typically, the laser is tuned to the Q1(2) transition,but the P1(1) and Q1(3) are also occasionally used. The laser beam is passed 32to 40 times back and forth through the air stream with a White cell (White, 1942)that has mirrors (2.5 cm diameter) spaced 25 cm apart (Electro Optics, Inc.). Atthe center of the detection cell, each laser beam is approximately 3 mm high and
142 IAN C. FALOONA ET AL.
2–3 mm wide. All the beams together form a rectangle that is 6–8 mm high by20 mm wide. The transmission through the White cell is greater than 92% withfresh optics. The laser power exiting the White cells is monitored by photodiodes(UDT, Inc., 555UV), as is the power exiting the laser system.
The weak OH fluorescence is detected by an electronically gated microchannelplate detector (Hamamatsu, R5916U-52, Hamamatsu City, Japan), which is set atright angles to both the air stream and the laser beam. As described in more detailbelow, the detector’s high-gain state and signal pulse counters can be controlledby electronic gates. The optical train that feeds the detector includes two lenses(7.5 cm diameter, f1) and a narrowband interference filter (Barr Associates, West-ford, MA). A concave spherical mirror collects fluorescence on the opposite side ofthe detection cell and sends it toward the lenses and detector. The total collectionefficiency is estimated to be 5–8% (Brune et al., 1995).
HO2 cannot be detected directly by LIF. Instead, NO (nitric oxide, >99% Math-eson, Twinsburg, OH) is added through a 2-cm diameter loop that is perforated withmany small holes to the air flow between the two detection axes so that the HO2
in the sample is rapidly converted to OH by the reaction: HO2 + NO → OH +NO2. This second measurement yields the total HOx (OH + HO2). HO2 is the dif-ference between HOx and the OH measured in the first axis, scaled by the relativeOH sensitivities of the two detection axes. The NO from commercial cylindersis passed at a regulated pressure of ∼20 psi through an Ascarite-packed cylinderto remove higher oxide impurities. The NO flow rate is controlled by a series ofsintered stainless steel flow restrictors (Mott Metallurgical, Farmington, CT) andsolenoid closure valves (Clippard ES-2T-12, Cincinnati, OH). The usual flow rateis 5 standard cubic centimeters (sccm), but rates of 3 and 8 sccm are used duringhourly calibration tests to ensure that the HO2 conversion is maximized.
The 308 nm UV source is a tunable dye laser (Wennberg et al., 1994) whichis intracavity doubled and pumped by a diode-pumped Nd:YAG laser (from 1995to 2000, LightWave Electronics, M210G-532–2500, Mountain View, CA; most re-cently, Spectra Physics, X30SC-1060A, Mountain View, CA). The pulse frequencyis chosen to be 3 kHz; the pulse widths are 25–40 ns. The two laser assembliesare mounted on either side of a rigid vertical plate. The wavelength of the UVlaser is tuned by means of an intracavity etalon (FSR 200 GHz) controlled by astepper motor; the output beam alternates between an on-resonance frequency andoff-resonance frequencies nearby (∼30 GHz to either side). The laser line widthis ∼4.7 GHz, about 1.5 times the OH linewidth, as determined with a diagnosticetalon and photodiode that are mounted on the laser plate.
To monitor the laser wavelength and enable tuning the laser on-resonance andoff-resonance, a small amount of laser light is passed through a low-pressure ref-erence cell, in which a photomultiplier tube detects fluorescence from the copiousOH that is made by thermolysis of water vapor on a 30-watt hot filament. Usu-ally, the sample in the detection cell is probed at the on-resonance wavelengthfor 10 seconds followed by an off-resonance wavelength for 10 seconds. The
A FLUORESCENCE INSTRUMENT FOR DETECTING TROPOSPHERIC OH AND HO2 143
off-resonance period is used to determine the contribution to the signal from back-ground effects. The off-resonance signal is monitored alternately at wavelengthsgreater than and less than the on-resonance wavelength.
Once the dye laser is aligned by adjusting the internal optics, it usually doesnot need to be aligned internally for weeks. The dye, Pyrromethene 597 (Exciton,Dayton, OH), is circulated through the dye laser from a 2-liter reservoir. Good dyelaser power can be maintained for continuous operation during an entire month-long ground-based mission by occasionally adding a small amount of concentrateddye solution to the reservoir. The laser power tends to decrease as the aircraftascends and descends or in the case of ground operations over the course of aday. It can be restored by adjusting the angle of the pump laser beam into the dyelaser and by adjusting the pressure in the sealed dye laser cavity. The average laserpower has been 10 to 25 mW.
The laser light is delivered to the detection system via fiber optic cables (200 µmdiameter, Thor Labs, Munich, Germany). The laser beam from the dye laser issplit so that 85% goes to the OH axis and 15% goes to the HO2 axis. Each laserbeam is focused into the end of a fiber. Near the detection chambers, the laserbeam exiting the fiber is focused into the White cell. In ATHOS, the fibers area meter long, but in GTHOS, they have been as long as 41 m, although 8–12 mfibers are typically used. The transmission of 308 nm laser light through the fiberis 0.98 m−1, so that the laser transmission in the 41-m fiber was less than 0.4. Inaddition, reflections off the ends of the fibers create additional, smaller laser pulsesthat occur after the laser pulse at time intervals �t (nanoseconds) = 9.8 × the fiberlength (m). These additional pulses cause laser scattering that must be avoidedby using narrower detection on-gates, thus decreasing detection sensitivity whenlonger fibers are used.
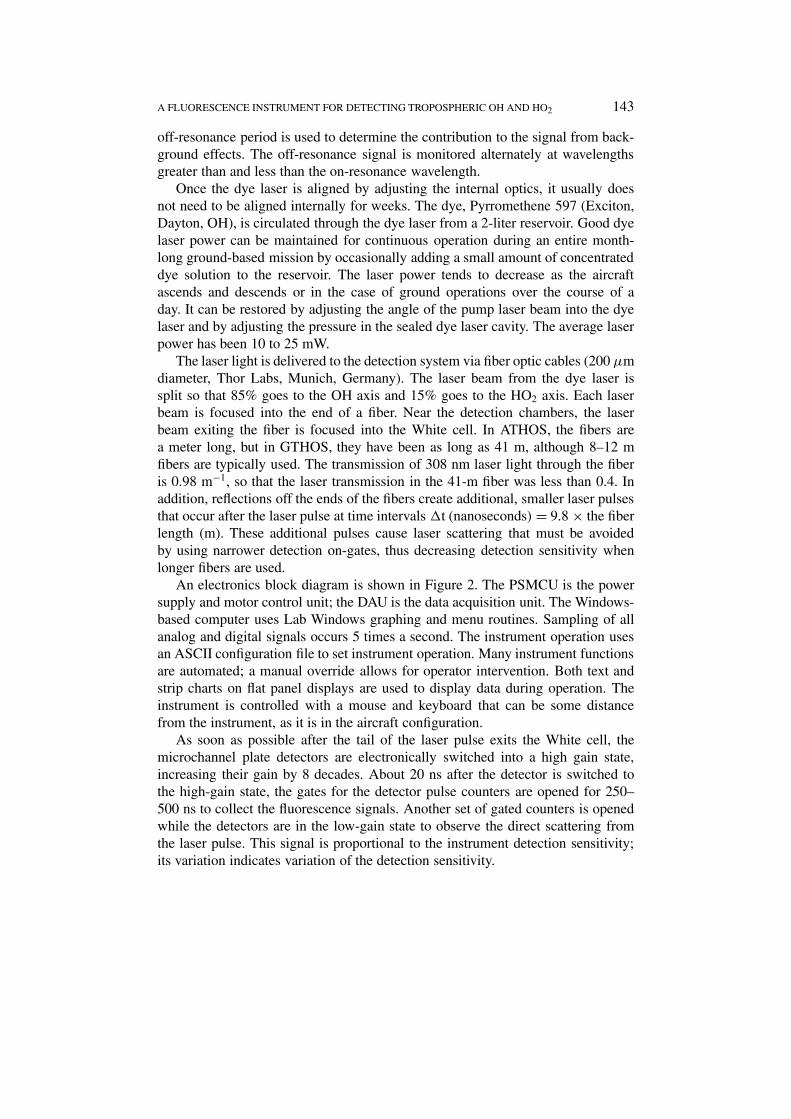
An electronics block diagram is shown in Figure 2. The PSMCU is the powersupply and motor control unit; the DAU is the data acquisition unit. The Windows-based computer uses Lab Windows graphing and menu routines. Sampling of allanalog and digital signals occurs 5 times a second. The instrument operation usesan ASCII configuration file to set instrument operation. Many instrument functionsare automated; a manual override allows for operator intervention. Both text andstrip charts on flat panel displays are used to display data during operation. Theinstrument is controlled with a mouse and keyboard that can be some distancefrom the instrument, as it is in the aircraft configuration.
As soon as possible after the tail of the laser pulse exits the White cell, themicrochannel plate detectors are electronically switched into a high gain state,increasing their gain by 8 decades. About 20 ns after the detector is switched tothe high-gain state, the gates for the detector pulse counters are opened for 250–500 ns to collect the fluorescence signals. Another set of gated counters is openedwhile the detectors are in the low-gain state to observe the direct scattering fromthe laser pulse. This signal is proportional to the instrument detection sensitivity;its variation indicates variation of the detection sensitivity.
144 IAN C. FALOONA ET AL.
Figure 2. Block diagram of the electrical system for ATHOS and GTHOS.
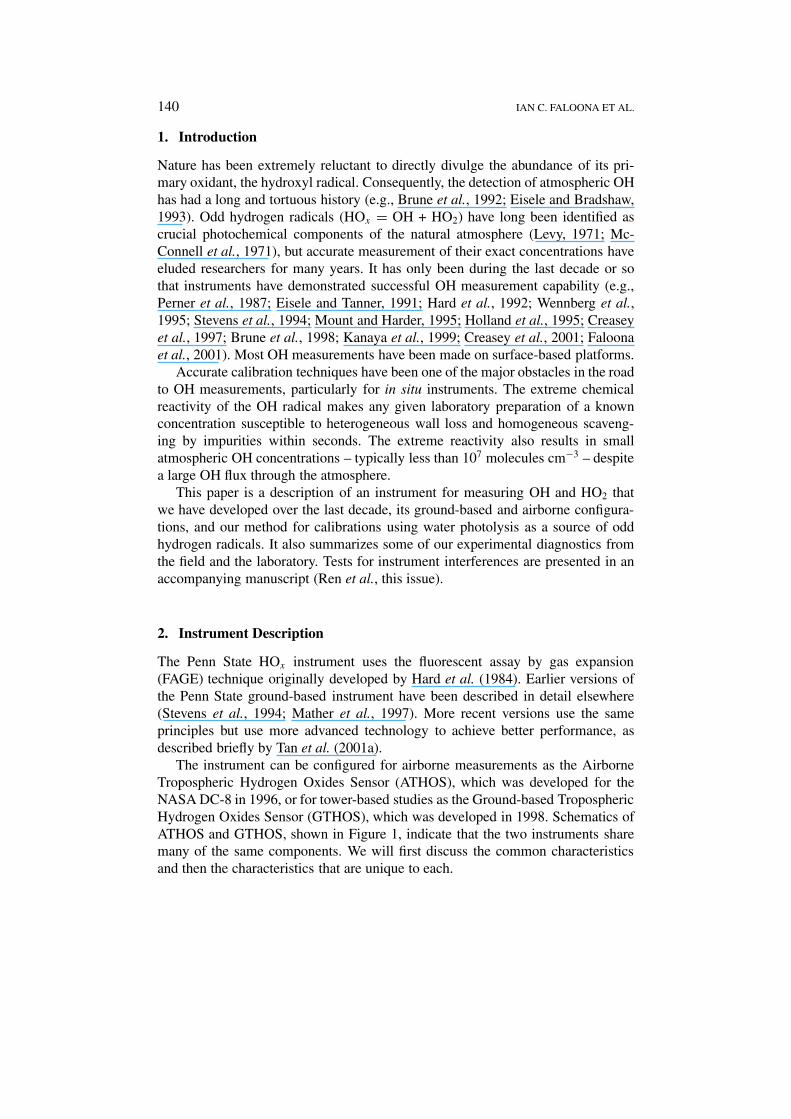
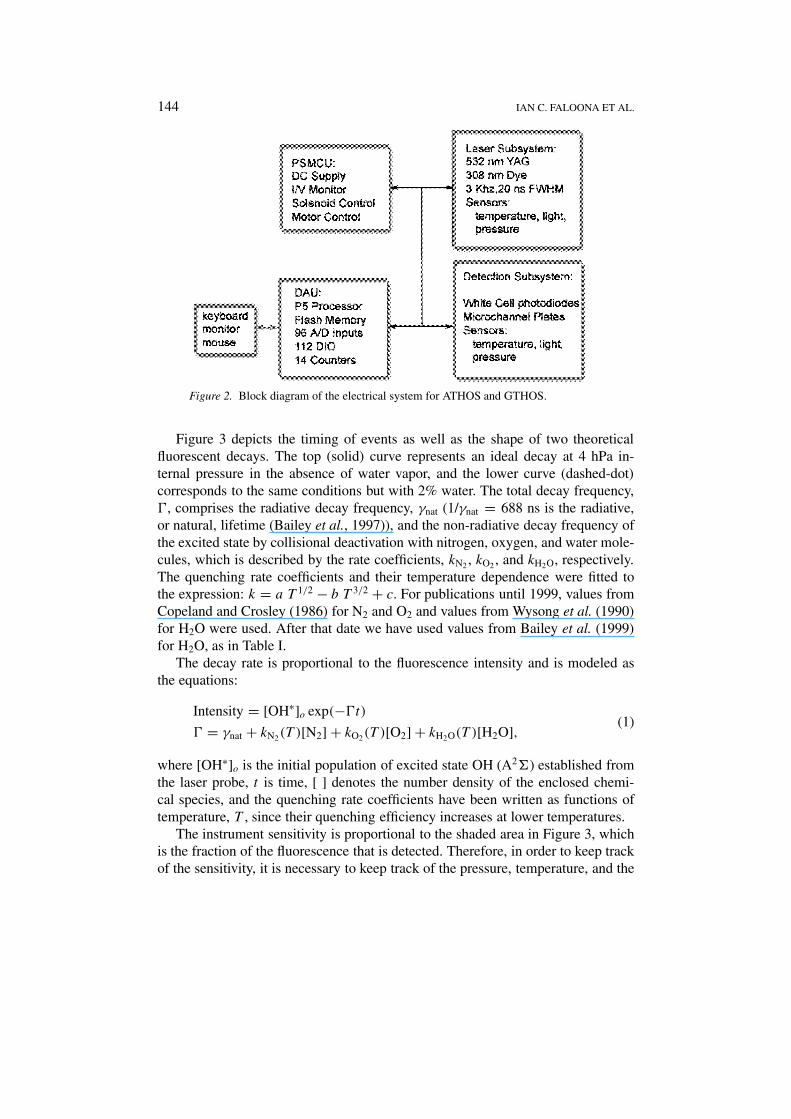
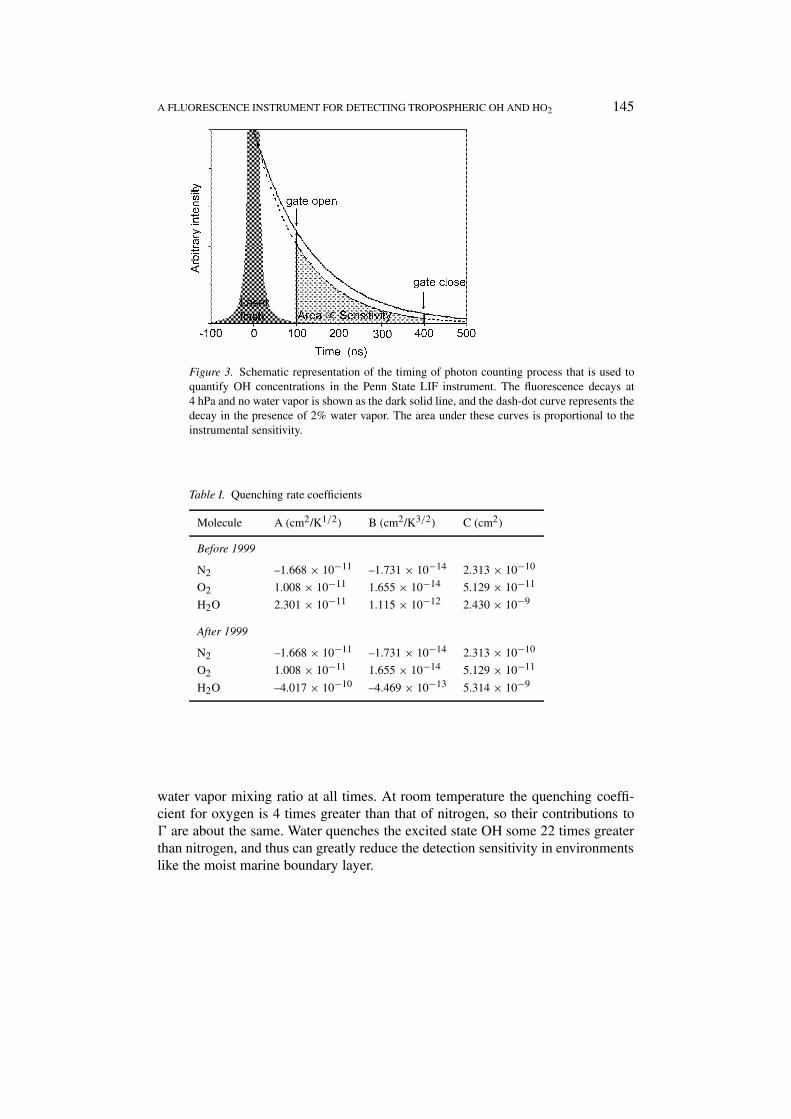
Figure 3 depicts the timing of events as well as the shape of two theoreticalfluorescent decays. The top (solid) curve represents an ideal decay at 4 hPa in-ternal pressure in the absence of water vapor, and the lower curve (dashed-dot)corresponds to the same conditions but with 2% water. The total decay frequency,�, comprises the radiative decay frequency, γnat (1/γnat = 688 ns is the radiative,or natural, lifetime (Bailey et al., 1997)), and the non-radiative decay frequency ofthe excited state by collisional deactivation with nitrogen, oxygen, and water mole-cules, which is described by the rate coefficients, kN2, kO2, and kH2O, respectively.The quenching rate coefficients and their temperature dependence were fitted tothe expression: k = a T 1/2 − b T 3/2 + c. For publications until 1999, values fromCopeland and Crosley (1986) for N2 and O2 and values from Wysong et al. (1990)for H2O were used. After that date we have used values from Bailey et al. (1999)for H2O, as in Table I.
The decay rate is proportional to the fluorescence intensity and is modeled asthe equations:
Intensity = [OH∗]o exp(−�t)
� = γnat + kN2(T )[N2] + kO2(T )[O2] + kH2O(T )[H2O], (1)
where [OH∗]o is the initial population of excited state OH (A2�) established fromthe laser probe, t is time, [ ] denotes the number density of the enclosed chemi-cal species, and the quenching rate coefficients have been written as functions oftemperature, T , since their quenching efficiency increases at lower temperatures.
The instrument sensitivity is proportional to the shaded area in Figure 3, whichis the fraction of the fluorescence that is detected. Therefore, in order to keep trackof the sensitivity, it is necessary to keep track of the pressure, temperature, and the
A FLUORESCENCE INSTRUMENT FOR DETECTING TROPOSPHERIC OH AND HO2 145
Figure 3. Schematic representation of the timing of photon counting process that is used toquantify OH concentrations in the Penn State LIF instrument. The fluorescence decays at4 hPa and no water vapor is shown as the dark solid line, and the dash-dot curve represents thedecay in the presence of 2% water vapor. The area under these curves is proportional to theinstrumental sensitivity.
Table I. Quenching rate coefficients
Molecule A (cm2/K1/2) B (cm2/K3/2) C (cm2)
Before 1999
N2 –1.668 × 10⁻¹¹ –1.731 × 10⁻¹⁴ 2.313 × 10⁻¹⁰
O2 1.008 × 10⁻¹¹ 1.655 × 10⁻¹⁴ 5.129 × 10⁻¹¹
H2O 2.301 × 10⁻¹¹ 1.115 × 10⁻¹² 2.430 × 10⁻⁹
After 1999
N2 –1.668 × 10⁻¹¹ –1.731 × 10⁻¹⁴ 2.313 × 10⁻¹⁰
O2 1.008 × 10⁻¹¹ 1.655 × 10⁻¹⁴ 5.129 × 10⁻¹¹
H2O –4.017 × 10⁻¹⁰ –4.469 × 10⁻¹³ 5.314 × 10⁻⁹
water vapor mixing ratio at all times. At room temperature the quenching coeffi-cient for oxygen is 4 times greater than that of nitrogen, so their contributions to� are about the same. Water quenches the excited state OH some 22 times greaterthan nitrogen, and thus can greatly reduce the detection sensitivity in environmentslike the moist marine boundary layer.
146 IAN C. FALOONA ET AL.
2.2. CHARACTERISTICS UNIQUE TO ATHOS
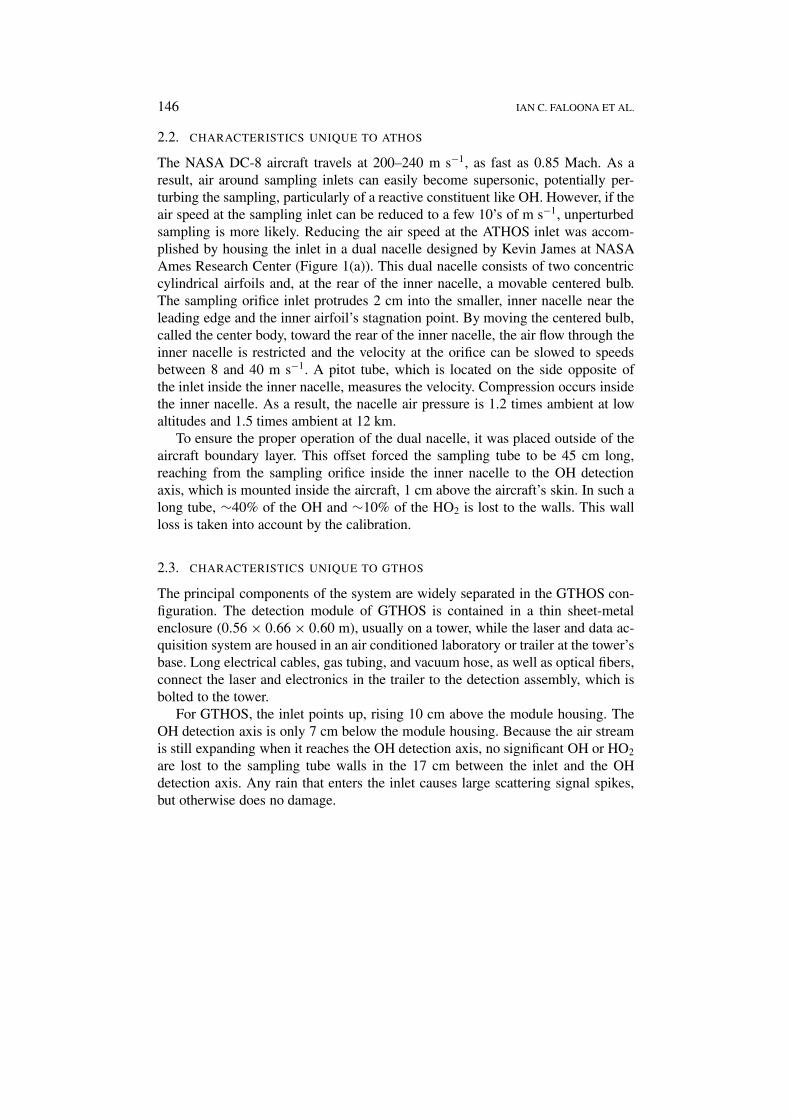
The NASA DC-8 aircraft travels at 200–240 m s−1, as fast as 0.85 Mach. As aresult, air around sampling inlets can easily become supersonic, potentially per-turbing the sampling, particularly of a reactive constituent like OH. However, if theair speed at the sampling inlet can be reduced to a few 10’s of m s−1, unperturbedsampling is more likely. Reducing the air speed at the ATHOS inlet was accom-plished by housing the inlet in a dual nacelle designed by Kevin James at NASAAmes Research Center (Figure 1(a)). This dual nacelle consists of two concentriccylindrical airfoils and, at the rear of the inner nacelle, a movable centered bulb.The sampling orifice inlet protrudes 2 cm into the smaller, inner nacelle near theleading edge and the inner airfoil’s stagnation point. By moving the centered bulb,called the center body, toward the rear of the inner nacelle, the air flow through theinner nacelle is restricted and the velocity at the orifice can be slowed to speedsbetween 8 and 40 m s−1. A pitot tube, which is located on the side opposite ofthe inlet inside the inner nacelle, measures the velocity. Compression occurs insidethe inner nacelle. As a result, the nacelle air pressure is 1.2 times ambient at lowaltitudes and 1.5 times ambient at 12 km.
To ensure the proper operation of the dual nacelle, it was placed outside of theaircraft boundary layer. This offset forced the sampling tube to be 45 cm long,reaching from the sampling orifice inside the inner nacelle to the OH detectionaxis, which is mounted inside the aircraft, 1 cm above the aircraft’s skin. In such along tube, ∼40% of the OH and ∼10% of the HO2 is lost to the walls. This wallloss is taken into account by the calibration.
2.3. CHARACTERISTICS UNIQUE TO GTHOS
The principal components of the system are widely separated in the GTHOS con-figuration. The detection module of GTHOS is contained in a thin sheet-metalenclosure (0.56 × 0.66 × 0.60 m), usually on a tower, while the laser and data ac-quisition system are housed in an air conditioned laboratory or trailer at the tower’sbase. Long electrical cables, gas tubing, and vacuum hose, as well as optical fibers,connect the laser and electronics in the trailer to the detection assembly, which isbolted to the tower.
For GTHOS, the inlet points up, rising 10 cm above the module housing. TheOH detection axis is only 7 cm below the module housing. Because the air streamis still expanding when it reaches the OH detection axis, no significant OH or HO2
are lost to the sampling tube walls in the 17 cm between the inlet and the OHdetection axis. Any rain that enters the inlet causes large scattering signal spikes,but otherwise does no damage.
A FLUORESCENCE INSTRUMENT FOR DETECTING TROPOSPHERIC OH AND HO2 147
3. Calibration Method
3.1. THEORY
The calibration is based on quantitative production of equal parts OH and HO2 bythe vacuum-UV photolysis of water vapor:
H2O + hνλ=184.9 nm−→ OH + H (R1)
H + O2M−→ HO2 . (R2)
The M in the latter reaction represents any molecule of the ambient gas, which actsto remove the excess internal energy of the combined translational energies of thereactants. The quantum yield for OH and H are both unity above 170 nm (Sanderet al., 2003). The water photolysis method has been employed by a number ofresearchers as a radical source (Stevens et al., 1994; Schultz et al., 1995; Tannerand Eisele, 1995; Heal et al., 1995; Hofzumahaus et al., 1996). OH and HO2 areproduced outside the instrument, with quantitative concentrations given by
[OH] = [HO2] = �185σH2O[H2O]ϕ�t , (2)
where �185 is the actinic flux of 185 nm radiation, σH2O is the photolysis crosssection of water vapor at the same wavelength, ϕ is the quantum yield of the pho-tolysis, and �t is the exposure time of the water vapor to the light source. Parityof the OH and HO2 yields is frequently checked in the laboratory in the groundconfiguration, for which OH wall losses are negligible, by adding NO internally toensure that the total HOx signal is twice of OH signal, the latter measured at theOH axis without adding NO.
A calibration factor is obtained from the expression:
C = �S
χOHP. (3)
�S is the difference signal (counts per second, cts s−1) between the online andoffline count rates, χOH is the calculated OH mixing ratio, equal to [OH] fromEquation (2) divided by [M], the ambient number density, and P is the laser powermonitored at the output of the White cell (mW). Thus, C is the sensitivity per mWof laser UV (cts s−1 pptv−1 mW−1), and CP is the total sensitivity. Subsequentmeasurements of χOH are then calculated by simply inverting Equation (3). Mix-ing ratio units (pptv) are used in the sensitivity and resultant radical abundancesbecause the mixing ratio is the quantity that is conserved from outside the inlet tothe low pressures inside the detection cell.
148 IAN C. FALOONA ET AL.
3.2. CALIBRATION PROCEDURE
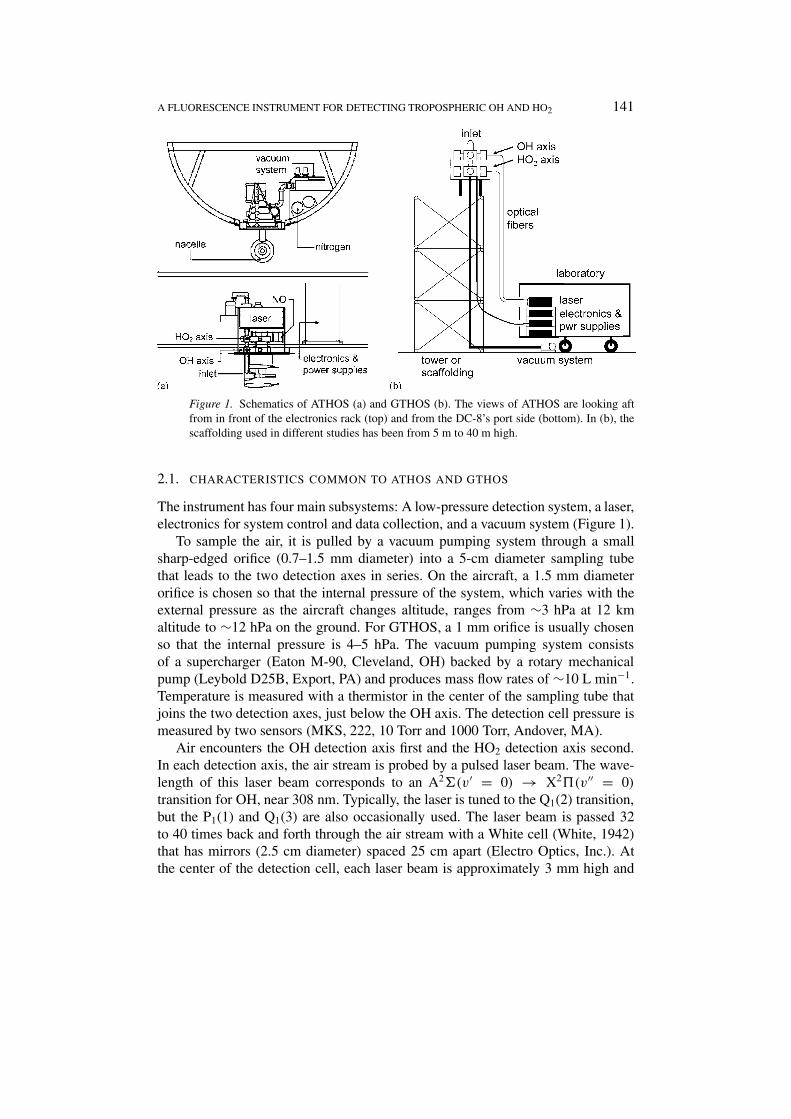
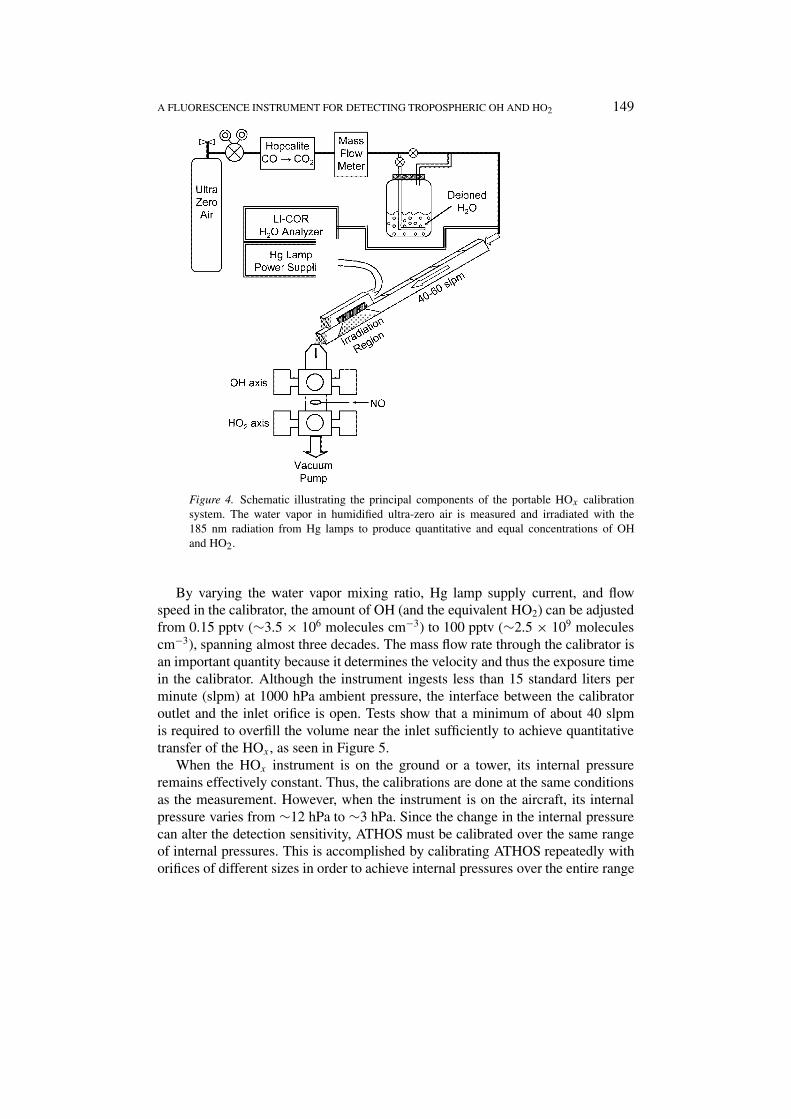
The calibration system was designed to deliver the generated HOx to the inletsystem at transverse velocities on the order of what is experienced in flight, about10 m s−1 (Figure 4). The gas stream begins with ultra-zero air that is run through a500 ml cartridge containing Hopcalite (Callery, Pittsburg, PA) which catalyticallyoxidizes CO to CO2 thereby reducing the rate of conversion of OH to HO2 afterformation by the reaction:
CO + OHO2−→ CO2 + HO2 . (R3)
The flow rate is measured by a mass flow meter (MKS) and then a variable stream isdiverted to a water bubbler to humidify the air. After mixing through several metersof tubing, a small portion of the flow (<1 slpm) is conducted to a differential, non-dispersive IR water analyzer (LI-COR, model 6262, Lincoln, NE) where 2.59 µmIR absorption is used to quantify the water vapor concentration with an accuracyof ±2%. This water analyzer is routinely compared to a dew point hygrometer(General Eastern, 1311DR, Plainville, Connecticut). The bulk of the calibration airis sent into what is called the wand, a 1.27 × 1.27 × 30 cm square aluminum tubethat is manufactured with three 3.8 cm long Suprasil™ windows separated by equaldistances.
The speed of the air flow through the tube is greater than 4.75 m s−1, leadingto Reynolds numbers of at least 4000. Because the calibrator is rectangular andportions of the interior are painted with coarse black paint, the flow is turbulent,and thus has a flat velocity profile. Measurements of the flow profile made with apitot tube indicate that the velocity does not change more than 13% across the bulkof the cross sectional area, and the integrated flow rate agrees with that calculatedfrom the mass flow measurement to within 6%.
The main concern about a turbulent flow is the higher efficiency with which thetransport of the radicals to the walls takes place. By situating the Hg lamp moduleat each of the three windows in the calibrator consecutively, a measure of the wallloss within the calibrator can be extrapolated to the inlet of the instrument. Resultsof these types of tests indicate that the loss of OH to the walls of the calibratorduring the 4–6 ms transit to the inlet, when the lamp module is in the full forwardwindow, is less than 5%.
The Hg lamp module consists of one or two low pressure Hg lamps (Oriel,Stratford, CT) that are housed in an aluminum cartridge that can be mounted overone of the Suprasil™ windows on the wand. A two-lamp version was used until1999; a one-lamp version is used now. The housing is continually purged withdry N2. In both versions, thin-walled tubes (3 mm diam., 10 mm long) are packedtogether in front of the lamp to create an approximate plane parallel UV field. Thetubes are painted with a black, low-fluorescent paint (IIT, Chicago, IL) to absorball light except the light that passes directly down the tubes. These tubes partiallycollimate the 185 nm light, providing a more uniform actinic flux distribution inthe photolysis region.
A FLUORESCENCE INSTRUMENT FOR DETECTING TROPOSPHERIC OH AND HO2 149
Figure 4. Schematic illustrating the principal components of the portable HOx calibrationsystem. The water vapor in humidified ultra-zero air is measured and irradiated with the185 nm radiation from Hg lamps to produce quantitative and equal concentrations of OHand HO2.
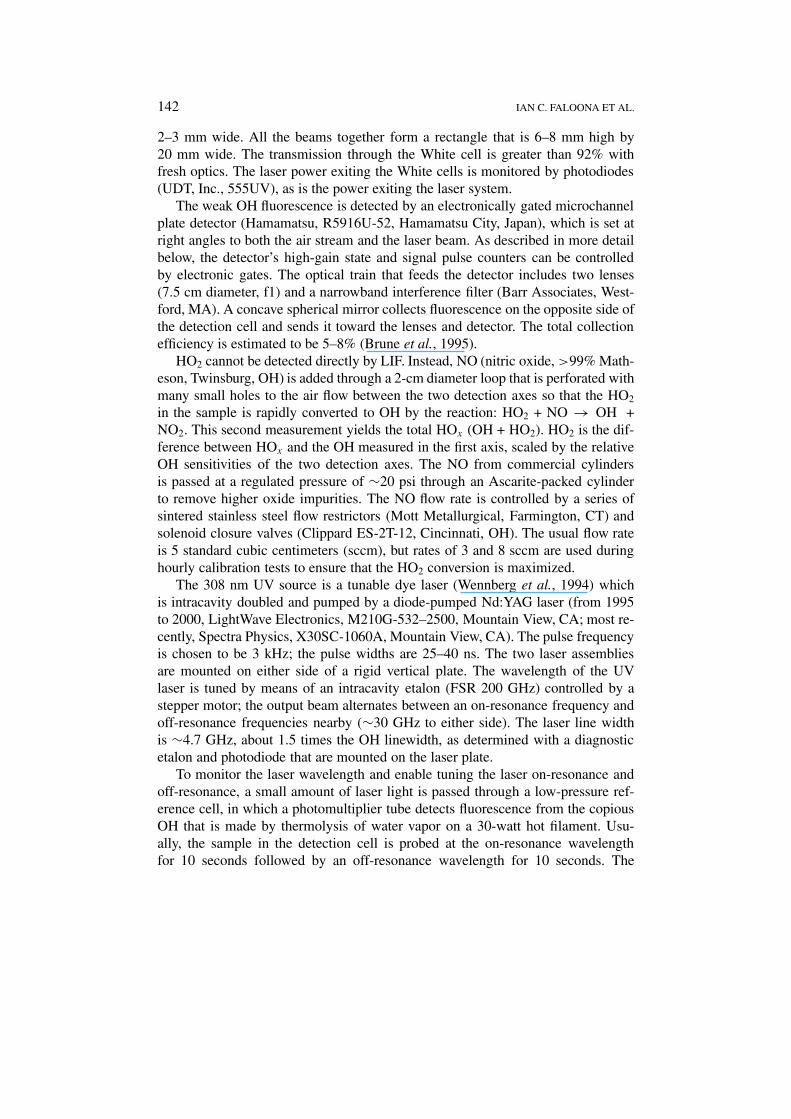
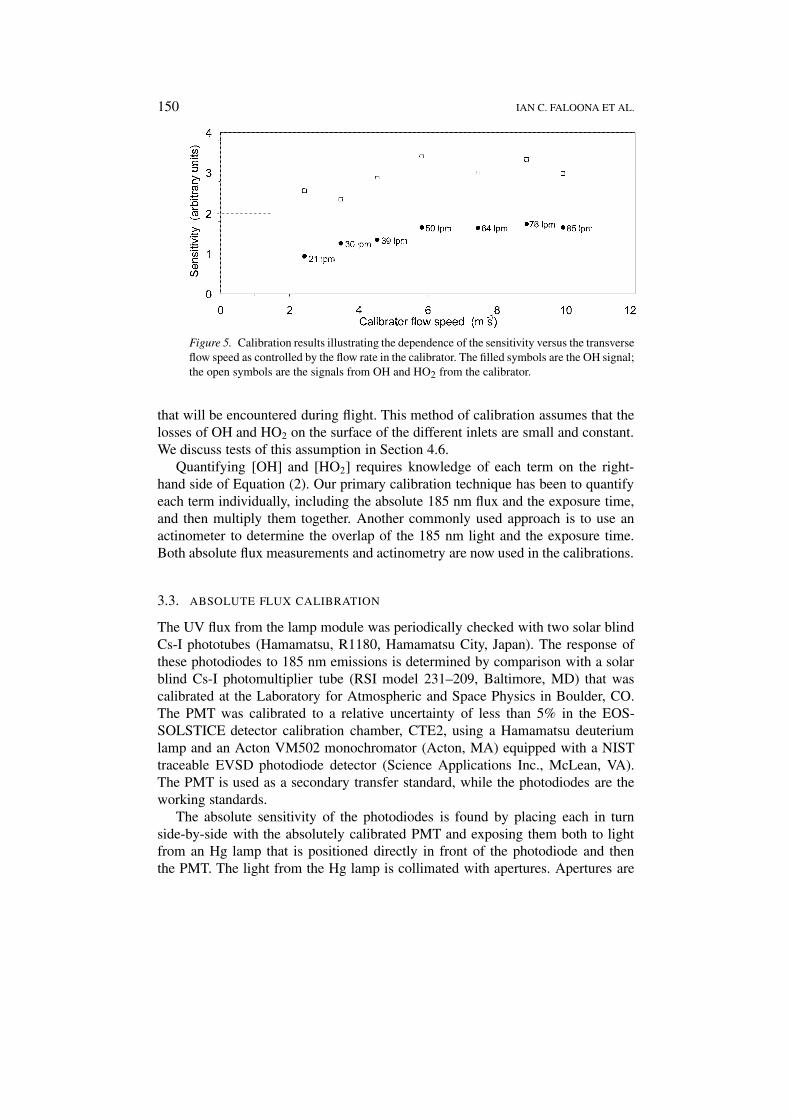
By varying the water vapor mixing ratio, Hg lamp supply current, and flowspeed in the calibrator, the amount of OH (and the equivalent HO2) can be adjustedfrom 0.15 pptv (∼3.5 × 10⁶ molecules cm−3) to 100 pptv (∼2.5 × 10⁹ moleculescm−3), spanning almost three decades. The mass flow rate through the calibrator isan important quantity because it determines the velocity and thus the exposure timein the calibrator. Although the instrument ingests less than 15 standard liters perminute (slpm) at 1000 hPa ambient pressure, the interface between the calibratoroutlet and the inlet orifice is open. Tests show that a minimum of about 40 slpmis required to overfill the volume near the inlet sufficiently to achieve quantitativetransfer of the HOx, as seen in Figure 5.
When the HOx instrument is on the ground or a tower, its internal pressureremains effectively constant. Thus, the calibrations are done at the same conditionsas the measurement. However, when the instrument is on the aircraft, its internalpressure varies from ∼12 hPa to ∼3 hPa. Since the change in the internal pressurecan alter the detection sensitivity, ATHOS must be calibrated over the same rangeof internal pressures. This is accomplished by calibrating ATHOS repeatedly withorifices of different sizes in order to achieve internal pressures over the entire range
150 IAN C. FALOONA ET AL.
Figure 5. Calibration results illustrating the dependence of the sensitivity versus the transverseflow speed as controlled by the flow rate in the calibrator. The filled symbols are the OH signal;the open symbols are the signals from OH and HO2 from the calibrator.
that will be encountered during flight. This method of calibration assumes that thelosses of OH and HO2 on the surface of the different inlets are small and constant.We discuss tests of this assumption in Section 4.6.
Quantifying [OH] and [HO2] requires knowledge of each term on the right-hand side of Equation (2). Our primary calibration technique has been to quantifyeach term individually, including the absolute 185 nm flux and the exposure time,and then multiply them together. Another commonly used approach is to use anactinometer to determine the overlap of the 185 nm light and the exposure time.Both absolute flux measurements and actinometry are now used in the calibrations.
3.3. ABSOLUTE FLUX CALIBRATION
The UV flux from the lamp module was periodically checked with two solar blindCs-I phototubes (Hamamatsu, R1180, Hamamatsu City, Japan). The response ofthese photodiodes to 185 nm emissions is determined by comparison with a solarblind Cs-I photomultiplier tube (RSI model 231–209, Baltimore, MD) that wascalibrated at the Laboratory for Atmospheric and Space Physics in Boulder, CO.The PMT was calibrated to a relative uncertainty of less than 5% in the EOS-SOLSTICE detector calibration chamber, CTE2, using a Hamamatsu deuteriumlamp and an Acton VM502 monochromator (Acton, MA) equipped with a NISTtraceable EVSD photodiode detector (Science Applications Inc., McLean, VA).The PMT is used as a secondary transfer standard, while the photodiodes are theworking standards.
The absolute sensitivity of the photodiodes is found by placing each in turnside-by-side with the absolutely calibrated PMT and exposing them both to lightfrom an Hg lamp that is positioned directly in front of the photodiode and thenthe PMT. The light from the Hg lamp is collimated with apertures. Apertures are
A FLUORESCENCE INSTRUMENT FOR DETECTING TROPOSPHERIC OH AND HO2 151
also placed in front of the photodiode and PMT. Because the PMT is much moresensitive than the photodiodes, neutral density filters with an optical density of∼3 are also placed in front of the PMT. To ensure that the photodiode calibrationis robust, many factors are varied, including the distance between the lamp andthe photodiode and PMT, the lamp current, and the aperture sizes. Calibrationsperformed in laboratory air and in nitrogen inside a Teflon enclosure produce thesame results.
A second part of this procedure is the mapping of the 185 nm flux from thelamp module that is used in the calibration. The lamp module is bolted to anoptical table. The photodiode with a small aperture is fixed to a mount that can betranslated over 3 axes. The flux mapping is done at three distances from the lamp,corresponding to the front, middle, and back of the 0.5′′ calibration tube; typicallymore than 70 measurements are taken to map each plane. These measurementsare then combined to give the actinic flux in the photolysis zone of the calibrationtube. These two procedures are now done before the calibrations that preceded andfollow each field study.
The greatest uncertainty with this technique is determining the actinic fluxexposure from the overlap of the mapped actinic flux and the exposure time ofwater vapor to that actinic flux. However, the collimating tubes and lamp positionproduces an actinic flux field that is uniform to better than 20% until near theedges of the actinic flux field, where it falls off. A second concern is that the fluxmapping on the optical bench does not give a good representation of the actinic fluxwithin the calibrator. However, tests have shown that the 185 nm light is effectivelyabsorbed by the black paint that is on the inside of the calibrator at each of thethree optical axes along the wand’s length. Thus, we believe that this calibrationtechnique produces accurately known OH and HO2 concentrations.
3.4. ACTINOMETRIC CALIBRATIONS WITH O3 AND N2O
Actinometric techniques measure directly the exposure of an air sample to UV lightand thus account directly for the overlap between the UV flux and the exposuretime of the air to that UV flux. All that is required is a gas that is photolyzedby 185 nm light, knowledge of the absorption cross section, and an instrumentthat accurately measures a photolysis product. While the absolute measurementof the actinic flux and these two actiniometric methods each have their strengthsand weaknesses, the agreement between these commonly used methods would giveconfidence in the absolute Hg actinic flux values.
In ozone actinometry, the Hg line at 185 nm photolyzes O2 to make two Oatoms, which immediately react with O2 to form O3 (Holland et al., 1998; Creaseyet al., 2000). The ozone is sampled from air that is passed through our calibratorwith an NOx analyzer (TEI, 42C, Franklin, MA) that is reconfigured so that excessreagent NO is added instead of regent O3. The NOx analyzer was calibrated athigher O3 levels before the measurements with an O3 analyzer (TEI, 49C, Franklin,
152 IAN C. FALOONA ET AL.
MA), which itself had been calibrated against a primary standard O3 calibrator(TEI, 49C-PS, Franklin, MA). Because the effective absorption cross section de-pends strongly on the Hg 185 nm line shape (Lanzendorf et al., 1997), the effectiveO2 cross section is measured by varying the O2 mixing ratio in an absorption tubeprior to the calibration. This cross section is typically 1.1 × 10⁻²⁰ cm2. A seconddifficulty with this technique is that the amount of ozone produced in the calibratoris 1–2 ppbv, which is not substantially larger than the increased uncertainty in thezero value of the NOx analyzer that is reconfigured to detect O3, which is not itsnormal use.
In N2O actinometry, the Hg line at 185 nm photolyzes N2O to make N2 andO(1D), with a quantum yield of 1.0 (Sander et al., 2003). The O(1D) reacts rapidlywith N2O to form 2 NO molecules (Edwards et al., 2003). The resulting NO is thendetected with an NOx analyzer (TEI, 42C). When the N2O mixing ratio is 0.20, theamount of NO that is produced is 1.6 ppbv. This amount of NO is well above thedetection limit for the NOx analyzer used in its normal configuration of detectingNO. The NOx analyzer is calibrated just before the calibration with an NO mixturethat is certified by Matheson Tri-Gas. Because the N2O absorption cross sectionis 1.43 × 10⁻¹⁹ cm2, the 185 nm light is partially absorbed across the 1.27-cmcalibrator tube. A correction for this absorption is applied as described by Edwardset al. (2003).
4. Sensitivity Dependence on Controlling Variables
4.1. THEORETICAL SENSITIVITY DEPENDENCES
The instrument sensitivity is greatly affected by the change in the instrument inter-nal pressure, the water vapor concentration, and the laser power. Internal pressureand water vapor concentration influence the calibration through the three compo-nents: the internal number density of OH, [OH]int, which increases linearly withinternal pressure at a constant temperature for a constant OH mixing ratio; thecollisional quenching effects manifest in Equation (1), Q; and the OH transmission,�, which is the fraction of OH that survives loss on the sampling tube’s walls andis detected at the detection axis. If we assume these effects are separable then thetotal sensitivity can be described by the product of three functions of the internalpressure, Pint,
C(Pint) = D1(P)�Q[OH]int . (4)
Here D1(P) is a lumped constant of all pressure-independent parameters, includinglaser power, which is determined from the calibration.
Pitot tube flow measurements made within the low-pressure inlet tube haveestablished that the air entering the pinhole does not significantly contact the inlettube’s walls until ∼20 cm downstream of the pinhole. Under steady-state condi-tions, the loss to the walls, represented by a reaction coefficient, kw, is sustainedby the radial molecular flux. According to Fickian principles, this flux is directly
A FLUORESCENCE INSTRUMENT FOR DETECTING TROPOSPHERIC OH AND HO2 153
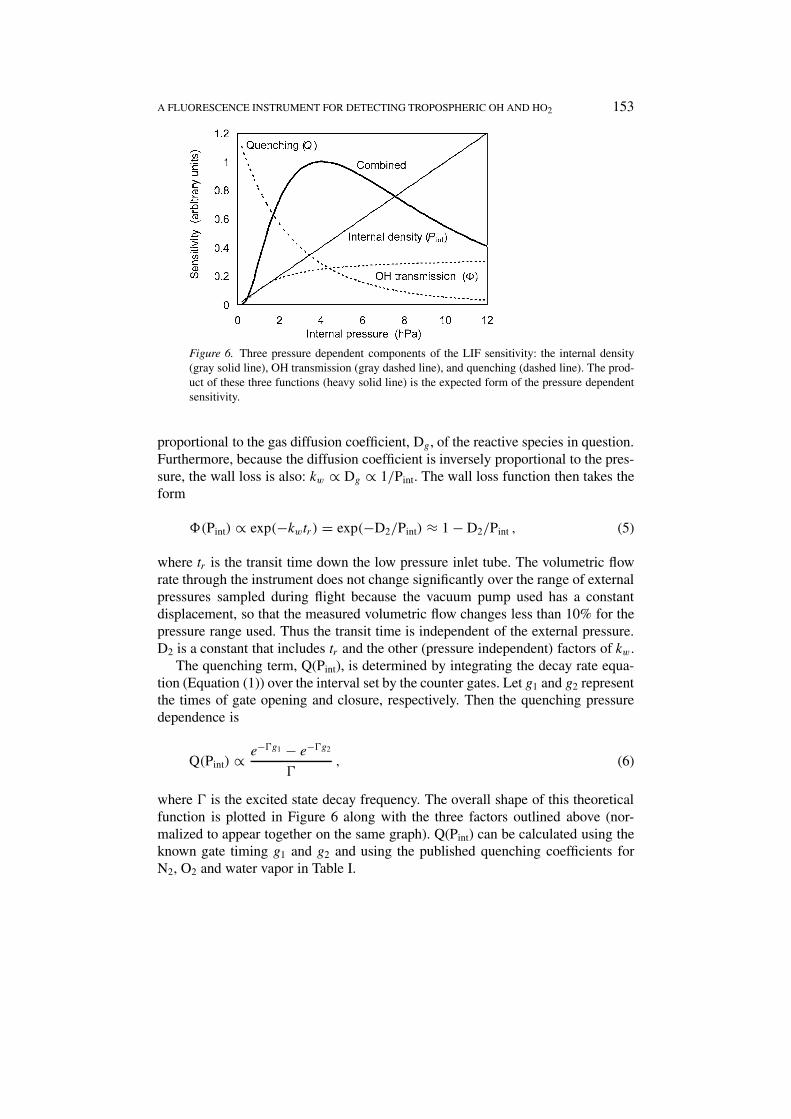
Figure 6. Three pressure dependent components of the LIF sensitivity: the internal density(gray solid line), OH transmission (gray dashed line), and quenching (dashed line). The prod-uct of these three functions (heavy solid line) is the expected form of the pressure dependentsensitivity.
proportional to the gas diffusion coefficient, Dg, of the reactive species in question.Furthermore, because the diffusion coefficient is inversely proportional to the pres-sure, the wall loss is also: kw ∝ Dg ∝ 1/Pint. The wall loss function then takes theform
�(Pint) ∝ exp(−kwtr) = exp(−D2/Pint) ≈ 1 − D2/Pint , (5)
where tr is the transit time down the low pressure inlet tube. The volumetric flowrate through the instrument does not change significantly over the range of externalpressures sampled during flight because the vacuum pump used has a constantdisplacement, so that the measured volumetric flow changes less than 10% for thepressure range used. Thus the transit time is independent of the external pressure.D2 is a constant that includes tr and the other (pressure independent) factors of kw.
The quenching term, Q(Pint), is determined by integrating the decay rate equa-tion (Equation (1)) over the interval set by the counter gates. Let g1 and g2 representthe times of gate opening and closure, respectively. Then the quenching pressuredependence is
Q(Pint) ∝ e−�g1 − e−�g2
�, (6)
where � is the excited state decay frequency. The overall shape of this theoreticalfunction is plotted in Figure 6 along with the three factors outlined above (nor-malized to appear together on the same graph). Q(Pint) can be calculated using theknown gate timing g1 and g2 and using the published quenching coefficients forN2, O2 and water vapor in Table I.
154 IAN C. FALOONA ET AL.
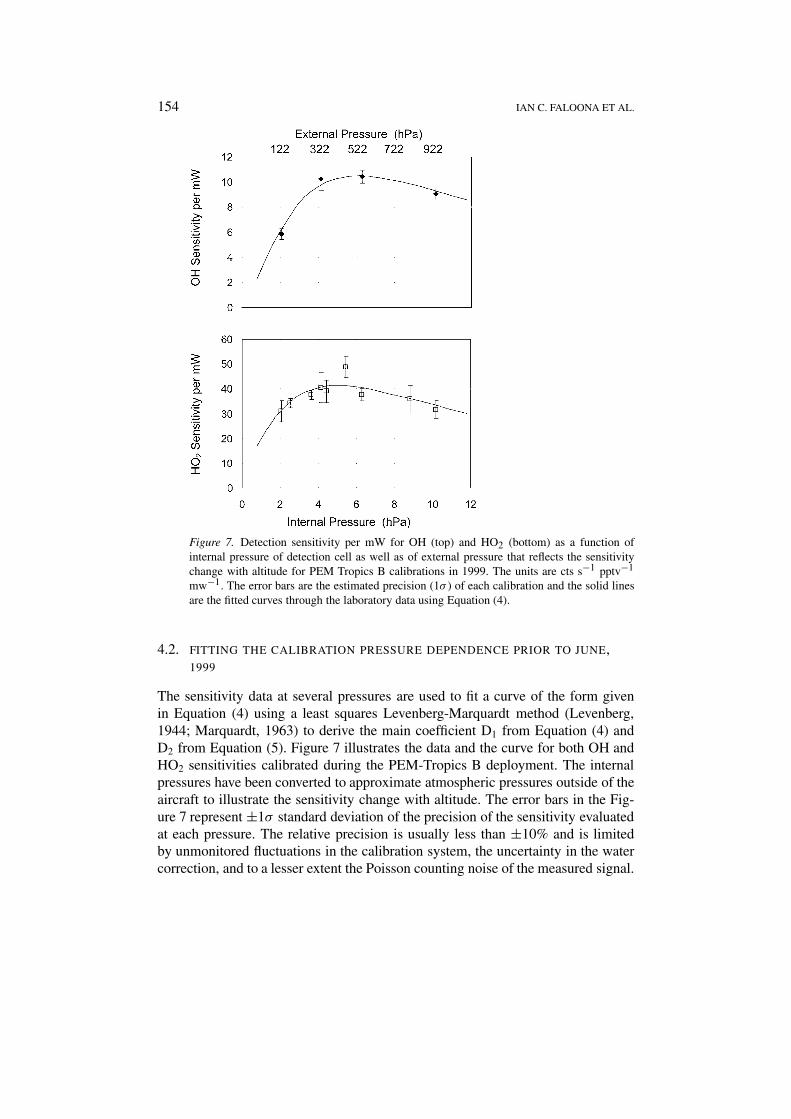
Figure 7. Detection sensitivity per mW for OH (top) and HO2 (bottom) as a function ofinternal pressure of detection cell as well as of external pressure that reflects the sensitivitychange with altitude for PEM Tropics B calibrations in 1999. The units are cts s−1 pptv−1
mw−1. The error bars are the estimated precision (1σ ) of each calibration and the solid linesare the fitted curves through the laboratory data using Equation (4).
4.2. FITTING THE CALIBRATION PRESSURE DEPENDENCE PRIOR TO JUNE,1999
The sensitivity data at several pressures are used to fit a curve of the form givenin Equation (4) using a least squares Levenberg-Marquardt method (Levenberg,1944; Marquardt, 1963) to derive the main coefficient D1 from Equation (4) andD2 from Equation (5). Figure 7 illustrates the data and the curve for both OH andHO2 sensitivities calibrated during the PEM-Tropics B deployment. The internalpressures have been converted to approximate atmospheric pressures outside of theaircraft to illustrate the sensitivity change with altitude. The error bars in the Fig-ure 7 represent ±1σ standard deviation of the precision of the sensitivity evaluatedat each pressure. The relative precision is usually less than ±10% and is limitedby unmonitored fluctuations in the calibration system, the uncertainty in the watercorrection, and to a lesser extent the Poisson counting noise of the measured signal.
A FLUORESCENCE INSTRUMENT FOR DETECTING TROPOSPHERIC OH AND HO2 155
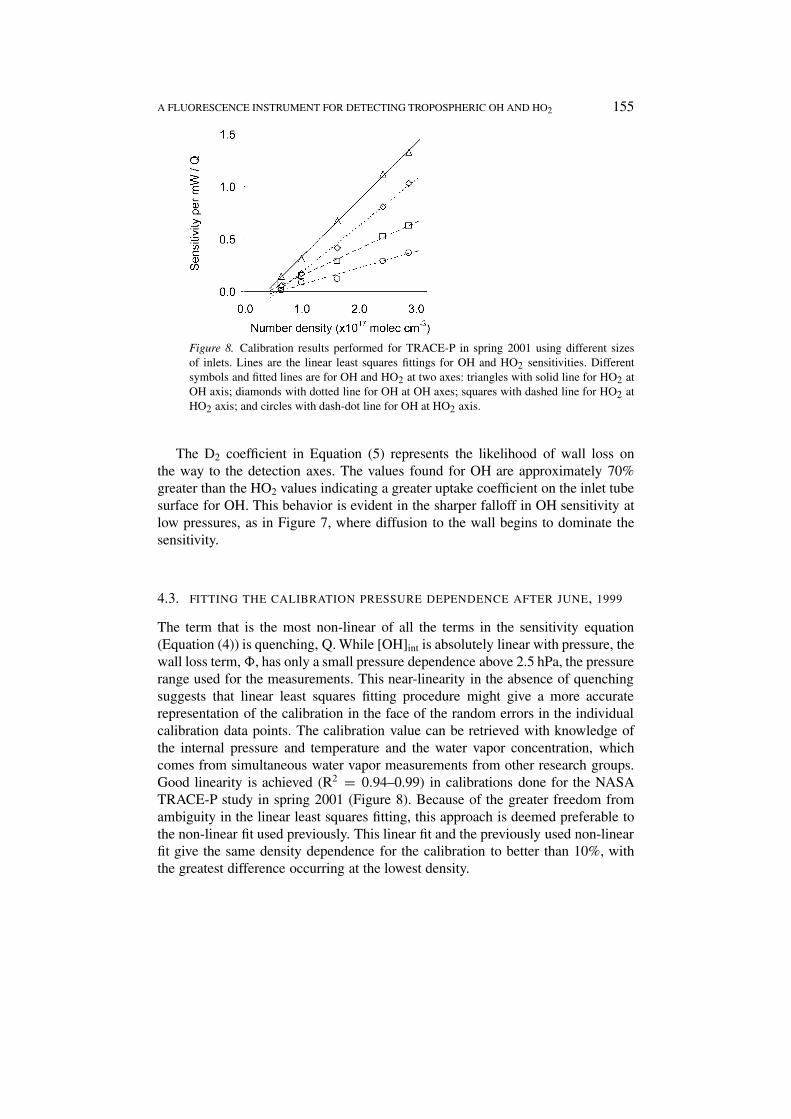
Figure 8. Calibration results performed for TRACE-P in spring 2001 using different sizesof inlets. Lines are the linear least squares fittings for OH and HO2 sensitivities. Differentsymbols and fitted lines are for OH and HO2 at two axes: triangles with solid line for HO2 atOH axis; diamonds with dotted line for OH at OH axes; squares with dashed line for HO2 atHO2 axis; and circles with dash-dot line for OH at HO2 axis.
The D2 coefficient in Equation (5) represents the likelihood of wall loss onthe way to the detection axes. The values found for OH are approximately 70%greater than the HO2 values indicating a greater uptake coefficient on the inlet tubesurface for OH. This behavior is evident in the sharper falloff in OH sensitivity atlow pressures, as in Figure 7, where diffusion to the wall begins to dominate thesensitivity.
4.3. FITTING THE CALIBRATION PRESSURE DEPENDENCE AFTER JUNE, 1999
The term that is the most non-linear of all the terms in the sensitivity equation(Equation (4)) is quenching, Q. While [OH]int is absolutely linear with pressure, thewall loss term, �, has only a small pressure dependence above 2.5 hPa, the pressurerange used for the measurements. This near-linearity in the absence of quenchingsuggests that linear least squares fitting procedure might give a more accuraterepresentation of the calibration in the face of the random errors in the individualcalibration data points. The calibration value can be retrieved with knowledge ofthe internal pressure and temperature and the water vapor concentration, whichcomes from simultaneous water vapor measurements from other research groups.Good linearity is achieved (R2 = 0.94–0.99) in calibrations done for the NASATRACE-P study in spring 2001 (Figure 8). Because of the greater freedom fromambiguity in the linear least squares fitting, this approach is deemed preferable tothe non-linear fit used previously. This linear fit and the previously used non-linearfit give the same density dependence for the calibration to better than 10%, withthe greatest difference occurring at the lowest density.
156 IAN C. FALOONA ET AL.
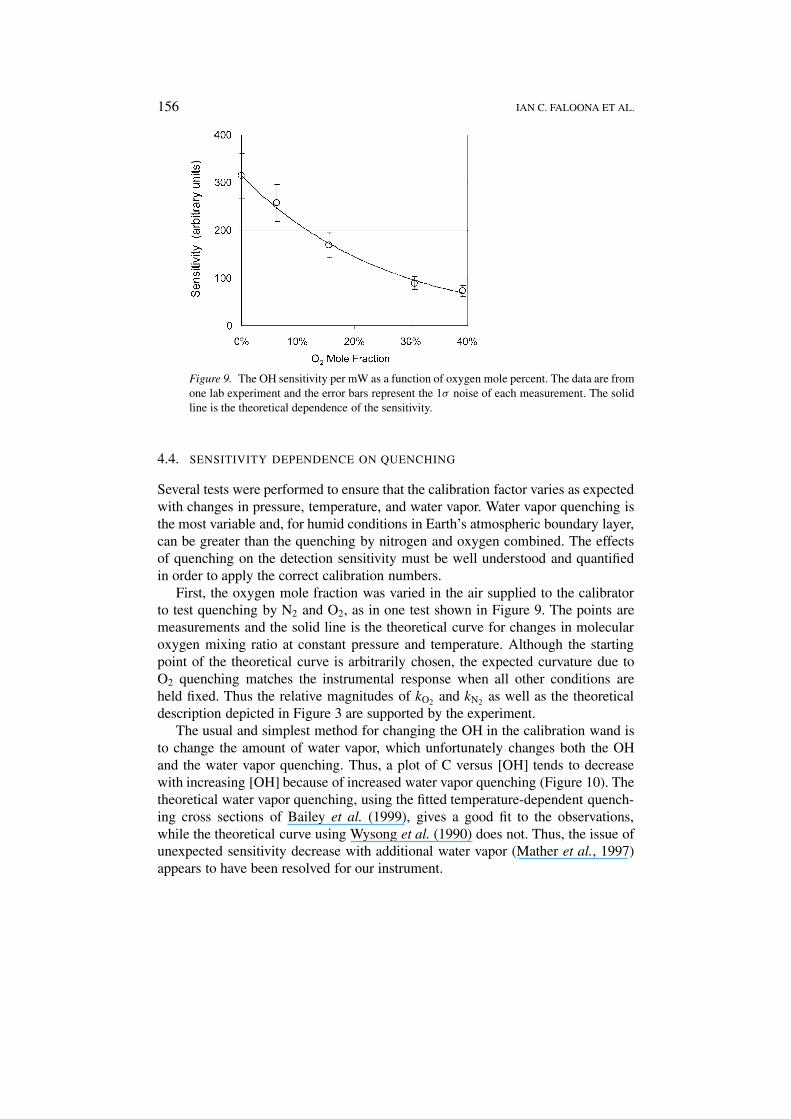
Figure 9. The OH sensitivity per mW as a function of oxygen mole percent. The data are fromone lab experiment and the error bars represent the 1σ noise of each measurement. The solidline is the theoretical dependence of the sensitivity.
4.4. SENSITIVITY DEPENDENCE ON QUENCHING
Several tests were performed to ensure that the calibration factor varies as expectedwith changes in pressure, temperature, and water vapor. Water vapor quenching isthe most variable and, for humid conditions in Earth’s atmospheric boundary layer,can be greater than the quenching by nitrogen and oxygen combined. The effectsof quenching on the detection sensitivity must be well understood and quantifiedin order to apply the correct calibration numbers.
First, the oxygen mole fraction was varied in the air supplied to the calibratorto test quenching by N2 and O2, as in one test shown in Figure 9. The points aremeasurements and the solid line is the theoretical curve for changes in molecularoxygen mixing ratio at constant pressure and temperature. Although the startingpoint of the theoretical curve is arbitrarily chosen, the expected curvature due toO2 quenching matches the instrumental response when all other conditions areheld fixed. Thus the relative magnitudes of kO2 and kN2 as well as the theoreticaldescription depicted in Figure 3 are supported by the experiment.
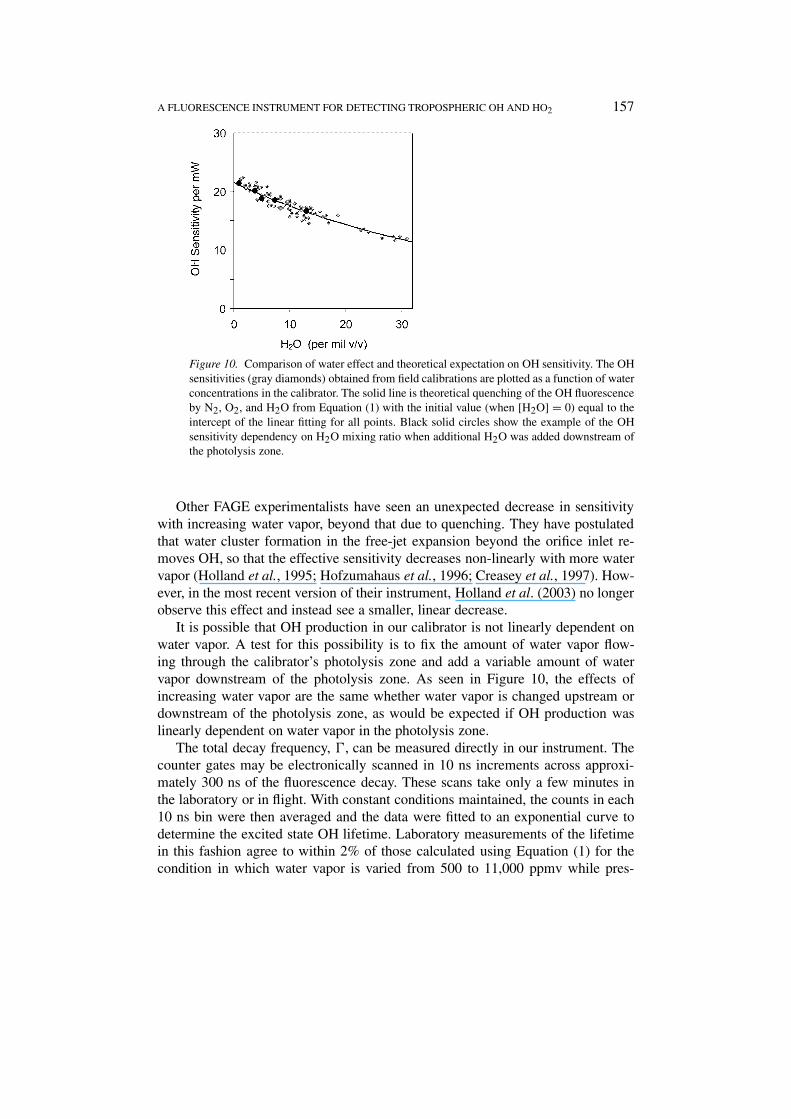
The usual and simplest method for changing the OH in the calibration wand isto change the amount of water vapor, which unfortunately changes both the OHand the water vapor quenching. Thus, a plot of C versus [OH] tends to decreasewith increasing [OH] because of increased water vapor quenching (Figure 10). Thetheoretical water vapor quenching, using the fitted temperature-dependent quench-ing cross sections of Bailey et al. (1999), gives a good fit to the observations,while the theoretical curve using Wysong et al. (1990) does not. Thus, the issue ofunexpected sensitivity decrease with additional water vapor (Mather et al., 1997)appears to have been resolved for our instrument.
A FLUORESCENCE INSTRUMENT FOR DETECTING TROPOSPHERIC OH AND HO2 157
Figure 10. Comparison of water effect and theoretical expectation on OH sensitivity. The OHsensitivities (gray diamonds) obtained from field calibrations are plotted as a function of waterconcentrations in the calibrator. The solid line is theoretical quenching of the OH fluorescenceby N2, O2, and H2O from Equation (1) with the initial value (when [H2O] = 0) equal to theintercept of the linear fitting for all points. Black solid circles show the example of the OHsensitivity dependency on H2O mixing ratio when additional H2O was added downstream ofthe photolysis zone.
Other FAGE experimentalists have seen an unexpected decrease in sensitivitywith increasing water vapor, beyond that due to quenching. They have postulatedthat water cluster formation in the free-jet expansion beyond the orifice inlet re-moves OH, so that the effective sensitivity decreases non-linearly with more watervapor (Holland et al., 1995; Hofzumahaus et al., 1996; Creasey et al., 1997). How-ever, in the most recent version of their instrument, Holland et al. (2003) no longerobserve this effect and instead see a smaller, linear decrease.
It is possible that OH production in our calibrator is not linearly dependent onwater vapor. A test for this possibility is to fix the amount of water vapor flow-ing through the calibrator’s photolysis zone and add a variable amount of watervapor downstream of the photolysis zone. As seen in Figure 10, the effects ofincreasing water vapor are the same whether water vapor is changed upstream ordownstream of the photolysis zone, as would be expected if OH production waslinearly dependent on water vapor in the photolysis zone.
The total decay frequency, �, can be measured directly in our instrument. Thecounter gates may be electronically scanned in 10 ns increments across approxi-mately 300 ns of the fluorescence decay. These scans take only a few minutes inthe laboratory or in flight. With constant conditions maintained, the counts in each10 ns bin were then averaged and the data were fitted to an exponential curve todetermine the excited state OH lifetime. Laboratory measurements of the lifetimein this fashion agree to within 2% of those calculated using Equation (1) for thecondition in which water vapor is varied from 500 to 11,000 ppmv while pres-
158 IAN C. FALOONA ET AL.
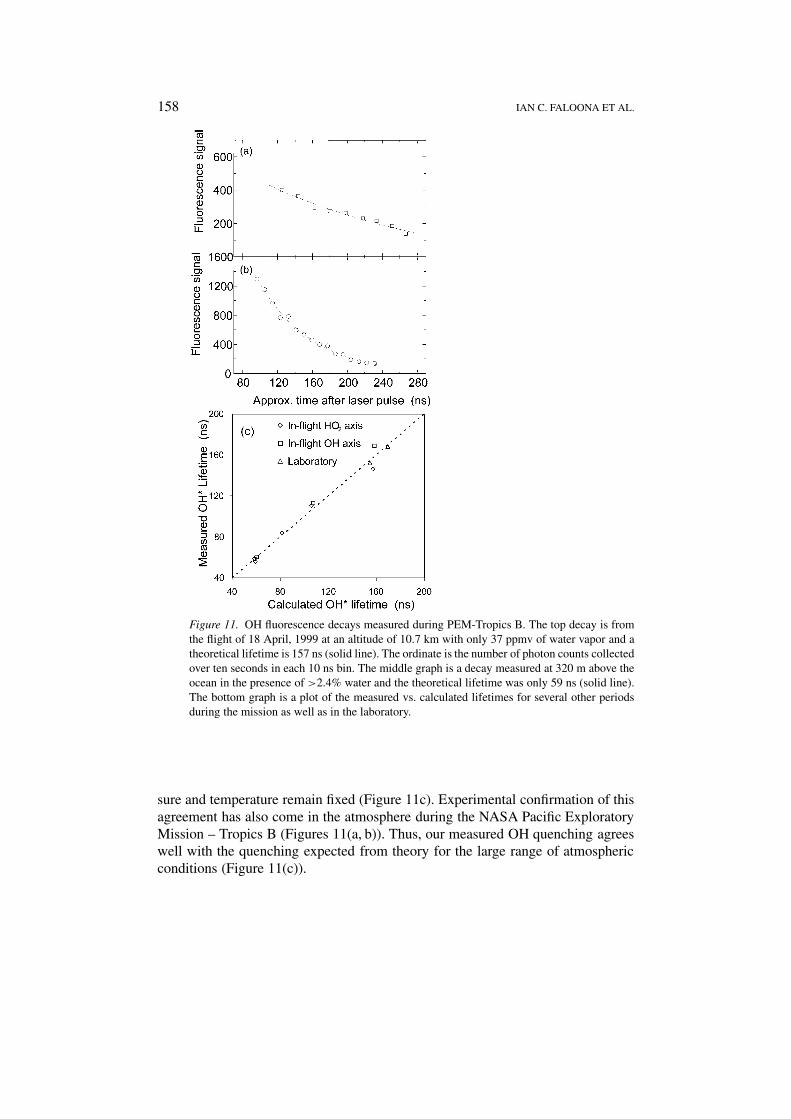
Figure 11. OH fluorescence decays measured during PEM-Tropics B. The top decay is fromthe flight of 18 April, 1999 at an altitude of 10.7 km with only 37 ppmv of water vapor and atheoretical lifetime is 157 ns (solid line). The ordinate is the number of photon counts collectedover ten seconds in each 10 ns bin. The middle graph is a decay measured at 320 m above theocean in the presence of >2.4% water and the theoretical lifetime was only 59 ns (solid line).The bottom graph is a plot of the measured vs. calculated lifetimes for several other periodsduring the mission as well as in the laboratory.
sure and temperature remain fixed (Figure 11c). Experimental confirmation of thisagreement has also come in the atmosphere during the NASA Pacific ExploratoryMission – Tropics B (Figures 11(a, b)). Thus, our measured OH quenching agreeswell with the quenching expected from theory for the large range of atmosphericconditions (Figure 11(c)).
A FLUORESCENCE INSTRUMENT FOR DETECTING TROPOSPHERIC OH AND HO2 159
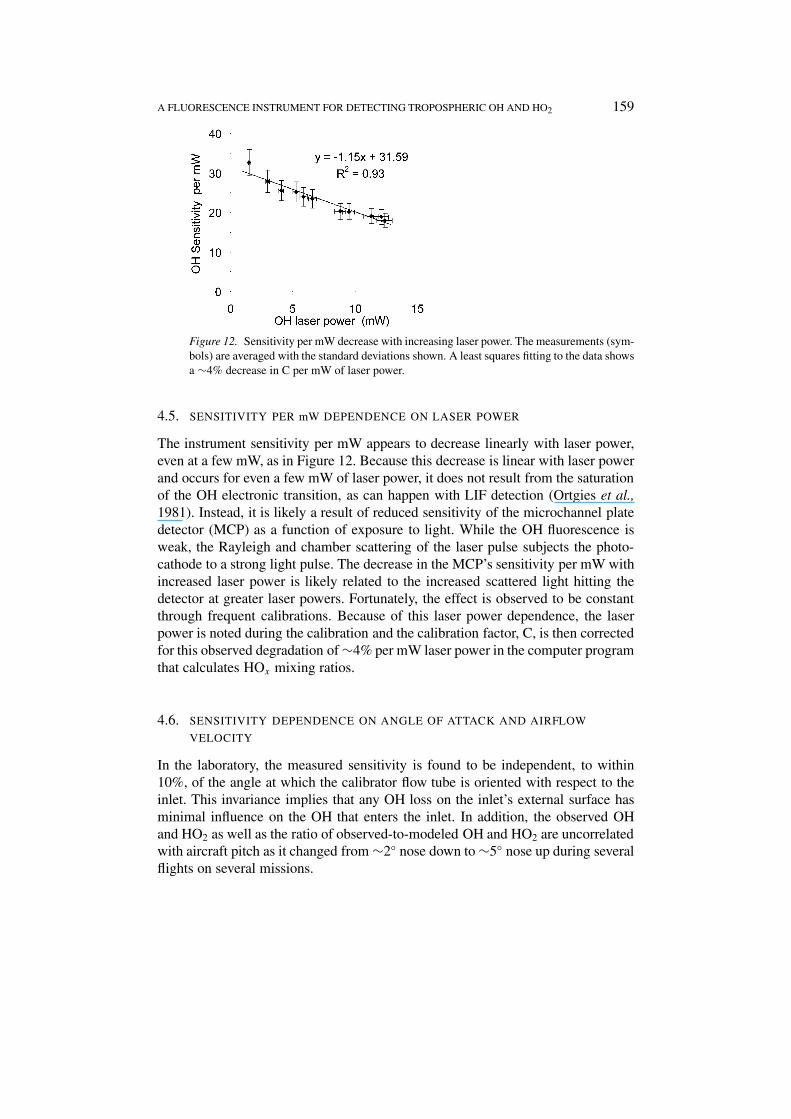
Figure 12. Sensitivity per mW decrease with increasing laser power. The measurements (sym-bols) are averaged with the standard deviations shown. A least squares fitting to the data showsa ∼4% decrease in C per mW of laser power.
4.5. SENSITIVITY PER mW DEPENDENCE ON LASER POWER
The instrument sensitivity per mW appears to decrease linearly with laser power,even at a few mW, as in Figure 12. Because this decrease is linear with laser powerand occurs for even a few mW of laser power, it does not result from the saturationof the OH electronic transition, as can happen with LIF detection (Ortgies et al.,1981). Instead, it is likely a result of reduced sensitivity of the microchannel platedetector (MCP) as a function of exposure to light. While the OH fluorescence isweak, the Rayleigh and chamber scattering of the laser pulse subjects the photo-cathode to a strong light pulse. The decrease in the MCP’s sensitivity per mW withincreased laser power is likely related to the increased scattered light hitting thedetector at greater laser powers. Fortunately, the effect is observed to be constantthrough frequent calibrations. Because of this laser power dependence, the laserpower is noted during the calibration and the calibration factor, C, is then correctedfor this observed degradation of ∼4% per mW laser power in the computer programthat calculates HOx mixing ratios.
4.6. SENSITIVITY DEPENDENCE ON ANGLE OF ATTACK AND AIRFLOW
VELOCITY
In the laboratory, the measured sensitivity is found to be independent, to within10%, of the angle at which the calibrator flow tube is oriented with respect to theinlet. This invariance implies that any OH loss on the inlet’s external surface hasminimal influence on the OH that enters the inlet. In addition, the observed OHand HO2 as well as the ratio of observed-to-modeled OH and HO2 are uncorrelatedwith aircraft pitch as it changed from ∼2◦ nose down to ∼5◦ nose up during severalflights on several missions.
160 IAN C. FALOONA ET AL.
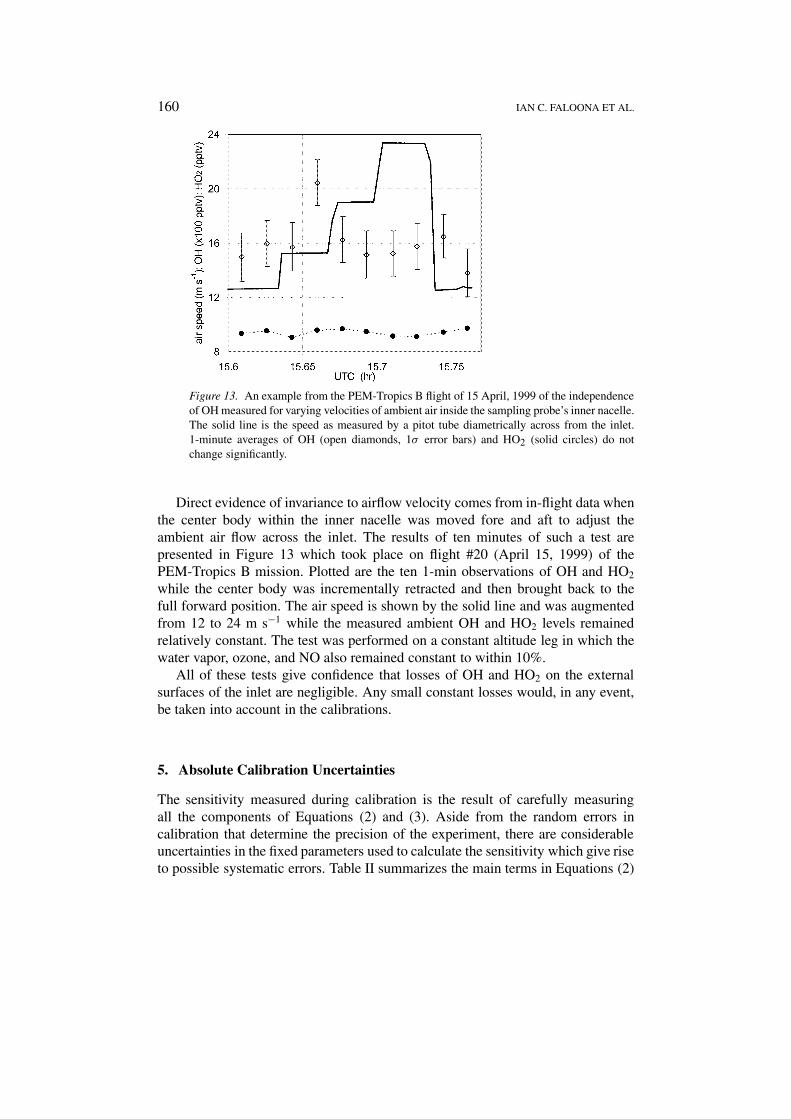
Figure 13. An example from the PEM-Tropics B flight of 15 April, 1999 of the independenceof OH measured for varying velocities of ambient air inside the sampling probe’s inner nacelle.The solid line is the speed as measured by a pitot tube diametrically across from the inlet.1-minute averages of OH (open diamonds, 1σ error bars) and HO2 (solid circles) do notchange significantly.
Direct evidence of invariance to airflow velocity comes from in-flight data whenthe center body within the inner nacelle was moved fore and aft to adjust theambient air flow across the inlet. The results of ten minutes of such a test arepresented in Figure 13 which took place on flight #20 (April 15, 1999) of thePEM-Tropics B mission. Plotted are the ten 1-min observations of OH and HO2
while the center body was incrementally retracted and then brought back to thefull forward position. The air speed is shown by the solid line and was augmentedfrom 12 to 24 m s−1 while the measured ambient OH and HO2 levels remainedrelatively constant. The test was performed on a constant altitude leg in which thewater vapor, ozone, and NO also remained constant to within 10%.
All of these tests give confidence that losses of OH and HO2 on the externalsurfaces of the inlet are negligible. Any small constant losses would, in any event,be taken into account in the calibrations.
5. Absolute Calibration Uncertainties
The sensitivity measured during calibration is the result of carefully measuringall the components of Equations (2) and (3). Aside from the random errors incalibration that determine the precision of the experiment, there are considerableuncertainties in the fixed parameters used to calculate the sensitivity which give riseto possible systematic errors. Table II summarizes the main terms in Equations (2)
A FLUORESCENCE INSTRUMENT FOR DETECTING TROPOSPHERIC OH AND HO2 161
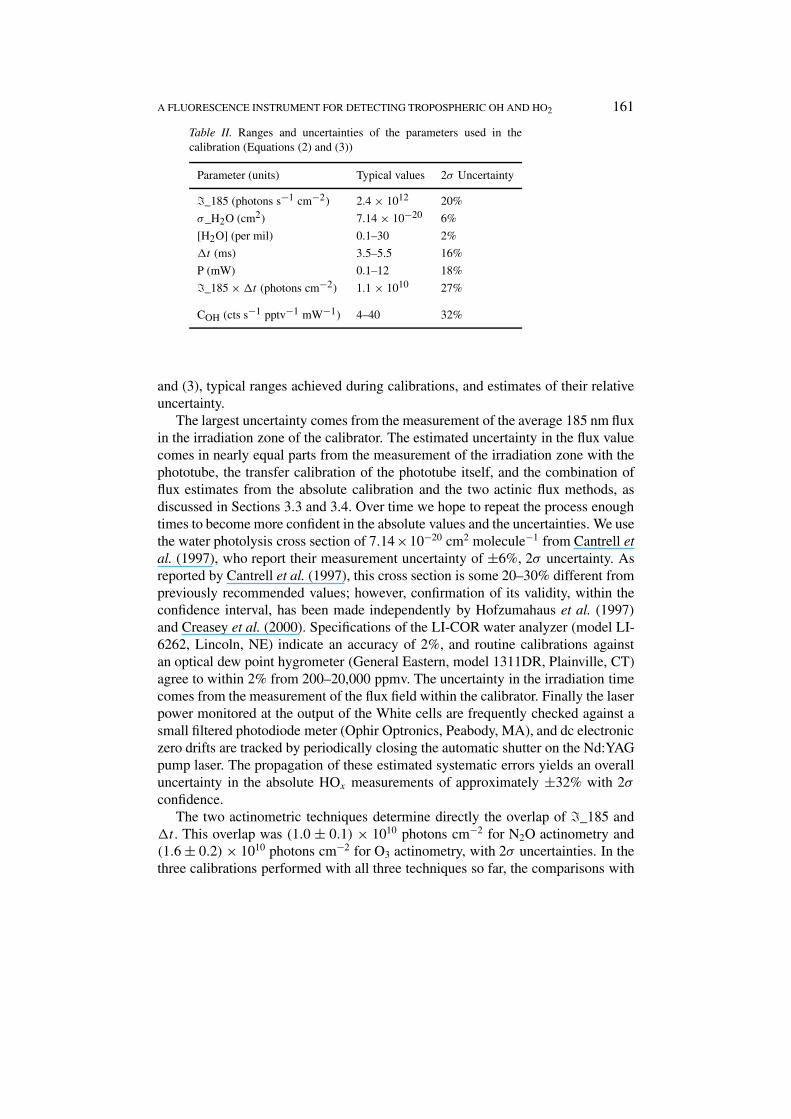
Table II. Ranges and uncertainties of the parameters used in thecalibration (Equations (2) and (3))
Parameter (units) Typical values 2σ Uncertainty
�_185 (photons s−1 cm−2) 2.4 × 10¹² 20%
σ_H2O (cm2) 7.14 × 10⁻²⁰ 6%
[H2O] (per mil) 0.1–30 2%
�t (ms) 3.5–5.5 16%
P (mW) 0.1–12 18%
�_185 × �t (photons cm−2) 1.1 × 10¹⁰ 27%
COH (cts s−1 pptv−1 mW−1) 4–40 32%
and (3), typical ranges achieved during calibrations, and estimates of their relativeuncertainty.
The largest uncertainty comes from the measurement of the average 185 nm fluxin the irradiation zone of the calibrator. The estimated uncertainty in the flux valuecomes in nearly equal parts from the measurement of the irradiation zone with thephototube, the transfer calibration of the phototube itself, and the combination offlux estimates from the absolute calibration and the two actinic flux methods, asdiscussed in Sections 3.3 and 3.4. Over time we hope to repeat the process enoughtimes to become more confident in the absolute values and the uncertainties. We usethe water photolysis cross section of 7.14×10⁻²⁰ cm2 molecule−1 from Cantrell etal. (1997), who report their measurement uncertainty of ±6%, 2σ uncertainty. Asreported by Cantrell et al. (1997), this cross section is some 20–30% different frompreviously recommended values; however, confirmation of its validity, within theconfidence interval, has been made independently by Hofzumahaus et al. (1997)and Creasey et al. (2000). Specifications of the LI-COR water analyzer (model LI-6262, Lincoln, NE) indicate an accuracy of 2%, and routine calibrations againstan optical dew point hygrometer (General Eastern, model 1311DR, Plainville, CT)agree to within 2% from 200–20,000 ppmv. The uncertainty in the irradiation timecomes from the measurement of the flux field within the calibrator. Finally the laserpower monitored at the output of the White cells are frequently checked against asmall filtered photodiode meter (Ophir Optronics, Peabody, MA), and dc electroniczero drifts are tracked by periodically closing the automatic shutter on the Nd:YAGpump laser. The propagation of these estimated systematic errors yields an overalluncertainty in the absolute HOx measurements of approximately ±32% with 2σ
confidence.The two actinometric techniques determine directly the overlap of �_185 and
�t . This overlap was (1.0 ± 0.1) × 1010 photons cm−2 for N2O actinometry and(1.6 ± 0.2) × 1010 photons cm−2 for O3 actinometry, with 2σ uncertainties. In thethree calibrations performed with all three techniques so far, the comparisons with
162 IAN C. FALOONA ET AL.
actinometry are encouraging. N2O actinometry gives an overlap of �_185 and �t
that agrees within 15% with the absolute flux technique, while the O2 photolysistends to give a value that is 1.4 times higher than the absolute flux technique. Thisagreement is within the 2σ uncertainties of the different techniques, although theozone actinometry is consistently above the other two, implying a systematic error.These differences will likely improve after more calibration and study.
6. Example of the Current ATHOS Detection Limit
The background noise-limited OH detection limit is defined by convention as,
[OH]min = (S/N)
CP
√2
tσb , (7)
where C and P are the instrumental sensitivity and laser power as defined in Equa-tion (3), S/N is the signal-to-noise ratio that determines the minimum, t is theintegration time (s), and σb is the standard deviation in the background count rate(cts s−1). Equation (7) assumes that the duty cycle is split in half between onlineand off-resonance measurements, which is how the instrument is usually operatedunder low OH conditions.
Typical OH sensitivities per mW of laser power are 20 cts s−1 pptv−1 mW−1,with typical background signals of 0.2 cts s−1 mW−1. The typical HO2 sensitivityper mW is similar, although they are often not identical due to OH wall loss inATHOS and slight differences in optical collection efficiencies and transmissionbetween the two detection axes. With laser power of 5 mW for the OH axis, thedetection sensitivity was typically 80 cts s−1 pptv−1, with a background signal ofless than 1 cts s−1. Since only 15% of the laser power is diverted to the HO2 axis,the typical total HO2 sensitivity is less than the typical total OH sensitivity.
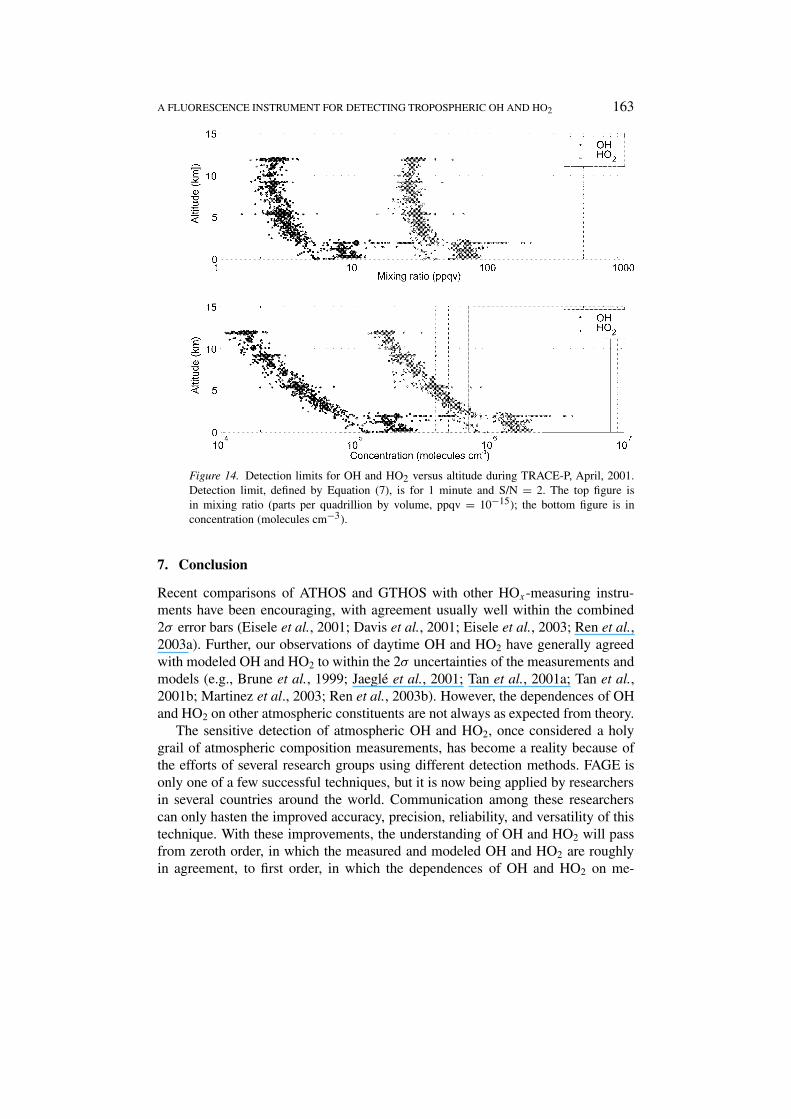
The detection limits using Equation (7) for one minute integration time anda S/N = 2 are shown for typical operational parameters from the Transport,Radiation, And Chemistry Experiment – Pacific (TRACE-P), which occurred inApril–May 2001 (Figure 14). The detection limits of less than 3 ppqv (parts perquadrillion by volume, 10−15) for the middle and upper troposphere calculated herehave been verified by laboratory studies using pure air, although not all cylindersof pure air appear to hold pure air. The increase in the detection limits at loweraltitudes is due primarily to the additional quenching by water vapor. In this case,the water vapor mixing ratio was ∼14 per mil. While the detection limits in mixingratios stabilize above 4 km, as expected, the detection limits in terms of concen-tration decrease as altitude increases. The detection limit for OH at 10 km is lessthan 2 × 10⁴ molecules cm−3. These low detection limits are well below thosenecessary to study HOx chemistry throughout the troposphere and stratosphere.
A FLUORESCENCE INSTRUMENT FOR DETECTING TROPOSPHERIC OH AND HO2 163
Figure 14. Detection limits for OH and HO2 versus altitude during TRACE-P, April, 2001.Detection limit, defined by Equation (7), is for 1 minute and S/N = 2. The top figure isin mixing ratio (parts per quadrillion by volume, ppqv = 10−15); the bottom figure is inconcentration (molecules cm−3).
7. Conclusion
Recent comparisons of ATHOS and GTHOS with other HOx-measuring instru-ments have been encouraging, with agreement usually well within the combined2σ error bars (Eisele et al., 2001; Davis et al., 2001; Eisele et al., 2003; Ren et al.,2003a). Further, our observations of daytime OH and HO2 have generally agreedwith modeled OH and HO2 to within the 2σ uncertainties of the measurements andmodels (e.g., Brune et al., 1999; Jaeglé et al., 2001; Tan et al., 2001a; Tan et al.,2001b; Martinez et al., 2003; Ren et al., 2003b). However, the dependences of OHand HO2 on other atmospheric constituents are not always as expected from theory.
The sensitive detection of atmospheric OH and HO2, once considered a holygrail of atmospheric composition measurements, has become a reality because ofthe efforts of several research groups using different detection methods. FAGE isonly one of a few successful techniques, but it is now being applied by researchersin several countries around the world. Communication among these researcherscan only hasten the improved accuracy, precision, reliability, and versatility of thistechnique. With these improvements, the understanding of OH and HO2 will passfrom zeroth order, in which the measured and modeled OH and HO2 are roughlyin agreement, to first order, in which the dependences of OH and HO2 on me-
164 IAN C. FALOONA ET AL.
teorology, surfaces, and other atmospheric constituents are precisely understood.This first-order understanding is essential for developing predictive capability forpresent and future atmospheric oxidation and ozone production. It is the goalof a growing number of researchers who now have the capability to measureatmospheric OH and HO2.
Acknowledgements
We acknowledge the help of Jeremy Bassis, Terry Shirley, Jennifer Adams,Jingqiu Mao and the fruitful collaborations that we have with colleagues on sev-eral airborne and tower-based field intensive studies. We thank Gary Rottman,Ray Wrigley and Ginger Drake at the University of Colorado for the absolutecalibrations of our primary standard photomultiplier tube. We also thank our col-leagues Frank Holland, Andreas Hofzumahaus, and Dwayne Heard for exchangeof information on the FAGE technique. This work has been supported by grantsfrom the National Science Foundation (ATM-9628059, ATM-9974335) and NASA(NAG1-1057, NCC-1-300, NAG2-1117, NAG2-1309, NCC-1-414).
References
Bailey, A. E., Heard, D. E., Paul, P. H., and Pilling, M. J., 1997: Collisional quenching of OH (A2�+,v′ = 0) by N2, O2, and CO2 between 204 and 294 K, implications for atmospheric measurementsof OH by laser-induced fluorescence, J. Chem. Soc. Faraday Trans. 93, 2915–2920.
Bailey, A. E., Heard, D. E., Henderson, D. A., and Paul, P. H., 1999: Collisional quenching of OH(A2�+, v′ = 0) by H2O between 211 and 294 K and the development of a unified model forquenching, Chem. Phys. Lett. 302, 132–138.
Brune, W. H., 1992: Stalking the elusive atmospheric hydroxyl radical, Science 256, 1154–1155.Brune, W. H., Stevens, P. S., and Mather, J. H., 1995: Measuring OH and HO2 in the troposphere by
laser-induced fluorescence, J. Atmos. Sci. 52, 3328–3336.Brune, W. H., Faloona, I. C., Tan, D., Weinheimer, A. J., Campos, T., Ridley, B. A., Vay, S. A.,
Collins, J. E., Sachse, G. W., Jaeglé, L., and Jacob, D. J., 1998: Airborne in situ OH and HO2observations in the cloud-free troposphere and lower stratosphere during SUCCESS, Geophys.Res. Lett. 25, 1701–1704.
Brune, W. H., Tan, D., Faloona, I., Jaeglé, L., Jacob, D., Heikes, B., Snow, J., Kondo, Y., Shetter, R.,Sachse, G., Anderson, B., Gregory, G., Vay, S., Singh, H., Davis, D., Crawford, J., and Blake,D., 1999: OH and HO2 chemistry in the North Atlantic free troposphere, Geophys. Res. Lett. 26,3077–3080.
Cantrell, C. A., Zimmer, A., and Tyndall, G. S., 1997: Absorption cross sections for water vapor from183 to 193 nm, Geophys. Res. Lett. 24, 2195–2198.
Copeland, R. A. and Crosley, D. R., 1986: Temperature dependent electronic quenching of OH(A2�+, v′ = 0) between 230 and 310 K, J. Chem. Phys. 84, 3099–3105.
Creasey, D. J., Halford-Maw, P. A., Heard, D. E., Pilling, M. J., and Whitaker, B. J., 1997: Imple-mentation and initial deployment of a field instrument for measurement of OH and HO2 in thetroposphere by laser-induced fluorescence, J. Chem. Soc. Faraday Trans. 93, 2907–2913.
Creasey, D. J., Heard, D. E., and Lee, J. D., 2000: Absorption cross-section measurements of watervapour and oxygen at 185 nm, implications for the calibration of field instruments to measureOH, HO2, and RO2 radicals, Geophys. Res. Lett. 27, 1651–6154.
A FLUORESCENCE INSTRUMENT FOR DETECTING TROPOSPHERIC OH AND HO2 165
Creasey, D. J., Heard, D. E., and Lee, J. D., 2001: OH and HO2 measurements in a forested regionof north-western Greece, Atmos. Environ. 35, 4713–4724.
Davis, D. D., Grodzinsky, G., Chen, G., Crawford, J., Eisele, F., Mauldin, L., Tanner, D., Cantrell,C., Brune, W., Tan, D., Faloona, I., Ridley, B., Montzka, D., Walega, J., Grahek, F., Sandholm,S., Sachse, G., Vay, S., Anderson, B., Avery, M., Heikes, B., Snow, J., O’Sullivan, D., Shetter,R., Lefer, B., Blake, D., Blake, N., Carroll M., and Wang, Y., 2001: Marine latitude/altitudeOH distributions: Comparison of Pacific Ocean observations with models, J. Geophys. Res. 106,32,691–32,707.
Edwards, G. D., Cantrell, C. A., Stephens, S., Hill, B., Goyea, O., Shetter, R. E., Mauldin, R. L.,Kosciuch, E., Tanner, D. J., and Eisele, F. L., 2003: Chemical Ionization Mass Spectrometerinstrument for the measurement of tropospheric HO2 and RO2, Anal. Chem. 75, 5317–5327.
Eisele, F. L. and Tanner, D. J., 1991: Ion-assisted tropospheric OH measurements, J. Geophys. Res.96, 9295–9308.
Eisele, F. L. and Bradshaw, J. D., 1993: The elusive hydroxyl radical: Measuring OH in theatmosphere, Anal. Chem. 65, 927–939.
Eisele, F. L., Mauldin, L., Tanner, D. J., Cantrell, C., Kosciuch, E., Brune, W., Faloona, I., Tan, D.,Davis, D. D., and Chen, G., 2001: The relationship between P-3B and DC-8 OH measurementsduring PEM-Tropics B, J. Geophys. Res. 106, 32,683–32,689.
Eisele, F. L., Mauldin, L., Cantrell, C., Zondlo, M., Apel, E., Fried, A., Walega, J., Shetter, R.,Lefer, B., Flocke, F., Weinheimer, A., Avery, M., Vay, S., Sachse, G., Podolske, J., Diskin,G., Barrick, J. D., Singh, H. B., Brune, W., Harder, H., Martinez, M., Bandy, A., Thornton,D., Heikes, B., Kondo, Y., Riemer, D., Sandholm, S., Tan, D., Talbot, R., and Dibb, J., 2003:Summary of measurement intercomparisons during TRACE-P, J. Geophys. Res. 108, 8791,doi:10.1029/2002JD003167.
Faloona, I., Tan, D., Brune, W., Hurst, J., Barket Jr., D., Couch, T. L., Shepson, P., Apel, E., Riemer,D., Thornberry, T., Carroll, M. A., Sillman, S., Keeler, G. J., Sagady, J., Hooper, D., and Pater-son, K., 2001: Nighttime observations of anomalously high levels of hydroxyl radicals above adeciduous forest canopy, J. Geophys. Res. 106, 24,315–24,333.
Hard, T. M., O’Brien, R. J., Chan, C. Y., Mehrabzadeh, A. A., 1984: Tropospheric free radicaldetermination by FAGE, Environ. Sci. Technol. 18, 768–777.
Hard, T. M., Chan, C. Y., Mehrabzadeh, A. A., and O’Brien, R. J., 1992: FAGE measurements oftropospheric HO with measurements and model of interferences, J. Geophys. Res. 97, 9795–9817.
Heal, M. R., Heard, D. E., Pilling, M. J., and Whitaker, B. J., 1995: On the development andvalidation of FAGE for local measurements of tropospheric OH and HO2, J. Atmos. Sci. 52,3428–3441.
Hofzumahaus, A., Aschmutat, U., Heßling, M., Holland, F., and Ehhalt, D. H., 1996: The mea-surement of tropospheric OH radicals by laser-induced fluorescence spectroscopy during thePOPCORN field campaign, Geophys. Res. Lett. 23, 2541–2544.
Hofzumahaus, A., Brauers, T., Aschmutat, U., Brandenburger, U., Dorn, H.-P., Hausmann, M.,Heßling, M., Holland, F., Plass-Dülmer, C., Sedlacek, M., Weber, M., and Ehhalt, D. H., 1997:Reply to comment by Lanzendorf et al., Geophys. Res. Lett. 24, 3039–3040.
Holland, F., Heßling, M., and Hofzumahaus, A., 1995: In situ measurement of tropospheric OHradicals by laser-induced fluorescence – a description of the KFA instrument, J. Atmos. Sci. 52,3393–3401.
Holland, F., Ashmutat, U., Hessling, M., Hofzumahaus, A., and Ehhalt, D. H., 1998: Highly timeresolved measurements of OH during POPCORN using laser-induced fluorescence spectroscopy,J. Atmos. Chem. 31, 205–225.
Holland, F., Hofzumahaus, A., Schäfer, J., Kraus, A., and Pätz, H., 2003: Measurements of OH andHO2 radical concentrations and photolysis frequencies during BERLIOZ, J. Geophys. Res. 108,8246, doi: 10.1029/2001JD001393.
166 IAN C. FALOONA ET AL.
Jaeglé, L., Jacob, D. J., Brune, W. H., and Wennberg, P. O., 2001: Chemistry of HOx radicals in theupper troposphere. Atmos. Environ. 35, 469–489.
Kanaya, Y., Sadanaga, Y., Matsumoto, J., Sharma, U. K., Hirokawa, J., Kajii, Y., and Akimoto, H.,1999: Nighttime observation of the HO2 radical by a LIF instrument at Oki island, Japan, and itspossible origins, Geophys. Res. Lett. 26, 2179–2183.
Lanzendorf, E. J., Hanisco, T. F., Donahue, N. M., and Wennberg, P. O., 1997: Comment on: ‘Themeasurement of tropospheric OH radicals by laser-induce fluorescence spectroscopy duringthe POPCORN field campaign’ by Hofzumahous et al. and ‘Intercomparison of troposphericOH radical measurements by multiple folded long-path laser absorption and laser inducedfluorescence’ by Brauers et al., Geophys. Res. Lett. 24, 3037–3038.
Levenberg, K., 1944: A method for the solution of certain problems in least squares, Quart. Appl.Math. 2, 164–168.
Levy II, H., 1971: Normal atmosphere: Large radical and formaldehyde concentrations predicted,Science 173, 141–143.
Marquardt, D., 1963: An algorithm for least-squares estimation of nonlinear parameters, SIAM J.Appl. Math. 11, 431–441.
Martinez, M., Harder, H., Kovacs, T. A., Simpas, J. B., Bassis, J., Lesher, R., Brune, W. H., Frost,G., Williams, E. J., Stroud, C. A., Jobson, B. T., Roberts, J. M., Hall, S. R., Shetter, R. E., Wert,B., Fried, A., Alicke, B., Stutz, J., Young, V. L., White, A. B., and Zamora, R. J., 2003: OH andHO2 concentrations, sources and loss rates during the Southern Oxidants Study in Nashville, TN,summer 1999, J. Geophys. Res. 108, 4617, doi: 10.1029/2003JD003551.
Mather, J. H., Stevens, P. S., and Brune, W. H., 1997: OH and HO2 measurements using laser-inducedfluorescence, J. Geophys. Res. 102, 6427–6436.
McConnell, J. C., McElroy, M. B., and Wofsy, S. C., 1971: Natural sources of atmospheric CO,Nature 233, 187–188.
Mount, G. H. and Harder, J. W., 1995: The measurement of tropospheric trace gases at Fritz PeakObservatory, Colorado, by Long-Path Absorption: OH and ancillary gases, J. Atmos. Sci. 52,3342–3353.
Ortgies, G., Gericke, K.-H., and Comes, F. J., 1981: Optical measurements of tropospheric hydroxylwith lasers, Z. Naturforsch. 36a, 177–183.
Perner, D., Paltt, U., Trainer, M., Huebler, G., Drummond, J. W., Junkermann, W., Rudolph, J.,Schubert, B., Volz-Thomas, A., Ehhalt, D. H., Rumpel, K. J., and Helas, G., 1987: Measurementof tropospheric OH concentrations: A comparison of field data with model predictions, J. Atmos.Chem. 5, 185–216.
Ren, X., Edwards, G. D., Cantrell, C. A., Lesher, R. L., Metcalf, A. R., Shirley, T., and Brune, W.H., 2003a: Intercomparison of peroxy radical measurements at a rural site using laser-inducedfluorescence and Peroxy Radical Chemical Ionization Mass Spectrometer (PerCIMS) techniques,J. Geophys. Res. 108, 4605, doi:10.1029/2003JD003644.
Ren, X., Harder, H., Martinez, M., Lesher, R. L., Oliger, A., Simpas, J. B., Brune, W. H., Schwab,J. J., Demerjian, K. L., He, Y., Zhou, X., and Gao, H., 2003b: OH and HO2 chemistry in theurban atmosphere of New York City, Atmos. Environ. 37, 3639–3651.
Ren, X., Harder, H., Martinez, M., Faloona, I., Tan, D., Lesher, R. L., DiCarlo, P., Simpas, J. B., andBrune, W. H., 2004: Interference testing for Atmospheric HOx measurements by laser-inducedfluorescence, J. Atmos. Chem. 47, 169–190.
Sander, S. P., Friedl, R. R., DeMore, W. B., Golden, D. M., Kurylo, M. J., Hampson, R. F., Huie,R. E., Moortgat, C. K., Ravishankara, A. R., Kolb, C. E., and Molina, M. J., 2000: Chemicalkinetics and photochemical data for use in stratospheric modeling, Evaluation number 12, JPLPublication 00–3, NASA Jet Propulsion Laboratory, Pasadena, California.
Schultz, M., Heitlinger, M., Mihelcic, D., and Volz-Thomas, A., 1995: Calibration source for peroxyradicals with built-in actinometry using H2O and O2 photolysis at 185 nm, J. Geophys. Res. 100,18,811–18,816.
A FLUORESCENCE INSTRUMENT FOR DETECTING TROPOSPHERIC OH AND HO2 167
Stevens, P. S., Mather, J. H., and Brune, W. H., 1994: Measurement of tropospheric OH and HO2 bylaser-induced fluorescence at low pressure, J. Geophys. Res. 99, 3542–3557.
Tan, D., Faloona, I., Simpas, J. B., Brune, W., Shepson, P. B., Couch, T. L., Sumner, A. L., Car-roll, M. A., Thornberry, T., Apel, E., Riemer, D., and Stockwell, W., 2001a: HOx budget in adeciduous forest: Results from the PROPHET summer 1998 campaign, J. Geophys. Res. 106,24407–24427.
Tan, D., Faloona, I., Simpas, J. B., Brune, W., Olson, J., Crawford, J., Avery, M., Sachse, G., Vay, S.,Sandholm, S., Guan, H.-W., Vaughn, T., Mastromarino, J., Heikes, B., Snow, J., Podolske, J., andSingh, H., 2001b: OH and HO2 in the tropical Pacific: Results from PEM-Tropics B, J. Geophys.Res. 106, 32,667–32,681.
Tanner, D. J. and Eisele, F. L., 1995: Present OH measurement limits and associated uncertainties, J.Geophys. Res. 100, 2883–2892.
Wennberg, P. O., Cohen, R. C., Hazen, N. L., Lapson, L. B., Allen, N. T., Hanisco, T. F., Oliver,J. F., Lanham, N. W., Demusz, J. N., and Anderson, J. G., 1994: Aircraft-borne, laser-inducedfluorescence instrument for the in situ detection of hydroxyl and hydroperoxyl radicals, Rev. Sci.Instr. 65, 1858–1876.
Wennberg, P. O., Hanisco, T. F., Cohen, R. C., Stimpfle, R. M., Lapson, L. B., and Anderson, J. G.,1995: In situ measurements of OH and HO2 in the upper troposphere and stratosphere, J. Atmos.Sci. 52, 3413–3420.
White, J., 1942: Long optical paths of large aperture, J. Opt. Soc. Amer. 32, 285–288.Wysong, I. J., Jeffries, J. B., and Crosley, D. R., 1990: Quenching of A2�+ OH at 300 K by several
colliders, J. Chem. Phys. 92, 5218–5222.
Related Documents