A labour-based approach to the analysis of structural transformation: application to French agricultural holdings 2000 Celine Bignebat, Pierre-Marie Bosc, Philippe Perrier-Cornet To cite this version: Celine Bignebat, Pierre-Marie Bosc, Philippe Perrier-Cornet. A labour-based approach to the analysis of structural transformation: application to French agricultural holdings 2000. [University works] auto-saisine. 2015, 17 p. <hal-01294793> HAL Id: hal-01294793 https://hal.archives-ouvertes.fr/hal-01294793 Submitted on 29 Mar 2016 HAL is a multi-disciplinary open access archive for the deposit and dissemination of sci- entific research documents, whether they are pub- lished or not. The documents may come from teaching and research institutions in France or abroad, or from public or private research centers. L’archive ouverte pluridisciplinaire HAL, est destin´ ee au d´ epˆ ot et ` a la diffusion de documents scientifiques de niveau recherche, publi´ es ou non, ´ emanant des ´ etablissements d’enseignement et de recherche fran¸cais ou ´ etrangers, des laboratoires publics ou priv´ es.

Welcome message from author
This document is posted to help you gain knowledge. Please leave a comment to let me know what you think about it! Share it to your friends and learn new things together.
Transcript
A labour-based approach to the analysis of structural
transformation: application to French agricultural
holdings 2000
Celine Bignebat, Pierre-Marie Bosc, Philippe Perrier-Cornet
To cite this version:
Celine Bignebat, Pierre-Marie Bosc, Philippe Perrier-Cornet. A labour-based approach tothe analysis of structural transformation: application to French agricultural holdings 2000.[University works] auto-saisine. 2015, 17 p. <hal-01294793>
HAL Id: hal-01294793
https://hal.archives-ouvertes.fr/hal-01294793
Submitted on 29 Mar 2016
HAL is a multi-disciplinary open accessarchive for the deposit and dissemination of sci-entific research documents, whether they are pub-lished or not. The documents may come fromteaching and research institutions in France orabroad, or from public or private research centers.
L’archive ouverte pluridisciplinaire HAL, estdestinee au depot et a la diffusion de documentsscientifiques de niveau recherche, publies ou non,emanant des etablissements d’enseignement et derecherche francais ou etrangers, des laboratoirespublics ou prives.

WORKING-PAPER – UMR MOISA
_______________________________
WORKING PAPER MOISA 2015-1
A labour-based approach to the analysis of structural transformation: application to French
agricultural holdings 2000
Bignebat, C. ; Bosc, P.M. ; Perrier-Cornet, P.
WORKING-PAPER – UMR MOISA
_______________________________
A labour-based approach to the analysis of structural transformation: Application to French
agricultural holdings 20001
Céline Bignebat 1,2
Pierre-Marie Bosc 3
Philippe Perrier-Cornet 1
1 INRA, UMR 1110 MOISA, F-34000 Montpellier, France
2 UMR 225 DIAL, F-75010 Paris, France
3 CIRAD, UMR MOISA, F-34000 Montpellier, France
Abstract
The question of farm size has long been a concern in the agricultural economics literature. The observation of a long-lasting
persistence of so-called small farms drew the attention of numerous researchers. The size of farms is often approximated by
the farm area in hectares or the added value and gross margin. We propose to investigate the opportunity to use labour
(family labour and hired, permanent and seasonal, wage labour) as an entry point for a typology of agricultural holdings, with
an application on French data from the Census collected in 2000. Then, we characterize the holdings belonging to the groups
defined by the typology based on the type of labour.
Keywords Agricultural labour, Farm size, France
Transformation des structures et salariat agricole : une application France sur RA 2000
Résumé
La question de la taille des exploitations agricoles, en relation avec leurs performances, a été largement abordée par la
littérature dédiée à l’économie agricole. En particulier, la persistance de l’existence de petites exploitations a attiré l’attention.
La taille des exploitations est le plus souvent estimée en hectares, en valeur ajoutée ou en chiffre d’affaires. Cet article
propose une entrée par le travail (familial ou salarié, saisonnier ou permanent) pour construire une typologie des exploitations
françaises sur la base du Recensement Agricole 2000. Il caractérise ensuite les différents types d’exploitations identifiées.
Mots clés Travail agricole, taille des exploitations, France
JEL : D22, D13, J43, Q12
Présenté au Colloque de la Société Française d’Economie Rurale (SFER) « Structures d’exploitation et exercice de l’activité
agricole : continuités, changements ou ruptures ? », Rennes (FRA), 12-13/02/2015
1 This research is funded by and discussed in the framework of the World Agricultural Watch (FAO, 2012)
http://www.worldagricultureswatch.org/
1
Introduction
The question of farm size has long been a concern in the agricultural economics literature
(Eastwood and al. 2010 for a review). The observation of a long-lasting persistence of so-called small
farms drew the attention of numerous researchers (Johnston and Ruttan, 1994): they questioned the
relationship between farm size and productivity (Barrett et al., 2010). The empirical analyses
conducted on various developed and developing countries often conclude on an inverse relationship
between farm size and performance whereby smaller farms tend to perform better (in terms of
productivity) than larger ones (see Mundlack, 2001 for a survey of the cross-farm
microeconometrical literature on production scale economies).
In those studies, the size of farms is often approximated by the farm area in hectares (for the
French case, Butault and Delame, 2005, for instance). The added value and the gross margin are used
as a measure of farm size as well. The latter definition of farm size is, for instance, adopted by the
European Union in the framework of the FADN (Farm Accountancy Data Network) where the
economic dimension is constructed for each farm in terms of European Size Unit (ESU)1.
However, those standards of measurement exhibit drawbacks: first, the farm area is measured
whatever the type of crop cultivated and does not allow for an international comparison; second the
economic dimension produced in the EU framework describes a potential gross margin computed on
the basis of standard figures at the regional level according to the type of cultivation.
We propose to investigate the opportunity to use labour (namely, family labour and hired,
permanent and seasonal, wage labour) as an entry point for a typology of agricultural holdings, with
an application on French data from the Census collected in 2000.
The aim of this paper is twofold: after a short review of the respective role and weight of family
labour and hired wage labour in the agricultural economics literature and in the recent evolution of
the agricultural sector (section 1), we will
(i) propose a typology of French agricultural holdings (based on census 2000 to be further on
extended to Census 2010) based on the use of labour. We distinguish thereby family labour,
seasonal hired wage labour and permanent hired wage labour (section 2), and.
(ii) characterize the holdings belonging to the groups defined by the typology (section 3).
1 http://ec.europa.eu/agriculture/rica/methodology1_en.cfm under the title “The economic size of farms” for a
definition of the European Size Unit (ESU)

2
1. General question: farm size / family farming
1.1. Agricultural labour in the Agecon literature
A significant part of the economic literature deals with the historical debate on farm size –
productivity inverse relationship that aims at exploring why small farms are supposed to be – in most
cases - more productive than larger ones. This debate is more or less implicitly linked to the nature of
the labour employed for farming. Usually, small farms are defined by the natural assets (hectares,
thereafter ha), by the herd size or by the economic size and implicitly authors have examined these
units as family farms. There is only few doubts that small farms and family farms categories partially
overlap, but not necessarily; but this distinction has been seldom addressed. Nevertheless, we can
assume that small farms can be understood as family farms where most of the labour is provided by
the family meanwhile larger farms rely more on hired labour. Eastwood and al.(2010) recognize that:
“Although the term family farm is widespread in the literature, we have not been able to find a
precise definition”. Many authors paid a specific attention to the market imperfections approach,
searching to explain the “inverse relationship” and developed formalized models to represent the unit
of production. Even if size is often taken as a key factor to handle the diversity of farming units, a
considerable literature developed approaches and models that consider labour as a key differentiating
factor. We will limit our review to the most relevant for our purpose.
Eswaran and Kotwal (1986) model - assuming perfect markets in land and labor and
heterogeneous assets distribution among households – leads to classify four categories based on
assets or capital endowments, ranging from the labourer-cultivators to large capitalists (table 1). The
distinction among the four categories refers to the capacity of each to be employed on one’s farm to
the capacity to become employer of increasing number of external workers, thus specializing
progressively in labour supervision. They focus on two specific skills that appear to be crucial in
agriculture: the ability to supervise labour and the managerial ability for decision making in a risk
prone environment regarding biological processes and unpredictable natural events on one side and
market uncertainty. Regarding hired labour and tenancy contracts, they underline the need to consider
labour input as the quantity of labour hired and the supervision effort to reduce shirking.
Table 1: Types of models of agricultural production units
Assets / Types
Labourer-
Cultivator
Self-cultivator
Small capitalist
Large capitalist
Land
Work on some
owned or rented land
More assets, more
land and work
exclusively on this
land (owned or
rented)
Employ more land
and assets
Employ more land
and assets
Labor
Work for others
Work only for
themselves
Work on farm and
supervise hired labor
Specialized in
supervision of hired
labor
Based on Eswaran and Kotwal (1986)
Allen and Lueck (1998) combine the now classical conception of the firm developed by Coase
(1937) with technical insight deriving from the specificity of the biological processes in farming.
3
Their definition of the farm is therefore close to a firm in Coase’s perspective (page 347): “A “pure”
family farm is the simplest case, where a single farmer owns the output and controls all the farm
assets, including all labor assets”. This definition is directly opposed to “factory-style corporate
agriculture” defined as a production unit “where many people own the farm and labor is provided by
large groups of specialized fixed wage labor”. In between they identify an intermediate form “in
which two or three owners share output and capital and each owner provides labor”. They call it
“Partnerships”. In this definition of family farms, they consider the household (husband and wife) as
a single agent and ignore intra-family shirking as well as the distinction between farm ownership and
renting. The specific performance of family farms compared to “factory-style corporate agriculture”
lies in the capacity of family labour to closely monitor and / or react to random events (combination
of climate shocks and biological reactions of plants and /or animals) and to adapt to an uneven
distribution of labour needs along with the plant or animal biological cycles around the year.
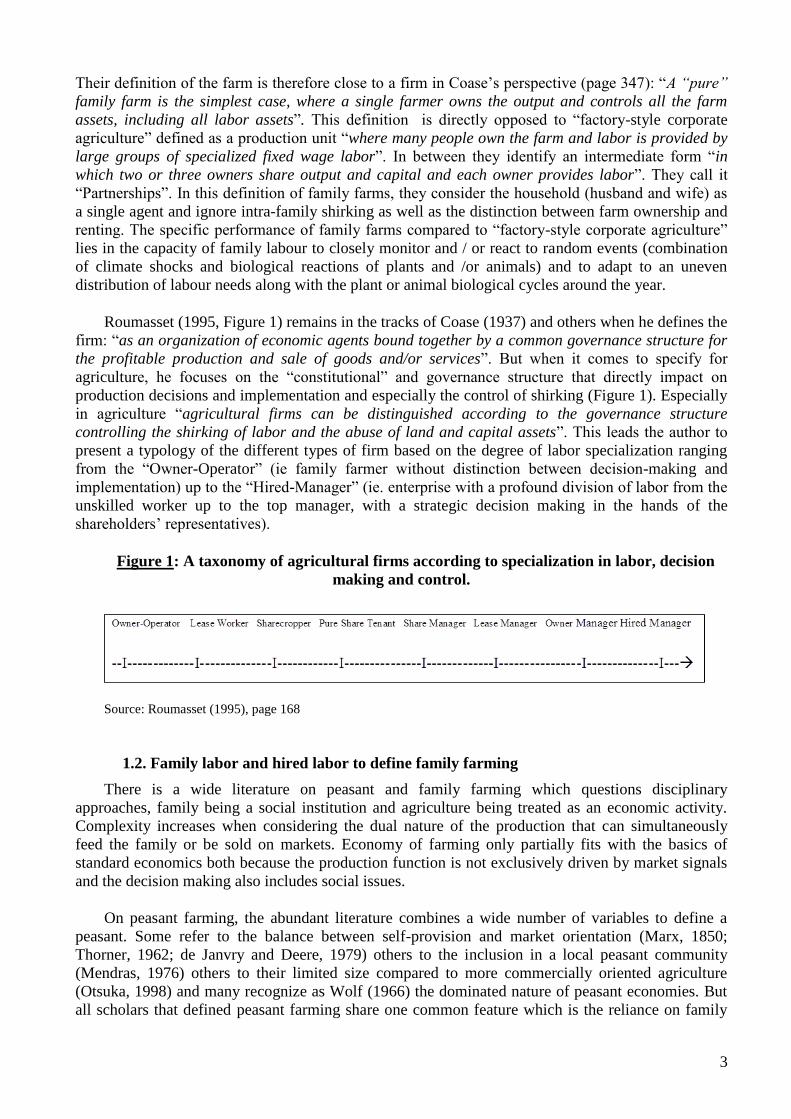
Roumasset (1995, Figure 1) remains in the tracks of Coase (1937) and others when he defines the
firm: “as an organization of economic agents bound together by a common governance structure for
the profitable production and sale of goods and/or services”. But when it comes to specify for
agriculture, he focuses on the “constitutional” and governance structure that directly impact on
production decisions and implementation and especially the control of shirking (Figure 1). Especially
in agriculture “agricultural firms can be distinguished according to the governance structure
controlling the shirking of labor and the abuse of land and capital assets”. This leads the author to
present a typology of the different types of firm based on the degree of labor specialization ranging
from the “Owner-Operator” (ie family farmer without distinction between decision-making and
implementation) up to the “Hired-Manager” (ie. enterprise with a profound division of labor from the
unskilled worker up to the top manager, with a strategic decision making in the hands of the
shareholders’ representatives).
Figure 1: A taxonomy of agricultural firms according to specialization in labor, decision
making and control.
Source: Roumasset (1995), page 168
1.2. Family labor and hired labor to define family farming
There is a wide literature on peasant and family farming which questions disciplinary
approaches, family being a social institution and agriculture being treated as an economic activity.
Complexity increases when considering the dual nature of the production that can simultaneously
feed the family or be sold on markets. Economy of farming only partially fits with the basics of
standard economics both because the production function is not exclusively driven by market signals
and the decision making also includes social issues.
On peasant farming, the abundant literature combines a wide number of variables to define a
peasant. Some refer to the balance between self-provision and market orientation (Marx, 1850;
Thorner, 1962; de Janvry and Deere, 1979) others to the inclusion in a local peasant community
(Mendras, 1976) others to their limited size compared to more commercially oriented agriculture
(Otsuka, 1998) and many recognize as Wolf (1966) the dominated nature of peasant economies. But
all scholars that defined peasant farming share one common feature which is the reliance on family

4
labor. This reliance is neither exclusive nor limited to agriculture (pluriactivity is part of peasant
farming – Chayanov 1990). So peasant farming is based on family labor.
On family farming, we follow the vision developed by scholars as Chayanov (1990), Lamarche
(1990), Hill (1993), Djurfeldt (1993) and recently by Brookfield (2007) – Figure 2. “Family
management, coupled with substantial work input, seems adequately to define family farms not only
in Europe, but elsewhere. This mode of management and production is found in all continents”
(Brookfield, 2008). Once defined as such, it is impossible with the available data to precisely define
which holding is run by a family. The legal status is specific to each context and is often related to
fiscal or organizational choices within the family. Size is also not robust since large scale farms can
be run by families. Bélières and al. (2014) propose to consider both the organic linkage between the
family patrimony and the economic assets of the farm (as a productive unit) and the exclusion of
permanent hired labour. The first criteria is not accessible in data bases or surveys, but limiting
family farms to those relying exclusively on family labour is possible with censuses or surveys in
which labour use is properly captured. Then, on the opposite, it is possible to strictly define the
corporate type of farming when all labour is hired and at the same time there is no link between
family patrimony and the economic assets.
Figure 2: Description of farms
Entrepreneurial Agricultures Family Agricultures
Labor Exclusively hired laborCombining family and
hired labor
Family labor
no permanent hired labor
Entreprise farm Family business farm Family farm
Sources: Bélières et al. (2013) ; FAO (2012)
We suggest here to rely of these definitions2 to analyse the 2000 Census data for France: this census
is reporting precise data on the labour used with respect to: family or hired wage labour, seasonal or
permanent labour, part-time or full-time active on the farm.
1.2. Proposal
We consider four categories:
(i) Family farms are farms working essentially with family labour and occasionally seasonal
hired wage labour. Furthermore, family farms are characterized by a structural relationship between
the productive activities and the family structure: therefore, the management type conforms to a
familial approach. In order to capture the heterogeneity of this category, we furthermore distinguish
between:
(a) Family farms type 1 with a limited investment in labour in absolute value (less than 0.5
Annual Work Unit3, thereafter AWU).
2 We should however note the limits of the measurement. The implication of family workers is divided into 5 categories
according to the number of hours worked on-farm relatively to full-time work: the precise full-time equivalent is
therefore not available.
3 AWU (annual work unit): corresponds to the work performed by one person who is occupied on an agricultural holding
on a full-time basis
5
(b) Family farms type 2 with a significant implication of family labour.
(ii) Family business farms encompasses holdings that, beyond the use of family labour, hire at
least one permanent worker. Those holdings rely then structurally on wage labour.
(iii) Corporate (or entrepreneurial) farms consists in the farms with exclusively hired labour
and a clear separation between ownership of productive assets and labour.
2. Building the typology
We draw on the framework presented in section 1.2.: we propose to French data from the
Agricultural Census 2000.
2.1. Definition of an agricultural holding and of the variables related to labour
(i) The French Agricultural Census 2000 was used on the basis of individual data, excluding
Overseas departments (the test will be easily translated to the French Census 2010). The data provide
a large range of characteristics of agricultural holdings. In the Census, an agricultural holding is
defined as an independent entity:
- that operates more than 1 hectare of land
- or more than 0.2 hectare of specialized production (vineyard, for instance)
- or a sufficient activity in agricultural production measured in number of livestock or
production volume.
The data base entails 663,807 holdings. When removing suspicious data reporting a Standard
Gross Margin (thereafter SGM) equal to zero, we end up with 663,041 observations.
(ii) The data set reports for each holding:
the amount of family labour (permanent and seasonal separately) in Annual Work Unit (thereafter
AWU)
the amount of wage labour (permanent and seasonal separately) in AWU
the amount of family wage labour in AWU
2.2. The methodology to classify
In the next paragraph, we explain how we categorized holdings according to labor.
2.2.1. Corporate farms
Corporate farms were empirically defined as farms that report more than 95% of wage (familial
and non-familial) labour compared to total labour. The threshold of 95% was chosen because
misreporting of some data was discovered; in particular some of the holdings are reporting no familial
labour whereas the total amount of labour is higher than the amount wage labour.
Group 4 (corporate agriculture): In total, 8,112 holdings are classified as corporate farms
(1.2% of the total sample)

6
The confidence interval of 95% adds 1,772 holdings to those who report zero family labour4.
2.2.2. Family business farms
The holdings that reported more than one AWU of hired permanent wage labour are classified as
family business farms.
- 64,879 holdings with at one permanent wage worker
We decided to add to those holdings a part of the remaining subsample. In fact, some of the
holdings report a very high proportion of seasonal wage labour and according to our knowledge,
those wage workers are substitutes to permanent workers: as the cost of seasonal workers is less than
that of permanent workers, farmers get round the law and use strategically seasonal contracts
(Darpeix and al., 2013). We decided thus to split the remaining sample into two samples in order to
assess the fact that some farms are actually employing a large amount of hired wage labour relatively
to the total amount of labour used on-farm. We used the k-mean method to find the threshold (81.5%
of family labour in total labour). The results turned out to be robust when using k-median instead of
k-mean.
- 49,117 holdings were thus added to the group of business farms
Group 3 (Family business farms): In total, 113,996 holdings are classified as Family business
farms
(17.2% of the total sample)
2.2.3. Family farms
The remaining farms of the sample consist of holdings that use family labour and potentially
seasonal wage labour (for a small proportion of total labour, according to the clustering procedure
made to reallocate holdings across family business farms and family farms). A large part of those
holdings (84%) report only family labour.
In order to discriminate further holdings belonging to this large and heterogeneous category, we
break it down into two categories according to the amount of labour engaged in farming:
(i) If the number of AWU is higher than 0.5, we consider holdings as significatively engaged in
agricultural production (family farms type 2).
Group 2 (Family farms type 2): In total, 360,242 holdings are classified as family farms type 2
(54.3% of the total sample)
(ii) If the number of AWU is less than 0.5, we consider holdings as engaged in agricultural
production as a minor activity (family farms type 1).
Group 1 (Family farms type 1): In total, 180,691 holdings are classified as family farms type 1
(27.2% of the total sample)
See graph 1 for a summary of the results.
4 Among those 1,772 holdings, 1,423 report more than 99% of wage labour.
7
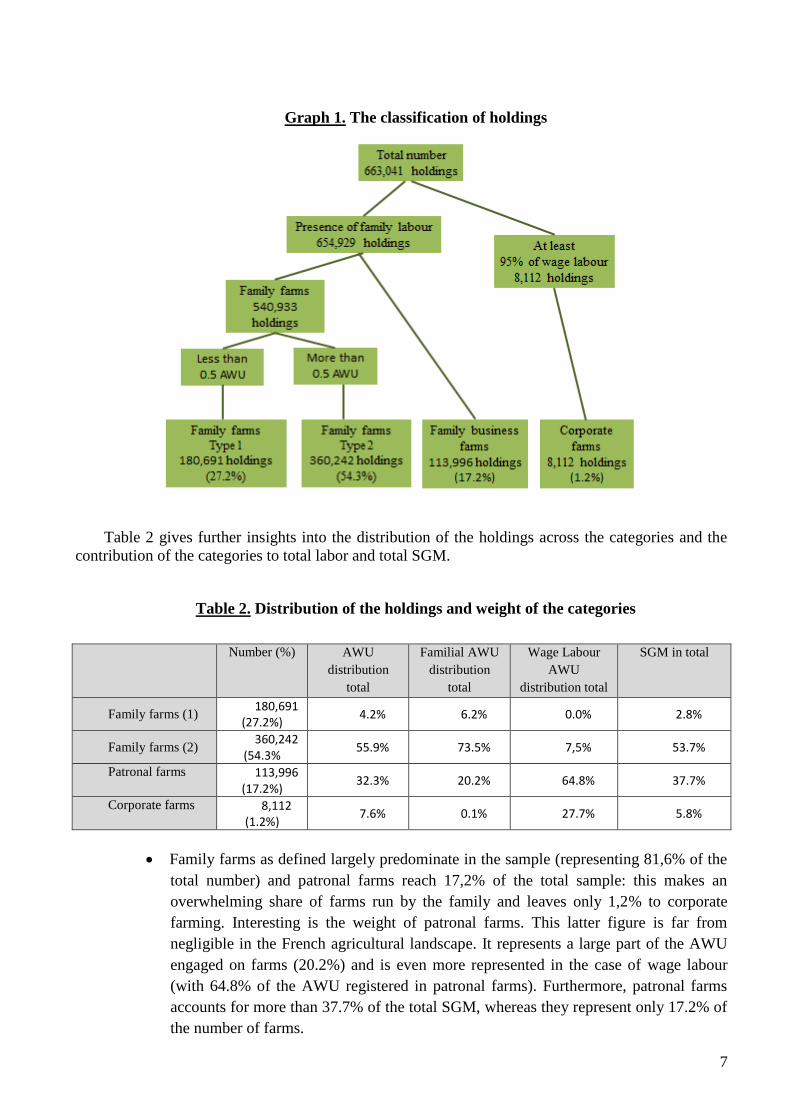
Graph 1. The classification of holdings
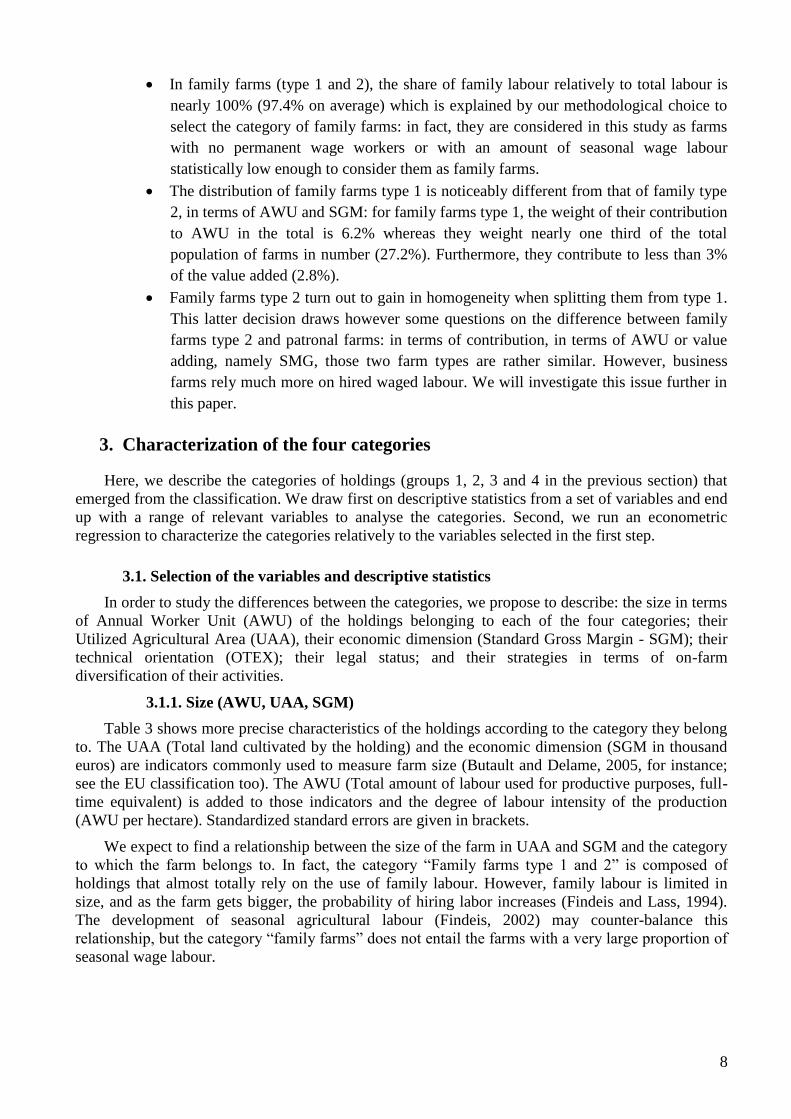
Table 2 gives further insights into the distribution of the holdings across the categories and the
contribution of the categories to total labor and total SGM.
Table 2. Distribution of the holdings and weight of the categories
Number (%) AWU
distribution
total
Familial AWU
distribution
total
Wage Labour
AWU
distribution total
SGM in total
Family farms (1) 180,691
(27.2%) 4.2% 6.2% 0.0% 2.8%
Family farms (2) 360,242
(54.3% 55.9% 73.5% 7,5% 53.7%
Patronal farms 113,996 (17.2%)
32.3% 20.2% 64.8% 37.7%
Corporate farms 8,112 (1.2%)
7.6% 0.1% 27.7% 5.8%
Family farms as defined largely predominate in the sample (representing 81,6% of the
total number) and patronal farms reach 17,2% of the total sample: this makes an
overwhelming share of farms run by the family and leaves only 1,2% to corporate
farming. Interesting is the weight of patronal farms. This latter figure is far from
negligible in the French agricultural landscape. It represents a large part of the AWU
engaged on farms (20.2%) and is even more represented in the case of wage labour
(with 64.8% of the AWU registered in patronal farms). Furthermore, patronal farms
accounts for more than 37.7% of the total SGM, whereas they represent only 17.2% of
the number of farms.
8
In family farms (type 1 and 2), the share of family labour relatively to total labour is
nearly 100% (97.4% on average) which is explained by our methodological choice to
select the category of family farms: in fact, they are considered in this study as farms
with no permanent wage workers or with an amount of seasonal wage labour
statistically low enough to consider them as family farms.
The distribution of family farms type 1 is noticeably different from that of family type
2, in terms of AWU and SGM: for family farms type 1, the weight of their contribution
to AWU in the total is 6.2% whereas they weight nearly one third of the total
population of farms in number (27.2%). Furthermore, they contribute to less than 3%
of the value added (2.8%).
Family farms type 2 turn out to gain in homogeneity when splitting them from type 1.
This latter decision draws however some questions on the difference between family
farms type 2 and patronal farms: in terms of contribution, in terms of AWU or value
adding, namely SMG, those two farm types are rather similar. However, business
farms rely much more on hired waged labour. We will investigate this issue further in
this paper.
3. Characterization of the four categories
Here, we describe the categories of holdings (groups 1, 2, 3 and 4 in the previous section) that
emerged from the classification. We draw first on descriptive statistics from a set of variables and end
up with a range of relevant variables to analyse the categories. Second, we run an econometric
regression to characterize the categories relatively to the variables selected in the first step.
3.1. Selection of the variables and descriptive statistics
In order to study the differences between the categories, we propose to describe: the size in terms
of Annual Worker Unit (AWU) of the holdings belonging to each of the four categories; their
Utilized Agricultural Area (UAA), their economic dimension (Standard Gross Margin - SGM); their
technical orientation (OTEX); their legal status; and their strategies in terms of on-farm
diversification of their activities.
3.1.1. Size (AWU, UAA, SGM)
Table 3 shows more precise characteristics of the holdings according to the category they belong
to. The UAA (Total land cultivated by the holding) and the economic dimension (SGM in thousand
euros) are indicators commonly used to measure farm size (Butault and Delame, 2005, for instance;
see the EU classification too). The AWU (Total amount of labour used for productive purposes, full-
time equivalent) is added to those indicators and the degree of labour intensity of the production
(AWU per hectare). Standardized standard errors are given in brackets.
We expect to find a relationship between the size of the farm in UAA and SGM and the category
to which the farm belongs to. In fact, the category “Family farms type 1 and 2” is composed of
holdings that almost totally rely on the use of family labour. However, family labour is limited in
size, and as the farm gets bigger, the probability of hiring labor increases (Findeis and Lass, 1994).
The development of seasonal agricultural labour (Findeis, 2002) may counter-balance this
relationship, but the category “family farms” does not entail the farms with a very large proportion of
seasonal wage labour.

9
Table 3. Descriptive statistics
UAA (ha) * SGM (1000 €)* AWU (total)* AWU per ha
Family farms (1) 5.9 (191%) 4.9 (196%) 0.2 (53%) 0.25 (485%)
Family farms (2) 52.5 (100%) 51.7 (92%) 1.4 (47%) 0.22 (1160%)
Family business 64.7 (131%) 114.36 (109%) 2.7 (97%) 0.42 (732%)
Corporate
agriculture 62.1 (125%) 246.91 (253%) 8.9 (201%) 2.04 (512%)
Total sample 42 (177%) 102.17 (195%) 1.4 (180%) 0.28 (922%)
* In parentheses standardized standard deviation (percentage of variation around the mean)
The statistics (Table 3) show that family farms are significantly smaller in terms of labour use
and total land area than both family business and corporate farms. However, family business and
corporate farms do not differ that much in terms of UAA, but the number of AWU is far higher for
corporate agriculture leading to a result in terms of labour intensity in favour of corporate holdings.
However, we can note a very high dispersion (standardized standard errors) in the latter case: in fact
the category of corporate holdings is highly heterogeneous: it entails large commercial companies as
well as small owners that produce on a recreational basis without being directly involved in the
production process (as in vineyard, in particular).
The amount of family labour is around 25% more important for patronal farms (1,4 vs 1,1) than
for family farms. It is worth mentioning that these patronal farms employ more family labour and
“produce” more than their equivalent in jobs through wage labour recruitment. Family farms with less
than 1 familial AWU represent 44.2% of the sample (among them 42% report that the household head
is retired); this proportion is less for patronal farms but not negligible as 32,1% of the farms have less
than 1 familial AWU (among them 22% with a retired household head). This proportion drops when
considering the threshold of 0.5 AWU (32% and 17.9% for family and patronal farms respectively).
Last, we see that corporate farms are much more labour intensive than business and family
farms. The distribution of AWU per ha is highly asymmetrical with a median at 0.04. We will come
back on this observation in the following section dealing with the technical orientation of the farms.
3.1.2 Technical orientation (OTEX)
It has been shown that production types that are highly labour-intensive tend to be those with
hired labour – seasonal or permanent (Benjamin et al., 1996; Benjamin and Kimhi, 2006). And hired
labour is the discriminant variable of the typology. The technical and economic orientation (OTEX) is
a tool that classifies the holdings into different types of production, specialized or mixed. We use the
two digit classification in order to keep a reasonable number of observations per production types and
furthermore aggregated some of the OTEX into larger homogenous categories for the sake of
readability. Table 4a presents the distribution of the entire sample over the categories and table 4b
disaggregate the results according to the groups “family farms type 1, “family farms type 2”, “family
business farms” and “corporate farms”:

10
Table 4a. Distribution by OTEX, total
Technical orientation (code) Total
Cereals and crops (13+14+81) 179916 (27%)
Horticulture (28+29) 15784 (2%)
Vineyards (37+38) 92304 (14%)
Fruits and permanent crops (39) 25305 (4%)
Dairy and mixed dairy (41+43) 87176 (13%)
Livestock (42) 77556 (12%)
Sheep and goats (44) 82456 (12%)
Poultry and pigs (50) 13104 (2%)
Polyculture (60+71+72) 64203 (9%)
Other mixed farms (82) 25237 (4%)
Total
663041 (100%)
Table 4b. Distribution of the typology by OTEX
Technical orientation (code): % Family farms
(1)
Family farms
(2)
Family
business
Corporate
farms
Cereals and crops (13+14+81): 100% 37048 (21%)
(21%) 108868(61%)
(30%) 32526 (18%)
(29%) 1474 (1%)
(18%)
Horticulture (28+29): 100% 109 (1%)
(0%) 7075 (45%)
(2%) 6532 (41%)
(6%) 1087 (7%)
(13%)
Vineyards (37+38): 100% 28996 (31%)
(16%) 27191 (29%)
(8%) 33732 (37%)
(30%) 2385 (3%)
(29%)
Fruits and permanent crops (39): 100% 9096 (36%)
(5%) 6759 (27%)
(2%) 8623 (34%)
(8%) 827 (3%)
(10%)
Dairy and mixed dairy (41+43): 100% 2386 (3%)
(1%) 76236 (87%)
(21%) 8341 (10%)
(7%) 213 (0%)
(3%)
Livestock (42): 100% 20205 (26%)
(11%) 52027 (67%)
(14%) 4972 (6%)
(4%) 352 (0%)
(4%)
Sheep and goats (44): 100% 42893 (52%)
(24%) 33416 (41%)
(9%) 5541 (7%)
(5%) 606 (1%)
(7%)
Poultry and pigs (50): 100% 1102 (8%)
(1%) 8098 (62%)
(2%) 3311 (25%)
(3%) 593 (5%)
(7%)
Polyculture - livestock (60+71+72): 100% 23931 (37%)
(13%) 31742 (49%)
(9%) 8086 (13%)
(7%) 444 (1%)
(5%)
Other mixed farms (82): 100% 13944 (55%)
(8%) 8830 (35%)
(0%) 2332 (9%)
(2%) 131 (1%)
(2%)
Total: 100%
180691 (27%)
(100%)
360242 (54%)
(100%)
113996 (17%)
(100%) 8112 (1%)
(100%)
Compared to the overall sample (table 4a)
11
we can see (table 4b) that especially vineyards, horticulture and permanent crops, “poultry and
pigs” are the sectors which are overrepresented in the categories of patronal and corporate
farms, and to a lower extent “cereals and crops”;
the distribution of the column “family farms type 2” is not extremely different from that of
the total sample, in fact family farms type 2 represent more than 50% of the sample and thus
are driving the distribution;
however, looking at the row distribution (per aggregated OTEX category), we see that family
farms type 2 accounts for 87% of the category “dairy and mixed dairy” and seems to be the
major insertion of this economic activity.
as what concerns family farms type 1, the categories “goats and sheep” and polyculture are
the most present; whereas those farms are very marginally engaged in horticulture. These
results will be further investigated in the next section.
3.1.3. Legal status
We identified the variable related to the legal status of farms as being relevant for interpreting the
type management which is at work on the French holdings. We built therefore on previous studies on
the topic (Bathélémy and Dussol, 2002 among others) that show that the legal status is related to the
size of the holding.
The French national Agricultural Census considers 8 categories of legal status. For the purpose
of this paper, we had to reconsider the original categories into larger groups. The Census
questionnaire for 2000 distinguishes between “individual farmers” and 7 other types of legal status.
What seems to be relevant in our case is an aggregate of different meaningful status into three
categories:
(i) Individual farm, that represents farms that are run by a single manager who is
considered as a juridical person.
(ii) Agricultural Company status: this category encompasses “collective” types of farm
management (such as GAEC5) and company status which are specific to the
agricultural sector (EARL, for instance). The term “collective” is used in the sense that
their management brings together at least two individuals.
(iii) Generic company status, i.e. Limited liability companies or public liability companies.
Looking at the legal status helps to check if corporate farms are more likely to operate under a
standard company status (non-specific to the agricultural sector); and to look into family and family
business farms that can operate under status specific to agriculture as well. We had a look at two
variables that were regarded as the most relevant proxies for the type of management (decision
making) at the holding level
5 GAEC for Groupement Agricole d’Exploitation en Commun, legal entities that gather individual persons into collective
units dedicated to agricultural production.

12
Table 5. Distribution of the typology by legal status
Individual
farm
Agricultural
company status
Generic
company status Total
Family farms (1) 178025 (99%)
(33.2%) 1431 (0.5%)
(1.2%) 1235 (0.5%)
(10.8%) 180,691 (100%)
(27.2%)
Family farms (2) 289359 (80%)
(53.9%) 67680 (19%)
(59.1%) 3203 (1%)
(28%) 360,242 (100%)
(54.3%)
Family business farms 68,843 (60%)
(12.8%) 42,215 (37%)
(36.8%) 2,938 (3%)
(25.7%) 113,996 (100%)
(17.2%)
Corporate farms 759 (9%)
(0.1%) 3,307 (41%)
(2.9%) 4,046 (50%)
(35.5%) 8,112 (100%)
(1.2%)
Total sample 536,986 (81%)
(100%) 114,633 (17%)
(100%) 11,412 (2%)
(100%) 663,031 (100%)
(100%)
Table 5 shows the repartition of the farms according to the categories related to labour and legal
status. The major part of the corporate farms are registered as generic companies (50%), whereas only
a small proportion of family and family business farms are generic companies (respectively 0,5%, 1%
and 3%). Nevertheless, we see that a large proportion of family business farms decided to opt for a
status specific to the agricultural sector (37%). In that respect, family farms type 2 relate more to
business farms (with 19% of them under agriculture specific status type) than family farms type 1 do
(with only 0.5% of the total having chosen this status). Individual farms are overwhelmingly found
among family farms type 1 (99% of them being concerned, and still 80% for type 2); however, family
business farms opt rather frequently for this status (60% of them).
3.1.4. On-farm on agricultural diversification of activities
We investigate in this section the linkage between on-farm diversification strategies and the type
of farm: on the one hand, family farms may be more diversified (as an option for survival) than
business or corporate farms (Aubert and Perrier-Cornet, 2009); on the other hand, business and
corporate farms may have an easier access to the capital needed to diversify.
We decided to aggregate some of the variables in order to build the typology (table 6):
diversified entails:
(i) direct sales to consumers, or –
(ii) on-farm processing of the product or
(ii) having an activity in relationship with tourism.

13
Table 6 Distribution of the typology according to on-farm non-agricultural diversification6
Not diversified Diversified Total
Family farms (1) 157,562 (87.2%)
(30%)
23,129 (12.8%)
(18%)
180,691 (100%) (27.2%)
Family farms (2) 293,961 (81.6%)
(55%)
66,281 (18.4%)
(50%)
360,242 (100%) (54.3%)
Family business
farms
75,578 (66.3%)
(14%)
38,418 (33.7%)
(29%)
113,996 (100%) (17.2%)
Corporate farms 4,566 (56.3%)
(1%)
3,546 (43.7%)
(3%)
8,112 (100%) (1.2%)
Total sample 531,667 (80.2%)
(100%)
131,374 (19.8%)
(100%)
663,031 (100%) (100%)
We can note the presence of a non-negligible part of family business farms in the category of the
diversified farms (respectively 12.8% and 18.4% for family farms type 1 and 2). Almost 50% of them
are concentrated in wine production due to processing component of the activity. And 13% of them
are engaged in mixed culture due to the activity of direct sales (present for 21% of the sub-sample).
However, the largest part of the diversified farms is found in family business farms and corporate
farms. And the results show that the farms which are the most probably diversified are corporate
farms.
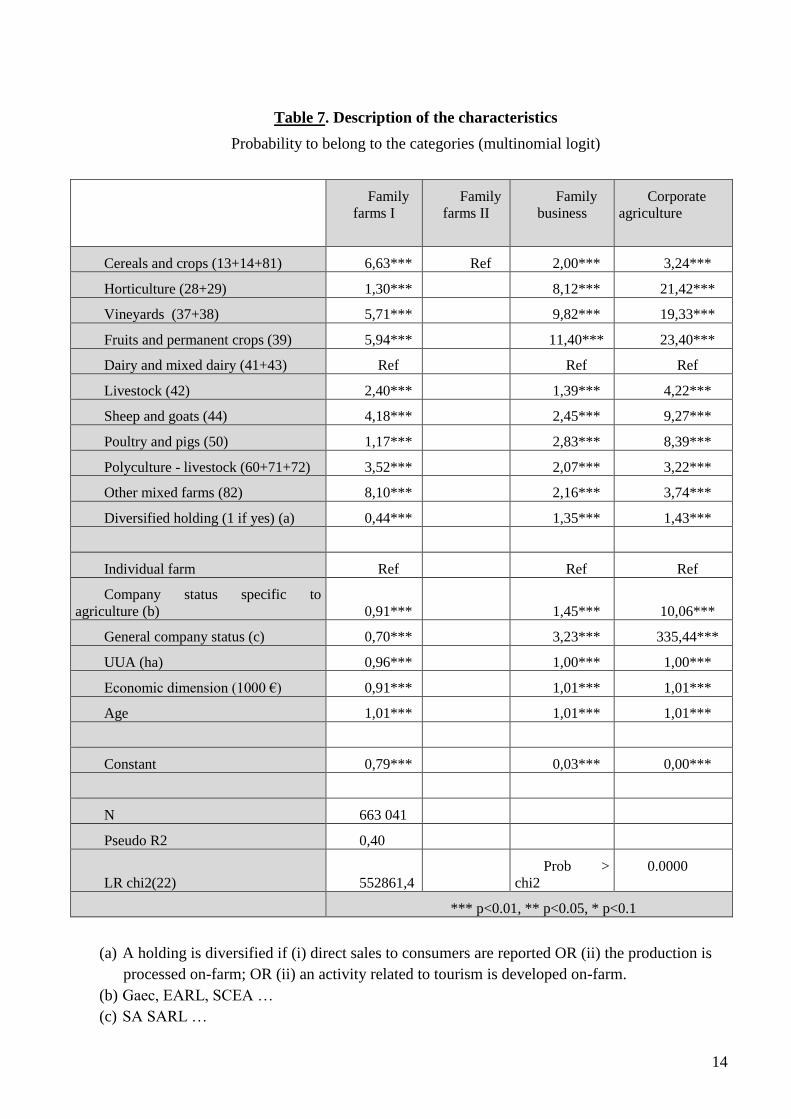
3.2. Description of the categories
In order to describe the joint influence of the variables presented in the preceding section on the
probability to belong to a specific category, we use a multinomial logit regression with the categories
as endogenous variable and the variables presented in the previous section as exogenous variables
(table 7). We performed a Hausman test for the assumption of independence of irrelevant alternatives.
We accept the independence but only weakly (10%) in the case of corporate agriculture.
The relative risk ratios (RRR) are reported in table 7 where the category of “family farms type 2”
is chosen as the reference category. As we consider a logistic regression, the odd of success is
. If the coefficient affected to one variable x is more than 1 for a category j,
then the variable has a positive effect on the probability to belong to j relatively to k (the reference
category). Moreover the odds of belonging to the category j is α times as large as belonging to
category k.
6 Accommodation ; cottages ; restoration ; crafts ; direct sales ; transformation, etc
14
Table 7. Description of the characteristics
Probability to belong to the categories (multinomial logit)
Family
farms I
Family
farms II
Family
business
Corporate
agriculture
Cereals and crops (13+14+81) 6,63*** Ref 2,00*** 3,24***
Horticulture (28+29) 1,30*** 8,12*** 21,42***
Vineyards (37+38) 5,71*** 9,82*** 19,33***
Fruits and permanent crops (39) 5,94*** 11,40*** 23,40***
Dairy and mixed dairy (41+43) Ref Ref Ref
Livestock (42) 2,40*** 1,39*** 4,22***
Sheep and goats (44) 4,18*** 2,45*** 9,27***
Poultry and pigs (50) 1,17*** 2,83*** 8,39***
Polyculture - livestock (60+71+72) 3,52*** 2,07*** 3,22***
Other mixed farms (82) 8,10*** 2,16*** 3,74***
Diversified holding (1 if yes) (a) 0,44*** 1,35*** 1,43***
Individual farm Ref Ref Ref
Company status specific to
agriculture (b) 0,91*** 1,45*** 10,06***
General company status (c) 0,70*** 3,23*** 335,44***
UUA (ha) 0,96*** 1,00*** 1,00***
Economic dimension (1000 €) 0,91*** 1,01*** 1,01***
Age 1,01*** 1,01*** 1,01***
Constant 0,79*** 0,03*** 0,00***
N 663 041
Pseudo R2 0,40
LR chi2(22) 552861,4
Prob >
chi2
0.0000
*** p<0.01, ** p<0.05, * p<0.1
(a) A holding is diversified if (i) direct sales to consumers are reported OR (ii) the production is
processed on-farm; OR (ii) an activity related to tourism is developed on-farm.
(b) Gaec, EARL, SCEA …
(c) SA SARL …
15
The results (table 7) show that:
First, the importance of the economic and technical orientations is essential: in reference to the
category “Dairy and mixed dairy”, family farms type 2 are less represented in the major part of other
the categories. In particular, the coefficients related to being engaged in horticulture, vineyards and
permanent crops are far higher than others, suggesting that those categories are mostly occupied by
business and corporate farms.. Polyculture is highly represented in small farms (family farms type 1).
The production of sheeps and goats too.
Second, farms that diversify towards on-farm non-agricultural production are more likely to
belong to the categories of family business and corporate farms than to those of family farming
(RR=1.35 and 1.43 respectively). However the differential is not high relatively to other coefficients,
especially concerning the OTEX. This seems to be due to two trends: first, family business and
corporate farms are more likely to access the working capital needed to develop on-farm non-
agricultural activities (especially direct sales and processing); however, on-farm diversification of
activities may be an option for the survival of small family farms (Aubert and Perrier-Cornet, 2009).
Nonetheless, diversification of activities increases the need for labour (Capt and Dussol, 2004).
Third, we see that the legal status widely differ according to the farm category. Commercial
companies with a generic legal status (LLC, PLC …) are more likely to be observed in the categories
of family business or corporate farms than in family farms type 2. However, table 7 shows that
companies with a status specific to agriculture are not highly different in the category of family
business farms than in family farms 2 (RRR=1.45). This may be due to the fact that status specific to
agriculture entail corporate organizations (GAEC) as a company type that encompass co-workers,
every though they remain family farms. The same direction is observed for family farms type 1 that
are, with that respect, not much different from those from type 2 (RRR=0.91)
Fourth, the dimension of the farm has not a large influence on the category the farm belongs to.
We distinguished between physical (AWU in hectares) and economic (SGM) dimensions. Neither
one or the other turns out to influence the chance to belong to any category (family farms 2 being the
reference), when controlling for the technical and economic orientation.
Last, the age of the family head does not seem to have any influence on the category to which
farms belong: in particular, we may have thought that retired family heads are running the small
family farms type 1. When controlling for other variables, such a result does not come out.
4. Conclusions
We proposed a typology of French agricultural holdings based on agricultural labour. We
distinguished thereby between family labour and permanent and seasonal hired wage labour in order
to split the sample into four categories: family holdings with limited labour implication, family
holdings with a larger labour implication, family business farms and corporate farms.
We then characterized the four categories. We find that (i) the technical and economic orientation
is essential to understand the insertion of the farm in each of the category. In particular, seasonal
labour intensive sectors (vineyards, horticulture) are more probably found in business and corporate
farms. Year-long labour-intensive sectors (“dairy”, “sheep and goats”) are found in family types of
farms; (ii) the on-farm diversification towards non-agricultural activities is mostly observed in family
business and corporate farms; (iii) farm size – physical (ha) and economic (SGM)– does not seem to
be a determinant of belonging to any of the categories we propose, when controlling for others
factors.
Beyond the results commonly found in the empirical literature, this analysis based on a proposal
for a typology opens a range of questions: First, the heterogeneity of the groups we propose may be
further investigated: even though farms fall in the same category, their characteristics and the
16
strategies of their owners or operators are different; second, some of the results on the technical and
economic orientation (OTEX) are not always intuitive, like that on the category “poultry and pigs”
and that of horticulture in contrast to vineyards and “permanent fruit crops”; third, the on-farm
diversification of activities shows that the influence in terms of labour demand is a key point Then we
were limited by the nature of Census data on diversification in agriculture, while the household
dimension with labour outside agriculture might be key to understand the rationale of the different
categories.
References
Aubert M. and P. Perrier-Cornet, 2009, “Is there a future for small farms in developed countries?
Evidence from the French case“, Agricultural Economics, 40 (s1): 773-787.
Barrett C., M. Bellemare and J. Hou, 2010, “Reconsidering Conventional Explanations of the
Inverse Productivity–Size Relationship”, World Development, 38(1): 88-97
Barthélémy D. and AM Dussol, 2002, “Sociétés agricoles : entre modernité et tradition”,
AGRESTE Cahiers n° 2
Bélières, J.-F., Bonnal, P., Bosc, P. M., Losch, B. and Sourisseau, J.-M., 2013. “Les agricultures
familiales du monde: Définitions, contributions et politiques publiques“. Rapport d’étude, Mai 2013,
AFD, MAEE et MAAF, CIRAD
file:///C:/Users/bosc/Downloads/20130711_Rapport_final_MAAF_MAE_AFD_AF_CIRADBIS_31_Mai_complet_
cle0197b5%20(2).pdf
Benjamin C., Corsi A. and Guyomard H., 1996, "Modelling labour decisions of French
agricultural households." Applied Economics, 28: 1577-1589
Benjamin C. and Kimhi A., 2006, "Farm work, off-farm work, and hired farm labour: estimating
a discrete-choice model of French farm couples' labour decisions." European Review of Agricultural
Economics, 33: 149-171
Brookfield H, Parsons H., 2007. Family farms : survival and prospects. A world wide analysis.
Routledge Studies in Human Geography. Routledge, 250 pages.
Brookfield H., 2008. Family Farms Are Still Around: Time to Invert the Old Agrarian Question.
Geography Compass, 2 (1): 108-126. doi:10.1111/j.1749-8198.2007.00078.x
Butault JP and N. Delame, 2005, “Concentration de la production agricole et croissance des
exploitations“, Economie et Statistiques (390) : 47–64 Capt D. and AM Dussol, 2004, “Exploitations diversifiées : un contenu en emploi plus élevé“, AGRESTE Cahiers
(2) : 11-18
Chayanov A. V., 1923 [1990]. L’Organisation de l’économie paysanne. Paris, Librairie du
Regard, 344 p. Darpeix A., Bignebat C. and Perrier-Cornet P., 2013, “Demand for seasonal wage labour in agriculture: what
does family farming hide? “, Journal of agricultural economics, 64(3) online view.
Deere, C. D. and de Janvry, A., 1979. “A Conceptual Framework for the Empirical Analysis of
Peasants”. American Journal of Agricultural Economics, 61 (4): 601-611.
Djurfeldt G., 1996. Defining and Operationalizing Family Farming from a Sociological
Perspective. Sociologia Ruralis, 36 (3): 340-351. doi:10.1111/j.1467-9523.1996.tb00026.x Eastwood, R., M. Lipton and A. Newell, 2010, “Farm size” In: P. Pingali and R. Evenson Handbook of
Agricultural Economics, Vol. 4, Elsevier: 3323-3397

17
Eswaran M. and A. Kotwal, 1986, “Access to Capital and Agrarian Production Organization”, Economic
Journal, 96: 482-498.
FAO, 2012. Monitoring Structural Changes in Agriculture – Informing policy dialogue -
Methodological Framework Version 2.8. Rome, Italy
Findeis, J., 2002, The dynamics of hired farm labor: Constraints and community responses.
CABI Publishing, New York.
Findeis, J. and Lass, D., 1994, “Labor decisions by agricultural households: Interrelationships
between off-farm labor supply and hired labor demand”. Working Paper, Population Research
Institute, The Pennsylvania State University.
Frisvold G., 1994, “Does supervision matter? Some hypothesis tests using Indian farm-level data”, Journal of
Development Economics, 43(2): 217–238.
Hill B., 1993. The ‘myth’ of the family farm: Defining the family farm and assessing its importance in the
European community. Journal of Rural Studies, 9 (4): 359-370. doi:10.1016/0743-0167(93)90048-o
Lamarche 1994. L’agriculture familiale : du mythe à la réalité, Tome 2 L’Harmattan, Paris.,
Marx, K., 1988. “Peasantry as a class”. In Shanin T. (Ed) Peasant and peasant societies. Penguin
Books, London, UK : 331-337
Mendras, H., 1976. Sociétés paysannes. Eléments pour une théorie de la paysannerie, Armand
Colin Coll. U, Paris 238p.
Mundlak, Y., 2001, “Production and supply”. In: P. Pingali and R. Evenson Handbook of
Agricultural Economics, Vol. 1A, Elsevier:.
Otsuka, K., 2008. “Peasants”, in S. N. Durlauf, L. E. Blume (eds.), The New Palgrave Dictionary
of Economics, Basingstoke: Palgrave Macmillan.
Thorner, D., 1988. “Peasant economy as a category in history”. In Shanin T. (Ed) Peasant and
peasant societies. Penguin Books, London, UK : 62-68
Wolf E., 1966. Peasants. Englewood Cliffs: Prentice-Hall, Foundations of Modern Anthropology
Series, 166 p.
Related Documents