BGD 8, 3289–3321, 2011 A laboratory experiment of intact polar lipid degradation J. Logemann et al. Title Page Abstract Introduction Conclusions References Tables Figures Back Close Full Screen / Esc Printer-friendly Version Interactive Discussion Discussion Paper | Discussion Paper | Discussion Paper | Discussion Paper | Biogeosciences Discuss., 8, 3289–3321, 2011 www.biogeosciences-discuss.net/8/3289/2011/ doi:10.5194/bgd-8-3289-2011 © Author(s) 2011. CC Attribution 3.0 License. Biogeosciences Discussions This discussion paper is/has been under review for the journal Biogeosciences (BG). Please refer to the corresponding final paper in BG if available. A laboratory experiment of intact polar lipid degradation in sandy sediments J. Logemann 1,* , J. Graue 1,* , J. K ¨ oster 1 , B. Engelen 1 , J. Rullk ¨ otter 1 , and H. Cypionka 1 1 Institute for Chemistry and Biology of the Marine Environment (ICBM), Carl von Ossietzky University of Oldenburg, P.O. Box 2503, 26111 Oldenburg, Germany * These authors contributed equally to this work. Received: 7 March 2011 – Accepted: 14 March 2011 – Published: 24 March 2011 Correspondence to: J. Logemann ([email protected]) Published by Copernicus Publications on behalf of the European Geosciences Union. 3289

Welcome message from author
This document is posted to help you gain knowledge. Please leave a comment to let me know what you think about it! Share it to your friends and learn new things together.
Transcript

BGD8, 3289–3321, 2011
A laboratoryexperiment of intact
polar lipiddegradation
J. Logemann et al.
Title Page
Abstract Introduction
Conclusions References
Tables Figures
J I
J I
Back Close
Full Screen / Esc
Printer-friendly Version
Interactive Discussion
Discussion
Paper
|D
iscussionP
aper|
Discussion
Paper
|D
iscussionP
aper|
Biogeosciences Discuss., 8, 3289–3321, 2011www.biogeosciences-discuss.net/8/3289/2011/doi:10.5194/bgd-8-3289-2011© Author(s) 2011. CC Attribution 3.0 License.
BiogeosciencesDiscussions
This discussion paper is/has been under review for the journal Biogeosciences (BG).Please refer to the corresponding final paper in BG if available.
A laboratory experiment of intact polarlipid degradation in sandy sediments
J. Logemann1,*, J. Graue1,*, J. Koster1, B. Engelen1, J. Rullkotter1, andH. Cypionka1
1Institute for Chemistry and Biology of the Marine Environment (ICBM), Carl von OssietzkyUniversity of Oldenburg, P.O. Box 2503, 26111 Oldenburg, Germany*These authors contributed equally to this work.
Received: 7 March 2011 – Accepted: 14 March 2011 – Published: 24 March 2011
Correspondence to: J. Logemann ([email protected])
Published by Copernicus Publications on behalf of the European Geosciences Union.
3289

BGD8, 3289–3321, 2011
A laboratoryexperiment of intact
polar lipiddegradation
J. Logemann et al.
Title Page
Abstract Introduction
Conclusions References
Tables Figures
J I
J I
Back Close
Full Screen / Esc
Printer-friendly Version
Interactive Discussion
Discussion
Paper
|D
iscussionP
aper|
Discussion
Paper
|D
iscussionP
aper|
Abstract
Intact polar lipids (IPLs) are considered biomarkers for living biomass. Their degrada-tion in marine sediments, however, is poorly understood and complicates interpretationof their occurrence in geological samples. To investigate the turnover of IPLs, a degra-dation experiment with anoxic sandy sediments from the North Sea was conducted.5
Intact cells of two organisms that do not naturally occur in North Sea sediments werechosen as IPL sources: (i) Saccharomyces cerevisiae, representative for ester-boundacyl lipids that also occur in Bacteria, and (ii) the archaeon Haloferax volcanii, repre-sentative for ether-bound isoprenoid lipids. Surprisingly, IPLs with phosphoester-boundhead groups showed approximately the same degradation rate as IPLs with glycosidic10
head groups. Furthermore, the results indicate a relatively fast degradation of S. cere-visiae IPLs with ester-bound moieties (analogs of bacterial membrane lipids) and nosignificant degradation of archaeal IPLs with ether-bound moieties. Pore water and16S rRNA-based DGGE analysis showed only a minor influence of the IPL sourceon microbial metabolism and community profiles. Due to our results, the IPL-based15
quantification of Archaea and Bacteria should be interpreted with caution.
1 Introduction
Intact polar lipids (IPLs) have widely been used as biomarkers for living organismsin sediments and water columns for several years (e.g. Zink et al., 2003; Sturt et al.,2004; Biddle et al., 2006; Ertefai et al., 2008; Rossel et al., 2008). Additionally, IPLs20
are applied as chemotaxonomic markers as some of these molecules are represen-tative for specific microbial clades. The chemotaxonomic information of IPLs is basedon the combination of various head groups with different side chains that are attachedto a glycerol backbone by two different bonding types. In general, bacterial and eu-karyal cytoplasma membranes contain intact polar lipids with unbranched ester-bound25
fatty acid moieties. In contrast, archaeal IPLs contain ether-bound isoprenoid moieties.
3290

BGD8, 3289–3321, 2011
A laboratoryexperiment of intact
polar lipiddegradation
J. Logemann et al.
Title Page
Abstract Introduction
Conclusions References
Tables Figures
J I
J I
Back Close
Full Screen / Esc
Printer-friendly Version
Interactive Discussion
Discussion
Paper
|D
iscussionP
aper|
Discussion
Paper
|D
iscussionP
aper|
This difference between bacterial and archaeal IPLs is used to quantify Bacteria andArchaea in sediments and water samples (e.g. Rossel et al., 2008). Thus, IPL analysisis valuable as an alternative or complementary technique to standard microbiologicalmethods. On a higher chemotaxonomic level ammonia-oxidizing bacteria can be iden-tified by the presence of ladderane lipids (Kuypers et al., 2003; Sinninghe Damste et5
al., 2005). Intact polar lipids with mixed ether/ester-bound moieties attached to theglycerol backbone were found in some strains of sulfate-reducing bacteria (Rutters etal., 2001). Separate δ13C analysis of polar head groups or unpolar core lipids of IPLscan also be used to gain information on the metabolism of their producers (Lin et al.,2010; Takano et al., 2010).10
However, one fundamental assumption underlies most of these applications: Intactpolar lipids are considered to degrade rapidly after cell death (White et al., 1979; Har-vey et al., 1986). Harvey et al. (1986) examined the degradation of both, a glycosidicether lipid and ester-bound phospholipids. Based on their findings the authors as-sumed that intact polar lipids with glycosidic head groups show a higher stability against15
degradation than intact polar lipids with phosphoester head groups. Based on the re-sults of Harvey et al. (1986) modeling was used by Lipp et al. (2009) and Schoutenet al. (2010) to assess the potential preservation of fossilized IPLs of planktonic originduring sediment burial.
The quantification of Bacteria and Archaea in the deep marine biosphere by IPL20
analysis and fluorescence in situ hybridization (FISH) in comparison to catalyzed re-porter deposition fluorescence in situ hybridization (CARD-FISH) and quantitative poly-merase chain reaction (q-PCR) analysis is controversially discussed in several studies(e.g. Biddle et al., 2006; Lipp et al., 2008). A reason for the contradictory abundancesof Archaea and Bacteria in these studies may be that ether-bound archaeal IPLs are25
more stable than their ester-bound bacterial counterparts, which in turn may lead toan overestimation of archaeal cell numbers. However, the lack of a broad study onthe degradation of intact polar lipids, which includes lipids with phosphoester and gly-cosidic bound head groups as well as ester and ether bound moieties, that occur in
3291

BGD8, 3289–3321, 2011
A laboratoryexperiment of intact
polar lipiddegradation
J. Logemann et al.
Title Page
Abstract Introduction
Conclusions References
Tables Figures
J I
J I
Back Close
Full Screen / Esc
Printer-friendly Version
Interactive Discussion
Discussion
Paper
|D
iscussionP
aper|
Discussion
Paper
|D
iscussionP
aper|
Bacteria and Archaea respectively, makes it necessary to revisit the degradation ofIPLs to ensure the robustness of this proxy.
We designed a degradation experiment to answer three general questions: Whatare the degradation rates of IPLs? Are there differences between ester- and ether-bound intact polar lipids and what is the influence of the bonding type of the head5
group upon lipid degradation? How does the microbial community change over timeand what are the main degradation products? The main degradation experiment wasaccompanied by two controls: The first control was intended to assess any processesthat are not mediated by microorganisms and lead to the degradation of the addedIPLs. This control is subsequently named “abiotic control”. The second control was10
used to investigate the influence of the addition of inactive biomass on the microbialcommunity and to monitor the development of the microbial community without anyfurther substrate addition under laboratory conditions. This control is subsequentlynamed “untreated control”.
2 Material and methods15
2.1 Experimental setup
The incubation vessels for the degradation experiment and the untreated control had atotal volume of 2.5 l each and were filled with 3 kg wet sediment (water content 20% wt).The sediment used in this experiment had been freshly collected in November 2009 onthe Janssand, a tidal flat located approximately 3 km south of Spiekeroog island, North20
Sea, Germany (53◦44.178′ N and 07◦41.974′ E). For sampling, the top cm of the oxicsurface sediment was removed until only black anoxic sediment was visible. The un-derlying sediment was transferred into plastic containers that were sealed by a lid,transported to the laboratory and stored at 4 ◦C for one week prior to further use. Thetotal organic carbon (TOC) content was 0.23%. It was calculated as the difference25
between total carbon (Vario EL Cube, Elementar Analysensysteme GmbH, Germany)
3292

BGD8, 3289–3321, 2011
A laboratoryexperiment of intact
polar lipiddegradation
J. Logemann et al.
Title Page
Abstract Introduction
Conclusions References
Tables Figures
J I
J I
Back Close
Full Screen / Esc
Printer-friendly Version
Interactive Discussion
Discussion
Paper
|D
iscussionP
aper|
Discussion
Paper
|D
iscussionP
aper|
and inorganic carbon (analyzed in a UIC CO2 coulometer). A total of 2.5 g Saccha-romyces cerevisiae biomass (elemental composition: 45.1% C, 7.9% H, 7.9% N and0.4% S; % of dry mass) as source for ester-bound IPLs and 1.25 g of Haloferax vol-canii (18.9% C, 3.6% H, 4.7% N and 0.7% S; % of dry mass) as source for ether-boundIPLs were added to the sediment in the incubation vessels used to study IPL degrada-5
tion. The experimental parameters for the untreated control were the same as for thedegradation experiment but no inactive cell material was added. To prevent contamina-tion with microorganisms due to frequent sampling in the abiotic control, 100 ml bottlesinstead of one 2.5 l incubation vessel were used. The bottles contained 50 g of sedi-ment, 50 mg, dry mass inactive biomass of S. cerevisiae and 25 mg, dry mass inactive10
H. volcanii biomass and were closed with rubber stoppers. The incubation vessels ofthe abiotic control were autoclaved after addition of the intact polar lipid containing cellmaterial.
2.2 Source material for intact polar lipids
As source for intact polar lipids two different organisms were used which do not oc-15
cur in the North Sea sediment. As source for ether-derived IPLs a pure culture ofHaloferax volcanii (DSM No. 16227) was grown at 37 ◦C in “Haloferax sulfurifontismedium” (DSMZ No. 1018). This archaeon provided two kinds of structurally differentmolecules – first, two IPLs with ether-bound isoprenoid moieties (PGP-Me, PG; Fig. 1)and a phosphoester head group and second, one IPL with ether-bound isoprenoid20
moieties and a glycosidic head group (S-GL-1; Fig. 1). The cells were harvested atthe end of the exponential growths phase. None of the H. volcanii IPLs occur in thenatural sediment and thus all of them could be used as tracers to monitor the degrada-tion of ether-bound IPLs. Commercially available Saccharomyces cerevisiae (baker’syeast; Fala GmbH, Germany) was used as source for IPLs with ester-bound acylic25
moieties and phosphoester head groups. S. cerevisiae cells harbour a broad varietyof IPLs which were partly used as tracers because these IPLs were not synthetizedby the natural sediment microbial community. The S. cerevisiae and the harvested
3293
BGD8, 3289–3321, 2011
A laboratoryexperiment of intact
polar lipiddegradation
J. Logemann et al.
Title Page
Abstract Introduction
Conclusions References
Tables Figures
J I
J I
Back Close
Full Screen / Esc
Printer-friendly Version
Interactive Discussion
Discussion
Paper
|D
iscussionP
aper|
Discussion
Paper
|D
iscussionP
aper|
archaeal cells were freeze dried and stored at −20 ◦C. Before use in the experiment,H. volcanii and S. cerevisiae cells were pasteurized at 100 ◦C for 30 min. Thereafter,part of the cells was transferred to fresh medium (“Haloferax sulfurifontis medium” andyeast extract medium, respectively) and analyzed for growth to exclude that the cellsare still alive and able to grow. Identification of S. cerevisiae lipids was achieved by5
HPLC-MS/MS experiments and by comparison to commercially available standards.The lipids of H. volcanii were identified by MS/MS experiments and comparison withpublished results of lipid structures (Sprott et al., 2003). In this experiment we moni-tored the concentrations of 16 intact polar lipids −13 ester-bound and 3 ether-boundones.10
2.3 Incubation parameters and sampling
After starting the experiment, the incubation vessels were stored at room temperaturein the dark. Before sampling, the sediment was homogenized for a minimum of 20 minon a mixing device. Head-space gas samples were taken with a syringe directly beforesampling the sediment. For sediment and pore water sampling, the incubation vessels15
were transferred into a glove box with an oxygen-free nitrogen (99%) and hydrogen(1%) atmosphere. Samples were taken as triplicates, aliquots of 8–12 g sediment forIPL analysis and 3–5 g sediment for RNA extraction. Pore water (1–2 ml) was extractedwith rhizones (Rhizon CSS 5 cm, Rhizosphere Research Products, Wageningen, theNetherlands) from the samples that were collected for IPL analysis. Previous inves-20
tigations had ensured the absence of IPLs in the pore water samples. Until furtherprocessing, all samples were stored at −20 ◦C. The samples for RNA extraction werekept at −80 ◦C. After sampling, the head space of the incubation vessels was flushedwith nitrogen to remove traces of hydrogen that was used in the glove box to sustainthe oxygen-free atmosphere.25
3294

BGD8, 3289–3321, 2011
A laboratoryexperiment of intact
polar lipiddegradation
J. Logemann et al.
Title Page
Abstract Introduction
Conclusions References
Tables Figures
J I
J I
Back Close
Full Screen / Esc
Printer-friendly Version
Interactive Discussion
Discussion
Paper
|D
iscussionP
aper|
Discussion
Paper
|D
iscussionP
aper|
2.4 Lipid extraction
The wet sediments were extracted using a modified Bligh & Dyer method accordingto Sturt et al. (2004). In the first three extraction steps, a single-phase mixture ofmethanol, dichloromethane and phosphate buffer (2:1:0.8, v/v/v) was used. In the fol-lowing three extraction steps, trichloroacetic acid was used instead of phosphate buffer.5
The combined extracts were collected in a separatory funnel. Phase separation wasachieved by addition of dichloromethane and water to a final mixture of 1:1:0.9 (v/v/v,methanol, dichloromethane, aqueous phase). The organic phase containing the IPLswas removed and the aqueous phase was washed three times with dichloromethane.The dry extracts were stored in a freezer at −20 ◦C until further use.10
2.5 HPLC-MS
Intact polar lipids were analyzed by HPLC (2695 separation module, Waters, Mil-fort, USA) coupled to a time-of-flight mass spectrometer equipped with an electro-spray source (Micromass, Q TOF micro, Waters, Milfort, USA). HPLC separation wasachieved on a diol phase (Lichrospher100 Diol 5 µ, CS – Chromatographie Service,15
Langerwehe, Germany) using a 2×125 mm column. A flow rate of 0.35 ml min−1 wasemployed with the following solvent gradient: 1 min 100% A, increasing over 20 min to35% A, 65% B using a concave curvature, followed by 40 min of reconditioning (Rutterset al., 2001). Eluent A was a mixture of n-hexane, i-propanol, formic acid and a solutionof 25% ammonia in water (79:20:1.2:0.04 by volume), eluent B was ipropanol, water,20
formic acid and a solution of 25% ammonia in water (88:10:1.2:0.04 by volume). Afteraddition of an injection standard (O-PE, phosphatidyl ethanolamine diether with twoC16 acyl moieties), the extracts were dissolved in the starting eluent and directly ana-lyzed. In this study, we exclusively report the change of those compounds that wereadded with the inactive cell material and did not occur in the natural sediment. Due25
to the lack of analytical standards for the archaeal glycolipids used, it was not possi-ble to determine the absolute concentrations of these compounds. Instead, ratios of
3295

BGD8, 3289–3321, 2011
A laboratoryexperiment of intact
polar lipiddegradation
J. Logemann et al.
Title Page
Abstract Introduction
Conclusions References
Tables Figures
J I
J I
Back Close
Full Screen / Esc
Printer-friendly Version
Interactive Discussion
Discussion
Paper
|D
iscussionP
aper|
Discussion
Paper
|D
iscussionP
aper|
peak areas of the monitored compounds to the peak area of the injection standard foreach sample were calculated. Subsequently, the calculated values are named relativeconcentrations. Since all samples had the same matrix background, this procedureshould give reasonable results without any influence of changing ionization. The an-alytical error varied between 0.5 and 7% depending on the investigated IPL and was5
determined by repeated analysis of the same samples taken at three different times.The limit of detection in general depends on the ionization efficiency for every analyzedcompound and typically lies between 2–10 ng per injection and IPL for the used massspectrometer (Micromass Q-TOF micro, Waters, Milfort, USA).
2.6 Chemical analyses of microbial metabolites10
Concentrations of fermentation products in the pore water were analyzed by high-performance liquid chromatography (Sykam, Furstenfeldbruck, Germany) using anAminex HPX-87H column (Biorad, Munchen, Germany) at 60 ◦C. The eluent was5 mM H2SO4 at 0.5 ml min−1. Organic acids were detected by an UV-VIS detector(UVIS 204; Linear Instruments, Reno, USA) at 210 nm. Alcohols were detected by15
a refractive-index detector (Knauer, Berlin, Germany). Prior to injection, the pore wa-ter was filtered through a 2 µm filter. Sulfate concentrations were measured by an ionchromatograph (Sykam, Furstenfeldbruck, Germany) with an anion separation column(LCA A24; Sykam, Furstenfeldbruck, Germany) at 60 ◦C followed by conductivity detec-tion. The eluent consisted of 0.64 g sodium carbonate, 0.2 g sodium hydroxide, 150 ml20
ethanol and 2 ml modifier (0.1 g 4-hydroxybenzonitrile/10 ml methanol) filled up to 1 lwith distilled water. The flow rate was set to 1.2 ml min−1. Prior to analysis the sampleswere 1 to 100 diluted in eluent without modifier. The concentrations of gaseous com-pounds were determined by an 8610C gas chromatograph (Schambeck SFD GmbH,Honnef, Germany). Analysis was carried out with argon (1 ml/min) as carrier gas and at25
a column oven temperature of 40 ◦C. For analysis of molecular hydrogen and methanea molecular sieve 13X packed column was used, whereas carbon dioxide was sepa-rated by a HayeSep D packed column. A thermal conductivity detector (256 ◦C) and a
3296
BGD8, 3289–3321, 2011
A laboratoryexperiment of intact
polar lipiddegradation
J. Logemann et al.
Title Page
Abstract Introduction
Conclusions References
Tables Figures
J I
J I
Back Close
Full Screen / Esc
Printer-friendly Version
Interactive Discussion
Discussion
Paper
|D
iscussionP
aper|
Discussion
Paper
|D
iscussionP
aper|
flame ionization detector (380 ◦C) were connected in series for detection of the gases.Sulfide concentrations were determined photometrically as described by Cord-Ruwischet al. (1985). The pH was adjusted at each sampling point to values between 7 and7.5 by addition of hydrochloric acid. Hydrogen sulfide was expelled by flushing theheadspace with CO2. After each CO2 flushing the headspace was replaced with N2.5
2.7 Determination of total cell numbers
Total cell counts were obtained after SYBR Green I staining according to a protocolof Lunau et al. (2005), which was adapted to sediment samples. For sample fixation,0.5 cm3 of sediment was transferred to 4.5 ml of fixing solution (63 ml distilled water,30 ml methanol, 2 ml of 25% aqueous glutardialdehyde solution, 5 ml Tween 80) and10
incubated at room temperature overnight. For detaching cells from particles, the sedi-ment slurries were incubated for 15 min at 35 ◦C in an ultrasonic bath (35 kHz, 2×320 Wper period; Sonorex RK 103 H, Bandelin, Morfelden-Walldorf, Germany). Homoge-nized aliquots of 20 µl were equally dispensed on a clean microscope slide in a squareof 20×20 mm. The slide was dried on a heating plate at 40 ◦C. A drop of 12 µl staining15
solution (190 µl Moviol, 5 µl SYBR Green I, 5 µl 1 M ascorbic acid in TAE buffer) wasplaced in the center of a 20×20 mm coverslip, which was then placed on the sedimentsample. After 10 min of incubation, 20 randomly selected fields or at least 400 cellswere counted for each sediment sample by epifluorescence microscopy.
2.8 RNA extraction and quantification20
Total RNA was extracted from 1 g sediment using the AllPrep DNA/RNA Mini Kit (Qia-gen, Hilden, Germany) according to the manufacturer’s instructions. For cell disruption,1 g sediment and 1 ml RLT Buffer were added to 1 g glass beads (0.18 mm diameter,Sartorius, Gottingen, Germany). Samples were homogenized for 90 s using a MiniBeadbeater (Biospec Products, Bartlesville, USA). For quantification, 100 µl of Ribo-25
Green (Invitrogen, Eugene, USA) solution (diluted 1:200 in TE buffer; pH 7.5) were
3297

BGD8, 3289–3321, 2011
A laboratoryexperiment of intact
polar lipiddegradation
J. Logemann et al.
Title Page
Abstract Introduction
Conclusions References
Tables Figures
J I
J I
Back Close
Full Screen / Esc
Printer-friendly Version
Interactive Discussion
Discussion
Paper
|D
iscussionP
aper|
Discussion
Paper
|D
iscussionP
aper|
added to 100 µl of RNA extract (each sample diluted 1:100 in TE buffer; pH 7.5) andtransferred to a microtiter plate. Serial dilutions (200 ng µl−1 to 1 ng µl−1) of E. coli16S and 23S ribosomal-RNA (Roche, Grenzach-Wyhlen, Germany) were treated asdescribed above and served as a calibration standard in each quantification assay.Fluorescence was measured at an excitation of 485 nm and an emission of 520 nm.5
2.9 Quantitative reverse transcription PCR (qRT-PCR)
Bacterial and archaeal 16S rRNA gene copy numbers were determined by quantita-tive reverse-transcription PCR using the OneStep RT-PCR Kit (Qiagen, Hilden, Ger-many). The primer pairs 519f/907r and s D Arch 0025-a-S-17/s-D-Arch-0344-a-S-20were used to quantify bacterial and archaeal RNA, respectively. Primer sequences10
for these two domains are given in Wilms et al. (2007). Each 25 mul PCR reactioncontained 15.9 µl nuclease-free water, 5× RT-PCR Buffer (Qiagen, Hilden, Germany),0.4 mM dNTP Mix (Qiagen, Hilden, Germany), 0.2 µM of each primer, 0.1 µl of a 1to 500 diluted SYBR Green I solution (Molecular Probes, Eugene, OR, USA), 1 µl OneStep Enzyme Mix (Qiagen, Hilden, Germany) and 1 µl standard (109 to 102 gene copies15
per µl) or environmental target RNA. Thermal cycling comprised a reverse transcriptionstep for 30 min at 50 ◦C, followed by an initial denaturation step for 15 min at 95 ◦C, 40cycles of amplification (10 s at 94 ◦C, 20 s at 54 ◦C for bacterial RNA quantification or48 ◦C for archaeal RNA quantification, 30 s at 72 ◦C and 20 s at 82 ◦C) and a terminalstep (2 min at 50 ◦C). After each run, a melting curve was recorded between 50 ◦C and20
99 ◦C to ensure that only specific amplification had occurred. 16S and 23S ribosomalRNA of E. coli (Roche Diagnostics GmbH, Grenzach-Wyhlen, Germany) served asstandard for bacterial gene targets. A PCR product was used as standard for quan-tification of Archaea. Archaeal primer sequences and PCR conditions are given inWilms et al. (2007). For each amplification the OneStep RT-PCR Kit was used accord-25
ing to the manufacturer’s instructions. All PCRs contained a reverse transcription step(30 min, 50 ◦C) prior to amplification.
3298
BGD8, 3289–3321, 2011
A laboratoryexperiment of intact
polar lipiddegradation
J. Logemann et al.
Title Page
Abstract Introduction
Conclusions References
Tables Figures
J I
J I
Back Close
Full Screen / Esc
Printer-friendly Version
Interactive Discussion
Discussion
Paper
|D
iscussionP
aper|
Discussion
Paper
|D
iscussionP
aper|
2.10 Denaturing gradient gel electrophoresis (DGGE) analysis
Partial 16S rRNA were amplified using the OneStep RT-PCR Kit (Qiagen, Hilden, Ger-many) with bacterial primers GC-357f and 907r as given in Muyer et al. (1995) and ar-chaeal primers S D Arch-GC-0344-a-S-20 und 907r as described previously (Wilms etal., 2006). Each forward primer contained a GC-clamp (Muyzer et al., 1993). Thermal5
cycling included a reverse transcription step for 30 min at 50 ◦C, followed by an initialdenaturation step for 15 min at 95 ◦C, 30 cycles of bacterial RNA amplification and 35cycles of archaeal RNA amplification (30 s at 94 ◦C, 45 s at 57 ◦C for bacterial RNA am-plification or 48 ◦C for archaeal RNA amplification, 60 s at 72 ◦C), and a terminal step(10 min at 72 ◦C). The PCR amplicons and loading buffer (40% [wt/vol] glycerol, 60%10
[wt/vol] 1× tris acetate-EDTA [TAE], and bromphenol blue) were mixed in a ratio of 1:2.DGGE was carried out as described by Suß et al. (2004) using an INGENYphorU-2system (Ingeny, Leiden, Netherlands) and a 6% (wt/vol) polyacrylamide gel containingdenaturant gradients of 50 to 70% for separation of bacterial PCR products. For sep-aration of archaeal PCR products a denaturant gradient of 30 to 80% was prepared.15
The gels were stained for 2 h with 1× SYBR Gold (Molecular Probes, Leiden, Nether-lands) in 1× tris-acetate-EDTA buffer and washed for 20 min in distilled water prior toUV transillumination.
2.11 Sequence analysis
DGGE bands were excised for sequencing and treated as described by Del Panno et20
al. (2005) without the second denaturing gel for purification. For reamplification thesame primers pairs as described above were used without the GC-clamp. The bacte-rial reamplification comprised 26 PCR cycles (annealing temperature 55 ◦C) whereasthe archaeal reamplification comprised 32 cycles (annealing temperature 48 ◦C). Forsubsequent sequence analysis, PCR products of DGGE bands were purified using the25
QIAquick PCR purification kit (Qiagen, Hilden, Germany) and commercially sequencedby GATC Biotech (Konstanz, Germany). The partial 16S rRNA sequences of the DGGEbands were compared to those in GenBank using the BLAST function (Altschul et al.,
3299

BGD8, 3289–3321, 2011
A laboratoryexperiment of intact
polar lipiddegradation
J. Logemann et al.
Title Page
Abstract Introduction
Conclusions References
Tables Figures
J I
J I
Back Close
Full Screen / Esc
Printer-friendly Version
Interactive Discussion
Discussion
Paper
|D
iscussionP
aper|
Discussion
Paper
|D
iscussionP
aper|
1997). Accession numbers of all partial 16S rRNA gene sequences obtained in thisstudy will be added to the EMBL database upon acceptance of the manuscript.
3 Results
The monitored microbial processes demonstrated similar trends in the degradation ex-periment and the untreated control. In contrast, the abiotic control showed no sign5
of sulfate reduction, methanogenesis, IPL degradation, fermentation or any other mi-crobial activity as demonstrated by the stability of all measured parameters (data notshown). This indicates that the degradation of IPLs was exclusively mediated by mi-croorganisms.
3.1 Sulfate and methane data10
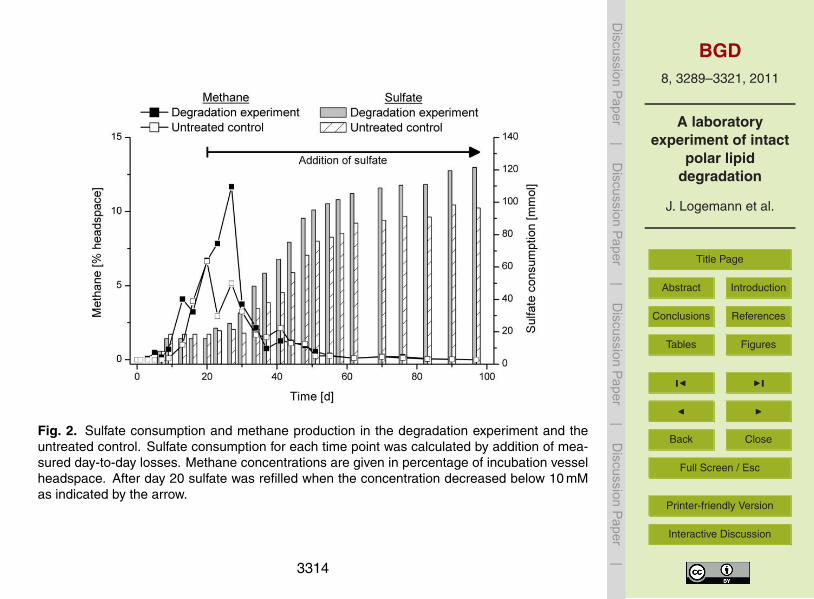
Sulfate and methane are part of the terminal mineralization processes and their con-centrations were monitored to assess the current status of the experiment. Sulfate wascompletely consumed within the first 9 days (Fig. 2). Between day 9 and day 20, the sul-fate concentration remained below the detection limit, until sulfate was refilled. Sulfatewas replenished to mimic the natural environment. At the end of the experiment, sulfate15
was consumed more slowly than at the beginning, indicating the depletion of electrondonors. The sulfate concentration decreased to 9 mM at day 97. Large amounts ofmethane were only detected in the absence of sulfate. The reason for this is, thatmethanogens commonly use the electron donors also used by sulfate-reducing bacte-ria. Since sulfate reduction is energetically favored methanogenesis is suppressed in20
the presence of sulfate (Oremland and Taylor, 1977). Gaseous sulfide (produced bysulfate reduction) was removed from the headspace during every sampling by purgingwith nitrogen. The concentration of dissolved sulfide in the pore water remained rel-atively low until day 27 (6 mM). The maximum concentration was reached at day 76(38 mM). Since this is a toxic concentration for most microorganisms, the headspace25
3300

BGD8, 3289–3321, 2011
A laboratoryexperiment of intact
polar lipiddegradation
J. Logemann et al.
Title Page
Abstract Introduction
Conclusions References
Tables Figures
J I
J I
Back Close
Full Screen / Esc
Printer-friendly Version
Interactive Discussion
Discussion
Paper
|D
iscussionP
aper|
Discussion
Paper
|D
iscussionP
aper|
was purged with CO2 to release the hydrogen sulfide. After flushing, the CO2 in thehead space was replaced with N2. The pH increased constantly in the degradationexperiment and the untreated control and was adjusted to values between pH 7 and 8by addition of hydrogen chloride. Oxygen was never detected in any incubation vessel.
3.2 Degradation of intact polar lipids5
The relative concentrations of ester-bound IPLs decreased in the course of the exper-iment whereas the relative concentrations of ether-bound IPLs remained stable. Thehead groups had no significant influence on the observed degradation pattern. Therelative concentrations of ester-bound IPLs with PC and PI head groups showed nosignificant change in the first days of the degradation experiment. Beginning at day 5,10
they decreased rapidly over 5 days followed by a phase of moderate loss until day 90.In case of PE and PS (Fig. 3c and d) higher relative concentrations were found at day5. In the following period the signal decreased over the rest of the experiment.
In contrast to this, the relative concentrations of all ether-bound IPLs (Fig. 4) scat-tered but did not decrease significantly until the end of the degradation experiment. The15
relative concentrations of ester- and ether-bound IPLs in the abiotic control showed aslight decrease relative to day 0 in the course of the experiment (Fig. 5). The smalldecrease in the abiotic control at day 1 was probably caused by inhomogeneity sincethe drop occurred in both ester- and ether-bound IPL quantifications.
3.3 Intact polar lipids in the untreated control20
Samples from the untreated control were taken in the same sampling intervals as in thedegradation experiment. Most of the IPLs added to monitor the degradation were notdetected in the untreated control. Exceptions were the IPLs PE 34:2 and PE 36:2, butcompared to the corresponding PEs in the added biomass their total amount was low(less than 3%). However, other IPLs such as SQDG (sulfoquinovosyl diacylglycerol)25
and ester-bound PG were identified in the untreated control. Additionally, ester-boundPEs with side chains different from those in the degradation experiment were found
3301

BGD8, 3289–3321, 2011
A laboratoryexperiment of intact
polar lipiddegradation
J. Logemann et al.
Title Page
Abstract Introduction
Conclusions References
Tables Figures
J I
J I
Back Close
Full Screen / Esc
Printer-friendly Version
Interactive Discussion
Discussion
Paper
|D
iscussionP
aper|
Discussion
Paper
|D
iscussionP
aper|
(31:0, 31:1, 33:1, 33:2, 35:2). SQDG was the most prominent IPL in the untreatedcontrol. It showed increasing abundances from day 0 to day 23 and then a decreaseto the starting value at a moderate rate after a major drop between days 23 and 27.PE and PG showed an increase between day 0 and day 5 and returned to the startingvalues in the course of the experiment.5
3.4 Microbial fermentation
Fermentation products were analyzed to monitor the utilization of organic matter. Thedata show the net balance of fermentation products since they are produced and con-sumed simultaneously (Fig. 6). In the beginning of the experiment the short-chain fattyacids were produced faster than consumed as indicated by their increasing concen-10
trations. The main fermentation product was acetate followed by propionate, butyrateand valerate. During the final phase of the experiment, the fermentation products wereutilized at the same rate as they were produced or the consumption was faster than theformation. Ethanol was also produced but could not be quantified due to signal over-lapping with those of other unknown organic compounds from the sediment matrix.15
The graphs for short-chain fatty acids in the degradation experiment and the untreatedcontrol shared the same characteristics. The accumulation of short-chain fatty acidstended to be slightly faster in the degradation experiment but overall the added cellmaterial had only a minor influence on the shape of the production curves of short-chain fatty acids. This indicates that the experiment was not disturbed by the addition20
of biomass as external substrate.
3.5 Succession in microbial abundance, diversity and activity
The development of the microbial communities was monitored to obtain backgroundinformation for the degradation of IPLs. The total cell counts of the degradation exper-iment and the untreated sediment showed the same trend and decreased only slightly25
during the experiment (Fig. 7). The total cell numbers of the degradation experiment
3302

BGD8, 3289–3321, 2011
A laboratoryexperiment of intact
polar lipiddegradation
J. Logemann et al.
Title Page
Abstract Introduction
Conclusions References
Tables Figures
J I
J I
Back Close
Full Screen / Esc
Printer-friendly Version
Interactive Discussion
Discussion
Paper
|D
iscussionP
aper|
Discussion
Paper
|D
iscussionP
aper|
were marginally higher than those of the untreated control. The numbers of bacte-rial 16S rRNA targets were one to two orders of magnitude higher than those of Ar-chaea. Between day 7 and day 16, the bacterial 16S rRNA copy numbers droppedsignificantly and returned to their previous values. The number of archaeal 16S rRNAcopies showed a generally increasing trend. After day 20, both the number of bacte-5
rial and archaeal 16S rRNA targets remained relatively constant. The RNA content ofthe sediment ranged from 80 to 4800 ng cm−3. Ravenschlag et al. (2000) determineda rRNA content of 0.9 to 1.4 fg rRNA per cell for two sulfate-reducing bacteria fromsurface sediments. Using these values to assess the total cell numbers for our study,the calculated values range between 8.9×10⁷ to 3.4×10⁹ cells cm−3, which fits nicely10
to our total cell counts. The community profiles of the degradation experiment and theuntreated sediment looked similar to each other. Initially, the community structure washighly diverse. This diversity decreased in the course of the experiment probably dueto a diminishing substrate spectrum as indicated in Fig. 6. Sequencing of representa-tive bands indicated the presence of different fermenting and sulfate-reducing bacteria.15
The most conspicuous organisms were relatives of Pelobacter sp. and Dethiosulfovib-rio acidaminovorans. These bacteria were highly abundant during the end phase ofthe experiment, when acetate and propionate were absent, indicating an enhancedactivity in this period. A sequence of a Cytophaga fermentans-related organism wasdetected after one week, also hinting toward an increased activity of that organism20
from that time on. Additionally, this bacterium showed a higher abundance in samplesfrom the degradation experiment. The abundance of other organisms, most of thembeing sulfate-reducing bacteria like a Desulfobacter psychrotolerans-related organism,appeared to be relatively constant over time, since sulfate was available almost duringthe entire experiment. Sulfur-oxidizing bacteria were only detected at the beginning25
of the experiment. Sequences affiliated to diatom chloroplasts were found during thecomplete course of the experiment.
The archaeal community pattern showed minor differences between the degradationexperiment and the untreated control (Fig. 9). A H. volcanii could only be detected
3303

BGD8, 3289–3321, 2011
A laboratoryexperiment of intact
polar lipiddegradation
J. Logemann et al.
Title Page
Abstract Introduction
Conclusions References
Tables Figures
J I
J I
Back Close
Full Screen / Esc
Printer-friendly Version
Interactive Discussion
Discussion
Paper
|D
iscussionP
aper|
Discussion
Paper
|D
iscussionP
aper|
at the very first sampling point in the degradation experiment. This indicated that theH. volcanii cells were successfully disintegrated during the experiment.
For both, the degradation experiment and the untreated control six bands were de-tected throughout the whole experiment. All sequences were closely related to twodifferent organisms, either Methanogenium frigidum or Methanogenium marinum. The5
community patterns reflect the quantification of Archaea by qPCR: In the first weekwhen the number of archaeal 16s rRNA gene targets was lowest, only very faint bandswere detected in the DGGE profile. In the beginning of the experiment, when sulfatewas still present, no methanogenic archaea could be detected (Fig. 9). Only after de-pletion of sulfate the rRNA of methanogens was found. The presence and activity of10
these organisms were supported by the methane production that was observed in theabsence of sulfate. In all samples, the content of eukaryotic RNA was too low to obtainsufficient PCR-products to prepare a DGGE with eukaryotic primers.
3.6 Total organic carbon
The carbon content was analyzed at five time points of the degradation experiment15
and the untreated control. The difference in organic matter between the degradationexperiment and the untreated control reflected the amount of organic carbon that wasadded to the degradation experiment with the inactive cell material of S. cerevisiae andH. volcanii. Although we added 1.36 g of cell-derived organic carbon which increasedthe TOC content of the natural sediment (0.22% Corg) by roughly 25%, no pronounced20
difference was visible between the degradation experiment and the untreated controlfor all other parameters.
3.7 Effects of sediment-derived organic carbon on microbial processes
The increasing concentrations for fermentation products and total cell counts within thefirst week demonstrate a stimulation of microbial activity. This was likely caused by a25
temperature increase from 4 ◦C (storage temperature) to 20 ◦C in the laboratory. Theaddition of biomass caused a faster increase for methanogenesis and fermentation.
3304

BGD8, 3289–3321, 2011
A laboratoryexperiment of intact
polar lipiddegradation
J. Logemann et al.
Title Page
Abstract Introduction
Conclusions References
Tables Figures
J I
J I
Back Close
Full Screen / Esc
Printer-friendly Version
Interactive Discussion
Discussion
Paper
|D
iscussionP
aper|
Discussion
Paper
|D
iscussionP
aper|
The added biomass also resulted in slightly increased values for sulfate consumption,methane production and fermentation (Figs. 2 and 6). The absolute amount of IPLsthat were added with the biomass of H. volcanii and S. cerevisiae was low comparedto other organic compounds present in the sediment itself. Therefore, the fermentationproducts do not only reflect the products of IPL degradation but mainly the degradation5
products of the organic matter which originated from the natural sediment.
4 Discussion
In this experiment ester-bound bacteria-like IPLs were faster degraded than ether-bound archaeal IPLs. The bonding type of the head group had no influence on thedegradation rate.10
4.1 Assessment of experimental conditions
On the first view the scattering for ether-bound IPLs appears to be much higher than forester-bound IPLs. This different behavior is an artifact of the data processing applied.To monitor the degradation of IPLs the relative concentration for each monitored IPLwas calculated. With this method, a scattering of IPL signals with values near the15
detection limit becomes much less visible than the scattering of IPL signals with valuesin the range of the injection standard. This explains the smooth degradation curvefor ester-bound IPLs in Fig. 3 after the first 10 days. Nevertheless, these analyticallimitations do not have any impact on the general results of this study.
Haloferax volcanii and Saccharomyces cerevisiae do not naturally occur in tidal flat20
sediments. Thus it could be assumed that the observed degradation rates of IPLs couldbe different from those originating from the natural community. However, the source ofthe ether-bound and ester-bound IPL should have no influence on the degradation ratesince the chemical structure and the bonding types of the added material can also befound in IPLs that naturally occur in Wadden Sea sediments (Rutters et al., 2001).25
3305

BGD8, 3289–3321, 2011
A laboratoryexperiment of intact
polar lipiddegradation
J. Logemann et al.
Title Page
Abstract Introduction
Conclusions References
Tables Figures
J I
J I
Back Close
Full Screen / Esc
Printer-friendly Version
Interactive Discussion
Discussion
Paper
|D
iscussionP
aper|
Discussion
Paper
|D
iscussionP
aper|
One could argue that the different degradation pattern observed for ether- and ester-bound IPLs are caused by a selective protection of ether-bound IPLs in intact H. vol-canii cell material and on the other hand disrupted cells of S. cerevisiae. This is unlikelybecause the rRNA of H. volcanii related archaea was only found at the very beginningof the experiment. Additionally, cultivation attempts with pasteurized cells showed no5
growth which indicates that the H. volcanii cells were killed during the experiment.As displayed in Fig. 4, the results of ether-bound IPL analysis showed a non-
systematic scattering. Adsorption/desorption processes of IPLs to/from the sedimentmatrix may be an issue. Sediment inhomogeneity is also a possible explanation. Wetried to minimize this effect by the design of the incubation vessel and intense mixing10
on a mixing device prior to every sampling. In addition to this, directly before openingthe incubation vessels in the anaerobic chamber, the sediment was resuspended byshaking. Other reasons for scattering IPL values may be varying extraction efficien-cies or changing matrix effects during ESI-ionization which may add some scatteringin addition to inhomogeneity.15
4.2 Influence of bonding types and moieties on IPL degradation
The degradation pattern and hence the stability of all investigated ester-boundbacterial-like IPLs was approximately the same (Fig. 3a–d). It can be assumed thatthe degradation of ester-bound intact polar lipids was independent from the type ofhead group, since the core structures of these IPLs are generally the same. A sim-20
ilar behavior was observed for the ether-bound archaeal IPLs. But in contrast to theester-bound bacterial IPLs, the investigated archaeal IPLs had two structurally differ-ent types of head groups – one glycosidic (S-GL-1) and two phosphoester (PG-Ar andPGP-Me; Fig. 1) head groups. Based on the study of Harvey et al. (1986) glycosidicether lipids are commonly assumed to be more stable than phospholipids with ester-25
bound moieties. However, Harvey and coauthors investigated the degradation of aglycosidic ether lipid and a phosphoester lipid. They found a higher stability of theglycosidic ether lipid. In general, compared to glycosidic bonds phosphoester bonds
3306

BGD8, 3289–3321, 2011
A laboratoryexperiment of intact
polar lipiddegradation
J. Logemann et al.
Title Page
Abstract Introduction
Conclusions References
Tables Figures
J I
J I
Back Close
Full Screen / Esc
Printer-friendly Version
Interactive Discussion
Discussion
Paper
|D
iscussionP
aper|
Discussion
Paper
|D
iscussionP
aper|
are chemically more labile. In combination with the findings of Harvey and coworkersthis could lead to the assumption that the bonding type of the head group has a ma-jor influence on the IPL degradation rate. But in fact the study of Harvey et al. 1986is not suitable to answer the question which part of an IPL-molecule (head group ormoiety bonding type) is responsible for the observed differential stability of bacterial5
and archaeal IPLs. According to our results, we assume that the differences in chem-ical stability of IPLs play only a minor role during the degradation of IPLs, at least inthe investigated system. Since the head groups had no influence on the IPL degra-dation rates the structurally different core lipids are assumed to cause the observeddegradation rates.10
In general complex molecules like lipids and proteins are hydrolyzed by exo- or ec-toenzymes which are released by prokaryotic cells. Therefore, we conclude that mi-crobiological enzymatic processes are the driving force in IPL degradation rather thanexpected chemical stabilities alone.
4.3 Microbial activity15
Originally, the experiment was planned as an enrichment culture for lipid-degradingbacteria. It turned out, however, that the added cell material had only little influenceon the community structure and the metabolic activity. This had a positive side-effect,since the processes which originally occur in tidal flat sediments were not disturbed andsuperposed. As a consequence the selected set-up is suitable to reflect the natural IPL20
degradation in such sediments.Most of the Archaea in sediments are known to be methanogens (Wilms et al., 2007)
or nitrifying archaea (Wuchter et al., 2007). They have a narrow substrate spectrumlimited to simple molecules and are not known to degrade lipids. Probably, the mainlipid degraders are Bacteria which are more abundant than Archaea in surface sedi-25
ments (e.g. Beck et al., 2011).Chloroplast RNA of diatoms was found throughout the whole course of the experi-
ment. Since no oxygen and no light for algal growth were available in the experiment,
3307

BGD8, 3289–3321, 2011
A laboratoryexperiment of intact
polar lipiddegradation
J. Logemann et al.
Title Page
Abstract Introduction
Conclusions References
Tables Figures
J I
J I
Back Close
Full Screen / Esc
Printer-friendly Version
Interactive Discussion
Discussion
Paper
|D
iscussionP
aper|
Discussion
Paper
|D
iscussionP
aper|
the diatoms might be inactive in a resting state. The RNA of chloroplasts is excep-tionally stable, because the RNA in this cell organelle is surrounded by four mem-branes (Kroth and Strotmann, 1999). Another reason for the stability of chloroplastRNA may be that the diatoms were in fact active and survived by a heterotrophic kindof metabolism. Facultative heterotrophy is known for many diatoms, including several5
Navicula species (Lewin, 1953; Sherr and Sherr, 2007). Heterotrophically growingdiatoms continue to synthesize their photosynthetic pigments in the dark and returnimmediately to photosynthesis under light exposure (Lewin and Hellebus, 1970). Thisindicates that chloroplast RNA is present even if no light is available.
The question if ester-bound lipids are recycled and used for membrane synthesis10
by Bacteria cannot be answered by our experimental-setup. However, enzymes aredescribed for Eukarya and Prokarya that facilitate bidirectional ATP-independent flip-ping of polar lipids across cytoplasmic membranes (Sanyal and Menon, 2009). Theincorporation of extrinsic cell building blocks is energetically useful for microorganismsbecause it is more efficient to recycle existing molecules than breaking them down to15
smaller molecules to synthesize them “de-novo”. Takano and coworkers (2010) added13Clabeled glucose to marine sediment and found that the 13C was incorporated intothe glycerol backbone of archaeal membrane lipids whereas the isoprenoid core lipidsremained unlabeled. This indicates a recycling of comparable large membrane build-ing blocks. To answer the question if IPLs can be recycled as intact molecules, stable-20
isotope probing (SIP) or 14C-labeling would be suitable tools to follow the degradationand incorporation of IPLs and their resulting products.
5 Conclusions
The quantification of Bacteria and Archaea in the deep marine biosphere by IPL andFISH analysis led to the assumption that this habitat is dominated by Archaea (Biddle25
et al., 2006; Lipp et al., 2008). In contrast, catalyzed reporter deposition fluorescencein situ hybridization (CARD-FISH) and quantitative polymerase chain reaction (q-PCR)
3308

BGD8, 3289–3321, 2011
A laboratoryexperiment of intact
polar lipiddegradation
J. Logemann et al.
Title Page
Abstract Introduction
Conclusions References
Tables Figures
J I
J I
Back Close
Full Screen / Esc
Printer-friendly Version
Interactive Discussion
Discussion
Paper
|D
iscussionP
aper|
Discussion
Paper
|D
iscussionP
aper|
suggest a predominance of Bacteria (Schippers et al., 2005; Inagaki et al., 2006).Our experiment shows that these interpretations have to be considered with caution,since ether-bound archaeal IPLs were clearly more stable than ester-bound bacteria-like IPLs over a period of 100 days. In nature, ether-bound IPLs may even be preservedfor longer time periods since the enhanced temperature in the laboratory accelerated5
the degradation processes. Therefore IPL based quantification may lead to an overes-timation of archaeal cell numbers.
Acknowledgements. The authors are grateful to B. Kopke, B. Buchmann, H. Haase andP. Neumann for their technical assistance. Many thanks to M. Seidel for sharing his experi-ence in IPL degradation experiments that were conducted prior to this work. This work was10
financially supported by Deutsche Forschungsgemeinschaft (DFG) within the Research Groupon “BioGeoChemistry of Tidal Flats” (FOR 432).
References
Altschul, S. F., Madden, T. L., Schaffer, A. A., Zhang, J., Zhang, Z., Miller, W., and Lipman, D.J.: Gapped BLAST and PSI-BLAST: a new generation of protein database search programs,15
Nucleic Acids Res., 25, 3389–3402, doi:10.1093/nar/25.17.3389, 1997.Beck, M., Riedel, T., Graue, J., Koster, J., Kowalski, N., Wu, C. S., Wegener, G., Lipsewers, Y.,
Freund, H., Bottcher, M. E., Brumsack, H.-J., Cypionka, H., Rullkotter, J., and Engelen, B.:Imprint of past and present environmental conditions on microbiology and biogeochemistry ofcoastal Quaternary sediments, Biogeosciences, 8, 55–68, doi:10.5194/bg-8-55-2011, 2011.20
Biddle, J. F., Lipp, J. S., Lever, M. A., Lloyd, K. G., Sørensen, K. B., Anderson, R., Fredricks, H.F., Elvert, M., Kelly, T. J., Schrag, D. P., Sogin, M. L., Brenchley, J. E., Teske, A., House, C. H.,and Hinrichs, K. U.: Heterotrophic archaea dominate sedimentary subsurface ecosystemsoff Peru, Proc. Natl. Acad. Sci. U.S.A., 103, 3846–3851, 2006.
Cord-Ruwisch, R.: A quick method for the determination of dissolved and precipitated sulfides25
in cultures of sulfate-reducing bacteria, J. Microbiol. Meth., 4, 33–36, 1985.Del Panno, M. T., Morelli, I. S., Engelen, B., Berthe-Corti, L., Effect of petrochemical sludge
concentrations on microbial communities during soil bioremediation, FEMS Microbiol. Eco.,53, 305–316, doi:10.1016/j.femsec.2005.01.014, 2005.
3309

BGD8, 3289–3321, 2011
A laboratoryexperiment of intact
polar lipiddegradation
J. Logemann et al.
Title Page
Abstract Introduction
Conclusions References
Tables Figures
J I
J I
Back Close
Full Screen / Esc
Printer-friendly Version
Interactive Discussion
Discussion
Paper
|D
iscussionP
aper|
Discussion
Paper
|D
iscussionP
aper|
Ertefai, T. F., Fisher, M. C., Fredricks, H. F., Lipp, J. S., Pearson, A., Birgel, D., Udert, K. M.,Cavanaugh, C. M., Gschwend, P. M., and Hinrichs, K. U.: Vertical distribution of microbiallipids and functional genes in chemically distinct layers of a highly polluted meromictic lake,Org. Geochem., 39, 1572–1588, 2008.
Harvey, H. R., Fallon, R. D., and Patton, J. S.: The effect of organic-matter and oxygen on the5
degradation of bacterial membrane lipids in marine sediments, Geochim. Cosmochim. Ac.,50, 795–804, 1986.
Inagaki, F., Nunoura, T., Nakagawa, S., Teske, A., Lever, M., Lauer, A., Suzuki, M., Takai, K.,Delwiche, M., Colwell, F. S., Nealson, K. H., Horikoshi, K., D’Hondt, S., and Jørgensen, B.B.: Biogeographical distribution and diversity of microbes in methane hydrate-bearing deep10
marine sediments on the Pacific Ocean Margin, Proc. Natl. Acad. Sci. U.S.A., 103, 2815–2820, doi:10.1073/pnas.0511033103, 2006.
Kroth, P. and Strotmann, H.: Diatom plastids: Secondary endocytobiosis, plastid genome andprotein import, Physiol. Plantarum, 107, 136–141, 1999.
Kuypers, M. M. M., Sliekers, A. O., Lavik, G., Schmid, M., Jørgensen, B. B., Kuenen, J. G.,15
Damste, J. S. S., Strous, M., and Jetten, M. S. M.: Anaerobic ammonium oxidation by anam-mox bacteria in the Black Sea, Nature, 422, 608–611, 2003.
Lewin, J. C.: Heterotrophy in diatoms, J. Gen. Microbiol., 9, 305–313, 1953.Lewin, J. and Hellebus, J.: Heterotophic nutrition of marine pennate diatom, Cylindrotheca
fusiformis, Can. J. Microbiol., 16, 1123–1129, 1970.20
Lin, Y. S., Lipp, J. S., Yoshinaga, M. Y., Lin, S. H., Elvert, M., and Hinrichs, K. U.: Intramolecularstable carbon isotopic analysis of archaeal glycosyl tetraether lipids, Rapid Commun. MassSpectrom., 24, 2817–2826, doi:10.1002/rcm.4707, 2010.
Lipp, J. S., Morono, Y., Inagaki, F., and Hinrichs, K.-U.: Significant contribution of Ar-chaea to 15 extant biomass in marine subsurface sediments, Nature, 454, 991–994,25
doi:10.1038/nature07174, 2008.Lipp, J. S., Liu, X. L., and Hinrichs, K. U.: Structural diversity and fate of intact polar lipids in
marine sediments, Geochim. Cosmochim. Ac., 73, A771–A771, 2009.Lunau, M., Lemke, A., Walther, K., Martens-Habbena, W., and Simon, M.: An improved
method for counting bacteria from sediments and turbid environments by epifluorescence30
microscopy, Environ. Microbiol., 7, 961–968, 2005.Muyzer, G., Dewaal, E. C., and Uitterlinden, A. G.: Profiling of complex microbial-populations
by denaturing gradient gel-electrophoresis analysis of polymerase chain reaction-amplified
3310
BGD8, 3289–3321, 2011
A laboratoryexperiment of intact
polar lipiddegradation
J. Logemann et al.
Title Page
Abstract Introduction
Conclusions References
Tables Figures
J I
J I
Back Close
Full Screen / Esc
Printer-friendly Version
Interactive Discussion
Discussion
Paper
|D
iscussionP
aper|
Discussion
Paper
|D
iscussionP
aper|
genes-coding for 16S ribosomal RNA, Appl. Environ. Microbiol., 59, 695–700, 1993.Muyzer, G., Teske, A., Wirsen, C. O., and Jannasch, H. W.: Phylogenetic relationships of
Thiomicrospira species and their identification in deep-sea hydrothermal vent samples bydenaturing gradient gel-electrophoresis of 16S rDNA fragments, Arch. Microbiol., 164, 165–172, 1995.5
Oremland, R. S. and Taylor, B. F.: Diurnal fluctuations of O2, N2 and CH4 in rhizosphere ofThalassia testundinum, Limnol. Oceanogr., 22, 566–570, 1977.
Ravenschlag, K., Sahm, K., Knoblauch, C., Jørgensen, B. B., and Amann, R.: Communitystructure, cellular rRNA content, and activity of sulfate-reducing bacteria in marine arctic sed-iments, Appl. Environ. Microbiol., 66, 3592–3602, doi:10.1128/aem.66.8.3592-3602.2000,10
2000.Rossel, P. E., Lipp, J. S., Fredricks, H. F., Arnds, J., Boetius, A., Elvert, M., and Hinrichs, K.
U.: Intact polar lipids of anaerobic methanotrophic archaea and associated bacteria, Org.Geochem., 39, 992–999, doi:10.1016/j.orggeochem.2008.02.021, 2008.
Rutters, H., Sass, H., Cypionka, H., and Rullkotter, J.: Monoalkylether phosphoslipids in the15
sulfate-reducing bacteria Desufosarcina variablis and Desulforhabus amnigenus, Arch. Mi-crobiol., 176, 435–442, 2001.
Sanyal, S. and Menon, A. K.: Flipping Lipids: Why an Whats the Reason for?, ACS Chem.Biol., 4, 895–909, doi:10.1021/cb900163d, 2009.
Schippers, A., Neretin, L. N., Kallmeyer, J., Ferdelman, T. G., Cragg, B. A., Parkes, R. J., and20
Jørgensen, B. B.: Prokaryotic cells of the deep sub-seafloor biosphere identified as livingbacteria, Nature, 433, 861–864, 2005.
Schouten, S., Middelburg, J. J., Hopmans, E. C., and Sinninghe Damste, J. S.: Fossilizationand degradation of intact polar lipids in deep subsurface sediments: A theoretical approach,Geochim. Cosmochim. Ac., 74, 3806 pp., 2010.25
Sherr, E. B. and Sherr, B. F.: Heterotrophic dinoflagellates: a significant component of micro-zooplankton biomass and major grazers of diatoms in the sea, Mar. Ecol.-Prog. Ser., 352,187–197, doi:10.3354/meps07161, 2007.
Sinninghe Damste, J. S., Rijpstra, W. I. C., Geenevasen, J. A. J., Strous, M., and Jetten,M. S. M.: Structural identification of ladderane and other membrane lipids of plancto-30
mycetes capable of anaerobic ammonium oxidation (anammox), FEBS J., 272, 4270–4283,doi:10.1111/j.1742-4658.2005.04842.x, 2005.
Sprott, G. D., Larocque, S., Cadotte, N., Dicaire, C. J., McGee, M., and Brisson, J. R.: Novel
3311
BGD8, 3289–3321, 2011
A laboratoryexperiment of intact
polar lipiddegradation
J. Logemann et al.
Title Page
Abstract Introduction
Conclusions References
Tables Figures
J I
J I
Back Close
Full Screen / Esc
Printer-friendly Version
Interactive Discussion
Discussion
Paper
|D
iscussionP
aper|
Discussion
Paper
|D
iscussionP
aper|
polar lipids of halophilic eubacterium Planococcus H8 and archaeon Haloferax volcanii, BBA-Mol. Cell Biol. L., 1633, 179 pp., 2003.
Sturt, H. F., Summons, R. E., Smith, K., Elvert, M., and Hinrichs, K. U.: Intact polar membranelipids in prokaryotes and sediments deciphered by high-performance liquid chromatogra-phy/electrospray ionization multistage mass spectrometry - new biomarkers for biogeochem-5
istry and microbial ecology, Rapid Commun. Mass Spectrom., 18, 617–628, 2004.Suß, J., Engelen, B., Cypionka, H., and Sass, H.: Quantitative analysis of bacterial communities
from Mediterranean sapropels based on cultivation-dependent methods, FEMS Microbiol.Ecol., 51, 109–121, 2004.
Takano, Y., Chikaraishi, Y., Ogawa, N. O., Nomaki, H., Morono, Y., Inagaki, F., Kitazato, H., Hin-10
richs, K. U., and Ohkouchi, N.: Sedimentary membrane lipids recycled by deep-sea benthicarchaea, Nat. Geosci., 3, 858–861, doi:10.1038/ngeo983, 2010.
White, D. C., Davis, W. M., Nickels, J. S., King, J. D., and Bobbie, R. J.: Determination of thesedimentary microbial biomass by extractable lipid phosphate, Oecologia, 40, 51–62, 1979.
Wilms, R., Sass, H., Kopke, B., Koster, J., Cypionka, H., and Engelen, B.: Specific Bacte-15
rial, Archaeal, and Eukaryotic Communities in Tidal-Flat Sediments along a Vertical Profileof Several Meters, Appl. Environ. Microbiol., 72, 2756–2764, doi:10.1128/aem.72.4.2756-2764.2006, 2006.
Wilms, R., Sass, H., Kopke, B., Cypionka, H., and Engelen, B.: Methane and sulfate profileswithin the subsurface of a tidal flat are reflected by the distribution of sulfate-reducing bacteria20
and methanogenic archaea, FEMS Microbiol. Ecol., 59, 611–621, 2007.Wuchter, C., Abbas, B., Coolen, M. J. L., Herfort, L., van Bleijswijk, J., Timmers, P., Strous,
M., Teira, E., Herndl, G. J., Middelburg, J. J., Schouten, S., and Sinninghe Damste, J.S.: Archaeal nitrification in the ocean, Proc. Natl. Acad. Sci. U.S.A., 104, 5704–5704,doi:10.1073/pnas.0701630104, 2007.25
Zink, K. G., Wilkes, H., Disko, U., Elvert, M., and Horsfield, B.: Intact phospholipids – microbial“life markers” in marine deep subsurface sediments, Org. Geochem., 34, 755–769, 2003.
3312

BGD8, 3289–3321, 2011
A laboratoryexperiment of intact
polar lipiddegradation
J. Logemann et al.
Title Page
Abstract Introduction
Conclusions References
Tables Figures
J I
J I
Back Close
Full Screen / Esc
Printer-friendly Version
Interactive Discussion
Discussion
Paper
|D
iscussionP
aper|
Discussion
Paper
|D
iscussionP
aper|
Fig. 1. Chemical structures of IPLs characteristic for the two organisms used in thisstudy: (A) diacylglycerol ester-bound core lipids of Saccharomyces cerevisiae bound to: phos-phatidylethanolamine (PE), phosphatidylcholine (PC), phosphatidylinositol (PI) and phosphaty-dylserine (PS); (B) isoprenoid ether-bound core lipids of Haloferax volcanii bound to: ar-chaetidylglycerol (PG-Ar), archaetidylglycerol methylphosphate (PGP-Me) and sulfono diglycodiacylglycerol S-GL-1 (nomenclature according to Sprott et al., 2003).
3313
BGD8, 3289–3321, 2011
A laboratoryexperiment of intact
polar lipiddegradation
J. Logemann et al.
Title Page
Abstract Introduction
Conclusions References
Tables Figures
J I
J I
Back Close
Full Screen / Esc
Printer-friendly Version
Interactive Discussion
Discussion
Paper
|D
iscussionP
aper|
Discussion
Paper
|D
iscussionP
aper|
23
1
Figure 1: Chemical structures of IPLs characteristic for the two organisms used in this study: 2
A: diacylglycerol ester-bound core lipids of Saccharomyces cerevisiae bound to: 3
phosphatidylethanolamine (PE), phosphatidylcholine (PC), phosphatidylinositol (PI) and 4
phosphatydylserine (PS); B: isoprenoid ether-bound core lipids of Haloferax volcanii bound 5
to: archaetidylglycerol (PG-Ar), archaetidylglycerol methylphosphate (PGP-Me) and sulfono 6
diglyco diacylglycerol S-GL-1 (nomenclature according to Sprott et al., 2003). 7
8
Figure 2: Sulfate consumption and methane production in the degradation experiment and the 9
untreated control. Sulfate consumption for each time point was calculated by addition of 10
Fig. 2. Sulfate consumption and methane production in the degradation experiment and theuntreated control. Sulfate consumption for each time point was calculated by addition of mea-sured day-to-day losses. Methane concentrations are given in percentage of incubation vesselheadspace. After day 20 sulfate was refilled when the concentration decreased below 10 mMas indicated by the arrow.
3314

BGD8, 3289–3321, 2011
A laboratoryexperiment of intact
polar lipiddegradation
J. Logemann et al.
Title Page
Abstract Introduction
Conclusions References
Tables Figures
J I
J I
Back Close
Full Screen / Esc
Printer-friendly Version
Interactive Discussion
Discussion
Paper
|D
iscussionP
aper|
Discussion
Paper
|D
iscussionP
aper|
24
measured day-to-day losses. Methane concentrations are given in percentage of incubation 1
vessel headspace. After day 20 sulfate was refilled when the concentration decreased below 2
10 mM as indicated by the arrow. 3
4
Figure 3: Relative concentrations of ester-bound IPLs with different head groups in the 5
degradation experiment vs. time in days. Core lipid structures are given as sum of fatty acids 6
(e.g. 32:2) where 32 represents the number of carbon atoms and 2 represents the number of 7
double bonds in the core lipid structure. 8
9
10
11
Fig. 3. Relative concentrations of ester-bound IPLs with different head groups in the degrada-tion experiment vs. time in days. Core lipid structures are given as sum of fatty acids (e.g. 32:2)where 32 represents the number of carbon atoms and 2 represents the number of double bondsin the core lipid structure.
3315

BGD8, 3289–3321, 2011
A laboratoryexperiment of intact
polar lipiddegradation
J. Logemann et al.
Title Page
Abstract Introduction
Conclusions References
Tables Figures
J I
J I
Back Close
Full Screen / Esc
Printer-friendly Version
Interactive Discussion
Discussion
Paper
|D
iscussionP
aper|
Discussion
Paper
|D
iscussionP
aper|
25
1
Figure 4: Relative concentrations of ether-bound IPLs with different head groups in the 2
degradation experiment vs. time in days. Abbreviations: archaetidylglycerol (PG-Ar), 3
archaetidylglycerol methylphosphate (PGP-Me), and sulfono diglyco diacylglycerol S-GL-1 4
(according to Sprott et al., 2003). 5
6
Figure 5: Sum of ester- and ether-bound IPLs in the degradation experiment and the abiotic 7
control given as relative concentrations relative to day 0. Closed symbols: degradation 8
experiment; open symbols: untreated control. 9
10
11
Fig. 4. Relative concentrations of ether-bound IPLs with different head groups in the degrada-tion experiment vs. time in days. Abbreviations: archaetidylglycerol (PG-Ar), archaetidylglycerolmethylphosphate (PGP-Me), and sulfono diglyco diacylglycerol S-GL-1 (according to Sprott etal., 2003).
3316

BGD8, 3289–3321, 2011
A laboratoryexperiment of intact
polar lipiddegradation
J. Logemann et al.
Title Page
Abstract Introduction
Conclusions References
Tables Figures
J I
J I
Back Close
Full Screen / Esc
Printer-friendly Version
Interactive Discussion
Discussion
Paper
|D
iscussionP
aper|
Discussion
Paper
|D
iscussionP
aper|
25
1
Figure 4: Relative concentrations of ether-bound IPLs with different head groups in the 2
degradation experiment vs. time in days. Abbreviations: archaetidylglycerol (PG-Ar), 3
archaetidylglycerol methylphosphate (PGP-Me), and sulfono diglyco diacylglycerol S-GL-1 4
(according to Sprott et al., 2003). 5
6
Figure 5: Sum of ester- and ether-bound IPLs in the degradation experiment and the abiotic 7
control given as relative concentrations relative to day 0. Closed symbols: degradation 8
experiment; open symbols: untreated control. 9
10
11
Fig. 5. Sum of ester- and ether-bound IPLs in the degradation experiment and the abiotic con-trol given as relative concentrations relative to day 0. Closed symbols: degradation experiment;open symbols: untreated control.
3317

BGD8, 3289–3321, 2011
A laboratoryexperiment of intact
polar lipiddegradation
J. Logemann et al.
Title Page
Abstract Introduction
Conclusions References
Tables Figures
J I
J I
Back Close
Full Screen / Esc
Printer-friendly Version
Interactive Discussion
Discussion
Paper
|D
iscussionP
aper|
Discussion
Paper
|D
iscussionP
aper|
26
1
Figure 6: Pore water concentrations of acetate, propionate, butyrate and valerate in mmol vs. 2
time in days. Closed symbols: degradation experiment; open symbols: untreated control. 3
4
5
Figure 7: Bacterial and archaeal 16S rRNA copies and total cell numbers (TCC) in the course 6
of the experiment. The number of bacterial and archaeal 16S rRNA targets are given in copies 7
per ng of extracted RNA, whereas the total cell counts are given in cells per cm³ sediment. 8
Closed symbols: degradation experiment; open symbols: untreated control. 9
10
11
12
Fig. 6. Pore water concentrations of acetate, propionate, butyrate and valerate in mmol vs. timein days. Closed symbols: degradation experiment; open symbols: untreated control.
3318

BGD8, 3289–3321, 2011
A laboratoryexperiment of intact
polar lipiddegradation
J. Logemann et al.
Title Page
Abstract Introduction
Conclusions References
Tables Figures
J I
J I
Back Close
Full Screen / Esc
Printer-friendly Version
Interactive Discussion
Discussion
Paper
|D
iscussionP
aper|
Discussion
Paper
|D
iscussionP
aper|
26
1
Figure 6: Pore water concentrations of acetate, propionate, butyrate and valerate in mmol vs. 2
time in days. Closed symbols: degradation experiment; open symbols: untreated control. 3
4
5
Figure 7: Bacterial and archaeal 16S rRNA copies and total cell numbers (TCC) in the course 6
of the experiment. The number of bacterial and archaeal 16S rRNA targets are given in copies 7
per ng of extracted RNA, whereas the total cell counts are given in cells per cm³ sediment. 8
Closed symbols: degradation experiment; open symbols: untreated control. 9
10
11
12
Fig. 7. Bacterial and archaeal 16S rRNA copies and total cell numbers (TCC) in the course ofthe experiment. The number of bacterial and archaeal 16S rRNA targets are given in copiesper ng of extracted RNA, whereas the total cell counts are given in cells per cm3 sediment.Closed symbols: degradation experiment; open symbols: untreated control.
3319

BGD8, 3289–3321, 2011
A laboratoryexperiment of intact
polar lipiddegradation
J. Logemann et al.
Title Page
Abstract Introduction
Conclusions References
Tables Figures
J I
J I
Back Close
Full Screen / Esc
Printer-friendly Version
Interactive Discussion
Discussion
Paper
|D
iscussionP
aper|
Discussion
Paper
|D
iscussionP
aper|
Fig. 8. DGGE community profiles of Bacteria and closest cultivated relatives of the sequencedDGGE bands with similarity in % compared to data from the EMBL database. (A) degradationexperiment (B) untreated control.
3320

BGD8, 3289–3321, 2011
A laboratoryexperiment of intact
polar lipiddegradation
J. Logemann et al.
Title Page
Abstract Introduction
Conclusions References
Tables Figures
J I
J I
Back Close
Full Screen / Esc
Printer-friendly Version
Interactive Discussion
Discussion
Paper
|D
iscussionP
aper|
Discussion
Paper
|D
iscussionP
aper|
Fig. 9. DGGE community profiles of Archaea and closest cultivated relatives of the sequencedDGGE bands with similarity in % compared to data from the EMBL database. (A) degradationexperiment (B) untreated control.
3321
Related Documents