Applied Intelligence 19, 125–141, 2003 c 2003 Kluwer Academic Publishers. Manufactured in The Netherlands. A Knowledge Discovery System with Support for Model Selection and Visualization TU BAO HO, TRONG DUNG NGUYEN, HIROSHI SHIMODAIRA AND MASAYUKI KIMURA Japan Advanced Institute of Science and Technology, Ishikawa, 923-1292 Japan [email protected] [email protected] [email protected] [email protected] Abstract. The process of knowledge discovery in databases consists of several steps that are iterative and inter- active. In each application, to go through this process the user has to exploit different algorithms and their settings that usually yield multiple models. Model selection, that is, the selection of appropriate models or algorithms to achieve such models, requires meta-knowledge of algorithm/model and model performance metrics. Therefore, model selection is usually a difficult task for the user. We believe that simplifying the process of model selection for the user is crucial to the success of real-life knowledge discovery activities. As opposed to most related work that aims to automate model selection, in our view model selection is a semiautomatic process, requiring an effective collaboration between the user and the discovery system. For such a collaboration, our solution is to give the user the ability to try various alternatives and to compare competing models quantitatively by performance metrics, and qualitatively by effective visualization. This paper presents our research on model selection and visualization in the development of a knowledge discovery system called D2MS. The paper addresses the motivation of model selection in knowledge discovery and related work, gives an overview of D2MS, and describes its solution to model selection and visualization. It then presents the usefulness of D2MS model selection in two case studies of discovering med- ical knowledge in hospital data—on meningitis and stomach cancer—using three data mining methods of decision trees, conceptual clustering, and rule induction. Keywords: KDD, model selection, visualization, user’s participation 1. Introduction Knowledge discovery in databases (KDD)—the rapidly growing interdisciplinary field of computing that evolves from its roots in database management, statistics, and machine learning—aims at finding use- ful knowledge from large databases. The process of knowledge discovery is complicated and should be seen inherently as a process containing several steps. The first step is to understand the application domain, to formulate the problem, and to collect data. The sec- ond step is to preprocess the data. The third step is that of data mining with the aim of extracting use- ful knowledge as patterns or models hidden in data. The fourth step is to post-process discovered knowl- edge. The fifth step is to put discovered knowledge to practical use [1]. These steps are inherently itera- tive and interactive, i.e., one cannot expect to extract useful knowledge by just pushing one time a large amount of data into a black box without the user’s participation. In this work we adopt the view in [2] regarding a pattern as a local structure and a model as a global rep- resentation of a structure. While a pattern is related to just a handful of variables and a few cases such as a rule, a model, e.g. a decision tree or a regression hyperplane, summarizes the systematic component underlying the data or describes how the data may have arisen. In a

Welcome message from author
This document is posted to help you gain knowledge. Please leave a comment to let me know what you think about it! Share it to your friends and learn new things together.
Transcript

Applied Intelligence 19, 125–141, 2003c© 2003 Kluwer Academic Publishers. Manufactured in The Netherlands.
A Knowledge Discovery System with Support for ModelSelection and Visualization
TU BAO HO, TRONG DUNG NGUYEN, HIROSHI SHIMODAIRA AND MASAYUKI KIMURAJapan Advanced Institute of Science and Technology, Ishikawa, 923-1292 Japan
Abstract. The process of knowledge discovery in databases consists of several steps that are iterative and inter-active. In each application, to go through this process the user has to exploit different algorithms and their settingsthat usually yield multiple models. Model selection, that is, the selection of appropriate models or algorithms toachieve such models, requires meta-knowledge of algorithm/model and model performance metrics. Therefore,model selection is usually a difficult task for the user. We believe that simplifying the process of model selection forthe user is crucial to the success of real-life knowledge discovery activities. As opposed to most related work thataims to automate model selection, in our view model selection is a semiautomatic process, requiring an effectivecollaboration between the user and the discovery system. For such a collaboration, our solution is to give the userthe ability to try various alternatives and to compare competing models quantitatively by performance metrics, andqualitatively by effective visualization. This paper presents our research on model selection and visualization in thedevelopment of a knowledge discovery system called D2MS. The paper addresses the motivation of model selectionin knowledge discovery and related work, gives an overview of D2MS, and describes its solution to model selectionand visualization. It then presents the usefulness of D2MS model selection in two case studies of discovering med-ical knowledge in hospital data—on meningitis and stomach cancer—using three data mining methods of decisiontrees, conceptual clustering, and rule induction.
Keywords: KDD, model selection, visualization, user’s participation
1. Introduction
Knowledge discovery in databases (KDD)—therapidly growing interdisciplinary field of computingthat evolves from its roots in database management,statistics, and machine learning—aims at finding use-ful knowledge from large databases. The process ofknowledge discovery is complicated and should be seeninherently as a process containing several steps. Thefirst step is to understand the application domain, toformulate the problem, and to collect data. The sec-ond step is to preprocess the data. The third step isthat of data mining with the aim of extracting use-ful knowledge as patterns or models hidden in data.
The fourth step is to post-process discovered knowl-edge. The fifth step is to put discovered knowledgeto practical use [1]. These steps are inherently itera-tive and interactive, i.e., one cannot expect to extractuseful knowledge by just pushing one time a largeamount of data into a black box without the user’sparticipation.
In this work we adopt the view in [2] regarding apattern as a local structure and a model as a global rep-resentation of a structure. While a pattern is related tojust a handful of variables and a few cases such as a rule,a model, e.g. a decision tree or a regression hyperplane,summarizes the systematic component underlying thedata or describes how the data may have arisen. In a

126 Ho et al.
broader sense, we will refer hereafter to a set of dis-covered patterns as a model.
The KDD primary goals of prediction and descrip-tion are concerned with different tasks in the datamining step of the KDD process, such as those forcharacterization, discrimination, association, classifi-cation, and clustering [3]. Also, there are different tasksof data cleaning, integration, transformation, and re-duction in the preprocessing step, and those of inter-pretation, evaluation, exportation, and visualization ofresults in the post-processing step. Moreover, each ofthese tasks can be done by different methods and al-gorithms. To solve a given discovery problem, the userusually has to go through these steps several times, witheach time corresponding to an exploitation of a series ofalgorithms.
It is well-known that there is no inherently supe-rior method/model in terms of generalization perfor-mance. The No Free Lunch theorem [4] states that inthe absence of prior information about the problem,there are no reasons to prefer one learning algorithmor classifier model over another. The problem of modelselection—choosing appropriate discovered models oralgorithms and their settings for obtaining such mod-els in a given application—is difficult and non-trivialbecause it requires empirical comparative evaluationof discovered models and meta-knowledge on mod-els/algorithms. The user often has to do a trial-and-errorprocess to select the most suitable models from com-peting ones. Clearly, trying all possible options is im-practical, and an informed search process is needed toattain expected models. Informed search requires bothperformance metrics and model characteristics that of-ten are not available to the user. Moreover, the user’sinterest in discovered models is a subjective matter thatdepends much on his/her domain knowledge and some-times is very independent of performance metrics pro-vided by the system. Current data mining provides mul-tiple algorithms within a single system, but the selec-tion and combination of these algorithms are externalto the system and specified by the user. This makesthe KDD process difficult and possibly less efficient inpractice.
Unlike the major research tendency that aims to pro-vide the user with meta-knowledge for an automaticmodel selection as described in the next section, in ourview model selection is semiautomatic and requires aneffective collaboration between the user and the dis-covery system. In such a collaboration, visualizationhas an indispensable role because it can give a deep
understanding of complicated models that the user can-not achieve if using only performance metrics. The re-search on visualization integrated with model selectionis significant because there is currently very limitedvisualization support for the process of building andselecting models in knowledge discovery [5, 6].
The goal of this work is to develop a research systemfor knowledge discovery with support for model selec-tion and visualization. The system called D2MS (DataMining with Model Selection) first provides the userwith the ability to try various algorithm combinationsand their settings. Each combination of algorithms isregistered in a list called a plan. After executing reg-istered plans, the user is supported in evaluating com-peting models quantitatively and qualitatively beforemaking his/her final selection. The quantitative evalu-ation can be obtained by performance metrics providedby the system, while the qualitative evaluation can beobtained by effective visualization of the discoveredmodels.
Within D2MS several data mining methods havebeen implemented, including decision tree inductionmethod CABRO [7], CABROrule [8], conceptual clus-tering method OSHAM and its variants [9], [10], andrule induction method LUPC [11]. These programshave been integrated with several advanced visualiza-tion techniques in D2MS such as tightly-coupled views[12], fish-eye views [13], and particularly the proposedtechnique T2.5D (Tree 2.5 Dimensions) for large hier-archical structures [14].
The rest of the paper is organized as follows.Section 2 discusses related work. Section 3 gives anoverview of the system. Section 4 introduces the D2MSsolution to model selection integrated with visualiza-tion. Section 5 briefly summarizes three data miningmethods—decision tree induction, conceptual cluster-ing, and rule induction—that were implemented inD2MS, and presents two case studies of discoveringknowledge in hospital data—on meningitis and stom-ach cancer—with these methods. Section 6 summarizesthe work and outlines further research.
2. Related Work
Model selection is a general statistical notion, anda probability model is generally a mathematical ex-pression representing some underlying phenomenon[15]. The model selection has usually been viewedin the statistics community in terms of estimation of

A Knowledge Discovery System with Model Selection 127
expected discrepancy E�( f, gθ ) between the underly-ing model f (that is unknown in practice) and approxi-mating models gθ , where θ is the parameter vector [16].The standard methods of model selection in statisticsinclude classical hypothesis testing, maximum like-lihood, Bayes method, minimum description length,cross-validation, bootstrap, and Akaike’s informationcriteria—see for example [16, 17].
The model selection problem has attracted re-searchers in machine learning and recently in knowl-edge discovery because of its significant importance.Most research on model selection in this communityhas focused on two issues: the preselection of mod-els/algorithms that is typically concerned with findingmeasures of relation between the dataset characteris-tics and the models/algorithms performance (referredto as model characteristics); and the post-selection thatis concerned with the evaluation of models/algorithmsusing multi-criteria of performance (referred to as per-formance metrics).
In [18] the author introduced an approach that usesknowledge about the representational biases of a set oflearning algorithms coded in the form of rules in orderto pre-select models or algorithms. In [19] the authorsintroduced three ranking methods of classification al-gorithms: using average ranks, success rate ratios, andsignificant wins. These methods generate rankings byresults obtained by algorithms on the training datasets,and the rankings are evaluated by their distance fromthe ideal ranking built in advance. In [20] the authorsproposed to use learning algorithm profiles to addressthe model selection problem. The algorithm profilesconsist of meta-level feature-value vectors which de-scribe learning algorithms in terms of their represen-tation, functionality, efficiency, robustness, and prac-ticality. NOEMON [21] is a prototype system in thecontext of the classification task that suggests the mostappropriate classifier, deciding on the basis of mor-phological similarity between the new dataset and theexisting collection.
Most research on performance metrics focuses onmulti-criteria for doing post-selection of algorithms.In [22] the authors proposed a multi-criteria evaluationmetric that aims to take into account both positive andnegative properties of data mining algorithms, and pro-vides a fast and comprehensive evaluation of variousalgorithms. In [23] the author strengthened the practicalrole of stratified cross validation in model selection formany common application domains by a large numberof careful experiments.
The above-mentioned research efforts aimed to findmeta-knowledge towards an automatic selection ofmodels/algorithms and did not take into account theparticipation of the user during model selection. Also,they often limited themselves to the classification prob-lem with supervised data in which performance met-rics can be computed and served for the predictiongoal. The situation is somewhat different in the caseof the clustering problem where the main goal is de-scription and several usual performance metrics suchas accuracy cannot be computed from unsuperviseddata. While D2MS provides model characteristics andperformance metrics for a quantitative evaluation, themajor distinguishing feature of the D2MS system isits tight integration of visualization with model selec-tion that supports a qualitative evaluation so that theuser can make a better final selection based on his/herinsight into discovered models.
Many KDD systems provide visualization of dataand knowledge, and different visualization techniqueshave been developed or adapted to the KDD process.MineSet [24] provides several 3D visualizers, in par-ticular a 3D Tree Visualizer. In [25] the authors devel-ops an interactive visualization in decision tree con-struction for supporting an effective cooperation of theuser and the computer in classification. In [26] the au-thors tightly integrate visualization with five steps ofthe KDD process. D2MS shares common features withthe above systems in human-machine interaction andprocess visualization, and contributes two additionalfeatures. Firstly, it integrates visualization into modelselection by providing visual information of competingmodels for the qualitative evaluation of the user. Sec-ondly, it provides the effective view T2.5D for large hi-erarchical structures that can be seen as an alternative topowerful techniques for representing large hierarchicalstructures such as 3D cone trees [27] or 2D hyperbolictrees [28]. For large trees, T2.5D can give an effectiveview by displaying subtrees of the user’s interest in 2Dspace and the rest of the tree in a virtual 3D space [14].
D2MS is a KDD research system that shares sev-eral common points with some KDD research sys-tems. MLC++ [29] is a powerful library of classifi-cation algorithms with guidance to compare and se-lect appropriate algorithms for the classification task.It also provides a visualization and interfaces betweenprograms for both end-users and software develop-ers. Sharing the class library approach, while MLC++is only suitable for well-trained programmers, D2MScan orient a user without much computer knowledge.
128 Ho et al.
DBMiner [3] is a KDD system that provides a widespectrum of data mining functions. As interactive datamining environments, while DBMiner focuses on atight integration of data mining methods with on-lineanalytical processing, D2MS focuses on a tight in-tegration of data mining methods with model selec-tion and visualization. FlexiMine [30] is a flexibleplatform for KDD research and application develop-ment. It is designed as a testbed for data mining re-search and a generic knowledge discovery tool. Whilesharing with Fleximine the integration of most KDDfunctions and the flexibility to do data mining, D2MSfocuses on supporting the active participation of theuser.
3. Overview of the System
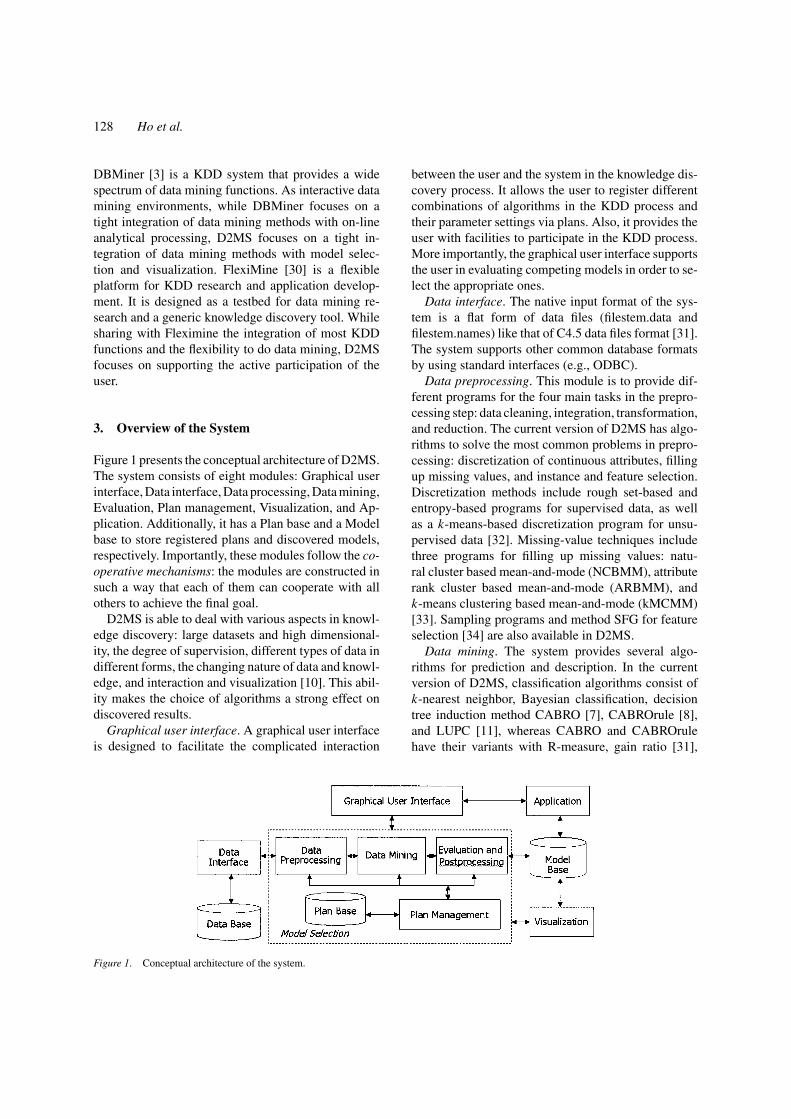
Figure 1 presents the conceptual architecture of D2MS.The system consists of eight modules: Graphical userinterface, Data interface, Data processing, Data mining,Evaluation, Plan management, Visualization, and Ap-plication. Additionally, it has a Plan base and a Modelbase to store registered plans and discovered models,respectively. Importantly, these modules follow the co-operative mechanisms: the modules are constructed insuch a way that each of them can cooperate with allothers to achieve the final goal.
D2MS is able to deal with various aspects in knowl-edge discovery: large datasets and high dimensional-ity, the degree of supervision, different types of data indifferent forms, the changing nature of data and knowl-edge, and interaction and visualization [10]. This abil-ity makes the choice of algorithms a strong effect ondiscovered results.
Graphical user interface. A graphical user interfaceis designed to facilitate the complicated interaction
Figure 1. Conceptual architecture of the system.
between the user and the system in the knowledge dis-covery process. It allows the user to register differentcombinations of algorithms in the KDD process andtheir parameter settings via plans. Also, it provides theuser with facilities to participate in the KDD process.More importantly, the graphical user interface supportsthe user in evaluating competing models in order to se-lect the appropriate ones.
Data interface. The native input format of the sys-tem is a flat form of data files (filestem.data andfilestem.names) like that of C4.5 data files format [31].The system supports other common database formatsby using standard interfaces (e.g., ODBC).
Data preprocessing. This module is to provide dif-ferent programs for the four main tasks in the prepro-cessing step: data cleaning, integration, transformation,and reduction. The current version of D2MS has algo-rithms to solve the most common problems in prepro-cessing: discretization of continuous attributes, fillingup missing values, and instance and feature selection.Discretization methods include rough set-based andentropy-based programs for supervised data, as wellas a k-means-based discretization program for unsu-pervised data [32]. Missing-value techniques includethree programs for filling up missing values: natu-ral cluster based mean-and-mode (NCBMM), attributerank cluster based mean-and-mode (ARBMM), andk-means clustering based mean-and-mode (kMCMM)[33]. Sampling programs and method SFG for featureselection [34] are also available in D2MS.
Data mining. The system provides several algo-rithms for prediction and description. In the currentversion of D2MS, classification algorithms consist ofk-nearest neighbor, Bayesian classification, decisiontree induction method CABRO [7], CABROrule [8],and LUPC [11], whereas CABRO and CABROrulehave their variants with R-measure, gain ratio [31],
A Knowledge Discovery System with Model Selection 129
gini-index [35], and χ2 [36], and each of them can pro-duce trees or rule sets by either error-based pruning [31]or the post-pruning technique in [8]. Clustering algo-rithms include: (1) k-means and its variants for mixednumerical and categorical attributes using an efficientmixed similarity measure MSM [37], and (2) concep-tual clustering algorithm OSHAM [9, 10]. These pro-grams can read data in the common input form, and theycan represent discovered models in a form readable byother related modules (post-processing, visualization,and plan management).
Post-processing and evaluation. This module pro-vides tools for post-processing and evaluation of dis-covered models. Its available tools include those for k-fold stratified cross validation integrated with data min-ing programs [7], for post-pruning of decision tree [8],for automatically generating tables containing synthe-sized information of discovered models, and for export-ing competing models into other easy-to-understandforms for the user (e.g., the spreadsheet format [10]),as well as forms readable for visualization programs(e.g., T2.5D for visualizing the hierarchical structures[14]).
Plan management. The main function of this moduleis to manage a plan base containing plans declared bythe user. It also coordinates modules on data mining,evaluation, and visualization in model selection.
Data and knowledge visualization. This module con-sists of three visualizers for data, rules, and hierarchicalstructures. The algorithms in other modules can fre-quently invoke this module in order to help the usermake effective use of them.
Application. This module contains utilities that helpthe user to use discovered models. A model can beused to match an unknown instance, or to generatean interactive dialogue in which the system conductsa series of questions/answers in order to predict theoutcome.
4. Model Selection and Visualization
4.1. Model Selection
The interestingness of discovered patterns/models iscommonly characterized by several criteria: evidenceindicates the significance of a finding measured by astatistical criterion; redundancy amounts to the simi-larity of a finding with respect to other-findings andmeasures to what degree a finding follows from an-
other one; usefulness relates a finding to the goal ofthe users; novelty includes the deviation from priorknowledge of the user or system; simplicity refers tothe syntactical complexity of the presentation of a find-ing, and generality is determined by the fraction of thepopulation a finding refers to. The interestingness canbe seen as a function of the above criteria [38] andstrongly depends on the user as well as his/her domainknowledge.
Working with medical experts for more than twoyears, we eventually came to realize that their evalua-tion are not always concerned with performance met-rics provided by discovery systems. In our case studieson meningitis and stomach cancer domains presentedin Section 5, domain experts were often interested inmodels that do not necessarily have the highest pre-dictive accuracy but those that give them somethingnew. It turns out that model selection in a KDD systemwould be a user-centered process that depends stronglyon active participation by the user.
The key idea of our solution to model selection inD2MS is to support an effective participation of theuser in this process. Concretely, D2MS first supportsthe user in doing trials on combinations of algorithmsand their parameter settings in order to produce com-peting models, and then supports the user to evaluatethem quantitatively and qualitatively by providing bothperformance criteria as well as visualization of thesemodels.
The model selection in D2MS mainly involves thethree steps of data processing, data mining, and post-processing, as shown in Fig. 1. There are three phasesin doing model selection in D2MS, all of which aremanaged by the plan management module: (1) regis-tering plans of selected algorithms and their settings;(2) executing the plans to discover models; (3) select-ing appropriate models by a comparative evaluation ofcompeting models.
The first phase is to register plans. A plan is an or-dered list of algorithms associated with their parametersettings that can yield a model or an intermediate re-sult when being executed. The plans are represented ina tree form called plan tree whose nodes are selectedalgorithms associated with their settings (the top-leftwindow in Fig. 2). The nodes on a path of the plantree must follow the order of preprocessing, data min-ing, and post-processing. A plan may contain severalalgorithms (nodes) of each step, for example filling inmissing values by the NCBMM and discretizing con-tinuous attributes by the entropy-based algorithm in

130 Ho et al.
Figure 2. A screen of D2MS in selecting models learned from meningitis data: the top-left window shows the plan tree; the bottom-leftwindow shows the summary table of performance metrics of discovered models; the bottom-right window shows detail information of the modelbeing activated (highlighted); and the top-right window shows tightly-coupled views of the model in which the detailed view in the right partcorresponds to the field-of-view specified in the left part.
preprocessing, then mining by CABRO and LUPC, andevaluating discovered results by k-fold cross validationin post-processing.
The plan management module provides the user witha friendly user-interface to register, modify, and deleteplans on the plan tree. D2MS allows the user to registerplans fully or gradually. A plan can be fully registeredby determining straightaway all of its component algo-rithms and their settings so that it can yield a model.However, a plan can be registered gradually by deter-mining algorithms and their settings step by step. Thismode of registration is useful in mining large datasets.For example, to do a task in the KDD process, the usercan try several algorithms/settings, and then evaluatetheir results and select only promising ones for doingfurther tasks.
The plan management module maintains profiles ofalgorithms available in preprocessing, data mining, and
post-processing of D2MS. An algorithm profile con-tains information about the algorithm functions, its re-quirements, types and effect of its parameters. An al-gorithm is registered via a dialog box when it is addedinto a plan. For example, to generate a decision tree byCABRO, the user needs to choose the minimum num-ber of instances at leaf nodes, the lowest accepted errorrate, the attributes to be grouped, the method for fillingin missing values, etc. The top-left window in Fig. 2shows a plan tree created for mining the meningitisdata (Section 5). This plan tree consists of NCBMMfor imputing missing values, a discretization based onentropy and rough sets, and CABRO with differentselection measures of LUPC with several parametersettings.
The second phase is to execute registered plans.While gradually registering a plan, the user can runan algorithm just after adding it to the plan, then
A Knowledge Discovery System with Model Selection 131
evaluate its results before deciding whether to continuethe plan from its current stage with other algorithms, orto backtrack and try the plan with another algorithm orsetting. The user also can run a plan after fully register-ing it, or even register a number of plans and then runthem altogether. The intermediate results, the discov-ered models and their summaries and exported formswill be automatically created and stored in the modelbase.
The third phase is to select appropriate models.D2MS provides a summary table presenting perfor-mance metrics of discovered models according to ex-ecuted plans (the bottom-left window in Fig. 2). How-ever, the user can evaluate each model in depth by visu-alizing it, browsing its structure, checking its relation-ship with the dataset, etc. (the top-right and bottom-right windows in Fig. 2). The user also can visualizeseveral models simultaneously to compare them (seeFig. 4). By getting a real insight into the competingmodels, the user certainly can make a better selectionof models.
The performance metrics on discovered models arereported according to the types of algorithms. D2MSreports a multidimensional measure for classificationsupervised algorithms consisting of the following sub-measures: (1) accuracy, (2) size (number of leaf nodesor rules), (3) training time, (4) pruning time, (5) re-source demand (memory). D2MS also reports a multi-dimensional measure for unsupervised clustering algo-rithms with the following sub-measures: (1) size (num-ber of clusters); (2) number of hierarchy levels (3) train-ing time, (4) resource demand (memory).
Section 4.2 addresses the visualization in model se-lection, and Section 5 will illustrate the D2MS’s modelselection with more details in regards to medicineapplications.
4.2. Visualization Support for Model Selection
In D2MS, visualization helps the user to interpret dataand models as well their connections in order to under-stand and evaluate models better. Through visualiza-tion the user also can see better the effect of algorithmsettings on resulted models so that he/she can adjustsettings to reach adequate models.
After a description of available visualizers in D2MS,this subsection focuses on two highlighted character-istics of its visualization: visualization of hierarchicalstructures and a tight integration of visualization withmodel selection.
4.2.1. Visualizers. There are three visualizers inD2MS: data visualizer, rule visualizer, and hierarchyvisualizer.
Data visualizer. It provides the user graphical viewson the statistics of the input data and relations betweenattributes. These include multiple forms of viewingdata such as tables, cross-tabulations, pie or charts,cubes. The data visualizer supports the user in the pre-processing step and in the selection of algorithms whenregistering plans.
Rule visualizer. It allows the user to view rules gener-ated by CABROrule or LUPC. The visualizer providesgraphical views on statistics of conditions and conclu-sions of a rule, correctly and wrongly matched cases inboth training and testing data, and links between rulesand data.
Hierarchy visualizer. It visualizes hierarchical struc-tures generated by CABRO and OSHAM. The visu-alizer provides different views that may be suitablefor different types and sizes of hierarchies. The usercan view an overall structure of a hierarchy togetherwith the detailed information of each node. D2MSprovides several visualization techniques that allowthe user to visualize large hierarchical structures ef-fectively. The tightly-coupled views [12] simultane-ously display a hierarchy in normal size and tiny sizethat allows the user to determine quickly the field-of-view and to pan to the region of interest (Fig. 2). Thefish-eye view [13] distorts the magnified image so thatthe center of interest is displayed at high magnifica-tion, while the rest of the image is progressively com-pressed. Also, the new technique T2.5D [14] is imple-mented in D2MS for visualizing very large hierarchicalstructures.
4.2.2. Trees 2.5 Dimensions. The user might find itdifficult to navigate a very large hierarchy, even withtightlycoupled and fish-eye views. To overcome thisdifficulty, we have been developing a new techniquecalled T2.5D (stands for Trees 2.5 Dimensions).
T2.5D is inspired by the work of Reingold andTilford [39] that draws clear trees in a reasonable timewith reasonable storage. Different from tightly-coupledand fish-eye views that can be seen as location-basedviews (view of objects in a region), T2.5D can beseen as a relation-based view (view of related objects).The starting point of T2.5D is the observation that alarge tree consists of many subtrees that are not usu-ally and necessarily viewed simultaneously. The keyidea of T2.5D is to represent a large tree in a virtual
132 Ho et al.
3D space (subtrees are overlapped to reduce occupiedspace), while each subtree of interest is displayed in a2D space. To this end, T2.5D determines the fixed po-sition of each subtree (its root node) in two axes (X andY) and, in addition, it computes dynamically a Z-orderfor this subtree in an imaginary axis Z. A subtree witha given Z-order is displayed in front of its siblings thathave higher Z-orders.
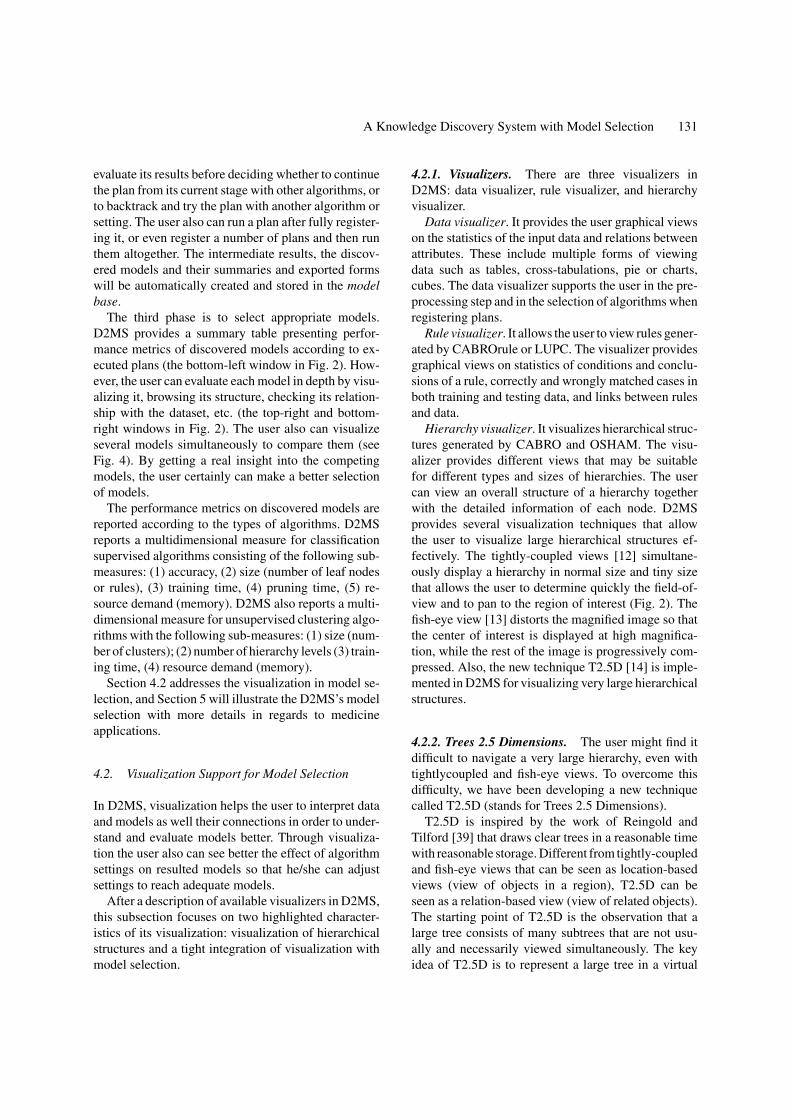
When visualizing and navigating a tree, at each mo-ment the Z-order of all nodes on the path from the rootto a node in focus in the tree is set to zero by T2.5D.The active wide path to a node in focus, which con-tains all nodes on the path from the root to this node infocus and their siblings, is displayed in the front of thescreen with highlighted colors to give the user a clearview. Other parts of the tree remain in the backgroundto provide an image of the overall structure. With Z-order, T2.5D can give the user an impression that treesare drawn in a 3D space. The user can easily change
Figure 3. T2.5D provides views in between 2D and 3D. The pruned tree learned from the stomach cancer data by CABRO has 1795 nodeswhere the active wide path to a node in focus displays all of its direct relatives in a 2D view.
the active wide path by choosing another node infocus [14].
We have tested T2.5D with various real and artifi-cial datasets. One example is the case of the U.S. cen-sus bureau database consisting of 199,523 instancesdescribed by 40 numeric and symbolic attributes(103 Mbytes). T2.5D handles well a tree learned fromthis dataset that has nearly 20,000 decision and leafnodes. The ease of navigation of such a large tree de-pends mainly on the depth of the tree (number of treelevels) and on the number of nodes having many sub-nodes (branches) but not on the number of nodes, sincemost of nodes are virtually represented. The under-standing of such trees is supported by the use of dif-ferent colors to label classes of leaf nodes. Figure 3illustrates a pruned tree of 1795 nodes learned fromstomach cancer data (Section 5). In general, more than1,000 nodes in several levels can be displayed togetheron the screen [14].
A Knowledge Discovery System with Model Selection 133
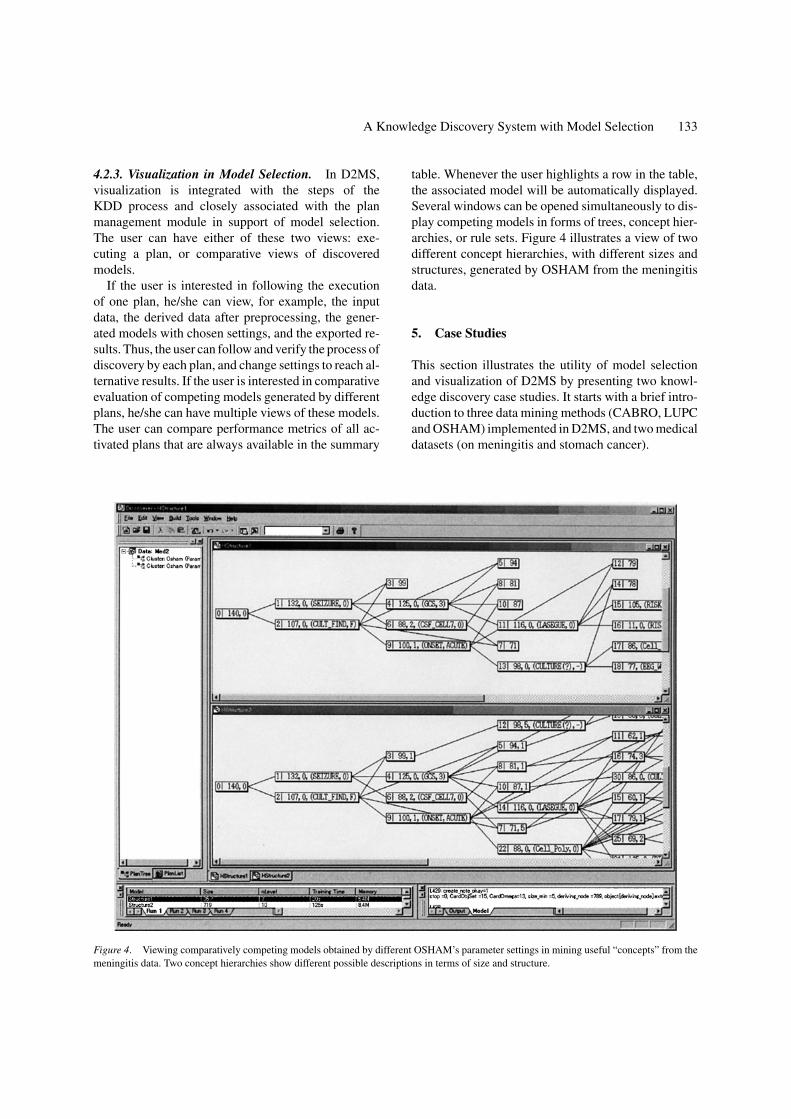
4.2.3. Visualization in Model Selection. In D2MS,visualization is integrated with the steps of theKDD process and closely associated with the planmanagement module in support of model selection.The user can have either of these two views: exe-cuting a plan, or comparative views of discoveredmodels.
If the user is interested in following the executionof one plan, he/she can view, for example, the inputdata, the derived data after preprocessing, the gener-ated models with chosen settings, and the exported re-sults. Thus, the user can follow and verify the process ofdiscovery by each plan, and change settings to reach al-ternative results. If the user is interested in comparativeevaluation of competing models generated by differentplans, he/she can have multiple views of these models.The user can compare performance metrics of all ac-tivated plans that are always available in the summary
Figure 4. Viewing comparatively competing models obtained by different OSHAM’s parameter settings in mining useful “concepts” from themeningitis data. Two concept hierarchies show different possible descriptions in terms of size and structure.
table. Whenever the user highlights a row in the table,the associated model will be automatically displayed.Several windows can be opened simultaneously to dis-play competing models in forms of trees, concept hier-archies, or rule sets. Figure 4 illustrates a view of twodifferent concept hierarchies, with different sizes andstructures, generated by OSHAM from the meningitisdata.
5. Case Studies
This section illustrates the utility of model selectionand visualization of D2MS by presenting two knowl-edge discovery case studies. It starts with a brief intro-duction to three data mining methods (CABRO, LUPCand OSHAM) implemented in D2MS, and two medicaldatasets (on meningitis and stomach cancer).
134 Ho et al.
5.1. CABRO, LUPC, and OSHAM
5.1.1. Decision Tree Method CABRO. Decision treeinduction (DTI) is one of the most widely used knowl-edge discovery methods for supervised data. From agiven set of labeled instances, DTI induces a model(classifier) in the form of a decision tree that predictsclasses of unknown instances. Typical decision treemethods include C4.5 [31] and CART [35].
The two main problems in DTI are attribute selec-tion and pruning. Attribute selection is to decide whichattribute will be chosen to branch a decision node [36].Pruning is to avoid over-fitting by reducing the com-plexity of the tree [40]. In our current system, deci-sion tree program CABRO (Construction d’une Basede Regles a partir d’Observations) [7] or its variantCABROrule [8] allow the user to generate different treemodels or rule sets by combining one of four attributeselection measures (gain-ratio [31], the gini-index [35],χ2 [36] and R-measure [7]) with one of the followingpruning algorithms: error-complexity, reduced-error,and pessimistic error [31, 35].
The following techniques resulting from our re-search on DTI have been implemented in the system: ef-ficient visualization of hierarchical structures includingtightly-coupled, fish-eye, and T2.5D views [14]; andrule post-pruning of large trees in the post-processingstep [8]. These techniques offer advantages in data min-ing in which datasets are often large, and consequentlyso are the decision trees. From the U.S. census database,C4.5 produces a pruned tree of about 18,500 decisionand leaf nodes, which are almost impossible to under-stand in text form. Also, C4.5 could not convert thistree into a rule set after two days of running on a Sunworkstation of 128 Mbytes of RAM memory. CABRO,however, provides an excellent view of its discoveredtree by T2.5D, and converted the tree into rules in anear linear time of O(n log n).
5.1.2. Rule Induction Method LUPC. LUPC (Learn-ing Unbalanced Positive Class) is another approach tolearning descriptive rules from supervised data. LUPCpermits two learning modes: learning one target classor learning all classes. If the user is interested in learn-ing one target class, this class will be considered as thepositive class C+ and all other classes as the negativeclass C−. With a suitable voting procedure and by se-quentially taking each class as the target class, LUPCcan learn all classes. It has been shown to be very effec-
tive when learning a minority class as the target classin a unbalanced dataset, and it is comparable to otherwell-known methods when learning all classes [11].
LUPC yields different rule sets depending on the set-tings of its four parameters: (1) minimum accuracy ofa rule α; (2) minimum coverage of a rule β; (3) numberof candidate attribute-value pairs η; and (4) number ofcandidate rules γ . There are three main features thatdistinguish LUPC from related methods and allow it tolearn effectively in unbalanced datasets. Firstly, it effi-ciently combines separate-and-conquer rule induction[41] with association rule mining by finding αβ-strongrules biased on accuracy and cover ratio with adaptivethresholds. Secondly, it exploits a property of rules inunbalanced datasets1 (we skip our proof as it can beverified easily) to make an effective search with a largebeam search parameter, as well as using data in thenegative class to speed up the mining process on theminority positive class. Thirdly, it integrates preprun-ing and post-pruning in a way that can avoid overfit-ting. Note that the risk of overfitting to the particulardataset(s) given the hand-turning process of parame-ter settings is avoided in D2MS while using CABRO,CABROrule, and LUPC because of the pruning modeof these programs.
5.1.3. Conceptual Clustering Method OSHAM.Conceptual clustering is a typical knowledge discov-ery method for unsupervised data. Its basic task is froma given set of unlabelled instances to find simulta-neously a hierarchical model that determines usefulobject subsets and their intensional definitions. Thesetwo problems relate to another important problem, thatof interpreting discovered concepts in the hierarchicalstructure.
The method OSHAM (Making Automatically Hier-archies of Structured Objects) employs a hybrid rep-resentation of concepts that combines advantages ofclassical, prototype, and exemplar views on concepts[9]. Depending on parameter settings, OSHAM canextract non-disjoint or disjoint hierarchical models ofconcepts. The algorithm OSHAM is non-incrementaland divisive. For each discovered concept, OSHAMseeks recursively for more specific subconcepts accord-ing to a quality function defined in its hybrid represen-tation. The form and the size of OSHAM’s hierarchicalmodels depend on plans and settings of the followingparameters: (1) the concept hierarchy to discover isdisjoint or non-disjoint; (2) the minimum size of each
A Knowledge Discovery System with Model Selection 135
node; (3) the threshold about the concept dispersion;and (4) the number of competitors for beam search.OSHAM is associated with an interpretation procedureto use discovered models. There are several variants ofOSHAM: incremental I-OSHAM that can learn whendatabases are incrementally updated; and approximateA-OSHAM that can learn approximate concepts whendata are uncertain and imprecise [10].
OSHAM yields different models with concept’s de-scription in the hierarchy when parameter settings arevaried. The selection of appropriate models resultingfrom unsupervised methods is difficult because only afew quantitative indexes are available. However, OS-HAM is implemented in the graphical environment ofD2MS and it supports the use in evaluating competingmodels. In fact, the user can visualize the concept hier-archies discovered by OSHAM, the general-to-specificrelation of the concepts, the description associated witheach concept such as its typical attribute-value pairs, thedispersion among its members, the estimated occur-rence probability of its members, etc. [9, 10]. Figure 4shows D2MS support for comparatively evaluating twomodels discovered by OSHAM, with different size andstructure, from meningitis data.
5.2. The Meningitis and Stomach Cancer Datasets
5.2.1. Meningitis Data. The meningitis dataset wascollected at the Medical Research Institute, TokyoMedical and Dental University from 1979 to 1993. Itcontains data of patients who suffered from meningi-tis and who were admitted to the department of emer-gency and neurology in several hospitals. There are 38numeric and categorical attributes presenting patientshistory, physical examination, laboratory examination,diagnosis, therapy, clinical course, final status, and riskfactors. The tasks determined by medical experts in ex-tracting knowledge from this dataset is to find factorsimportant for (1) diagnosis of meningitis, (2) detectionof bacteria or virus, and (3) prediction of prognosis[42]. The dataset and these tasks have been given tochallenge the research community [11].
5.2.2. Stomach Cancer Data. The stomach cancerdataset collected at the National Cancer Center inTokyo during 1962–1991 is a very precious source forthis research. It contains data of 7,520 patients: de-scribed originally by 83 numeric and categorical at-tributes. These include information on patients, symp-
toms, type of cancer, longitudinal and circular loca-tion, serosal invasion, metastasis, pre-operative com-plication, post-operative complication, etc. One goal isto use attributes containing patient information beforethe operation to predict the patient status after the op-eration. The domain experts are particularly interestedin finding predictive and descriptive rules for the classof patients who died within 90 days after operation(among five outcome classes “death within 90 days”,“death after 90 days”, “death after 5 years”, “alive”,“unknown”).
5.3. Knowledge Extraction from Meningitis Data
The main feature of the problem of knowledge ex-traction from meningitis data is its multi-tasks. Eachof the tasks (1), (2), and (3) can be done by two al-ternative target attributes. For example, the extractionof diagnosis knowledge can be done by using eitherattribute DIAG2 that groups diagnosis results into 2classes (VIRUS and BACTERIA), or attribute DIAGthat groups diagnosis results into 6 classes (ABSCESS,BACTERIA, BACTE(E), TB(E), VIRUS(E), VIRUS).Similarly, two tasks of extracting predictive and de-scriptive knowledge on the detection of bacteria/virusand prognosis can be carried out with pairs of attributesCULTFIND and CULTURE (2 and 13 classes), andCOURSE and CCOURSE (2 and 12 classes), respec-tively. There are a total of 6 target attributes in thisdataset, and accordingly, 6 datasets derived from theoriginal one for the mining tasks. To find interestingknowledge in such a complicated problem, the inter-action of and iteration with various parameter settingsof data mining methods are indispensable in order togenerate and select models. In our experiments, it wasdifficult to run iteratively with different parameter set-tings and to comparatively evaluate other data miningsystems such as C4.5 [31], its successor See5, or CBA[43].
Different plans have been created in D2MS for do-ing these tasks. Each of them is typically a sequenceof methods for discretization of numerical attributes,data mining, and visualization of extracted knowledgeor its exportation to the Excel format. Two super-vised discretization methods in D2MS yield 2 differ-ent derived datasets from each of 6 above-mentionedderived datasets as these methods depend on theclass attribute. Thus, we obtained totally 12 differentderived datasets among them 4 derived datasets can be

136 Ho et al.
used for one mining task. The entropy-based discretiza-tion method often ignores many attributes and yieldsfew discretized values on the remaining attributes. Therough set-based discretization method does not ignoreany attributes and often yields more values for attributesto be discretized. When data mining methods CABRO(CABROrule), LUPC, and OSHAM with their differ-ent settings are applied to these two derived datasets,different possible models can be generated.
The plans associated with CABRO produce 16 com-peting decision trees, with the default parameter set-ting, for each of the mining tasks (1), (2), or (3) byusing alternatively 4 attribute selection measures (R-measure, gain-ratio, gini-index, and χ2) on 4 deriveddatasets. Figure 2 illustrates such generated decisiontree models. The bottom-left window reports the per-formance metrics on each discovered model. Each ofthem when highlighted will be visualized in the top-right window, and detailed information of the modelcan be seen in the bottom-right window. The generatedtrees can be visualized and navigated by fish-eyes andT2.5D visualizers. The utility of D2MS is supported bythe fact that it is relatively easy to induce decision treesfrom a dataset but it is much more difficult to select thebest among them. The convenient way of evaluatingand comparing generated decision trees in D2MS is ofgreat help to the user.
The plans associated with LUPC (also CABROrule)produce competing rule sets. LUPC runs in two modes:(1) learning all classes, and (2) learning one target classof the target attribute (one model will be generated forone target class, says, the class VIRUS of the attributeDIAG2). D2MS allows us to easily try LUPC with var-ious parameter settings and to evaluate the obtainedrule sets by the performance metrics and visualizationof rules and data. By analyzing early results obtainedby varying parameter settings of LUPC, we have deter-mined a promising parameter setting for this dataset:minimum accuracy of a rule α = 95%, minimum cov-erage of a rule β = 2, number of candidate attribute-value pairsη = 100, number of candidate rulesγ = 30.With these parameters we obtained totally 73 modelsfrom 12 derived datasets when running two learningmodes (this number of models is smaller than the num-ber of models possibly generated as we did not applythe learning mode of one target class to several classesof three attributes DIAG, CULTURE, and CCOURSEas they have very few training instances). In general, thenumber of discovered models depends on the parametersettings. Rules found for identifying factors important
for diagnosis, detection of bacteria/virus, and predict-ing prognosis were well accepted by domain experts[11].
The plans associated with OSHAM produce differ-ent concept hierarchies depending on the settings offour parameters in OSHAM. Each concept hierarchypresents a hierarchical model of concepts with mul-tiple links where each concept is characterized by a10-tuple of the components including its intension, ex-tension, etc. [9]. As the size and structure of gener-ated concept hierarchies may greatly change when OS-HAM’s parameters are varied, it is particularly difficultto produce and select appropriate models. The tree vi-sualizer of D2MS offers a great support to the user inobserving and evaluating models, especially the modelstructure and concept components. For example, thetree visualizer allows us to answer a number of impor-tant questions in doing model selection, for example,which attribute-values pairs are the most significant indiscovered clusters? Also, what is the relation betweenthe model size (simplicity) and the quality of discov-ered concepts (e.g., its dispersion, occurence probabil-ity, etc.)?
Figure 4 illustrates two different models visualizedsimultaneously for the comparison purpose. In thisexample, the models consist of 75 and 114 concepts(nodes) generated by two plans containing OSHAMwith its parameter settings (1, 7, 0.3, 3) and (1, 4, 0.3,4), respectively. The user can observe the structure andlinks of these models, as well as the characteristics ofeach concept. Below is an example of a concept foundby OSHAM from the meningitis data with parameters(1, 7, 0.3, 3). The components of this concept, whichcovers 88 cases of which 2 are exceptional, can be seenwhen navigating the concept hierarchy.
CONCEPT 59Level = 4, Super Concepts = {25},Sub Concepts = {60 61 62 63 64}
Concept dispersion = 0.297297Local instance dispersion = 0.297297Concept probability = 0.628571Concept local conditional probability= 1.000000
Features = {(WBC,0), (SEIZURE,1),(EEG FOCUS(?),-), (CSF CELL, 0)}
Local instances/Covered instances = 2/88Local instance dispersion = 0.297297Local instance conditional probability= 1.000000
A Knowledge Discovery System with Model Selection 137
5.4. Knowledge Extraction from StomachCancer Data
The extraction of prediction and description rules forthe class “death within 90 days” from stomach cancerdata is a difficult task because the classes in this datasethave a very imbalanced distribution and they are notwell separated. Several well-known data mining sys-tems C4.5, See5, CBA, and Rosetta have been appliedto do this task. However, the obtained results were farfrom expectations: they have low support and confi-dence, and usually relate to only a small percentageof patients of the target class. In next subsections, weshow that the method LUPC, with visualization tools ofD2MS, allows us to detect and select some interestingrules.
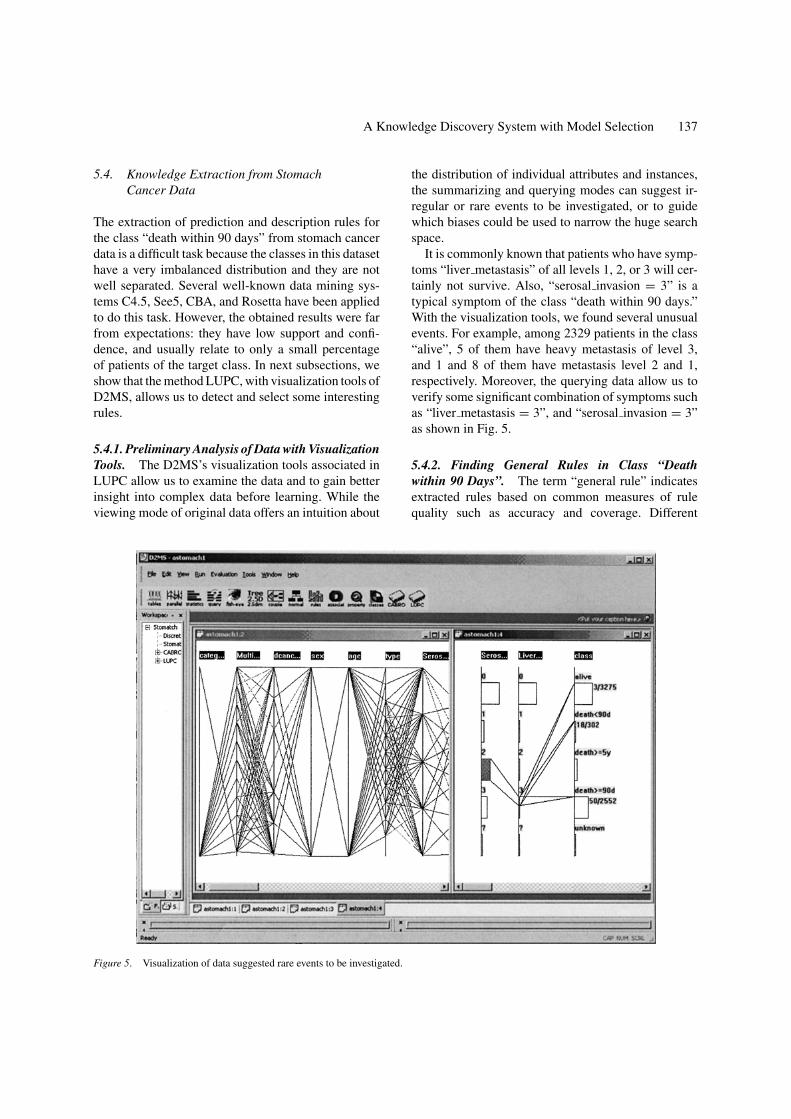
5.4.1. Preliminary Analysis of Data with VisualizationTools. The D2MS’s visualization tools associated inLUPC allow us to examine the data and to gain betterinsight into complex data before learning. While theviewing mode of original data offers an intuition about
Figure 5. Visualization of data suggested rare events to be investigated.
the distribution of individual attributes and instances,the summarizing and querying modes can suggest ir-regular or rare events to be investigated, or to guidewhich biases could be used to narrow the huge searchspace.
It is commonly known that patients who have symp-toms “liver metastasis” of all levels 1, 2, or 3 will cer-tainly not survive. Also, “serosal invasion = 3” is atypical symptom of the class “death within 90 days.”With the visualization tools, we found several unusualevents. For example, among 2329 patients in the class“alive”, 5 of them have heavy metastasis of level 3,and 1 and 8 of them have metastasis level 2 and 1,respectively. Moreover, the querying data allow us toverify some significant combination of symptoms suchas “liver metastasis = 3”, and “serosal invasion = 3”as shown in Fig. 5.
5.4.2. Finding General Rules in Class “Deathwithin 90 Days”. The term “general rule” indicatesextracted rules based on common measures of rulequality such as accuracy and coverage. Different
138 Ho et al.
Table 1. Number and quality of rules discovered by various data mining methods.
Nb. rules
cover ≥ 1, cover ≥ 7, cover ≥ 10,Methods acc ≥ 50% acc ≥ 80% acc ≥ 50% Method LUPC Nb. rules
See5 (CF = 25%) 16 0 1 cover ≥ 1, acc ≥ 50% 225
See5 (CF = 99%) 178 2 1 cover ≥ 7, acc = 80% 22
CBA-CB 106 1 0 cover ≥ 7, acc ≥ 100% 4
CBA-CAR 1,496 1 45 cover ≥ 10, acc ≥ 50% 45
Rosetta 19,564 5 0 cover ≥ 10, acc ≥ 60% 23
cover ≥ 10, acc ≥ 70% 6
cover ≥ 10, acc ≥ 80% 0
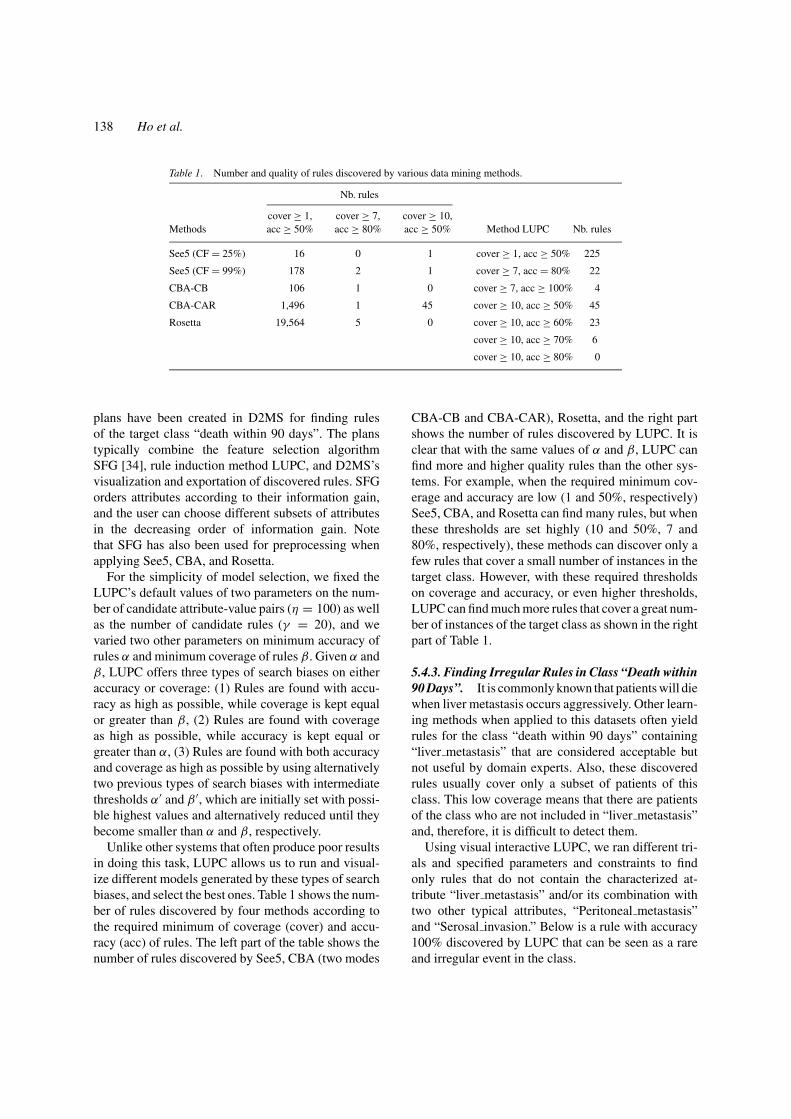
plans have been created in D2MS for finding rulesof the target class “death within 90 days”. The planstypically combine the feature selection algorithmSFG [34], rule induction method LUPC, and D2MS’svisualization and exportation of discovered rules. SFGorders attributes according to their information gain,and the user can choose different subsets of attributesin the decreasing order of information gain. Notethat SFG has also been used for preprocessing whenapplying See5, CBA, and Rosetta.
For the simplicity of model selection, we fixed theLUPC’s default values of two parameters on the num-ber of candidate attribute-value pairs (η = 100) as wellas the number of candidate rules (γ = 20), and wevaried two other parameters on minimum accuracy ofrules α and minimum coverage of rules β. Given α andβ, LUPC offers three types of search biases on eitheraccuracy or coverage: (1) Rules are found with accu-racy as high as possible, while coverage is kept equalor greater than β, (2) Rules are found with coverageas high as possible, while accuracy is kept equal orgreater than α, (3) Rules are found with both accuracyand coverage as high as possible by using alternativelytwo previous types of search biases with intermediatethresholds α′ and β ′, which are initially set with possi-ble highest values and alternatively reduced until theybecome smaller than α and β, respectively.
Unlike other systems that often produce poor resultsin doing this task, LUPC allows us to run and visual-ize different models generated by these types of searchbiases, and select the best ones. Table 1 shows the num-ber of rules discovered by four methods according tothe required minimum of coverage (cover) and accu-racy (acc) of rules. The left part of the table shows thenumber of rules discovered by See5, CBA (two modes
CBA-CB and CBA-CAR), Rosetta, and the right partshows the number of rules discovered by LUPC. It isclear that with the same values of α and β, LUPC canfind more and higher quality rules than the other sys-tems. For example, when the required minimum cov-erage and accuracy are low (1 and 50%, respectively)See5, CBA, and Rosetta can find many rules, but whenthese thresholds are set highly (10 and 50%, 7 and80%, respectively), these methods can discover only afew rules that cover a small number of instances in thetarget class. However, with these required thresholdson coverage and accuracy, or even higher thresholds,LUPC can find much more rules that cover a great num-ber of instances of the target class as shown in the rightpart of Table 1.
5.4.3. Finding Irregular Rules in Class “Death within90 Days”. It is commonly known that patients will diewhen liver metastasis occurs aggressively. Other learn-ing methods when applied to this datasets often yieldrules for the class “death within 90 days” containing“liver metastasis” that are considered acceptable butnot useful by domain experts. Also, these discoveredrules usually cover only a subset of patients of thisclass. This low coverage means that there are patientsof the class who are not included in “liver metastasis”and, therefore, it is difficult to detect them.
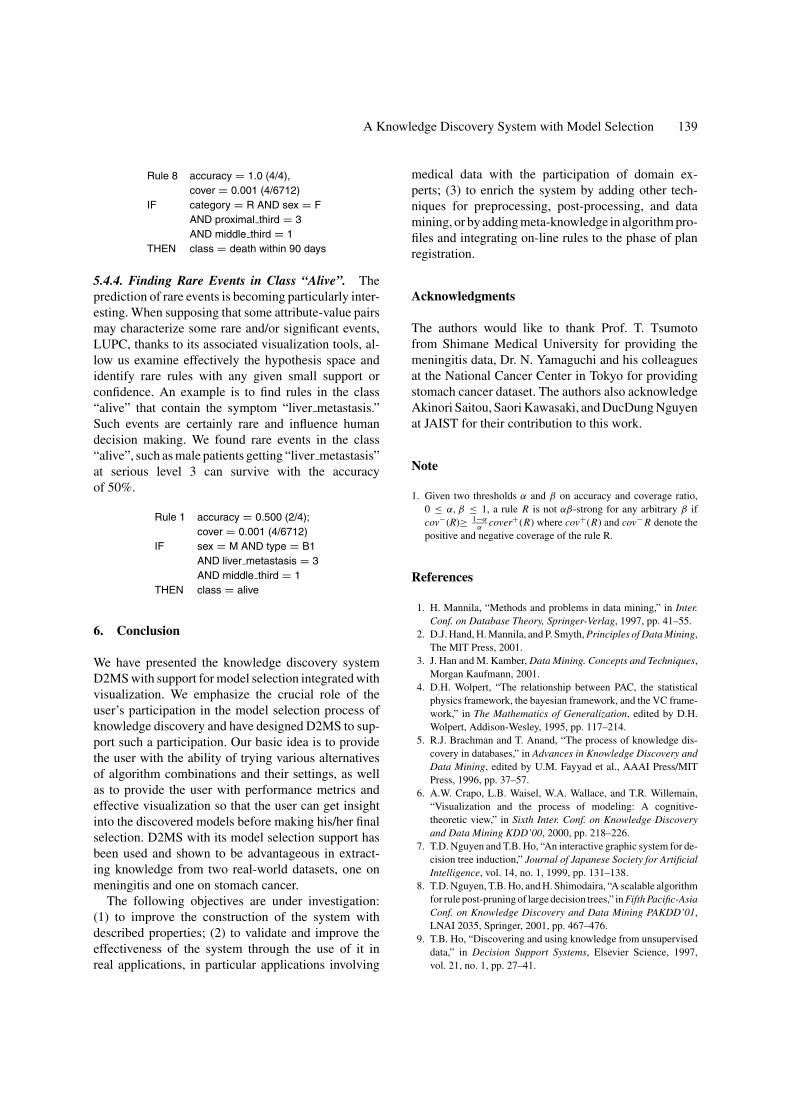
Using visual interactive LUPC, we ran different tri-als and specified parameters and constraints to findonly rules that do not contain the characterized at-tribute “liver metastasis” and/or its combination withtwo other typical attributes, “Peritoneal metastasis”and “Serosal invasion.” Below is a rule with accuracy100% discovered by LUPC that can be seen as a rareand irregular event in the class.
A Knowledge Discovery System with Model Selection 139
Rule 8 accuracy = 1.0 (4/4),cover = 0.001 (4/6712)
IF category = R AND sex = FAND proximal third = 3AND middle third = 1
THEN class = death within 90 days
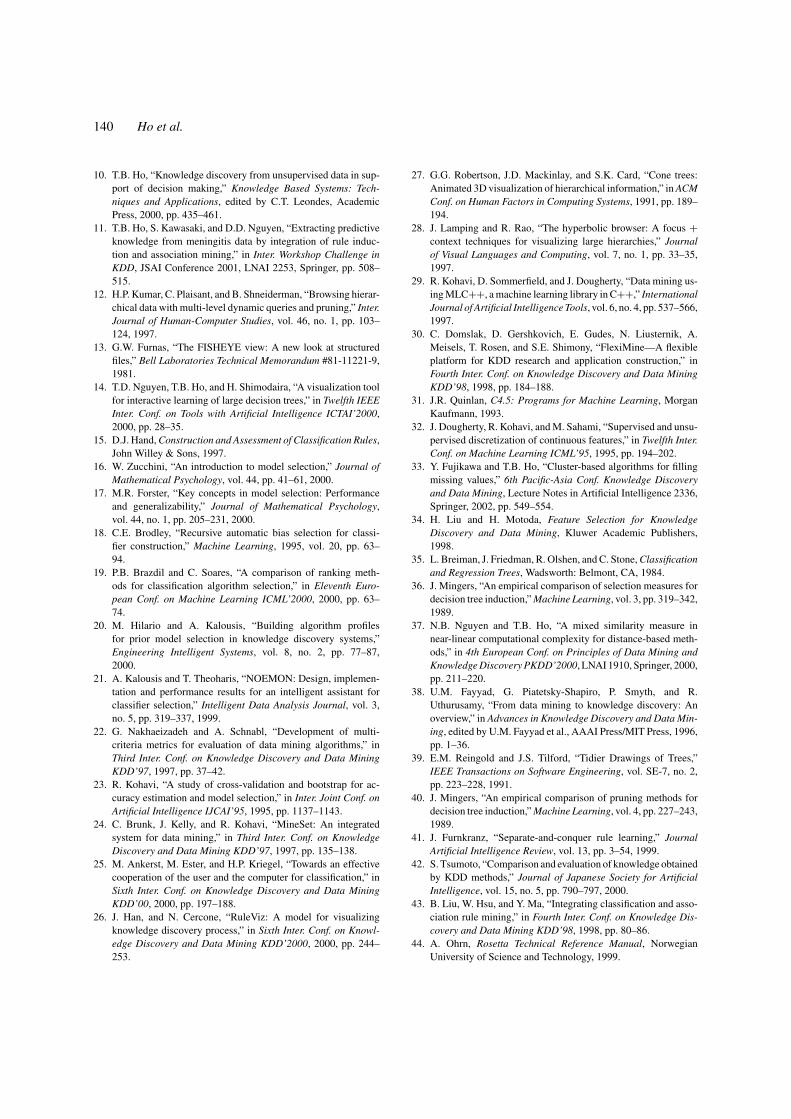
5.4.4. Finding Rare Events in Class “Alive”. Theprediction of rare events is becoming particularly inter-esting. When supposing that some attribute-value pairsmay characterize some rare and/or significant events,LUPC, thanks to its associated visualization tools, al-low us examine effectively the hypothesis space andidentify rare rules with any given small support orconfidence. An example is to find rules in the class“alive” that contain the symptom “liver metastasis.”Such events are certainly rare and influence humandecision making. We found rare events in the class“alive”, such as male patients getting “liver metastasis”at serious level 3 can survive with the accuracyof 50%.
Rule 1 accuracy = 0.500 (2/4);cover = 0.001 (4/6712)
IF sex = M AND type = B1AND liver metastasis = 3AND middle third = 1
THEN class = alive
6. Conclusion
We have presented the knowledge discovery systemD2MS with support for model selection integrated withvisualization. We emphasize the crucial role of theuser’s participation in the model selection process ofknowledge discovery and have designed D2MS to sup-port such a participation. Our basic idea is to providethe user with the ability of trying various alternativesof algorithm combinations and their settings, as wellas to provide the user with performance metrics andeffective visualization so that the user can get insightinto the discovered models before making his/her finalselection. D2MS with its model selection support hasbeen used and shown to be advantageous in extract-ing knowledge from two real-world datasets, one onmeningitis and one on stomach cancer.
The following objectives are under investigation:(1) to improve the construction of the system withdescribed properties; (2) to validate and improve theeffectiveness of the system through the use of it inreal applications, in particular applications involving
medical data with the participation of domain ex-perts; (3) to enrich the system by adding other tech-niques for preprocessing, post-processing, and datamining, or by adding meta-knowledge in algorithm pro-files and integrating on-line rules to the phase of planregistration.
Acknowledgments
The authors would like to thank Prof. T. Tsumotofrom Shimane Medical University for providing themeningitis data, Dr. N. Yamaguchi and his colleaguesat the National Cancer Center in Tokyo for providingstomach cancer dataset. The authors also acknowledgeAkinori Saitou, Saori Kawasaki, and DucDung Nguyenat JAIST for their contribution to this work.
Note
1. Given two thresholds α and β on accuracy and coverage ratio,0 ≤ α, β ≤ 1, a rule R is not αβ-strong for any arbitrary β ifcov−(R)≥ 1−α
αcover+(R) where cov+(R) and cov− R denote the
positive and negative coverage of the rule R.
References
1. H. Mannila, “Methods and problems in data mining,” in Inter.Conf. on Database Theory, Springer-Verlag, 1997, pp. 41–55.
2. D.J. Hand, H. Mannila, and P. Smyth, Principles of Data Mining,The MIT Press, 2001.
3. J. Han and M. Kamber, Data Mining. Concepts and Techniques,Morgan Kaufmann, 2001.
4. D.H. Wolpert, “The relationship between PAC, the statisticalphysics framework, the bayesian framework, and the VC frame-work,” in The Mathematics of Generalization, edited by D.H.Wolpert, Addison-Wesley, 1995, pp. 117–214.
5. R.J. Brachman and T. Anand, “The process of knowledge dis-covery in databases,” in Advances in Knowledge Discovery andData Mining, edited by U.M. Fayyad et al., AAAI Press/MITPress, 1996, pp. 37–57.
6. A.W. Crapo, L.B. Waisel, W.A. Wallace, and T.R. Willemain,“Visualization and the process of modeling: A cognitive-theoretic view,” in Sixth Inter. Conf. on Knowledge Discoveryand Data Mining KDD’00, 2000, pp. 218–226.
7. T.D. Nguyen and T.B. Ho, “An interactive graphic system for de-cision tree induction,” Journal of Japanese Society for ArtificialIntelligence, vol. 14, no. 1, 1999, pp. 131–138.
8. T.D. Nguyen, T.B. Ho, and H. Shimodaira, “A scalable algorithmfor rule post-pruning of large decision trees,” in Fifth Pacific-AsiaConf. on Knowledge Discovery and Data Mining PAKDD’01,LNAI 2035, Springer, 2001, pp. 467–476.
9. T.B. Ho, “Discovering and using knowledge from unsuperviseddata,” in Decision Support Systems, Elsevier Science, 1997,vol. 21, no. 1, pp. 27–41.
140 Ho et al.
10. T.B. Ho, “Knowledge discovery from unsupervised data in sup-port of decision making,” Knowledge Based Systems: Tech-niques and Applications, edited by C.T. Leondes, AcademicPress, 2000, pp. 435–461.
11. T.B. Ho, S. Kawasaki, and D.D. Nguyen, “Extracting predictiveknowledge from meningitis data by integration of rule induc-tion and association mining,” in Inter. Workshop Challenge inKDD, JSAI Conference 2001, LNAI 2253, Springer, pp. 508–515.
12. H.P. Kumar, C. Plaisant, and B. Shneiderman, “Browsing hierar-chical data with multi-level dynamic queries and pruning,” Inter.Journal of Human-Computer Studies, vol. 46, no. 1, pp. 103–124, 1997.
13. G.W. Furnas, “The FISHEYE view: A new look at structuredfiles,” Bell Laboratories Technical Memorandum #81-11221-9,1981.
14. T.D. Nguyen, T.B. Ho, and H. Shimodaira, “A visualization toolfor interactive learning of large decision trees,” in Twelfth IEEEInter. Conf. on Tools with Artificial Intelligence ICTAI’2000,2000, pp. 28–35.
15. D.J. Hand, Construction and Assessment of Classification Rules,John Willey & Sons, 1997.
16. W. Zucchini, “An introduction to model selection,” Journal ofMathematical Psychology, vol. 44, pp. 41–61, 2000.
17. M.R. Forster, “Key concepts in model selection: Performanceand generalizability,” Journal of Mathematical Psychology,vol. 44, no. 1, pp. 205–231, 2000.
18. C.E. Brodley, “Recursive automatic bias selection for classi-fier construction,” Machine Learning, 1995, vol. 20, pp. 63–94.
19. P.B. Brazdil and C. Soares, “A comparison of ranking meth-ods for classification algorithm selection,” in Eleventh Euro-pean Conf. on Machine Learning ICML’2000, 2000, pp. 63–74.
20. M. Hilario and A. Kalousis, “Building algorithm profilesfor prior model selection in knowledge discovery systems,”Engineering Intelligent Systems, vol. 8, no. 2, pp. 77–87,2000.
21. A. Kalousis and T. Theoharis, “NOEMON: Design, implemen-tation and performance results for an intelligent assistant forclassifier selection,” Intelligent Data Analysis Journal, vol. 3,no. 5, pp. 319–337, 1999.
22. G. Nakhaeizadeh and A. Schnabl, “Development of multi-criteria metrics for evaluation of data mining algorithms,” inThird Inter. Conf. on Knowledge Discovery and Data MiningKDD’97, 1997, pp. 37–42.
23. R. Kohavi, “A study of cross-validation and bootstrap for ac-curacy estimation and model selection,” in Inter. Joint Conf. onArtificial Intelligence IJCAI’95, 1995, pp. 1137–1143.
24. C. Brunk, J. Kelly, and R. Kohavi, “MineSet: An integratedsystem for data mining,” in Third Inter. Conf. on KnowledgeDiscovery and Data Mining KDD’97, 1997, pp. 135–138.
25. M. Ankerst, M. Ester, and H.P. Kriegel, “Towards an effectivecooperation of the user and the computer for classification,” inSixth Inter. Conf. on Knowledge Discovery and Data MiningKDD’00, 2000, pp. 197–188.
26. J. Han, and N. Cercone, “RuleViz: A model for visualizingknowledge discovery process,” in Sixth Inter. Conf. on Knowl-edge Discovery and Data Mining KDD’2000, 2000, pp. 244–253.
27. G.G. Robertson, J.D. Mackinlay, and S.K. Card, “Cone trees:Animated 3D visualization of hierarchical information,” in ACMConf. on Human Factors in Computing Systems, 1991, pp. 189–194.
28. J. Lamping and R. Rao, “The hyperbolic browser: A focus +context techniques for visualizing large hierarchies,” Journalof Visual Languages and Computing, vol. 7, no. 1, pp. 33–35,1997.
29. R. Kohavi, D. Sommerfield, and J. Dougherty, “Data mining us-ing MLC++, a machine learning library in C++,” InternationalJournal of Artificial Intelligence Tools, vol. 6, no. 4, pp. 537–566,1997.
30. C. Domslak, D. Gershkovich, E. Gudes, N. Liusternik, A.Meisels, T. Rosen, and S.E. Shimony, “FlexiMine—A flexibleplatform for KDD research and application construction,” inFourth Inter. Conf. on Knowledge Discovery and Data MiningKDD’98, 1998, pp. 184–188.
31. J.R. Quinlan, C4.5: Programs for Machine Learning, MorganKaufmann, 1993.
32. J. Dougherty, R. Kohavi, and M. Sahami, “Supervised and unsu-pervised discretization of continuous features,” in Twelfth Inter.Conf. on Machine Learning ICML’95, 1995, pp. 194–202.
33. Y. Fujikawa and T.B. Ho, “Cluster-based algorithms for fillingmissing values,” 6th Pacific-Asia Conf. Knowledge Discoveryand Data Mining, Lecture Notes in Artificial Intelligence 2336,Springer, 2002, pp. 549–554.
34. H. Liu and H. Motoda, Feature Selection for KnowledgeDiscovery and Data Mining, Kluwer Academic Publishers,1998.
35. L. Breiman, J. Friedman, R. Olshen, and C. Stone, Classificationand Regression Trees, Wadsworth: Belmont, CA, 1984.
36. J. Mingers, “An empirical comparison of selection measures fordecision tree induction,” Machine Learning, vol. 3, pp. 319–342,1989.
37. N.B. Nguyen and T.B. Ho, “A mixed similarity measure innear-linear computational complexity for distance-based meth-ods,” in 4th European Conf. on Principles of Data Mining andKnowledge Discovery PKDD’2000, LNAI 1910, Springer, 2000,pp. 211–220.
38. U.M. Fayyad, G. Piatetsky-Shapiro, P. Smyth, and R.Uthurusamy, “From data mining to knowledge discovery: Anoverview,” in Advances in Knowledge Discovery and Data Min-ing, edited by U.M. Fayyad et al., AAAI Press/MIT Press, 1996,pp. 1–36.
39. E.M. Reingold and J.S. Tilford, “Tidier Drawings of Trees,”IEEE Transactions on Software Engineering, vol. SE-7, no. 2,pp. 223–228, 1991.
40. J. Mingers, “An empirical comparison of pruning methods fordecision tree induction,” Machine Learning, vol. 4, pp. 227–243,1989.
41. J. Furnkranz, “Separate-and-conquer rule learning,” JournalArtificial Intelligence Review, vol. 13, pp. 3–54, 1999.
42. S. Tsumoto, “Comparison and evaluation of knowledge obtainedby KDD methods,” Journal of Japanese Society for ArtificialIntelligence, vol. 15, no. 5, pp. 790–797, 2000.
43. B. Liu, W. Hsu, and Y. Ma, “Integrating classification and asso-ciation rule mining,” in Fourth Inter. Conf. on Knowledge Dis-covery and Data Mining KDD’98, 1998, pp. 80–86.
44. A. Ohrn, Rosetta Technical Reference Manual, NorwegianUniversity of Science and Technology, 1999.

A Knowledge Discovery System with Model Selection 141
Tu Bao Ho received a B.Eng. degree from Hanoi University of Tech-nology in 1978, M.S. and Ph.D. degrees from University Paris 6,in 1984 and 1987, a Habilitation diploma in 1998 from UniversityParis Dauphine. He is currently a professor at School of Knowledge,Japan Advanced Institute of Science and Technology (JAIST). Hisresearch interests include artificial intelligence, machine learning,knowledge-based systems, knowledge discovery and data mining.
Trong Dung Nguyen received a B.S. degree from Hanoi Universityin 1990, M.S. and Ph.D. degrees from Japan Advanced Institute ofScience and Technology (JAIST) in 1998 and 2001. He is an associateat JAIST from 2001. His research interests include machine learning,data mining, and intelligent tutoring systems.
Hiroshi Shimodaira received the B.Sc. degree in 1982 from theDepartment of Electrical Engineering, Tohoku University, the M.Sc.
degree and the PhD degree in information engineering in 1984 and1988, respectively, both from the School of Information Engineer-ing, Tohoku University, Japan. He has been an associate professorof Japan Advanced Institute of Science and Technology (JAIST),Ishikawa, Japan, since 1992. From 1988 to 1991 he was a ResearchAssociate of Faculty of Information Science, Tohoku University. Hewas a visitor at ATR Interpreting Telephony Research Laboratories inthe summer of 1990. From 1995 to 1996, he was a visiting researcherat CSTR, The University of Edinburgh. His research activities activ-ities are in speech recognition, character recognition, medical imageprocessing, statistical machine learning, and anthropomorphic spo-ken dialog agents.
Masayuki Kimura received his Ph.D. in 1959 from Tohoku Uni-versity. He studied at Tohoku University until 1991 when he movedto Japan Advanced Institute of Science and Technology (JAIST). Hehas been an emeritus professor at Tohoku University. He has done re-search in system theory, threshold logic, and learning systems, whilehis current interests are artificial intelligence, genetic algorithms andevolutional systems.
Related Documents