IEEE TRANSACTIONS ON BIOMEDICAL ENGINEERING, VOL. 62, NO. 1, JANUARY 2015 165 A Joint QRS Detection and Data Compression Scheme for Wearable Sensors C. J. Deepu, Member, IEEE, and Y. Lian ∗ , Fellow, IEEE Abstract—This paper presents a novel electrocardiogram (ECG) processing technique for joint data compression and QRS detec- tion in a wireless wearable sensor. The proposed algorithm is aimed at lowering the average complexity per task by sharing the com- putational load among multiple essential signal-processing tasks needed for wearable devices. The compression algorithm, which is based on an adaptive linear data prediction scheme, achieves a loss- less bit compression ratio of 2.286x. The QRS detection algorithm achieves a sensitivity (Se) of 99.64% and positive prediction (+P) of 99.81% when tested with the MIT/BIH Arrhythmia database. Lower overall complexity and good performance renders the pro- posed technique suitable for wearable/ambulatory ECG devices. Index Terms—ECG-on-chip, lossless data compression, QRS de- tection, wearable devices, wireless sensors. I. INTRODUCTION H EALTHCARE spending is increasingly becoming the ma- jor contributor of expenditure in many countries. U.S. alone spends roughly 18% of its GDP on healthcare [1]. Car- diovascular diseases are one of the leading causes of the overall expenditure. These expenses are expected to skyrocket in the coming years due to an aging population, as a result of in- creasing life expectancies. The quality of life in this scenario can be improved by focusing on prevention and early detection of diseases. This can be achieved by proactive and long-term monitoring of individual’s cardiovascular health using low-cost wearable electrocardiogram (ECG) sensor devices (e.g. [2], [3]). The main features of the ECG, i.e., the P, Q, R, S, and T points, give information about the cardiac health of the person. A wearable ECG sensor, as shown in Fig. 1, can be used to acquire, process, and wirelessly transmit ECG signal to a mon- itoring center. The main challenge involved in the development of the sensor is to make the device low profile, unobtrusive, easy to use with long battery life for continuous usage. A high level of integration with inbuilt signal acquisition and data conversion is required to minimize the size, cost, and power consumption of such a sensor. The major source of power consumption in such Manuscript received March 13, 2014; revised June 14, 2014; accepted July 10, 2014. Date of publication July 24, 2014; date of current version December 18, 2014. This work was supported in part by the National Research Foundation Competitive Research Programme under Grant NRF-CRP8-2011-01 and NUS Faculty Strategic Funding under Grant R-263-000-A02-731. Asterisk indicates corresponding author. C. J. Deepu is with the Department of Electrical and Computer Engineer- ing, National University of Singapore, Singapore 119077 (e-mail: deepu_ [email protected]). ∗ Y. Lian is with the Department of Electrical and Computer Engineer- ing, National University of Singapore, Singapore 119077 (e-mail: eleliany@ nus.edu.sg). Color versions of one or more of the figures in this paper are available online at http://ieeexplore.ieee.org. Digital Object Identifier 10.1109/TBME.2014.2342879 Fig. 1. Wearable ECG monitoring system. a system is the wireless transceiver, and hence, it is desirable to carry out preliminary ECG analysis tasks like QRS detection [4] and RR interval estimation locally. This allows the transmis- sion to be triggered only when it is deemed necessary based on cardiac rhythm analysis. Further, the large quantity of ECG data obtained by round the clock monitoring may need to be either stored locally in a flash device or transmitted wirelessly to a monitoring gateway for further analysis. The transmission of data incurs high power consumption, and the use of a local storage increases the device cost. The cost is further affected by the need for an on-chip SRAM which is typically used to interface the ECG chip with a microcontroller [5] to support burst transfer. Although lossy compression techniques provide higher com- pression ratios (CR), we focus on lossless schemes so as to pre- vent the possibility of losing any patient information of potential diagnostic value. Also, it is worth noting that lossy compression techniques have not been approved by medical regulatory bod- ies in most countries and hence cannot be used in commercial devices. Most of the existing literature on lossless ECG com- pression [6], [7] predominantly focuses on achieving higher CR. However, in the context of wireless sensors and ambula- tory devices, the energy and memory savings obtained from the compression should be higher than what is consumed by the compressor itself. QRS detection is not a new topic. A comprehensive review of existing approaches can be found in [8]. However, most of the reported approaches are aimed at increasing the accuracy of detection by using complex signal-processing techniques. For ambulatory devices and sensors, another very important figure of merit is the power consumption, and hence, the overall com- plexity should be low. In recent years, several QRS detection algorithms with low-power implementations have been reported for wireless sensors [9]–[12]. Also several discrete or integrated lossy and lossless ECG compression implementations have been reported [13], [14]. It can be noted that using two distinct ap- proaches for QRS detection and data compression will result 0018-9294 © 2014 IEEE. Personal use is permitted, but republication/redistribution requires IEEE permission. See http://www.ieee.org/publications standards/publications/rights/index.html for more information.

A Joint QRS Detection and Data Compression Scheme for Wearable Sensors
Jul 29, 2015
Welcome message from author
This document is posted to help you gain knowledge. Please leave a comment to let me know what you think about it! Share it to your friends and learn new things together.
Transcript
IEEE TRANSACTIONS ON BIOMEDICAL ENGINEERING, VOL. 62, NO. 1, JANUARY 2015 165
A Joint QRS Detection and Data CompressionScheme for Wearable Sensors
C. J. Deepu, Member, IEEE, and Y. Lian∗, Fellow, IEEE
Abstract—This paper presents a novel electrocardiogram (ECG)processing technique for joint data compression and QRS detec-tion in a wireless wearable sensor. The proposed algorithm is aimedat lowering the average complexity per task by sharing the com-putational load among multiple essential signal-processing tasksneeded for wearable devices. The compression algorithm, which isbased on an adaptive linear data prediction scheme, achieves a loss-less bit compression ratio of 2.286x. The QRS detection algorithmachieves a sensitivity (Se) of 99.64% and positive prediction (+P)of 99.81% when tested with the MIT/BIH Arrhythmia database.Lower overall complexity and good performance renders the pro-posed technique suitable for wearable/ambulatory ECG devices.
Index Terms—ECG-on-chip, lossless data compression, QRS de-tection, wearable devices, wireless sensors.
I. INTRODUCTION
H EALTHCARE spending is increasingly becoming the ma-jor contributor of expenditure in many countries. U.S.
alone spends roughly 18% of its GDP on healthcare [1]. Car-diovascular diseases are one of the leading causes of the overallexpenditure. These expenses are expected to skyrocket in thecoming years due to an aging population, as a result of in-creasing life expectancies. The quality of life in this scenariocan be improved by focusing on prevention and early detectionof diseases. This can be achieved by proactive and long-termmonitoring of individual’s cardiovascular health using low-costwearable electrocardiogram (ECG) sensor devices (e.g. [2], [3]).The main features of the ECG, i.e., the P, Q, R, S, and T points,give information about the cardiac health of the person.
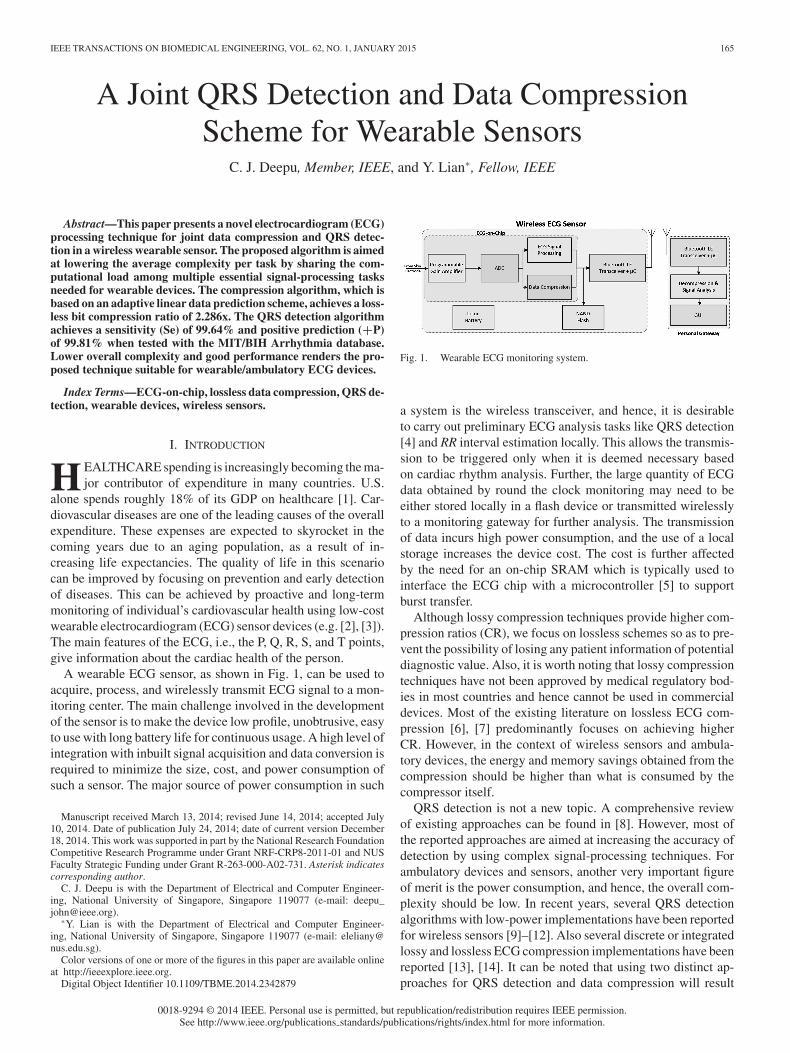
A wearable ECG sensor, as shown in Fig. 1, can be used toacquire, process, and wirelessly transmit ECG signal to a mon-itoring center. The main challenge involved in the developmentof the sensor is to make the device low profile, unobtrusive, easyto use with long battery life for continuous usage. A high level ofintegration with inbuilt signal acquisition and data conversion isrequired to minimize the size, cost, and power consumption ofsuch a sensor. The major source of power consumption in such
Manuscript received March 13, 2014; revised June 14, 2014; accepted July10, 2014. Date of publication July 24, 2014; date of current version December18, 2014. This work was supported in part by the National Research FoundationCompetitive Research Programme under Grant NRF-CRP8-2011-01 and NUSFaculty Strategic Funding under Grant R-263-000-A02-731. Asterisk indicatescorresponding author.
C. J. Deepu is with the Department of Electrical and Computer Engineer-ing, National University of Singapore, Singapore 119077 (e-mail: [email protected]).
∗Y. Lian is with the Department of Electrical and Computer Engineer-ing, National University of Singapore, Singapore 119077 (e-mail: [email protected]).
Color versions of one or more of the figures in this paper are available onlineat http://ieeexplore.ieee.org.
Digital Object Identifier 10.1109/TBME.2014.2342879
Fig. 1. Wearable ECG monitoring system.
a system is the wireless transceiver, and hence, it is desirableto carry out preliminary ECG analysis tasks like QRS detection[4] and RR interval estimation locally. This allows the transmis-sion to be triggered only when it is deemed necessary basedon cardiac rhythm analysis. Further, the large quantity of ECGdata obtained by round the clock monitoring may need to beeither stored locally in a flash device or transmitted wirelesslyto a monitoring gateway for further analysis. The transmissionof data incurs high power consumption, and the use of a localstorage increases the device cost. The cost is further affectedby the need for an on-chip SRAM which is typically used tointerface the ECG chip with a microcontroller [5] to supportburst transfer.
Although lossy compression techniques provide higher com-pression ratios (CR), we focus on lossless schemes so as to pre-vent the possibility of losing any patient information of potentialdiagnostic value. Also, it is worth noting that lossy compressiontechniques have not been approved by medical regulatory bod-ies in most countries and hence cannot be used in commercialdevices. Most of the existing literature on lossless ECG com-pression [6], [7] predominantly focuses on achieving higherCR. However, in the context of wireless sensors and ambula-tory devices, the energy and memory savings obtained from thecompression should be higher than what is consumed by thecompressor itself.
QRS detection is not a new topic. A comprehensive reviewof existing approaches can be found in [8]. However, most ofthe reported approaches are aimed at increasing the accuracy ofdetection by using complex signal-processing techniques. Forambulatory devices and sensors, another very important figureof merit is the power consumption, and hence, the overall com-plexity should be low. In recent years, several QRS detectionalgorithms with low-power implementations have been reportedfor wireless sensors [9]–[12]. Also several discrete or integratedlossy and lossless ECG compression implementations have beenreported [13], [14]. It can be noted that using two distinct ap-proaches for QRS detection and data compression will result
0018-9294 © 2014 IEEE. Personal use is permitted, but republication/redistribution requires IEEE permission.See http://www.ieee.org/publications standards/publications/rights/index.html for more information.

166 IEEE TRANSACTIONS ON BIOMEDICAL ENGINEERING, VOL. 62, NO. 1, JANUARY 2015
in higher overall system complexity. Till now, there are no re-ports on joint approaches for QRS detection and lossless datacompression.
In this paper, we present a joint approach for QRS detectionand ECG compression algorithm for use in wireless sensors. Thecentral idea of the proposed algorithm is to use a single tech-nique for processing of QRS detection and data compression,instead of using two distinct approaches. The algorithm lowersthe average computational complexity per task by sharing thecomputational load among two operations. This is done using ashared adaptive linear predictor for performing both ECG beat-detection and lossless data compression. In addition, a novelfixed-length data coding-packaging technique for convenientrepresentation of the signal entropy is presented.
This paper is organized as follows. Section II introducesthe concept of the joint QRS detection compression (JQDC)scheme. In Section III, the details of QRS detection schemeare discussed. Section IV describes the lossless compressionscheme. The performance analysis of the algorithm and the sim-ulation results are detailed in Section V. Concluding remarksare given in Section VI.
II. PROPOSED JQDC SCHEME
Several forward prediction-based approaches are used forQRS detection as reported in [8], [15], and [16]. In these ap-proaches, a forward predictor is used to estimate the currentsample of the ECG signal, x(n), from its past m samples, i.e.,
x̂(n) =m∑
k=1
hkx(n − k) (1)
where x̂(n) is the estimate of x(n) and hk is the predictorcoefficient. Upon convergence, the predictor is able to closelyestimate the future samples, including the P, T wave segmentsand the slow baseline variations in the ECG signal. Therefore,the instantaneous prediction error e(n), which is the differencebetween the actual sample and its estimate x̂(n), will be minimalin these regions
e(n) = x(n) − x̂(n). (2)
However, for signal regions with steep amplitude variations,like the QRS segment, the predictor statistics are considerablydifferent and hence will result in a higher prediction error, asshown in Fig. 2. Note that Fig. 2 represents one of simulationresults based on one dataset in the MIT/BIH database [17], [18].The rest of the datasets show similar characteristics. Therefore,the prediction error can be used as a marker to locate the QRScomplex in the ECG signal.
Alternatively, the short-term linear predictor can be thoughtof being capable of predicting the low-frequency portion of theECG signal, while most of the high-frequency signal content andnoise remain in the instantaneous prediction error. The transferfunction of this filter is given in (3). With further processing, theQRS complex can be extracted from this “high-pass filtered”
Fig. 2. Instantaneous prediction error, e(n).
Fig. 3. JQDC scheme: Overall block diagram.
signal [8]
E(z) =
(1 −
m∑
k=1
hk ∗ Z−k
)∗ X(z). (3)
At the same time, we noticed that linear predictive coding isa main part of lossless data compression techniques [6], [13],[19] for the redundancy reduction between neighboring signalsamples. This prompts us to develop a new scheme that jointlyperforms QRS detection and lossless compression (JQDC) asshown in Fig. 3. This way, the computational load of the linearpredictive coding can be shared between data compression andQRS detection.
In the proposed JQDC scheme, a linear predictor is usedto estimate the current sample based on previous m samples.The estimated value is subtracted from the actual sample tocalculate the instantaneous prediction error, which after furtherprocessing is used for identifying the location of QRS complex.The prediction error is encoded and packaged so as to obtaina compressed lossless representation of the original data forwireless transmission or local storage.
Several factors affect the detection accuracy, CR, and hard-ware complexity in the proposed joint detection and compres-sion algorithm. In the following, we analyze the effect of linearpredictor selection, order of the predictor, and step size.
A. Adaptive Linear Prediction
In the proposed JQDC scheme, an adaptive predictor, asshown in Fig. 4, is used, so that predictor self-adjusts outputbased on the incoming signal statistics.

DEEPU AND LIAN: A JOINT QRS DETECTION AND DATA COMPRESSION SCHEME FOR WEARABLE SENSORS 167
Fig. 4. Adaptive linear predictor.
TABLE IPERFORMANCE OF LMS VARIANTS IN THE JQDC SCHEME
Algorithm Se (%) +P (%) CR
LMS 99.51 99.75 2.29NLMS 99.56 99.68 2.31SLMS 99.65 99.72 2.30SSLMS 99.64 99.81 2.28
TABLE IIHARDWARE COMPLEXITY FOR A FOUR-TAP ADAPTIVE UPDATER
Algorithm Adders Multipliers
LMS 4 8NLMS 7 16SLMS 5 4SSLMS 5 0
The predictor is realized by using a tapped-delay line struc-ture. For updating predictor weights, LMS algorithm and itsvariants were considered, as follows [20]:
LMS h(n + 1) = h(n) + μ . e(n) . x(n). (4)
NLMS h(n + 1) = h(n) + β.e(n) .x(n)x(n)2 . (5)
SLMS h(n + 1) = h(n) + μ.sgn(e(n)) . x(n). (6)
SSLMS h(n + 1) = h(n) + μ . sgn(e(n)) . sgn(x(n)). (7)
Here, μ and β are the step sizes, and h (n + 1) and h (n)are updated and current predictor coefficients, respectively. Thedifferent LMS variants yielded comparable results based onsimulations using the MIT/BIH database for detection and com-pression as shown in Table I. We chose Sign Sign Least MeanSquare (SSLMS) algorithm as its implementation complexity isthe lowest [21] as shown in Table II.
B. Linear Predictor Order
The order of linear predictor is highly related to performanceof proposed JQDC and hardware cost. It is necessary to analyzethe relationship between the order and performance. This was
Fig. 5. Predictor order versus performance.
carried out using the ECG signals from the MIT/BIH database,along with SSLMS predictor and initialization methodologymentioned in the next section. Fig. 5 shows the QRS detectionperformance and CR versus predictor’s order. As expected, theCR improves as the predictor order increases. This is because thepredictor could more accurately predict the future data as pre-dictor order increases. The QRS detection performance basedon SE and +P, on the other hand, shows a different pattern. Theperformance increases as the order is increased till 4 and startedto gradually decline thereafter. As the order increases QRS seg-ment becomes more and more predictable, and hence, the in-stantaneous error contains less signal component of the QRScomplex, which results in a lower detection accuracy. While atvery low orders, the prediction accuracy is lower, which leadsto presence of low-frequency baseline variations and P/T wavecomponents in the instantaneous error output that affects QRSdetection accuracy.
C. Initialization and Step Size
Adaptive techniques require several cycles to converge to theoptimal point based on the incoming signal characteristics. Inorder to speed up the adaptation, we initialized the SSLMSpredictor with pre-computed values hinit
1 , hinit2 , hinit
3 , hinit4 as
given below.
hinit1 =
1N
N∑
n=1
h1n , hinit2 =
1N
N∑
n=1
h2n (8)
hinit3 =
1N
N∑
n=1
h3n , hinit4 =
1N
N∑
n=1
h4n (9)
where hinit1 , hinit
2 , hinit3 , and hinit
4 are the statistical averages ofthe predictor coefficients (h1n , h2n , h3n , h4n ) obtained from thedatasets in the MIT/BIH database. As the signal characteristicsof ECG vary from patient to another, the statistical average fromseveral datasets serves as a good starting point for the adaptationfor all inputs. The coefficients of the datasets were computedby using Levinson–Durbin algorithm [20]. A variable step μeff

168 IEEE TRANSACTIONS ON BIOMEDICAL ENGINEERING, VOL. 62, NO. 1, JANUARY 2015
Fig. 6. QRS detection block diagram.
was selected as follows:
μeff =
{μinit , N < NL
μfinal, N ≥ NL.(10)
For initial NL iterations, a higher value of step size, μinit =0.001, is used in order to speed up predictor adaptation. How-ever, a large step size will result in a lower overall compressionand QRS detection ratios because of higher steady-state error(in the slowly varying segments) and faster prediction responseto QRS complex (resulting in smaller prediction error for QRS).Once the predictor coefficients are adapted based on the incom-ing signal, a smaller value step size, μfinal = 0.00001, is used.These μ and NL (1024) values are selected based on simulationsusing the MIT/BIH database.
III. QRS DETECTION
As noted in the previous section, the instantaneous predic-tion error, e(n), from the adaptive SSLMS predictor is used forlocating the QRS complex. This is because the error correspond-ing to QRS segment is relatively higher than that of P, T waveand baseline variations. The prediction error also contains high-frequency impulse noise, which has to be filtered out so as toeasily locate the QRS complex. Typically, moving average fil-ters are effective in removing impulse noises and smootheningof such signals. However in doing so, it also smoothens and dis-torts the shape and the height of the error peaks corresponding tothe QRS complex. It is important to preserve the integrity of thesignal content corresponding to QRS, while smoothening thehigh-frequency and impulse noise that corresponds to the otherregions of ECG. To achieve these goals, a Savtizky–Golay (SG)filter is employed to remove the high-frequency impulse noisefrom the prediction error. Once the impulse noise is removed,the signal is further enhanced by using a squaring and mov-ing sum operation for adaptive thresholding and peak detection.The block diagram of the QRS detection scheme is illustratedin Fig. 6.
A. SG Filtering
SG filters are known well in domains like analytical chemistryand has been of recent interest in ECG signal processing [22].SG filters smoothen the incoming signal by approximating thesignal within a specified window of size L to a polynomial oforder K, which best matches the given signal in a least-squares
Fig. 7. Filtering a noisy signal with (a) moving average filter and (b) SG filter.
sense. A polynomial of order K is defined as
fK (x) =K∑
i=1
cixi. (11)
It is shown in [22] that this polynomial fitting and re-evaluation is equivalent to discrete convolution with a fixedimpulse response
esg (n) =M∑
m=−M
h[m]e(n − m) (12)
where L = 2M + 1,K ≤ L, esg (n) is the SG filtered predictionerror
In comparison with a moving average filter, SG filters arebeneficial in maintaining the higher order moments in the inputsignal, as shown in Fig. 7. It preserves features of the distributionsuch as relative maxima, minima, and width and reduces thesmoothening of peak heights, while suppressing the impulsenoise. It can be seen from Fig. 7 that the noise suppressioncapability of SG filters is not as good as moving average filter.However, once the impulse noise level relative to the QRS peaksis suppressed, a moving average operation can be used to furthersmoothen the signal.
To select the order and frame size (K, L) of the filter forremoving noise from the prediction error, we computed theQRS detection accuracy based on the MIT/BIH database forvarious combinations of (K, L) with K ranging from 3 to 6 and Lranging from 9 to 17. It was found that best detection accuracy–hardware complexity tradeoff was achieved for SG filter withK = 3 and L = 15. The SG filter coefficients were computedas described in [22].

DEEPU AND LIAN: A JOINT QRS DETECTION AND DATA COMPRESSION SCHEME FOR WEARABLE SENSORS 169
B. Signal Enhancement by Squaring and Moving Sum
Once the high-frequency impulse noise is suppressed, thesignal is further enhanced by squaring and taking the movingsum of the signal before the thresholding operation. The in-stantaneous signal samples are squared, as in (13), to providea nonlinear amplification to the prediction error, which helpsto further magnify the QRS component in the signal relative tothe other segments. Furthermore, moving window integration isdone to obtain a smooth waveform for thresholding and peakdetection
eno(n) =m/2∑
n=−m/2
|e sg(n)|2 (13)
The number of samples for moving integration, M, is se-lected such that it corresponds to the width of the QRS complexin the ECG signal. For 360-Hz sampling, M = 26 was chosenas it gave the best tradeoff between complexity and detectionperformance.
C. Adaptive Thresholding and Peak detection
The enhanced signal, eno(n), is continuously scanned to findQRS peaks. As the signal amplitudes vary across patients andbased on external conditions, an adaptive threshold is used fordetection. The threshold is initialized with a default value, Thdefin the beginning, and a new threshold is computed based on themaximum value of the signal in a training period of first 2 s, i.e.,the threshold is updated to 25% of the maximum value duringthis period. Every time the signal exceeds the threshold, thepeak detection algorithm searches and locates the presence ofa peak, Tamp , as described later. The average threshold Thavgis computed as 25% of the average of last four detected peaks,i.e.,
Thavg = 0.25 ∗ 14∗
∑
k≤3
Thk . (14)
In order to prevent sudden amplitude changes from affectingthe threshold adaptation, the peak amplitude considered for eachdetection is limited to two times the previously detected peak.Furthermore, an automated threshold reduction mechanism isemployed to ensure that a decrease in the peak amplitude ofthe signal corresponding to QRS peaks does not cause a lockupcondition, whereby subsequent peaks are not detected due toa higher threshold. For this, the RR intervals from past foursuccessful detections are averaged to find RRavg
RRavg =(
14
)∗
4∑
i=1
RRi. (15)
For every RRavg duration, if a new peak is not detected, thenthe average threshold is reduced to 75% of its current value.This threshold reduction continues until the average thresholdhits a predefined minimum value, so that noise signals are notpicked up as QRS peaks. The threshold adaptation routine isgiven in Fig. 8.
The peak detection algorithm starts when the filtered signaleno(n) exceeds the threshold. It begins with finding a continually
Fig. 8. Threshold adaptation routine for QRS detection.
Fig. 9. Peak detection.
rising edge and then a continuously falling edge within a specificperiod of time as shown in Fig. 9. The adaptive threshold up-date mechanism described previously prevents the occurrenceof false detections due to variation in signal amplitude. Further,we also implemented a false peak elimination mechanism thateliminates close peaks
2∧
j=0eno(i − j) − eno(i − j − 1) > 0 (16)
2∧
j=0eno(i + j + 1) − eno(i + j) < 0. (17)
The rising edge is identified by a continuous increase in signalamplitude over at least three points as defined by (16). Once arising edge is located, the algorithm looks for a falling edgewithin a search window Ts of 100 ms. If within Ts, another

170 IEEE TRANSACTIONS ON BIOMEDICAL ENGINEERING, VOL. 62, NO. 1, JANUARY 2015
Fig. 10. Peak detection and false peak cancellation routine.
rising edge is located, the previously detected rising edge isdiscarded, and the timer Ts is restarted at the new edge. Themaximum signal amplitude within this search window, whenthere is a detection, is considered as the new threshold, Tamp .A falling edge is determined by a continuous decrease in signalamplitude over three points as given in (17). If a falling edge ispresent, the algorithm checks for the presence of a previous peakwithin 35% duration of RRavg (TBlank) interval, failing which,a detection is immediately declared. If a previously detectedpeak exists within TBlank duration, then either the current peakor the previous peak is canceled based on a lower Tamp value.TBlank is bounded by a maximum value, so that the peak canbe declared within a fixed delay. The peak detection routine isgiven in Fig. 10.
Fig. 11. Lossless data compression scheme.
IV. LOSSLESS DATA COMPRESSION
As discussed previously, the dynamic range of the predictionerror signal e(n) is low and centers around zero except for thesegment corresponding to the QRS complex. However, it shouldbe noted that for preserving the data without any loss, we need(M + 2) bits to fully represent e(n), where M is the bit-widthof x(n). Further, a coding scheme can be used to reduce thebit-width of e(n) without incurring any data loss. Instead oftransmitting the whole sample, only the coded data have to bestored/transmitted, resulting in power/memory savings.
For coding e(n), variable length coding schemes like Huffmanand Arithmetic coding [13] can be used, which produce prefix-free codes [23]. The proposed JQDC scheme is compatible withany of these existing coding schemes. The complexity of en-coder/decoder implementation is quite high for these techniquesthough they produces optimal bit representations [13], [24]. Forexample, Huffman coding associates the most frequently occur-ring symbols with short codewords and the less frequently oc-curring symbols with long codewords. This symbol-codewordassociation table has to be preconstructed using a statisticaldataset and the implementation of this table would require alarge on chip memory [24] which ultimately would negate theeffect of SRAM area savings [5] through compression. A furthersuboptimal approach, selective Huffman coding [23], encodesonly m frequently used symbols with Huffman codes and retainthe remaining data unencoded at the expense of CR achieved[23]. The hardware complexity of [14] and [23] is lower com-pared to the statistical approach. However, it still needs an msymbol lookup table at the encoder as well as the decoder. Inaddition, these coding schemes produce variable length codesat the output. Further packaging is required to make it practi-cal fixed-length packets that can be stored in fixed word lengthSRAM/Flash or interfaced through a standard I/O like SPI. Thisrepackaging usually necessitates a complex hardware like theone proposed in [25].
We adopt a simple coding-packaging scheme which gives apractical, fixed-length 16-bit output and has low hardware com-plexity (first presented in [26]). The coding-packaging routineis summarized in Table III. Here, the 2’s complement repre-sentation (e_2c(n)) of the error signal is used. Since most errorsamples centers around zero, it can be represented in only a fewbits. Therefore, we only retain the necessary LSB’s and removeany MSBs that do not carry information. However, the problemin using this approach is that the bit clipped, 2’s complementencoded samples are of varying bit widths and cannot be storedcontinuously in a memory as it lacks the prefix-free nature ofthe Huffman codes. Hence, we introduce a simple bit packagingscheme which can pack data samples of varying bit widths dy-namically to produce a fixed-length data output of 16 bits. Eachindividual data packet will be marked with a unique header so

DEEPU AND LIAN: A JOINT QRS DETECTION AND DATA COMPRESSION SCHEME FOR WEARABLE SENSORS 171
TABLE IIISIMPLIFIED CODING-PACKAGING ROUTINE
Simplified data packaging routine.
1) Receive 2’sC coded prediction error, e2 c(n), into a 6–word local memory.2) If the memory is full go to Step 3), else go to Step 1)3) If-2 ≤ e2 c(n − 5 ≤ i ≤ n) ≤ 1, append header ‘0000’, use framing format D
form Table IV and go to Step 1) else Step 4)4) If-4 ≤ e2 c(n − 3 ≤ i ≤ n) ≤ 3, append header ‘0001’, use framing format C
form Table IV and go to Step 1) else Step 5)5) If-16 ≤ e2 c(n − 2 ≤ i ≤ n) ≤ 15, append header ‘1’, use framing format A
form Table IV and go to Step 1) else Step 6)6) If-64 ≤ e2 c(n − 1 ≤ i ≤ n) ≤ 63, append header ‘01’, use framing format B
form Table IV and go to Step 1) else Step 7)7) If-65 ≥ e2 c(n) ≥ 64, append header ‘0011’, use framing format E form
Table IV, replace e2 c(n) with corresponding x(n) and go to Step 1)
TABLE IVSPECIFICATIONS OF THE FABRICATED DEVICES
TABLE VECG COMPRESSION DE-COMPRESSION SUMMARY
ECG Compression De-Compression Summary
Compression1) Initialize the SSLMS predictor2) While new input sample do
a. Estimate new sample, x̂, from previous sample using SSLMS predictorb. Read new sample, xc. Compute prediction error e(n) = x − x̂
d. Update SSLMS predictor weights with Eq(7)e. Clip e(n) to obtain min bit width 2’s C representationf. Package using routine in Table III
De-Compression1) Initialize the SSLMS predictor and estimate the first sample, x̂
2) Unpack frames using data format from Table IV, to get e(n)3) Reconstruct original data with x(n) = x̂(n) + e(n) and feedback to the predictor.
as to easily identify and decode the data while decompressing.The data packaging format is listed in Table IV.
The dynamic data packaging scheme uses a simple priorityencoding technique to frame fixed-length data from samples ofmultiple bit widths. As and when the error data are received, thealgorithm checks whether the maximum amplitude of a signalgroup (e2c (n − j ≤ i ≤ n)) exceeds the value that particularframe format can accommodate from Table IV based on thepackaging routine given in Table III. If not, the algorithm pro-ceeds with the next best framing option. Full data frames ofType E can be sent periodically at a predetermined interval toadd resilience against transmission errors. The summary of thecompression–decompression scheme is given in Table V.
Fig. 12. QRS detection over tape 117 of the MIT/BIH database with large Twaves (a) ECG signal (b) Prediction Error (c) SG filtered signal (d)smoothenedsignal with adaptive thresholding and detected QRS peaks (Red).
V. PERFORMANCE RESULTS
A. QRS Detection
The performance of the proposed algorithm is evaluated usingthe MIT/BIH Arrhythmia database. The MIT/BIH database is abenchmark database with 48 half-hour two-channel ambulatoryECG recordings. These recordings have 11-bit resolution over10 mV and are sampled at 360 Hz.
To evaluate the QRS detection performance, false positive(FP) and false negative (FN) detections are used. FP indicatesthe declaration of a QRS peak when there is actually none andFN indicates that the algorithm failed to detect an actual beat.Further, by using FP and FN, the sensitivity (Se) and positiveprediction (+P) are computed using the following equations:
Se(%) =TP
TP + FN(18)
+P (%) =TP
TP + FP. (19)
Here, TP stands for true positive, i.e., the number of QRScorrectly detected. Table VI contains the summary of QRS de-tection results for all recordings. Figs. 12–14 show the perfor-mance of the algorithm under noisy conditions. The first plot(a) in each figure shows the original signal. The second plot (b)

172 IEEE TRANSACTIONS ON BIOMEDICAL ENGINEERING, VOL. 62, NO. 1, JANUARY 2015
TABLE VIPERFORMANCE OF THE PROPOSED ALGORITHM USING
THE MIT/BIH DATABASE
Tape Total FP FN Se (%) +P (%)
100 2273 0 1 99.96 100101 1865 3 1 99.95 99.84102 2187 0 0 100 100103 2084 0 1 99.95 100104 2229 24 3 99.87 98.93105 2572 27 9 99.65 98.96106 2027 1 4 99.8 99.95107 2137 0 4 99.81 100108 1774 30 3 99.83 98.32109 2532 3 4 99.84 99.88111 2124 3 1 99.95 99.86112 2539 0 0 100 100113 1795 0 1 99.94 100114 1879 8 2 99.89 99.58115 1953 0 0 100 100116 2412 2 20 99.17 99.92117 1535 0 0 100 100118 2278 1 0 100 99.96119 1987 1 0 100 99.95121 1863 1 0 100 99.95122 2476 1 0 100 99.96123 1518 5 3 99.8 99.67124 1619 1 7 99.57 99.94200 2601 2 2 99.92 99.92201 1963 0 85 95.67 100202 2136 0 17 99.2 100203 2980 22 56 98.12 99.25205 2656 0 12 99.55 100207 1860 14 4 99.78 99.25208 2955 4 24 99.19 99.86209 3004 0 0 100 100210 2650 5 19 99.28 99.81212 2748 2 0 100 99.93213 3251 0 34 98.95 100214 2265 2 4 99.82 99.91215 3363 3 4 99.88 99.91217 2209 0 3 99.86 100219 2154 0 5 99.77 100220 2048 0 0 100 100221 2427 1 7 99.71 99.96222 2483 4 1 99.96 99.84223 2605 0 6 99.77 100228 2053 31 4 99.81 98.51230 2256 0 0 100 100231 1571 0 0 100 100232 1780 0 37 97.92 100233 3079 0 4 99.87 100234 2753 0 3 99.89 100
Total 109508 201 395 99.64 99.81
shows the instantaneous prediction error e(n). The third plot (c)shows the SG filtered signal. It can be observed that the impulsenoise is drastically reduced after SG filtering. The fourth plot(d) shows the smoothened signal after squaring and integrationwith threshold varying adaptively based on signal amplitude.The peak detections are marked as a red colored spike in theplot (d). Fig. 12 shows the performance of the algorithm underthe presence of elevated T waves, which are often misidenti-fied as QRS peaks due to their amplitude. It can be seen fromFig. 12(b)–(d) that the T waves are effectively removed by thefiltering and processing stages. Fig. 13 shows the detection per-formance, when QRS complexes with varying morphologies,
Fig. 13. QRS detection over tape 200 of the MIT/BIH database with irregularinverted peaks. (a) ECG signal. (b) Prediction error. (c) SG filtered signal. (d)Smoothened signal with adaptive thresholding and detected QRS peaks (Red).
amplitudes, and intervals are present. Every alternate beat hasinverted morphology, varying amplitude with irregular RR in-terval as shown in Fig. 13(a). It can be seen from Fig. 13(b)–(d)that the algorithm performs well in presence of these irregulari-ties. Fig. 13(d) also illustrates the automated threshold reductionmechanism when no new R peak is detected for an RRavg in-terval. Fig. 14 shows that the algorithm performs well in thepresence of baseline wandering. In Fig. 14, it can be seen thatthe automatic threshold adjustment drops the detection thresh-old based on the signal amplitude so as to enable an accurateidentification of QRS complex.
Table VII compares the performance of existing algorithmswith the proposed one. As shown, the proposed algorithmachieves good detection error rate in comparison with othercompeting algorithms. Some existing algorithms like multi-scale morphology technique offer better performance in ab-solute terms. However, the computational complexities of thesealgorithms are relatively high. More importantly, the existingalgorithms only perform QRS detection. In comparison, theproposed algorithm can share the computational load with datacompression to achieve more power savings in a wearable sen-sor node. The additional logic needed for carrying out datacompression is very minimal. Hence, the proposed algorithm isbetter suited for wearable sensor applications.

DEEPU AND LIAN: A JOINT QRS DETECTION AND DATA COMPRESSION SCHEME FOR WEARABLE SENSORS 173
Fig. 14. QRS detection of tape 203 of the MIT database with severe baselinedrift and noise. (a) ECG signal. (b) Prediction error. (c) SG filtered signal. (d)Smoothened signal with adaptive thresholding and detected QRS peaks (Red).
B. Data Compression Performance
The proposed data compression algorithm is tested using theMIT/BIH Arrhythmia database for analyzing the compressionperformance. The bit compression ratio (BCR) is computed asfollows:
BCR =No of uncompressed samples X BWuncomp
No of compressed Samples X BWcomp(20)
where BWcomp and BWuncomp refers to the bit widths of com-pressed and uncompressed samples, respectively.
Table VIII shows the summary of ECG compression perfor-mance for all MIT/BIH recordings. The average and max valuesof BCR obtained are also given. The proposed JQDC schemecan be used with any error coding scheme. Statistical Huff-man coding gives the best performance. However, its hardwarecomplexity is high and produces variable length codes. The se-lective Huffman codes has moderate complexity but producesvariable length codes that need further packaging [25]. The pro-posed joint coding-packaging scheme gives fixed-length frames,which are compatible with Memory/SPI, etc., at a very low com-plexity compared to [13] and [14].
Table IX compares the compression performance of the pro-posed approach with other techniques implemented on hardware
TABLE VIIPERFORMANCE COMPARISON WITH OTHER PUBLISHED ALGORITHMS
Method Se(%) +P(%) Ref
Wavelet De-noising 99.55 99.49 [27]Genetic Algorithm 99.60 99.51 [28]Filter Banks 99.59 99.56 [29]BPF/Search-back 99.69 99.77 [30]Multiscale Morphology 99.81 99.80 [31]Quadratic Spline wavelet 99.31 99.70 [10]Pulse Train approach 99.58 99.55 [4]Wavelet Delineation 99.66 99.56 [32]Proposed method 99.64 99.81 –
for wearable applications. In [13], a delta predictor and Rice–Golomb coding scheme are utilized to achieve a CR of 2.38.However, the Rice–Golomb coding has higher complexity andrequires a SRAM block for its implementation leading to largearea. In [14], a two-stage adaptive predictor and the Huffmancoding achieve the highest CR of 2.43. But it generates variablelength coded data and would need further packaging to inter-face with a standard IO [25]. In [33], a simple predictor andthe Huffman coding are employed to achieve a CR of 1.92. In[26], a slope predictor and a fixed-length packaging scheme arecombined to produce a CR of 2.25. In addition, there exist otherapproaches for achieving higher CR while using complex signal-processing techniques. These approaches require the usage ofmore complex hardware, which is not suitable for low-powerwearable applications [6], [7], and therefore not included in thecomparison. The proposed technique achieves a CR of 2.28 us-ing an adaptive predictor and fixed-length packaging. Althoughthe compression performance is slightly lower than that in [13]and [14], the proposed joint approach implements two func-tions, i.e., compression and QRS detection, both of which areessential for wearable applications and share the computationalcomplexity. All the other approaches only implement one of thefunctions. In addition, the proposed scheme always generatesfixed-length output and would not require any further packaging[25].
In order to estimate the power consumed by the proposedtechnique, we have implemented the JQDC scheme in VerilogHDL and synthesized it using 0.35-μm CMOS process for atwo-channel ECG device. The received data contain seriallymultiplexed two-channel ECG signal. Initially, the data are de-multiplexed and fed into individual predictors (as in Fig. 4)to compute the estimate. The prediction error from one of thechannels is used for QRS detection and prediction errors fromboth channels are multiplexed back and compressed using thefixed-length packaging scheme discussed in Section IV. A QRSdetector is implemented (see Fig. 6), where threshold adapta-tion and false peak elimination follows the routines in Figs 8and 10. The design also includes an SPI slave to interface withexternal microcontrollers. The ECG signal from the MIT/BIHdatabase is used for testing the design. The circuit power hasbeen estimated with Synopsys Power Compiler after gate levelsynthesis. The circuit consumes 490 nW at 1.8-V supply voltageand 512-Hz clock frequency. When the QRS detector clock is

174 IEEE TRANSACTIONS ON BIOMEDICAL ENGINEERING, VOL. 62, NO. 1, JANUARY 2015
TABLE VIIICOMPRESSION PERFORMANCE OF THE PROPOSED ALGORITHM USING THE
MIT/BIH DATABASE
Tape Statistical Selective ProposedHuffman Huffman Joint codingCoding Coding Packaging
100 2.7748 2.2244 2.3173101 2.7287 2.1952 2.2858102 2.7431 2.2198 2.2962103 2.7125 2.1919 2.288104 2.6096 2.1471 2.247105 2.662 2.1512 2.2533106 2.5418 2.0833 2.1825107 2.5466 2.0959 2.1978108 2.6444 2.1395 2.2452109 2.7443 2.2023 2.2951111 2.7299 2.1927 2.245112 2.9021 2.3004 2.432113 2.5496 2.1001 2.1748114 2.7145 2.1833 2.2555115 2.7494 2.2199 2.3724116 2.4911 2.0613 2.2054117 2.7192 2.1861 2.2952118 2.5063 2.0537 2.2023119 2.5856 2.104 2.2422121 2.9946 2.3554 2.4432122 2.5772 2.0959 2.2141123 2.6791 2.163 2.2907124 2.8712 2.2816 2.4283200 2.6221 2.1272 2.2572201 2.9862 2.351 2.4281202 2.6623 2.15 2.2361203 2.3297 1.9387 2.1136205 2.9638 2.3382 2.5446207 2.7089 2.1804 2.2751208 2.5433 2.0793 2.18209 2.4936 2.0447 2.1817210 2.7111 2.1815 2.2712212 2.4203 1.9988 2.1449213 2.6227 2.1284 2.2962214 2.5715 2.0938 2.1913215 2.4818 2.0365 2.1593217 2.545 2.0864 2.1776219 2.8075 2.2443 2.4021220 2.722 2.2083 2.3582221 2.6238 2.1258 2.2174222 2.6923 2.1694 2.2411223 2.8428 2.2643 2.4042228 2.664 2.1517 2.2428230 2.7724 2.2226 2.3808231 2.848 2.2722 2.4149232 2.9561 2.3323 2.4403233 2.7628 2.2141 2.3535234 2.8064 2.2402 2.3855
Avg BCR 2.69 2.17 2.286Max. BCR 2.99 2.35 2.544
TABLE IXCOMPRESSION PERFORMANCE COMPARISON WITH OTHER ALGORITHMS
Method BCR Ref
Delta Predictor/Rice Golomb Coding 2.38 [13]Adaptive Predictor/ Huffman Coding 2.43 [14]Simple Predictor/ Huffman Coding 1.92 [33]Slope Predictor/ Fixed-length Packaging 2.25 [26]Proposed method 2.28 –
turned OFF, i.e., when two-channel ECG compressor alone is inoperation, the design consumes 357 nW. The additional powerconsumed by the QRS detector (apart from the logic sharedwith the compressor) is just 133 nW. The total power consump-tion of the JQDC scheme is much lower than microprocessor orDSP-based solutions. Multifunctional implementation and ul-tralow power consumption makes the design suitable for wear-able devices.
VI. CONCLUSION
This paper has presented a novel scheme for joint QRS de-tection and lossless data compression aimed at wearable ECGdevices. The adaptive prediction-based compression algorithmachieves a lossless BCR of 2.286x. The QRS detection algo-rithm achieves a high sensitivity of 99.64% and positive pre-diction of 99.81% with the MIT/BIH Arrhythmia database. Thealgorithm enables the sharing of computational load among mul-tiple critical functions needed in a wearable sensor. To our bestknowledge, this is the first joint algorithm that implements QRSdetection and lossless data compression.
REFERENCES
[1] “World Health Statistics 2013,” World Health Organisation, Geneva,Switzerland, 2013.
[2] E. S. Winokur, M. K. Delano, and C. G. Sodini, “A wearable cardiacmonitor for long-term data acquisition and analysis,” IEEE Trans. Biomed.Eng., vol. 60, no. 1, pp. 189–192, Jan. 2013.
[3] D. R. Zhang, C. J. Deepu, X. Y. Xu, and Y. Lian, “A wireless ECG plasterfor real-time cardiac health monitoring in body sensor networks,” in Proc.IEEE Biomed. Circuits Syst. Conf., 2011, pp. 205–208.
[4] G. Nallathambi and J. Principe, “Integrate and fire pulse train automatonfor QRS detection,” IEEE Trans. Biomed. Eng., vol. 61, no. 2, pp. 317–326,Sep. 2013.
[5] C. J. Deepu, X. Xu, X. Zou, L. Yao, and Y. Lian, “An ECG-on-chipfor wearable cardiac monitoring devices,” in Proc. 5th IEEE Int. Symp.Electron. Design Test Appl., 2010, pp. 225–228.
[6] Z. Arnavut, “ECG signal compression based on burrows-wheeler trans-formation and inversion ranks of linear prediction,” IEEE Trans. Biomed.Eng., vol. 54, no. 3. pp. 410–418, Mar. 2007.
[7] S.-G. Miaou and S.-N. Chao, “Wavelet-based lossy-to-lossless ECG com-pression in a unified vector quantization framework,” IEEE Trans. Biomed.Eng., vol. 52, no. 3, pp. 539–543, Mar. 2005.
[8] B.-U. Kohler, C. Hennig, and R. Orglmeister, “The principles of softwareQRS detection,” IEEE Eng. Med. Biol. Mag., vol. 21, no. 1. pp. 42–57,Jan./Feb. 2002.
[9] X. Liu, Y. Zheng, M. W. Phyu, B. Zhao, M. Je, and X. Yuan, “Multiplefunctional ECG signal is processing for wearable applications of long-term cardiac monitoring,” IEEE Trans. Biomed. Eng., vol. 58, no. 2, pp.380–389, Feb. 2011.
[10] C.-I. Ieong, P.-I. Mak, C.-P. Lam, C. Dong, M.-I. Vai, P.-U. Mak, S.-H.Pun, F. Wan, and R. P. Martins, “A 0.83-uW QRS detection processorusing quadratic spline wavelet transform for wireless ECG acquisition in0.35-uM CMOS,” IEEE Trans. Biomed. Circuits Syst., vol. 6, no. 6. pp.586–595, Dec. 2012.
[11] Y. Zou, J. Han, X. Weng, and X. Zeng, “An ultra-low power QRS complexdetection algorithm based on down-sampling wavelet transform,” IEEESignal Process. Lett., vol. 20, no. 5, pp. 515–518, May 2013.
[12] Y. Wang, C. J. Deepu, and Y. Lian, “A computationally efficient QRSdetection algorithm for wearable ECG sensors,” in Proc. 2011 Annu. Int.Conf. Eng. Med. Biol. Soc., 2011, pp. 5641–5644.
[13] E. Chua and W. Fang, “Mixed bio-signal lossless data compressor forportable brain-heart monitoring systems,” IEEE Trans. Consum. Electron.,vol. 57, no. 1, pp. 267–273, Feb. 2011.
[14] S.-L. Chen and J.-G. Wang, “VLSI implementation of low-power cost-efficient lossless ECG encoder design for wireless healthcare monitoringapplication,” Electron. Lett., vol. 49, no. 2, pp. 91–93, Jan. 2013.
[15] A. Kyrkos, E. A. Giakoumakis, G. Carayannis, and G. C. Eurasip, “QRSdetection through time recursive prediction techniques,” Signal Process.,vol. 15, no. 4, pp. 429–436, Dec. 1988.

DEEPU AND LIAN: A JOINT QRS DETECTION AND DATA COMPRESSION SCHEME FOR WEARABLE SENSORS 175
[16] K. P. Lin and W. H. Chang, “QRS feature extraction using linear predic-tion,” IEEE Trans. Biomed. Eng., vol. 36, no. 10, pp. 1050–1055, Oct.1989.
[17] A. L. Goldberger, L. A. N. Amaral, L. Glass, J. M. Hausdorff, P. C.Ivanov, R. G. Mark, J. E. Mietus, G. B. Moody, C.-K. Peng, and H. E.Stanley, “PhysioBank, PhysioToolkit, and PhysioNet: Components of anew research resource for complex physiologic signals,” Circulation, vol.101, no. 23, pp. e215–e220, Jun. 2000.
[18] G. B. Moody and R. G. Mark, “The impact of the MIT-BIH Arrhythmiadatabase,” IEEE Eng. Med. Biol. Mag., vol. 20, no. 3. pp. 45–50, May/Jun.2001.
[19] A. Koski, “Lossless ECG encoding,” Comput. Methods ProgramsBiomed., vol. 52, no. 1, pp. 23–33, Jan. 1997.
[20] B. Farhang-Boroujeny, Adaptive filters: Theory and Applications. NewYork, NY, USA: Wiley, 1998.
[21] L. Der and B. Razavi, “A 2-GHz CMOS image-reject receiver with LMScalibration,” IEEE J. Solid-State Circuits, vol. 38, no. 2, pp. 167–175, Feb.2003.
[22] R. W. Schafer, “What Is a Savitzky-Golay filter?” IEEE Signal Process.Mag., vol. 28, no. 4. pp. 111–117, Jul. 2011.
[23] A. Jas, J. Ghosh-Dastidar, M.-E. Ng, and N. a. A. Touba, “An efficient testvector compression scheme using selective Huffman coding,” IEEE Trans.Comput.-Aided Des. Integr. Circuits Syst., vol. 22, no. 6, pp. 797–806, Jun.2003.
[24] S. Rigler, W. Bishop, and A. Kennings, “FPGA-based lossless data com-pression using Huffman and LZ77 algorithms,” in Proc. Can. Conf. Elec-tron. Comput. Eng., 2007, pp. 1235–1238.
[25] R. A. Becker and T. Acharya, “Variable length coding packing architec-ture,” U.S. Patent US6 653 953 B2, Intel Corporation,” 2003.
[26] C. J. Deepu, X. Zhang, W.-S. Liew, D. L. T. Wong, and Y. Lian, “AnECG-SoC with 535nW/channel lossless data compression for wearablesensors,” in Proc. IEEE Asian Solid-State Circuits Conf., 2013, pp. 145–148.
[27] S.-W. Chen, H.-C. Chen, and H.-L. Chan, “A real-time QRS detectionmethod based on moving-averaging incorporating with wavelet denois-ing,” Comput. Methods Programs Biomed., vol. 82, no. 3, pp. 187–195,Jun. 2006.
[28] R. Poli, S. Cagnoni, and G. Valli, “Genetic design of optimum linear andnonlinear QRS detectors,” IEEE Trans. Biomed. Eng., vol. 42, no. 11. pp.1137–1141, Nov. 1995.
[29] V. X. Afonso, W. J. Tompkins, T. Q. Nguyen, and S. Luo, “ECG beatdetection using filter banks,” IEEE Trans. Biomed. Eng., vol. 46, no. 2.pp. 192–202, Feb. 1999.
[30] P. S. Hamilton and W. J. Tompkins, “Quantitative investigation of QRSdetection rules using the MIT/BIH arrhythmia database,” IEEE Trans.Biomed. Eng., vol. BME-33, no. 12. pp. 1157–1165, Dec. 1986.
[31] F. Zhang and Y. Lian, “QRS detection based on multiscale mathematicalmorphology for wearable ECG devices in body area networks,” IEEETrans. Biomed. Circuits Syst., vol. 3, no. 4, pp. 220–228, Aug. 2009.
[32] J. P. Martinez, R. Almeida, S. Olmos, a P. Rocha, and P. Laguna, “Awavelet-based ECG delineator: evaluation on standard databases,” IEEETrans. Biomed. Eng., vol. 51, no. 4, pp. 570–581, Apr. 2004.
[33] S. S.-L. Chen, H. H.-Y. Lee, C. C.-A. Chen, H.-Y. Huang, and C.-H.Luo, “Wireless body sensor network with adaptive low-power design forbiometrics and healthcare applications,” IEEE Syst. J., vol. 3, no. 4, pp.398–409, Dec. 2009.
Chacko John Deepu (S’07–M’14) received theB.Tech. degree in electronics and communication en-gineering from the University of Kerala, Thiruvanan-thapuram, India, in 2002, and the M.Sc. and Ph.D. de-grees in electrical engineering from National Univer-sity Singapore (NUS), Singapore, in 2008 and 2014,respectively.
He is currently a Research Fellow with the Bio-electronics Laboratory, NUS. His research interestsinclude biomedical signal processing, low-power de-sign, and wearable devices.
Yong Lian (M.90–SM’99–F’09) received the B.Sc.degree from the College of Economics and Man-agement, Shanghai Jiao Tong University, Shanghai,China, in 1984, and the Ph.D. degree from the Depart-ment of Electrical Engineering, National Universityof Singapore (NUS), Singapore, in 1994.
He spent nine years in industry and joined theNUS in 1996. He was appointed as the first Provost’sChair Professor in the Department of Electrical andComputer Engineering, NUS, in 2011. He is also theFounder of ClearBridge VitalSigns Pte. Ltd., a start-
up for wireless wearable biomedical devices. His research interests includebiomedical circuits and systems, and signal processing.
Dr. Lian’s received many awards including the 1996 IEEE CAS Society’sGuillemin-Cauer Award for the best paper published in the IEEE TRANSAC-TIONS ON CIRCUITS AND SYSTEMS II, the 2008 Multimedia Commu-nications Best Paper Award from the IEEE Communications Society for thepaper published in the IEEE TRANSACTIONS ON MULTIMEDIA, the 2011IES Prestigious Engineering Achievement Award, the 2012 Faculty ResearchAward, the 2014 CN Yang Award in Science and Technology for New Immigrant(Singapore). As an educator, he received the University Annual Teaching Ex-cellent Award in two consecutive academic years from 2008 to 2010, and manyother teaching awards from the Faculty of Engineering. Under his guidance,his students received many awards including the Best Student Paper Award inICME 2007, winner of 47th DAC/ISSCC Student Design Contest in 2010, BestDesign Award in A-SSCC 2013 Student Design Contest. He is the Vice Presi-dent for Publications of the IEEE Circuits and Systems (CAS) Society, Steer-ing Committee Member of the IEEE TRANSACTIONS ON BIOMEDICALCIRCUITS AND SYSTEMS and the IEEE TRANSACTIONS ON MULTI-MEDIA, the Past Chair of DSP Technical Committee of the IEEE CAS Society.He was the Editor-in-Chief of the IEEE TRANSACTIONS ON CIRCUITSAND SYSTEMS PART II: EXPRESS BRIEFS for two terms from 2010 to2013. He also served as Associate Editors for the IEEE TRANSACTIONS ONCIRCUITS AND SYSTEMS—PART I: REGULAR PAPERS, IEEE TRANS-ACTIONS ON CIRCUITS AND SYSTEMS—PART II: EXPRESS BRIEFS,IEEE TRANSACTIONS ON BIOMEDICAL CIRCUITS AND SYSTEMS,and Journal of Circuits, Systems Signal Processing in the past 15 years, andwas the Guest Editor for eight special issues in IEEE TRANSACTIONS ONCIRCUITS AND SYSTEMS—PART I: REGULAR PAPERS, IEEE TRANS-ACTIONS ON BIOMEDICAL CIRCUITS AND SYSTEMS, and Journal ofCircuits, Systems Signal Processing. He was the Vice President for the Asia Pa-cific Region of the IEEE CAS Society from 2007 to 2008, AdComm Member ofthe IEEE Biometrics Council from 2008 to 2009, CAS Society Representative tothe BioTechnology Council from 2007 to 2009, Chair of the BioCAS TechnicalCommittee of the IEEE CAS Society from 2007 to 2009, Member of the IEEEMedal for Innovations in Healthcare Technology Committee from 2010 to 2012,and a Distinguished Lecturer of the IEEE CAS Society from 2004 to 2005. Heis the Founder of the International Conference on Green Circuits and Systems,the Asia Pacific Conference on Postgraduate Research in Microelectronics andElectronics, and the IEEE Biomedical Circuits and Systems Conference. He isa Fellow of the Academy of Engineering Singapore.
Related Documents


![Energy Efficient Fetal ECG Telemonitoring Using Wearable ... · [4] G. Da Poian, R. Bernardini, R. Rinaldo, “ Sparse Representation for Fetal QRS Detection in Abdominal ECG Recordings,”](https://static.cupdf.com/doc/110x72/5f87061a7372046e385a4c42/energy-efficient-fetal-ecg-telemonitoring-using-wearable-4-g-da-poian-r.jpg)