A hydrous melting and fractionation model for mid-ocean ridge basalts: Application to the Mid-Atlantic Ridge near the Azores P. D. Asimow Division of Geological and Planetary Sciences, California Institute of Technology, Pasadena, California 91125, USA ([email protected]) Formerly at Lamont-Doherty Earth Observatory, Palisades, New York 10964, USA J. E. Dixon Rosenstiel School of Marine and Atmospheric Science, Division of Marine Geology and Geophysics, University of Miami, Miami, Florida 33149, USA ([email protected]) C. H. Langmuir Lamont-Doherty Earth Observatory, Palisades, New York 10964, USA Now at Department of Earth and Planetary Sciences, Harvard University, Cambridge, Massachusetts 02138, USA ([email protected]) [1] The major element, trace element, and isotopic composition of mid-ocean ridge basalt glasses affected by the Azores hotspot are strongly correlated with H 2 O content of the glass. Distinguishing the relative importance of source chemistry and potential temperature in ridge-hotspot interaction therefore requires a comprehensive model that accounts for the effect of H 2 O in the source on melting behavior and for the effect of H 2 O in primitive liquids on the fractionation path. We develop such a model by coupling the latest version of the MELTS algorithm to a model for partitioning of water among silicate melts and nominally anhydrous minerals. We find that much of the variation in all major oxides except TiO 2 and a significant fraction of the crustal thickness anomaly at the Azores platform are explained by the combined effects on melting and fractionation of up to 700 ppm H 2 O in the source with only a small thermal anomaly, particularly if there is a small component of buoyantly driven active flow associated with the more H 2 O- rich melting regimes. An on-axis thermal anomaly of 35°C in potential temperature explains the full crustal thickness increase of 4 km approaching the Azores platform, whereas a 75°C thermal anomaly would be required in the absence of water or active flow. The polybaric hydrous melting and fractionation model allows us to solve for the TiO 2 , trace element and isotopic composition of the H 2 O-rich component in a way that self-consistently accounts for the changes in the melting and fractionation regimes resulting from enrichment, although the presence and concentration in the enriched component of elements more compatible than Dy cannot be resolved. Components: 13,623 words, 8 figures, 1 table. Keywords: Mid-Atlantic Ridge; Azores; basalt fractionation; hydrous mantle melting; plume-ridge interaction. Index Terms: 3640 Mineralogy and Petrology: Igneous petrology; 3035 Marine Geology and Geophysics: Midocean ridge processes; 9325 Information Related to Geographic Region: Atlantic Ocean. Received 11 April 2003; Revised 21 October 2003; Accepted 18 November 2003; Published 28 January 2004. G 3 G 3 Geochemistry Geophysics Geosystems Published by AGU and the Geochemical Society AN ELECTRONIC JOURNAL OF THE EARTH SCIENCES Geochemistry Geophysics Geosystems Article Volume 5, Number 1 28 January 2004 Q01E16, doi:10.1029/2003GC000568 ISSN: 1525-2027 Copyright 2004 by the American Geophysical Union 1 of 24

Welcome message from author
This document is posted to help you gain knowledge. Please leave a comment to let me know what you think about it! Share it to your friends and learn new things together.
Transcript
A hydrous melting and fractionation model for mid-oceanridge basalts: Application to the Mid-Atlantic Ridge near theAzores
P. D. AsimowDivision of Geological and Planetary Sciences, California Institute of Technology, Pasadena, California 91125, USA([email protected])
Formerly at Lamont-Doherty Earth Observatory, Palisades, New York 10964, USA
J. E. DixonRosenstiel School of Marine and Atmospheric Science, Division of Marine Geology and Geophysics, University of Miami,Miami, Florida 33149, USA ([email protected])
C. H. LangmuirLamont-Doherty Earth Observatory, Palisades, New York 10964, USA
Now at Department of Earth and Planetary Sciences, Harvard University, Cambridge, Massachusetts 02138, USA([email protected])
[1] The major element, trace element, and isotopic composition of mid-ocean ridge basalt glasses affected
by the Azores hotspot are strongly correlated with H2O content of the glass. Distinguishing the relative
importance of source chemistry and potential temperature in ridge-hotspot interaction therefore requires a
comprehensive model that accounts for the effect of H2O in the source on melting behavior and for the
effect of H2O in primitive liquids on the fractionation path. We develop such a model by coupling the latest
version of the MELTS algorithm to a model for partitioning of water among silicate melts and nominally
anhydrous minerals. We find that much of the variation in all major oxides except TiO2 and a significant
fraction of the crustal thickness anomaly at the Azores platform are explained by the combined effects on
melting and fractionation of up to �700 ppm H2O in the source with only a small thermal anomaly,
particularly if there is a small component of buoyantly driven active flow associated with the more H2O-
rich melting regimes. An on-axis thermal anomaly of �35�C in potential temperature explains the full
crustal thickness increase of �4 km approaching the Azores platform, whereas a �75�C thermal anomaly
would be required in the absence of water or active flow. The polybaric hydrous melting and fractionation
model allows us to solve for the TiO2, trace element and isotopic composition of the H2O-rich component
in a way that self-consistently accounts for the changes in the melting and fractionation regimes resulting
from enrichment, although the presence and concentration in the enriched component of elements more
compatible than Dy cannot be resolved.
Components: 13,623 words, 8 figures, 1 table.
Keywords: Mid-Atlantic Ridge; Azores; basalt fractionation; hydrous mantle melting; plume-ridge interaction.
Index Terms: 3640 Mineralogy and Petrology: Igneous petrology; 3035 Marine Geology and Geophysics: Midocean ridge
processes; 9325 Information Related to Geographic Region: Atlantic Ocean.
Received 11 April 2003; Revised 21 October 2003; Accepted 18 November 2003; Published 28 January 2004.
G3G3GeochemistryGeophysics
Geosystems
Published by AGU and the Geochemical Society
AN ELECTRONIC JOURNAL OF THE EARTH SCIENCES
GeochemistryGeophysics
Geosystems
Article
Volume 5, Number 1
28 January 2004
Q01E16, doi:10.1029/2003GC000568
ISSN: 1525-2027
Copyright 2004 by the American Geophysical Union 1 of 24
Asimow, P. D., J. E. Dixon, and C. H. Langmuir (2004), A hydrous melting and fractionation model for mid-ocean ridge
basalts: Application to the Mid-Atlantic Ridge near the Azores, Geochem. Geophys. Geosyst., 5, Q01E16,
doi:10.1029/2003GC000568.
————————————
Theme: Plume-Ridge Interaction Guest Editor: David Graham
1. Introduction
[2] Variations in the trace element ratios and iso-
topic composition of basalts collected along the
Mid-Atlantic Ridge generally reveal long-wave-
length patterns associated with proximity to hot-
spots [Schilling et al., 1983], including Jan Mayen
[Schilling et al., 1999], Iceland [Hart et al., 1973],
the Azores [Schilling, 1975], Sierra Leone [Schilling
et al., 1994], Shona and Discovery [Douglass et
al., 1995, 1999], the Tristan da Cunha group
[Humphris et al., 1985; Hanan et al., 1986], and
Bouvet [Dickey et al., 1977; LeRoex et al., 1987].
Distinguishing the thermal and chemical effects of
hotspots on mid-ocean ridges, determining the
composition of the hotspot-related components,
and understanding the geodynamic processes that
disperse hotspot material over �1000 km distances
have become both the principal barriers to global
understanding of ridge dynamics and essential
areas of opportunity for deep understanding of
the earth’s interior.
[3] It has long been a matter of debate whether the
Azores, in particular, are principally the result of a
thermal hotspot or a compositional anomaly, per-
haps a ‘‘wetspot’’ [Bonatti, 1990]. The shallow
bathymetry of the ridge axis across the Azores
platform certainly requires a low-density column
relative to normal zero-age oceanic lithosphere,
and this is most easily achieved by thickening of
the crust, as is indeed observed seismically [Searle,
1976]. A thick oceanic crust, in turn, requires either
higher-than-normal extents of melting or the pro-
cessing of extra mantle through the melting regime
by an active flow field. Both high extents of
melting and anomalous buoyancy and/or viscosity
(needed to drive active flow), however, are consis-
tent either with elevated mantle temperatures or
volatile-enriched source compositions. Schilling
[1975] documented large enrichments of light rare
earth elements along the ridge approaching the
Azores and concluded a chemically enriched
source was required because melting and fraction-
ation processes were inadequate to explain the
patterns (indeed, this would require much smaller
degrees of melting in the enriched samples, which
makes the crustal volume anomaly that much
harder to explain, Hofmann and White [1982]).
Suggestions for the origin of this enriched domain
have included subducted, partially dehydrated oce-
anic crust [Hofmann and White, 1982; Kurz et al.,
1982] or fragments of continental lithosphere either
left behind during the opening of the Atlantic
[Bonatti, 1971] or delaminated and later advected
upward in a plume [McKenzie and O’Nions, 1983,
1995]. Noble gas evidence from the Azores and the
nearby mid-Atlantic Ridge have been interpreted in
terms of three component mixing, requiring both
an undegassed and a recycled component [Moreira
and Allegre, 1999]. Bonatti [1990] examined the
mineral chemistry and equilibration temperatures
of abyssal peridotites from the Azores region and
found higher extents of depletion (complementary
to high extents of melting) than elsewhere in the
Atlantic, but equal or cooler temperatures.
[4] Given the complex interplay of source compo-
sition, potential temperature, melting process, mix-
ing of melt increments, and fractionation effects in
determining the composition and volume of mid-
ocean ridge crust, progress in separating these
effects requires the application of a model through
which hypotheses can be realized and compared to
data. The model must be sufficiently powerful to
account for all the sources of variability that are
potentially of interest, and it ought to be sufficiently
accurate to provide confidence in the results. Given
that many aspects of the melting process are
unobservable, such models are difficult to test
GeochemistryGeophysicsGeosystems G3G3
asimow et al.: hydrous melting and fractionation 10.1029/2003GC000568
2 of 24
completely. Hence it is best to use a model that
accounts for a wide range of experimental con-
straints and that is based on thermodynamic prin-
ciples. Comprehensive models of mid-ocean ridge
basalt production based on empirical [McKenzie
and Bickle, 1988; Niu and Batiza, 1991; Langmuir
et al., 1992; Kinzler, 1997] or thermodynamic
parameterization [Asimow et al., 2001] have led
to much insight into the depths of origin of mid-
ocean ridge magmas, the range of mantle potential
temperature, the variability in mantle source com-
positions, the effects of the melt transport process
on re-equilibration and mixing, and other issues.
[5] All of the comprehensive models applied to
date, however, share the limitation that they con-
sider only anhydrous conditions. Yet for a number
of reasons there has been renewed interest in
considering the role of H2O in determining the
melting behavior of the MORB source region. The
interpretation of seismic evidence suggesting a
small fraction of melt beneath the southern East
Pacific Rise [MELT Seismic Team, 1998] at pres-
sures higher than those consistent with anhydrous
models suggests water is important even in normal
ridge segments. Certainly to understand a water-
enriched study area such as the Azores region, we
need a model that includes H2O. Although the
direct effects of H2O on melting [Yoder and Tilley,
1962; Kushiro, 1972; Green, 1973; Kushiro, 1975;
Green, 1976; Stolper and Newman, 1994; Hirose
and Kawamoto, 1995; Gaetani and Grove, 1998;
Falloon and Danyushevsky, 2000] and fraction-
ation [Michael and Chase, 1987; Sinton and Fryer,
1987; Danyushevsky, 2001] are fairly well-under-
stood, no comprehensive model of mid-ocean ridge
petrogenesis that accounts for H2O in the source
and in the primary liquid exists. We have devel-
oped such a model by extending a previous anhy-
drous model [Asimow et al., 2001] based on the
MELTS algorithm of Ghiorso and Sack [1995] to
include a description of the partitioning of water
between nominally anhydrous mantle minerals and
basaltic melts [Hirth and Kohlstedt, 1996]. For the
melting part of the calculation we have adopted a
recent recalibration of the silicate liquid model
optimized for peridotite melting at high pressure,
known as pMELTS [Ghiorso et al., 2002], but the
fractionation step uses the original MELTS calibra-
tion, which is more accurate at low pressure. We
present the development and implementation of
this new hybrid model (pHMELTS) and then show
its implications for petrogenesis in the Atlantic
based on the FAZAR cruise data (Atlantis II cruise
127; full sample documentation to be presented in
a separate paper in this journal; Asimow et al., in
preparation, 2003). This model demonstrates good
agreement with an independently developed exten-
sion of the Langmuir et al. [1992] anhydrous ridge
model and both models show the interesting be-
havior that H2O addition to the source causes
decreasing mean extents of melting with increasing
total melt production and hence requires less
enriched sources and smaller temperature anoma-
lies at the Azores and the Galapagos spreading
center than would be required by anhydrous
models [Asimow and Langmuir, 2003].
2. Development of Wet Melting Model
[6] Given the high water contents of basalts from
the study area and the well-known effects of H2O
on both melting and fractionation, a necessary first
step in understanding the relationship between
source heterogeneity and observables must be a
forward model of MORB production and fraction-
ation in the presence of H2O. All published models
of MORB melting that account for polybaric melt
production and mixing to produce a primary ag-
gregate melt [Klein and Langmuir, 1987;McKenzie
and Bickle, 1988; Niu and Batiza, 1991; Kinzler
and Grove, 1992; Langmuir et al., 1992; Kinzler,
1997; Asimow et al., 2001] to date have been
anhydrous models. Most work on hydrous melting
has focused on the water-rich subduction zone
environment. For the water-poor, yet not completely
anhydrous, ridge environment, a new model is
needed. We chose to base pHMELTS on the
pMELTS calibration in part because it incorporates
the Pitzer and Sterner [1994] equation of state for
H2O, which extrapolates well to high pressure, as
opposed to the Haar et al. [1984] equation used in
MELTS, which fails at 1.0 GPa.
[7] The consensus among mineralogists and min-
eral physicists [Bai and Kohlstedt, 1992; Bell and
GeochemistryGeophysicsGeosystems G3G3
asimow et al.: hydrous melting and fractionation 10.1029/2003GC000568asimow et al.: hydrous melting and fractionation 10.1029/2003GC000568
3 of 24
Rossman, 1992; Karato and Jung, 1998] is that
H2O in the upper mantle at concentrations up to
about one thousand parts per million (ppm) by
weight is stored in the nominally anhydrous
minerals olivine, pyroxenes, and garnet. pMELTS
has the ability to model the effect of H2O dis-
solved in the liquid phase. In the absence of
hydrous phases such as free vapor or amphiboles,
however, it knows no location other than the
liquid to store H2O and so cannot be used to
find the water-undersaturated solidus or to per-
form water-undersaturated fractional melting cal-
culations. We worked around this limitation by
adopting the model of Hirth and Kohlstedt [1996]
for solubility of H2O in olivine and relative
partitioning of H2O among mantle solids. In this
model the solubility of H2O in olivine is propor-
tional to the standard-state fugacity of water
fH2Oo . We retain their assumption of Henry’s
law behavior for H2O in the solids such that, at
constant fH2Oo , concentration is proportional to
activity of H2O, aH2O. Hirth and Kohlstedt [1996]
further assumed that the solubility of H2O in the
melt is proportional to ( fH2Oo )1/2 but that at
constant pressure and temperature water concen-
tration in the melt is linearly proportional to aH2O.
These assumptions taken together yield a partition
coefficient DH2Othat is equal to the ratio of
solubilities, is independent of water content, and
depends only on pressure and temperature. Our
model differs from Hirth and Kohlstedt’s [1996]
treatment in two ways. First, we use the solubility
of water in the liquid phase implicit in pMELTS
rather than a simple dependence on ( fH2Oo )1/2; this
accounts for any dependence of water solubility
on melt composition that may arise in the
pMELTS calibration. Second, since at low con-
centrations H2O dissolves in melt as two OH
groups, we do not assume Henry’s law for H2O
concentration in the melt, which makes our DH2O
depend on concentration as well as pressure and
temperature. In particular, just as the solubility of
H2O in the melt depends on ( fH2Oo )1/2, so the
concentration of H2O in the melt when water is
undersaturated should depend on ( fH2O)1/2 =
(aH2O)1/2 ( fH2O
o )1/2. Only at saturation, when
aH2O= 1 and fugacity is equal to standard-state
fugacity, does this model give the same result as
Hirth and Kohlstedt’s assumptions. Thus our
model, by adopting a convention that makes the
water content in melt when water-undersaturated
thermodynamically consistent with the solubility
model, introduces an additional dependence of the
partition coefficient on (aH2O)1/2. As we will see
below, this makes H2O partitioning concentration-
dependent, such that H2O is more compatible in
more H2O-rich source compositions, and such that
DH2Odecreases rapidly during near-fractional
decompression melting due both to decreasing
pressure and decreasing concentration.
[8] To detect the solidus and the onset of melting
with this model, we adopted an approach analogous
to the method described by Ghiorso [1985] for
calculation of equilibrium at fixed fO2. We construct
and minimize a Korzhinskii-type potential that fixes
the activity of H2O rather than the water content of
the system. Given the assumed Henrian behavior of
H2O in the solids, the activity of H2O below the
solidus is determined as follows. First H2O is
partitioned among the various minerals to obtain
the concentration in olivine. The solubility of H2O
in olivine is taken from Hirth and Kohlstedt’s
function of the fugacity of pure water at the pressure
and temperature of interest. Then the activity is
given by the ratio of water concentration in olivine
to water solubility in olivine. Since the activity of
water depends on the modal abundance of the
minerals, an iteration is required to find an equilib-
rium mineral assemblage and aH2Othat are consis-
tent with the desired bulk water content. Then,
given the activities of all the major components
from the calculation of equilibrium and the activity
of H2O from the concentration in olivine relative to
its solubility, we test for the saturation of the non-
ideal pMELTS silicate liquid phase using the algo-
rithm described by Ghiorso [1994] as modified by
Asimow and Ghiorso [1998].
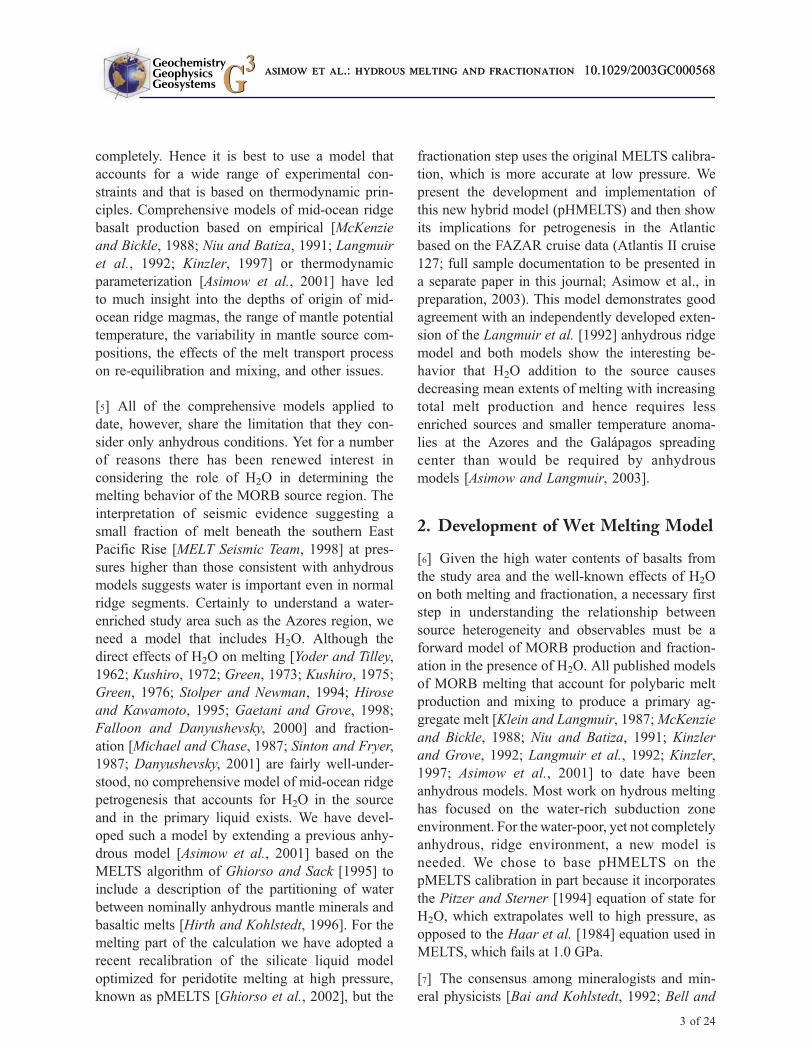
[9] Figure 1 shows the solidus relations predicted
by pHMELTS for our adopted depleted end mem-
ber composition, including the dry and water-
saturated solidus curves, solidus contours of equal
water activity, and solidus curves at fixed bulk H2O
contents. See below for the details of this source
composition; it is obtained from fertile peridotite
by removing �1% melt. The boundaries of the
GeochemistryGeophysicsGeosystems G3G3
asimow et al.: hydrous melting and fractionation 10.1029/2003GC000568
4 of 24
plagioclase, garnet, and hornblende stability fields
on the solidus are also shown. Note that the solidus
contours for 50 and 300 ppm bulk water do not
enter the hornblende stability field but instead
follow its boundary; were the potential temperature
low enough to stabilize amphibole peridotite, then
the solidus at these water concentrations would be
defined by dehydration melting at the breakdown
of hornblende. For potential temperatures appro-
priate to normal oceanic mantle, the adiabat does
not intersect this field and melting begins at a point
on an undersaturated solidus contour defined by
the water content and potential temperature. Thus
for example, the dashed red curve shows the
1380�C adiabat and the solid red curves show three
melting paths beginning on this adiabat for
assemblages with 50, 300, and 700 ppm H2O. As
pressure decreases and the water concentration
necessary to saturate the nominally anhydrous
mineral assemblage decreases, the solidus contours
at fixed bulk water content each merge with the
water-saturated solidus. Figure 1 is qualitatively
similar to the corresponding solidus relations
shown by Hirth and Kohlstedt [1996] based on
their interpolation between estimated dry and
water-saturated solidi.
[10] As the pHMELTS calculation continues be-
yond the initiation of melting, an additional
accounting trick is required that tracks H2O
dissolved in the solids separately from the bulk
composition input to pMELTS for equilibration,
Figure 1. Solidus relations for our adopted depleted peridotite composition (Table 1) with variable H2O contents aspredicted by the pHMELTS model, a hybrid of pMELTS [Ghiorso et al., 2002] and the estimates of solubility ofwater in nominally anhydrous minerals given by Hirth and Kohlstedt [1996]. The upper heavy black curve is theanhydrous solidus (aH2O
= 0); the lowermost heavy black curve is the water-saturated solidus (aH2O= 1). The blue
contours in between are lines of constant activity of water on the solidus at increments of 0.1 in aH2O. The black
curves labeled 50, 300, and 700 show the solidus predicted for these bulk H2O contents in parts per million byweight. These are not parallel to the activity contours because the increase with pressure in the solubility of H2O inthe solid mineral assemblage implies a decrease in aH2O
at fixed bulk water content with increasing pressure. Thegray lines delimit the stability of garnet and plagioclase on the solidus respectively; spinel is present everywherebecause of the Cr2O3 component [see Asimow et al., 1995]. The green boundary delimits the stability of hornblendeon the solidus; this is probably not predicted well given the simple thermodynamic model of hornblende currentlyavailable and occupies a temperature too low for interest at mid-ocean ridges, but is shown for completeness. Thedotted red line is the solid adiabat with potential temperature 1380�C; it is metastable once melting begins. Thesolid red curves are the pressure-temperature trajectories of the adiabatic continuous melting paths for 50, 300, and700 ppm bulk H2O in the source.
GeochemistryGeophysicsGeosystems G3G3
asimow et al.: hydrous melting and fractionation 10.1029/2003GC000568
5 of 24
since pMELTS only knows about the water that
is dissolved in the liquid phase. This is accom-
plished using a trace element add-on to pMELTS
that, given a set of mineral-melt partition coef-
ficients and an initial bulk concentration of each
trace element, calculates bulk partition coeffi-
cients from the modes obtained by pMELTS
and distributes trace elements accordingly. Hence
given an initial guess of the melt fraction, the
trace element subroutine calculates how much
water should be in the melt phase according to
the mineral solubility models of Hirth and Kohl-
stedt and adjusts the bulk composition considered
by pMELTS. Since the mass of H2O in the liquid
phase depends on melt fraction and the melt
fraction depends on the mass of dissolved H2O,
iteration is required to find thermal, major, and
trace element equilibrium. When this iteration
converges, the total H2O content of minerals
and melt equals the prescribed bulk H2O content,
the system is in thermodynamic equilibrium and,
in particular, the activity of H2O implied by the
water content of the minerals equals the aH2O
implied by the water content of the melt. This
iteration has been made computationally efficient
enough that a melting column from 4 GPa to the
surface in 0.01 GPa steps can be calculated in a
few minutes on a workstation.
[11] The pHMELTS model is used to calculate
primary liquid compositions following the ap-
proach described in detail in Asimow et al.
[2001]. We simulate continuous melting in this
work by decompressing the assemblage isentropi-
cally until the melt fraction by volume exceeds 1%.
Any fraction of liquid above 1% is then extracted
and the entropy of the remaining system is used as
the reference for the next decompression step. This
continuous melting approach differs from the per-
fect fractional melting treatments in Asimow et al.
[2001] and Asimow and Langmuir [2003]; we
adopted it here mostly to avoid the need for
calculations at extreme pressures beyond the rea-
sonable calibrated range of pMELTS. The behavior
of water in this model and its effect upon melting
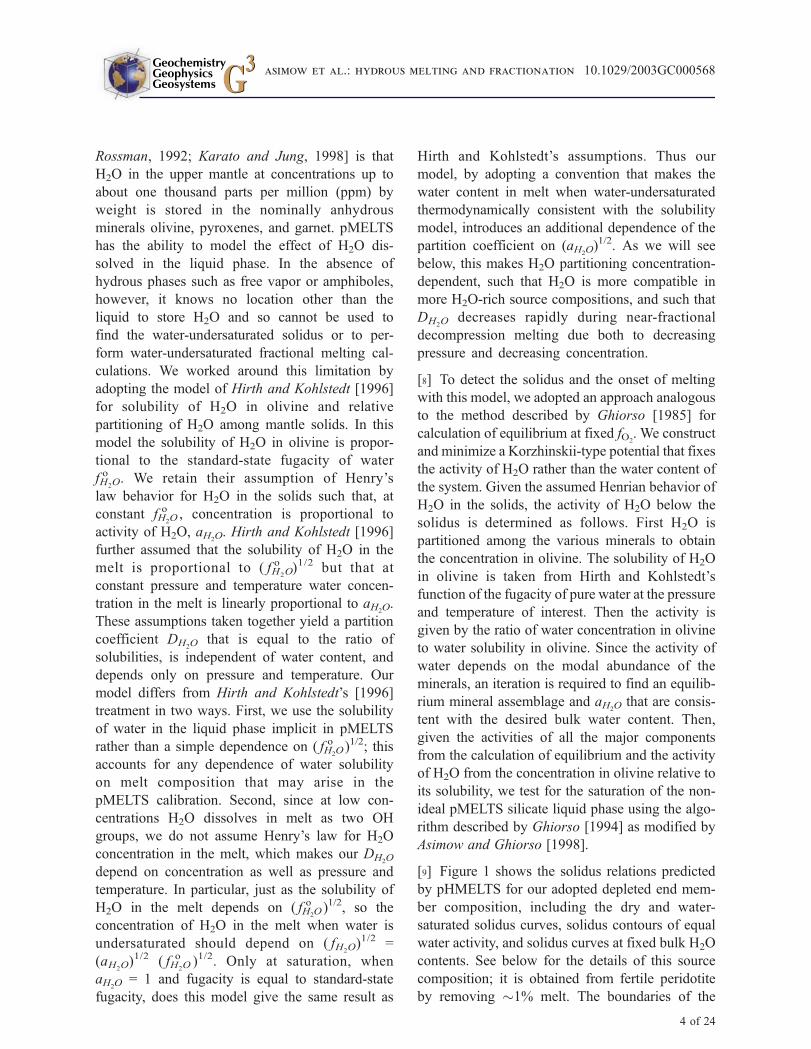
are demonstrated in Figure 2. Figure 2a compares
the melt productivity, percent increase in degree of
melting per kbar pressure decrease, of the dry
pMELTS model and the pHMELTS model at equal
potential temperature and various water contents.
The major features of these productivity functions
include a low near-solidus productivity, increasing
to a maximum of about 3%/kbar just before the
exhaustion of cpx from the residue, followed by a
drop to values <1.5%/kbar for harzburgite melting
[Asimow et al., 1997, 2001]. Compared to previ-
ously published MELTS productivity curves for
fertile peridotite, the dry solidus productivity
is higher and the low-productivity tail much
shorter for this depleted source composition. The
pHMELTS productivity curves show that the pro-
ductivity of water-induced melting below the dry
solidus, about 0.1%/kbar, is lower than the initial
productivity of dry melting. Figure 2a also shows
the somewhat surprising result that wet melting
paths, because of near-fractional melt extraction
below the dry solidus, give a lower productivity at
equal pressure than dryer paths in the pressure
interval where dry melting operates.
[12] The behavior of trace water along the poly-
baric pHMELTS melting paths is shown in
Figures 2b and 2c for various initial water con-
tents at equal potential temperature. Figure 2b
shows the evolution of the bulk partition coeffi-
cient for water. In the Hirth and Kohlstedt [1996]
model (black line), as emphasized above, the
partition coefficient DH2Ois independent of water
content, but decreases during progressive decom-
pression melting because of the drop in pressure
and because the modal abundance of pyroxenes,
in which water is taken to be 5–10 times more
compatible than in olivine, decreases during melt-
ing. On the other hand, in the pHMELTS model
DH2Odepends on water activity, such that sources
with less water give lower DH2Oat equal pressure
and temperature. This aspect of the model pro-
vides a natural explanation for the observation of
Danyushevsky et al. [2000] that H2O partitions
like La in depleted, water-poor MORB suites and
like the more compatible element Nd in water-rich
MORB suites. Figure 2c shows the bulk water
contents of the residual assemblage along the
same melting paths, showing the progressive
drying out of the residue by extraction of water
into the melt phase. As melt extraction decreases
GeochemistryGeophysicsGeosystems G3G3
asimow et al.: hydrous melting and fractionation 10.1029/2003GC000568
6 of 24
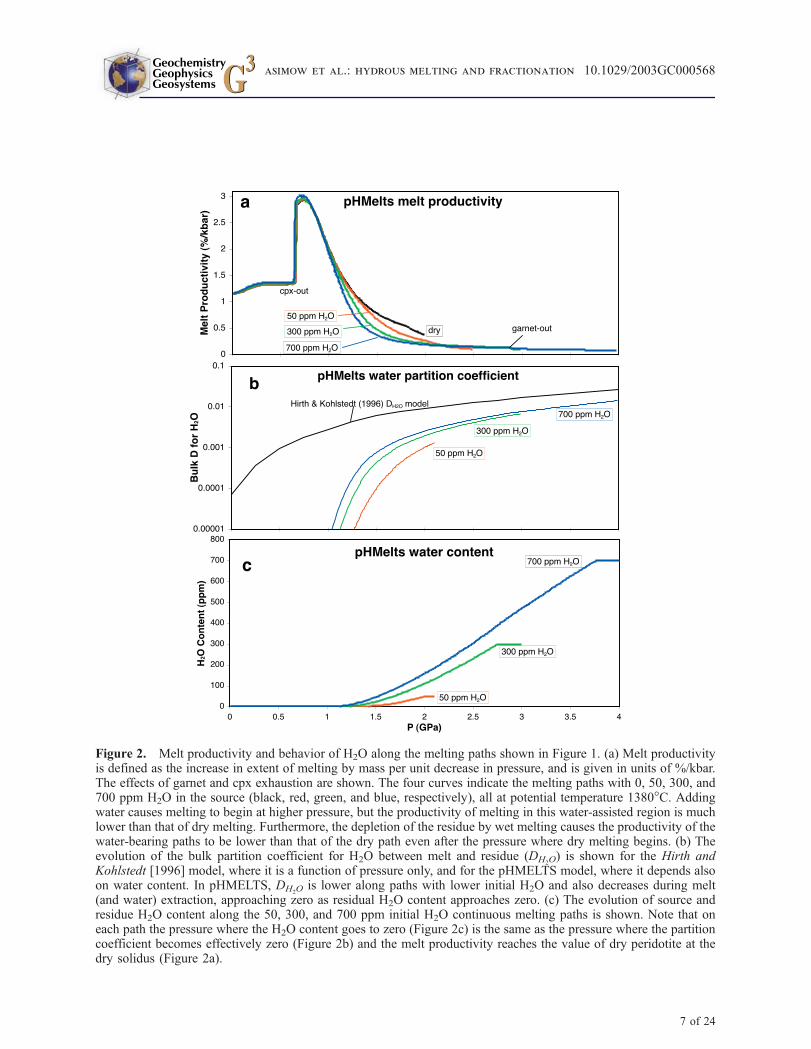
Figure 2. Melt productivity and behavior of H2O along the melting paths shown in Figure 1. (a) Melt productivityis defined as the increase in extent of melting by mass per unit decrease in pressure, and is given in units of %/kbar.The effects of garnet and cpx exhaustion are shown. The four curves indicate the melting paths with 0, 50, 300, and700 ppm H2O in the source (black, red, green, and blue, respectively), all at potential temperature 1380�C. Addingwater causes melting to begin at higher pressure, but the productivity of melting in this water-assisted region is muchlower than that of dry melting. Furthermore, the depletion of the residue by wet melting causes the productivity of thewater-bearing paths to be lower than that of the dry path even after the pressure where dry melting begins. (b) Theevolution of the bulk partition coefficient for H2O between melt and residue (DH2O
) is shown for the Hirth andKohlstedt [1996] model, where it is a function of pressure only, and for the pHMELTS model, where it depends alsoon water content. In pHMELTS, DH2O
is lower along paths with lower initial H2O and also decreases during melt(and water) extraction, approaching zero as residual H2O content approaches zero. (c) The evolution of source andresidue H2O content along the 50, 300, and 700 ppm initial H2O continuous melting paths is shown. Note that oneach path the pressure where the H2O content goes to zero (Figure 2c) is the same as the pressure where the partitioncoefficient becomes effectively zero (Figure 2b) and the melt productivity reaches the value of dry peridotite at thedry solidus (Figure 2a).
GeochemistryGeophysicsGeosystems G3G3
asimow et al.: hydrous melting and fractionation 10.1029/2003GC000568
7 of 24
the H2O content of the residue along each path,
DH2Odrops due to the concentration effect on
partitioning in addition to the pressure and modal
effects. Hence water extraction is an accelerating
process, in which water approaches perfectly
incompatible behavior as its abundance decreases,
yielding a sharper wet-to-dry transition than
would the Hirth and Kohlstedt [1996] model.
[13] Model primary aggregate liquids can be gen-
erated by integrating (i.e., mixing) the incremental
liquids generated along the one-dimensional
streamline calculated by the melting model using
any of a number of formalisms that describe the net
magmatic output of a melting region of given flow
geometry. We found that in the Azores region the
passive flow formalism [e.g.,McKenzie and Bickle,
1988] leads to excessive weighting of high pres-
sure liquids and hence SiO2 too low and FeO* too
high at reasonable potential temperatures. This
behavior is rather insensitive to source composition
since SiO2 activity is buffered by the olivine-
orthopyroxene assemblage and is hence only a
strong function of pressure. This may, of course,
simply reflect errors in the pMELTS model (al-
though model SiO2 compares well to 1 GPa experi-
ments [Ghiorso et al., 2002]), but we found that a
mixing model with a component of active
flow [Scott and Stevenson, 1989; Forsyth, 1992;
Spiegelman, 1996] can match all the observables
simultaneously. Hence we use here a mixing model
that simulates a passive flow at depth and a
transition to buoyantly driven active flow at a
pressure of 0.6 GPa. Such a flow field might arise
from internal buoyancy of retained melt and hence
be restricted to the shallow part of the melting
regime where most melt is accumulated [e.g., Scott,
1992, Figure 4.2b]. This flow field is simulated
using the following integration scheme: melt incre-
ments produced on streamlines that exit the melting
regime below 0.6 GPa are integrated up to the
pressure where they exit the melting regime,
whereas streamlines that cross 0.6 GPa are inte-
grated all the way to the base of the crust. In order
to emphasize as clearly as possible the effect of
water addition alone, we hold the component of
active flow constant in all the calculations below,
although the SiO2 and FeO* data could be better fit
by adding a transition from passive to partly active
flow.
[14] The final step in the model is fractional
crystallization of the primary aggregate composi-
tions until their MgO contents reach 8%. Fraction-
ation is modeled using MELTS at 500 bars and
1 log unit below the quartz-fayalite-magnetite
buffer. At low pressure, the original MELTS cali-
bration [Ghiorso and Sack, 1995] is more reliable
than the newer pMELTS calibration [Ghiorso et
al., 2002], which is optimized for high pressure
and is used here for melting calculations. MELTS
accounts for the effects of H2O in the fractionating
liquid and for consistency is used both for forward-
fractionating the model liquids and, in the follow-
ing comparison against natural basalt glasses, for
forward- or back-fractionating the measured glass
compositions to a common 8% MgO.
3. Application to the Mid-AtlanticRidge Near the Azores
[15] The development of the pHMELTS model was
motivated by the desire to understand and interpret
data on a suite of axial mid-ocean ridge basalt
glasses from the segments of the mid-Atlantic
Ridge near the Azores hotspot. The sample suite
was collected by the FAZAR expedition (cruise
127, legs 1 and 2, of the Atlantis II) in 1992 and
covers a latitude range from 33 to 41�N (Figure 3;
segment definition and nomenclature by Detrick et
al. [1995]). A variety of analyses of subsets of this
suite have been published already: Sr, Nd, and Pb
isotopes and selected trace elements by XRF and
isotope dilution are in Dosso et al. [1999]; U-series
disequilibria on samples from the Azores platform
region of this collection were reported by Bourdon
et al. [1996]; Noble gas concentrations and isotope
ratios were measured by Sarda et al. [1999] and
Moreira et al. [1999]; oxygen isotope composi-
tions are reported by K. M. Cooper, J. M. Eiler,
P. D. Asimow, and C. H. Langmuir (Oxygen isotope
evidence for the origin of enriched mantle beneath
the mid-Atlantic ridge, manuscript submitted to
Geochemistry Geophysics Geosystems, 2003, here-
inafter referred to as Cooper et al., submitted
manuscript, 2003); chalcophile element data are
GeochemistryGeophysicsGeosystems G3G3
asimow et al.: hydrous melting and fractionation 10.1029/2003GC000568
8 of 24
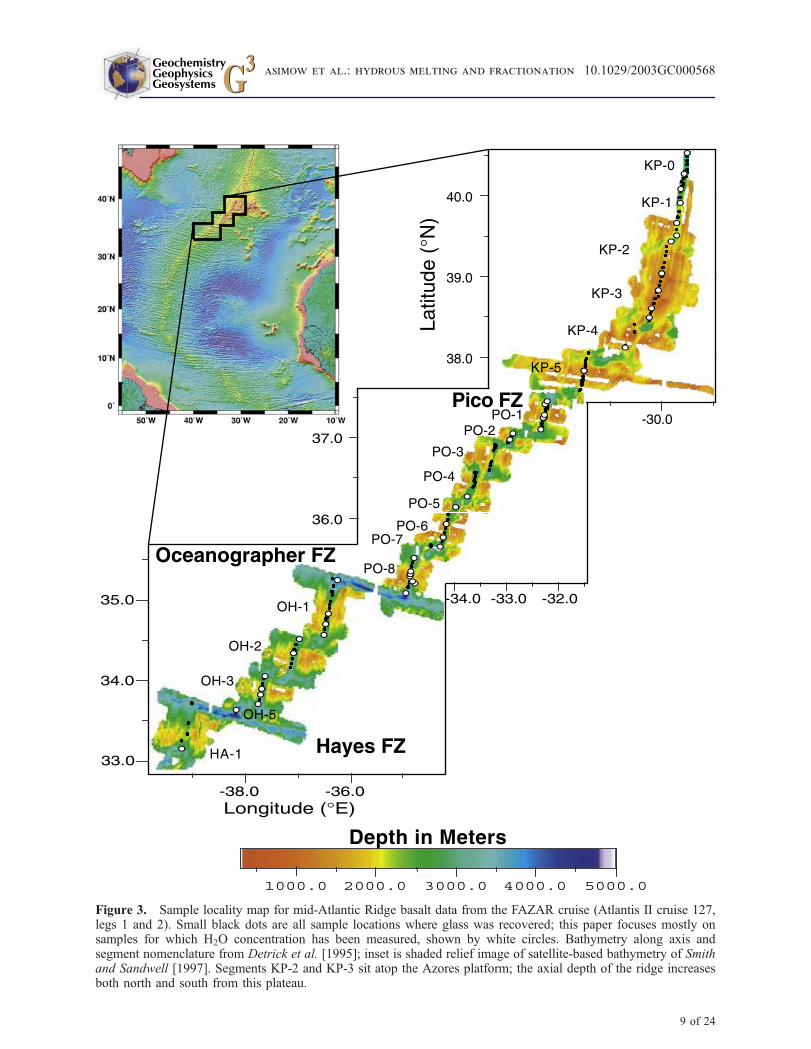
Figure 3. Sample locality map for mid-Atlantic Ridge basalt data from the FAZAR cruise (Atlantis II cruise 127,legs 1 and 2). Small black dots are all sample locations where glass was recovered; this paper focuses mostly onsamples for which H2O concentration has been measured, shown by white circles. Bathymetry along axis andsegment nomenclature from Detrick et al. [1995]; inset is shaded relief image of satellite-based bathymetry of Smithand Sandwell [1997]. Segments KP-2 and KP-3 sit atop the Azores platform; the axial depth of the ridge increasesboth north and south from this plateau.
GeochemistryGeophysicsGeosystems G3G3
asimow et al.: hydrous melting and fractionation 10.1029/2003GC000568
9 of 24
given by Yi et al. [2000a, 2000b]; volatile concen-
trations and degassing corrections are given by
Dixon et al. [2002]. Data have been corrected for
low-pressure fractionation to 8% MgO in a way
that accounts for the heterogeneity of this suite and
the effects of H2O on fractionation [Asimow and
Langmuir, 1998]; the scheme is guided by MELTS
[Ghiorso and Sack, 1995] and represents an im-
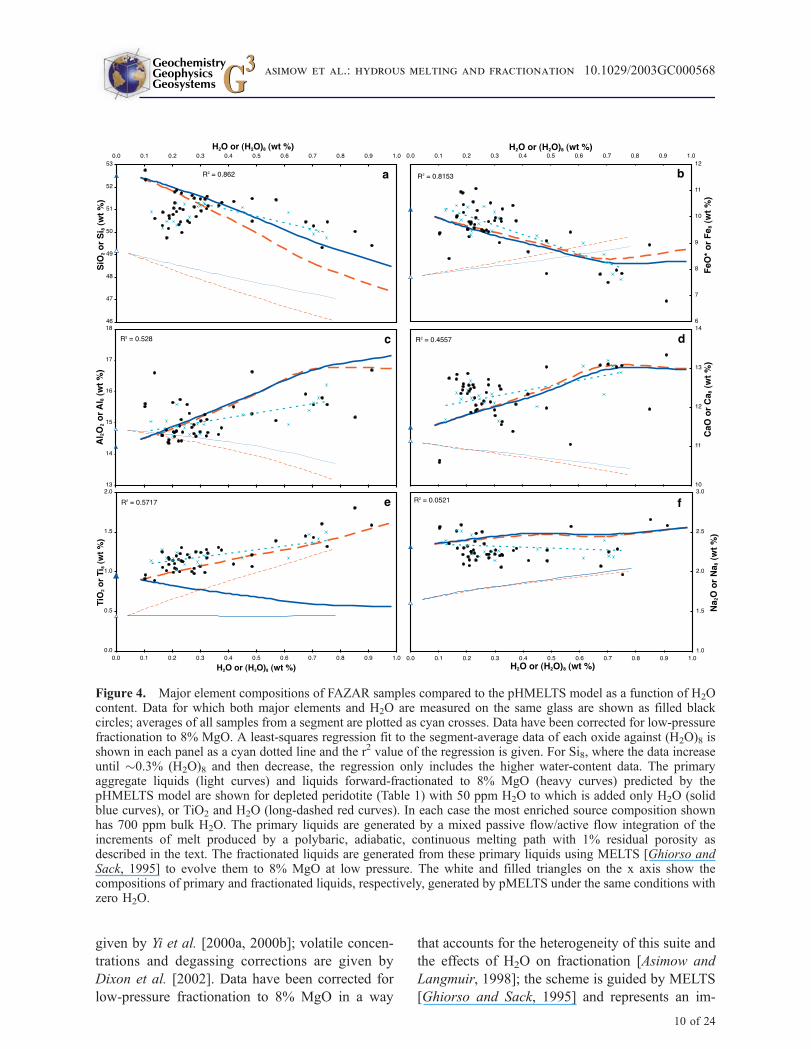
Figure 4. Major element compositions of FAZAR samples compared to the pHMELTS model as a function of H2Ocontent. Data for which both major elements and H2O are measured on the same glass are shown as filled blackcircles; averages of all samples from a segment are plotted as cyan crosses. Data have been corrected for low-pressurefractionation to 8% MgO. A least-squares regression fit to the segment-average data of each oxide against (H2O)8 isshown in each panel as a cyan dotted line and the r2 value of the regression is given. For Si8, where the data increaseuntil �0.3% (H2O)8 and then decrease, the regression only includes the higher water-content data. The primaryaggregate liquids (light curves) and liquids forward-fractionated to 8% MgO (heavy curves) predicted by thepHMELTS model are shown for depleted peridotite (Table 1) with 50 ppm H2O to which is added only H2O (solidblue curves), or TiO2 and H2O (long-dashed red curves). In each case the most enriched source composition shownhas 700 ppm bulk H2O. The primary liquids are generated by a mixed passive flow/active flow integration of theincrements of melt produced by a polybaric, adiabatic, continuous melting path with 1% residual porosity asdescribed in the text. The fractionated liquids are generated from these primary liquids using MELTS [Ghiorso andSack, 1995] to evolve them to 8% MgO at low pressure. The white and filled triangles on the x axis show thecompositions of primary and fractionated liquids, respectively, generated by pMELTS under the same conditions withzero H2O.
GeochemistryGeophysicsGeosystems G3G3
asimow et al.: hydrous melting and fractionation 10.1029/2003GC000568
10 of 24
provement over methods such as generic correction
slopes [e.g., Klein and Langmuir, 1987], simple
regression [e.g., Plank and Langmuir, 1988], uni-
versal polynomial working curves [Niu et al.,
1999], and anhydrous calculations with limited
calibration sets [Weaver and Langmuir, 1990;
Ariskin et al., 1993; Yang et al., 1996]. Full major
element and trace element results and details of
fractionation correction for the entire collected suite
(265 distinct glass compositions from 55 dredges
and 152 wax cores) will be presented in a separate
paper in this journal (Asimow et al., in preparation,
2003); in this paper we focus on testing the model of
hydrous melting against the subset of 56 samples
on which H2O contents have been measured
(white circles in Figure 3).
3.1. Major Elements
[16] Since our purpose here is to test the effect of
H2O on the melting and fractionation process, the
model is compared to data using H2O as the
abscissa in Figure 4. Data are plotted after correc-
tions for degassing [Dixon et al., 2002] and
fractionation, assuming H2O to be perfectly
incompatible and undersaturated during fraction-
ation. The notations (H2O)8, Si8, Ti8, Fe8, etc. refer
to weight percent oxides estimated for the liquid
evolved from or parental to a given sample at the
point where the liquid line of descent crosses 8.0%
MgO. In Figure 4, small black circles are individ-
ual samples on which both major elements and
water have been measured. Cyan crosses are aver-
age values of fractionation-corrected major ele-
ments for all samples from a given segment
(Figure 3) on which major elements have been
measured plotted versus average values of (H2O)8for all samples from a given segment on which
H2O concentrations have been measured; in each
segment many more samples contribute to the
major-element average composition than to the
average water content. Segment-average and indi-
vidual-sample data show similar trends, with re-
duced scatter in the major element data for
segment-average points. For this exercise, we ex-
clude the North Oceanographer Fracture Zone
(segment PO-8 in the nomenclature of Detrick et
al. [1995]) samples, which have been shown to
reflect an isotopically distinct and less H2O-rich
source component than the Azores platform [Shirey
et al., 1987; Dixon et al., 2002]. We also exclude
two samples from segment KP-5 that have experi-
enced open-system degassing and whose pre-erup-
tive H2O content cannot be established with
confidence. In the initial model to be tested, the
enriched component consists only of water and
trace elements; also, the potential temperature and
flow-field are held constant. Hence this model tests
what aspects of the Azores platform anomaly are
attributable purely to H2O addition rather than
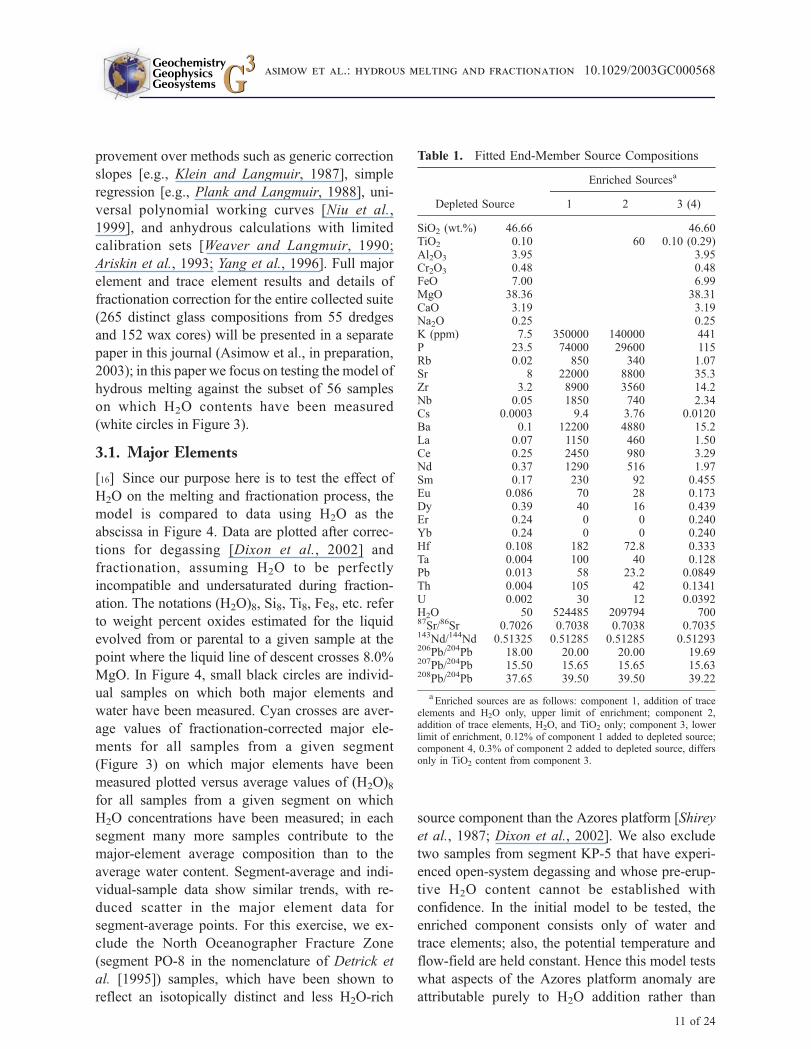
Table 1. Fitted End-Member Source Compositions
Depleted Source
Enriched Sourcesa
1 2 3 (4)
SiO2 (wt.%) 46.66 46.60TiO2 0.10 60 0.10 (0.29)Al2O3 3.95 3.95Cr2O3 0.48 0.48FeO 7.00 6.99MgO 38.36 38.31CaO 3.19 3.19Na2O 0.25 0.25K (ppm) 7.5 350000 140000 441P 23.5 74000 29600 115Rb 0.02 850 340 1.07Sr 8 22000 8800 35.3Zr 3.2 8900 3560 14.2Nb 0.05 1850 740 2.34Cs 0.0003 9.4 3.76 0.0120Ba 0.1 12200 4880 15.2La 0.07 1150 460 1.50Ce 0.25 2450 980 3.29Nd 0.37 1290 516 1.97Sm 0.17 230 92 0.455Eu 0.086 70 28 0.173Dy 0.39 40 16 0.439Er 0.24 0 0 0.240Yb 0.24 0 0 0.240Hf 0.108 182 72.8 0.333Ta 0.004 100 40 0.128Pb 0.013 58 23.2 0.0849Th 0.004 105 42 0.1341U 0.002 30 12 0.0392H2O 50 524485 209794 70087Sr/86Sr 0.7026 0.7038 0.7038 0.7035143Nd/144Nd 0.51325 0.51285 0.51285 0.51293206Pb/204Pb 18.00 20.00 20.00 19.69207Pb/204Pb 15.50 15.65 15.65 15.63208Pb/204Pb 37.65 39.50 39.50 39.22
aEnriched sources are as follows: component 1, addition of trace
elements and H2O only, upper limit of enrichment; component 2,addition of trace elements, H2O, and TiO2 only; component 3, lowerlimit of enrichment, 0.12% of component 1 added to depleted source;component 4, 0.3% of component 2 added to depleted source, differsonly in TiO2 content from component 3.
GeochemistryGeophysicsGeosystems G3G3
asimow et al.: hydrous melting and fractionation 10.1029/2003GC000568
11 of 24
thermal, dynamical or other chemical anomalies.
For this purpose, K2O and P2O5 are treated as trace
elements and are deferred to the binary mixing
calculation below.
[17] Reasonable fits to the low-H2O end of the data
require a depleted source composition, equivalent
to the residue after extracting about 1% melt from
the fertile lherzolite model of Hart and Zindler
[1986]. This end member contains about 50 ppm
H2O; its composition is shown in Table 1. We
modeled the melting of this depleted source and of
mixed sources with up to 700 ppm bulk H2O; the
enriched component initially consists only of H2O
and trace elements that do not affect the melting
relations. A potential temperature of 1380�C,which for this composition intersects the dry sol-
idus at 2 GPa, was selected because it generates
normal 7 km crustal thickness with 50 ppm H2O.
The 1380�Cmetastable adiabat is shown in Figure 1
along with the pressure-temperature trajectories of
the melting paths for the 50, 300, and 700 ppm
H2O calculations.
[18] Figure 4 shows major element composition as
a function of H2O content for primary aggregate
liquids (fine solid blue lines) and liquids fraction-
ated to 8% MgO (bold solid blue lines) generated
from this range of sources. The changes in
primary liquid composition are fairly small. They
approximate the effects of simple increase in
mean pressure of melting due to addition of deep
melts from the hydrous melting region below the
dry solidus: MgO and FeO* go up, other oxides
go down. Where the model trends of the primary
aggregate liquids and the liquids fractionated to
8% MgO are not parallel, we attribute the differ-
ence in these slopes to the effects of H2O on the
liquid line of descent. This is an aspect of the
problem that, while well known to petrologists,
has perhaps received less attention in modeling of
mid-ocean ridge variations than it requires. H2O
in the fractionating liquids has a strong effect on
the fractionation path, promoting olivine fraction-
ation relative to plagioclase and, to a lesser extent,
clinopyroxene (cpx) [Yoder and Tilley, 1962;
Michael and Chase, 1987; Sinton and Fryer,
1987; Danyushevsky, 2001]. Kushiro [1975] pro-
vides a useful qualitative explanation of the sense
of this effect: addition of monovalent cations such
as hydrogen tends to depolymerize the silicate
network in the melt, which shifts liquidus bound-
aries so as to stabilize minerals with the most
depolymerized structure. Olivine, containing iso-
lated SiO4 tetrahedra, is favored relative to cpx, a
chain silicate, and especially relative to plagio-
clase, a framework silicate. The effect is propor-
tional to the mole fraction of the cation, such that
a given weight percent of H2O has a much larger
effect than a comparable weight of Na2O or K2O.
A mid-ocean ridge basalt has the normal fraction-
ation sequence olivine followed by olivine +
plagioclase and then by olivine + plagioclase +
cpx. The effect of H2O is to delay multiple
saturation to lower temperature and liquid MgO
content as well as to increase the abundance of
olivine in the crystallizing assemblage after mul-
tiple saturation. The manifestations of these
changes are discussed oxide-by-oxide below, but
the general sense is, for a given model primary
aggregate liquid, to (1) reduce model Fe8, since
Fe partitions into olivine; (2) increase model Ca8and Al8 since these elements partition into cpx
and plagioclase; and (3) increase model Ti8, Na8,
and other incompatible elements because the
increased modal abundance of the Mg-rich phase
olivine in the fractionating assemblage implies a
smaller mass is withdrawn from the liquid to
reach 8% MgO.
[19] A notable aspect of this mechanism for mod-
ifying values of model liquid predictions at 8%
MgO by water addition is that it ceases to work
once multiple saturation is suppressed to less than
8% MgO, which happens at �0.7% (H2O)8 for the
present model compositions. Additional water may
lower plagioclase and cpx saturation further and
may affect the liquid line of descent once multiple
saturation occurs, but this has no effect on the
predicted value at 8% MgO.
[20] The following paragraphs compare the mod-
eling results to the Atlantic data oxide-by-oxide
and then in normative projection. We find that the
model of simple H2O addition predicts trends for
all elements except Ti8 that have the right sign of
correlation versus (H2O)8 and that the model trends
approximately parallel the principal component of
GeochemistryGeophysicsGeosystems G3G3
asimow et al.: hydrous melting and fractionation 10.1029/2003GC000568
12 of 24
the data arrays in most elements, particularly in the
most water-rich samples.
3.1.1. SiO2
[21] The primary aggregate model liquids show a
decrease in SiO2 with increasing H2O and the
fractionated model liquids show a parallel decrease
in Si8 with increasing (H2O)8 (Figure 4a). We
attribute this effect primarily to the pressure-
dependence of SiO2 in partial melts of peridotite
and the higher mean pressure of melting induced
by addition ofH2Oat constant potential temperature.
For samples or segments with greater than 0.3%
(H2O)8, there is a negative correlation in the data
between Si8 and (H2O)8 with a slope resembling
that predicted by the model. The scatter in the Si8data perpendicular to the modeled H2O-addition
trend are consistent with incomplete mixtures of
the liquids produced in the melting regime, as is
often seen when individual samples from ridge
segments are considered, rather than segment aver-
ages [Klein and Langmuir, 1989]. The bulk of the
data at (H2O)8 <0.3% reflect a different trend, with
a positive slope. This trend could be explained by
an increasingly active flow regime with decreasing
distance to the Azores, perhaps due to the decrease
of mantle viscosity and increase in internal buoy-
ancy of partial melts caused by increasing water in
the source. Lower potential temperature in the
regions farthest from the Azores would have the
opposite effect of raising SiO2 further in the most
H2O-poor samples, yielding too steep a slope in the
SiO2-H2O diagram. Instead these data are best
modeled by coupled variations in flow regime
and H2O content at approximately constant poten-
tial temperature. The flow regime effect, which
seems to be most important at relatively low H2O
contents, is not included in the model trends; at
higher H2O contents, the petrologic effect of water
is dominant, and the model trends appear to repro-
duce the high-H2O data.
3.1.2. FeO
[22] Away from H2O-rich hotspots like the Azores
and the Galapagos [Langmuir et al., 1992], there is
a negative correlation between Fe8 and axial depth
attributable to the increase in mean pressure of
melting with increasing potential temperature
[Klein and Langmuir, 1987]. Given the broad
bathymetric high and thickened crust associated
with the Azores platform, reasoning from the
global trend of Klein and Langmuir would lead
to the expectation of high-Fe8 data in this region.
That we find instead very low Fe8 is surprising and
requires an explanation consistent with the local
observations as well as the global mid-ocean ridge
data set, and this explanation is not likely to be
found in any melting regime process. Indeed, the
primary aggregate liquids predicted by pHMELTS
show increasing FeO* with increasing H2O, even
in the absence of a temperature anomaly (Figure 4b)
because of the increase in the mean pressure of
melting caused by solidus depression. Rather, we
may look to changes in the fractionation process to
explain much of the decrease in Fe8 with increasing
H2O in this region [Asimow and Langmuir, 2003].
[23] The effect of the change in liquid line of
descent due to water addition, in FeO*-MgO space,
is a lowering of Fe8. This is seen in the model
results in Figure 4b, where despite the positive
slope of primary FeO* versus H2O, a negative
correlation of Fe8 with (H2O)8 emerges with a
slope similar to the observed Fe8 data. Between
0.1 and 0.7 wt.% (H2O)8, the model primary
liquids increase by �0.75 absolute wt.% FeO*,
but after fractionation the model predicts a de-
crease of 2 wt.% in Fe8; this is the result of
enhanced olivine fractionation. However, the most
H2O-rich model liquid does not follow the trend.
Once plagioclase and cpx saturation have been
suppressed to less than 8% MgO along the liquid
line of descent, this mechanism no longer leads to
decreases in Fe8. In the treatment of any similar
suite, it is possible to constrain the maximum
magnitude of Fe8 lowering due to the effect of
H2O on fractionation (independent of the uncer-
tainties of a given fractionation model) given only
the MgO value at which plagioclase and/or cpx
saturation occurs in the driest, most depleted
liquids in the suite, e.g., by examination of melt
inclusions or detailed studies of phenocryst
populations.
[24] The segment-averaged data show a decrease
of about 3 wt.% in Fe8 and among the individual
GeochemistryGeophysicsGeosystems G3G3
asimow et al.: hydrous melting and fractionation 10.1029/2003GC000568
13 of 24
samples the range is as large as 4 wt.%. Hence in
its present form the melting and fractionation
model only explains about half the decrease in
Fe8, but this is much better than anhydrous models
that would show an increase in Fe8 due to the
increase in potential temperature needed to explain
the increase in crustal thickness in this region.
3.1.3. Al2O3
[25] The data show, with some scatter, a positive
correlation between (H2O)8 and Al8 (Figure 4c); as
with the Si8 data, the correlation is best defined by
data above 0.3% (H2O)8. The primary liquids
predicted by the pHMELTS model show a negative
correlation between Al2O3 and H2O, but upon
fractionating to 8% MgO the model predicts a
positive correlation up to 0.7% (H2O)8. The model
trend is steeper than that in the data; this could
plausibly be related to artifacts of saturation tem-
perature or plagioclase composition in the MELTS
calculation. The increase in Al8 in H2O-rich model
liquids is attributable to the suppression of plagio-
clase during fractionation, much as the decrease in
Fe8 was attributed to the complementary enhance-
ment in olivine fractionation. That primary Al2O3
and fractionated Al8 vary in opposite senses dem-
onstrates again the importance of considering the
effects of H2O on fractionation as well as on the
melting process.
3.1.4. CaO
[26] The signal-to-noise ratio in the Ca8 data is
low; CaO is the most difficult oxide to accurately
correct to 8% MgO in this suite (Asimow et al., in
preparation, 2003). There is no significant corre-
lation of Ca8 with enrichment in the individual
sample data, but a positive correlation with
(H2O)8 can be recognized in the segment aver-
ages: the most H2O-rich segments as a group have
higher average Ca8 than the more H2O-poor seg-
ments (Figure 4d). There are evidently other
factors affecting CaO and Ca8, but increase with
(H2O)8 does seem to be one principal component
of the averaged data. As with Al8 and Fe8, the
model reproduces this observation despite show-
ing the opposite trend of decreasing CaO in the
primary liquids with increasing H2O, in this case
because of the suppression of cpx fractionation by
H2O.
3.1.5. TiO2
[27] Figure 4e shows that when only H2O is added
to the source, the model fails to reproduce the
positive correlation between Ti8 and (H2O)8. TiO2
in the primary liquids is insensitive to H2O addi-
tion. This may result from an effect that is real, but
exaggerated in pMELTS, namely the decrease in Ti
concentrations in near-solidus alkali-rich liquids
[Baker and Stolper, 1994; Baker et al., 1995], such
that the low-melt fraction liquids created by water-
enhanced deep melting do not add much Ti to the
aggregate liquid. The effect of H2O on the frac-
tionation path, however, is evident in Ti8. H2O
promotes olivine fractionation relative to plagio-
clase and cpx; since olivine is richer in MgO than
these other phases, this leads to a smaller mass of
crystals being fractionated from the more H2O-rich
primary liquids to reach 8% MgO. Since TiO2 is
incompatible during fractionation of olivine, pla-
gioclase, and/or cpx, a decrease in fractionated
mass leads to decreasing Ti8. This is the only clear
failure of the simple pHMELTS model of addition
of H2O at constant potential temperature to explain
a major element trend. For this reason, we also
consider a model in which the enriched source
consists of H2O, trace elements, and TiO2. This is
shown in Figure 4 by the red long-dashed lines
(fine dashed red line showing primary aggregate
model liquids, bold dashed red line showing model
liquids fractionated to 8% MgO). The best fit is
obtained if the enriched component has a TiO2/
H2O ratio of 3, in contrast to the typical MORB
source with a TiO2/H2O ratio of about 10–20. In
detail, the addition of TiO2 to the enriched com-
ponent affects all the other major element trends,
but none of the changes are large enough to affect
the conclusions of this exercise.
3.1.6. Na2O
[28] Consideration of Na presents an interesting
puzzle because an anomaly like the Azores has
several competing effects on Na8 with opposite
sense. A hotspot anomaly would be expected to
lower Na8 because Na2O is incompatible and there
GeochemistryGeophysicsGeosystems G3G3
asimow et al.: hydrous melting and fractionation 10.1029/2003GC000568
14 of 24
is an increase in extent of melting associated with
high potential temperature or excess H2O-driven
melting. On the other hand, trace elements with
bulk partition coefficients similar to that expected
for Na2O are often very high in hotspot-affected
basalts because of source enrichment. Furthermore,
in passive-flow melting regimes, the addition of a
tail of low-degree melting at the base of the melting
regime can draw in considerable extra Na and give
increasing Na2O in primary liquids despite con-
stant source composition and increasing maximum
extent of melting. However, this enhancement may
be moderated by the probable increase in bulk
partition coefficient for Na with increasing pres-
sure. On yet another hand, Na is incompatible
during fractionation and hence any decrease in
the mass fractionated to reach 8% MgO with
increasing olivine fractionation (as seen above for
Ti) may cause a decrease in Na8. In the case of our
data from the Azores region, there is very little
regional signature in Na8 and even in the most
H2O-rich segment high and low-Na8 samples co-
exist (Figure 4f). In detail, there appears to be a
decrease in Na8 from the most depleted samples up
to about 0.3% H2O, followed by constant or
perhaps slightly increasing Na8 in the water-rich
part of the data. In our model, which at this stage
disregards effects of potential temperature or
source enrichment of Na2O, we predict a gentle
increase in primary Na2O due to low-degree melts
from deep in the melting regime, and essentially
constant Na8 up to �0.7 wt.% H2O due to the
effects of increased olivine fractionation from these
primary liquids. The data do not seem to require
source enrichment in Na, although it might be
required to compensate for an increase in potential
temperature.
3.1.7. Major Element Summary
[29] Although the major element variations cannot
be reduced to any single parameter of variation, the
results of the pHMELTS model suggest a set of
physical and chemical mechanisms that explain the
sign and in most cases the approximate magnitude
of that considerable part of the variance in the
observed fractionation-corrected data (about half
the total variance) accounted for by correlation
with H2O. Among Si8, Ti8, Al8, Fe8, Ca8, and
Na8, only Ti8 requires any direct contribution from
the enriched source component. An alternative
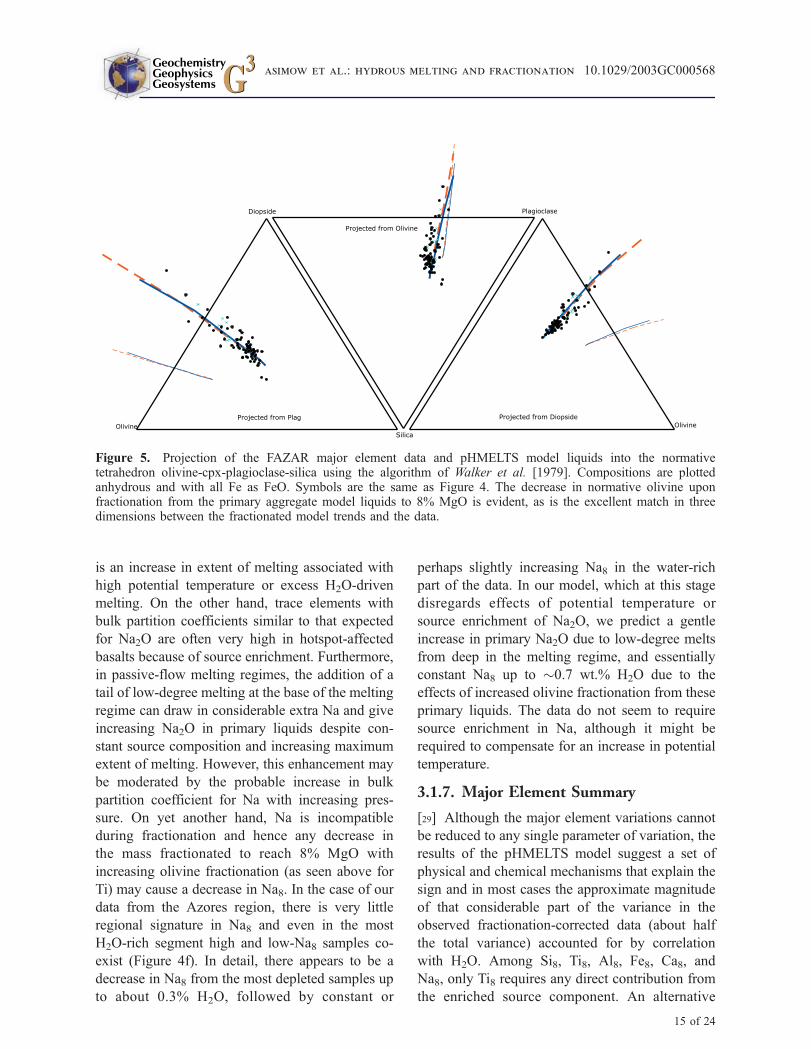
Figure 5. Projection of the FAZAR major element data and pHMELTS model liquids into the normativetetrahedron olivine-cpx-plagioclase-silica using the algorithm of Walker et al. [1979]. Compositions are plottedanhydrous and with all Fe as FeO. Symbols are the same as Figure 4. The decrease in normative olivine uponfractionation from the primary aggregate model liquids to 8% MgO is evident, as is the excellent match in threedimensions between the fractionated model trends and the data.
GeochemistryGeophysicsGeosystems G3G3
asimow et al.: hydrous melting and fractionation 10.1029/2003GC000568
15 of 24
viewpoint to these oxide-oxide variation diagrams
is afforded by projection of the data and model
liquid compositions into the normative tetrahedron
olivine-cpx-plagioclase-silica, for example using
the projection scheme of Walker et al. [1979].
The position of a point in this space depends on
all the major oxides and so presents information in
a complementary manner to the individual oxide
plots. In Figure 5 the position in this tetrahedron is
shown by projection onto three of the bounding
triangles. The fractionation-corrected data (individ-
ual samples, black circles; segment averages, cyan
crosses) as well as the primary aggregate model
trends (light lines; solid blue lines for trace element
and H2O addition only, red long-dashed lines for
model with Ti addition) and fractionated model
trends (bold lines) are shown as in Figure 4.
Viewed from all three of these angles, the projec-
tions of the fractionated model trends fit the data
very well. The data and model trends are all
essentially radial from the silica vertex, and project
to a tight circular cluster and very short curves
when viewed from the silica vertex. Figure 5 shows
that pHMELTS and the particular water-addition
model described here provide an excellent quanti-
tative fit to the first principal component of major-
element variation in the fractionation-corrected
data.
3.2. Crustal Thickness
[30] The thickness of the oceanic crust is an
essential first-order constraint on ridge melting
processes and mantle temperature, and a model
for variations along axis must account for the
absolute value and the changes in crustal thickness
as well as the chemistry of the basalts. There are, of
course, uncertainties in the determination of crustal
thickness by either seismic or gravity-based meth-
ods. In the study area, there are several seismic
determinations of absolute crustal thickness by
refraction profiling [Fowler, 1976; Sinha and
Louden, 1983; Hooft et al., 2000] or Rayleigh
wave dispersion [Searle, 1976] and one gravity
study that interprets variations in mantle Bouguer
anomaly in terms of relative along-axis variations
in crustal thickness [Detrick et al., 1995]. These
studies show that crustal thickness is highly vari-
able at the segment-scale. There are variations
along-axis, e.g., varying from 3.5 km at segment
end to 8 km at segment center with a mean of 5.6
km directly along-axis on segment OH-1 [Hooft et
al., 2000]. Variations across-axis have been inter-
preted at one location in terms of temporal varia-
tions, in the case of an off-axis line on 2 Ma crust
parallel to OH-1 that yields 1–2 km more crust
than the corresponding on-axis line [Sinha and
Louden, 1983]. At another location, crustal thick-
ening from 3 km on-axis to 8 km at 10 km off-axis
on the FAMOUS segment was interpreted as dis-
tributed crustal accretion [Fowler, 1976]. The only
direct determination of crustal thickness in the
Azores platform region is the Rayleigh wave study
of Searle [1976], which reports 8.0 ± 0.6 km for
the center of the platform and 6.3 km for the flanks
of the platform near FAMOUS (i.e., segment PO-3)
or segment KP-0. Given the spatial complexity and
disagreement among various studies, it is difficult
to unambiguously extract an along-axis gradient in
segment-average crustal thickness from the seismic
measurements. Indeed, values near 8 km have been
reported throughout the study area. However, a
reasonable interpretation suggests total thickening
of �3 km over the whole study area, with about
1.5 km between FAMOUS at 37�N and KP-3 at
39�N. This is consistent with the gravity interpre-
tation of Detrick et al. [1995] who obtain a
maximum increase in crustal thickness by attribut-
ing all mantle Bouguer anomalies to Airy isostasy,
ignoring potential mantle or crustal density varia-
tions. Their result is an increase of 3.5–4 km over
the whole study area, of which 2–3 km occurs
between FAMOUS and the Azores platform.
[31] Estimates of segment mean crustal thickness
can be compared to the results of two-dimensional
melting models, since both are meant to be
determinations of total magma budget and are
insensitive to segment-scale along-axis flow of
mantle or melt. In several models of anhydrous
melting and passive-flow mixing at mid-ocean
ridges, a thickening of the crust by 4 km, from
7 km to 11 km, requires an increase of at least
75�C in potential temperature [Kinzler and Grove,
1992; Langmuir et al., 1992; Asimow et al.,
2001]. The model of McKenzie and Bickle
GeochemistryGeophysicsGeosystems G3G3
asimow et al.: hydrous melting and fractionation 10.1029/2003GC000568
16 of 24
[1988], which has a near-solidus productivity
much too high for volatile-affected melting,
requires an increase of 50�C in potential temper-
ature to reach crustal thickness 3 km above
average. The effect of water addition on oceanic
crustal thickness and the corresponding relation-
ship between crustal thickness and potential tem-
perature has previously been modeled only by
Robinson et al. [2001] using an extension of
McKenzie and Bickle’s [1988] parameterization.
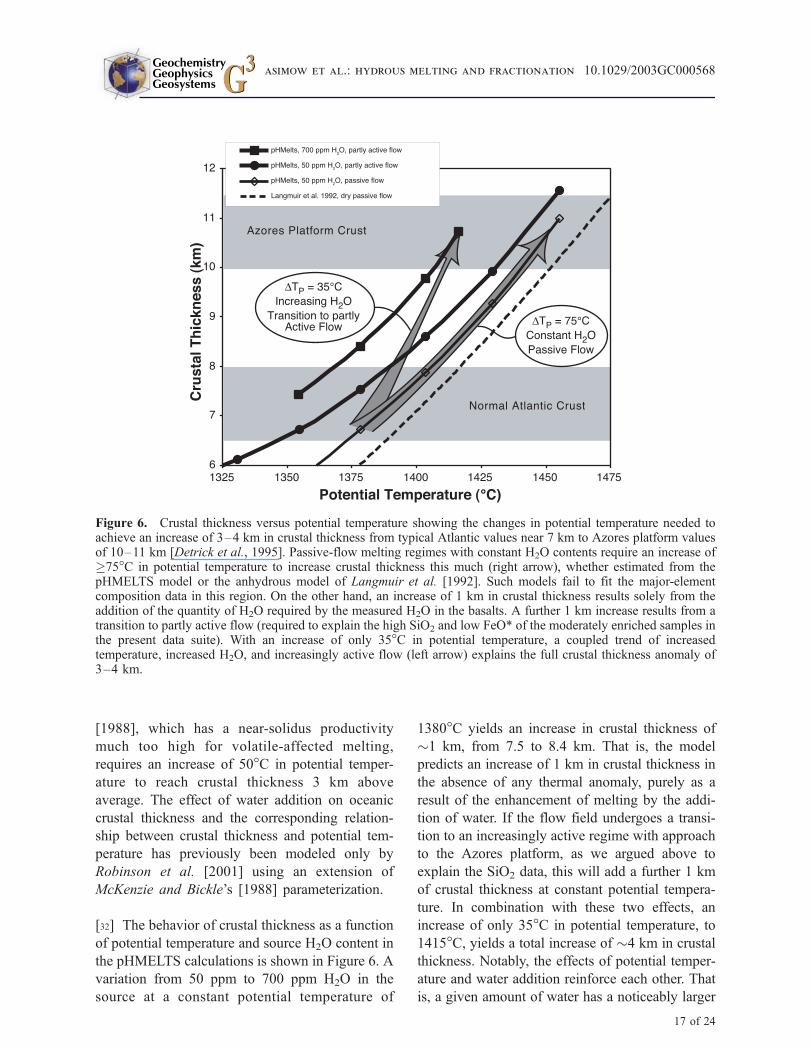
[32] The behavior of crustal thickness as a function
of potential temperature and source H2O content in
the pHMELTS calculations is shown in Figure 6. A
variation from 50 ppm to 700 ppm H2O in the
source at a constant potential temperature of
1380�C yields an increase in crustal thickness of
�1 km, from 7.5 to 8.4 km. That is, the model
predicts an increase of 1 km in crustal thickness in
the absence of any thermal anomaly, purely as a
result of the enhancement of melting by the addi-
tion of water. If the flow field undergoes a transi-
tion to an increasingly active regime with approach
to the Azores platform, as we argued above to
explain the SiO2 data, this will add a further 1 km
of crustal thickness at constant potential tempera-
ture. In combination with these two effects, an
increase of only 35�C in potential temperature, to
1415�C, yields a total increase of �4 km in crustal
thickness. Notably, the effects of potential temper-
ature and water addition reinforce each other. That
is, a given amount of water has a noticeably larger
Figure 6. Crustal thickness versus potential temperature showing the changes in potential temperature needed toachieve an increase of 3–4 km in crustal thickness from typical Atlantic values near 7 km to Azores platform valuesof 10–11 km [Detrick et al., 1995]. Passive-flow melting regimes with constant H2O contents require an increase of�75�C in potential temperature to increase crustal thickness this much (right arrow), whether estimated from thepHMELTS model or the anhydrous model of Langmuir et al. [1992]. Such models fail to fit the major-elementcomposition data in this region. On the other hand, an increase of 1 km in crustal thickness results solely from theaddition of the quantity of H2O required by the measured H2O in the basalts. A further 1 km increase results from atransition to partly active flow (required to explain the high SiO2 and low FeO* of the moderately enriched samples inthe present data suite). With an increase of only 35�C in potential temperature, a coupled trend of increasedtemperature, increased H2O, and increasingly active flow (left arrow) explains the full crustal thickness anomaly of3–4 km.
GeochemistryGeophysicsGeosystems G3G3
asimow et al.: hydrous melting and fractionation 10.1029/2003GC000568
17 of 24
effect at modestly higher potential temperature,
e.g., 1 km at 1380�C and 1.5 km at 1415�C.Conversely, in the presence of water a much
smaller temperature anomaly yields the maximum
increase in crustal thickness inferred by seismic
and gravity methods. We emphasize that the 75�Cincrease in potential temperature required by an-
hydrous models to explain the increased crustal
thickness at the Azores would lead to major
increase in Fe8, precisely the opposite of what is
observed. Although the pHMELTS model has
many shortcomings and contains assumptions that
cannot be defended in great detail, it shows that the
addition of H2O to the source, together with a small
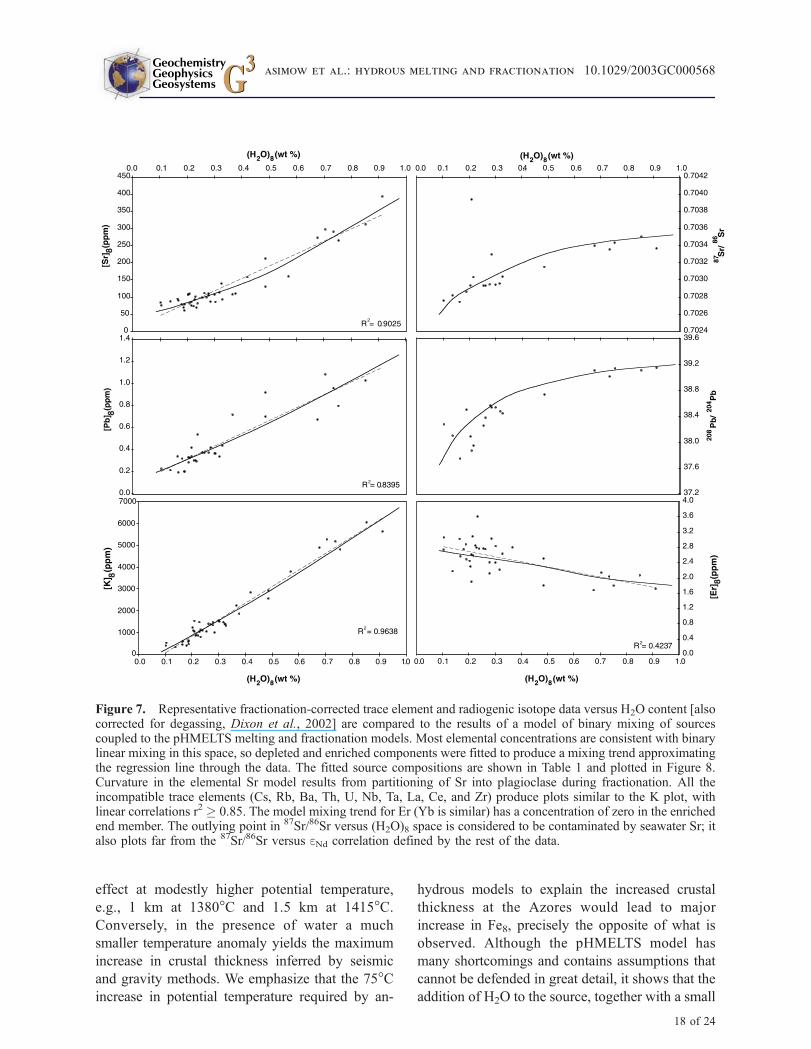
Figure 7. Representative fractionation-corrected trace element and radiogenic isotope data versus H2O content [alsocorrected for degassing, Dixon et al., 2002] are compared to the results of a model of binary mixing of sourcescoupled to the pHMELTS melting and fractionation models. Most elemental concentrations are consistent with binarylinear mixing in this space, so depleted and enriched components were fitted to produce a mixing trend approximatingthe regression line through the data. The fitted source compositions are shown in Table 1 and plotted in Figure 8.Curvature in the elemental Sr model results from partitioning of Sr into plagioclase during fractionation. All theincompatible trace elements (Cs, Rb, Ba, Th, U, Nb, Ta, La, Ce, and Zr) produce plots similar to the K plot, withlinear correlations r2 � 0.85. The model mixing trend for Er (Yb is similar) has a concentration of zero in the enrichedend member. The outlying point in 87Sr/86Sr versus (H2O)8 space is considered to be contaminated by seawater Sr; italso plots far from the 87Sr/86Sr versus eNd correlation defined by the rest of the data.
GeochemistryGeophysicsGeosystems G3G3
asimow et al.: hydrous melting and fractionation 10.1029/2003GC000568
18 of 24
temperature anomaly, can explain geophysical as
well as petrological observations.
3.3. Trace Elements and Isotopes
[33] When radiogenic isotope ratios and fraction-
ation-corrected trace element concentrations are
plotted against fractionation-corrected bulk H2O
contents for the subset of samples where all these
indicators have been analyzed, as in Figure 7, the
results appear consistent with binary mixing. Hence
we have inverted for the composition of two source
components. The fitting utilizes the pHMELTS
model liquids at 8% MgO; however, the adjustable
quantities are not erupted compositions but source
compositions. Hence this exercise accounts for all
the effects of water addition on melting and frac-
tionation. This is significant because the incompat-
ible elements are significantly more enriched in
model liquids derived from melting regimes richer
in H2O due to the large volume of deep mantle that
experiences small degrees of hydrous melting.
Ignoring this effect would lead to an overestimate
by about a factor of two in the abundances of the
most incompatible elements in the enriched com-
ponent. The quality of the resulting fits can be seen
in Figure 7 for several representative trace elements
and isotope ratios. Because the variations in parti-
tion coefficients during melting and fractionation
are small for most of these elements, the model
mixing trends for most trace elements are essentially
linear. However, participation of plagioclase in the
fractionation process leads to significant curvature
in the array of fractionated liquids from mixed
sources for Sr, and this is arguably more consistent
with the data array than simple mixing of liquids.
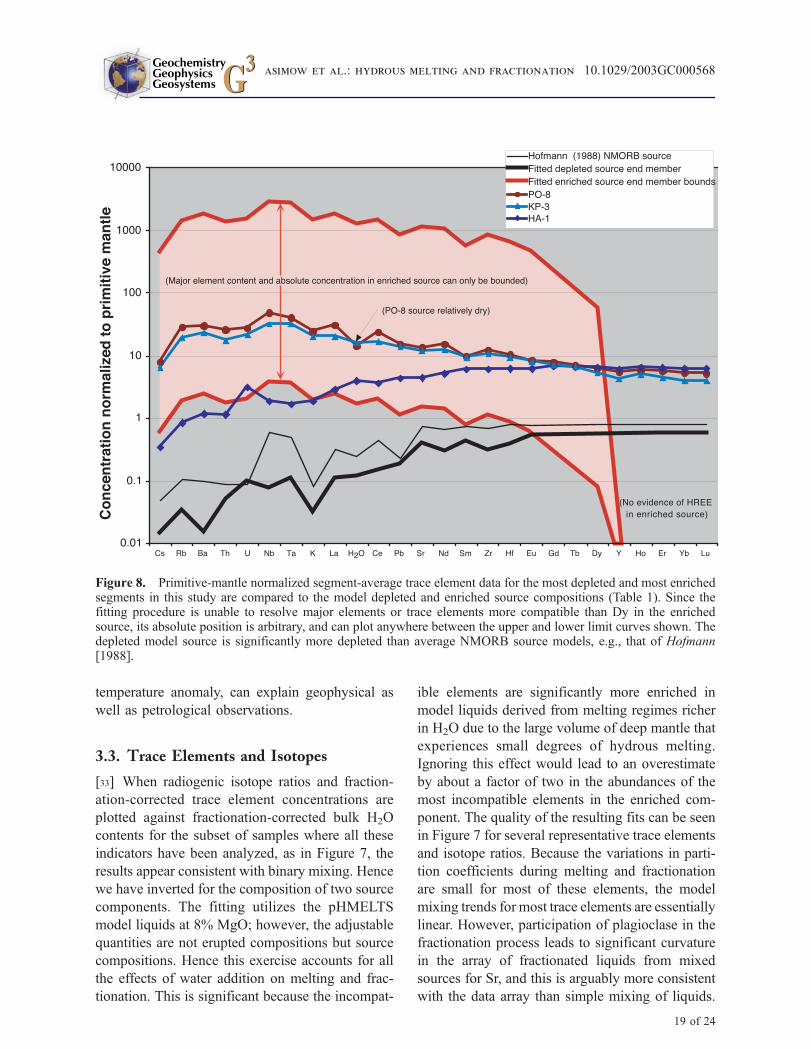
Figure 8. Primitive-mantle normalized segment-average trace element data for the most depleted and most enrichedsegments in this study are compared to the model depleted and enriched source compositions (Table 1). Since thefitting procedure is unable to resolve major elements or trace elements more compatible than Dy in the enrichedsource, its absolute position is arbitrary, and can plot anywhere between the upper and lower limit curves shown. Thedepleted model source is significantly more depleted than average NMORB source models, e.g., that of Hofmann[1988].
GeochemistryGeophysicsGeosystems G3G3
asimow et al.: hydrous melting and fractionation 10.1029/2003GC000568
19 of 24
Because the enriched end member has higher
concentrations of Sr, Nd, and Pb than the depleted
end member, the same model predicts concave-
downward hyperbolic mixing trends that fit the
data very well in radiogenic isotope ratios versus
H2O (Figure 7). In isotope ratio-ratio plots (not
shown), the model trends have a slight curvature,
but the data array could be fitted equally well with
straight lines. In other words, isotope ratio-ratio
plots do not in this data set resolve differences in
Sr/Nd, Sr/Pb, or Nd/Pb ratios among the end
members. For elements more compatible than Dy,
the best fit is obtained with a concentration of zero
in the enriched end member, but this result should
simply be taken to imply that given the small mass
fraction of the enriched component, its composi-
tion is not sufficiently enriched in these elements to
have a significant impact on the composition of the
mixed sources.
[34] The fitted end-member compositions chosen
are given in Table 1 and plotted in Figure 8.
Because the trace element plus H2O content of
the enriched component is normalized to 100%
(that is, unresolved major elements are excluded),
this exercise gives the upper limit on the water
content and degree of enrichment of this source
and a lower limit on the mass fraction added. The
Ti-free model end member is 52 wt.% H2O, has
primitive-mantle normalized incompatible element
abundances of about 1000–2000, and only 0.13%
by mass of this component is required to generate
the most enriched samples. The Ti-bearing model
(with TiO2/H2O ratio of 3) dilutes these numbers to
20 wt.% H2O, incompatible concentrations of
500–700 times primitive, and 0.3% added to the
most enriched source mixture. We consider these
water-dominated compositions for the enriched
component unlikely because H2O/Ce ratios in the
water-rich samples are consistent with magmatic
partitioning rather than involvement of hydrous
fluids [Dixon et al., 2002]; however, if the enriched
component is a silicate melt, then it must contain
major elements that are not resolved by our fitting.
The whole abundance pattern of the enriched
component will be moved downward by the pres-
ence of major elements that are unresolved because
the mass fraction of the enriched source is so small.
The lower limit is obtained by assuming that the
most enriched sample derives from melting the
enriched component in pure form, in which case
the enriched component would be of peridotite
bulk composition with 700 ppm H2O and have
primitive-mantle normalized concentrations of
highly incompatible elements near 2–3; the lower-
limit enriched compositions in Table 1 are obtained
by mixing the depleted source with the necessary
mass fractions of the upper-limit enriched compo-
sitions so as to yield 700 ppm H2O.
[35] On a primitive-mantle normalized diagram
with the elements ordered according to the normal
sequence of incompatibility in MORB [Hofmann,
1988], the pattern for the enriched source compo-
nent (Figure 8) mirrors the compositions of the
most enriched samples, and is fairly smooth.
Anomalies are all less than a factor of two. One
notable aspect of the pattern is the elevated Ce/Pb
ratio (relative to primitive mantle) of the enriched
component, reflecting the high Ce/Pb ratio of
several of the most H2O-rich samples (these sam-
ples also show anomalous oxygen isotope ratios
(Cooper et al., submitted manuscript, 2003)). The
negative anomaly in Pb, a slight negative anomaly
in H2O, and positive anomalies in Nb and Ta are all
features complementary to the patterns observed in
subduction-related magmas [Pearce and Cann,
1973; Miller et al., 1994]. In arc magmas, the
complementary anomalies in these elements are
normally explained by preferential extraction of
fluid-mobile elements from the subducting slab to
the source area in the mantle wedge. Hence the
pattern observed here is consistent with recycled
material residual after extraction of fluid-mobile
components. However, except for compositions
near the lower limit for the enriched source, this
source is too enriched in incompatible elements to
be recycled NMORB even without depletion dur-
ing partial dehydration. Thus it seems necessary
that at some stage in its evolution the enriched
component was mobilized as a small-degree
melt, perhaps deep in a subduction system: after
dehydration and deep enough that the region meta-
somatized by the enriched component escaped
incorporation in the subduction melting environ-
ment. It is possible that this component may have
GeochemistryGeophysicsGeosystems G3G3
asimow et al.: hydrous melting and fractionation 10.1029/2003GC000568
20 of 24
resided for some part of its history in the conti-
nental lithosphere [McKenzie and O’Nions, 1995;
Moreira and Allegre, 1999]. The present model
does not account for the heterogeneities observed
in this region in noble gas isotope ratios; although
the elements examined here do not seem to require
a third component, they do not by any means
exclude it.
4. Conclusions
[36] We have developed a model for mid-ocean
ridge melting regimes with small amounts of water
in the source by combining the pMELTS [Ghiorso
et al., 2002] description of water-bearing crystal-
melt phase equilibria and energetics with the
formulation of solubility of water in nominally
anhydrous mantle minerals described by Hirth
and Kohlstedt [1996]. We use this model to inves-
tigate the major element, trace element, isotopic,
and crustal thickness relations observed along the
Mid-Atlantic Ridge in the vicinity of the Azores
platform. In contrast to the results of standard
models of anhydrous, passive-flow mid-ocean
ridge basalt production, which require a �75�Cincrease in potential temperature to explain the
crustal thickness anomaly and fail to explain any
of the trace, major, volatile, or isotopic chemical
indicators, we find that a temperature anomaly of
<35�C and a small component of active flow
together with the effects of addition of up to
700 ppm H2O in a trace element enriched source
can explain all these data to some extent. There
remain features of the major-element data, includ-
ing the magnitude of the overall decrease in Fe8and the Si8, Ca8, and Na8 trends in the water-poor
subset of the data, that are not well explained, both
because of shortcomings in the quantitative petro-
logical models and because of physical effects not
yet accounted for. For many elements, notably Fe,
Al, and Ca, the changes in erupted compositions
are dominated by the effect of H2O on the low-
pressure fractionation path rather than any effect on
primary liquid composition in the melting process.
In the context of this melting and fractionation
model we find that the trace element and isotopic
data are well-explained by a binary mixing model
in which the enriched source, though we can only
bound its absolute enrichment level, is consistent
with mantle wedge peridotite that was metasomat-
ized by a small-degree melt of a partially dehy-
drated subducted slab.
Acknowledgments
[37] PDA thanks Mark Ghiorso for allowing his code to be so
mercilessly hacked. PDAwas supported for part of this work by
a postdoctoral fellowship from Lamont-Doherty Earth Obser-
vatory and later by the National Science Foundation (OCE 00-
95294). CHL and JED acknowledge support by multiple grants
from NSF over a period of years. This is Division of Geological
and Planetary Sciences contribution number 8913.
References
Ariskin, A. A., M. Y. Frenkel, G. S. Barmina, and R. L.
Nielsen (1993), Comagmat: A FORTRAN program to model
magma differentiation processes, Comp. Geosci., 19, 1155–
1170.
Asimow, P. D., and M. S. Ghiorso (1998), Algorithmic mod-
ifications extending MELTS to calculate subsolidus phase
relations, Am. Mineral., 83, 1127–1132.
Asimow, P. D., and C. H. Langmuir (1998), Segment-scale and
regional systematics from 33�N to 41�N on the Mid-Atlantic
Ridge: Results from the FAZAR Cruise, Eos Trans. AGU,
79(46), Fall Meet. Suppl., F938–F939.
Asimow, P. D., and C. H. Langmuir (2003), The importance of
water to oceanic mantle melting regimes, Nature, 421, 815–
820.
Asimow, P. D., M. M. Hirschmann, M. S. Ghiorso, M. J.
O’Hara, and E. M. Stolper (1995), The effect of pressure-
induced solid-solid phase transitions on decompression melt-
ing of the mantle, Geochim. Cosmochim. Acta, 59, 4489–
4506.
Asimow, P. D., M. M. Hirschmann, and E. M. Stolper (1997),
An analysis of variations in isentropic melt productivity,
Philos. Trans. R. Soc. London Ser. A, 355, 255–281.
Asimow, P. D., M. M. Hirschmann, and E. M. Stolper (2001),
Calculation of peridotite partial melting from thermody-
namic models of minerals and melts. IV. Adiabatic decom-
pression and the composition and mean properties of
mid-ocean ridge basalts, J. Petrol., 42, 963–998.
Bai, Q., and D. L. Kohlstedt (1992), Substantial hydrogen
solubility in olivine and implications for water storage in
the mantle, Nature, 357, 672–674.
Baker, M. B., and E. M. Stolper (1994), Determining the
composition of high-pressure mantle melts using diamond
aggregates, Geochim. Cosmochim. Acta, 58, 2811–2827.
Baker, M. B., M. M. Hirschmann, M. S. Ghiorso, and E. M.
Stolper (1995), Compositions of near-solidus peridotite
melts from experiments and thermodynamic calculations,
Nature, 375, 308–311.
Bell, D. R., and G. R. Rossman (1992), Water in the Earth’s
mantle: The role of nominally anhydrous minerals, Science,
255, 1391–1397.
GeochemistryGeophysicsGeosystems G3G3
asimow et al.: hydrous melting and fractionation 10.1029/2003GC000568
21 of 24
Bonatti, E. (1971), Ancient continental mantle beneath oceanic
ridges, J. Geophys. Res., 76, 3825–3831.
Bonatti, E. (1990), Not so hot ‘‘hot spots’’ in the oceanic
mantle, Science, 250, 107–111.
Bourdon, B., C. H. Langmuir, and A. Zindler (1996), Ridge-
hotspot interaction along the Mid-Atlantic Ridge between
37�300 and 40�300N: The U-Th disequilibrium evidence,
Earth Planet. Sci. Lett., 142, 175–189.
Danyushevsky, L. V. (2001), The effect of small amount of
H2O on crystallisation of mid-ocean ridge and backarc
basic magmas, J. Volcanol. Geotherm. Res., 110, 265–
280.
Danyushevsky, L. V., S. M. Eggins, T. J. Falloon, and
D. M. Christie (2000), H2O abundance in depleted to
moderately enriched mid-ocean ridge magmas; Part I:
Incompatible behaviour, implications for mantle storage,
and origin of regional variations, J. Petrol., 41, 1329–
1364.
Detrick, R. S., H. D. Needham, and V. Renard (1995), Gravity
anomalies and crustal thickness variations along the Mid-
Atlantic Ridge between 33�N and 40�N, J. Geophys. Res.,100, 3767–3787.
Dickey, J. S., Jr., F. A. Frey, S. Hart, E. B. Watson, and
G. Thompson (1977), Geochemistry and petrology of
dredged basalts from the Bouvet triple junction, South
Atlantic, Geochim. Cosmochim. Acta, 41, 1105–1118.
Dixon, J. E., L. Leist, C. H. Langmuir, and J.-G. Schilling
(2002), Recycled dehydrated lithosphere observed in
plume-influenced mid-ocean-ridge basalt, Nature, 420,
385–389.
Dosso, L., H. Bougault, C. H. Langmuir, C. Bollinger,
O. Bonnier, and J. Etoubleau (1999), The age and dis-
tribution of mantle heterogeneity along the Mid-Atlantic
Ridge (31–41�N), Earth Planet. Sci. Lett., 170, 269–
286.
Douglass, J., J.-G. Schilling, and R. H. Kingsley (1995), In-
fluence of the discovery and shona mantle plumes on the
southern Mid-Atlantic Ridge: Rare-earth evidence, Geophys.
Res. Lett., 22, 2893–2896.
Douglass, J., J.-G. Schilling, and D. Fontignie (1999), Plume-
ridge interactions of the Discovery and Shona mantle plumes
with the southern mid-Atlantic ridge (40�–55�S), J. Geo-phys. Res., 104, 2941–2962.
Falloon, T. J., and L. V. Danyushevsky (2000), Melting of
refractory mantle at 1. 5, 2 and 2. 5 GPa under anhydrous
and H2O-undersaturated conditions: Implications for the
petrogenesis of high-Ca boninites and the influence of
subduction components on mantle melting, J. Petrol., 41,
257–283.
Forsyth, D. W. (1992), Geophysical constraints on mantle flow
and melt generation beneath mid-ocean ridges, in Mantle
Flow and Melt Generation at Mid-Ocean Ridges, Geophys.
Monogr. Ser., vol. 71, edited by J. P. Morgan, D. K.
Blackman, and J. M. Sinton, pp. 1–66, AGU, Washington,
D.C.
Fowler, C. M. R. (1976), Crustal structure of the Mid-Atlantic
ridge crest at 37�N, Geophys. J. R. Astron. Soc., 47, 459–491.
Gaetani, G. A., and T. L. Grove (1998), The influence of water
on melting of mantle peridotite, Contrib. Mineral. Petrol.,
131, 323–346.
Ghiorso, M. S. (1985), Chemical Mass transfer in magmatic
processes: I. Thermodynamic relations and numerical algo-
rithms, Contrib. Mineral. Petrol., 90, 107–120.
Ghiorso, M. S. (1994), Algorithms for the estimation of
phase stability in heterogeneous thermodynamic systems,
Geochim. Cosmochim. Acta, 58, 5489–5501.
Ghiorso, M. S., and R. O. Sack (1995), Chemical mass transfer
in magmatic processes IV. A revised and internally consis-
tent thermodynamic model for the interpolation and extra-
polation of liquid-solid equilibria in magmatic systems at
elevated temperatures and pressures, Contrib. Mineral. Pet-
rol., 119, 197–212.
Ghiorso, M. S., M. M. Hirschmann, P. W. Reiners, and V. C.
Kress III (2002), The pMELTS: A revision of MELTS for
improved calculation of phase relations and major element
partitioning related to partial melting of the mantle to 3 GPa,
Geochem. Geophys. Geosyst., 3(5), 1030, doi:10.1029/
2001GC000217.
Green, D. H. (1973), Experimental studies on a model upper
mantle composition at high pressure under water-saturated
and water-undersaturated conditions, Earth Planet. Sci. Lett.,
19, 37–53.
Green, D. H. (1976), Experimental testing of ‘‘equilibrium’’
partial melting of peridotite under water-saturated, high-pres-
sure conditions, Can. Mineral., 14, 255–268.
Haar, L., J. S. Gallagher, and G. S. Kell (1984), NBS/NRC
Steam Tables, Hemisphere Publ., Washington, D.C.
Hanan, B. B., R. H. Kingsley, and J.-G. Schilling (1986), Pb
isotope evidence in the South-Atlantic for migrating ridge
hotspot interactions, Nature, 322, 137–144.
Hart, S. R., and A. Zindler (1986), In search of a bulk-earth
composition, Chem. Geol., 57, 247–267.
Hart, S. R., J.-G. Schilling, and J. L. Powell (1973), Basalts
from Iceland and along the Reykjanes Ridge: Sr isotope
geochemistry, Nature Phys. Sci., 246, 104–107.
Hirose, K., and T. Kawamoto (1995), Hydrous partial melting
of lherzolite at 1 GPa: The effect of H2O on the genesis of
basaltic magmas, Earth Planet. Sci. Lett., 133, 463–473.
Hirth, G., and D. L. Kohlstedt (1996), Water in the oceanic
upper mantle: Implications for rheology, melt extraction and
the evolution of the lithosphere, Earth Planet. Sci. Lett.,
144(1–2), 93–108.
Hofmann, A. W. (1988), Chemical differentiation of the Earth:
The relationship between mantle, continental crust, and ocea-
nic crust, Earth Planet. Sci. Lett., 90, 297–314.
Hofmann, A. W., and W. M. White (1982), Mantle plumes
from ancient oceanic crust, Earth Planet. Sci. Lett., 57,
421–436.
Hooft, E. E. E., R. S. Detrick, D. R. Toomey, J. A. Collins, and
J. Lin (2000), Crustal thickness and structure along three
contrasting spreading segments of the Mid-Atlantic Ridge,
33.5�N–35�N, J. Geophys. Res., 105, 8205–8226.Humphris, S. E., G. Thompson, J.-G. Schilling, and R. H.
Kingsley (1985), Petrological and Geochemical Variations
Along the Mid-Atlantic Ridge Between 46�S and 32�S -
GeochemistryGeophysicsGeosystems G3G3
asimow et al.: hydrous melting and fractionation 10.1029/2003GC000568
22 of 24
Influence of the Tristan Da Cunha Mantle Plume, Geochim.
Cosmochim. Acta, 49, 1445–1464.
Karato, S.-I., and H. Jung (1998), Water, partial melting and
the origin of the seismic low velocity and high attenuation
zone in the upper mantle, Earth Planet. Sci. Lett., 157, 193–
207.
Kinzler, R. J. (1997), Melting of mantle peridotite at pressures
approaching the spinel to garnet transition: Application to
mid-ocean ridge basalt petrogenesis, J. Geophys. Res., 102,
853–874.
Kinzler, R. J., and T. L. Grove (1992), Primary magmas of
mid-ocean ridge basalts: 2. Applications, J. Geophys. Res.,
97, 6907–6926.
Klein, E. M., and C. H. Langmuir (1987), Global correlations
of ocean ridge basalt chemistry with axial depth and crustal
thickness, J. Geophys. Res., 92, 8089–8115.
Klein, E. M., and C. H. Langmuir (1989), Local versus global
variations in ocean ridge basalt composition: A reply,
J. Geophys. Res., 94, 4241–4252.
Kurz, M. D., W. J. Jenkins, J.-G. Schilling, and S. R. Hart
(1982), Helium isotope variations in the mantle beneath
the central North Atlantic Ocean, Earth Planet. Sci. Lett.,
58, 1–14.
Kushiro, I. (1972), Effect of water on the composition of
magmas formed at high pressures, J. Petrol., 13, 311–334.
Kushiro, I. (1975), Nature of Silicate Melt and Its Significance
in Magma Genesis - Regularities in Shift of Liquidus Bound-
aries Involving Olivine, Pyroxene, and Silica Minerals, Am.
J. Sci., 275, 411–431.
Langmuir, C. H., E. M. Klein, and T. Plank (1992), Petro-
logical systematics of mid-ocean ridge basalts: Constraints
on melt generation beneath ocean ridges, inMantle Flow and
Melt Generation at Mid-Ocean Ridges, Geophys. Monogr.
Ser., vol. 71, edited by J. P. Morgan, D. K. Blackman,
and J. M. Sinton, pp. 183–280, AGU, Washington,
D.C.
LeRoex, A. P., H. J. B. Dick, L. Gulen, A. M. Reid, and A. J.
Erlank (1987), Local and Regional Heterogeneity in Morb
From the Mid-Atlantic Ridge Between 54.5�S and 51�S -
Evidence For Geochemical Enrichment, Geochim. Cosmo-
chim. Acta, 51, 541–555.
McKenzie, D., and M. J. Bickle (1988), The volume and com-
position of melt generated by extension of the lithosphere,
J. Petrol., 29, 625–679.
McKenzie, D., and R. K. O’Nions (1983), Mantle reservoirs
and ocean island basalts, Nature, 301, 229–231.
McKenzie, D., and R. K. O’Nions (1995), The source regions
of ocean island basalts, J. Petrol., 36, 133–159.
MELT Seismic Team (1998), Imaging the deep seismic struc-
ture beneath a Mid-Ocean Ridge: The MELT experiment,
Science, 280, 1215–1218.
Michael, P. J., and R. L. Chase (1987), The influence of pri-
mary magma composition, H2O and pressure on Mid-Ocean
Ridge basalt differentiation, Contrib. Mineral. Petrol., 96,
245–263.
Miller, D. M., S. L. Goldstein, and C. H. Langmuir (1994), Ce/
Pb and Pb-isotope ratios in arc magmas and the enrichment
of Pb in the continents, Nature, 368, 514–520.
Moreira, M., and C.-J. Allegre (1999), Rare gas systematics on
Mid-Atlantic Ridge (37–40�N), Earth Planet. Sci. Lett.,
198, 401–416.
Niu, Y., and R. Batiza (1991), An empirical method for calcu-
lating melt compositions produced beneath mid-ocean
ridges: Application to axis and off-axis (seamounts) melting,
J. Geophys. Res., 96, 21,753–21,777.
Niu, Y., K. D. Collerson, R. Batiza, J. I.Wendt, andM. Regelous
(1999), Origin of enriched-type mid-ocean ridge basalt at
ridges far from mantle plumes: The East Pacific Rise at
11�200N, J. Geophys. Res., 104, 7067–7087.Pearce, J. A., and J. R. Cann (1973), Tectonic setting of basic
volcanic rocks determined using trace element analyses,
Earth Planet. Sci. Lett., 19, 290–300.
Pitzer, K. S., and S. M. Sterner (1994), Equations of state valid
continuously from zero to extreme pressures for H2O and
CO2, J. Chem. Phys., 101, 3111–3116.
Plank, T., and C. H. Langmuir (1988), An evaluation of the
global variations in the major element chemistry of arc ba-
salts, Earth Planet. Sci. Lett., 90, 349–370.
Robinson, C. J., M. J. Bickle, T. A. Minshull, R. S. White, and
A. R. L. Nichols (2001), Low degree melting under the
Southwest Indian Ridge: The roles of mantle temperature,
conductive cooling and wet melting, Earth Planet. Sci. Lett.,
188, 383–398.
Sarda, P., M. Moreira, and T. Staudacher (1999), Argon-lead
isotopic correlation in Mid-Atlantic Ridge basalts, Science,
283, 666–668.
Schilling, J.-G. (1975), Azores mantle blob: The rare earth
evidence, Earth Planet. Sci. Lett., 24, 103–105.
Schilling, J.-G., M. Zajac, R. Evans, T. Johnston, W. White,
J. D. Devine, and R. Kingsley (1983), Petrologic and geo-
chemical variations along the Mid-Atlantic Ridge from 29�Nto 73�N, Am. J. Sci., 283, 510–586.
Schilling, J.-G., B. B. Hanan, B. McCully, R. H. Kingsley, and
D. Fontignie (1994), Influence of the Sierra-Leone Mantle
Plume On the Equatorial Mid-Atlantic Ridge: A Nd-Sr-Pb
Isotopic Study, J. Geophys. Res., 99, 12,005–12,028.
Schilling, J.-G., R. Kingsley, D. Fontignie, R. Poreda, and
S. Xue (1999), Dispersion of the Jan Mayen and Iceland
mantle plumes in the Arctic: A He-Pb-Nd-Sr isotope tracer
study of basalts from the Kolbeinsey, Mohns, and Knipovich
Ridges, J. Geophys. Res., 104, 10,543–10,569.
Scott, D. R. (1992), Small-scale convection and mantle melt-
ing beneath mid-ocean ridges, in Mantle Flow and Melt
Generation at Mid-Ocean Ridges, Geophys. Monogr. Ser.,
vol. 71, edited by J. P. Morgan, D. K. Blackman, and J. M.
Sinton, pp. 327–352, AGU, Washington, D.C.
Scott, D. R., and D. J. Stevenson (1989), A self-consistent
model of melting, magma migration and buoyancy-driven
circulation beneath mid-ocean ridges, J. Geophys. Res., 94,
2973–2988.
Searle, R. C. (1976), Lithospheric structure of the Azores Pla-
teau from Rayleigh-wave dispersion, Geophys. J. R. Astron.
Soc., 44, 537–546.
Shirey, S. B., J. F. Bender, and C. H. Langmuir (1987), Three-
component isotopic heterogeneity near the Oceanographer
transform, Mid-Atlantic Ridge, Nature, 325, 217–223.
GeochemistryGeophysicsGeosystems G3G3
asimow et al.: hydrous melting and fractionation 10.1029/2003GC000568
23 of 24
Sinha, M. C., and K. E. Louden (1983), The Oceanographer
fracture zone-1. Crustal structure from seismic refraction
studies, Geophysical J. Royal Astronomical Society, 75,
715–736.
Sinton, J. M., and P. Fryer (1987), Mariana trough lavas from
18�N: Implications for the origin of back-arc basalts, J. Geo-
phys. Res., 92, 12,782–12,802.
Smith, W. H. F., and D. T. Sandwell (1997), Global seafloor
topography from satellite altimetry and ship depth sound-
ings, Science, 277, 1957–1962.
Spiegelman, M. (1996), Geochemical consequences of
melt transport in 2-D: The sensitivity of trace elements
to mantle dynamics, Earth Planet. Sci. Lett., 139, 115–
132.
Stolper, E. M., and S. Newman (1994), The role of water in the
petrogenesis of Mariana trough magmas, Earth Planet. Sci.
Lett., 121, 293–325.
Walker, D., T. Shibata, and S. E. DeLong (1979), Abyssal
tholeiites from the Oceanographer Fracture Zone, Contrib.
Mineral. Petrol., 70, 111–125.
Weaver, J., and C. H. Langmuir (1990), Calculation of
phase equilibrium in mineral-melt systemsComp. Geosci.,
16, 1–19.
Yang, H.-J., R. J. Kinzler, and T. L. Grove (1996), Experiments
and models of anhydrous, basaltic olivine-plagioclase-augite
saturated melts from 0. 001 to 10 kbar, Contrib. Mineral.
Petrol., 124, 1–18.
Yi, W., A. N. Halliday, J. C. Alt, D. C. Lee, M. Rehkamper,
M. O. Garcia, and Y. J. Su (2000a), Cadmium, indium, tin,
tellurium, and sulfur in oceanic basalts: Implications for
chalcophile element fractionation in the Earth, J. Geophys.
Res., 105, 18,927–18,948.
Yi, W., A. Halliday, J. Alt, D. Lee, M. Rehkamper, M. Garcia,
C. Langmuir, and Y. Su (2000b), Erratum: ‘‘Cadmium, in-
dium, tin, tellurium, and sulfur in oceanic basalts: Implica-
tions for chalcophile element fractionation in the Earth,’’
J. Geophys. Res., 105, 23,761–23,762.
Yoder, H. S., and C. E. Tilley (1962), Origin of basaltic mag-
mas: Experimental study of natural and synthetic rock sys-
tems, J. Petrol., 3, 342–532.
GeochemistryGeophysicsGeosystems G3G3
asimow et al.: hydrous melting and fractionation 10.1029/2003GC000568
24 of 24
Related Documents