ARTICLES A human gut microbial gene catalogue established by metagenomic sequencing Junjie Qin 1 *, Ruiqiang Li 1 *, Jeroen Raes 2,3 , Manimozhiyan Arumugam 2 , Kristoffer Solvsten Burgdorf 4 , Chaysavanh Manichanh 5 , Trine Nielsen 4 , Nicolas Pons 6 , Florence Levenez 6 , Takuji Yamada 2 , Daniel R. Mende 2 , Junhua Li 1,7 , Junming Xu 1 , Shaochuan Li 1 , Dongfang Li 1,8 , Jianjun Cao 1 , Bo Wang 1 , Huiqing Liang 1 , Huisong Zheng 1 , Yinlong Xie 1,7 , Julien Tap 6 , Patricia Lepage 6 , Marcelo Bertalan 9 , Jean-Michel Batto 6 , Torben Hansen 4 , Denis Le Paslier 10 , Allan Linneberg 11 , H. Bjørn Nielsen 9 , Eric Pelletier 10 , Pierre Renault 6 , Thomas Sicheritz-Ponten 9 , Keith Turner 12 , Hongmei Zhu 1 , Chang Yu 1 , Shengting Li 1 , Min Jian 1 , Yan Zhou 1 , Yingrui Li 1 , Xiuqing Zhang 1 , Songgang Li 1 , Nan Qin 1 , Huanming Yang 1 , Jian Wang 1 , Søren Brunak 9 , Joel Dore ´ 6 , Francisco Guarner 5 , Karsten Kristiansen 13 , Oluf Pedersen 4,14 , Julian Parkhill 12 , Jean Weissenbach 10 , MetaHIT Consortium{, Peer Bork 2 , S. Dusko Ehrlich 6 & Jun Wang 1,13 To understand the impact of gut microbes on human health and well-being it is crucial to assess their genetic potential. Here we describe the Illumina-based metagenomic sequencing, assembly and characterization of 3.3 million non-redundant microbial genes, derived from 576.7 gigabases of sequence, from faecal samples of 124 European individuals. The gene set, ,150 times larger than the human gene complement, contains an overwhelming majority of the prevalent (more frequent) microbial genes of the cohort and probably includes a large proportion of the prevalent human intestinal microbial genes. The genes are largely shared among individuals of the cohort. Over 99% of the genes are bacterial, indicating that the entire cohort harbours between 1,000 and 1,150 prevalent bacterial species and each individual at least 160 such species, which are also largely shared. We define and describe the minimal gut metagenome and the minimal gut bacterial genome in terms of functions present in all individuals and most bacteria, respectively. It has been estimated that the microbes in our bodies collectively make up to 100 trillion cells, tenfold the number of human cells, and suggested that they encode 100-fold more unique genes than our own genome 1 . The majority of microbes reside in the gut, have a profound influence on human physiology and nutrition, and are crucial for human life 2,3 . Furthermore, the gut microbes contribute to energy harvest from food, and changes of gut microbiome may be associated with bowel diseases or obesity 4–8 . To understand and exploit the impact of the gut microbes on human health and well-being it is necessary to decipher the content, diversity and functioning of the microbial gut community. 16S ribo- somal RNA gene (rRNA) sequence-based methods 9 revealed that two bacterial divisions, the Bacteroidetes and the Firmicutes, constitute over 90% of the known phylogenetic categories and dominate the distal gut microbiota 10 . Studies also showed substantial diversity of the gut microbiome between healthy individuals 4,8,10,11 . Although this difference is especially marked among infants 12 , later in life the gut microbiome converges to more similar phyla. Metagenomic sequencing represents a powerful alternative to rRNA sequencing for analysing complex microbial communities 13–15 . Applied to the human gut, such studies have already generated some 3 gigabases (Gb) of microbial sequence from faecal samples of 33 individuals from the United States or Japan 8,16,17 . To get a broader overview of the human gut microbial genes we used the Illumina Genome Analyser (GA) technology to carry out deep sequencing of total DNA from faecal samples of 124 European adults. We generated 576.7 Gb of sequence, almost 200 times more than in all previous studies, assembled it into contigs and predicted 3.3 million unique open reading frames (ORFs). This gene catalogue contains virtually all of the prevalent gut microbial genes in our cohort, provides a broad view of the functions important for bacterial life in the gut and indicates that many bacterial species are shared by different individuals. Our results also show that short-read metagenomic sequencing can be used for global characterization of the genetic potential of ecologically complex environments. Metagenomic sequencing of gut microbiomes As part of the MetaHIT (Metagenomics of the Human Intestinal Tract) project, we collected faecal specimens from 124 healthy, over- weight and obese individual human adults, as well as inflammatory bowel disease (IBD) patients, from Denmark and Spain (Supplemen- tary Table 1). Total DNA was extracted from the faecal specimens 18 and an average of 4.5 Gb (ranging between 2 and 7.3 Gb) of sequence was generated for each sample, allowing us to capture most of the *These authors contributed equally to this work. {Lists of authors and affiliations appear at the end of the paper. 1 BGI-Shenzhen, Shenzhen 518083, China. 2 European Molecular Biology Laboratory, 69117 Heidelberg, Germany. 3 VIB—Vrije Universiteit Brussel, 1050 Brussels, Belgium. 4 Hagedorn Research Institute, DK 2820 Copenhagen, Denmark. 5 Hospital Universitari Val d’Hebron, Ciberehd, 08035 Barcelona, Spain. 6 Institut National de la Recherche Agronomique, 78350 Jouy en Josas, France. 7 School of Software Engineering, South China University of Technology, Guangzhou 510641, China. 8 Genome Research Institute, Shenzhen University Medical School, Shenzhen 518000, China. 9 Center for Biological Sequence Analysis, Technical University of Denmark, DK-2800 Kongens Lyngby, Denmark. 10 Commissariat a ` l’Energie Atomique, Genoscope, 91000 Evry, France. 11 Research Center for Prevention and Health, DK-2600 Glostrup, Denmark. 12 The Wellcome Trust Sanger Institute, Hinxton, Cambridge CB10 1SA, UK. 13 Department of Biology, University of Copenhagen, DK-2200 Copenhagen, Denmark. 14 Institute of Biomedical Sciences, University of Copenhagen & Faculty of Health Science, University of Aarhus, 8000 Aarhus, Denmark. Vol 464 | 4 March 2010 | doi:10.1038/nature08821 59 Macmillan Publishers Limited. All rights reserved ©2010

Welcome message from author
This document is posted to help you gain knowledge. Please leave a comment to let me know what you think about it! Share it to your friends and learn new things together.
Transcript
ARTICLES
A human gut microbial gene catalogueestablished by metagenomic sequencingJunjie Qin1*, Ruiqiang Li1*, Jeroen Raes2,3, Manimozhiyan Arumugam2, Kristoffer Solvsten Burgdorf4,Chaysavanh Manichanh5, Trine Nielsen4, Nicolas Pons6, Florence Levenez6, Takuji Yamada2, Daniel R. Mende2,Junhua Li1,7, Junming Xu1, Shaochuan Li1, Dongfang Li1,8, Jianjun Cao1, Bo Wang1, Huiqing Liang1, Huisong Zheng1,Yinlong Xie1,7, Julien Tap6, Patricia Lepage6, Marcelo Bertalan9, Jean-Michel Batto6, Torben Hansen4, Denis LePaslier10, Allan Linneberg11, H. Bjørn Nielsen9, Eric Pelletier10, Pierre Renault6, Thomas Sicheritz-Ponten9,Keith Turner12, Hongmei Zhu1, Chang Yu1, Shengting Li1, Min Jian1, Yan Zhou1, Yingrui Li1, Xiuqing Zhang1,Songgang Li1, Nan Qin1, Huanming Yang1, Jian Wang1, Søren Brunak9, Joel Dore6, Francisco Guarner5,Karsten Kristiansen13, Oluf Pedersen4,14, Julian Parkhill12, Jean Weissenbach10, MetaHIT Consortium{, Peer Bork2,S. Dusko Ehrlich6 & Jun Wang1,13
To understand the impact of gut microbes on human health and well-being it is crucial to assess their genetic potential. Herewe describe the Illumina-based metagenomic sequencing, assembly and characterization of 3.3 million non-redundantmicrobial genes, derived from 576.7 gigabases of sequence, from faecal samples of 124 European individuals. The gene set,,150 times larger than the human gene complement, contains an overwhelming majority of the prevalent (more frequent)microbial genes of the cohort and probably includes a large proportion of the prevalent human intestinal microbial genes. Thegenes are largely shared among individuals of the cohort. Over 99% of the genes are bacterial, indicating that the entirecohort harbours between 1,000 and 1,150 prevalent bacterial species and each individual at least 160 such species, which arealso largely shared. We define and describe the minimal gut metagenome and the minimal gut bacterial genome in terms offunctions present in all individuals and most bacteria, respectively.
It has been estimated that the microbes in our bodies collectivelymake up to 100 trillion cells, tenfold the number of human cells,and suggested that they encode 100-fold more unique genes thanour own genome1. The majority of microbes reside in the gut, havea profound influence on human physiology and nutrition, and arecrucial for human life2,3. Furthermore, the gut microbes contribute toenergy harvest from food, and changes of gut microbiome may beassociated with bowel diseases or obesity4–8.
To understand and exploit the impact of the gut microbes onhuman health and well-being it is necessary to decipher the content,diversity and functioning of the microbial gut community. 16S ribo-somal RNA gene (rRNA) sequence-based methods9 revealed that twobacterial divisions, the Bacteroidetes and the Firmicutes, constituteover 90% of the known phylogenetic categories and dominate thedistal gut microbiota10. Studies also showed substantial diversity ofthe gut microbiome between healthy individuals4,8,10,11. Although thisdifference is especially marked among infants12, later in life the gutmicrobiome converges to more similar phyla.
Metagenomic sequencing represents a powerful alternative torRNA sequencing for analysing complex microbial communities13–15.Applied to the human gut, such studies have already generated some3 gigabases (Gb) of microbial sequence from faecal samples of 33
individuals from the United States or Japan8,16,17. To get a broaderoverview of the human gut microbial genes we used the IlluminaGenome Analyser (GA) technology to carry out deep sequencing oftotal DNA from faecal samples of 124 European adults. We generated576.7 Gb of sequence, almost 200 times more than in all previousstudies, assembled it into contigs and predicted 3.3 million uniqueopen reading frames (ORFs). This gene catalogue contains virtuallyall of the prevalent gut microbial genes in our cohort, provides abroad view of the functions important for bacterial life in the gutand indicates that many bacterial species are shared by differentindividuals. Our results also show that short-read metagenomicsequencing can be used for global characterization of the geneticpotential of ecologically complex environments.
Metagenomic sequencing of gut microbiomes
As part of the MetaHIT (Metagenomics of the Human IntestinalTract) project, we collected faecal specimens from 124 healthy, over-weight and obese individual human adults, as well as inflammatorybowel disease (IBD) patients, from Denmark and Spain (Supplemen-tary Table 1). Total DNA was extracted from the faecal specimens18
and an average of 4.5 Gb (ranging between 2 and 7.3 Gb) of sequencewas generated for each sample, allowing us to capture most of the
*These authors contributed equally to this work.{Lists of authors and affiliations appear at the end of the paper.
1BGI-Shenzhen, Shenzhen 518083, China. 2European Molecular Biology Laboratory, 69117 Heidelberg, Germany. 3VIB—Vrije Universiteit Brussel, 1050 Brussels, Belgium. 4HagedornResearch Institute, DK 2820 Copenhagen, Denmark. 5Hospital Universitari Val d’Hebron, Ciberehd, 08035 Barcelona, Spain. 6Institut National de la Recherche Agronomique, 78350Jouy en Josas, France. 7School of Software Engineering, South China University of Technology, Guangzhou 510641, China. 8Genome Research Institute, Shenzhen University MedicalSchool, Shenzhen 518000, China. 9Center for Biological Sequence Analysis, Technical University of Denmark, DK-2800 Kongens Lyngby, Denmark. 10Commissariat a l’EnergieAtomique, Genoscope, 91000 Evry, France. 11Research Center for Prevention and Health, DK-2600 Glostrup, Denmark. 12The Wellcome Trust Sanger Institute, Hinxton, CambridgeCB10 1SA, UK. 13Department of Biology, University of Copenhagen, DK-2200 Copenhagen, Denmark. 14Institute of Biomedical Sciences, University of Copenhagen & Faculty of HealthScience, University of Aarhus, 8000 Aarhus, Denmark.
Vol 464 | 4 March 2010 | doi:10.1038/nature08821
59Macmillan Publishers Limited. All rights reserved©2010

novelty (see Methods and Supplementary Table 2). In total, weobtained 576.7 Gb of sequence (Supplementary Table 3).
Wanting to generate an extensive catalogue of microbial genes fromthe human gut, we first assembled the short Illumina reads into longercontigs, which could then be analysed and annotated by standardmethods. Using SOAPdenovo19, a de Bruijn graph-based tool speciallydesigned for assembling very short reads, we performed de novoassembly for all of the Illumina GA sequence data. Because a highdiversity between individuals is expected8,16,17, we first assembled eachsample independently (Supplementary Fig. 3). As much as 42.7% ofthe Illumina GA reads was assembled into a total of 6.58 millioncontigs of a length .500 bp, giving a total contig length of 10.3 Gb,with an N50 length of 2.2 kb (Supplementary Fig. 4) and the range of12.3 to 237.6 Mb (Supplementary Table 4). Almost 35% of reads fromany one sample could be mapped to contigs from other samples,indicating the existence of a common sequence core.
To assess the quality of the Illumina GA-based assembly we mappedthe contigs of samples MH0006 and MH0012 to the Sanger reads fromthe same samples (Supplementary Table 2). A total of 98.7% of thecontigs that map to at least one Sanger read were collinear over 99.6%of the mapped regions. This is comparable to the contigs that weregenerated by 454 sequencing for one of the two samples (MH0006) asa control, of which 97.9% were collinear over 99.5% of the mappedregions. We estimate assembly errors to be 14.2 and 20.7 per megabase(Mb) of Illumina- and 454-based contigs, respectively (see Methodsand Supplementary Fig. 5), indicating that the short- and long-read-based assemblies have comparable accuracies.
To complete the contig set we pooled the unassembled reads fromall 124 samples, and repeated the de novo assembly process. About 0.4million additional contigs were thus generated, having a length of370 Mb and an N50 length of 939 bp. The total length of our finalcontig set was thus 10.7 Gb. Some 80% of the 576.7 Gb of IlluminaGA sequence could be aligned to the contigs at a threshold of 90%identity, allowing for accommodation of sequencing errors andstrain variability in the gut (Fig. 1), almost twice the 42.7% ofsequence that was assembled into contigs by SOAPdenovo, becauseassembly uses more stringent criteria. This indicates that a vastmajority of the Illumina sequence is represented by our contigs.
To compare the representation of the human gut microbiome inour contigs with that from previous work, we aligned them to thereads from the two largest published gut metagenome studies(1.83 Gb of Roche/454 sequencing reads from 18 US adults8, and0.79 Gb of Sanger reads from 13 Japanese adults and infants17), usingthe 90% identity threshold. A total of 70.1% and 85.9% of the readsfrom the Japanese and US samples, respectively, could be aligned to
our contigs (Fig. 1), showing that the contigs include a high fractionof sequences from previous studies. In contrast, 85.7% and 69.5% ofour contigs were not covered by the reads from the Japanese and USsamples, respectively, highlighting the novelty we captured.
Only 31.0–48.8% of the reads from the two previous studies andthe present study could be aligned to 194 public human gut bacterialgenomes (Supplementary Table 5), and 7.6–21.2% to the bacterialgenomes deposited in GenBank (Fig. 1). This indicates that thereference gene set obtained by sequencing genomes of isolated bac-terial strains is still of a limited scale.
A gene catalogue of the human gut microbiome
To establish a non-redundant human gut microbiome gene set wefirst used the MetaGene20 program to predict ORFs in our contigsand found 14,048,045 ORFs longer than 100 bp (SupplementaryTable 6). They occupied 86.7% of the contigs, comparable to thevalue found for fully sequenced genomes (,86%). Two-thirds ofthe ORFs appeared incomplete, possibly due to the size of our contigs(N50 of 2.2 kb). We next removed the redundant ORFs, by pair-wisecomparison, using a very stringent criterion of 95% identity over90% of the shorter ORF length, which can fuse orthologues butavoids inflation of the data set due to possible sequencing errors(see Methods). Yet, the final non-redundant gene set contained asmany as 3,299,822 ORFs with an average length of 704 bp (Sup-plementary Table 7).
We term the genes of the non-redundant set ‘prevalent genes’, asthey are encoded on contigs assembled from the most abundant reads(see Methods). The minimal relative abundance of the prevalentgenes was ,6 3 1027, as estimated from the minimum sequencecoverage of the unique genes (close to 3), and the total Illuminasequence length generated for each individual (on average, 4.5 Gb),assuming the average gene length of 0.85 kb (that is, 3 3 0.85 3 103/4.5 3 109).
We mapped the 3.3 million gut ORFs to the 319,812 genes (targetgenes) of the 89 frequent reference microbial genomes in the humangut. At a 90% identity threshold, 80% of the target genes had at least80% of their length covered by a single gut ORF (Fig. 2b). Thisindicates that the gene set includes most of the known human gutbacterial genes.
We examined the number of prevalent genes identified across allindividuals as a function of the extent of sequencing, demanding atleast two supporting reads for a gene call (Fig. 2a). The incidence-based coverage richness estimator (ICE), determined at 100 individuals(the highest number the EstimateS21 program could accommodate),indicates that our catalogue captures 85.3% of the prevalent genes.Although this is probably an underestimate, it nevertheless indicatesthat the catalogue contains an overwhelming majority of the prevalentgenes of the cohort.
Each individual carried 536,112 6 12,167 (mean 6 s.e.m.) prevalentgenes (Supplementary Fig. 6b), indicating that most of the 3.3 milliongene pool must be shared. However, most of the prevalent genes werefound in only a few individuals: 2,375,655 were present in less than20%, whereas 294,110 were found in at least 50% of individuals (weterm these ‘common’ genes). These values depend on the samplingdepth; sequencing of MH0006 and MH0012 revealed more of thecatalogue genes, present at a low abundance (Supplementary Fig. 7).Nevertheless, even at our routine sampling depth, each individualharboured 204,056 6 3,603 (mean 6 s.e.m.) common genes, indi-cating that about 38% of an individual’s total gene pool is shared.Interestingly, the IBD patients harboured, on average, 25% fewer genesthan the individuals not suffering from IBD (Supplementary Fig. 8),consistent with the observation that the former have lower bacterialdiversity than the latter22.
Common bacterial core
Deep metagenomic sequencing provides the opportunity to explorethe existence of a common set of microbial species (common core) in
100
50
0Assembledcontig set
Known humangut bacteria
GenBankbacteria
Cov
erag
e of
seq
uenc
ing
read
s (%
)
Figure 1 | Coverage of human gut microbiome. The three human microbialsequencing read sets—Illumina GA reads generated from 124 individuals inthis study (black; n 5 124), Roche/454 reads from 18 human twins and theirmothers (grey; n 5 18) and Sanger reads from 13 Japanese individuals(white; n 5 13)—were aligned to each of the reference sequence sets. Meanvalues 6 s.e.m. are plotted.
ARTICLES NATURE | Vol 464 | 4 March 2010
60Macmillan Publishers Limited. All rights reserved©2010
the cohort. For this purpose, we used a non-redundant set of 650sequenced bacterial and archaeal genomes (see Methods). We alignedthe Illumina GA reads of each human gut microbial sample onto thegenome set, using a 90% identity threshold, and determined theproportion of the genomes covered by the reads that aligned ontoonly a single position in the set. At a 1% coverage, which for a typicalgut bacterial genome corresponds to an average length of about40 kb, some 25-fold more than that of the 16S gene generally usedfor species identification, we detected 18 species in all individuals, 57in $90% and 75 in $50% of individuals (Supplementary Table 8). At10% coverage, requiring ,10-fold higher abundance in a sample, westill found 13 of the above species in $90% of individuals and 35in $50%.
When the cumulated sequence length increased from 3.96 Gb to8.74 Gb and from 4.41 Gb to 11.6 Gb, for samples MH0006 andMH0012, respectively, the number of strains common to the twoat the 1% coverage threshold increased by 25%, from 135 to 169.This indicates the existence of a significantly larger common corethan the one we could observe at the sequence depth routinely usedfor each individual.
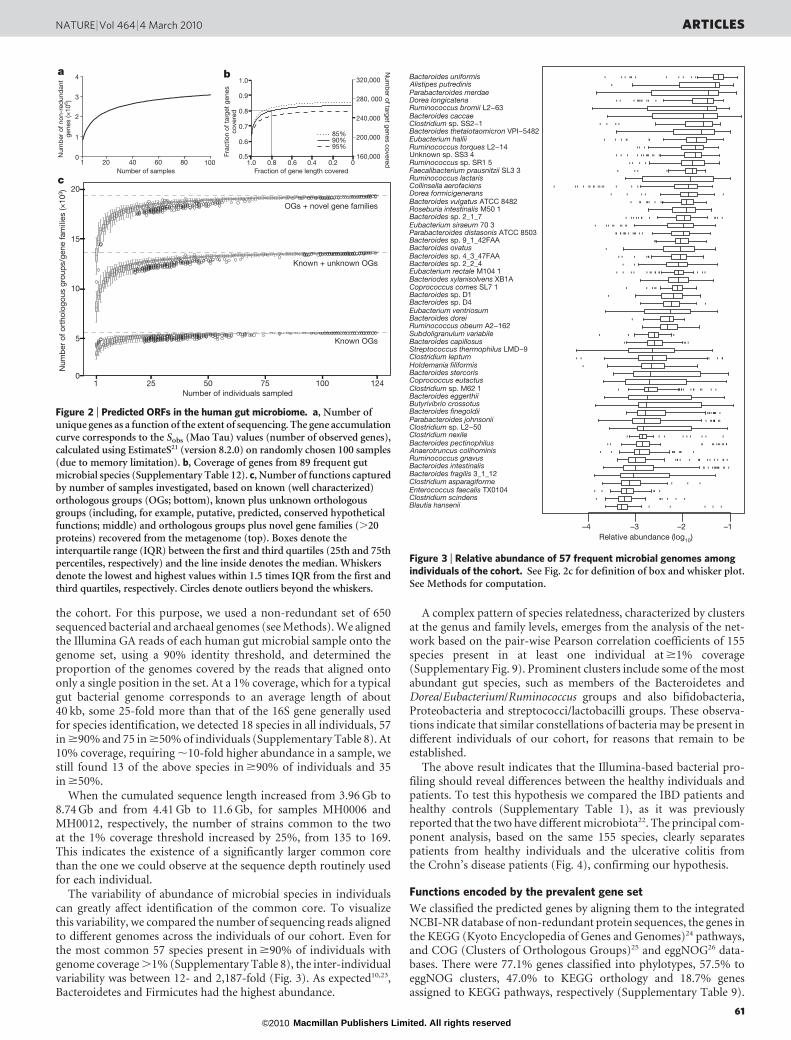
The variability of abundance of microbial species in individualscan greatly affect identification of the common core. To visualizethis variability, we compared the number of sequencing reads alignedto different genomes across the individuals of our cohort. Even forthe most common 57 species present in $90% of individuals withgenome coverage .1% (Supplementary Table 8), the inter-individualvariability was between 12- and 2,187-fold (Fig. 3). As expected10,23,Bacteroidetes and Firmicutes had the highest abundance.
A complex pattern of species relatedness, characterized by clustersat the genus and family levels, emerges from the analysis of the net-work based on the pair-wise Pearson correlation coefficients of 155species present in at least one individual at $1% coverage(Supplementary Fig. 9). Prominent clusters include some of the mostabundant gut species, such as members of the Bacteroidetes andDorea/Eubacterium/Ruminococcus groups and also bifidobacteria,Proteobacteria and streptococci/lactobacilli groups. These observa-tions indicate that similar constellations of bacteria may be present indifferent individuals of our cohort, for reasons that remain to beestablished.
The above result indicates that the Illumina-based bacterial pro-filing should reveal differences between the healthy individuals andpatients. To test this hypothesis we compared the IBD patients andhealthy controls (Supplementary Table 1), as it was previouslyreported that the two have different microbiota22. The principal com-ponent analysis, based on the same 155 species, clearly separatespatients from healthy individuals and the ulcerative colitis fromthe Crohn’s disease patients (Fig. 4), confirming our hypothesis.
Functions encoded by the prevalent gene set
We classified the predicted genes by aligning them to the integratedNCBI-NR database of non-redundant protein sequences, the genes inthe KEGG (Kyoto Encyclopedia of Genes and Genomes)24 pathways,and COG (Clusters of Orthologous Groups)25 and eggNOG26 data-bases. There were 77.1% genes classified into phylotypes, 57.5% toeggNOG clusters, 47.0% to KEGG orthology and 18.7% genesassigned to KEGG pathways, respectively (Supplementary Table 9).
Relative abundance (log10)
Blautia hanseniiClostridium scindensEnterococcus faecalis TX0104Clostridium asparagiformeBacteroides fragilis 3_1_12Bacteroides intestinalisRuminococcus gnavusAnaerotruncus colihominisBacteroides pectinophilusClostridium nexileClostridium sp. L2−50Parabacteroides johnsoniiBacteroides finegoldiiButyrivibrio crossotusBacteroides eggerthiiClostridium sp. M62 1Coprococcus eutactusBacteroides stercorisHoldemania filiformisClostridium leptumStreptococcus thermophilus LMD−9Bacteroides capillosusSubdoligranulum variabileRuminococcus obeum A2−162Bacteroides doreiEubacterium ventriosumBacteroides sp. D4Bacteroides sp. D1Coprococcus comes SL7 1Bacteriodes xylanisolvens XB1AEubacterium rectale M104 1Bacteroides sp. 2_2_4Bacteroides sp. 4_3_47FAABacteroides ovatusBacteroides sp. 9_1_42FAAParabacteroides distasonis ATCC 8503Eubacterium siraeum 70 3Bacteroides sp. 2_1_7Roseburia intestinalis M50 1Bacteroides vulgatus ATCC 8482Dorea formicigeneransCollinsella aerofaciensRuminococcus lactarisFaecalibacterium prausnitzii SL3 3Ruminococcus sp. SR1 5Unknown sp. SS3 4Ruminococcus torques L2−14Eubacterium halliiBacteroides thetaiotaomicron VPI−5482Clostridium sp. SS2−1Bacteroides caccaeRuminococcus bromii L2−63Dorea longicatenaParabacteroides merdaeAlistipes putredinisBacteroides uniformis
–4 –3 –2 –1
Figure 3 | Relative abundance of 57 frequent microbial genomes amongindividuals of the cohort. See Fig. 2c for definition of box and whisker plot.See Methods for computation.
1Number of individuals sampled
Num
ber
of o
rtho
logo
us g
roup
s/ge
ne fa
mili
es (×
103 )
25 50 75 100 124
a b
c
320,000
280, 000
240,000
200,000
160,0001.0 0.8 0.6 0.4 0.2 0
0.6
0.7
0.8
0.9
1.0
0.5
85%90%95%
0
5
10
15
20
0
1
2
3
4
1 20 40 60 80 100
OGs + novel gene families
Known + unknown OGs
Known OGs
Num
ber
of n
on-r
edun
dan
tge
nes
(×10
6 )
Num
ber of target genes covered
Frac
tion
of t
arge
t ge
nes
cove
red
Number of samples Fraction of gene length covered
Figure 2 | Predicted ORFs in the human gut microbiome. a, Number ofunique genes as a function of the extent of sequencing. The gene accumulationcurve corresponds to the Sobs (Mao Tau) values (number of observed genes),calculated using EstimateS21 (version 8.2.0) on randomly chosen 100 samples(due to memory limitation). b, Coverage of genes from 89 frequent gutmicrobial species (Supplementary Table 12). c, Number of functions capturedby number of samples investigated, based on known (well characterized)orthologous groups (OGs; bottom), known plus unknown orthologousgroups (including, for example, putative, predicted, conserved hypotheticalfunctions; middle) and orthologous groups plus novel gene families (.20proteins) recovered from the metagenome (top). Boxes denote theinterquartile range (IQR) between the first and third quartiles (25th and 75thpercentiles, respectively) and the line inside denotes the median. Whiskersdenote the lowest and highest values within 1.5 times IQR from the first andthird quartiles, respectively. Circles denote outliers beyond the whiskers.
NATURE | Vol 464 | 4 March 2010 ARTICLES
61Macmillan Publishers Limited. All rights reserved©2010
Almost all (99.96%) of the phylogenetically assigned genes belongedto the Bacteria and Archaea, reflecting their predominance in the gut.Genes that were not mapped to orthologous groups were clusteredinto gene families (see Methods). To investigate the functional con-tent of the prevalent gene set we computed the total number oforthologous groups and/or gene families present in any combinationof n individuals (with n 5 2–124; see Fig. 2c). This rarefaction ana-lysis shows that the ‘known’ functions (annotated in eggNOG orKEGG) quickly saturate (a value of 5,569 groups was observed): whensampling any subset of 50 individuals, most have been detected.However, three-quarters of the prevalent gut functionalities consistsof uncharacterized orthologous groups and/or completely novel genefamilies (Fig. 2c). When including these groups, the rarefaction curveonly starts to plateau at the very end, at a much higher level (19,338groups were detected), confirming that the extensive sampling of alarge number of individuals was necessary to capture this considerableamount of novel/unknown functionality.
Bacterial functions important for life in the gut
The extensive non-redundant catalogue of the bacterial genes fromthe human intestinal tract provides an opportunity to identify bac-terial functions important for life in this environment. There arefunctions necessary for a bacterium to thrive in a gut context (thatis, the ‘minimal gut genome’) and those involved in the homeostasisof the whole ecosystem, encoded across many species (the ‘minimalgut metagenome’). The first set of functions is expected to be presentin most or all gut bacterial species; the second set in most or allindividuals’ gut samples.
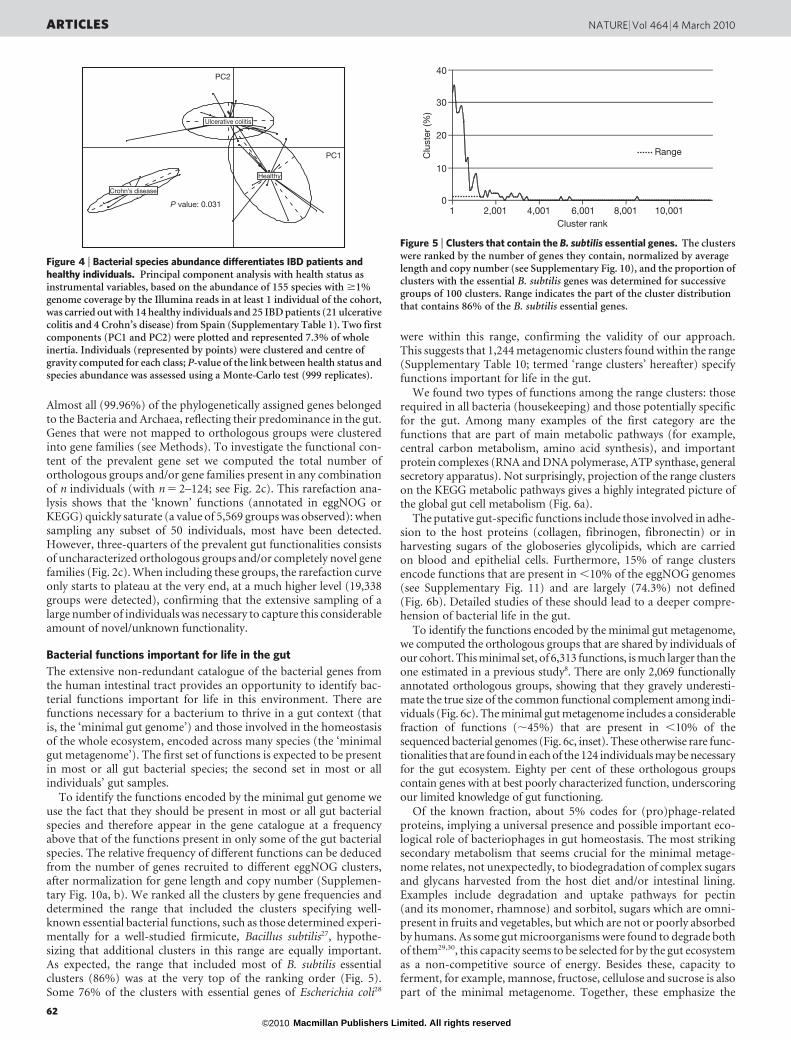
To identify the functions encoded by the minimal gut genome weuse the fact that they should be present in most or all gut bacterialspecies and therefore appear in the gene catalogue at a frequencyabove that of the functions present in only some of the gut bacterialspecies. The relative frequency of different functions can be deducedfrom the number of genes recruited to different eggNOG clusters,after normalization for gene length and copy number (Supplemen-tary Fig. 10a, b). We ranked all the clusters by gene frequencies anddetermined the range that included the clusters specifying well-known essential bacterial functions, such as those determined experi-mentally for a well-studied firmicute, Bacillus subtilis27, hypothe-sizing that additional clusters in this range are equally important.As expected, the range that included most of B. subtilis essentialclusters (86%) was at the very top of the ranking order (Fig. 5).Some 76% of the clusters with essential genes of Escherichia coli28
were within this range, confirming the validity of our approach.This suggests that 1,244 metagenomic clusters found within the range(Supplementary Table 10; termed ‘range clusters’ hereafter) specifyfunctions important for life in the gut.
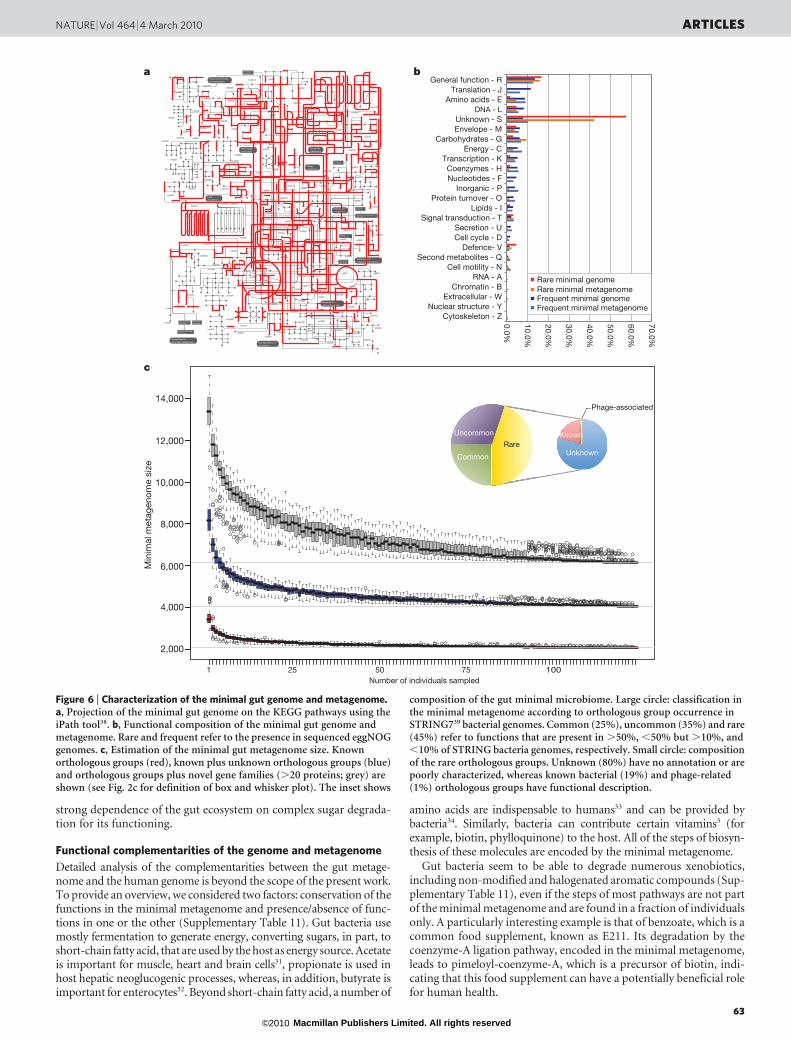
We found two types of functions among the range clusters: thoserequired in all bacteria (housekeeping) and those potentially specificfor the gut. Among many examples of the first category are thefunctions that are part of main metabolic pathways (for example,central carbon metabolism, amino acid synthesis), and importantprotein complexes (RNA and DNA polymerase, ATP synthase, generalsecretory apparatus). Not surprisingly, projection of the range clusterson the KEGG metabolic pathways gives a highly integrated picture ofthe global gut cell metabolism (Fig. 6a).
The putative gut-specific functions include those involved in adhe-sion to the host proteins (collagen, fibrinogen, fibronectin) or inharvesting sugars of the globoseries glycolipids, which are carriedon blood and epithelial cells. Furthermore, 15% of range clustersencode functions that are present in ,10% of the eggNOG genomes(see Supplementary Fig. 11) and are largely (74.3%) not defined(Fig. 6b). Detailed studies of these should lead to a deeper compre-hension of bacterial life in the gut.
To identify the functions encoded by the minimal gut metagenome,we computed the orthologous groups that are shared by individuals ofour cohort. This minimal set, of 6,313 functions, is much larger than theone estimated in a previous study8. There are only 2,069 functionallyannotated orthologous groups, showing that they gravely underesti-mate the true size of the common functional complement among indi-viduals (Fig. 6c). The minimal gut metagenome includes a considerablefraction of functions (,45%) that are present in ,10% of thesequenced bacterial genomes (Fig. 6c, inset). These otherwise rare func-tionalities that are found in each of the 124 individuals may be necessaryfor the gut ecosystem. Eighty per cent of these orthologous groupscontain genes with at best poorly characterized function, underscoringour limited knowledge of gut functioning.
Of the known fraction, about 5% codes for (pro)phage-relatedproteins, implying a universal presence and possible important eco-logical role of bacteriophages in gut homeostasis. The most strikingsecondary metabolism that seems crucial for the minimal metage-nome relates, not unexpectedly, to biodegradation of complex sugarsand glycans harvested from the host diet and/or intestinal lining.Examples include degradation and uptake pathways for pectin(and its monomer, rhamnose) and sorbitol, sugars which are omni-present in fruits and vegetables, but which are not or poorly absorbedby humans. As some gut microorganisms were found to degrade bothof them29,30, this capacity seems to be selected for by the gut ecosystemas a non-competitive source of energy. Besides these, capacity toferment, for example, mannose, fructose, cellulose and sucrose is alsopart of the minimal metagenome. Together, these emphasize the
40
30
20
10
0
Clu
ster
(%)
1 2,001 4,001 6,001 8,001 10,001Cluster rank
Range
Figure 5 | Clusters that contain the B. subtilis essential genes. The clusterswere ranked by the number of genes they contain, normalized by averagelength and copy number (see Supplementary Fig. 10), and the proportion ofclusters with the essential B. subtilis genes was determined for successivegroups of 100 clusters. Range indicates the part of the cluster distributionthat contains 86% of the B. subtilis essential genes.
•
•
•
•
•
• •
• •
•
•
•
••
•
•
••
•
•
•
•
•
•
•
• •
•
•
•
•
••
•
•
•
•
•
•
Healthy
Crohn’s disease
Ulcerative colitis
P value: 0.031
PC2
PC1
Figure 4 | Bacterial species abundance differentiates IBD patients andhealthy individuals. Principal component analysis with health status asinstrumental variables, based on the abundance of 155 species with $1%genome coverage by the Illumina reads in at least 1 individual of the cohort,was carried out with 14 healthy individuals and 25 IBD patients (21 ulcerativecolitis and 4 Crohn’s disease) from Spain (Supplementary Table 1). Two firstcomponents (PC1 and PC2) were plotted and represented 7.3% of wholeinertia. Individuals (represented by points) were clustered and centre ofgravity computed for each class; P-value of the link between health status andspecies abundance was assessed using a Monte-Carlo test (999 replicates).
ARTICLES NATURE | Vol 464 | 4 March 2010
62Macmillan Publishers Limited. All rights reserved©2010
strong dependence of the gut ecosystem on complex sugar degrada-tion for its functioning.
Functional complementarities of the genome and metagenome
Detailed analysis of the complementarities between the gut metage-nome and the human genome is beyond the scope of the present work.To provide an overview, we considered two factors: conservation of thefunctions in the minimal metagenome and presence/absence of func-tions in one or the other (Supplementary Table 11). Gut bacteria usemostly fermentation to generate energy, converting sugars, in part, toshort-chain fatty acid, that are used by the host as energy source. Acetateis important for muscle, heart and brain cells31, propionate is used inhost hepatic neoglucogenic processes, whereas, in addition, butyrate isimportant for enterocytes32. Beyond short-chain fatty acid, a number of
amino acids are indispensable to humans33 and can be provided bybacteria34. Similarly, bacteria can contribute certain vitamins3 (forexample, biotin, phylloquinone) to the host. All of the steps of biosyn-thesis of these molecules are encoded by the minimal metagenome.
Gut bacteria seem to be able to degrade numerous xenobiotics,including non-modified and halogenated aromatic compounds (Sup-plementary Table 11), even if the steps of most pathways are not partof the minimal metagenome and are found in a fraction of individualsonly. A particularly interesting example is that of benzoate, which is acommon food supplement, known as E211. Its degradation by thecoenzyme-A ligation pathway, encoded in the minimal metagenome,leads to pimeloyl-coenzyme-A, which is a precursor of biotin, indi-cating that this food supplement can have a potentially beneficial rolefor human health.
Common
Uncommon
RareUnknown
Known
Phage-associated
2,000
4,000
6,000
8,000
10,000
12,000
14,000
Number of individuals sampled
Min
imal
met
agen
ome
size
1 25 50 75 100
c
a b
map00565
map00350
map00629
resistanceβ-Lactam
map00643
map00620
map00780
map00260
map00940
map00512
map00670
map00513
map00220
map00628
Limonene and pinenedegradation
map00040
map00632
map00563
map00920
biosynthesis IIAlkaloid
map00600
map00625
map00400
map00941
map00520
map00790
map00330
map00621
map00271
map00591
map00072
map00480
map00031
map00460
map00910
map00604
map00631
map00900
map00010
map00331
map00290
map00240
map00300
map00561
map00196
map00053
map00071
map00660
map00860
map00440
map00601
Tetracyclinebiosynthesis
map00641
map00642
map00750
map00710
map00195
map00251
map00052
map00531
map00051
map00410
map00540
map00140
map00120
map00252
map00380
map00627
biosynthesisPenicillins and cephalosporins
map00830
map00623
Monoterpenoidbiosynthesis
map00360
map00472
map00562
map00530
map00650
map00770
map00062
map00640
map00730
map00473
map00130
map00760
map00950
map00510
map00272
map00622
map00363
map00680
Diterpenoidbiosynthesis
Streptomycinbiosynthesis
map00340
map00791
map00564
map00020
map00500
map00720
map00362
map00310
map00230
map00550
map00630
map00603
map00471
map00901
map00602
map00590
map00351map00626
map00030map00534
map00532
map00190
map00740
map00430
map00624
map00061
map00150
biosynthesisNovobiocin
map00280
map00906
map00100
map00361
map00930
map00450
Carbohydratemetabolism
and metabolismGlycan biosynthesis
metabolismAmino acid
metabolismEnergy
Lipidmetabolism
xenobioticsBiodegradation of
Metabolism ofother amino acids
metabolismNucleotide
Metabolism ofcofactors and vitamins
Biosynthesis ofsecondary metabolites
0.0%
10.0%
20.0%
30.0%
40.0%
50.0%
60.0%
70.0%
General function - RTranslation - J
Amino acids - EDNA - L
Unknown - SEnvelope - M
Carbohydrates - GEnergy - C
Transcription - KCoenzymes - HNucleotides - F
Inorganic - PProtein turnover - O
Lipids - ISignal transduction - T
Secretion - UCell cycle - D
Defence- VSecond metabolites - Q
Cell motility - NRNA - A
Chromatin - BExtracellular - W
Nuclear structure - YCytoskeleton - Z
Rare minimal genome Rare minimal metagenome Frequent minimal genome Frequent minimal metagenome
Figure 6 | Characterization of the minimal gut genome and metagenome.a, Projection of the minimal gut genome on the KEGG pathways using theiPath tool38. b, Functional composition of the minimal gut genome andmetagenome. Rare and frequent refer to the presence in sequenced eggNOGgenomes. c, Estimation of the minimal gut metagenome size. Knownorthologous groups (red), known plus unknown orthologous groups (blue)and orthologous groups plus novel gene families (.20 proteins; grey) areshown (see Fig. 2c for definition of box and whisker plot). The inset shows
composition of the gut minimal microbiome. Large circle: classification inthe minimal metagenome according to orthologous group occurrence inSTRING739 bacterial genomes. Common (25%), uncommon (35%) and rare(45%) refer to functions that are present in .50%, ,50% but .10%, and,10% of STRING bacteria genomes, respectively. Small circle: compositionof the rare orthologous groups. Unknown (80%) have no annotation or arepoorly characterized, whereas known bacterial (19%) and phage-related(1%) orthologous groups have functional description.
NATURE | Vol 464 | 4 March 2010 ARTICLES
63Macmillan Publishers Limited. All rights reserved©2010
Discussion
We have used extensive Illumina GA short-read-based sequencing oftotal faecal DNA from a cohort of 124 individuals of European(Nordic and Mediterranean) origin to establish a catalogue of non-redundant human intestinal microbial genes. The catalogue contains3.3 million microbial genes, 150-fold more than the human genecomplement, and includes an overwhelming majority (.86%) ofprevalent genes harboured by our cohort. The catalogue probablycontains a large majority of prevalent intestinal microbial genes in thehuman population, for the following reasons: (1) over 70% of themetagenomic reads from three previous studies, including Americanand Japanese individuals8,16,17, can be mapped on our contigs; (2)about 80% of the microbial genes from 89 frequent gut referencegenomes are present in our set. This result represents a proof ofprinciple that short-read sequencing can be used to characterizecomplex microbiomes.
The full bacterial gene complement of each individual was notsampled in our work. Nevertheless, we have detected some 536,000prevalent unique genes in each, out of the total of 3.3 million carriedby our cohort. Inevitably, the individuals largely share the genes ofthe common pool. At the present depth of sequencing, we found thatalmost 40% of the genes from each individual are shared with at leasthalf of the individuals of the cohort. Future studies of world-widespan, envisaged within the International Human MicrobiomeConsortium, will complete, as necessary, our gene catalogue andestablish boundaries to the proportion of shared genes.
Essentially all (99.1%) of the genes of our catalogue are of bacterialorigin, the remainder being mostly archaeal, with only 0.1% of eukar-yotic and viral origins. The gene catalogue is therefore equivalent tothat of some 1,000 bacterial species with an average-sized genome,encoding about 3,364 non-redundant genes. We estimate that nomore than 15% of prevalent genes of our cohort may be missingfrom the catalogue, and suggest that the cohort harbours no morethan ,1,150 bacterial species abundant enough to be detected by oursampling. Given the large overlap between microbial sequences inthis and previous studies we suggest that the number of abundantintestinal bacterial species may be not much higher than thatobserved in our cohort. Each individual of our cohort harbours atleast 160 such bacterial species, as estimated by the average prevalentgene number, and many must thus be shared.
We assigned about 12% of the reference set genes (404,000) to the194 sequenced intestinal bacterial genomes, and can thus associatethem with bacterial species. Sequencing of at least 1,000 human-associated bacterial genomes is foreseen within the InternationalHuman Microbiome Consortium, via the Human MicrobiomeProject and MetaHIT. This is commensurate with the number ofdominant species in our cohort and expected more broadly in humangut, and should enable a much more extensive gene to species assign-ment. Nevertheless, we used the presently available sequencedgenomes to explore further the concept of largely shared speciesamong our cohort and identified 75 species common to .50% ofindividuals and 57 species common to .90%. These numbers arelikely to increase with the number of sequenced reference strains anda deeper sampling. Indeed, a 2–3-fold increase in sequencing depthraised by 25% the number of species that we could detect as sharedbetween two individuals. A large number of shared species supportsthe view that the prevalent human microbiome is of a finite and notoverly large size.
How can this view be reconciled with that of a considerable inter-personal diversity of innumerable bacterial species in the gut, arisingfrom most previous studies using the 16S RNA marker gene4,8,10,11?Possibly the depth of sampling of these studies was insufficient toreveal common species when present at low abundance, and empha-sized the difference in the composition of a relatively few dominantspecies. We found a very high variability of abundance (12- to 2,200-fold) for the 57 most common species across the individuals of ourcohort. Nevertheless, a recent 16S rRNA-based study concluded that
a common bacterial species ‘core’, shared among at least 50% ofindividuals under study, exists35.
Detailed comparisons of bacterial genes across the individuals ofour cohort will be carried out in the future, within the context ofthe ongoing MetaHIT clinical studies of which they are part.Nevertheless, clustering of the genes in families allowed us to capturea virtually full functional potential of the prevalent gene set andrevealed a considerable novelty, extending the functional categoriesby some 30% in regard to previous work8. Similarly, this analysis hasrevealed a functional core, conserved in each individual of the cohort,which reflects the full minimal human gut metagenome, encodedacross many species and probably required for the proper functioningof the gut ecosystem. The size of this minimal metagenome exceedsseveral-fold that of the core metagenome reported previously8. Itincludes functions known to be important to the host–bacterial inter-action, such as degradation of complex polysaccharides, synthesis ofshort-chain fatty acids, indispensable amino acids and vitamins.Finally, we also identified functions that we attribute to a minimalgut bacterial genome, likely to be required by any bacterium to thrivein this ecosystem. Besides general housekeeping functions, theminimal genome encompasses many genes of unknown function, rarein sequenced genomes and possibly specifically required in the gut.
Beyond providing the global view of the human gut microbiome,the extensive gene catalogue we have established enables future studiesof association of the microbial genes with human phenotypes and,even more broadly, human living habits, taking into account theenvironment, including diet, from birth to old age. We anticipate thatthese studies will lead to a much more complete understanding ofhuman biology than the one we presently have.
METHODS SUMMARY
Human faecal samples were collected, frozen immediately and DNA was purified
by standard methods22. For all 124 individuals, paired-end libraries were con-
structed with different clone insert sizes and subjected to Illumina GA sequen-
cing. All reads were assembled using SOAPdenovo19, with specific parameter
‘2M 3’ for metagenomics data. MetaGene was used for gene prediction. A
non-redundant gene set was constructed by pair-wise comparison of all genes,
using BLAT36 under the criteria of identity .95% and overlap .90%. Gene
taxonomic assignments were made on the basis of BLASTP37 search (e-value
,1 3 1025) of the NCBI-NR database and 126 known gut bacteria genomes.
Gene functional annotations were made by BLASTP search (e-value ,1 3 1025)
with eggNOG and KEGG (v48.2) databases. The total and shared number of
orthologous groups and/or gene families were computed using a random com-
bination of n individuals (with n 5 2 to 124, 100 replicates per bin).
Full Methods and any associated references are available in the online version ofthe paper at www.nature.com/nature.
Received 14 August; accepted 23 December 2009.
1. Ley, R. E., Peterson, D. A. & Gordon, J. I. Ecological and evolutionary forces shapingmicrobial diversity in the human intestine. Cell 124, 837–848 (2006).
2. Backhed, F., Ley, R. E., Sonnenburg, J. L., Peterson, D. A. & Gordon, J. I. Host-bacterial mutualism in the human intestine. Science 307, 1915–1920 (2005).
3. Hooper, L. V., Midtvedt, T. & Gordon, J. I. How host-microbial interactions shapethe nutrient environment of the mammalian intestine. Annu. Rev. Nutr. 22,283–307 (2002).
4. Ley, R. E., Turnbaugh, P. J., Klein, S. & Gordon, J. I. Microbial ecology: human gutmicrobes associated with obesity. Nature 444, 1022–1023 (2006).
5. Turnbaugh, P. J. et al. An obesity-associated gut microbiome with increasedcapacity for energy harvest. Nature 444, 1027–1031 (2006).
6. Ley, R. E. et al. Obesity alters gut microbial ecology. Proc. Natl Acad. Sci. USA 102,11070–11075 (2005).
7. Zhang, H. et al. Human gut microbiota in obesity and after gastric bypass. Proc.Natl Acad. Sci. USA 106, 2365–2370 (2009).
8. Turnbaugh, P. J. et al. A core gut microbiome in obese and lean twins. Nature 457,480–484 (2009).
9. Zoetendal, E. G., Akkermans, A. D. & De Vos, W. M. Temperature gradient gelelectrophoresis analysis of 16S rRNA from human fecal samples reveals stableand host-specific communities of active bacteria. Appl. Environ. Microbiol. 64,3854–3859 (1998).
10. Eckburg, P. B. et al. Diversity of the human intestinal microbial flora. Science 308,1635–1638 (2005).
ARTICLES NATURE | Vol 464 | 4 March 2010
64Macmillan Publishers Limited. All rights reserved©2010
11. Ley, R. E., Lozupone, C. A., Hamady, M., Knight, R. & Gordon, J. I. Worlds withinworlds: evolution of the vertebrate gut microbiota. Nature Rev. Microbiol. 6,776–788 (2008).
12. Palmer, C., Bik, E. M., Digiulio, D. B., Relman, D. A. & Brown, P. O. Development ofthe human infant intestinal microbiota. PLoS Biol. 5, e177 (2007).
13. Riesenfeld, C. S., Schloss, P. D. & Handelsman, J. Metagenomics: genomic analysisof microbial communities. Annu. Rev. Genet. 38, 525–552 (2004).
14. von Mering, C. et al. Quantitative phylogenetic assessment of microbialcommunities in diverse environments. Science 315, 1126–1130 (2007).
15. Tringe, S. G. & Rubin, E. M. Metagenomics: DNA sequencing of environmentalsamples. Nature Rev. Genet. 6, 805–814 (2005).
16. Gill, S. R. et al. Metagenomic analysis of the human distal gut microbiome. Science312, 1355–1359 (2006).
17. Kurokawa, K. et al. Comparative metagenomics revealed commonly enrichedgene sets in human gut microbiomes. DNA Res. 14, 169–181 (2007).
18. Suau, A. et al. Direct analysis of genes encoding 16S rRNA from complexcommunities reveals many novel molecular species within the human gut. Appl.Environ. Microbiol. 65, 4799–4807 (1999).
19. Li, R. & Zhu, H. De novo assembly of the human genomes with massively parallelshort read sequencing. Genome Res. doi:10.1101/gr.097261.109 (17 December2009).
20. Noguchi, H., Park, J. & Takagi, T. MetaGene: prokaryotic gene finding fromenvironmental genome shotgun sequences. Nucleic Acids Res. 34, 5623–5630(2006).
21. Colwell, R. K. EstimateS: Statistical estimation of species richness and shared speciesfrom samples, version 8.2. Æhttp://viceroy.eeb.uconn.edu/estimatesæ (1997).
22. Manichanh, C. et al. Reduced diversity of faecal microbiota in Crohn’s diseaserevealed by a metagenomic approach. Gut 55, 205–211 (2006).
23. Wang, X., Heazlewood, S. P., Krause, D. O. & Florin, T. H. Molecularcharacterization of the microbial species that colonize human ileal and colonicmucosa by using 16S rDNA sequence analysis. J. Appl. Microbiol. 95, 508–520(2003).
24. Kanehisa, M., Goto, S., Kawashima, S., Okuno, Y. & Hattori, M. The KEGGresource for deciphering the genome. Nucleic Acids Res. 32, D277–D280 (2004).
25. Tatusov, R. L. et al. The COG database: an updated version includes eukaryotes.BMC Bioinformatics 4, 41 (2003).
26. Jensen, L. J. et al. eggNOG: automated construction and annotation oforthologous groups of genes. Nucleic Acids Res. 36, D250–D254 (2008).
27. Kobayashi, K. et al. Essential Bacillus subtilis genes. Proc. Natl Acad. Sci. USA 100,4678–4683 (2003).
28. Baba, T. et al. Construction of Escherichia coli K-12 in-frame, single-gene knockoutmutants: the Keio collection. Mol. Syst. Biol. 2, doi: 10.1038/msb4100050 (2006).
29. Dongowski, G., Lorenz, A. & Anger, H. Degradation of pectins with differentdegrees of esterification by Bacteroides thetaiotaomicron isolated from human gutflora. Appl. Environ. Microbiol. 66, 1321–1327 (2000).
30. Cummings, J. H. & Macfarlane, G. T. The control and consequences of bacterialfermentation in the human colon. J. Appl. Bacteriol. 70, 443–459 (1991).
31. Wong, J. M., de Souza, R., Kendall, C. W., Emam, A. & Jenkins, D. J. Colonic health:fermentation and short chain fatty acids. J. Clin. Gastroenterol. 40, 235–243(2006).
32. Hamer, H. M. et al. The role of butyrate on colonic function. Aliment. Pharmacol.Ther. 27, 104–119 (2008).
33. Elango, R., Ball, R. O. & Pencharz, P. B. Amino acid requirements in humans: with aspecial emphasis on the metabolic availability of amino acids. Amino Acids 37,19–27 (2009).
34. Metges, C. C. Contribution of microbial amino acids to amino acid homeostasis ofthe host. J. Nutr. 130, 1857S–1864S (2000).
35. Tap, J. et al. Towards the human intestinal microbiota phylogenetic core. Environ.Microbiol. 11, 2574–2584 (2009).
36. Kent, W. J. BLAT–the BLAST-like alignment tool. Genome Res. 12, 656–664(2002).
37. Altschul, S. F. et al. Gapped BLAST and PSI-BLAST: a new generation of proteindatabase search programs. Nucleic Acids Res. 25, 3389–3402 (1997).
38. Letunic, I., Yamada, T., Kanehisa, M. & Bork, P. iPath: interactive exploration ofbiochemical pathways and networks. Trends Biochem Sci. 33, 101–103 (2008).
39. von Mering, C. et al. STRING 7—recent developments in the integration andprediction of protein interactions. Nucleic Acids Res. 35, D358–D362 (2007).
Supplementary Information is linked to the online version of the paper atwww.nature.com/nature.
Acknowledgements We are indebted to the faculty and staff of Beijing GenomicsInstitute at Shenzhen, whose names were not included in the author list, but whocontributed to large-scale sequencing of this team work. The research leading tothese results has received funding from the European Community’s SeventhFramework Programme (FP7/2007-2013): MetaHIT, grant agreementHEALTH-F4-2007-201052, the Ole Rømer grant from the Danish Natural ScienceResearch Council, the Solexa project (272-07-0196), the Shenzhen MunicipalGovernment of China, the National Natural Science Foundation of China(30725008), the International Science and Technology Cooperation Project(0806), China (CXB200903110066A; ZYC200903240076A), the DanishStrategic Research Council grant no 2106-07-0021 (Seqnet), and the LundbeckFoundation Centre for Applied Medical Genomics in Personalised DiseasePrediction, Prevention and Care. Ciberehd is funded by Instituto de Salud Carlos III(Spain). We also thank X. Wang from the School of Biosciences andBioengineering, South China University of Technology, for his coordination on theInnovative Program for Undergraduate Students in which J.L. and Y.X. joined.
Author Contributions All authors are members of the Metagenomics of theHuman Intestinal Tract (MetaHIT) Consortium. So.L., H.Y., Je.W., J.D., F.G., K.K.,O.P., S.B., J.P., Ji.W., S.D.E. and Ju.W. managed the project. T.N., T.H. and K.S.B.performed clinical analyses; F.L. and C.M. performed DNA extraction. X.Z., B.W.,J.C., H.L., Hu.Z., K.T., D.L.P., E.P. and M.J. performed sequencing. Ju.W., S.D.E, P.B.,R.L., J.R., M.A. and J.Q. designed the analyses. J.Q., Sha.L., D.L., J.L., J.X., Y.X., Ho.Z.,M.B., H.B.N., T.S.-P., C.Y., She.L., T.Y., N.P., J.-M.B., P.L., D.R.M., S.D.E. and Y.Z.performed the data analyses. S.D.E., P.B., J.R., J.Q., R.L. and Ju.W. wrote the paper.J.T., A.L., P.R., Y.L. and N.Q. revised the paper. The MetaHIT Consortium memberscontributed to design and execution of the study.
Author Information The raw Illumina read data of all 124 samples has beendeposited in the EBI, under the accession ERA000116. The contigs and gene set areavailable to download from the EMBL (http://www.bork.embl.de/,arumugam/Qin_et_al_2010/) and BGI (http://gutmeta.genomics.org.cn) websites. Reprintsand permissions information is available at www.nature.com/reprints. The authorsdeclare no competing financial interests. This paper is distributed under the termsof the Creative Commons Attribution-Non-Commercial-Share-Alike license, and isfreely available to all readers at www.nature.com/nature. Correspondence andrequests for materials should be addressed to Ju.W. ([email protected]) orS.D.E. ([email protected]).
MetaHIT Consortium (additional members)
Maria Antolin1, Francois Artiguenave2, Herve Blottiere3, Natalia Borruel1, ThomasBruls2, Francesc Casellas1, Christian Chervaux4, Antonella Cultrone3, ChristineDelorme3, Gerard Denariaz4, Rozenn Dervyn3, Miguel Forte5, Carsten Friss6, Maartenvan de Guchte3, Eric Guedon3, Florence Haimet3, Alexandre Jamet3, Catherine Juste3,Ghalia Kaci3, Michiel Kleerebezem7, Jan Knol4, Michel Kristensen8, Severine Layec3,Karine Le Roux3, Marion Leclerc3, Emmanuelle Maguin3, Raquel Melo Minardi2, RaishOozeer4, Maria Rescigno9, Nicolas Sanchez3, Sebastian Tims7, Toni Torrejon1, EncarnaVarela1, Willem de Vos7, Yohanan Winogradsky3 & Erwin Zoetendal7
1Hospital Universitari Val d’Hebron, Ciberehd, 08035 Barcelona, Spain. 2Commissariat al’Energie Atomique, Genoscope, 91000 Evry, France. 3Institut National de la RechercheAgronomique, 78350 Jouy en Josas, France. 4Danone Research, 91120 Palaiseau, France.5UCB Pharma SA, 28046 Madrid, Spain. 6Center for Biological Sequence Analysis,Technical University of Denmark, DK-2800 Kongens Lyngby, Denmark. 7WageningenUnviersiteit, 6710BA Ede, The Netherlands. 8Hagedorn Research Institute, DK 2820Copenhagen, Denmark. 9Istituto Europeo di Oncologia, 20100 Mila, Italy.
NATURE | Vol 464 | 4 March 2010 ARTICLES
65Macmillan Publishers Limited. All rights reserved©2010

METHODSHuman faecal sample collection. Danish individuals were from the Inter-99
cohort40, varying in phenotypes according to BMI and status towards obesity/
diabetes, whereas Spanish individuals were either healthy controls or patients
with chronic inflammatory bowel diseases (Crohn’s disease or ulcerative colitis)
in clinical remission.
Patients and healthy controls were asked to provide a frozen stool sample.
Fresh stool samples were obtained at home, and samples were immediately
frozen by storing them in their home freezer. Frozen samples were delivered
to the Hospital using insulating polystyrene foam containers, and then they were
stored at 280 uC until analysis.
DNA extraction. A frozen aliquot (200 mg) of each faecal sample was suspended
in 250ml of guanidine thiocyanate, 0.1 M Tris (pH 7.5) and 40ml of 10%
N-lauroyl sarcosine. Then, DNA extraction was conducted as previously
described22. The DNA concentration and its molecular size were estimated by
nanodrop (Thermo Scientific) and agarose gel electrophoresis.
DNA library construction and sequencing. DNA library preparation followed
the manufacturer’s instruction (Illumina). We used the same workflow as
described elsewhere to perform cluster generation, template hybridization, iso-
thermal amplification, linearization, blocking and denaturization and hybridi-
zation of the sequencing primers. The base-calling pipeline (version
IlluminaPipeline-0.3) was used to process the raw fluorescent images and call
sequences.
We constructed one library (clone insert size 200 bp) for each of the first 15
samples, and two libraries with different clone insert sizes (135 bp and 400 bp) for
each of the remaining 109 samples for validation of experimental reproducibility.
To estimate the optimal return between the generation of novel sequence and
sequencing depth, we aligned the Illumina GA reads from samples MH0006 and
MH0012 onto 468,335 Sanger reads totalling to 311.7 Mb generated from the
same two samples (156.9 and 154.7 Mb, respectively, Supplementary Table 2),
using the Short Oligonucleotide Alignment Program (SOAP)41 and a match
requirement of 95% sequence identity. With about 4 Gb of Illumina sequence,
94% and 89% of the Sanger reads (for MH0006 and MH0012, respectively) were
covered. Further extensive sequencing, to 12.6 and 16.6 Gb for MH0006 and
MH0012, respectively, brought only a moderate increase of coverage to about
95% (Supplementary Fig. 1). More than 90% of the Sanger reads were covered by
the Illumina sequences to a very high and uniform level (Supplementary Fig. 2),
indicating that there is little or no bias in the Illumina GA sequence. As expected,
a large proportion of Illumina sequences (57% and 74% for M0006 and M0012,
respectively) was novel and could not be mapped onto the Sanger reads. This
fraction was similar at the 4 and 12–16 Gb sequencing levels, confirming that
most of the novelty was captured already at 4 Gb.
We generated 35.4–97.6 million reads for the remaining 122 samples, with an
average of 62.5 million reads. Sequencing read length of the first batch of 15
samples was 44 bp and the second batch was 75 bp.
Public data used. The sequenced bacteria genomes (totally 806 genomes) deposited
in GenBank were downloaded from NCBI database (http://www.ncbi.nlm.nih.gov/)
on 10 January 2009. The known human gut bacteria genome sequences were down-
loaded from HMP database (http://www.hmpdacc-resources.org/cgi-bin/hmp_
catalog/main.cgi), GenBank (67 genomes), Washington University in St Louis (85
genomes, version April 2009, http://genome.wustl.edu/pub/organism/Microbes/
Human_Gut_Microbiome/), and sequenced by the MetaHIT project (17 genomes,
version September 2009, http://www.sanger.ac.uk/pathogens/metahit/). The other
gut metagenome data used in this project include: (1) human gut metagenomic data
sequenced from US individuals8, which was downloaded from NCBI with the
accession SRA002775; (2) human gut metagenomic data from Japanese indivi-
duals17, which was downloaded from P. Bork’s group at EMBL (http://www.
bork.embl.de). The integrated NR database we constructed in this study included
NCBI-NR database (version April 2009) and all genes from the known human gut
bacteria genomes.
Illumina GA short reads de novo assembly. High-quality short reads of each
DNA sample were assembled by the SOAPdenovo assembler19. In brief, we first
filtered the low abundant sequences from the assembly according to 17-mer fre-
quencies. The 17-mers with depth less than 5 were screened in front of assembly, for
these low-frequency sequences were very unlikely to be assembled, whereas remov-
ing them would significantly reduce memory requirement and make assembly
feasible in an ordinary supercomputer (512 GB memory in our institute).
Then the sequences were processed one by one and the de Bruijn graph data
format was used to store the overlap information among the sequences. The
overlap paths supported by a single read were unreliable and removed. Short
low-depth tips and bubbles that were caused by sequencing errors or genetic
variations between microbial strains were trimmed and merged, respectively.
Read paths were used to solve the tiny repeats.
Finally, we broke the connections at repeat boundaries, and outputted the
continuous sequences with unambiguous connections as contigs. The metage-
nomic special model was chosen, and parameters ‘2K 21’ and ‘2K 23’ were used
for 44 bp and 75 bp reads, respectively, to indicate the minimal sequence overlap
required.
After de novo assembly for each sample independently, we merged all the
unassembled reads together and performed assembly for them, as to maximize
the usage of data and assemble the microbial genomes that have low frequency in
each read set, but have sufficient sequence depth for assembly by putting the data
of all samples together.
Validating Illumina contigs using Sanger reads. We used BLASTN (WU-
BLAST 2.0) to map Sanger reads from samples MH0006 and MH0012
(156.9 Mb and 154.7 Mb, respectively) to Illumina contigs (single best hit longer
than 75 bp and over 95% identity) from the same samples. Each alignment was
scanned for breakage of collinearity where both sequences have at least 50 bases
left unaligned at one end of the alignment. Each such breakage was considered an
assembly error in the Illumina contig at the location where collinearity breaks.
Errors within 30 bp from each other were merged. An error was discarded if there
exists a Sanger read that agrees with the contig structure for 60 bp on both sides
of the error. For comparison, we repeated this on a Newbler2 assembly of 454
Titanium reads from MH0006 (550 Mb reads). Supplementary Fig. 5a shows the
number of errors per Mb of assembled Illumina/454 contigs. We estimate 14.12
errors per Mb of contigs for the Illumina assembly, which is comparable to that
of the 454 assembly (20.73 per Mb). 98.7% of Illumina contigs that map at least
one Sanger read were collinear over 99.55% of the mapped regions, which is
comparable to 97.86% of such 454 contigs being collinear over 99.48% of the
mapped regions.
Evaluation of human gut microbiome coverage. The Illumina GA reads were
aligned against the assembled contigs and known bacteria genomes using
SOAP41 by allowing at most two mismatches in the first 35-bp region and
90% identity over the read sequence. The Roche/454 and Sanger sequencing
reads were aligned against the same reference using BLASTN with 1 3 1028,
over 100 bp alignment length and minimal 90% identity cutoff. Two mismatches
were allowed and identity was set 95% over the read sequence when aligned to
the GA reads of MH0006 and MH0012 to Sanger reads from the same samples by
SOAP.
Gene prediction and construction of the non-redundant gene set. We use
MetaGene20—which uses di-codon frequencies estimated by the GC content
of a given sequence, and predicts a whole range of ORFs based on the anonymous
genomic sequences—to find ORFs from the contigs of each of the 124 samples as
well as the contigs from the merged assembly.
The predicted ORFs were then aligned to each other using BLAT36. A pair of
genes with greater than 95% identity and aligned length covered over 90% of the
shorter gene was grouped together. The groups sharing genes were then merged,
and the longest ORF in each merged group was used to represent the group, and the
other members of the group were taken as redundancy. Therefore, we organized the
non-redundant gene set from all the predicted genes by excluding the redundancy.
Finally, the ORFs with length less than 100 bp were filtered. We translated the ORFs
into protein sequences using the NCBI Genetic Codes11.
Identification of genes. To make a balance between identifying low-abundance
genes and reducing the error-rate of identification, we explored the impact of the
threshold set for read coverage required to identify a gene in individual micro-
biomes. The number of genes decreased about twice when the number of reads
required for identification was increased from 2 to 6, and changed slowly there-
after (Supplementary Fig. 6a). Nevertheless, to include the rare genes into the
analysis, we selected the threshold of 2 reads.
Gene taxonomic assignment. Taxonomic assignment of predicted genes was
carried out using BLASTP alignment against the integrated NR database.
BLASTP alignment hits with e-values larger than 1 3 1025 were filtered, and for
each gene the significant matches which were defined by e-values #10 3 e-value of
the top hit were retained to distinguish taxonomic groups. Then we determined the
taxonomical level of each gene by the lowest common ancestor (LCA)-based
algorithm that was implemented in MEGAN42. The LCA-based algorithm assigns
genes to taxa in the way that the taxonomical level of the assigned taxon reflects the
level of conservation of the gene. For example, if a gene was conserved in many
species, it was assigned to the LCA rather than to a species.
Gene functional classification. We used BLASTP to search the protein
sequences of the predicted genes in the eggNOG database26 and KEGG database24
with e-value #1 3 1025. The genes were annotated as the function of the NOGs
or KEGG homologues with lowest e-value. The eggNOG database is an integ-
ration of the COG and KOG databases. The genes annotated by COG were
classified into the 25 COG categories, and genes that were annotated by KEGG
were assigned into KEGG pathways.
doi:10.1038/nature08821
Macmillan Publishers Limited. All rights reserved©2010
Determination of minimal gut bacterial genome. The number of non-redundantgenes assigned to the eggNOG clusters was normalized by gene length and cluster
copy number (Supplementary Fig. 8). The clusters were ranked by normalized gene
number and the range that included the clusters encoding essential Bacillus subtilis
genes was determined, computing the proportion of these clusters among the
successive groups of 100 clusters. Analysis of the range gene clusters involved,
besides iPath projections, use of KEGG and manual verification of the complete-
ness of the pathways and protein machineries they encode.
Determination of total functional complement and minimal metagenome.We computed the total and shared number of orthologous groups and/or gene
families present in random combinations of n individuals (with n 5 2 to 124, 100
replicates per bin). This analysis was performed on three groups of gene clusters:
(1) known eggNOG orthologous groups (that is, those with functional annota-
tion, excluding those in which the terms [Uu]ncharacteri[sz]ed, [Uu]nknown,
[Pp]redicted or[Pp]utative occurred); (2) all eggNOG orthologous groups; (3)
all orthologous groups plus gene families constructed from remaining genes not
assigned to the two above categories. Families were clustered from all-against-all
BLASTP results using MCL43 with an inflation factor of 1.1 and a bit-score cutoff
of 60.Rarefaction analysis. Estimation of total gene richness was done using
EstimateS on 100 randomly picked samples due to memory limitations.
Because the CV value was .0.5, both chao2 (classic) and ICE richness estimators
were calculated and the larger estimate of the two (ICE) was used. The estimate
for this sample size was 3,621,646 genes (ICE) whereas Sobs (Mao Tau) was
3,090,575 genes, or 85.3%. The ICE estimator curve did not completely saturate,
(data not shown) indicating that additional samples will need to be added to
achieve a final, conclusive estimate.
Common bacterial core. To eliminate the influence of very similar strains and
assess the presence of known microbial species among the individuals of the
cohort, we used 650 sequenced bacterial and archaeal genomes as a reference set.
The set was composed from 932 publicly available genomes, which were grouped
by similarity, using a 90% identity cutoff and the similarity over at least 80% of
the length. From each group only the largest genome was used. Illumina reads
from 124 individuals were mapped to the set, for species profiling analysis and
the genomes originating from the same species (by differing in size .20%)
curated by manual inspection and by using the 16S-based clustering when the
sequences were available.
Relative abundance of microbial genomes among individuals. We computed
the genome coverage by uniquely mapping Illumina reads and normalized it to
1 Gb of sequence, to correct for different sequencing levels in different indivi-
duals. The coverage was summed over all species of the non-redundant bacterial
genome set for each individual and the proportion of each species relative to the
sum calculated.
Species co-existence network. For the 155 species that had genome coverage by
the Illumina reads $1% in at least one individual we calculated the pair-wise
inter-species Pearson correlations between sequencing depths (abundance)
throughout the entire cohort of 124 individuals. From the resulting 11,175
inter-species correlations, correlations less than 20.4 or above 0.4 (n 5 342)
were visualized in a graph using Cytoscape44 displaying the average genome
coverage of each species as node size in the graph.
40. Toft, U. et al. The impact of a population-based multi-factorial lifestyleintervention on changes in long-term dietary habits: The Inter99 study. Prev. Med.47, 378–383 (2008).
41. Li, R. et al. SOAP2: an improved ultrafast tool for short read alignment.Bioinformatics 25, 1966–1967 (2009).
42. Huson, D. H., Auch, A. F., Qi, J. & Schuster, S. C. MEGAN analysis of metagenomicdata. Genome Res. 17, 377–386 (2007).
43. van Dongen, S. Graph Clustering by Flow Simulation. PhD thesis, Univ. Utrecht (2000).44. Shannon, P. et al. Cytoscape: a software environment for integrated models of
biomolecular interaction networks. Genome Res. 13, 2498–2504 (2003).
doi:10.1038/nature08821
Macmillan Publishers Limited. All rights reserved©2010
Related Documents


