ORIGINAL PAPER A Holocene record of Pacific Decadal Oscillation (PDO)-related hydrologic variability in Southern California (Lake Elsinore, CA) M. E. Kirby • S. P. Lund • W. P. Patterson • M. A. Anderson • B. W. Bird • L. Ivanovici • P. Monarrez • S. Nielsen Received: 13 August 2009 / Accepted: 4 July 2010 / Published online: 17 July 2010 Ó The Author(s) 2010. This article is published with open access at Springerlink.com Abstract High-resolution terrestrial records of Holocene climate from Southern California are scarce. Moreover, there are no records of Pacific Decadal Oscillation (PDO) variability, a major driver of decadal to multi-decadal climate variability for the region, older than 1,000 years. Recent research on Lake Elsinore, however, has shown that the lake’s sediments hold excellent potential for paleoenviron- mental analysis and reconstruction. New 1-cm con- tiguous grain size data reveal a more complex Holocene climate history for Southern California than previously recognized at the site. A modern comparison between the twentieth century PDO index, lake level change, San Jacinto River discharge, and percent sand suggests that sand content is a reasonable, qualitative proxy for PDO-related, hydro- logic variability at both multi-decadal-to-centennial as well as event (i.e. storm) timescales. A deposi- tional model is proposed to explain the sand-hydro- logic proxy. The sand-hydrologic proxy data reveal nine centennial-scale intervals of wet and dry climate throughout the Holocene. Percent total sand values [ 1.5 standard deviation above the 150–9,700 cal year BP average are frequent between 9,700 and 3,200 cal year BP (n = 41), but they are rare from 3,200 to 150 cal year BP (n = 6). This disparity is interpreted as a change in the frequency of excep- tionally wet (high discharge) years and/or changes in large storm activity. A comparison to other regional hydrologic proxies (10 sites) shows more then M. E. Kirby (&) L. Ivanovici P. Monarrez S. Nielsen Department of Geological Sciences, California State University, Fullerton, Fullerton, CA 92834, USA e-mail: [email protected] L. Ivanovici e-mail: [email protected] P. Monarrez e-mail: [email protected] S. Nielsen e-mail: sniel002@fiu.edu S. P. Lund Department of Earth Sciences, University of Southern California, Los Angeles, CA 90089, USA e-mail: [email protected] W. P. Patterson Department of Geological Sciences, University of Saskatchewan, Saskatoon, SK S7N 5E2, Canada e-mail: [email protected] M. A. Anderson Department of Environmental Sciences, University of California, Riverside, Riverside, CA 92521, USA e-mail: [email protected] B. W. Bird Byrd Polar Research Center, The Ohio State University, Columbus, OH 43210, USA e-mail: [email protected] 123 J Paleolimnol (2010) 44:819–839 DOI 10.1007/s10933-010-9454-0

Welcome message from author
This document is posted to help you gain knowledge. Please leave a comment to let me know what you think about it! Share it to your friends and learn new things together.
Transcript
ORIGINAL PAPER
A Holocene record of Pacific Decadal Oscillation(PDO)-related hydrologic variabilityin Southern California (Lake Elsinore, CA)
M. E. Kirby • S. P. Lund • W. P. Patterson •
M. A. Anderson • B. W. Bird • L. Ivanovici •
P. Monarrez • S. Nielsen
Received: 13 August 2009 / Accepted: 4 July 2010 / Published online: 17 July 2010
� The Author(s) 2010. This article is published with open access at Springerlink.com
Abstract High-resolution terrestrial records of
Holocene climate from Southern California are
scarce. Moreover, there are no records of Pacific
Decadal Oscillation (PDO) variability, a major driver
of decadal to multi-decadal climate variability for the
region, older than 1,000 years. Recent research on
Lake Elsinore, however, has shown that the lake’s
sediments hold excellent potential for paleoenviron-
mental analysis and reconstruction. New 1-cm con-
tiguous grain size data reveal a more complex
Holocene climate history for Southern California
than previously recognized at the site. A modern
comparison between the twentieth century PDO
index, lake level change, San Jacinto River discharge,
and percent sand suggests that sand content is a
reasonable, qualitative proxy for PDO-related, hydro-
logic variability at both multi-decadal-to-centennial
as well as event (i.e. storm) timescales. A deposi-
tional model is proposed to explain the sand-hydro-
logic proxy. The sand-hydrologic proxy data reveal
nine centennial-scale intervals of wet and dry climate
throughout the Holocene. Percent total sand values
[1.5 standard deviation above the 150–9,700 cal year
BP average are frequent between 9,700 and
3,200 cal year BP (n = 41), but they are rare from
3,200 to 150 cal year BP (n = 6). This disparity is
interpreted as a change in the frequency of excep-
tionally wet (high discharge) years and/or changes in
large storm activity. A comparison to other regional
hydrologic proxies (10 sites) shows more then
M. E. Kirby (&) � L. Ivanovici � P. Monarrez �S. Nielsen
Department of Geological Sciences, California State
University, Fullerton, Fullerton, CA 92834, USA
e-mail: [email protected]
L. Ivanovici
e-mail: [email protected]
P. Monarrez
e-mail: [email protected]
S. Nielsen
e-mail: [email protected]
S. P. Lund
Department of Earth Sciences, University of Southern
California, Los Angeles, CA 90089, USA
e-mail: [email protected]
W. P. Patterson
Department of Geological Sciences, University
of Saskatchewan, Saskatoon, SK S7N 5E2, Canada
e-mail: [email protected]
M. A. Anderson
Department of Environmental Sciences, University
of California, Riverside, Riverside, CA 92521, USA
e-mail: [email protected]
B. W. Bird
Byrd Polar Research Center, The Ohio State University,
Columbus, OH 43210, USA
e-mail: [email protected]
123
J Paleolimnol (2010) 44:819–839
DOI 10.1007/s10933-010-9454-0
occasional similarities across the region (i.e. 6 of 9
Elsinore wet intervals are present at [50% of the
comparison sites). Only the early Holocene and the
Little Ice Age intervals, however, are interpreted
consistently across the region as uniformly wet
(C80% of the comparison sites). A comparison to
two ENSO reconstructions indicates little, if any,
correlation to the Elsinore data, suggesting that
ENSO variability is not the predominant forcing of
Holocene climate in Southern California.
Keywords PDO � Grain size � Holocene �Lake sediment � Southern California
Introduction
Southern California is home to over 18,000,000 people
(ca. AD 2000) with a projected increase in population
to nearly 25,000,000 by AD 2030 (CDWR 2005). As
part of the South Coast hydrologic region, Southern
California meets 23% of its combined agricultural and
urban water demands directly from its own ground-
water basins (Swartz and Hauge 2003). Therefore,
future drying trends will produce a severe water
demand and availability predicament (Seager et al.
2007). The region is characterized by an arid, Med-
iterranean climate (cool, wet winters and hot, dry
summers) and faces a perennial freshwater availability
crisis (Beuhler 2003). It is well known that the
availability of freshwater to, and within, Southern
California is controlled, fundamentally, by climate
variability, which likely includes recent human-caused
climate change (Barnett et al. 2008). Climate models
suggest that future global warming will lead to
increased aridity in Southern California (Seager et al.
2007). These model results present a serious challenge
to water management and usage in Southern Califor-
nia. Critical to this challenge is the placement of
modern and predicted climate change in the context of
geologically recent climate change. Reconstructions
of past climate provide a common method for assess-
ing modern and future climate trends and predictions,
particularly terrestrially-based reconstructions from
the region (i.e. Southern California) of interest. The
prehistoric record ([150 years) of climate variability
in Southern California is sparsely documented, and
limited to Mission diaries, tree-ring studies, some
palynology, and a few lake studies (see Kirby et al.
2007 for reference summary). Building on these
previous studies, there is an on-going project that
focuses specifically on the rare, but valuable lacustrine
archives of Southern California (Kirby et al. 2004,
2005, 2006, 2007; Bird et al. 2010).
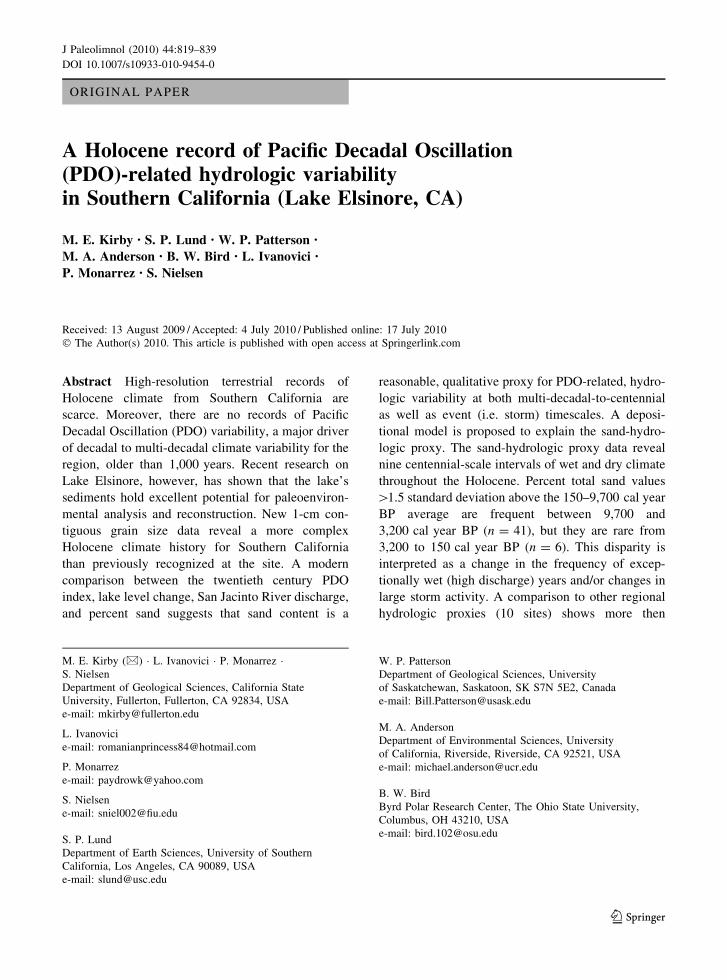
One of these archives is Lake Elsinore, southern
California’s largest natural lake (Fig. 1). Sediment
cores from the lake’s deepest basin are characterized
by relatively high sedimentation rates (*1.0 m/
1,000 years over the Holocene) and nearly continu-
ous sedimentation (Kirby et al. 2007). Holocene-scale
trends (i.e. Milankovitch/orbital-scale) in environ-
mental magnetic susceptibility, loss-on-ignition, %
HCl-extractable Al, and total inorganic P are inter-
preted to reflect long-term drying of the region in
response to changes in winter-summer insolation and
their respective effects on the seasonality of precip-
itation (Kirby et al. 2007).
To investigate the importance of higher frequency/
sub-orbital-scale climate change not addressed in
Kirby et al. (2007), the authors measured 1-cm
contiguous sediment grain size data from core
LEGC03-3. The working hypothesis for this new
data is straightforward: differences in grain size,
particularly the very fine-to-fine sand, reflect changes
in run-off dynamics as coupled to changes in
atmospheric circulation (i.e. climate). Our hypothesis
builds on the observations of: (1) Inman and Jenkins
(1999) who show a strong positive relationship
between sediment flux in the rivers of Southern
California and intervals of increased precipitation
during the twentieth century; and, (2) Cayan and
Peterson (1989), Brito-Castillo et al. (2003), and
Hanson et al. (2006), who show that higher stream-
flow/precipitation in southwestern North America is
associated with a preferred mode of atmospheric
circulation akin to the positive/warm phase of the
PDO. Our paleo-run-off hypothesis is assessed
through comparison to the twentieth century PDO
index, Lake Elsinore lake level, San Jacinto River
discharge, and sediment grain size over the past
100 years. Results indicate that sediment grain size,
specifically percent very fine-to-fine sand, is a
reasonable proxy for hydrologic change at a range
of time scales. This modern relationship is used to
develop a qualitative reconstruction of PDO-related,
Holocene hydrologic variability. Results are
820 J Paleolimnol (2010) 44:819–839
123
compared to regional climate records and ENSO
reconstructions. A depositional model is developed to
explain the grain size proxy.
Background
Regional climatology
Present-day precipitation variability across southern
California is a winter season occurrence. The amount
of precipitation for the region is linked to the mean
position of the winter season polar front, which is
modulated by changes in the position of the eastern
Pacific subtropical high (Cayan and Peterson 1989;
Hanson et al. 2006). Under modern conditions, dry
winters in Southern California are linked to a strong
high-pressure ridge off the west coast of the United
States. This configuration directs storms over the
northwestern United States. Wet winters are related
to a weakening of the subtropical high, causing a
southward shift in the winter season storm track
(Cayan and Peterson 1989). The large-scale atmo-
spheric patterns that control storm trajectories
are influenced by Pacific Ocean sea-surface condi-
tions (Trenberth and Hurrell 1994). Interannual
precipitation variability across Southern California
is related to the El Nino-Southern Oscillation (ENSO
hereafter; El Nino = higher precipitation in Southern
CA and vice versa in northern CA), whereas inter-
decadal variability is linked to the Pacific Decadal
Oscillation (PDO hereafter; ?PDO similar to El Nino
effects) (Castello and Shelton 2004; Hanson et al.
2006; Wise 2010).
An examination of the relationship between twen-
tieth century lake level at Lake Elsinore and regional
precipitation indicates a strong positive correlation
(Kirby et al. 2004, 2007). A similar comparison using
the PDO also shows a positive relationship to lake
level (Kirby et al. 2007). Together, these analyses
indicate that large-scale ocean–atmosphere interac-
tions are recorded at our study site and that Lake
Elsinore responds to a broad range of spatial and
temporal hydrologic change.
The contribution of summer-fall precipitation to
Southern California is small under present conditions,
though the effects can be severe, generating localized
flooding, landslides, and lightning-formed forest fires
(Tubbs 1972; Adams and Comrie 1997). Today,
summer precipitation is a product generally of an
expanded North American monsoon, which enhances
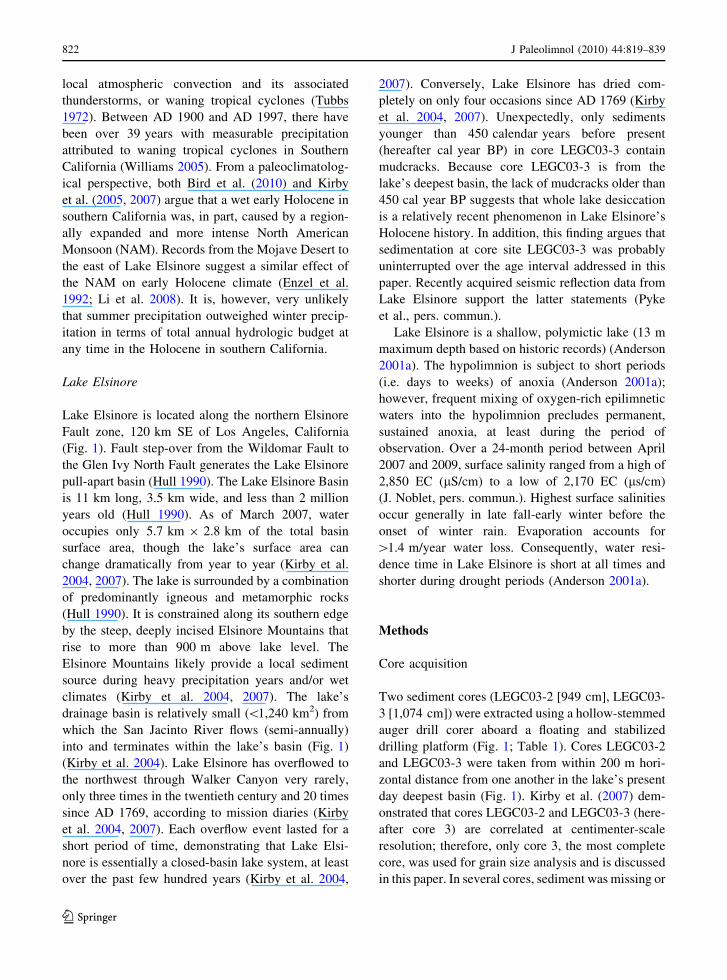
Fig. 1 Study site with regional inset map. LE Lake Elsinore, NV Nevada, CA California, PO Pacific Ocean. Core sites are shown
with total core length (m) and approximate basal age
J Paleolimnol (2010) 44:819–839 821
123
local atmospheric convection and its associated
thunderstorms, or waning tropical cyclones (Tubbs
1972). Between AD 1900 and AD 1997, there have
been over 39 years with measurable precipitation
attributed to waning tropical cyclones in Southern
California (Williams 2005). From a paleoclimatolog-
ical perspective, both Bird et al. (2010) and Kirby
et al. (2005, 2007) argue that a wet early Holocene in
southern California was, in part, caused by a region-
ally expanded and more intense North American
Monsoon (NAM). Records from the Mojave Desert to
the east of Lake Elsinore suggest a similar effect of
the NAM on early Holocene climate (Enzel et al.
1992; Li et al. 2008). It is, however, very unlikely
that summer precipitation outweighed winter precip-
itation in terms of total annual hydrologic budget at
any time in the Holocene in southern California.
Lake Elsinore
Lake Elsinore is located along the northern Elsinore
Fault zone, 120 km SE of Los Angeles, California
(Fig. 1). Fault step-over from the Wildomar Fault to
the Glen Ivy North Fault generates the Lake Elsinore
pull-apart basin (Hull 1990). The Lake Elsinore Basin
is 11 km long, 3.5 km wide, and less than 2 million
years old (Hull 1990). As of March 2007, water
occupies only 5.7 km 9 2.8 km of the total basin
surface area, though the lake’s surface area can
change dramatically from year to year (Kirby et al.
2004, 2007). The lake is surrounded by a combination
of predominantly igneous and metamorphic rocks
(Hull 1990). It is constrained along its southern edge
by the steep, deeply incised Elsinore Mountains that
rise to more than 900 m above lake level. The
Elsinore Mountains likely provide a local sediment
source during heavy precipitation years and/or wet
climates (Kirby et al. 2004, 2007). The lake’s
drainage basin is relatively small (\1,240 km2) from
which the San Jacinto River flows (semi-annually)
into and terminates within the lake’s basin (Fig. 1)
(Kirby et al. 2004). Lake Elsinore has overflowed to
the northwest through Walker Canyon very rarely,
only three times in the twentieth century and 20 times
since AD 1769, according to mission diaries (Kirby
et al. 2004, 2007). Each overflow event lasted for a
short period of time, demonstrating that Lake Elsi-
nore is essentially a closed-basin lake system, at least
over the past few hundred years (Kirby et al. 2004,
2007). Conversely, Lake Elsinore has dried com-
pletely on only four occasions since AD 1769 (Kirby
et al. 2004, 2007). Unexpectedly, only sediments
younger than 450 calendar years before present
(hereafter cal year BP) in core LEGC03-3 contain
mudcracks. Because core LEGC03-3 is from the
lake’s deepest basin, the lack of mudcracks older than
450 cal year BP suggests that whole lake desiccation
is a relatively recent phenomenon in Lake Elsinore’s
Holocene history. In addition, this finding argues that
sedimentation at core site LEGC03-3 was probably
uninterrupted over the age interval addressed in this
paper. Recently acquired seismic reflection data from
Lake Elsinore support the latter statements (Pyke
et al., pers. commun.).
Lake Elsinore is a shallow, polymictic lake (13 m
maximum depth based on historic records) (Anderson
2001a). The hypolimnion is subject to short periods
(i.e. days to weeks) of anoxia (Anderson 2001a);
however, frequent mixing of oxygen-rich epilimnetic
waters into the hypolimnion precludes permanent,
sustained anoxia, at least during the period of
observation. Over a 24-month period between April
2007 and 2009, surface salinity ranged from a high of
2,850 EC (lS/cm) to a low of 2,170 EC (ls/cm)
(J. Noblet, pers. commun.). Highest surface salinities
occur generally in late fall-early winter before the
onset of winter rain. Evaporation accounts for
[1.4 m/year water loss. Consequently, water resi-
dence time in Lake Elsinore is short at all times and
shorter during drought periods (Anderson 2001a).
Methods
Core acquisition
Two sediment cores (LEGC03-2 [949 cm], LEGC03-
3 [1,074 cm]) were extracted using a hollow-stemmed
auger drill corer aboard a floating and stabilized
drilling platform (Fig. 1; Table 1). Cores LEGC03-2
and LEGC03-3 were taken from within 200 m hori-
zontal distance from one another in the lake’s present
day deepest basin (Fig. 1). Kirby et al. (2007) dem-
onstrated that cores LEGC03-2 and LEGC03-3 (here-
after core 3) are correlated at centimenter-scale
resolution; therefore, only core 3, the most complete
core, was used for grain size analysis and is discussed
in this paper. In several cores, sediment was missing or
822 J Paleolimnol (2010) 44:819–839
123
disturbed at the top of the core sections. This
observation is consistent with minor over-augering
between drives or sediment disturbance of the core top
during the coring process. In all cases, it is assumed
that the core bottoms represent the intended depth of
coring. Recovery for core 3 was 85%. For the purposes
of age control, core LESS02-11 (hereafter core 11,
Kirby et al. 2004) is also discussed in this paper. Core
11 was extracted south of core 3 in the same deep
basin.
Age control
In the absence of salvageable macro- or micro-
organic matter, bulk organic matter was used for age
control (Table 2). Eight dates were measured on core
LEGC03-2 and 18 dates were measured on core 3.
All dates were measured at the University of
California, Irvine Keck AMS Facility, and samples
were pre-treated with an acid wash to remove
carbonate. Age control for sediments less than
150 cal years BP was transferred from core 11 to
core 3 (details in Sect. ‘‘Results’’).
Core sedimentology and grain size
Core 3 sedimentology is based on a combination of
visual description, grain size analysis, environmental
magnetic susceptibility, LOI 550�C, and LOI 950�C
(see Kirby et al. 2007 for latter three analytical
methods). Core 3 grain size was determined on
approximately 0.1–0.5 cm3 of sediment at 1-cm
contiguous intervals. Samples were boiled in DI water
and pre-treated with at least 30 ml of 30% H2O2 to
remove organics. Biogenic silica (i.e. diatoms) is
almost entirely absent in the lake sediments
(A. Bloom, pers. commun. 2007); therefore, we did
not process the sediments to remove biogenic silica.
The sediments were not pre-treated with HCl because
carbonate microfossils (e.g. ostracods [gastropods are
completely absent]) are extremely rare and poorly
preserved in the Holocene section. Furthermore,
we opted to include the micron-size, chemically
precipitated CaCO3 (Anderson 2001a, b) as a part of
the lake’s total inorganic, minerogenic size fraction
and therefore did not acidify the sediments. Prior to
grain size analysis, but after organic removal, samples
were split using a TFE fluoro-carbon plastic riffle
splitter with 2,000-l slots. Samples were split, if
necessary, to achieve an obscuration of 8–14%
(Malvern Instruments 1999).
All samples were run on a Malvern Mastersizer
2000 laser diffraction grain size analyzer coupled to a
Hydro 2000G. At the beginning of each measurement
day, a tuff standard (TS2) with a known distribution
between 1.0 and 16.0 l (avg. 4.54 l ± 0.07; n =
3,194) was measured twice and compared to past
measurements to assess the equipment’s accuracy and
repeatability. Thereafter, TS2 was run every 10
samples to verify analytical repeatability and stability
and once at the end of the day’s analyses for a final
assessment. TS2 results are compared to values
obtained by measuring known Malvern standards as
an additional measure of stability. The measurement
principle used is the Mie Scattering principle. Sample
measurement time was 30 s with 30,000 measurement
snaps per single sample aliquot averaged per 10,000
snaps. The final three measurements (30,000 measure-
ments/10,000 snaps = 3 time-averaged measure-
ments) were compared for internal consistency per
sample. All data are reported as volume percent and
divided into 10 grain-size intervals as well as d(0.1),
d(0.5), d(0.9), %clay, %silt, %sand, and mode.
The total percent sand data were standardized by
subtracting the mean of the distribution (as calculated
between 150 and 9,700 cal year BP) from each
observation, and dividing the value by the standard
deviation (as calculated between 150 and 9,700 cal -
year BP). The standardization process creates a mean
of zero with deviations from the mean in units of
standard deviation. The standardized data were also
binned into 50-year intervals to assess multi-decadal-
to centennial-scale variability. The anthropogenic
interval (-53 to 150 cal year BP or AD 2003 to AD
1800 [0 cal years BP = AD 1950]) was not included
in the standardization calculation because of the
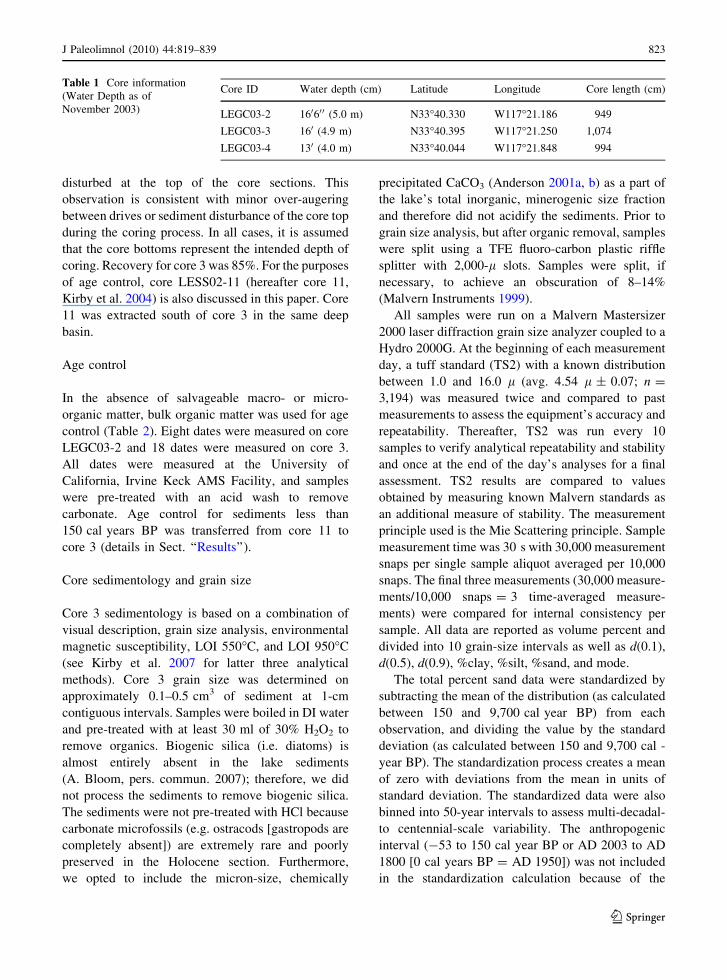
Table 1 Core information
(Water Depth as of
November 2003)
Core ID Water depth (cm) Latitude Longitude Core length (cm)
LEGC03-2 16060 0 (5.0 m) N33�40.330 W117�21.186 949
LEGC03-3 160 (4.9 m) N33�40.395 W117�21.250 1,074
LEGC03-4 130 (4.0 m) N33�40.044 W117�21.848 994
J Paleolimnol (2010) 44:819–839 823
123
much higher-than-Holocene average, post-settlement
sand values. From AD 1900 to AD 2003, the sand
data were standardized using the AD 1900 to AD
2003 average and standard deviation. These modern
data were binned into 10-year averages (e.g. AD
1910–1919, AD 1920–1929, etc.) for comparison to
lake level, river discharge, and PDO data.
Meteorological indices and lake level data
Meteorological data were obtained from the National
Climatic Data Center weather observation station
records (lwf.ncdc.noaa.gov/oa/climate/stationlocator.
html). Lake level data for Lake Elsinore were obtained
from the United States Geological Survey, the Elsinore
Valley Municipal Water District monitoring program
(www.evmwd.com), and Berry et al. (1953). San Jac-
into River discharge data were obtained from the
USGS Water Data for the Nation website (nwis.
waterdata.usgs.gov/nwis). PDO data were obtained
from Mantua et al. (1997; [http://jisao.washington.edu/
pdo/PDO.latest]). The PDO, lake level, and discharge
data were binned into 10-year averages (e.g. AD
1910–1919, AD 1920–1929, etc.) so that their time
intervals correspond to that of the typical sand datum.
Intervals of missing lake level data were substituted
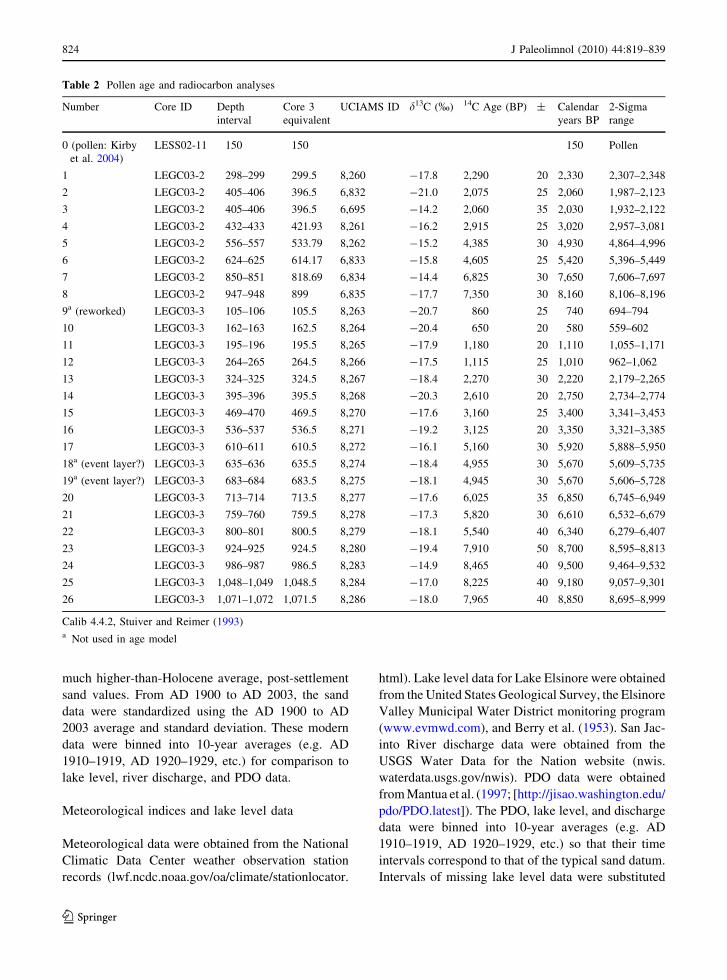
Table 2 Pollen age and radiocarbon analyses
Number Core ID Depth
interval
Core 3
equivalent
UCIAMS ID d13C (%) 14C Age (BP) ± Calendar
years BP
2-Sigma
range
0 (pollen: Kirby
et al. 2004)
LESS02-11 150 150 150 Pollen
1 LEGC03-2 298–299 299.5 8,260 -17.8 2,290 20 2,330 2,307–2,348
2 LEGC03-2 405–406 396.5 6,832 -21.0 2,075 25 2,060 1,987–2,123
3 LEGC03-2 405–406 396.5 6,695 -14.2 2,060 35 2,030 1,932–2,122
4 LEGC03-2 432–433 421.93 8,261 -16.2 2,915 25 3,020 2,957–3,081
5 LEGC03-2 556–557 533.79 8,262 -15.2 4,385 30 4,930 4,864–4,996
6 LEGC03-2 624–625 614.17 6,833 -15.8 4,605 25 5,420 5,396–5,449
7 LEGC03-2 850–851 818.69 6,834 -14.4 6,825 30 7,650 7,606–7,697
8 LEGC03-2 947–948 899 6,835 -17.7 7,350 30 8,160 8,106–8,196
9a (reworked) LEGC03-3 105–106 105.5 8,263 -20.7 860 25 740 694–794
10 LEGC03-3 162–163 162.5 8,264 -20.4 650 20 580 559–602
11 LEGC03-3 195–196 195.5 8,265 -17.9 1,180 20 1,110 1,055–1,171
12 LEGC03-3 264–265 264.5 8,266 -17.5 1,115 25 1,010 962–1,062
13 LEGC03-3 324–325 324.5 8,267 -18.4 2,270 30 2,220 2,179–2,265
14 LEGC03-3 395–396 395.5 8,268 -20.3 2,610 20 2,750 2,734–2,774
15 LEGC03-3 469–470 469.5 8,270 -17.6 3,160 25 3,400 3,341–3,453
16 LEGC03-3 536–537 536.5 8,271 -19.2 3,125 20 3,350 3,321–3,385
17 LEGC03-3 610–611 610.5 8,272 -16.1 5,160 30 5,920 5,888–5,950
18a (event layer?) LEGC03-3 635–636 635.5 8,274 -18.4 4,955 30 5,670 5,609–5,735
19a (event layer?) LEGC03-3 683–684 683.5 8,275 -18.1 4,945 30 5,670 5,606–5,728
20 LEGC03-3 713–714 713.5 8,277 -17.6 6,025 35 6,850 6,745–6,949
21 LEGC03-3 759–760 759.5 8,278 -17.3 5,820 30 6,610 6,532–6,679
22 LEGC03-3 800–801 800.5 8,279 -18.1 5,540 40 6,340 6,279–6,407
23 LEGC03-3 924–925 924.5 8,280 -19.4 7,910 50 8,700 8,595–8,813
24 LEGC03-3 986–987 986.5 8,283 -14.9 8,465 40 9,500 9,464–9,532
25 LEGC03-3 1,048–1,049 1,048.5 8,284 -17.0 8,225 40 9,180 9,057–9,301
26 LEGC03-3 1,071–1,072 1,071.5 8,286 -18.0 7,965 40 8,850 8,695–8,999
Calib 4.4.2, Stuiver and Reimer (1993)a Not used in age model
824 J Paleolimnol (2010) 44:819–839
123
with values interpolated between points of known data
using a linear interpolation (i.e. AD 1998–1999, 1991,
1989–1984, 1972–1971, 1968, 1966, 1963–1960)
based on the relationship between precipitation and the
predictable lake level response in an arid environment.
Binning the sand, PDO, discharge, and lake level data
by mid-decade (i.e. AD 1905–1914) does not change
the relationships between the various data.
Results
Age control
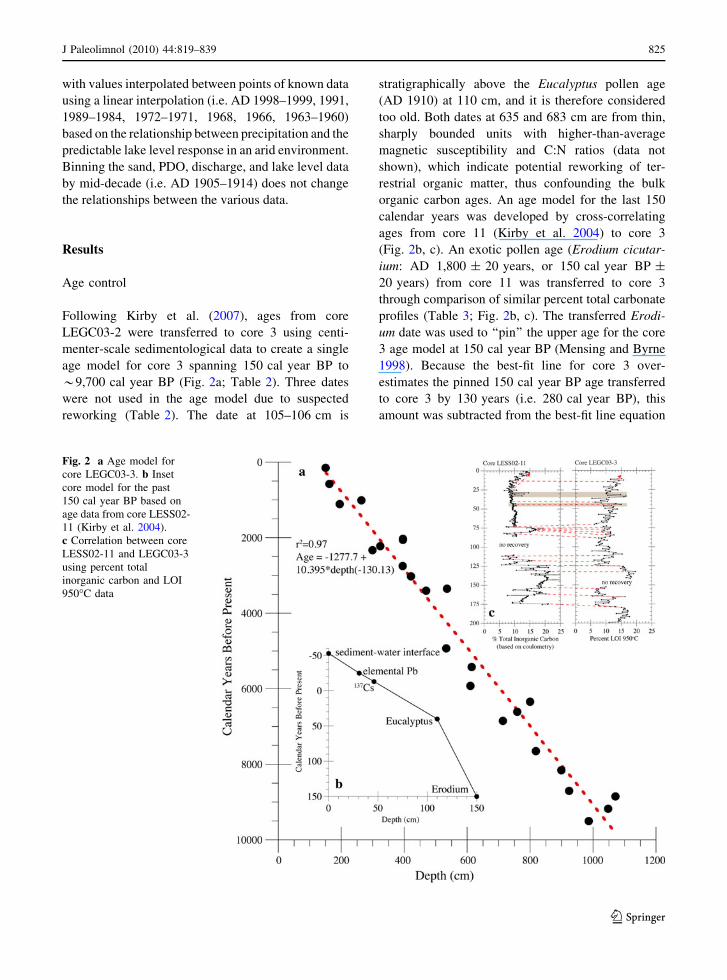
Following Kirby et al. (2007), ages from core
LEGC03-2 were transferred to core 3 using centi-
menter-scale sedimentological data to create a single
age model for core 3 spanning 150 cal year BP to
*9,700 cal year BP (Fig. 2a; Table 2). Three dates
were not used in the age model due to suspected
reworking (Table 2). The date at 105–106 cm is
stratigraphically above the Eucalyptus pollen age
(AD 1910) at 110 cm, and it is therefore considered
too old. Both dates at 635 and 683 cm are from thin,
sharply bounded units with higher-than-average
magnetic susceptibility and C:N ratios (data not
shown), which indicate potential reworking of ter-
restrial organic matter, thus confounding the bulk
organic carbon ages. An age model for the last 150
calendar years was developed by cross-correlating
ages from core 11 (Kirby et al. 2004) to core 3
(Fig. 2b, c). An exotic pollen age (Erodium cicutar-
ium: AD 1,800 ± 20 years, or 150 cal year BP ±
20 years) from core 11 was transferred to core 3
through comparison of similar percent total carbonate
profiles (Table 3; Fig. 2b, c). The transferred Erodi-
um date was used to ‘‘pin’’ the upper age for the core
3 age model at 150 cal year BP (Mensing and Byrne
1998). Because the best-fit line for core 3 over-
estimates the pinned 150 cal year BP age transferred
to core 3 by 130 years (i.e. 280 cal year BP), this
amount was subtracted from the best-fit line equation
Fig. 2 a Age model for
core LEGC03-3. b Inset
core model for the past
150 cal year BP based on
age data from core LESS02-
11 (Kirby et al. 2004).
c Correlation between core
LESS02-11 and LEGC03-3
using percent total
inorganic carbon and LOI
950�C data
J Paleolimnol (2010) 44:819–839 825
123
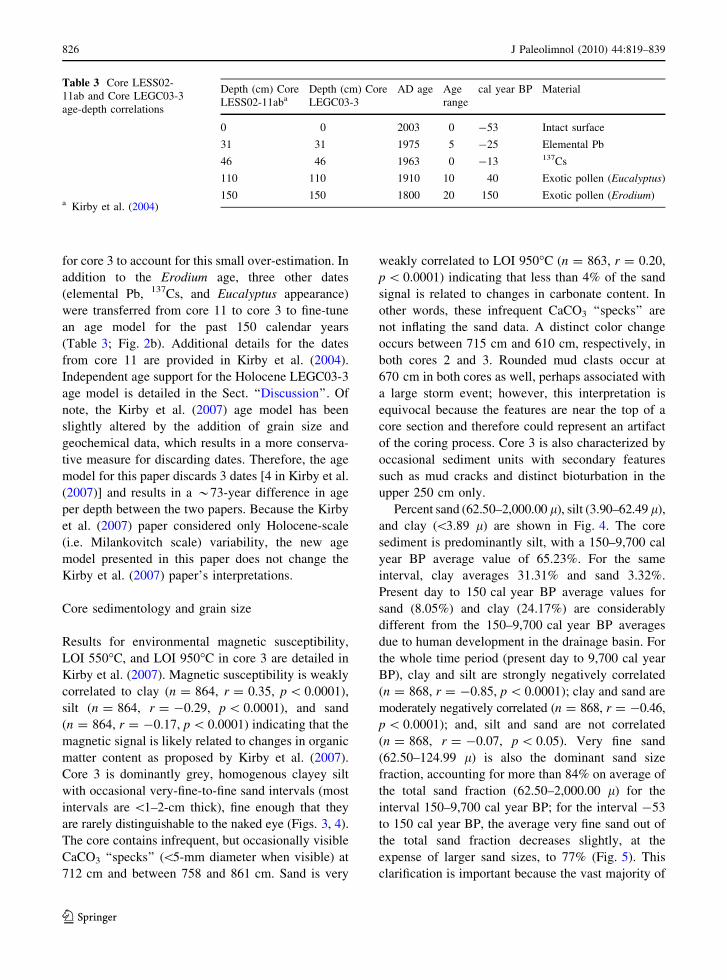
for core 3 to account for this small over-estimation. In
addition to the Erodium age, three other dates
(elemental Pb, 137Cs, and Eucalyptus appearance)
were transferred from core 11 to core 3 to fine-tune
an age model for the past 150 calendar years
(Table 3; Fig. 2b). Additional details for the dates
from core 11 are provided in Kirby et al. (2004).
Independent age support for the Holocene LEGC03-3
age model is detailed in the Sect. ‘‘Discussion’’. Of
note, the Kirby et al. (2007) age model has been
slightly altered by the addition of grain size and
geochemical data, which results in a more conserva-
tive measure for discarding dates. Therefore, the age
model for this paper discards 3 dates [4 in Kirby et al.
(2007)] and results in a *73-year difference in age
per depth between the two papers. Because the Kirby
et al. (2007) paper considered only Holocene-scale
(i.e. Milankovitch scale) variability, the new age
model presented in this paper does not change the
Kirby et al. (2007) paper’s interpretations.
Core sedimentology and grain size
Results for environmental magnetic susceptibility,
LOI 550�C, and LOI 950�C in core 3 are detailed in
Kirby et al. (2007). Magnetic susceptibility is weakly
correlated to clay (n = 864, r = 0.35, p \ 0.0001),
silt (n = 864, r = -0.29, p \ 0.0001), and sand
(n = 864, r = -0.17, p \ 0.0001) indicating that the
magnetic signal is likely related to changes in organic
matter content as proposed by Kirby et al. (2007).
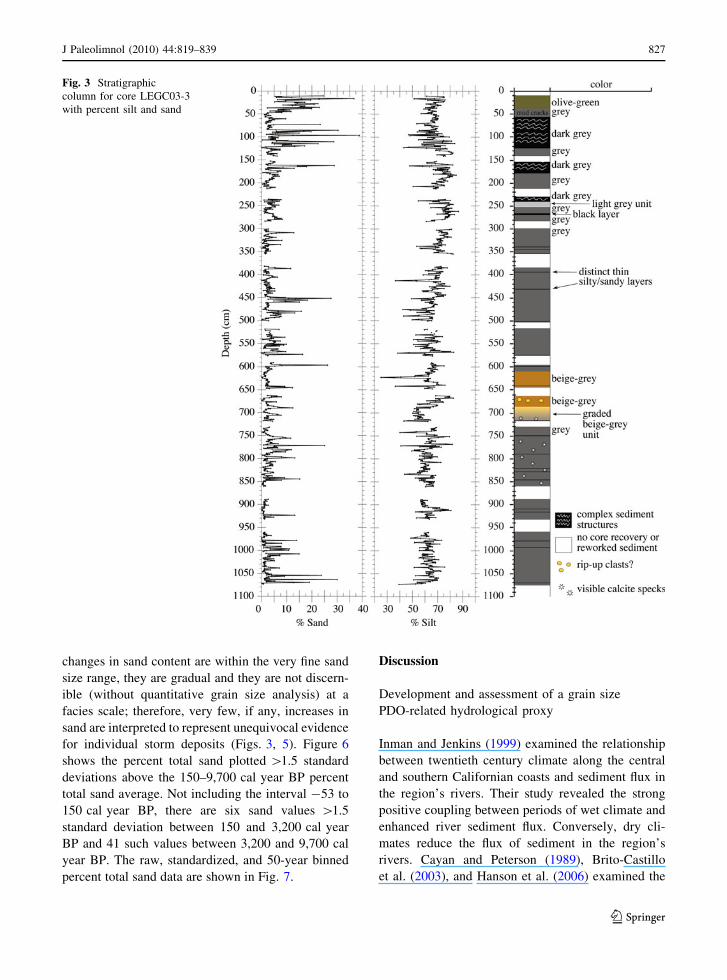
Core 3 is dominantly grey, homogenous clayey silt
with occasional very-fine-to-fine sand intervals (most
intervals are \1–2-cm thick), fine enough that they
are rarely distinguishable to the naked eye (Figs. 3, 4).
The core contains infrequent, but occasionally visible
CaCO3 ‘‘specks’’ (\5-mm diameter when visible) at
712 cm and between 758 and 861 cm. Sand is very
weakly correlated to LOI 950�C (n = 863, r = 0.20,
p \ 0.0001) indicating that less than 4% of the sand
signal is related to changes in carbonate content. In
other words, these infrequent CaCO3 ‘‘specks’’ are
not inflating the sand data. A distinct color change
occurs between 715 cm and 610 cm, respectively, in
both cores 2 and 3. Rounded mud clasts occur at
670 cm in both cores as well, perhaps associated with
a large storm event; however, this interpretation is
equivocal because the features are near the top of a
core section and therefore could represent an artifact
of the coring process. Core 3 is also characterized by
occasional sediment units with secondary features
such as mud cracks and distinct bioturbation in the
upper 250 cm only.
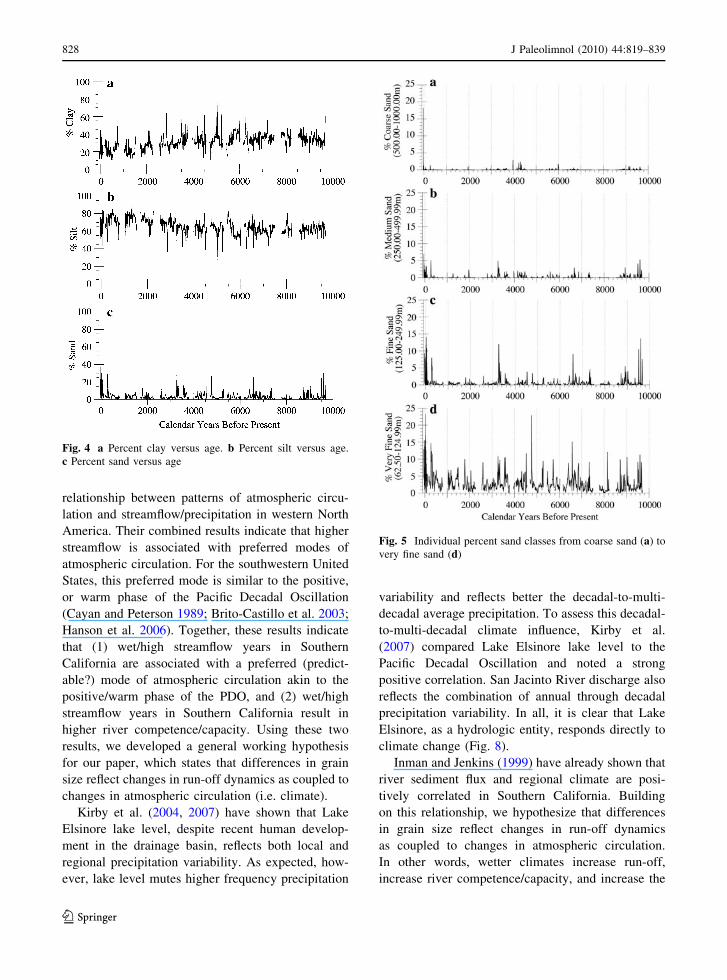
Percent sand (62.50–2,000.00 l), silt (3.90–62.49 l),
and clay (\3.89 l) are shown in Fig. 4. The core
sediment is predominantly silt, with a 150–9,700 cal
year BP average value of 65.23%. For the same
interval, clay averages 31.31% and sand 3.32%.
Present day to 150 cal year BP average values for
sand (8.05%) and clay (24.17%) are considerably
different from the 150–9,700 cal year BP averages
due to human development in the drainage basin. For
the whole time period (present day to 9,700 cal year
BP), clay and silt are strongly negatively correlated
(n = 868, r = -0.85, p \ 0.0001); clay and sand are
moderately negatively correlated (n = 868, r = -0.46,
p \ 0.0001); and, silt and sand are not correlated
(n = 868, r = -0.07, p \ 0.05). Very fine sand
(62.50–124.99 l) is also the dominant sand size
fraction, accounting for more than 84% on average of
the total sand fraction (62.50–2,000.00 l) for the
interval 150–9,700 cal year BP; for the interval -53
to 150 cal year BP, the average very fine sand out of
the total sand fraction decreases slightly, at the
expense of larger sand sizes, to 77% (Fig. 5). This
clarification is important because the vast majority of
Table 3 Core LESS02-
11ab and Core LEGC03-3
age-depth correlations
a Kirby et al. (2004)
Depth (cm) Core
LESS02-11abaDepth (cm) Core
LEGC03-3
AD age Age
range
cal year BP Material
0 0 2003 0 -53 Intact surface
31 31 1975 5 -25 Elemental Pb
46 46 1963 0 -13 137Cs
110 110 1910 10 40 Exotic pollen (Eucalyptus)
150 150 1800 20 150 Exotic pollen (Erodium)
826 J Paleolimnol (2010) 44:819–839
123
changes in sand content are within the very fine sand
size range, they are gradual and they are not discern-
ible (without quantitative grain size analysis) at a
facies scale; therefore, very few, if any, increases in
sand are interpreted to represent unequivocal evidence
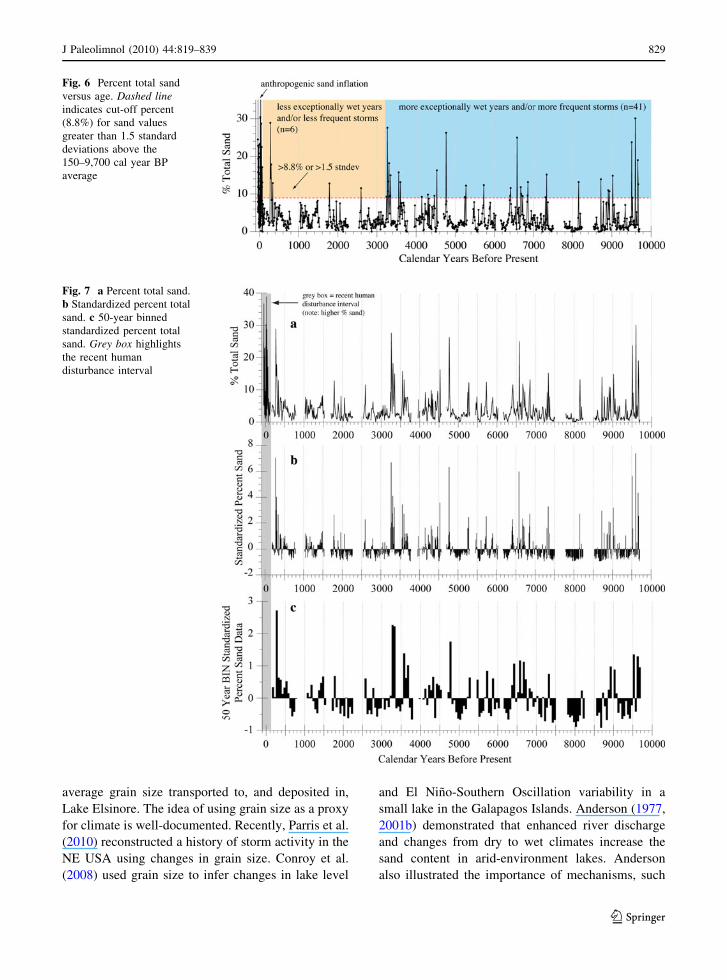
for individual storm deposits (Figs. 3, 5). Figure 6
shows the percent total sand plotted [1.5 standard
deviations above the 150–9,700 cal year BP percent
total sand average. Not including the interval -53 to
150 cal year BP, there are six sand values [1.5
standard deviation between 150 and 3,200 cal year
BP and 41 such values between 3,200 and 9,700 cal
year BP. The raw, standardized, and 50-year binned
percent total sand data are shown in Fig. 7.
Discussion
Development and assessment of a grain size
PDO-related hydrological proxy
Inman and Jenkins (1999) examined the relationship
between twentieth century climate along the central
and southern Californian coasts and sediment flux in
the region’s rivers. Their study revealed the strong
positive coupling between periods of wet climate and
enhanced river sediment flux. Conversely, dry cli-
mates reduce the flux of sediment in the region’s
rivers. Cayan and Peterson (1989), Brito-Castillo
et al. (2003), and Hanson et al. (2006) examined the
Fig. 3 Stratigraphic
column for core LEGC03-3
with percent silt and sand
J Paleolimnol (2010) 44:819–839 827
123
relationship between patterns of atmospheric circu-
lation and streamflow/precipitation in western North
America. Their combined results indicate that higher
streamflow is associated with preferred modes of
atmospheric circulation. For the southwestern United
States, this preferred mode is similar to the positive,
or warm phase of the Pacific Decadal Oscillation
(Cayan and Peterson 1989; Brito-Castillo et al. 2003;
Hanson et al. 2006). Together, these results indicate
that (1) wet/high streamflow years in Southern
California are associated with a preferred (predict-
able?) mode of atmospheric circulation akin to the
positive/warm phase of the PDO, and (2) wet/high
streamflow years in Southern California result in
higher river competence/capacity. Using these two
results, we developed a general working hypothesis
for our paper, which states that differences in grain
size reflect changes in run-off dynamics as coupled to
changes in atmospheric circulation (i.e. climate).
Kirby et al. (2004, 2007) have shown that Lake
Elsinore lake level, despite recent human develop-
ment in the drainage basin, reflects both local and
regional precipitation variability. As expected, how-
ever, lake level mutes higher frequency precipitation
variability and reflects better the decadal-to-multi-
decadal average precipitation. To assess this decadal-
to-multi-decadal climate influence, Kirby et al.
(2007) compared Lake Elsinore lake level to the
Pacific Decadal Oscillation and noted a strong
positive correlation. San Jacinto River discharge also
reflects the combination of annual through decadal
precipitation variability. In all, it is clear that Lake
Elsinore, as a hydrologic entity, responds directly to
climate change (Fig. 8).
Inman and Jenkins (1999) have already shown that
river sediment flux and regional climate are posi-
tively correlated in Southern California. Building
on this relationship, we hypothesize that differences
in grain size reflect changes in run-off dynamics
as coupled to changes in atmospheric circulation.
In other words, wetter climates increase run-off,
increase river competence/capacity, and increase the
Fig. 4 a Percent clay versus age. b Percent silt versus age.
c Percent sand versus age
Fig. 5 Individual percent sand classes from coarse sand (a) to
very fine sand (d)
828 J Paleolimnol (2010) 44:819–839
123
average grain size transported to, and deposited in,
Lake Elsinore. The idea of using grain size as a proxy
for climate is well-documented. Recently, Parris et al.
(2010) reconstructed a history of storm activity in the
NE USA using changes in grain size. Conroy et al.
(2008) used grain size to infer changes in lake level
and El Nino-Southern Oscillation variability in a
small lake in the Galapagos Islands. Anderson (1977,
2001b) demonstrated that enhanced river discharge
and changes from dry to wet climates increase the
sand content in arid-environment lakes. Anderson
also illustrated the importance of mechanisms, such
Fig. 6 Percent total sand
versus age. Dashed lineindicates cut-off percent
(8.8%) for sand values
greater than 1.5 standard
deviations above the
150–9,700 cal year BP
average
Fig. 7 a Percent total sand.
b Standardized percent total
sand. c 50-year binned
standardized percent total
sand. Grey box highlights
the recent human
disturbance interval
J Paleolimnol (2010) 44:819–839 829
123
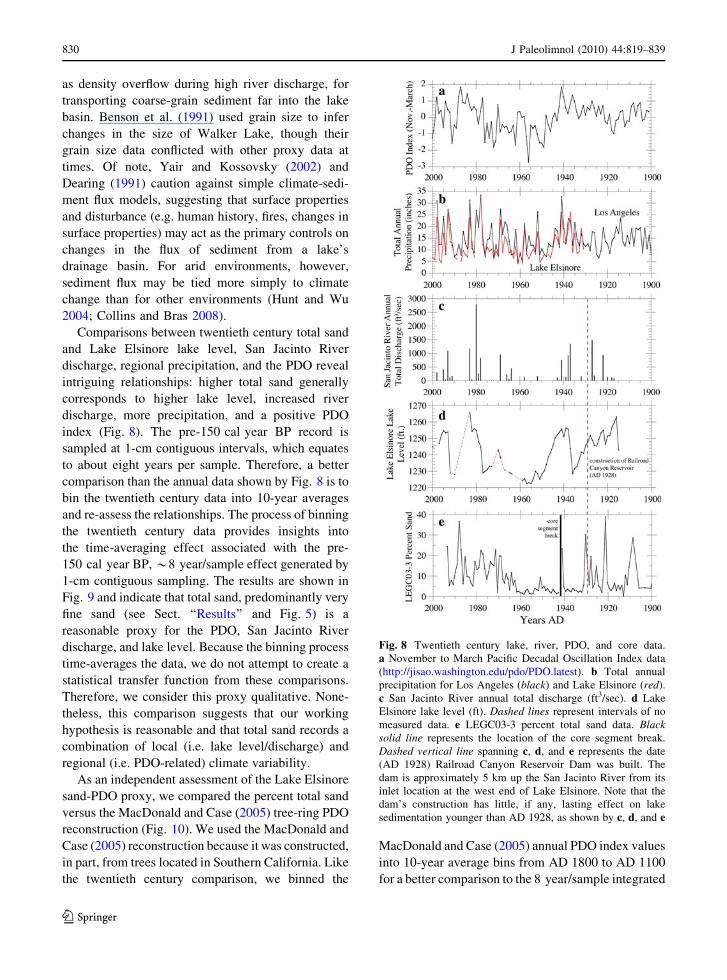
as density overflow during high river discharge, for
transporting coarse-grain sediment far into the lake
basin. Benson et al. (1991) used grain size to infer
changes in the size of Walker Lake, though their
grain size data conflicted with other proxy data at
times. Of note, Yair and Kossovsky (2002) and
Dearing (1991) caution against simple climate-sedi-
ment flux models, suggesting that surface properties
and disturbance (e.g. human history, fires, changes in
surface properties) may act as the primary controls on
changes in the flux of sediment from a lake’s
drainage basin. For arid environments, however,
sediment flux may be tied more simply to climate
change than for other environments (Hunt and Wu
2004; Collins and Bras 2008).
Comparisons between twentieth century total sand
and Lake Elsinore lake level, San Jacinto River
discharge, regional precipitation, and the PDO reveal
intriguing relationships: higher total sand generally
corresponds to higher lake level, increased river
discharge, more precipitation, and a positive PDO
index (Fig. 8). The pre-150 cal year BP record is
sampled at 1-cm contiguous intervals, which equates
to about eight years per sample. Therefore, a better
comparison than the annual data shown by Fig. 8 is to
bin the twentieth century data into 10-year averages
and re-assess the relationships. The process of binning
the twentieth century data provides insights into
the time-averaging effect associated with the pre-
150 cal year BP, *8 year/sample effect generated by
1-cm contiguous sampling. The results are shown in
Fig. 9 and indicate that total sand, predominantly very
fine sand (see Sect. ‘‘Results’’ and Fig. 5) is a
reasonable proxy for the PDO, San Jacinto River
discharge, and lake level. Because the binning process
time-averages the data, we do not attempt to create a
statistical transfer function from these comparisons.
Therefore, we consider this proxy qualitative. None-
theless, this comparison suggests that our working
hypothesis is reasonable and that total sand records a
combination of local (i.e. lake level/discharge) and
regional (i.e. PDO-related) climate variability.
As an independent assessment of the Lake Elsinore
sand-PDO proxy, we compared the percent total sand
versus the MacDonald and Case (2005) tree-ring PDO
reconstruction (Fig. 10). We used the MacDonald and
Case (2005) reconstruction because it was constructed,
in part, from trees located in Southern California. Like
the twentieth century comparison, we binned the
MacDonald and Case (2005) annual PDO index values
into 10-year average bins from AD 1800 to AD 1100
for a better comparison to the 8 year/sample integrated
Fig. 8 Twentieth century lake, river, PDO, and core data.
a November to March Pacific Decadal Oscillation Index data
(http://jisao.washington.edu/pdo/PDO.latest). b Total annual
precipitation for Los Angeles (black) and Lake Elsinore (red).
c San Jacinto River annual total discharge (ft3/sec). d Lake
Elsinore lake level (ft). Dashed lines represent intervals of no
measured data. e LEGC03-3 percent total sand data. Blacksolid line represents the location of the core segment break.
Dashed vertical line spanning c, d, and e represents the date
(AD 1928) Railroad Canyon Reservoir Dam was built. The
dam is approximately 5 km up the San Jacinto River from its
inlet location at the west end of Lake Elsinore. Note that the
dam’s construction has little, if any, lasting effect on lake
sedimentation younger than AD 1928, as shown by c, d, and e
830 J Paleolimnol (2010) 44:819–839
123
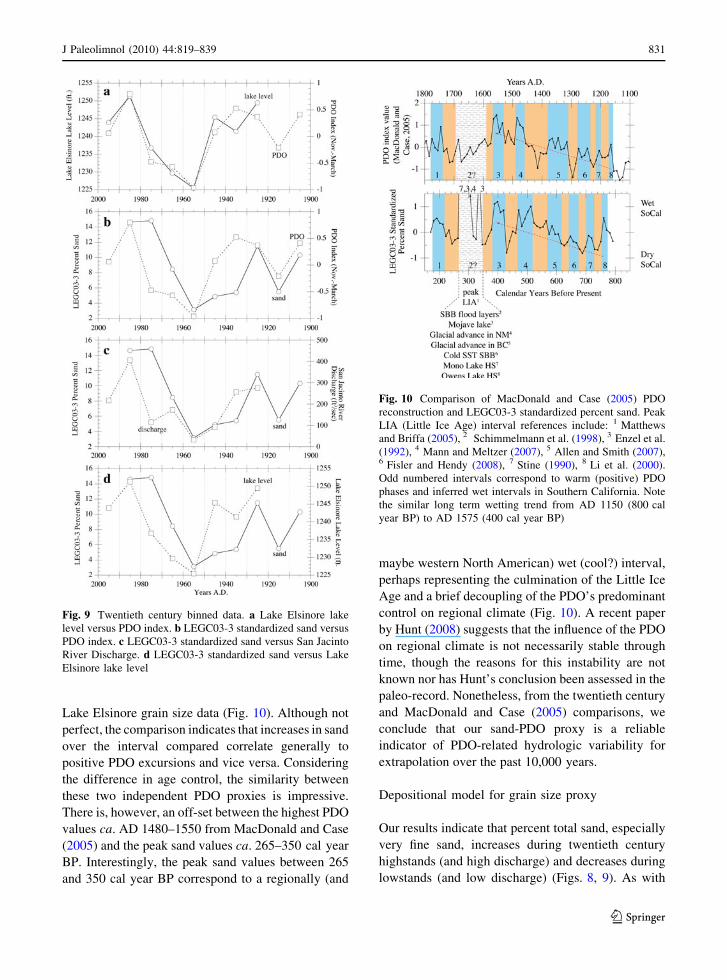
Lake Elsinore grain size data (Fig. 10). Although not
perfect, the comparison indicates that increases in sand
over the interval compared correlate generally to
positive PDO excursions and vice versa. Considering
the difference in age control, the similarity between
these two independent PDO proxies is impressive.
There is, however, an off-set between the highest PDO
values ca. AD 1480–1550 from MacDonald and Case
(2005) and the peak sand values ca. 265–350 cal year
BP. Interestingly, the peak sand values between 265
and 350 cal year BP correspond to a regionally (and
maybe western North American) wet (cool?) interval,
perhaps representing the culmination of the Little Ice
Age and a brief decoupling of the PDO’s predominant
control on regional climate (Fig. 10). A recent paper
by Hunt (2008) suggests that the influence of the PDO
on regional climate is not necessarily stable through
time, though the reasons for this instability are not
known nor has Hunt’s conclusion been assessed in the
paleo-record. Nonetheless, from the twentieth century
and MacDonald and Case (2005) comparisons, we
conclude that our sand-PDO proxy is a reliable
indicator of PDO-related hydrologic variability for
extrapolation over the past 10,000 years.
Depositional model for grain size proxy
Our results indicate that percent total sand, especially
very fine sand, increases during twentieth century
highstands (and high discharge) and decreases during
lowstands (and low discharge) (Figs. 8, 9). As with
Fig. 9 Twentieth century binned data. a Lake Elsinore lake
level versus PDO index. b LEGC03-3 standardized sand versus
PDO index. c LEGC03-3 standardized sand versus San Jacinto
River Discharge. d LEGC03-3 standardized sand versus Lake
Elsinore lake level
Fig. 10 Comparison of MacDonald and Case (2005) PDO
reconstruction and LEGC03-3 standardized percent sand. Peak
LIA (Little Ice Age) interval references include: 1 Matthews
and Briffa (2005), 2 Schimmelmann et al. (1998), 3 Enzel et al.
(1992), 4 Mann and Meltzer (2007), 5 Allen and Smith (2007),6 Fisler and Hendy (2008), 7 Stine (1990), 8 Li et al. (2000).
Odd numbered intervals correspond to warm (positive) PDO
phases and inferred wet intervals in Southern California. Note
the similar long term wetting trend from AD 1150 (800 cal
year BP) to AD 1575 (400 cal year BP)
J Paleolimnol (2010) 44:819–839 831
123
most, if not all lake basins, Lake Elsinore is
characterized by a pronounced grain size gradient
from coarse grains in the littoral zone to fine grains in
the profundal zone (Anderson 2001a). In most lake
basins, sediment focusing is the usual explanation for
this gradient (Davis and Ford 1982). Sediment
focusing is a process that removes fine grain sediment
from the littoral zone and re-deposits it in the
profundal zone via wave action/winnowing, near-
shore currents, and/or littoral migration associated
with changes in lake level. Here, we present a
depositional model to explain the coarse-highstand/
fine-lowstand relationship observed in Lake Elsinore
using the concept of sediment focusing as an
important depositional process.
Lake Elsinore lake level, as for many arid-
environment lakes, is controlled directly by the
amount of precipitation (Figs. 8, 9). Yet lake level
response to above average precipitation versus below
average precipitation is generally asymmetric. In
other words, a single large storm or above average
wet year can fill Lake Elsinore, whereas, it requires
several years or more of below average precipitation
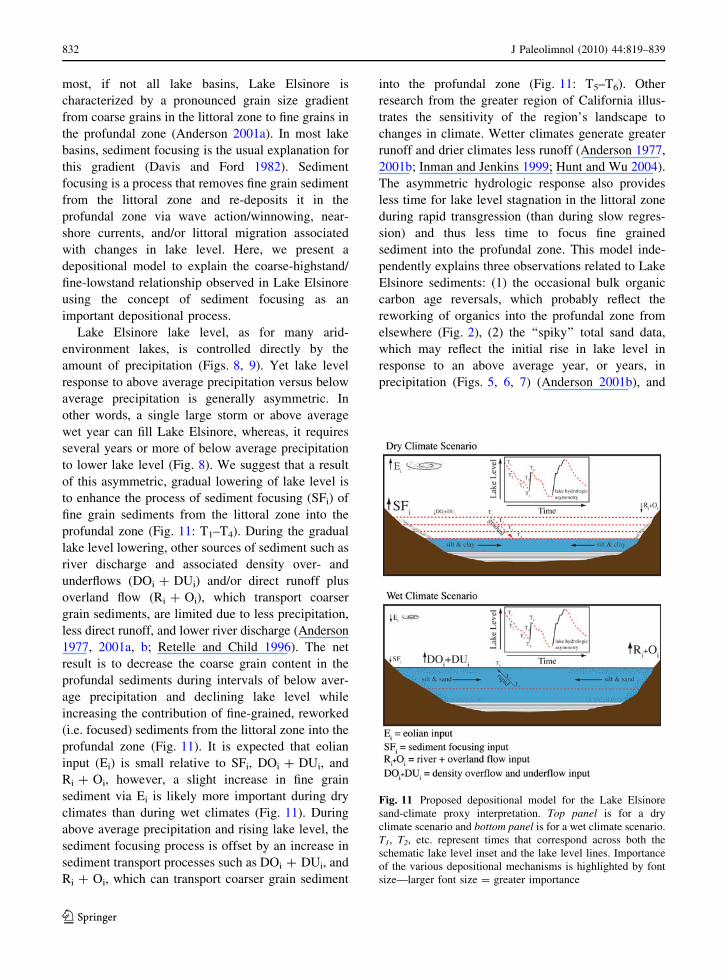
to lower lake level (Fig. 8). We suggest that a result
of this asymmetric, gradual lowering of lake level is
to enhance the process of sediment focusing (SFi) of
fine grain sediments from the littoral zone into the
profundal zone (Fig. 11: T1–T4). During the gradual
lake level lowering, other sources of sediment such as
river discharge and associated density over- and
underflows (DOi ? DUi) and/or direct runoff plus
overland flow (Ri ? Oi), which transport coarser
grain sediments, are limited due to less precipitation,
less direct runoff, and lower river discharge (Anderson
1977, 2001a, b; Retelle and Child 1996). The net
result is to decrease the coarse grain content in the
profundal sediments during intervals of below aver-
age precipitation and declining lake level while
increasing the contribution of fine-grained, reworked
(i.e. focused) sediments from the littoral zone into the
profundal zone (Fig. 11). It is expected that eolian
input (Ei) is small relative to SFi, DOi ? DUi, and
Ri ? Oi, however, a slight increase in fine grain
sediment via Ei is likely more important during dry
climates than during wet climates (Fig. 11). During
above average precipitation and rising lake level, the
sediment focusing process is offset by an increase in
sediment transport processes such as DOi ? DUi, and
Ri ? Oi, which can transport coarser grain sediment
into the profundal zone (Fig. 11: T5–T6). Other
research from the greater region of California illus-
trates the sensitivity of the region’s landscape to
changes in climate. Wetter climates generate greater
runoff and drier climates less runoff (Anderson 1977,
2001b; Inman and Jenkins 1999; Hunt and Wu 2004).
The asymmetric hydrologic response also provides
less time for lake level stagnation in the littoral zone
during rapid transgression (than during slow regres-
sion) and thus less time to focus fine grained
sediment into the profundal zone. This model inde-
pendently explains three observations related to Lake
Elsinore sediments: (1) the occasional bulk organic
carbon age reversals, which probably reflect the
reworking of organics into the profundal zone from
elsewhere (Fig. 2), (2) the ‘‘spiky’’ total sand data,
which may reflect the initial rise in lake level in
response to an above average year, or years, in
precipitation (Figs. 5, 6, 7) (Anderson 2001b), and
Fig. 11 Proposed depositional model for the Lake Elsinore
sand-climate proxy interpretation. Top panel is for a dry
climate scenario and bottom panel is for a wet climate scenario.
T1, T2, etc. represent times that correspond across both the
schematic lake level inset and the lake level lines. Importance
of the various depositional mechanisms is highlighted by font
size—larger font size = greater importance
832 J Paleolimnol (2010) 44:819–839
123
(3) the tendency for an asymmetry in the length of
time between above average and below average sand
content over the past 9,700 cal year BP (Fig. 7). It is
expected that this model is appropriate for other
shallow, arid-environment lakes, but inappropriate
for temperate, deep lakes with relatively stable lake
level, lake basins with a rapid depth change from the
littoral to the profundal environment, and/or small
catchment basins which lack a major inlet (Shuman
et al. 2009).
A 10,000-year PDO-related record of hydrologic
variability and regional comparisons
Figure 12 shows the 50-year binned sand data from
Lake Elsinore versus a variety of regional, terrestrial
paleoclimatic reconstructions. Based on the modern
(i.e. past 100 years) comparison between percent sand,
PDO, river discharge, and lake level, we interpret the
standardized sand values greater than zero as charac-
teristic of wetter-than-average climate, a generally
positive PDO index wherein storms track more
frequently across Southern California, higher regional
river discharge, and high average Lake Elsinore lake
level. Because we cannot create a PDO reconstruction
such as that inferred with tree rings, we use the term
PDO-related hydrologic variability. It is more realistic
to assume that our proxy is capturing a component of
the PDO-related system that characterizes North
Pacific climate and promotes more frequent storm
tracks across Southern California (Cayan and Peterson
1989; Brito-Castillo et al. 2003; Hanson et al. 2006).
To help assess the multi-decadal- to centennial-scale
PDO-related signal, we highlight packages of stan-
dardized sand with two or more above zero occur-
rences that are not separated by more than two below
zero occurrences or missing data (Fig. 12). Using
these criteria, nine intervals (defined as C150 years
[3 9 50 year BINS]) of sustained, wet climate are
recorded during the past 9,700 cal year BP: from
9,700 to 9,500, 9,100 to 8,850, 6,900 to 6,350, 4,550 to
4,100, 3,700 to 3,550, 3,350 to 3,200, 1,550 to 1,350,
1,200 to 1,050, and 600 to 150 calendar years before
present. These intervals range from 150 to 550 years in
duration. There is no apparent cyclicity or periodicity
within the binned wet interval data. The early
Holocene (9,700–8,850 cal year BP), mid-to-late
Holocene (4,800–3,200 cal year BP), and latest
Holocene (1,500–150 cal year BP) loosely define
three generally wet intervals, though gaps in data in
the latter two intervals make this claim less robust (i.e.
only part of the Medieval Warm Period is present
[800–600 cal year BP: no data from 1,050 to 800 cal
year BP] Fig. 12). It is possible that the purported
increase in summer precipitation in the early Holocene
in Southern California confounds (and conflates?) the
Elsinore sand proxy (Kirby et al. 2007; Bird et al.
2010). However, the early Holocene is not unusually
sandy in comparison to the other sand-rich intervals in
the Elsinore record. Moreover, as previously stated, it
is unlikely that summer precipitation outweighed
winter precipitation in terms of total annual hydrologic
budget at any time in the Holocene in southern
California. As a result, it is unlikely that summer
precipitation contributed significantly to river dis-
charge and sediment transport.
The age model for LEGC03-3 is supported by two
independently dated cores also from Lake Elsinore—
core LESS02-5 (Kirby et al. 2004) and LEGC03-4
(Fig. 1). As shown in Kirby et al. (2004), the lake edge
core LESS02-5 contains sedimentologic and isotopic
evidence for a high stand centered on ca. 3,400 cal
year BP and ca. 1,800 cal year BP, with a period of
inferred low lake level in between. The timing of this
high-low–high lake level cycle fits with the LEGC03-3
sand proxy, which shows a wet climate ca.
3,400–3,250, a dry climate from 3,250 to 1,850, and
brief return to a wet climate ca. 1,800 cal year BP
(Fig. 12). Core LEGC03-4 is from a slightly shallower
depth than LEGC03-3, though the depth difference
between the two cores has decreased over time
(0.90 m today vs. 3.80 m 8,900 cal year BP) due to
infilling. Mudcracks in core LEGC03-4 are bracketed
by dates of 3,260 and 1,710 cal year BP, indicating a
period of low level at the same time as that inferred
from the sand proxy in core LEGC03-3 (Fig. 12).
Together, three independently dated core stratigraph-
ies indicate a wet-dry-wet cycle ca. 3,400–1,700 cal
year BP, which lends support to our LEGC03-3 age
model, at least for the late Holocene.
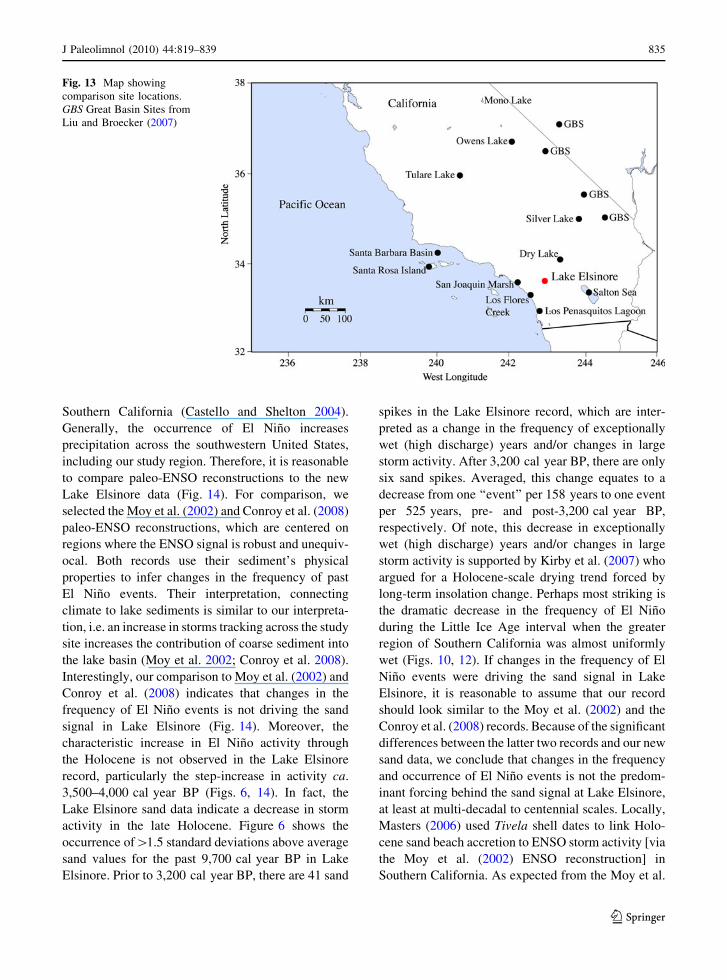
Figure 13 shows the location of other terrestrial
paleoclimate reconstructions from the greater region
of Southern California. The proxies used for these ten
reconstructions range from pollen to geochemistry to
sedimentology. A comparison between the new Lake
Elsinore PDO-related sand proxy and the ten regional
records reveals that six out of the nine Lake Elsinore
‘‘wet’’ intervals correspond across [50% of the
J Paleolimnol (2010) 44:819–839 833
123
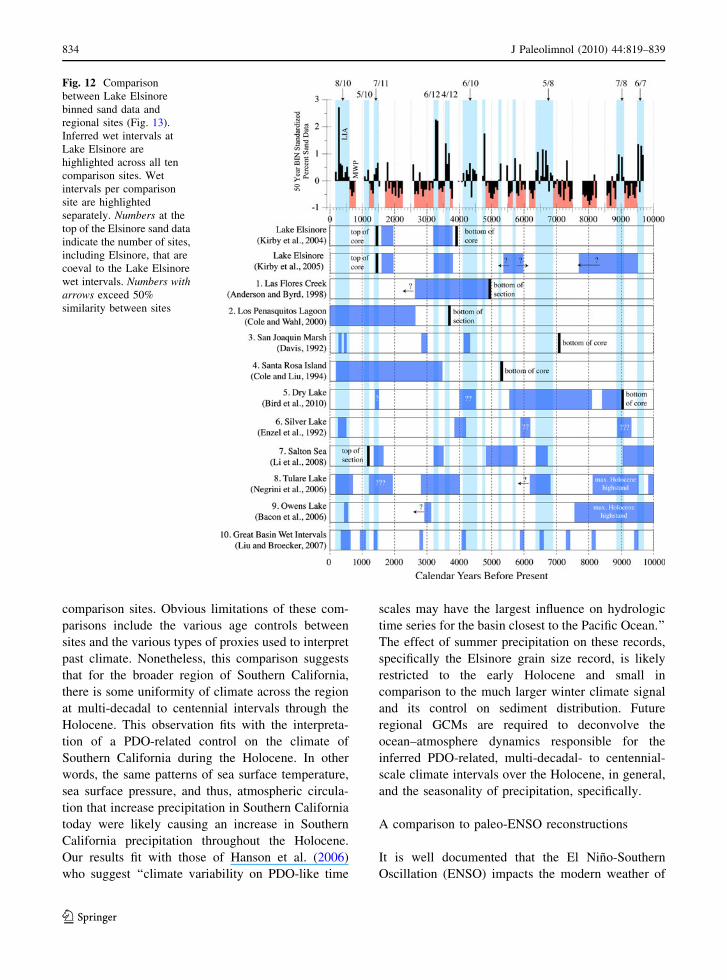
comparison sites. Obvious limitations of these com-
parisons include the various age controls between
sites and the various types of proxies used to interpret
past climate. Nonetheless, this comparison suggests
that for the broader region of Southern California,
there is some uniformity of climate across the region
at multi-decadal to centennial intervals through the
Holocene. This observation fits with the interpreta-
tion of a PDO-related control on the climate of
Southern California during the Holocene. In other
words, the same patterns of sea surface temperature,
sea surface pressure, and thus, atmospheric circula-
tion that increase precipitation in Southern California
today were likely causing an increase in Southern
California precipitation throughout the Holocene.
Our results fit with those of Hanson et al. (2006)
who suggest ‘‘climate variability on PDO-like time
scales may have the largest influence on hydrologic
time series for the basin closest to the Pacific Ocean.’’
The effect of summer precipitation on these records,
specifically the Elsinore grain size record, is likely
restricted to the early Holocene and small in
comparison to the much larger winter climate signal
and its control on sediment distribution. Future
regional GCMs are required to deconvolve the
ocean–atmosphere dynamics responsible for the
inferred PDO-related, multi-decadal- to centennial-
scale climate intervals over the Holocene, in general,
and the seasonality of precipitation, specifically.
A comparison to paleo-ENSO reconstructions
It is well documented that the El Nino-Southern
Oscillation (ENSO) impacts the modern weather of
Fig. 12 Comparison
between Lake Elsinore
binned sand data and
regional sites (Fig. 13).
Inferred wet intervals at
Lake Elsinore are
highlighted across all ten
comparison sites. Wet
intervals per comparison
site are highlighted
separately. Numbers at the
top of the Elsinore sand data
indicate the number of sites,
including Elsinore, that are
coeval to the Lake Elsinore
wet intervals. Numbers witharrows exceed 50%
similarity between sites
834 J Paleolimnol (2010) 44:819–839
123
Southern California (Castello and Shelton 2004).
Generally, the occurrence of El Nino increases
precipitation across the southwestern United States,
including our study region. Therefore, it is reasonable
to compare paleo-ENSO reconstructions to the new
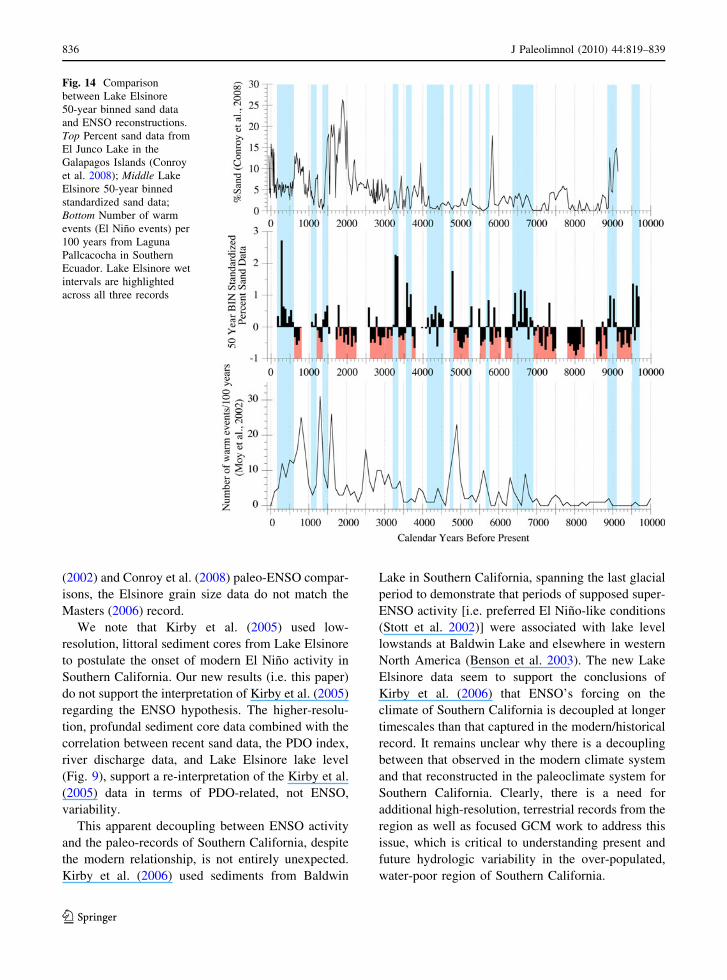
Lake Elsinore data (Fig. 14). For comparison, we
selected the Moy et al. (2002) and Conroy et al. (2008)
paleo-ENSO reconstructions, which are centered on
regions where the ENSO signal is robust and unequiv-
ocal. Both records use their sediment’s physical
properties to infer changes in the frequency of past
El Nino events. Their interpretation, connecting
climate to lake sediments is similar to our interpreta-
tion, i.e. an increase in storms tracking across the study
site increases the contribution of coarse sediment into
the lake basin (Moy et al. 2002; Conroy et al. 2008).
Interestingly, our comparison to Moy et al. (2002) and
Conroy et al. (2008) indicates that changes in the
frequency of El Nino events is not driving the sand
signal in Lake Elsinore (Fig. 14). Moreover, the
characteristic increase in El Nino activity through
the Holocene is not observed in the Lake Elsinore
record, particularly the step-increase in activity ca.
3,500–4,000 cal year BP (Figs. 6, 14). In fact, the
Lake Elsinore sand data indicate a decrease in storm
activity in the late Holocene. Figure 6 shows the
occurrence of[1.5 standard deviations above average
sand values for the past 9,700 cal year BP in Lake
Elsinore. Prior to 3,200 cal year BP, there are 41 sand
spikes in the Lake Elsinore record, which are inter-
preted as a change in the frequency of exceptionally
wet (high discharge) years and/or changes in large
storm activity. After 3,200 cal year BP, there are only
six sand spikes. Averaged, this change equates to a
decrease from one ‘‘event’’ per 158 years to one event
per 525 years, pre- and post-3,200 cal year BP,
respectively. Of note, this decrease in exceptionally
wet (high discharge) years and/or changes in large
storm activity is supported by Kirby et al. (2007) who
argued for a Holocene-scale drying trend forced by
long-term insolation change. Perhaps most striking is
the dramatic decrease in the frequency of El Nino
during the Little Ice Age interval when the greater
region of Southern California was almost uniformly
wet (Figs. 10, 12). If changes in the frequency of El
Nino events were driving the sand signal in Lake
Elsinore, it is reasonable to assume that our record
should look similar to the Moy et al. (2002) and the
Conroy et al. (2008) records. Because of the significant
differences between the latter two records and our new
sand data, we conclude that changes in the frequency
and occurrence of El Nino events is not the predom-
inant forcing behind the sand signal at Lake Elsinore,
at least at multi-decadal to centennial scales. Locally,
Masters (2006) used Tivela shell dates to link Holo-
cene sand beach accretion to ENSO storm activity [via
the Moy et al. (2002) ENSO reconstruction] in
Southern California. As expected from the Moy et al.
Fig. 13 Map showing
comparison site locations.
GBS Great Basin Sites from
Liu and Broecker (2007)
J Paleolimnol (2010) 44:819–839 835
123
(2002) and Conroy et al. (2008) paleo-ENSO compar-
isons, the Elsinore grain size data do not match the
Masters (2006) record.
We note that Kirby et al. (2005) used low-
resolution, littoral sediment cores from Lake Elsinore
to postulate the onset of modern El Nino activity in
Southern California. Our new results (i.e. this paper)
do not support the interpretation of Kirby et al. (2005)
regarding the ENSO hypothesis. The higher-resolu-
tion, profundal sediment core data combined with the
correlation between recent sand data, the PDO index,
river discharge data, and Lake Elsinore lake level
(Fig. 9), support a re-interpretation of the Kirby et al.
(2005) data in terms of PDO-related, not ENSO,
variability.
This apparent decoupling between ENSO activity
and the paleo-records of Southern California, despite
the modern relationship, is not entirely unexpected.
Kirby et al. (2006) used sediments from Baldwin
Lake in Southern California, spanning the last glacial
period to demonstrate that periods of supposed super-
ENSO activity [i.e. preferred El Nino-like conditions
(Stott et al. 2002)] were associated with lake level
lowstands at Baldwin Lake and elsewhere in western
North America (Benson et al. 2003). The new Lake
Elsinore data seem to support the conclusions of
Kirby et al. (2006) that ENSO’s forcing on the
climate of Southern California is decoupled at longer
timescales than that captured in the modern/historical
record. It remains unclear why there is a decoupling
between that observed in the modern climate system
and that reconstructed in the paleoclimate system for
Southern California. Clearly, there is a need for
additional high-resolution, terrestrial records from the
region as well as focused GCM work to address this
issue, which is critical to understanding present and
future hydrologic variability in the over-populated,
water-poor region of Southern California.
Fig. 14 Comparison
between Lake Elsinore
50-year binned sand data
and ENSO reconstructions.
Top Percent sand data from
El Junco Lake in the
Galapagos Islands (Conroy
et al. 2008); Middle Lake
Elsinore 50-year binned
standardized sand data;
Bottom Number of warm
events (El Nino events) per
100 years from Laguna
Pallcacocha in Southern
Ecuador. Lake Elsinore wet
intervals are highlighted
across all three records
836 J Paleolimnol (2010) 44:819–839
123
Conclusions
New 1-cm contiguous grain size data from core
LEGC03-3 provide new insights into Holocene multi-
decadal- to centennial-scale climate variability. Our
conclusions are summarized below:
1. Percent sand, especially very fine sand, shows a
strong correlation with twentieth century PDO
variability, Lake Elsinore lake level, and San
Jacinto River discharge. Consequently, we used
percent total sand as a qualitative proxy for PDO-
related hydrologic variability over the past
9,700 cal year BP.
2. As an independent assessment of our Lake
Elsinore PDO-related sand proxy, we compared
our sand data to the MacDonald and Case (2005),
1,000-year PDO reconstruction. The comparison
reveals excellent correlations at decadal to multi-
decadal time scales, with the exception of the
LIA. The MacDonald and Case (2005) PDO
reconstruction is weakly negative (cold PDO
phase) during the peak stage of the LIA. The
Elsinore PDO-related sand proxy indicates a wet
climate during the peak stage of the LIA, which
is supported by other evidence across western
North America.
3. A depositional model is proposed to explain the
coarse (fine), wet (dry) relationship observed in
the twentieth century Lake Elsinore proxy cali-
bration. The model focuses on the impact of the
asymmetrical lake level changes characteristic of
arid-environment lakes (i.e. rapid transgressions
vs. slow regressions) on sediment depositional
processes.
4. Using the PDO-related sand proxy, nine intervals
of sustained wet climate are recorded during the
past 9,700 cal year BP: from 9,700 to 9,500,
9,100 to 8,850, 6,900 to 6,350, 4,550 to 4,100,
3,700 to 3,550, 3,350 to 3,200, 1,550 to 1,350,
1,200 to 1,050, and 600 to 150 calendar years
before present (cal year BP). A comparison
between the new Lake Elsinore PDO-related
sand proxy and the ten regional records reveals
that six out of the nine Lake Elsinore ‘‘wet’’
intervals correspond across [50% of the com-
parison sites. This comparison suggests that for
the broader region of Southern California, there
is some uniformity of climate across the region at
multi-decadal to centennial intervals through the
Holocene.
5. A comparison to two well known ENSO recon-
structions (Moy et al. 2002; Conroy et al. 2008)
shows almost no relationship between increased
frequency or occurrence of El Nino over the
Holocene despite the well documented impact of
ENSO variability in the modern Southern California
climate system. Future regional GCMs are required
to explain this observation for both the lack of an
ENSO signal and the presence of a PDO signal.
6. The lack of a strong ENSO signal coupled with
the presence of a strong PDO signal over the past
9,700 cal year BP suggests that future predictive
models should focus on the PDO for predicting
decadal-scale hydrologic variability in the over-
populated, water-poor region of Southern
California.
Acknowledgements This research was funded by the
National Science Foundation (EAR-0602269-01) to MEK and
SPL. Additional funds were provided by a Lake Elsinore-San
Jacinto Water Authority (LESJWA) contract to MEK and
MAA and the American Chemical Society-Petroleum Research
Fund (ACS-PRF: Grant #41789-GB8) to MEK. Funds from
Cal-State Fullerton Faculty-Student Creative Research Grants
provided summer stipends for several students. Special thanks
to the City of Lake Elsinore, particularly Mr. Patrick Kilroy
(Lake Manager) for access to the lake; Mr. David Ruhl
(LESJWA) for contract management; Gregg Drilling and
Testing, Inc. for exceptional quality service; Drs. John Southon
and Guaciara dos Santos (Univ. of Cal. Irvine) for radiocarbon
dating; Dr. James Noblet (CSUSB) and his students for modern
limnological data; and Ms. Jennifer Schmidt for careful lab
analyses. Excellent reviews by two anonymous referees helped
improve the paper’s content and clarity.
Open Access This article is distributed under the terms of the
Creative Commons Attribution Noncommercial License which
permits any noncommercial use, distribution, and reproduction
in any medium, provided the original author(s) and source are
credited.
References
Adams DK, Comrie AC (1997) The North American monsoon.
Bull Am Met Soc 78:2197–2213
Allen SM, Smith DJ (2007) Late Holocene glacial activity of
Bridge Glacier, British Columbia Coast Mountains. Can J
Ear Sci 44:1753–1773
Anderson RY (1977) Short-term sedimentation response in
lakes in western United States as measured by automated
sampling. Limnol Oceanogr 22:423–433
J Paleolimnol (2010) 44:819–839 837
123
Anderson MA (2001a) Internal loading and nutrient cycling in
Lake Elsinore. Santa Ana Regional Water Quality Control
Board, Lake Elsinore, p 52
Anderson RY (2001b) Rapid changes in Late Pleistocene
precipitation and stream discharge determined from
medium- and coarse-grained sediment in saline lakes.
Glob Plan Chan 28:73–83
Anderson RS, Byrd BF (1998) Late-Holocene vegetation
changes from the Las Flores Creek coastal lowlands, San
Diego County, California. Madrono 45:171–182
Bacon SN, Burke RM, Pezzopane SK, Jayko AS (2006) Last
glacial maximum and Holocene lake levels of Owens
Lake, eastern California, USA. Quat Sci Rev 25:
1264–1282
Barnett TP, Pierce DW, Hidalgo HG, Bonfils C, Santer BD,
Das T, Bala G, Wood AW, Nozawa T, Mirin AA, Cayan
DR, Dettinger MD (2008) Human-induced changes in the
hydrology of the western United States. Science
319:1080–1083
Benson LV, Meyers PA, Spencer RJ (1991) Change in the size
of Walker Lake during the past 5000 years. Palaeogeogr
Palaeoclimatol Palaeoecol 81:189–214
Benson L, Lund S, Negrini R, Linsley B, Zic M (2003)
Response of North America Great Basin Lakes to
Dansgaard-Oeschger oscillations. Quat Sci Rev
22:2239–2251
Berry WL, MacRostie W, Sabiston DW (1953) Elsinore Basin
investigation. State Water Resources Board, Sacramento,
p 105
Beuhler M (2003) Potential impacts of global warming on
water resources in southern California. Water Sci Technol
47:165–168
Bird BW, Kirby ME, Howat IM, Tulaczyk S (2010) Geo-
physical evidence for Holocene lake-level change in
southern California (Dry Lake). Boreas 39:131–144
Brito-Castillo L, Douglas AV, Leyva-Contreras A, Lluch-
Belda D (2003) The effect of large-scale circulation on
precipitation and streamflow in the Gulf of California
continental watershed. Int J Clim 23:751–768
Castello AF, Shelton ML (2004) Winter precipitation on the
US Pacific coast and El Nino-Southern Oscillation events.
Int J Clim 24:481–497
Cayan DR, Peterson DH (1989) The influence of North Pacific
atmospheric circulation on streamflow in the west in
aspects of climate variability in the Pacific and the wes-
tern Americas. In: AGU (ed) Geophysical monograph
series, American Geophysical Union, Washington,
pp 375–397
CDWR (2005) California Water Plan Update 2005
Cole KL, Liu GW (1994) Holocene paleoecology of an estuary
on Santa Rosa Island, California. Quat Res 41:326–335
Cole KL, Wahl E (2000) A late Holocene paleoecological
record from Torrey Pines State Reserve, California. Quat
Res 53:341–351
Collins DBG, Bras RL (2008) Climatic control of sediment
yield in dry lands following climate and land cover
change. Water Resour Res 44:W10405
Conroy JL, Overpeck JT, Cole JE, Shanahan TM, Steinitz-
Kannan M (2008) Holocene changes in eastern tropical
Pacific climate inferred from a Galapagos lake sediment
record. Quat Sci Rev 27:1166–1180
Davis OK (1992) Rapid climatic change in coastal southern
California inferred from pollen analysis of San Joaquin
Marsh. Quat Res 37:89–100
Davis MB, Ford MS (1982) Sediment focusing in Mirror Lake,
New Hampshire. Limnol Oceanogr 27:137–150
Dearing JA (1991) Lake sediment records of erosional pro-
cesses. Hydrobiologia 214:99–106
Enzel Y, Brown WJ, Anderson RY, McFadden LD, Wells SG
(1992) Short-duration Holocene lakes in the Mojave River
drainage basin, Southern California. Quat Res 38:60–73
Fisler J, Hendy IL (2008) California current system response to
late Holocene climate cooling in southern California. Geo
Res Lett 35:L09702. doi:10.1029/2008GL033902
Hanson R, Dettinger M, Newhouse M (2006) Relations
between climatic variability and hydrologic time series
from four alluvial basins across the southwestern United
States. Hyd J 14:1122–1146
Hull AG (1990) Seismotectonics of the Elsinore-Temecula
Trough, Elsinore Fault Zone, Southern California. Geo-
logical Sciences. UC Santa Barbara, Santa Barbara, p 233
Hunt B (2008) Secular variation of the Pacific Decadal
Oscillation, the North Pacific Oscillation and climatic
jumps in a multi-millennial simulation. Clim Dyn
30:467–483
Hunt AG, Wu JQ (2004) Climatic influences on Holocene
variations in soil erosion rates on a small hill in the Mo-
jave Desert. Geomorphology 58:263–289
Inman DL, Jenkins SA (1999) Climate change and the epis-
odicity of sediment flux of small California Rivers. J Geo
107:251–270
Kirby ME, Poulsen CJ, Lund SP, Patterson WP, Reidy L,
Hammond DE (2004) Late Holocene lake-level dynamics
inferred from magnetic susceptibility and stable oxygen
isotope data: Lake Elsinore, Southern California (USA).
J Paleolimnol 31:275–293
Kirby ME, Lund SP, Poulsen CJ (2005) Hydrologic variability
and the onset of modern El Nino-Southern Oscillation: a
19 250-year record from Lake Elsinore, southern Cali-
fornia. J Quat Sci 20:239–254
Kirby ME, Lund SP, Bird BW (2006) Mid-Wisconsin sediment
record from Baldwin Lake reveals hemispheric climate
dynamics (Southern CA, USA). Palaeogeogr Palaeocli-
matol Palaeoecol 241:267–283
Kirby M, Lund S, Anderson M, Bird B (2007) Insolation
forcing of Holocene climate change in Southern Califor-
nia: a sediment study from Lake Elsinore. J Paleolimnol
38:395–417
Li HC, Stott LD, Bischoff JL, Ku T-L, Lund SP (2000) Climate
variability in East-Central California during the past
1000 years reflected by high-resolution geochemical and
isotopic records from Owens Lake sediments. Quat Res
54:189–197
Li HC, Xu XM, Ku TL, You CF, Buchheim HP, Peters R
(2008) Isotopic and geochemical evidence of palaeocli-
mate changes in Salton Basin, California, during the past
20 kyr: 1. [delta]18O and [delta]13C records in lake tufa
deposits. Palaeogeogr Palaeoclimatol Palaeoecol
259:182–197
Liu T, Broecker WS (2007) Holocene rock varnish micro-
stratigraphy and its chronometric application in the dry-
lands of western USA. Geomorphology 84:1–21
838 J Paleolimnol (2010) 44:819–839
123
Macdonald GM, Case RA (2005) Variations in the Pacific
Decadal Oscillation over the past millennium. Geo Res
Lett 32:L08703. doi:10.1029/2005GL022478
Malvern Instruments (1999) Operators guide. Malvern Instru-
ments, Worcestershire
Mann DH, Meltzer DJ (2007) Millennial-scale dynamics of
valley fills over the past 12, 000 14C yr in northeastern
New Mexico, USA. Geo Soc Am Bull 119:1433–1448
Mantua NJ, Francis RC, Hare SR, Zhang Y, Wallace JM
(1997) A Pacific interdecadal climate oscillation with
impacts on salmon production. Bull Am Met Soc
78:1069–1079
Masters PM (2006) Holocene sand beaches of southern Cali-
fornia: ENSO forcing and coastal processes on millennial
scales. Palaeogeogr Palaeoclimatol Palaeoecol 232:73–95
Matthews JA, Briffa KR (2005) The ‘Little Ice Age’:
re-evaluation of an evolving concept. Geo Ann Series A
Phy Geo 87:17–36
Mensing S, Byrne R (1998) Pre-mission invasion of Erodiumcicutarium in California. J Biogeogr 25:757–762
Moy CM, Seltzer GO, Rodbell DT, Anderson DM (2002)
Variability of El Nino/Southern Oscillation activity at
millennial timescales during the Holocene epoch. Nature
420:162–165
Negrini RM, Wigand PE, Draucker S, Gobalet K, Gardner JK,
Sutton MQ, YoheIi RM (2006) The Rambla highstand
shoreline and the Holocene lake-level history of Tulare
Lake, California, USA. Quat Sci Rev 25:1599–1618
Parris A, Bierman P, Noren A, Prins M, Lini A (2010) Holo-
cene paleostorms identified by particle size signatures in
lake sediments from the northeastern United States. J Pa-
leolimnol 43:29–49
Retelle MJ, Child JK (1996) Suspended sediment transport and
deposition in a high arctic meromictic lake. J Paleolimnol
16:151–167
Schimmelmann A, Zhao M, Harvey CC, Lange CB (1998) A
large California flood and correlative global climatic
events 400 years ago. Quat Res 49:51–61
Seager R, Ting M, Held I, Kushnir Y, Lu J, Vecchi G, Huang
HP, Harnik N, Leetmaa A, Lau NC, Li C, Velez J, Naik N
(2007) Model projections of an imminent transition to a
more arid climate in Southwestern North America. Sci-
ence 316:1181–1184
Shuman B, Henderson AK, Colman SM, Stone JR, Fritz SC,
Stevens LR, Power MJ, Whitlock C (2009) Holocene
lake-level trends in the Rocky Mountains. U.S.A. Quat Sci
Rev 28:1861–1879
Stine S (1990) Late Holocene fluctuations of Mono Lake,
eastern California. Palaeogeogr Palaeoclimatol Palaeoecol
78:333–381
Stott L, Poulsen C, Lund S, Thunell R (2002) Super ENSO and
global climate oscillations at millennial time scales.
Science 297:222–226
Stuiver M, Reimer PJ (1993) Extended 14C database and
revised CALIB radiocarbon calibration program. Radio-
carbon 35:215–230
Swartz R, Hauge C (2003) California groundwater-2003 update,
CA Department Water Resources, Bulletin 118, p 246
Trenberth KB, Hurrell JW (1994) Decadal atmosphere-ocean
variations in the Pacific. Clim Dyn 9:303–319
Tubbs AM (1972) Summer thunderstorms over Southern
California. Mon Wea Rev 100:799–807
Williams J (2005) Background: California’s tropical storms.
USA Today, Los Angeles
Wise EK (2010) Spatiotemporal variability of the precipitation
dipole transition zone in the western United States. Geo
Res Lett 37:L07706
Yair A, Kossovsky A (2002) Climate and surface properties:
hydrological response of small arid and semi-arid water-
sheds. Geomorphology 42:43–57
J Paleolimnol (2010) 44:819–839 839
123
Related Documents
![Modulation of Rossby waves on the Pacific North Equatorial ... · Zhai et al. [2013] emphasized the NEC transport at 137 E correlated well with Pacific Decadal Oscillation (PDO)](https://static.cupdf.com/doc/110x72/5f0fd9797e708231d44630f5/modulation-of-rossby-waves-on-the-pacific-north-equatorial-zhai-et-al-2013.jpg)