BioMed Central Page 1 of 13 (page number not for citation purposes) BMC Bioinformatics Open Access Methodology article A high-throughput pipeline for designing microarray-based pathogen diagnostic assays Ravi Vijaya Satya, Nela Zavaljevski, Kamal Kumar and Jaques Reifman* Address: Biotechnology HPC Software Applications Institute, Telemedicine and Advanced Technology Research Center, US Army Medical Research and Materiel Command, Fort Detrick, MD 21702, USA Email: Ravi Vijaya Satya - [email protected]; Nela Zavaljevski - [email protected]; Kamal Kumar - [email protected]; Jaques Reifman* - [email protected] * Corresponding author Abstract Background: We present a methodology for high-throughput design of oligonucleotide fingerprints for microarray-based pathogen diagnostic assays. The oligonucleotide fingerprints, or DNA microarray probes, are designed for identifying target organisms in environmental or clinical samples. The design process is implemented in a high-performance computing software pipeline that incorporates major algorithmic improvements over a previous version to both reduce computation time and improve specificity assessment. Results: The algorithmic improvements result in significant reduction in runtimes, with the updated pipeline being nearly up to five-times faster than the previous version. The improvements in specificity assessment, based on multiple specificity criteria, result in robust and consistent evaluation of cross-hybridization with nontarget sequences. In addition, the multiple criteria provide finer control on the number of resulting fingerprints, which helps in obtaining a larger number of fingerprints with high specificity. Simulation tests for Francisella tularensis and Yersinia pestis, using a well-established hybridization model to estimate cross-hybridization with nontarget sequences, show that the improved specificity criteria yield a larger number of fingerprints as compared to using a single specificity criterion. Conclusion: The faster runtimes, achieved as the result of algorithmic improvements, are critical for extending the pipeline to process multiple target genomes. The larger numbers of identified fingerprints, obtained by considering broader specificity criteria, are essential for designing probes for hard-to-distinguish target sequences. Background Recent developments in technology have led to the sequencing of many eukaryotic and prokaryotic organ- isms. Availability of these genomic sequences unlocked opportunities for the development of whole-genome- based diagnostic assays, such as DNA microarrays and polymerase chain reaction (PCR) assays, which offer higher specificity than traditional methods based on a sin- gle gene or protein [1]. Because of their simplicity and effi- ciency, these assays are increasingly being used for various applications in medicine, environmental monitoring, and biodefense. The popularity of these assays, in turn, trig- gered the development of different computational tools for sequence-based signature design [1-4]. Published: 10 April 2008 BMC Bioinformatics 2008, 9:185 doi:10.1186/1471-2105-9-185 Received: 21 November 2007 Accepted: 10 April 2008 This article is available from: http://www.biomedcentral.com/1471-2105/9/185 © 2008 Satya et al; licensee BioMed Central Ltd. This is an Open Access article distributed under the terms of the Creative Commons Attribution License (http://creativecommons.org/licenses/by/2.0 ), which permits unrestricted use, distribution, and reproduction in any medium, provided the original work is properly cited.

Welcome message from author
This document is posted to help you gain knowledge. Please leave a comment to let me know what you think about it! Share it to your friends and learn new things together.
Transcript
BioMed CentralBMC Bioinformatics
ss
Open AcceMethodology articleA high-throughput pipeline for designing microarray-based pathogen diagnostic assaysRavi Vijaya Satya, Nela Zavaljevski, Kamal Kumar and Jaques Reifman*Address: Biotechnology HPC Software Applications Institute, Telemedicine and Advanced Technology Research Center, US Army Medical Research and Materiel Command, Fort Detrick, MD 21702, USA
Email: Ravi Vijaya Satya - [email protected]; Nela Zavaljevski - [email protected]; Kamal Kumar - [email protected]; Jaques Reifman* - [email protected]
* Corresponding author
AbstractBackground: We present a methodology for high-throughput design of oligonucleotidefingerprints for microarray-based pathogen diagnostic assays. The oligonucleotide fingerprints, orDNA microarray probes, are designed for identifying target organisms in environmental or clinicalsamples. The design process is implemented in a high-performance computing software pipelinethat incorporates major algorithmic improvements over a previous version to both reducecomputation time and improve specificity assessment.
Results: The algorithmic improvements result in significant reduction in runtimes, with theupdated pipeline being nearly up to five-times faster than the previous version. The improvementsin specificity assessment, based on multiple specificity criteria, result in robust and consistentevaluation of cross-hybridization with nontarget sequences. In addition, the multiple criteriaprovide finer control on the number of resulting fingerprints, which helps in obtaining a largernumber of fingerprints with high specificity. Simulation tests for Francisella tularensis and Yersiniapestis, using a well-established hybridization model to estimate cross-hybridization with nontargetsequences, show that the improved specificity criteria yield a larger number of fingerprints ascompared to using a single specificity criterion.
Conclusion: The faster runtimes, achieved as the result of algorithmic improvements, are criticalfor extending the pipeline to process multiple target genomes. The larger numbers of identifiedfingerprints, obtained by considering broader specificity criteria, are essential for designing probesfor hard-to-distinguish target sequences.
BackgroundRecent developments in technology have led to thesequencing of many eukaryotic and prokaryotic organ-isms. Availability of these genomic sequences unlockedopportunities for the development of whole-genome-based diagnostic assays, such as DNA microarrays andpolymerase chain reaction (PCR) assays, which offer
higher specificity than traditional methods based on a sin-gle gene or protein [1]. Because of their simplicity and effi-ciency, these assays are increasingly being used for variousapplications in medicine, environmental monitoring, andbiodefense. The popularity of these assays, in turn, trig-gered the development of different computational toolsfor sequence-based signature design [1-4].
Published: 10 April 2008
BMC Bioinformatics 2008, 9:185 doi:10.1186/1471-2105-9-185
Received: 21 November 2007Accepted: 10 April 2008
This article is available from: http://www.biomedcentral.com/1471-2105/9/185
© 2008 Satya et al; licensee BioMed Central Ltd. This is an Open Access article distributed under the terms of the Creative Commons Attribution License (http://creativecommons.org/licenses/by/2.0), which permits unrestricted use, distribution, and reproduction in any medium, provided the original work is properly cited.
Page 1 of 13(page number not for citation purposes)
BMC Bioinformatics 2008, 9:185 http://www.biomedcentral.com/1471-2105/9/185
Microarray-based pathogen diagnostic assays are gainingpopularity due to their ability to test for hundreds, or eventhousands, of pathogens in a single diagnostic test [5].Wilson et al. [6] used 50-thousand 20 mer overlappingoligonucleotides to detect 18 pathogens, Wang et al. [7]reported using a microarray with 11-thousand 70 mer oli-gonucleotides that can identify 954 distinct viruses, whilePalacios et al. [8] designed a panmicrobial microarraycomprising nearly 30-thousand 60 mer probes. Currenttechnology for custom microarray design enables up to385000 oligonucleotides per slide, while arrays with 2.1million probes are available for other high-throughputapplications, such as comparative genome hybridization[9]. The ability to simultaneously screen against a widerange of targets is essential for detecting biological threatagents in environmental samples, where there may be noprior knowledge about the specific pathogens likely to bepresent in the sample.
In terms of the computational problems, the design ofmicroarray probes for pathogen identification is funda-mentally different from the design of microarray probesfor gene expression analysis. An oligonucleotide probedesigned for monitoring the expression of a gene shouldhybridize only to the mRNA of the corresponding gene,and should not have any significant cross-hybridizationwith other mRNAs from the same organism. Because allsequences involved are gene transcripts of a single organ-ism, the combined length of the sequences is typically, atmost, a few megabases. The problem, though computa-tionally intensive, can be handled by a single processor inless than an hour [10]. Many efficient computationaltools have been developed for designing microarrayprobes for gene expression analysis [10-15].
In contrast, oligonucleotide probes designed for pathogendiagnostic assays should hybridize only with the intendedtarget and should not have any significant cross-hybridi-zation with any nontarget genome. This necessitates thecomparison of each candidate probe against every availa-ble sequenced nontarget genome. To date, the combinedsize of the nucleotide sequences in the National Center forBiotechnology Information (NCBI) nt database is greaterthan 21 gigabases and is bound to grow exponentially asmore and more genomes are sequenced. The amount ofsequence data that need to be analyzed for each targetpathogen is also increasing due to multiple strains ofmany pathogens being sequenced. Therefore, the sheermagnitude of the search space necessitates efficient high-throughput algorithms that both quickly scan largegenomic databases and reduce the space to a small set ofunique regions in the target genome.
In this paper, we present a software tool for identifyingoligonucleotide fingerprints for microarray-based patho-
gen diagnostic assays. The software, named Tool for Oli-gonucleotide Fingerprint Identification (TOFI), is anintegrated, scalable, high-performance-computing pipe-line that combines genome comparison tools, probedesign software, and sequence alignment programs inorder to design highly specific microarray probes for agiven target pathogen (i.e., one complete genomicsequence). This pipeline (henceforth referred to as TOFI-beta), is an improvement over an earlier version of thepipeline (TOFI-alpha), presented by Tembe et al. [4].TOFI-beta incorporates several optimizations andenhancements that significantly reduce the overall execu-tion time of the pipeline, opening up possibilities forfuture extension of the system to design fingerprints com-mon to a group of targets. In addition, TOFI-beta usesnew, multiple criteria for estimating probe specificity,which, for any given genome, results in a considerableincrease in the number of identified in silico fingerprintswithout increase in the (expected) false-positive rate. Thisis particularly important in cases where the targetsequence is a close match to other sequences, where thelarger number of in silico fingerprints increases the chanceof identification of true fingerprints.
Existing methods for design of pathogen diagnostic assaysOne method to design probes is to select regions of thepathogen genome that are known to be associated withspecific functions. For example, specific genes of bacterialgenomes, such as the 16S rRNA gene [16], virulence genes[17], and antibiotic resistance genes [18], have all beenused to design microarray probes for species-level diag-nostics.
Another method to design probes is to employ the wholegenome of the pathogen. A few software tools/algorithmshave been proposed to guide the design of whole-genome-based pathogen diagnostic assays [1-4,11-14].Some of these tools are intended for microarray-basedassays [2,4,11-14], whereas others are intended for PCR-based assays [1,3]. Most of these tools, however, do nothave the capability of testing for specificity against a largenumber of nontarget genomes; they are based on theassumption that the signatures need only be unique withrespect to the host or a small set of nontarget sequences.For instance, Kaderali and Schliep [2] developed an algo-rithm that analyzes a set of input target sequences anddesigns a single probe for each target, with the probebeing unique with respect to all other input sequences.The uniqueness of the probe is determined by construct-ing a generalized suffix tree for all the input targetsequences. The method presented by Putonti et al. [19]designs probes that are unique with respect to a hostorganism. Both of these approaches are clearly not ade-quate if the signatures are to identify pathogens from envi-ronmental samples containing a multitude of nontarget
Page 2 of 13(page number not for citation purposes)
BMC Bioinformatics 2008, 9:185 http://www.biomedcentral.com/1471-2105/9/185
organisms. Because, in general, there is no prior knowl-edge of the contaminants in a sample, the signatures haveto be unique with respect to all known nontargetsequences.
The KPATH pipeline for PCR assays [1] is the seminal soft-ware that introduced the concept of in silico comparisonagainst all known nontarget sequences. Insignia [3] isanother tool for designing PCR assays. Unlike the currentversion of TOFI, which designs fingerprints for a singlegenome, both KPATH and Insignia have the ability todesign fingerprints that are common to multiple targetgenomes. To our knowledge, KPATH and Insignia are theonly tools other than TOFI [4] that have the provision forin silico sequence-based testing for specificity against mul-tiple nontarget genomes.
Neither KPATH nor Insignia is applicable for designingmicroarray fingerprints, as the design and specificityrequirements of microarray fingerprints are quite differentfrom those of PCR signatures. For example, the most com-monly used PCR signatures consist of a probe and twoprimers, which, due to their short length [18–25 basepairs (bp)] and constraints on the inter-primer distance,can tolerate inexact matches with nontarget sequenceswithout much degradation in specificity. Conversely, inaddition to being characterized by only one DNA segmentwith no spacing constraints, microarray probes are gener-ally longer and more susceptible to cross-hybridizationeven in the absence of an exact match [20]. This requiresmore extensive searches, for both exact and inexactmatches, against nontarget sequences to identify highlyspecific fingerprints for microarrays.
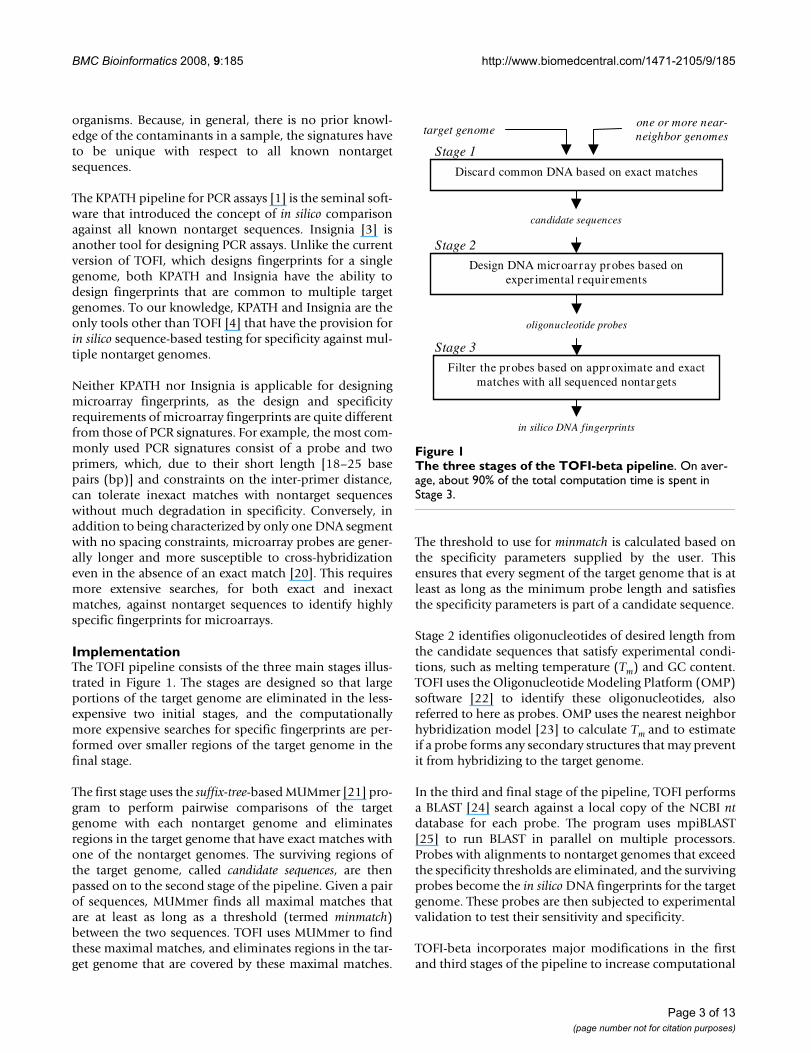
ImplementationThe TOFI pipeline consists of the three main stages illus-trated in Figure 1. The stages are designed so that largeportions of the target genome are eliminated in the less-expensive two initial stages, and the computationallymore expensive searches for specific fingerprints are per-formed over smaller regions of the target genome in thefinal stage.
The first stage uses the suffix-tree-based MUMmer [21] pro-gram to perform pairwise comparisons of the targetgenome with each nontarget genome and eliminatesregions in the target genome that have exact matches withone of the nontarget genomes. The surviving regions ofthe target genome, called candidate sequences, are thenpassed on to the second stage of the pipeline. Given a pairof sequences, MUMmer finds all maximal matches thatare at least as long as a threshold (termed minmatch)between the two sequences. TOFI uses MUMmer to findthese maximal matches, and eliminates regions in the tar-get genome that are covered by these maximal matches.
The threshold to use for minmatch is calculated based onthe specificity parameters supplied by the user. Thisensures that every segment of the target genome that is atleast as long as the minimum probe length and satisfiesthe specificity parameters is part of a candidate sequence.
Stage 2 identifies oligonucleotides of desired length fromthe candidate sequences that satisfy experimental condi-tions, such as melting temperature (Tm) and GC content.TOFI uses the Oligonucleotide Modeling Platform (OMP)software [22] to identify these oligonucleotides, alsoreferred to here as probes. OMP uses the nearest neighborhybridization model [23] to calculate Tm and to estimateif a probe forms any secondary structures that may preventit from hybridizing to the target genome.
In the third and final stage of the pipeline, TOFI performsa BLAST [24] search against a local copy of the NCBI ntdatabase for each probe. The program uses mpiBLAST[25] to run BLAST in parallel on multiple processors.Probes with alignments to nontarget genomes that exceedthe specificity thresholds are eliminated, and the survivingprobes become the in silico DNA fingerprints for the targetgenome. These probes are then subjected to experimentalvalidation to test their sensitivity and specificity.
TOFI-beta incorporates major modifications in the firstand third stages of the pipeline to increase computational
The three stages of the TOFI-beta pipelineFigure 1The three stages of the TOFI-beta pipeline. On aver-age, about 90% of the total computation time is spent in Stage 3.
Filter the probes based on approximate and exact matches with all sequenced nontargets
Design DNA microar ray probes based on exper imental requirements
Discard common DNA based on exact matches
one or more near-neighbor genomes target genome
candidate sequences
Stage 1
oligonucleotide probes
in silico DNA fingerprints
Stage 2
Stage 3
Page 3 of 13(page number not for citation purposes)
BMC Bioinformatics 2008, 9:185 http://www.biomedcentral.com/1471-2105/9/185
speed and enhance the specificity assessment of the fin-gerprints. In the following, we compare TOFI-beta andTOFI-alpha and describe these improvements.
Improvements in Stage 1
In Stage 1, the major improvement in TOFI-beta overTOFI-alpha is the comparison of the target against multiplenontarget genomes for finding exact matches. TOFI-alphaonly allows for comparison against a single nontargetsequence. Comparison against a single genome is effectivein eliminating a large portion of the target genome whena closely-related, nontarget near-neighbor genomesequence is available. However, when such a nontargetsequence is not available, too many candidate sequencesare passed on to the later stages of the pipeline, which arecomputationally more expensive. Even when a closely-related, nontarget near-neighbor is available, compari-sons against additional nontarget genomes is advanta-geous. As Stage 1 is relatively inexpensive, the additionaltime spent in this stage is offset by the much larger reduc-tion in computation time in the later steps, yielding a veryfavorable trade-off in overall runtime. Potentially, the tar-get genome could be compared with all nontargetsequences in the entire nt database.
As described by Tembe et al. [4], sequence comparisonsfor exact matches in Stage 1 are performed using the nuc-mer module in MUMmer. Some modifications wererequired in TOFI-beta, however, to avoid some perform-ance issues when using a large database of nontargetsequences. Since the larger databases are too big forMUMmer, they are split into smaller databases and thetarget sequence is compared for exact matches against thesmaller databases. This procedure is parallelized in TOFI-beta so that the target sequence is compared against a dif-ferent set of nontarget sequences at each processor. Theresults are then assembled and processed so that onlyunique regions of the target genome are passed on to thenext stage.
Improvements in Stage 3In Stage 3, each probe that is generated in Stage 2 isscreened for cross-hybridization against all available non-target genome sequences in the nt database using BLAST[24]. Stage 3 is, by far, the most computationally expen-sive stage, which takes about 99% of the total runtime ofTOFI-alpha.
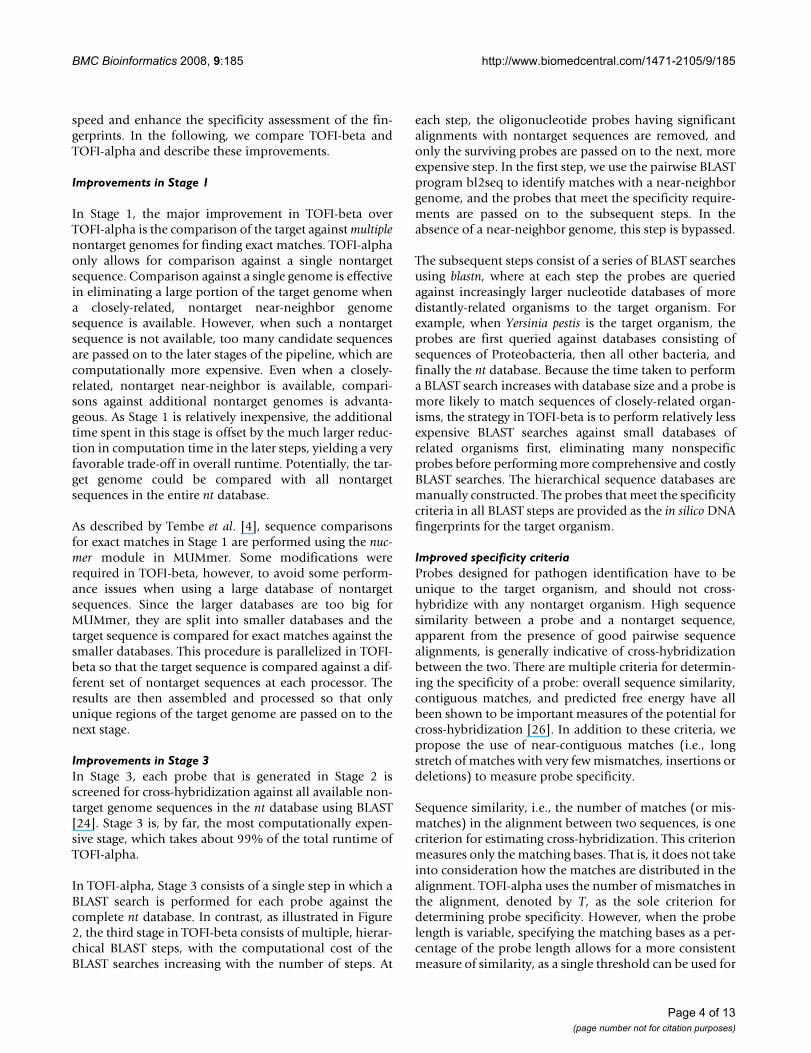
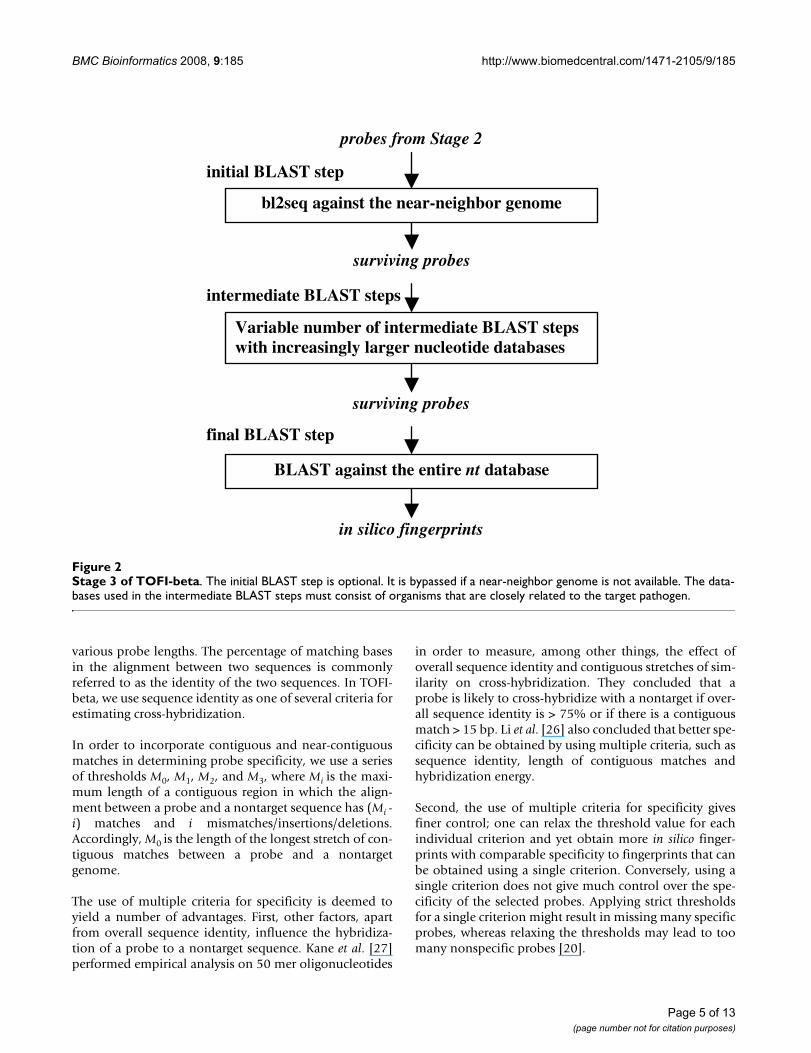
In TOFI-alpha, Stage 3 consists of a single step in which aBLAST search is performed for each probe against thecomplete nt database. In contrast, as illustrated in Figure2, the third stage in TOFI-beta consists of multiple, hierar-chical BLAST steps, with the computational cost of theBLAST searches increasing with the number of steps. At
each step, the oligonucleotide probes having significantalignments with nontarget sequences are removed, andonly the surviving probes are passed on to the next, moreexpensive step. In the first step, we use the pairwise BLASTprogram bl2seq to identify matches with a near-neighborgenome, and the probes that meet the specificity require-ments are passed on to the subsequent steps. In theabsence of a near-neighbor genome, this step is bypassed.
The subsequent steps consist of a series of BLAST searchesusing blastn, where at each step the probes are queriedagainst increasingly larger nucleotide databases of moredistantly-related organisms to the target organism. Forexample, when Yersinia pestis is the target organism, theprobes are first queried against databases consisting ofsequences of Proteobacteria, then all other bacteria, andfinally the nt database. Because the time taken to performa BLAST search increases with database size and a probe ismore likely to match sequences of closely-related organ-isms, the strategy in TOFI-beta is to perform relatively lessexpensive BLAST searches against small databases ofrelated organisms first, eliminating many nonspecificprobes before performing more comprehensive and costlyBLAST searches. The hierarchical sequence databases aremanually constructed. The probes that meet the specificitycriteria in all BLAST steps are provided as the in silico DNAfingerprints for the target organism.
Improved specificity criteriaProbes designed for pathogen identification have to beunique to the target organism, and should not cross-hybridize with any nontarget organism. High sequencesimilarity between a probe and a nontarget sequence,apparent from the presence of good pairwise sequencealignments, is generally indicative of cross-hybridizationbetween the two. There are multiple criteria for determin-ing the specificity of a probe: overall sequence similarity,contiguous matches, and predicted free energy have allbeen shown to be important measures of the potential forcross-hybridization [26]. In addition to these criteria, wepropose the use of near-contiguous matches (i.e., longstretch of matches with very few mismatches, insertions ordeletions) to measure probe specificity.
Sequence similarity, i.e., the number of matches (or mis-matches) in the alignment between two sequences, is onecriterion for estimating cross-hybridization. This criterionmeasures only the matching bases. That is, it does not takeinto consideration how the matches are distributed in thealignment. TOFI-alpha uses the number of mismatches inthe alignment, denoted by T, as the sole criterion fordetermining probe specificity. However, when the probelength is variable, specifying the matching bases as a per-centage of the probe length allows for a more consistentmeasure of similarity, as a single threshold can be used for
Page 4 of 13(page number not for citation purposes)
BMC Bioinformatics 2008, 9:185 http://www.biomedcentral.com/1471-2105/9/185
various probe lengths. The percentage of matching basesin the alignment between two sequences is commonlyreferred to as the identity of the two sequences. In TOFI-beta, we use sequence identity as one of several criteria forestimating cross-hybridization.
In order to incorporate contiguous and near-contiguousmatches in determining probe specificity, we use a seriesof thresholds M0, M1, M2, and M3, where Mi is the maxi-mum length of a contiguous region in which the align-ment between a probe and a nontarget sequence has (Mi -i) matches and i mismatches/insertions/deletions.Accordingly, M0 is the length of the longest stretch of con-tiguous matches between a probe and a nontargetgenome.
The use of multiple criteria for specificity is deemed toyield a number of advantages. First, other factors, apartfrom overall sequence identity, influence the hybridiza-tion of a probe to a nontarget sequence. Kane et al. [27]performed empirical analysis on 50 mer oligonucleotides
in order to measure, among other things, the effect ofoverall sequence identity and contiguous stretches of sim-ilarity on cross-hybridization. They concluded that aprobe is likely to cross-hybridize with a nontarget if over-all sequence identity is > 75% or if there is a contiguousmatch > 15 bp. Li et al. [26] also concluded that better spe-cificity can be obtained by using multiple criteria, such assequence identity, length of contiguous matches andhybridization energy.
Second, the use of multiple criteria for specificity givesfiner control; one can relax the threshold value for eachindividual criterion and yet obtain more in silico finger-prints with comparable specificity to fingerprints that canbe obtained using a single criterion. Conversely, using asingle criterion does not give much control over the spe-cificity of the selected probes. Applying strict thresholdsfor a single criterion might result in missing many specificprobes, whereas relaxing the thresholds may lead to toomany nonspecific probes [20].
Stage 3 of TOFI-betaFigure 2Stage 3 of TOFI-beta. The initial BLAST step is optional. It is bypassed if a near-neighbor genome is not available. The data-bases used in the intermediate BLAST steps must consist of organisms that are closely related to the target pathogen.
bl2seq against the near-neighbor genome
BLAST against the entire nt database
probes from Stage 2
surviving probes
surviving probes
in silico fingerprints
initial BLAST step
final BLAST step
Variable number of intermediate BLAST steps with increasingly larger nucleotide databases
intermediate BLAST steps
Page 5 of 13(page number not for citation purposes)
BMC Bioinformatics 2008, 9:185 http://www.biomedcentral.com/1471-2105/9/185
An additional advantage is that using multiple specificitycriteria, including contiguous matches, improves runtime.The selection of specificity criteria affects the choice of thelength of minimum exact matches in Stage 1, and usingmultiple criteria allows for the selection of a smallerthreshold for minimum exact matches. This selectionresults in fewer candidate sequences passing Stage 1,thereby improving the overall pipeline performance.
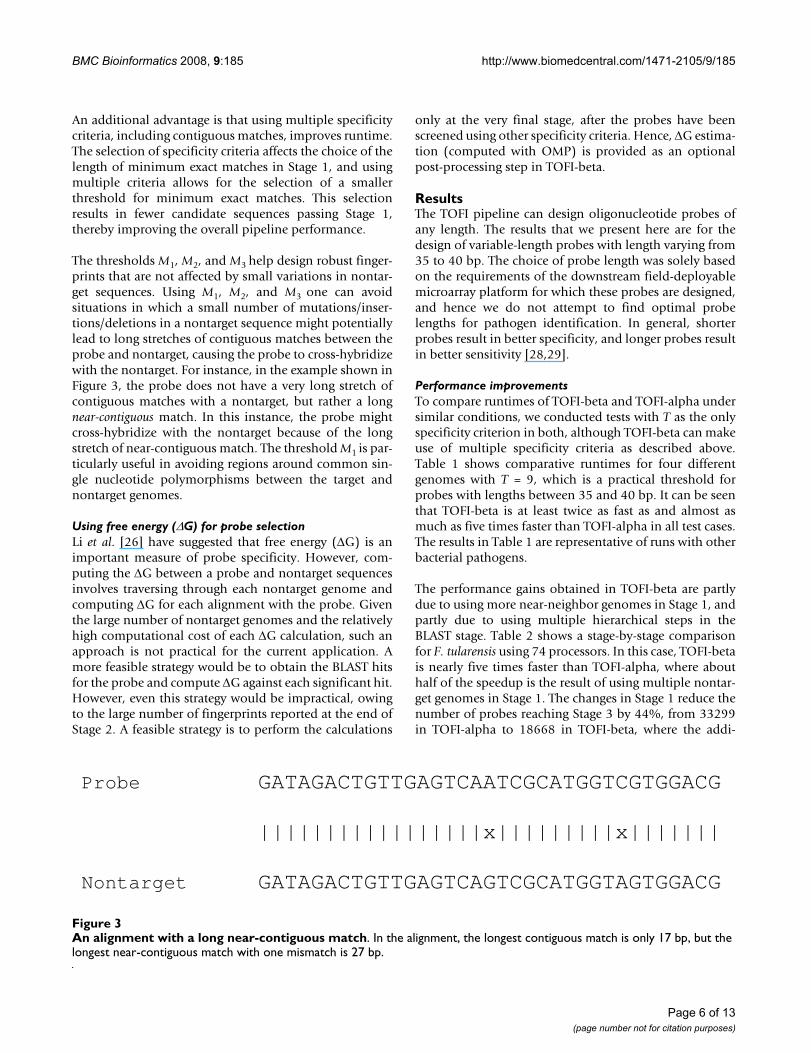
The thresholds M1, M2, and M3 help design robust finger-prints that are not affected by small variations in nontar-get sequences. Using M1, M2, and M3 one can avoidsituations in which a small number of mutations/inser-tions/deletions in a nontarget sequence might potentiallylead to long stretches of contiguous matches between theprobe and nontarget, causing the probe to cross-hybridizewith the nontarget. For instance, in the example shown inFigure 3, the probe does not have a very long stretch ofcontiguous matches with a nontarget, but rather a longnear-contiguous match. In this instance, the probe mightcross-hybridize with the nontarget because of the longstretch of near-contiguous match. The threshold M1 is par-ticularly useful in avoiding regions around common sin-gle nucleotide polymorphisms between the target andnontarget genomes.
Using free energy (ΔG) for probe selectionLi et al. [26] have suggested that free energy (ΔG) is animportant measure of probe specificity. However, com-puting the ΔG between a probe and nontarget sequencesinvolves traversing through each nontarget genome andcomputing ΔG for each alignment with the probe. Giventhe large number of nontarget genomes and the relativelyhigh computational cost of each ΔG calculation, such anapproach is not practical for the current application. Amore feasible strategy would be to obtain the BLAST hitsfor the probe and compute ΔG against each significant hit.However, even this strategy would be impractical, owingto the large number of fingerprints reported at the end ofStage 2. A feasible strategy is to perform the calculations
only at the very final stage, after the probes have beenscreened using other specificity criteria. Hence, ΔG estima-tion (computed with OMP) is provided as an optionalpost-processing step in TOFI-beta.
ResultsThe TOFI pipeline can design oligonucleotide probes ofany length. The results that we present here are for thedesign of variable-length probes with length varying from35 to 40 bp. The choice of probe length was solely basedon the requirements of the downstream field-deployablemicroarray platform for which these probes are designed,and hence we do not attempt to find optimal probelengths for pathogen identification. In general, shorterprobes result in better specificity, and longer probes resultin better sensitivity [28,29].
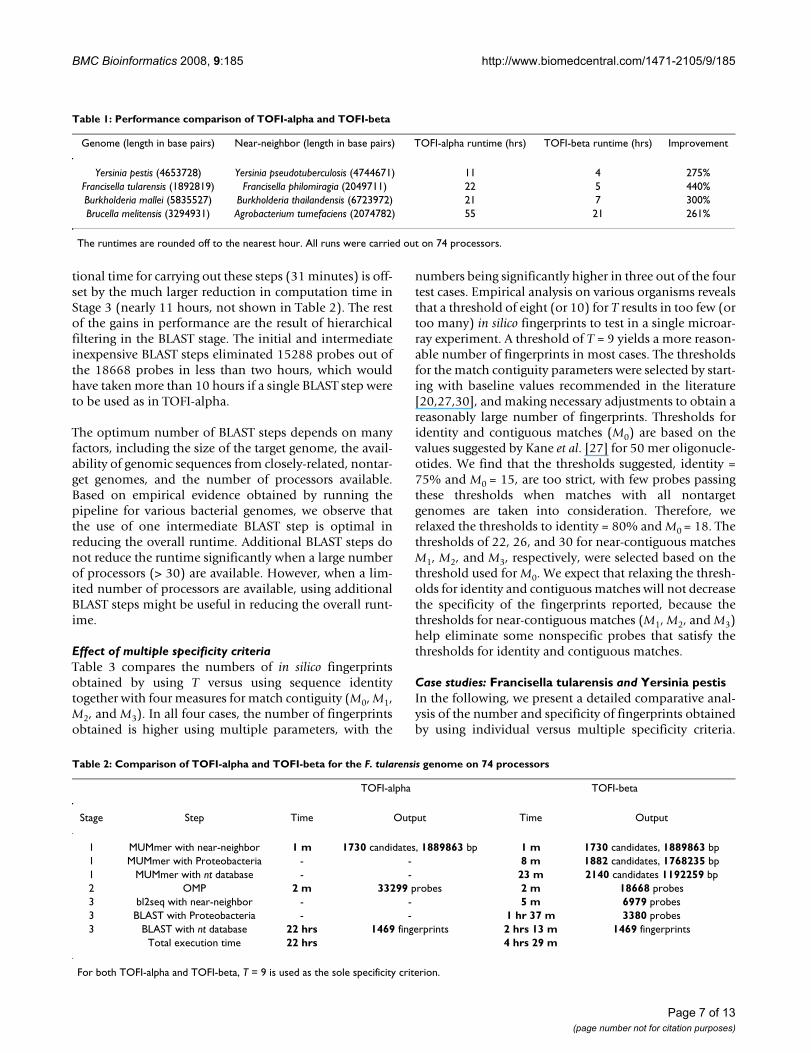
Performance improvementsTo compare runtimes of TOFI-beta and TOFI-alpha undersimilar conditions, we conducted tests with T as the onlyspecificity criterion in both, although TOFI-beta can makeuse of multiple specificity criteria as described above.Table 1 shows comparative runtimes for four differentgenomes with T = 9, which is a practical threshold forprobes with lengths between 35 and 40 bp. It can be seenthat TOFI-beta is at least twice as fast as and almost asmuch as five times faster than TOFI-alpha in all test cases.The results in Table 1 are representative of runs with otherbacterial pathogens.
The performance gains obtained in TOFI-beta are partlydue to using more near-neighbor genomes in Stage 1, andpartly due to using multiple hierarchical steps in theBLAST stage. Table 2 shows a stage-by-stage comparisonfor F. tularensis using 74 processors. In this case, TOFI-betais nearly five times faster than TOFI-alpha, where abouthalf of the speedup is the result of using multiple nontar-get genomes in Stage 1. The changes in Stage 1 reduce thenumber of probes reaching Stage 3 by 44%, from 33299in TOFI-alpha to 18668 in TOFI-beta, where the addi-
An alignment with a long near-contiguous matchFigure 3An alignment with a long near-contiguous match. In the alignment, the longest contiguous match is only 17 bp, but the longest near-contiguous match with one mismatch is 27 bp.
Probe GATAGACTGTTGAGTCAATCGCATGGTCGTGGACG
|||||||||||||||||x|||||||||x|||||||
Nontarget GATAGACTGTTGAGTCAGTCGCATGGTAGTGGACG
Page 6 of 13(page number not for citation purposes)
BMC Bioinformatics 2008, 9:185 http://www.biomedcentral.com/1471-2105/9/185
tional time for carrying out these steps (31 minutes) is off-set by the much larger reduction in computation time inStage 3 (nearly 11 hours, not shown in Table 2). The restof the gains in performance are the result of hierarchicalfiltering in the BLAST stage. The initial and intermediateinexpensive BLAST steps eliminated 15288 probes out ofthe 18668 probes in less than two hours, which wouldhave taken more than 10 hours if a single BLAST step wereto be used as in TOFI-alpha.
The optimum number of BLAST steps depends on manyfactors, including the size of the target genome, the avail-ability of genomic sequences from closely-related, nontar-get genomes, and the number of processors available.Based on empirical evidence obtained by running thepipeline for various bacterial genomes, we observe thatthe use of one intermediate BLAST step is optimal inreducing the overall runtime. Additional BLAST steps donot reduce the runtime significantly when a large numberof processors (> 30) are available. However, when a lim-ited number of processors are available, using additionalBLAST steps might be useful in reducing the overall runt-ime.
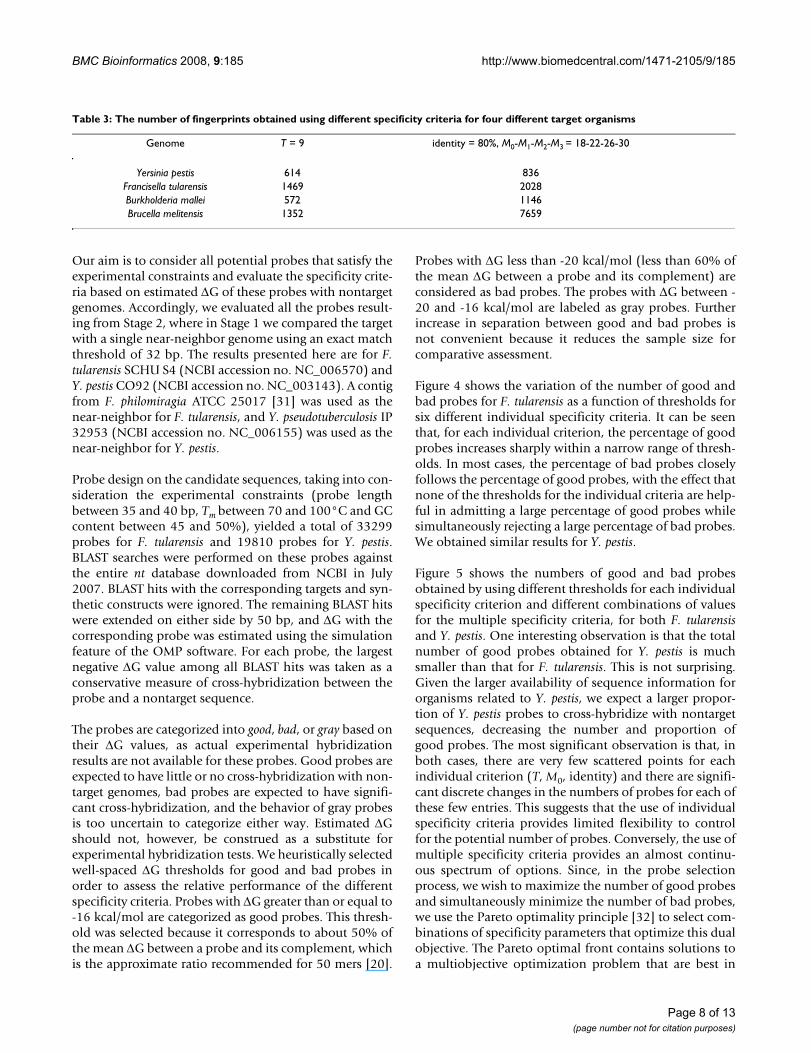
Effect of multiple specificity criteriaTable 3 compares the numbers of in silico fingerprintsobtained by using T versus using sequence identitytogether with four measures for match contiguity (M0, M1,M2, and M3). In all four cases, the number of fingerprintsobtained is higher using multiple parameters, with the
numbers being significantly higher in three out of the fourtest cases. Empirical analysis on various organisms revealsthat a threshold of eight (or 10) for T results in too few (ortoo many) in silico fingerprints to test in a single microar-ray experiment. A threshold of T = 9 yields a more reason-able number of fingerprints in most cases. The thresholdsfor the match contiguity parameters were selected by start-ing with baseline values recommended in the literature[20,27,30], and making necessary adjustments to obtain areasonably large number of fingerprints. Thresholds foridentity and contiguous matches (M0) are based on thevalues suggested by Kane et al. [27] for 50 mer oligonucle-otides. We find that the thresholds suggested, identity =75% and M0 = 15, are too strict, with few probes passingthese thresholds when matches with all nontargetgenomes are taken into consideration. Therefore, werelaxed the thresholds to identity = 80% and M0 = 18. Thethresholds of 22, 26, and 30 for near-contiguous matchesM1, M2, and M3, respectively, were selected based on thethreshold used for M0. We expect that relaxing the thresh-olds for identity and contiguous matches will not decreasethe specificity of the fingerprints reported, because thethresholds for near-contiguous matches (M1, M2, and M3)help eliminate some nonspecific probes that satisfy thethresholds for identity and contiguous matches.
Case studies: Francisella tularensis and Yersinia pestisIn the following, we present a detailed comparative anal-ysis of the number and specificity of fingerprints obtainedby using individual versus multiple specificity criteria.
Table 2: Comparison of TOFI-alpha and TOFI-beta for the F. tularensis genome on 74 processors
TOFI-alpha TOFI-beta
Stage Step Time Output Time Output
1 MUMmer with near-neighbor 1 m 1730 candidates, 1889863 bp 1 m 1730 candidates, 1889863 bp1 MUMmer with Proteobacteria - - 8 m 1882 candidates, 1768235 bp1 MUMmer with nt database - - 23 m 2140 candidates 1192259 bp2 OMP 2 m 33299 probes 2 m 18668 probes3 bl2seq with near-neighbor - - 5 m 6979 probes3 BLAST with Proteobacteria - - 1 hr 37 m 3380 probes3 BLAST with nt database 22 hrs 1469 fingerprints 2 hrs 13 m 1469 fingerprints
Total execution time 22 hrs 4 hrs 29 m
For both TOFI-alpha and TOFI-beta, T = 9 is used as the sole specificity criterion.
Table 1: Performance comparison of TOFI-alpha and TOFI-beta
Genome (length in base pairs) Near-neighbor (length in base pairs) TOFI-alpha runtime (hrs) TOFI-beta runtime (hrs) Improvement
Yersinia pestis (4653728) Yersinia pseudotuberculosis (4744671) 11 4 275%Francisella tularensis (1892819) Francisella philomiragia (2049711) 22 5 440%Burkholderia mallei (5835527) Burkholderia thailandensis (6723972) 21 7 300%Brucella melitensis (3294931) Agrobacterium tumefaciens (2074782) 55 21 261%
The runtimes are rounded off to the nearest hour. All runs were carried out on 74 processors.
Page 7 of 13(page number not for citation purposes)
BMC Bioinformatics 2008, 9:185 http://www.biomedcentral.com/1471-2105/9/185
Our aim is to consider all potential probes that satisfy theexperimental constraints and evaluate the specificity crite-ria based on estimated ΔG of these probes with nontargetgenomes. Accordingly, we evaluated all the probes result-ing from Stage 2, where in Stage 1 we compared the targetwith a single near-neighbor genome using an exact matchthreshold of 32 bp. The results presented here are for F.tularensis SCHU S4 (NCBI accession no. NC_006570) andY. pestis CO92 (NCBI accession no. NC_003143). A contigfrom F. philomiragia ATCC 25017 [31] was used as thenear-neighbor for F. tularensis, and Y. pseudotuberculosis IP32953 (NCBI accession no. NC_006155) was used as thenear-neighbor for Y. pestis.
Probe design on the candidate sequences, taking into con-sideration the experimental constraints (probe lengthbetween 35 and 40 bp, Tm between 70 and 100°C and GCcontent between 45 and 50%), yielded a total of 33299probes for F. tularensis and 19810 probes for Y. pestis.BLAST searches were performed on these probes againstthe entire nt database downloaded from NCBI in July2007. BLAST hits with the corresponding targets and syn-thetic constructs were ignored. The remaining BLAST hitswere extended on either side by 50 bp, and ΔG with thecorresponding probe was estimated using the simulationfeature of the OMP software. For each probe, the largestnegative ΔG value among all BLAST hits was taken as aconservative measure of cross-hybridization between theprobe and a nontarget sequence.
The probes are categorized into good, bad, or gray based ontheir ΔG values, as actual experimental hybridizationresults are not available for these probes. Good probes areexpected to have little or no cross-hybridization with non-target genomes, bad probes are expected to have signifi-cant cross-hybridization, and the behavior of gray probesis too uncertain to categorize either way. Estimated ΔGshould not, however, be construed as a substitute forexperimental hybridization tests. We heuristically selectedwell-spaced ΔG thresholds for good and bad probes inorder to assess the relative performance of the differentspecificity criteria. Probes with ΔG greater than or equal to-16 kcal/mol are categorized as good probes. This thresh-old was selected because it corresponds to about 50% ofthe mean ΔG between a probe and its complement, whichis the approximate ratio recommended for 50 mers [20].
Probes with ΔG less than -20 kcal/mol (less than 60% ofthe mean ΔG between a probe and its complement) areconsidered as bad probes. The probes with ΔG between -20 and -16 kcal/mol are labeled as gray probes. Furtherincrease in separation between good and bad probes isnot convenient because it reduces the sample size forcomparative assessment.
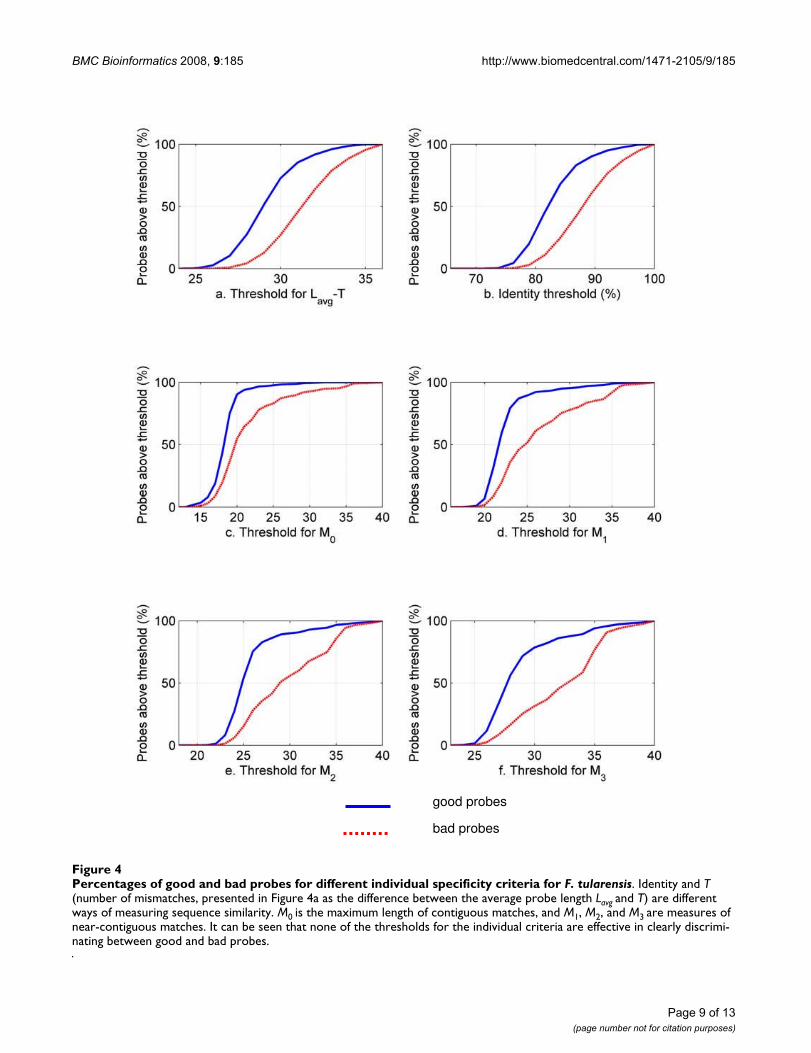
Figure 4 shows the variation of the number of good andbad probes for F. tularensis as a function of thresholds forsix different individual specificity criteria. It can be seenthat, for each individual criterion, the percentage of goodprobes increases sharply within a narrow range of thresh-olds. In most cases, the percentage of bad probes closelyfollows the percentage of good probes, with the effect thatnone of the thresholds for the individual criteria are help-ful in admitting a large percentage of good probes whilesimultaneously rejecting a large percentage of bad probes.We obtained similar results for Y. pestis.
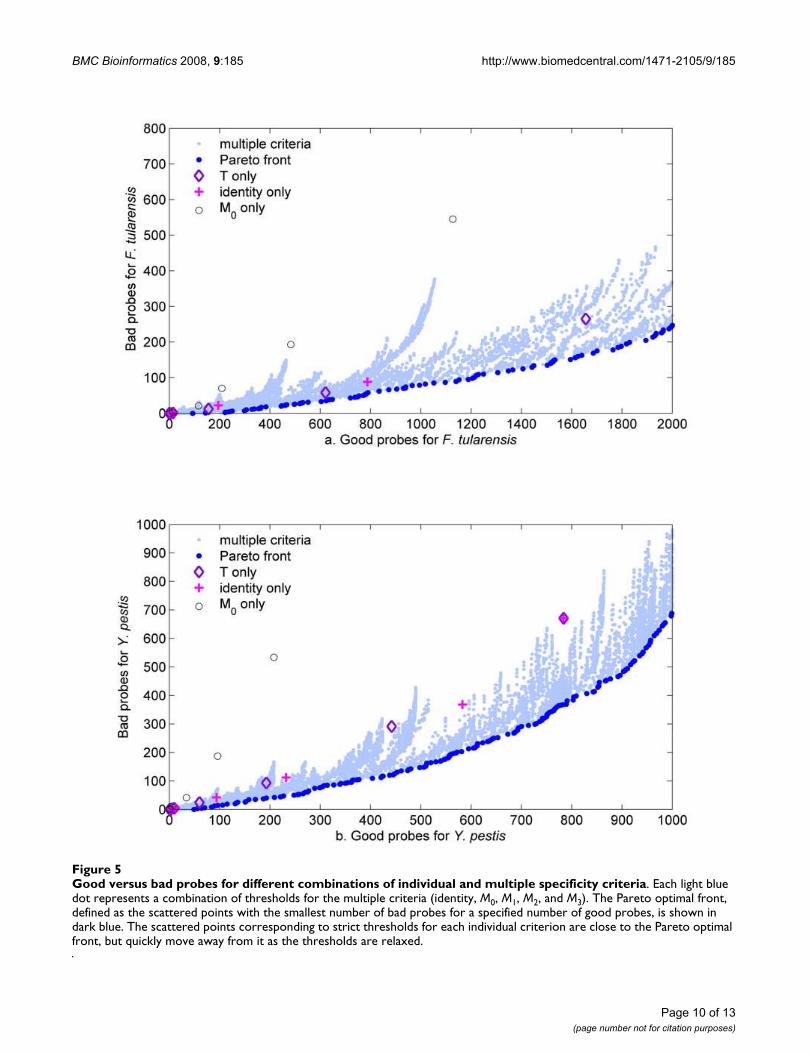
Figure 5 shows the numbers of good and bad probesobtained by using different thresholds for each individualspecificity criterion and different combinations of valuesfor the multiple specificity criteria, for both F. tularensisand Y. pestis. One interesting observation is that the totalnumber of good probes obtained for Y. pestis is muchsmaller than that for F. tularensis. This is not surprising.Given the larger availability of sequence information fororganisms related to Y. pestis, we expect a larger propor-tion of Y. pestis probes to cross-hybridize with nontargetsequences, decreasing the number and proportion ofgood probes. The most significant observation is that, inboth cases, there are very few scattered points for eachindividual criterion (T, M0, identity) and there are signifi-cant discrete changes in the numbers of probes for each ofthese few entries. This suggests that the use of individualspecificity criteria provides limited flexibility to controlfor the potential number of probes. Conversely, the use ofmultiple specificity criteria provides an almost continu-ous spectrum of options. Since, in the probe selectionprocess, we wish to maximize the number of good probesand simultaneously minimize the number of bad probes,we use the Pareto optimality principle [32] to select com-binations of specificity parameters that optimize this dualobjective. The Pareto optimal front contains solutions toa multiobjective optimization problem that are best in
Table 3: The number of fingerprints obtained using different specificity criteria for four different target organisms
Genome T = 9 identity = 80%, M0-M1-M2-M3 = 18-22-26-30
Yersinia pestis 614 836Francisella tularensis 1469 2028Burkholderia mallei 572 1146Brucella melitensis 1352 7659
Page 8 of 13(page number not for citation purposes)
BMC Bioinformatics 2008, 9:185 http://www.biomedcentral.com/1471-2105/9/185
Page 9 of 13(page number not for citation purposes)
Percentages of good and bad probes for different individual specificity criteria for F. tularensisFigure 4Percentages of good and bad probes for different individual specificity criteria for F. tularensis. Identity and T (number of mismatches, presented in Figure 4a as the difference between the average probe length Lavg and T) are different ways of measuring sequence similarity. M0 is the maximum length of contiguous matches, and M1, M2, and M3 are measures of near-contiguous matches. It can be seen that none of the thresholds for the individual criteria are effective in clearly discrimi-nating between good and bad probes.
good probes bad probes
BMC Bioinformatics 2008, 9:185 http://www.biomedcentral.com/1471-2105/9/185
Page 10 of 13(page number not for citation purposes)
Good versus bad probes for different combinations of individual and multiple specificity criteriaFigure 5Good versus bad probes for different combinations of individual and multiple specificity criteria. Each light blue dot represents a combination of thresholds for the multiple criteria (identity, M0, M1, M2, and M3). The Pareto optimal front, defined as the scattered points with the smallest number of bad probes for a specified number of good probes, is shown in dark blue. The scattered points corresponding to strict thresholds for each individual criterion are close to the Pareto optimal front, but quickly move away from it as the thresholds are relaxed.
BMC Bioinformatics 2008, 9:185 http://www.biomedcentral.com/1471-2105/9/185
satisfying all of the objectives simultaneously. That meansthat there can be other solutions that are better in satisfy-ing one or several objectives, but they must be worse thanthe Pareto optimal solution in satisfying the remainingobjectives. In our case, the Pareto optimal front identifiesthe scattered points with the smallest number of badprobes for a given number of good probes. The scatteredpoints for the individual criteria consistently drift awayfrom the Pareto optimal front as the number of goodprobes increases. This trend further suggests that multiplespecificity criteria should be used if one is interested inobtaining a larger number of good in silico probes, whilesimultaneously admitting fewer bad probes.
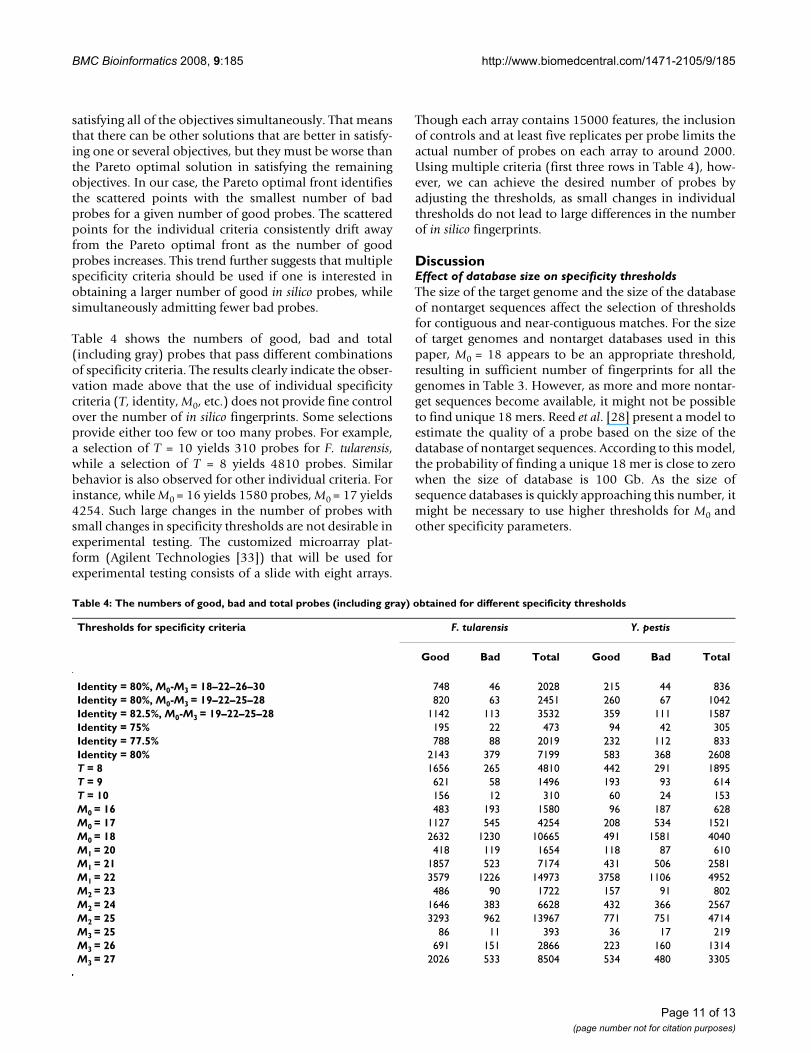
Table 4 shows the numbers of good, bad and total(including gray) probes that pass different combinationsof specificity criteria. The results clearly indicate the obser-vation made above that the use of individual specificitycriteria (T, identity, M0, etc.) does not provide fine controlover the number of in silico fingerprints. Some selectionsprovide either too few or too many probes. For example,a selection of T = 10 yields 310 probes for F. tularensis,while a selection of T = 8 yields 4810 probes. Similarbehavior is also observed for other individual criteria. Forinstance, while M0 = 16 yields 1580 probes, M0 = 17 yields4254. Such large changes in the number of probes withsmall changes in specificity thresholds are not desirable inexperimental testing. The customized microarray plat-form (Agilent Technologies [33]) that will be used forexperimental testing consists of a slide with eight arrays.
Though each array contains 15000 features, the inclusionof controls and at least five replicates per probe limits theactual number of probes on each array to around 2000.Using multiple criteria (first three rows in Table 4), how-ever, we can achieve the desired number of probes byadjusting the thresholds, as small changes in individualthresholds do not lead to large differences in the numberof in silico fingerprints.
DiscussionEffect of database size on specificity thresholdsThe size of the target genome and the size of the databaseof nontarget sequences affect the selection of thresholdsfor contiguous and near-contiguous matches. For the sizeof target genomes and nontarget databases used in thispaper, M0 = 18 appears to be an appropriate threshold,resulting in sufficient number of fingerprints for all thegenomes in Table 3. However, as more and more nontar-get sequences become available, it might not be possibleto find unique 18 mers. Reed et al. [28] present a model toestimate the quality of a probe based on the size of thedatabase of nontarget sequences. According to this model,the probability of finding a unique 18 mer is close to zerowhen the size of database is 100 Gb. As the size ofsequence databases is quickly approaching this number, itmight be necessary to use higher thresholds for M0 andother specificity parameters.
Table 4: The numbers of good, bad and total probes (including gray) obtained for different specificity thresholds
Thresholds for specificity criteria F. tularensis Y. pestis
Good Bad Total Good Bad Total
Identity = 80%, M0-M3 = 18–22–26–30 748 46 2028 215 44 836Identity = 80%, M0-M3 = 19–22–25–28 820 63 2451 260 67 1042Identity = 82.5%, M0-M3 = 19–22–25–28 1142 113 3532 359 111 1587Identity = 75% 195 22 473 94 42 305Identity = 77.5% 788 88 2019 232 112 833Identity = 80% 2143 379 7199 583 368 2608T = 8 1656 265 4810 442 291 1895T = 9 621 58 1496 193 93 614T = 10 156 12 310 60 24 153M0 = 16 483 193 1580 96 187 628M0 = 17 1127 545 4254 208 534 1521M0 = 18 2632 1230 10665 491 1581 4040M1 = 20 418 119 1654 118 87 610M1 = 21 1857 523 7174 431 506 2581M1 = 22 3579 1226 14973 3758 1106 4952M2 = 23 486 90 1722 157 91 802M2 = 24 1646 383 6628 432 366 2567M2 = 25 3293 962 13967 771 751 4714M3 = 25 86 11 393 36 17 219M3 = 26 691 151 2866 223 160 1314M3 = 27 2026 533 8504 534 480 3305
Page 11 of 13(page number not for citation purposes)
BMC Bioinformatics 2008, 9:185 http://www.biomedcentral.com/1471-2105/9/185
Limitations of using BLASTEven though BLAST is among the best methods forsequence comparisons against large databases like the ntdatabase, BLAST has its limitations. BLAST is a heuristicapproach that first finds short, exact, "anchor" matchesand extends the alignments around these exact matches.The size of these exact matches, termed word size, is givenby the input parameter W. In the blastn program, used forBLAST searches against large sequence databases, thedefault value for W is 11 and the smallest possible valueW can take is 7. Because every match reported by BLASTmust include an exact match of length W, it imposes alower bound on the values of the specificity thresholdsM0, M1, M2, and M3. For any given W, the smallest near-contiguous match with i mismatches that can be guaran-teed to be reported by BLAST is given by W(i+1), there-fore, the minimum allowable value for any Mi is W(i+1)-1. Accordingly, the lowest thresholds of M1, M2, and M3for W = 7 are 13, 20, and 27, respectively. Using lowerthresholds for Mi could result in some near contiguousmatches of length Mi not being reported by BLAST.
Errors in sequence databasesTOFI currently uses the description provided in the headerline of a FASTA sequence to determine if the sequence is atarget or a nontarget sequence. Typographical errors ormissing information in the NCBI sequence data can some-times cause TOFI to treat a sequence from a target organ-ism as a nontarget sequence, which can potentially lead toremoval of good fingerprints.
The fingerprints designed by TOFI can only be as accurateas the sequence databases used for comparisons with non-target sequences. However, identifying the errors andremoving low-quality data from sequence databases isbeyond the scope of the TOFI framework. The only com-plete solution for handling errors in sequence data is touse manually curated sequence databases that containonly high-quality sequences with accurate sequencedescriptions.
Extension to multiple genomesThe performance improvements in TOFI-beta pave theway for extending the pipeline to design probes commonto a group of target genomes, e.g., multiple strains of aspecies and multiple species of a genus. The identificationof common fingerprints is a more computationally inten-sive problem, as it requires the simultaneous analyses ofmultiple target genomes. In the future, we will extend thesoftware pipeline to design sets of fingerprints common tomultiple targets and sets unique to each target, takingmaximum advantage of the shared sequences among themultiple genomes in order to reduce the overall computa-tion time.
ConclusionThe enhanced pipeline incorporates major algorithmicimprovements, resulting in performance that is nearly upto five-times faster than the previous version of the pipe-line. The use of multiple specificity criteria provides finercontrol over the number of resulting fingerprints. This ishelpful in obtaining a larger number of in silico finger-prints than those obtained using individual criteria, andmay be essential for the following three reasons: (1) asmore and more genomic sequences become available,there will be significant fingerprint erosion; matches withthe newly available sequences will eliminate some finger-prints, (2) certain near-neighbor organisms may have verysimilar sequences, so, in these cases, obtaining a largernumber of potential in silico fingerprints for experimentaltesting would be desirable, and (3) due to the noisy natureof microarray experiments, redundancy is essential forconfidence in the results. Therefore, it is desirable to startwith a sufficiently large number of in silico fingerprints,and identify specific fingerprints based on experimentalresults with the target and a panel of nontarget sequences.
Availability and requirements• Project name: TOFI
• Project home page: http://www.bhsai.org/downloads/tofi_beta.tar.gz
• Operating systems: Linux
• Programming Language: Perl
• Other Requirements: mpiBLAST 1.4.0 or higher, MUM-mer 3.19 or higher, and OMP developer edition
Authors' contributionsRVS conceived and implemented the algorithmicimprovements in TOFI-beta. KK developed the user inter-face for TOFI-beta and modules for running OMP. NZanalyzed the simulation data for specificity thresholdselection. JR conceived the project and provided overallproject guidance. RVS, NZ and JR were the main writers ofthe manuscript.
AcknowledgementsWe thank Major Jeanne Geyer and Dr. Leonard Wasieloski of the U. S. Army Medical Research Institute of Infectious Diseases for their help and suggestions in selecting various design parameters and for providing the sequence of F. philomiragia prior to publication on the DOE Joint Genome Institute website. This work was sponsored by the U. S. Department of Defense High Performance Computing Modernization Program, under the High Performance Computing Software Applications Institutes initiative.
The opinions and assertions contained herein are the private views of the authors and are not to be construed as official or as reflecting the views of the U. S. Army or of the U. S. Department of Defense. This paper has been approved for public release with unlimited distribution.
Page 12 of 13(page number not for citation purposes)
BMC Bioinformatics 2008, 9:185 http://www.biomedcentral.com/1471-2105/9/185
Publish with BioMed Central and every scientist can read your work free of charge
"BioMed Central will be the most significant development for disseminating the results of biomedical research in our lifetime."
Sir Paul Nurse, Cancer Research UK
Your research papers will be:
available free of charge to the entire biomedical community
peer reviewed and published immediately upon acceptance
cited in PubMed and archived on PubMed Central
yours — you keep the copyright
Submit your manuscript here:http://www.biomedcentral.com/info/publishing_adv.asp
BioMedcentral
References1. Slezak T, Kuczmarski T, Ott L, Torres C, Medeiros D, Smith J, Truitt
B, Mulakken N, Lam M, Vitalis E, Zemla A, Zhou CE, Gardner S:Comparative genomics tools applied to bioterrorismdefence. Brief Bioinform 2003, 4(2):133-149.
2. Kaderali L, Schliep A: Selecting signature oligonucleotides toidentify organisms using DNA arrays. Bioinformatics 2002,18(10):1340-1349.
3. Phillippy AM, Mason JA, Ayanbule K, Sommer DD, Taviani E, Huq A,Colwell RR, Knight IT, Salzberg SL: Comprehensive DNA signa-ture discovery and validation. PLoS Comput Biol 2007, 3(5):e98.
4. Tembe W, Zavaljevski N, Bode E, Chase C, Geyer J, Wasieloski L,Benson G, Reifman J: Oligonucleotide fingerprint identificationfor microarray-based pathogen diagnostic assays. Bioinformat-ics 2007, 23(1):5-13.
5. Loy A, Bodrossy L: Highly parallel microbial diagnostics usingoligonucleotide microarrays. Clin Chim Acta 2005/08/30 edition.2006, 363(1-2):106-119.
6. Wilson WJ, Strout CL, DeSantis TZ, Stilwell JL, Carrano AV,Andersen GL: Sequence-specific identification of 18 patho-genic microorganisms using microarray technology. Mol CellProbes 2002/05/29 edition. 2002, 16(2):119-127.
7. Wang D, Urisman A, Liu YT, Springer M, Ksiazek TG, Erdman DD,Mardis ER, Hickenbotham M, Magrini V, Eldred J, Latreille JP, WilsonRK, Ganem D, DeRisi JL: Viral discovery and sequence recoveryusing DNA microarrays. PLoS Biol 2003, 1(2):E2.
8. Palacios G, Quan PL, Jabado OJ, Conlan S, Hirschberg DL, Liu Y, ZhaiJ, Renwick N, Hui J, Hegyi H, Grolla A, Strong JE, Towner JS, GeisbertTW, Jahrling PB, Buchen-Osmond C, Ellerbrok H, Sanchez-Seco MP,Lussier Y, Formenty P, Nichol MS, Feldmann H, Briese T, Lipkin WI:Panmicrobial oligonucleotide array for diagnosis of infec-tious diseases. Emerg Infect Dis 2007, 13(1):73-81.
9. CGH Whole-Genome & Custom Fine-Tiling Microarraysand Services [http://www.nimblegen.com/products/cgh/index.html]
10. Nordberg EK: YODA: selecting signature oligonucleotides.Bioinformatics 2005, 21(8):1365-1370.
11. Rimour S, Hill D, Militon C, Peyret P: GoArrays: highly dynamicand efficient microarray probe design. Bioinformatics 2005,21(7):1094-1103.
12. Chen H, Sharp BM: Oliz, a suite of Perl scripts that assist in thedesign of microarrays using 50mer oligonucleotides fromthe 3' untranslated region. BMC Bioinformatics 2002, 3:27.
13. Wernersson R, Nielsen HB: OligoWiz 2.0--integrating sequencefeature annotation into the design of microarray probes.Nucleic Acids Res 2005, 33(Web Server issue):W611-5.
14. Rahmann S: Fast and sensitive probe selection for DNA chipsusing jumps in matching statistics. Proc IEEE Comput Soc Bioin-form Conf 2003, 2:57-64.
15. Rahmann S: Fast large scale oligonucleotide selection usingthe longest common factor approach. J Bioinform Comput Biol2003, 1(2):343-361.
16. Loy A, Maixner F, Wagner M, Horn M: probeBase--an onlineresource for rRNA-targeted oligonucleotide probes: newfeatures 2007. Nucleic Acids Res 2006/11/14 edition. 2007,35(Database issue):D800-4.
17. Volokhov D, Pomerantsev A, Kivovich V, Rasooly A, Chizhikov V:Identification of Bacillus anthracis by multiprobe microarrayhybridization. Diagn Microbiol Infect Dis 2004/07/13 edition. 2004,49(3):163-171.
18. Zhu LX, Zhang ZW, Wang C, Yang HW, Jiang D, Zhang Q, Mitchel-son K, Cheng J: Use of a DNA microarray for simultaneousdetection of antibiotic resistance genes among staphylococ-cal clinical isolates. J Clin Microbiol 2007/08/31 edition. 2007,45(11):3514-3521.
19. Putonti C, Chumakov S, Mitra R, Fox GE, Willson RC, Fofanov Y:Human-blind probes and primers for dengue virus identifica-tion. Febs J 2006, 273(2):398-408.
20. He Z, Wu L, Li X, Fields MW, Zhou J: Empirical establishment ofoligonucleotide probe design criteria. Appl Environ Microbiol2005, 71(7):3753-3760.
21. Kurtz S, Phillippy A, Delcher AL, Smoot M, Shumway M, AntonescuC, Salzberg SL: Versatile and open software for comparinglarge genomes. Genome Biol 2004, 5(2):R12.
22. OMP Developer Edition [http://www.dnasoftware.com/Products/OMP_DE/index.htm]
23. SantaLucia J Jr., Hicks D: The thermodynamics of DNA struc-tural motifs. Annu Rev Biophys Biomol Struct 2004, 33:415-440.
24. Altschul SF, Gish W, Miller W, Myers EW, Lipman DJ: Basic localalignment search tool. J Mol Biol 1990, 215(3):403-410.
25. Darling A, Carey L, Feng W: The Design, Implementation, andEvaluation of mpiBLAST . In 4th International Conference on LinuxClusters: The HPC Revolution 2003 in conjunction with the ClusterWorldConference & Expo San Jose, CA ; 2003.
26. Li X, He Z, Zhou J: Selection of optimal oligonucleotide probesfor microarrays using multiple criteria, global alignment andparameter estimation. Nucleic Acids Res 2005, 33(19):6114-6123.
27. Kane MD, Jatkoe TA, Stumpf CR, Lu J, Thomas JD, Madore SJ:Assessment of the sensitivity and specificity of oligonucle-otide (50mer) microarrays. Nucleic Acids Res 2000,28(22):4552-4557.
28. Reed C, Fofanov V, Putonti C, Chumakov S, Slezak T, Fofanov Y:Effect of the mutation rate and background size on the qual-ity of pathogen identification. Bioinformatics 2007/09/21 edition.2007, 23(20):2665-2671.
29. Chou CC, Lee TT, Chen CH, Hsiao HY, Lin YL, Ho MS, Yang PC,Peck K: Design of microarray probes for virus identificationand detection of emerging viruses at the genus level. BMC Bio-informatics 2006, 7:232.
30. Liebich J, Schadt CW, Chong SC, He Z, Rhee SK, Zhou J: Improve-ment of oligonucleotide probe design criteria for functionalgene microarrays in environmental applications. Appl EnvironMicrobiol 2006, 72(2):1688-1691.
31. JGI Microbial Genomes [http://genome.jgi-psf.org/mic_cur1.html]
32. Censor Y: Pareto Optimality in Multiobjective Problems. ApplMath Optimiz 1977, 4:41-59.
33. Agilent DNA microarrays [http://www.chem.agilent.com/Scripts/PCol.asp?lPage=494]
Page 13 of 13(page number not for citation purposes)
http://www.ncbi.nlm.nih.gov/entrez/query.fcgi?cmd=Retrieve&db=PubMed&dopt=Abstract&list_uids=2231712
Related Documents