0012-821X/$ - see front matter D 2005 Elsevier B.V. All rights reserved. doi:10.1016/j.epsl.2005.01.036 * Corresponding author. Tel.: +1 612 624 9598; fax: +1 612 625 3819. E-mail address: [email protected] (C.A. Dykoski). A high-resolution, absolute-dated Holocene and deglacial Asian monsoon record from Dongge Cave, China Carolyn A. Dykoski a, * , R. Lawrence Edwards a , Hai Cheng a , Daoxian Yuan b , Yanjun Cai c , Meiliang Zhang b , Yushi Lin b , Jiaming Qing b , Zhisheng An c , Justin Revenaugh a a Department of Geology and Geophysics, University of Minnesota, MN 55455, USA b Karst Dynamic Laboratory, The Ministry of Land Resources, 40 Qixing road, Guilin 541004, China c State Key Lab of Loess and Quaternary Geology, Institute of Earth Environment, Chinese Academy of Sciences, Xi’an, 710075, China Received 24 May 2004; received in revised form 20 January 2005; accepted 25 January 2005 Available online 23 March 2005 Editor: E. Boyle Abstract We present a continuous record of the Asian monsoon over the last 16 ka from y 18 O measurements of stalagmite calcite. Over 900 oxygen isotopic measurements providing information on shifts in monsoon precipitation are combined with a chronology from 45 precise 230 Th dates. y 18 O and therefore Asian monsoon intensity generally follows changes in insolation, although changes in y 18 O are generally accommodated in abrupt shifts in contrast to smoothly varying insolation, indicating that threshold effects may be important. y 18 O decreased dramatically (~3x) at the start of the Holocene (~11.5 ka) and remained low for ~6 ka. Four positive y 18 O events centered at 11225F97 yr BP (1.05x), 10880F117 yr BP (1.15x), 9165F75 yr BP (1.4x), and a double event centered at 8260F64 yr BP (1.1x) and 8080F74 yr BP (1.0x) punctuated this period of high monsoon intensity. All four events correlate within error with climate changes in Greenland ice cores. Thus, the relationship between the Asian monsoon and the North Atlantic observed during the glacial period appears to continue into the early Holocene. In addition, three of the four events correlate within error with outburst events from Lake Agassiz. The decline of monsoon intensity in the mid-late Holocene is characterized by an abrupt positive shift in y 18 O which occurs at 3550F59 yr BP (1.1x in ~100 yr). In addition, the Holocene is punctuated by numerous centennial- and multi-decadal-scale events (amplitudes 0.5 to 1x) up to half the amplitude of the glacial interstadial events seen in the last glacial period. Thus, Holocene centennial- and multi-decadal-scale monsoon variability is significant, although not as large as glacial millennial-scale variability. The monsoon shows a strong connection with northern South American hydrological changes related by changes in ITCZ position. Spectral analysis of the y 18 O record shows significant peaks at solar periodicities of 208 yr and 86 yr suggesting variation is influenced by solar forcing. However, there are numerous other significant peaks including peaks at El Nin ˜ o frequencies (observed for high-resolution portions of the record between 8110 and 8250 yr) which suggest that changes in oceanic and atmospheric circulation patterns in addition to those forced by solar changes are important in controlling Holocene monsoon Earth and Planetary Science Letters 233 (2005) 71 – 86 www.elsevier.com/locate/epsl

Welcome message from author
This document is posted to help you gain knowledge. Please leave a comment to let me know what you think about it! Share it to your friends and learn new things together.
Transcript
0012-821X/$ - see front matter D 2005 Elsevier B.V. All rights reserved.
doi:10.1016/j.epsl.2005.01.036
* Corresponding author. Tel.: +1 612 624 9598; fax: +1 612 625 3819.
E-mail address: [email protected] (C.A. Dykoski).
www.elsevier.com/locate/eps
lA high-resolution, absolute-dated Holocene and deglacial Asian
monsoon record from Dongge Cave, China
Carolyn A. Dykoskia,*, R. Lawrence Edwardsa, Hai Chenga, Daoxian Yuanb,
Yanjun Caic, Meiliang Zhangb, Yushi Linb, Jiaming Qingb,
Zhisheng Anc, Justin Revenaugha
aDepartment of Geology and Geophysics, University of Minnesota, MN 55455, USAbKarst Dynamic Laboratory, The Ministry of Land Resources, 40 Qixing road, Guilin 541004, China
cState Key Lab of Loess and Quaternary Geology, Institute of Earth Environment, Chinese Academy of Sciences, Xi’an, 710075, China
Received 24 May 2004; received in revised form 20 January 2005; accepted 25 January 2005
Available online 23 March 2005
Editor: E. Boyle
Abstract
We present a continuous record of the Asian monsoon over the last 16 ka from y18O measurements of stalagmite calcite.
Over 900 oxygen isotopic measurements providing information on shifts in monsoon precipitation are combined with a
chronology from 45 precise 230Th dates. y18O and therefore Asian monsoon intensity generally follows changes in insolation,
although changes in y18O are generally accommodated in abrupt shifts in contrast to smoothly varying insolation, indicating that
threshold effects may be important. y18O decreased dramatically (~3x) at the start of the Holocene (~11.5 ka) and remained
low for ~6 ka. Four positive y18O events centered at 11225F97 yr BP (1.05x), 10880F117 yr BP (1.15x), 9165F75 yr BP
(1.4x), and a double event centered at 8260F64 yr BP (1.1x) and 8080F74 yr BP (1.0x) punctuated this period of high
monsoon intensity. All four events correlate within error with climate changes in Greenland ice cores. Thus, the relationship
between the Asian monsoon and the North Atlantic observed during the glacial period appears to continue into the early
Holocene. In addition, three of the four events correlate within error with outburst events from Lake Agassiz. The decline of
monsoon intensity in the mid-late Holocene is characterized by an abrupt positive shift in y18O which occurs at 3550F59 yr BP
(1.1x in ~100 yr). In addition, the Holocene is punctuated by numerous centennial- and multi-decadal-scale events (amplitudes
0.5 to 1x) up to half the amplitude of the glacial interstadial events seen in the last glacial period. Thus, Holocene centennial-
and multi-decadal-scale monsoon variability is significant, although not as large as glacial millennial-scale variability. The
monsoon shows a strong connection with northern South American hydrological changes related by changes in ITCZ position.
Spectral analysis of the y18O record shows significant peaks at solar periodicities of 208 yr and 86 yr suggesting variation is
influenced by solar forcing. However, there are numerous other significant peaks including peaks at El Nino frequencies
(observed for high-resolution portions of the record between 8110 and 8250 yr) which suggest that changes in oceanic and
atmospheric circulation patterns in addition to those forced by solar changes are important in controlling Holocene monsoon
Earth and Planetary Science Letters 233 (2005) 71–86
C.A. Dykoski et al. / Earth and Planetary Science Letters 233 (2005) 71–8672
climate. In addition, for this high-resolution portion, we observe a distinctive biennial oscillation of the Asian monsoon, which
has been associated with the Tropospheric Biennial Oscillation (TBO).
D 2005 Elsevier B.V. All rights reserved.
Keywords: speleothem; Asian monsoon; Holocene; inductively coupled plasma; China
1. Introduction
The stability (or instability) of interglacial climate
has become an important issue that can be addressed
by studying Holocene climate. Recently, a millennial-
scale pattern, which occurs during the last glacial
period [1], has been observed to extend into the
Holocene [2,3], challenging the idea of fairly stable
climatic conditions observed in Greenland ice cores
during the Holocene. If climate is driven by solar
forcing, the tropics would be a likely candidate for
picking up the signal and then amplifying it to the rest
of the world due to the large amount of radiation that
the Earth receives at those latitudes and the physics of
heat transport [4]. Some of the cycles observed in the
solar spectra have decadal-scale variation and would
require a high-resolution proxy to record the potential
signal. The Greenland and Antarctic ice cores are
complete, high-resolution records of the Holocene and
are fairly well-dated, but are restricted to polar
regions.
High-resolution, precisely dated records from the
lower latitudes, which cover a good portion of the
Holocene, are useful in resolving these issues [5–7].
Speleothems can have continuous deposition of
calcium carbonate over long periods of time and
well-chosen speleothems are datable with high pre-
cision. Absolute ages can be determined by means of230Th dating by mass spectrometry [7]. Here, we
present a high-resolution Holocene record based upon
a speleothem recovered from Dongge Cave in south
China.
Previous work on speleothems recovered from
Hulu Cave, near Nanjing, China, shows large and at
times rapid shifts in monsoon intensity between 75 ka
and 11 ka [8]. The speleothems from Hulu Cave were
deposited near the eastern coast of China at a locality
affected only by the East Asian monsoon. The long-
term trend in y18O correlates to summer insolation
values at that latitude (338N), suggesting summer
monsoon enhancement through increases in the
temperature differences between the continent and
ocean. Similarities between the oxygen isotope record
from the Greenland ice core and the Chinese record
are strong [8]. Features similar to Dansgaard/
Oeschger [9] events are observed in the Chinese
record, demonstrating a strong link between the East
Asian monsoon and North Atlantic climate for the last
glacial period and deglacial sequence. This evidence
suggests that circulation changes hypothesized to
cause the Dansgaard/Oeschger events [10] may have
also affected the tropical western Pacific Ocean where
the East Asian monsoon originates.
Dongge Cave is different from the Hulu Cave
samples in two ways. It is located inland from the
coast to the south and west relative to Hulu Cave.
Secondly, the Dongge cave speleothem that is the
main focus of this work spans Holocene as well as
(late Pleistocene) deglacial climate as opposed to the
Hulu Cave speleothems which at present are largely
restricted to the Pleistocene. Therefore, the Dongge
Cave record can be used to test the extent to which the
link between Asian monsoon intensity and Greenland
climate continues into the Holocene. In addition,
recent studies suggest that Dongge Cave is located in
a region of China affected by the Indian monsoon
[11]. Therefore, correlation with the Hulu Cave
stalagmites during periods of concurrent growth
would test whether or not mechanisms affecting the
East Asian monsoon actually affect a broader region
of the Asian monsoon system.
2. Location, local meteorology, and sample
description
Stalagmite D4 was recovered from Dongge Cave,
China (25817VN, 10885VE, elevation=680 m). The
cave is located 18 km southeast of Libo, Guizhou
Province in southern inland China (Fig. 1). Work from
Dongge Cave was previously reported for stalagmites
D3 and D4 as well as current climate conditions near
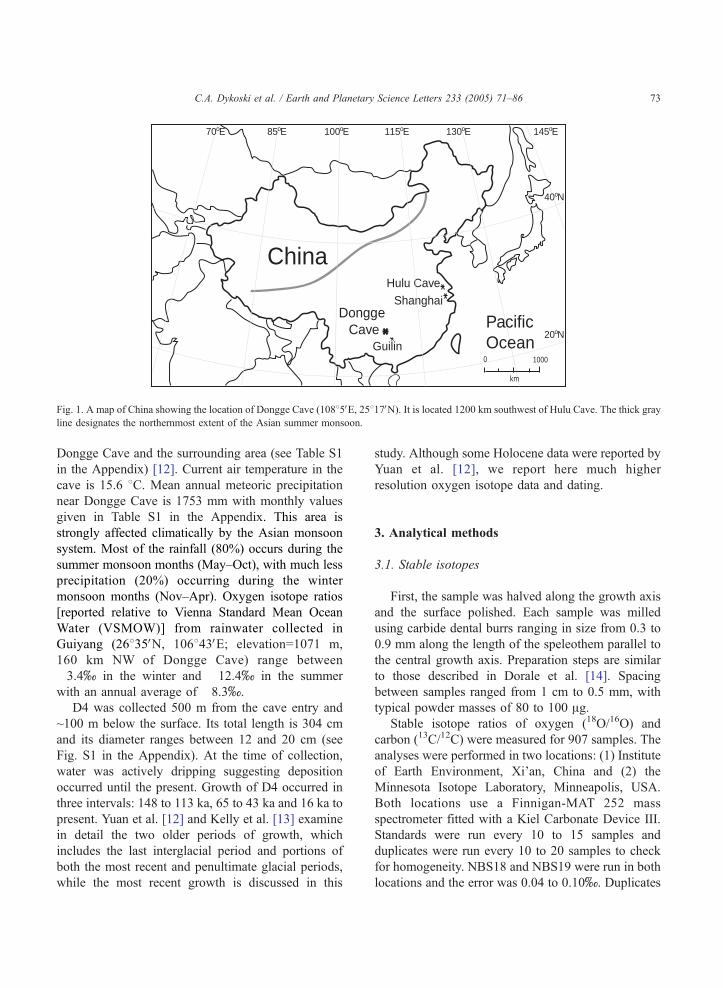
DonggeCave
Guilin
Shanghai
70 E
Hulu Cave
0 1000
km
PacificOcean
China
o 85 Eo 100 Eo 115 Eo 130 Eo
40 No
20 No
145 Eo
Fig. 1. A map of China showing the location of Dongge Cave (10885VE, 25817VN). It is located 1200 km southwest of Hulu Cave. The thick gray
line designates the northernmost extent of the Asian summer monsoon.
C.A. Dykoski et al. / Earth and Planetary Science Letters 233 (2005) 71–86 73
Dongge Cave and the surrounding area (see Table S1
in the Appendix) [12]. Current air temperature in the
cave is 15.6 8C. Mean annual meteoric precipitation
near Dongge Cave is 1753 mm with monthly values
given in Table S1 in the Appendix. This area is
strongly affected climatically by the Asian monsoon
system. Most of the rainfall (80%) occurs during the
summer monsoon months (May–Oct), with much less
precipitation (20%) occurring during the winter
monsoon months (Nov–Apr). Oxygen isotope ratios
[reported relative to Vienna Standard Mean Ocean
Water (VSMOW)] from rainwater collected in
Guiyang (26835VN, 106843VE; elevation=1071 m,
160 km NW of Dongge Cave) range between
�3.4x in the winter and �12.4x in the summer
with an annual average of �8.3x.
D4 was collected 500 m from the cave entry and
~100 m below the surface. Its total length is 304 cm
and its diameter ranges between 12 and 20 cm (see
Fig. S1 in the Appendix). At the time of collection,
water was actively dripping suggesting deposition
occurred until the present. Growth of D4 occurred in
three intervals: 148 to 113 ka, 65 to 43 ka and 16 ka to
present. Yuan et al. [12] and Kelly et al. [13] examine
in detail the two older periods of growth, which
includes the last interglacial period and portions of
both the most recent and penultimate glacial periods,
while the most recent growth is discussed in this
study. Although some Holocene data were reported by
Yuan et al. [12], we report here much higher
resolution oxygen isotope data and dating.
3. Analytical methods
3.1. Stable isotopes
First, the sample was halved along the growth axis
and the surface polished. Each sample was milled
using carbide dental burrs ranging in size from 0.3 to
0.9 mm along the length of the speleothem parallel to
the central growth axis. Preparation steps are similar
to those described in Dorale et al. [14]. Spacing
between samples ranged from 1 cm to 0.5 mm, with
typical powder masses of 80 to 100 Ag.Stable isotope ratios of oxygen (18O/16O) and
carbon (13C/12C) were measured for 907 samples. The
analyses were performed in two locations: (1) Institute
of Earth Environment, Xi’an, China and (2) the
Minnesota Isotope Laboratory, Minneapolis, USA.
Both locations use a Finnigan-MAT 252 mass
spectrometer fitted with a Kiel Carbonate Device III.
Standards were run every 10 to 15 samples and
duplicates were run every 10 to 20 samples to check
for homogeneity. NBS18 and NBS19 were run in both
locations and the error was 0.04 to 0.10x. Duplicates
C.A. Dykoski et al. / Earth and Planetary Science Letters 233 (2005) 71–8674
replicated within 0.16x for oxygen (most below
0.10x) and 0.20 x for carbon (with the exception of
two sample pairs which were most likely due to
sampling error). The Chinese lab used a highly
purified CO2 gas (y18O=21.28x, y13C=24.74x) as
a reference for standardizing samples. At Minnesota,
the Laboratory Information Management System
(LIMS) was used to normalize the raw data to VPDB
(x), instead of standardizing the reference gas. To test
for systematic offsets between the results from the two
laboratories, we examined the few short portions of
the record with alternating analyses from each
laboratory. We analyzed groups of three consecutive
analyses and compared the middle with the average of
the other two. For 90 such calculations, the average
difference between the two values was 0.00x with a
standard deviation of 0.22. As this difference is due to
both climate and analytical offset we infer that
analytical offset is negligible. Values are reported as
y18O (x) and y13C (x) with respect to the Vienna
Pee Dee Belemnite (VPDB) standard.
3.2. 230Th dating
Samples for dating were drilled using carbide
dental burrs following stratigraphic horizons as in
Dorale et al. [14]. Typical powder amounts ranged
from 100 to 300 mg. The chemical procedure used to
separate the uranium and thorium is similar to that
described in Edwards et al. [7]. The calcite powder is
dissolved with nitric acid, a mixed 229Th/233U/236U
tracer is added, and the sample is dried down. After
the addition of an iron chloride solution, NH4OH is
added drop by drop until the iron precipitates. The
sample is then centrifuged to separate the iron from
the rest of the solution and the overlying liquid is
removed. After loading the sample into columns
containing anion resin, HCl is added to elute the
thorium and water is added to elute the uranium. With
the uranium and thorium separated, each sample is
dried down and dilute nitric acid is added for injection
into the ICP-MS.
Analyses were conducted by means of inductively
coupled plasma mass spectrometry (ICP-MS) on a
Finnigan-MAT Element outfitted with a double
focusing sector-field magnet in reversed Nier–John-
son geometry and a single MasCom multiplier. The
instrument was operated at low resolution and in
electrostatic peak hopping mode. Combined ioniza-
tion plus transmission efficiency of 2.5 to 3x has
been measured for uranium and 1.5 to 2x has been
measured for thorium. Further details on instrumental
procedures are explained by Shen et al. [15].
4. Results
4.1. Replication
It is critical to have an accurate understanding of
what the stable isotope results represent. Many
processes other than climate may be involved in
producing the y18O signal observed in speleothems.
Kinetic fractionation, mixing of water during resi-
dence in the vadose zone, dissolution–reprecipitation,
and degassing history can contribute to the y18Osignal, therefore shifting the climate signal. A simple
test is a replication test of isotopic records of
stalagmites from the same cave [16]. Oxygen isotope
results from another stalagmite retrieved from Dongge
cave (D3) essentially replicate the oxygen isotopic
record of D4 at periods when the two stalagmites grew
contemporaneously (115 to 148 ka) [12]. The two
samples grew 200 m apart and it is highly unlikely
that the combination of conditions experienced by
each set of drips was identical in each case. Therefore,
kinetic fractionation and water–rock interactions are
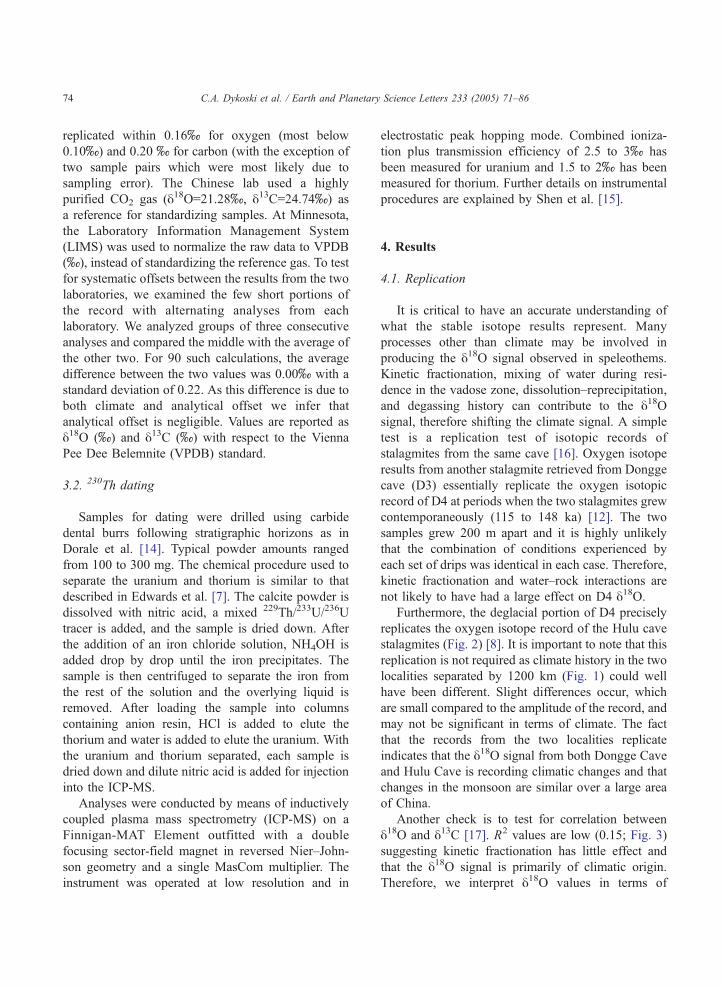
not likely to have had a large effect on D4 y18O.Furthermore, the deglacial portion of D4 precisely
replicates the oxygen isotope record of the Hulu cave
stalagmites (Fig. 2) [8]. It is important to note that this
replication is not required as climate history in the two
localities separated by 1200 km (Fig. 1) could well
have been different. Slight differences occur, which
are small compared to the amplitude of the record, and
may not be significant in terms of climate. The fact
that the records from the two localities replicate
indicates that the y18O signal from both Dongge Cave
and Hulu Cave is recording climatic changes and that
changes in the monsoon are similar over a large area
of China.
Another check is to test for correlation between
y18O and y13C [17]. R2 values are low (0.15; Fig. 3)
suggesting kinetic fractionation has little effect and
that the y18O signal is primarily of climatic origin.
Therefore, we interpret y18O values in terms of
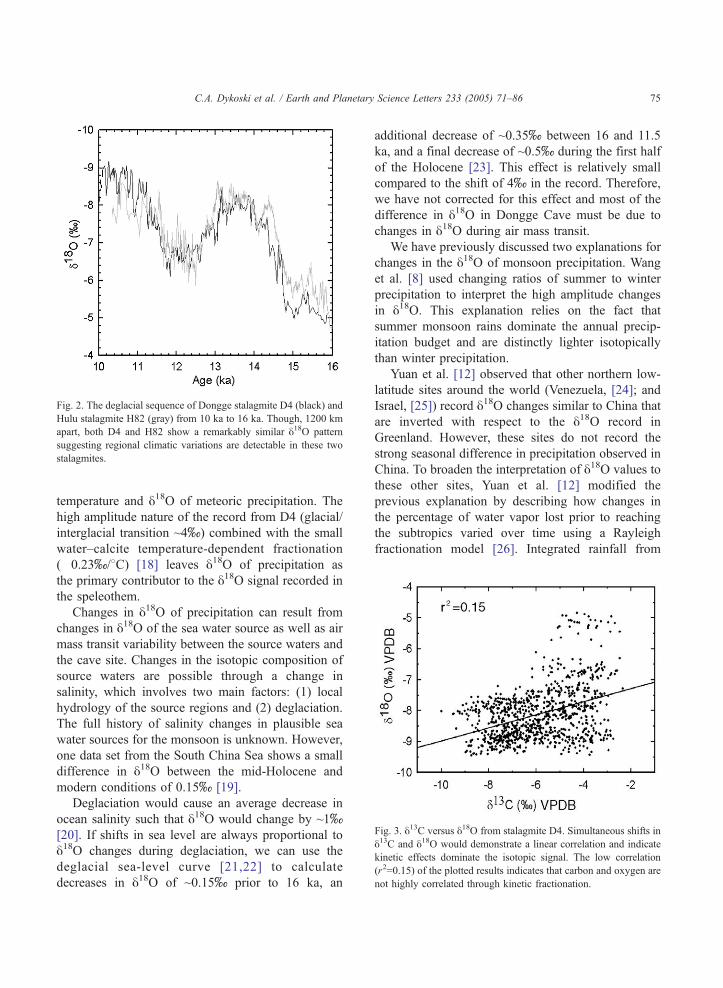
Fig. 2. The deglacial sequence of Dongge stalagmite D4 (black) and
Hulu stalagmite H82 (gray) from 10 ka to 16 ka. Though, 1200 km
apart, both D4 and H82 show a remarkably similar y18O pattern
suggesting regional climatic variations are detectable in these two
stalagmites.
Fig. 3. y13C versus y18O from stalagmite D4. Simultaneous shifts in
y13C and y18O would demonstrate a linear correlation and indicate
kinetic effects dominate the isotopic signal. The low correlation
(r2=0.15) of the plotted results indicates that carbon and oxygen are
not highly correlated through kinetic fractionation.
C.A. Dykoski et al. / Earth and Planetary Science Letters 233 (2005) 71–86 75
temperature and y18O of meteoric precipitation. The
high amplitude nature of the record from D4 (glacial/
interglacial transition ~4x) combined with the small
water–calcite temperature-dependent fractionation
(�0.23x/8C) [18] leaves y18O of precipitation as
the primary contributor to the y18O signal recorded in
the speleothem.
Changes in y18O of precipitation can result from
changes in y18O of the sea water source as well as air
mass transit variability between the source waters and
the cave site. Changes in the isotopic composition of
source waters are possible through a change in
salinity, which involves two main factors: (1) local
hydrology of the source regions and (2) deglaciation.
The full history of salinity changes in plausible sea
water sources for the monsoon is unknown. However,
one data set from the South China Sea shows a small
difference in y18O between the mid-Holocene and
modern conditions of 0.15x [19].
Deglaciation would cause an average decrease in
ocean salinity such that y18O would change by ~1x[20]. If shifts in sea level are always proportional to
y18O changes during deglaciation, we can use the
deglacial sea-level curve [21,22] to calculate
decreases in y18O of ~0.15x prior to 16 ka, an
additional decrease of ~0.35x between 16 and 11.5
ka, and a final decrease of ~0.5x during the first half
of the Holocene [23]. This effect is relatively small
compared to the shift of 4x in the record. Therefore,
we have not corrected for this effect and most of the
difference in y18O in Dongge Cave must be due to
changes in y18O during air mass transit.
We have previously discussed two explanations for
changes in the y18O of monsoon precipitation. Wang
et al. [8] used changing ratios of summer to winter
precipitation to interpret the high amplitude changes
in y18O. This explanation relies on the fact that
summer monsoon rains dominate the annual precip-
itation budget and are distinctly lighter isotopically
than winter precipitation.
Yuan et al. [12] observed that other northern low-
latitude sites around the world (Venezuela, [24]; and
Israel, [25]) record y18O changes similar to China that
are inverted with respect to the y18O record in
Greenland. However, these sites do not record the
strong seasonal difference in precipitation observed in
China. To broaden the interpretation of y18O values to
these other sites, Yuan et al. [12] modified the
previous explanation by describing how changes in
the percentage of water vapor lost prior to reaching
the subtropics varied over time using a Rayleigh
fractionation model [26]. Integrated rainfall from
C.A. Dykoski et al. / Earth and Planetary Science Letters 233 (2005) 71–8676
tropical sources to SE China during glacial times was
calculated to be 65% of that during the mid-Holocene
[12]. Thus, following this interpretation, changes in
the proportion of precipitation reaching China corre-
late with changes in Greenland temperature. The Yuan
et al. [12] mechanism provides a single explanation
for the fact that the y18O relationship seen in the
northern tropics and subtropics at multiple sites is
inverted with respect to Greenland.
4.2. Chronology
Previous work has shown that deposition of D4
occurred during 3 periods of growth at 148 to 113 ka,
66 to 42.5 ka, and 16 ka to present, which were
interrupted by 2 hiatuses [12]. Most of the growth
(~2.0 m out of 3.04 m) occurred since the last hiatus
(since 16 ka: the last deglacial sequence and
Holocene). 45 230Th dates were acquired within the
youngest growth phase. Decay constants and meas-
ured values of uranium and thorium concentrations
used in these calculations are listed in Table 1.
Concentrations range between 170 to 500 ppb for238U and 0.01 to 0.9 fg of 230Th/g of sample. Ages
were corrected using an initial 230Th/232Th atomic
ratio of (7.0F5.0)�10�6. This value was calculated
using samples with anomalously high concentrations
of 232Th together with the constraint of stratigraphic
order. For almost all the samples, the correction for
initial 230Th was negligible. Dates are reported with
2r analytical errors that averageF67 yr (and range
between 19 and 138 yr).
All of our dates occur in stratigraphic order and it
appears that D4 grew continuously throughout this
period. Linear interpolation was used to calculate an
age for each y18O value. To determine the error for a
linearly interpolated age, the normal procedure would
involve combining appropriately weighted errors from
the measured ICP-MS ages on either side of the
sample quadratically. This procedure would generally
produce an error in interpolated age, which is less than
the error in age of the actual measured bounding ages.
Such an error estimate is not likely valid as no term
for error in changes in growth rate has been applied,
nor is it possible to quantify such a term. Thus, the
true error is most likely greater than that calculated
with the quadratic method. We arbitrarily chose to
calculate the error by adding the appropriately
weighted bounding age errors linearly, providing a
more reasonable error estimate. In one case
(9105F416 yr BP), the error was very large due to
a high 232Th concentration correction. This age was
omitted during the above error calculations.
Growth rate varied within the sample from ~20 to
500 Am/yr with an average of 154 Am/yr during the
Holocene, 43 Am/yr during the deglacial sequence and
122 Am/yr for the whole record (Figs. 4 and 5).
Between 7.5 and 8.5 ka, growth rate reached as high
as 500 Am/yr. This period of high growth rate
corresponds to the period of lightest y18O, which we
infer to be the time of highest rainfall (see below).
Overall, the changes in growth rate are broadly
consistent with changes in precipitation inferred from
y18O data. High growth rates are ideal for high-
resolution sampling of oxygen isotope ratios, as we
can achieve a sampling resolution of about 300 Ameven drilling by hand.
4.3. The d18O record
The sampling interval of D4 yielded an average
time resolution of ~19 years with some portions
sampled as high as every 1 to 2 yr. The presence of
annual bands was not observed. The D4 profile of
y18O shows many distinct features (Fig. 6). Note that
y18O is plotted increasing downwards. At the start of
growth ~16 ka, y18O values are relatively heavy
(�5x) and growth rate is relatively low. Bands within
the sample are well defined and dark gray in color. A
dramatic shift toward lighter values (~3x) occurs at
14.7 ka, coincident within error with the start of the
Bolling–Allerod in Greenland. These light values
(�8x) were maintained for ~1.7 ka. At ~13 ka,
y18O begins to rise and by 12.5 ka had risen by 2x to
heavier values. This event corresponds to the begin-
ning of the Younger Dryas as recorded in Greenland.
At ~11.5 ka, y18O falls to lighter values of �8.4x,
within error of the end of the Younger Dryas. After
this abrupt drop, y18O values continue to get lighter
gradually until they reach peak values between 8 and
9 ka.
This general decrease in y18O is interrupted by 11
heavy excursions between 11.5 and 8 ka. The four
largest (amplitudes greater than 1.0x) occur at 11.2,
10.9, 9.2, and 8.1/8.2 ka and last between 90 and 230
yr. The first event occurs within error of the Preboreal
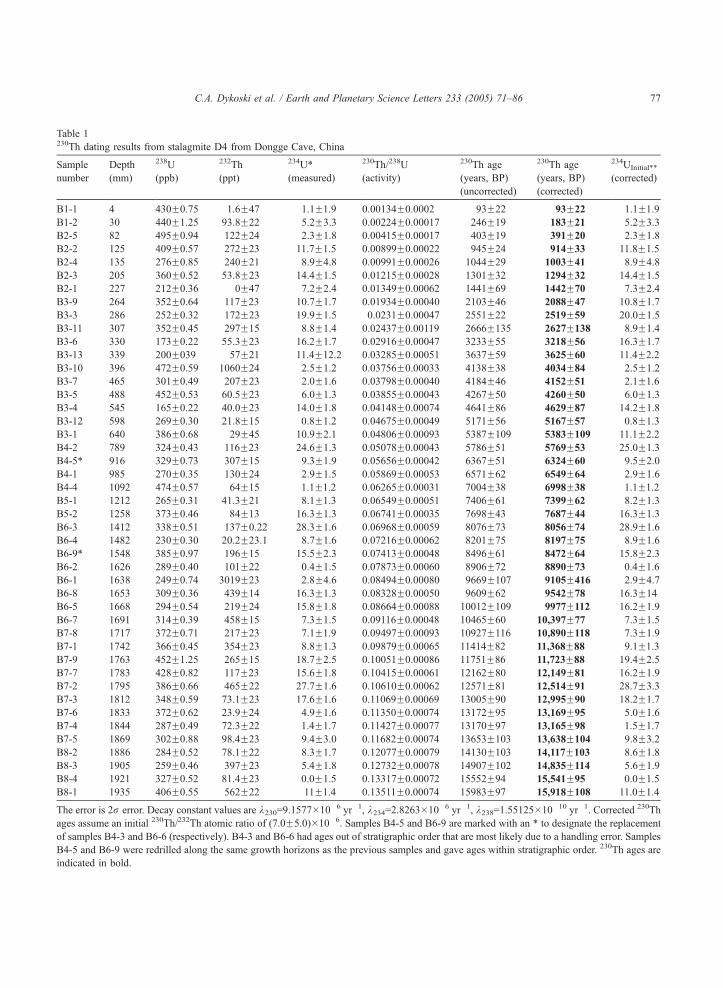
Table 1230Th dating results from stalagmite D4 from Dongge Cave, China
Sample
number
Depth
(mm)
238U
(ppb)
232Th
(ppt)
234UT(measured)
230Th/238U
(activity)
230Th age
(years, BP)
(uncorrected)
230Th age
(years, BP)
(corrected)
234UInitialTT
(corrected)
B1-1 4 430F0.75 1.6F47 �1.1F1.9 0.00134F0.0002 93F22 93F22 �1.1F1.9
B1-2 30 440F1.25 93.8F22 �5.2F3.3 0.00224F0.00017 246F19 183F21 �5.2F3.3
B2-5 82 495F0.94 122F24 �2.3F1.8 0.00415F0.00017 403F19 391F20 �2.3F1.8
B2-2 125 409F0.57 272F23 �11.7F1.5 0.00899F0.00022 945F24 914F33 �11.8F1.5
B2-4 135 276F0.85 240F21 �8.9F4.8 0.00991F0.00026 1044F29 1003F41 �8.9F4.8
B2-3 205 360F0.52 53.8F23 �14.4F1.5 0.01215F0.00028 1301F32 1294F32 �14.4F1.5
B2-1 227 212F0.36 0F47 �7.2F2.4 0.01349F0.00062 1441F69 1442F70 �7.3F2.4
B3-9 264 352F0.64 117F23 �10.7F1.7 0.01934F0.00040 2103F46 2088F47 �10.8F1.7
B3-3 286 252F0.32 172F23 �19.9F1.5 0.0231F0.00047 2551F22 2519F59 �20.0F1.5
B3-11 307 352F0.45 297F15 �8.8F1.4 0.02437F0.00119 2666F135 2627F138 �8.9F1.4
B3-6 330 173F0.22 55.3F23 �16.2F1.7 0.02916F0.00047 3233F55 3218F56 �16.3F1.7
B3-13 339 200F039 57F21 �11.4F12.2 0.03285F0.00051 3637F59 3625F60 �11.4F2.2
B3-10 396 472F0.59 1060F24 �2.5F1.2 0.03756F0.00033 4138F38 4034F84 �2.5F1.2
B3-7 465 301F0.49 207F23 �2.0F1.6 0.03798F0.00040 4184F46 4152F51 �2.1F1.6
B3-5 488 452F0.53 60.5F23 �6.0F1.3 0.03855F0.00043 4267F50 4260F50 �6.0F1.3
B3-4 545 165F0.22 40.0F23 �14.0F1.8 0.04148F0.00074 4641F86 4629F87 �14.2F1.8
B3-12 598 269F0.30 21.8F15 0.8F1.2 0.04675F0.00049 5171F56 5167F57 0.8F1.3
B3-1 640 386F0.68 29F45 �10.9F2.1 0.04806F0.00093 5387F109 5383F109 �11.1F2.2
B4-2 789 324F0.43 116F23 �24.6F1.3 0.05078F0.00043 5786F51 5769F53 �25.0F1.3
B4-5T 916 329F0.73 307F15 �9.3F1.9 0.05656F0.00042 6367F51 6324F60 �9.5F2.0
B4-1 985 270F0.35 130F24 �2.9F1.5 0.05869F0.00053 6571F62 6549F64 �2.9F1.6
B4-4 1092 474F0.57 64F15 1.1F1.2 0.06265F0.00031 7004F38 6998F38 1.1F1.2
B5-1 1212 265F0.31 41.3F21 �8.1F1.3 0.06549F0.00051 7406F61 7399F62 �8.2F1.3
B5-2 1258 373F0.46 84F13 �16.3F1.3 0.06741F0.00035 7698F43 7687F44 �16.3F1.3
B6-3 1412 338F0.51 137F0.22 �28.3F1.6 0.06968F0.00059 8076F73 8056F74 �28.9F1.6
B6-4 1482 230F0.30 20.2F23.1 �8.7F1.6 0.07216F0.00062 8201F75 8197F75 �8.9F1.6
B6-9T 1548 385F0.97 196F15 �15.5F2.3 0.07413F0.00048 8496F61 8472F64 �15.8F2.3
B6-2 1626 289F0.40 101F22 �0.4F1.5 0.07873F0.00060 8906F72 8890F73 0.4F1.6
B6-1 1638 249F0.74 3019F23 �2.8F4.6 0.08494F0.00080 9669F107 9105F416 �2.9F4.7
B6-8 1653 309F0.36 439F14 �16.3F1.3 0.08328F0.00050 9609F62 9542F78 �16.3F14
B6-5 1668 294F0.54 219F24 �15.8F1.8 0.08664F0.00088 10012F109 9977F112 �16.2F1.9
B6-7 1691 314F0.39 458F15 �7.3F1.5 0.09116F0.00048 10465F60 10,397F77 �7.3F1.5
B7-8 1717 372F0.71 217F23 �7.1F1.9 0.09497F0.00093 10927F116 10,890F118 �7.3F1.9
B7-1 1742 366F0.45 354F23 �8.8F1.3 0.09879F0.00065 11414F82 11,368F88 �9.1F1.3
B7-9 1763 452F1.25 265F15 �18.7F2.5 0.10051F0.00086 11751F86 11,723F88 �19.4F2.5
B7-7 1783 428F0.82 117F23 �15.6F1.8 0.10415F0.00061 12162F80 12,149F81 �16.2F1.9
B7-2 1795 386F0.66 465F22 �27.7F1.6 0.10610F0.00062 12571F81 12,514F91 �28.7F3.3
B7-3 1812 348F0.59 73.1F23 �17.6F1.6 0.11069F0.00069 13005F90 12,995F90 �18.2F1.7
B7-6 1833 372F0.62 23.9F24 �4.9F1.6 0.11350F0.00074 13172F95 13,169F95 �5.0F1.6
B7-4 1844 287F0.49 72.3F22 1.4F1.7 0.11427F0.00077 13170F97 13,165F98 1.5F1.7
B7-5 1869 302F0.88 98.4F23 �9.4F3.0 0.11682F0.00074 13653F103 13,638F104 �9.8F3.2
B8-2 1886 284F0.52 78.1F22 �8.3F1.7 0.12077F0.00079 14130F103 14,117F103 �8.6F1.8
B8-3 1905 259F0.46 397F23 �5.4F1.8 0.12732F0.00078 14907F102 14,835F114 �5.6F1.9
B8-4 1921 327F0.52 81.4F23 0.0F1.5 0.13317F0.00072 15552F94 15,541F95 0.0F1.5
B8-1 1935 406F0.55 562F22 �11F1.4 0.13511F0.00074 15983F97 15,918F108 �11.0F1.4
The error is 2r error. Decay constant values are k230=9.1577�10�6 yr�1, k234=2.8263�10�6 yr�1, k238=1.55125�10�10 yr�1. Corrected 230Th
ages assume an initial 230Th/232Th atomic ratio of (7.0F5.0)�10�6. Samples B4-5 and B6-9 are marked with an T to designate the replacement
of samples B4-3 and B6-6 (respectively). B4-3 and B6-6 had ages out of stratigraphic order that are most likely due to a handling error. Samples
B4-5 and B6-9 were redrilled along the same growth horizons as the previous samples and gave ages within stratigraphic order. 230Th ages are
indicated in bold.
C.A. Dykoski et al. / Earth and Planetary Science Letters 233 (2005) 71–86 77
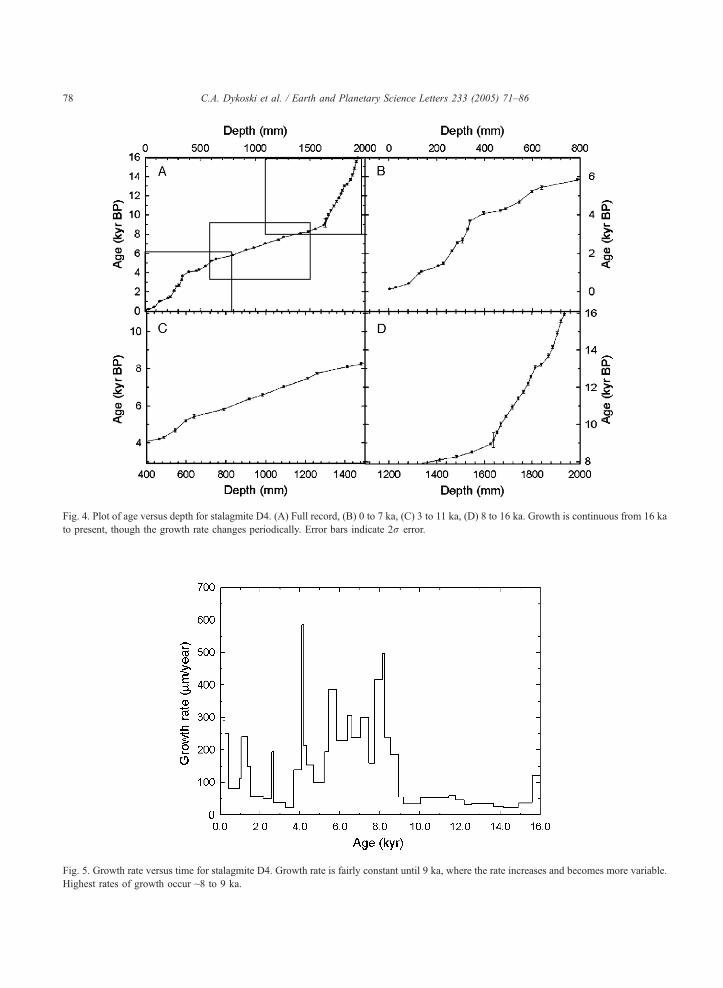
Fig. 4. Plot of age versus depth for stalagmite D4. (A) Full record, (B) 0 to 7 ka, (C) 3 to 11 ka, (D) 8 to 16 ka. Growth is continuous from 16 ka
to present, though the growth rate changes periodically. Error bars indicate 2r error.
Fig. 5. Growth rate versus time for stalagmite D4. Growth rate is fairly constant until 9 ka, where the rate increases and becomes more variable.
Highest rates of growth occur ~8 to 9 ka.
C.A. Dykoski et al. / Earth and Planetary Science Letters 233 (2005) 71–8678
Fig. 6. Stalagmite D4 oxygen isotope values versus time (black) and average summer insolation for 258N (gray). 45 230Th ages are also plotted
with 2r error bars.
C.A. Dykoski et al. / Earth and Planetary Science Letters 233 (2005) 71–86 79
Oscillation (11.2 ka, 1.05x) observed in the ice cores
from Greenland. The second event occurs at 10.9 ka
(1.15x) and also correlates with a climate shift in
Greenland. The largest of the early Holocene events
occurs at 9.2 ka, when y18O shifts to heavier values by
1.4x. This is similar to an event observed in the
NGRIP ice core at 9.2 ka. The last of the heavy y18Oexcursions in the early Holocene exists as two shifts in
y18O (~1x), which occur at 8260 and 8080 yr BP and
correlates within error with the 8200 yr BP Event
observed in Greenland. Growth rate, which had
remained relatively constant at values of ~40 Am/yr
until this point, increases at ~9 ka by over a factor of
10 and remains high for ~1000 yr (Fig. 5). After this
period of high growth rate, growth rate decreases but
remains ~100 to 400 Am/yr throughout the middle
Holocene. At ~6.8 ka, y18O values begin to lighten
until a low of �9x is reached ~6 ka. At this point,
y18O values again reverse toward heavier values with
an increase of 1.5x in 570 yr and growth rate slows
to ~100 Am/yr. From ~5.2 ka to 3.5 ka, y18O does not
show an increasing or decreasing trend, but appears to
fluctuate around a value of �8.2x. At ~4 ka, growth
slows to near minimum values of 20 Am/yr. Following
the period of steady y18O, an abrupt positive shift
occurs at 3550F59 yr BP (1.15x in 100 yr). This is
followed by a period of high amplitude changes in
y18O (up to 1.6x) which occurs for ~1.5 ka. Over the
last 2 ka, there is a slight decrease towards lighter
y18O values until modern values of about �8x are
reached.
Throughout the Holocene, y18O varies continually.
Several significant events occur in the early Holocene
including an event at 11.2 ka BP and 10.9 ka BP, the
prominent feature at ~9.3 ka BP and the double event
~8.2–8.1ka BP. High frequency variability of ~0.5 to
1x persists during the middle–late Holocene. The
largest y18O change in the middle to late Holocene is
observed at ~3.5 ka with a sharp unidirectional event.
Growth rate broadly follows trends in y18O as
increases in growth correlate with periods of light
y18O. This relationship supports the idea that changes
in integrated precipitation are the ultimate cause of
changes in the y18O record [12].
4.4. Spectral analysis
Spectral analysis was performed on the y18Orecord from Dongge Cave using the program MTAP
[27]. The multi-taper method approach used a
bandwidth factor of 3 and 5 tapers (degrees of
freedom) at high resolution. Fig. 7 shows four
different time series that were analyzed. First, the
whole data set (~16 ka to present, including both the
deglacial and Holocene portions of the record) was
run with an average sampling of 19 yr per sample,
thereby giving a cutoff interval of reliable periodici-
ties at ~40 yr. These results are given in Fig. 7A and
Frequency (1/yr) Frequency (1/yr)
Spect
rum
Pow
er
Spect
rum
Pow
er
121
110
98
93
86 81 68
55
51
208
227
417
181
6.6
6.4
5.1
11.6
44
2.3
2.4
13
11
45
548
8
19
19
A 0-16 ka C 8110-8250 y
B 0-11 ka D 100-400 y
41
6
25
0
21
72
27
17
9
12
71
14
10
210
9
85 7382
65 55 43
39
Fig. 7. Spectral analysis results for D4. (A) Full y18O record (~16 ka to present), (B) Holocene (~11 ka to present), (C) high resolution y18Orecord from 8110 to 8250 yr, and (D) high resolution y18O record from 100–400 yr. Peaks are labeled with their period in years. Due to different
sampling intervals, the Nyquist frequency or reliable cutoff frequency varies for each run. Each plot shows only those frequencies that are below
the Nyquist frequency. Note the different scales for each plot.
C.A. Dykoski et al. / Earth and Planetary Science Letters 233 (2005) 71–8680
show statistically significant periodicities at the 90%
confidence level at 417, 227, 208, 181, 121, 110, 98,
93, 86, 81, 68, 55, and 51 yr. A second portion of the
record that contained only the Holocene (~11 ka to
present) was examined which has a slightly higher
sampling interval of 15 yr per sample. These results
are shown in Fig. 7B and are very similar to Fig. 7A.
Two high-resolution portions of the record were also
examined (Fig. 7C and D). The first consisted of 140
yr of the data from 8110 to 8250 yr BP with an
average sampling of ~1 yr per sample, thereby giving
a cutoff interval of ~2 yr. These results are given in
Fig. 7C and show significant periodicities at 44, 6.6,
6.4, 5.1, 4.8, 2.4–2.3 yr. Fig. 7D shows the results of
the other high-resolution portion of the data from 100
to 400 yr BP. This time interval is double the length of
the previous run but has lower resolution sampling
averaging at 3 yr per sample. This makes it impossible
to determine periodicities less than 6 yr. Fig. 7D
shows the addition of peaks at 13 yr and 11 yr
periodicities.
5. Climate discussion
Stalagmite D4 shows features similar to deglacial
features seen in Greenland, including the Bolling/
Allerod and Younger Dryas periods. This correlation
agrees with the results from Hulu Cave [8], thus
confirming that the relationship between the monsoon
and Greenland temperature is maintained throughout
the deglacial sequence as well as broadening the
relationship between the Asian monsoon and North
Atlantic climate to a larger area of China [12].
C.A. Dykoski et al. / Earth and Planetary Science Letters 233 (2005) 71–86 81
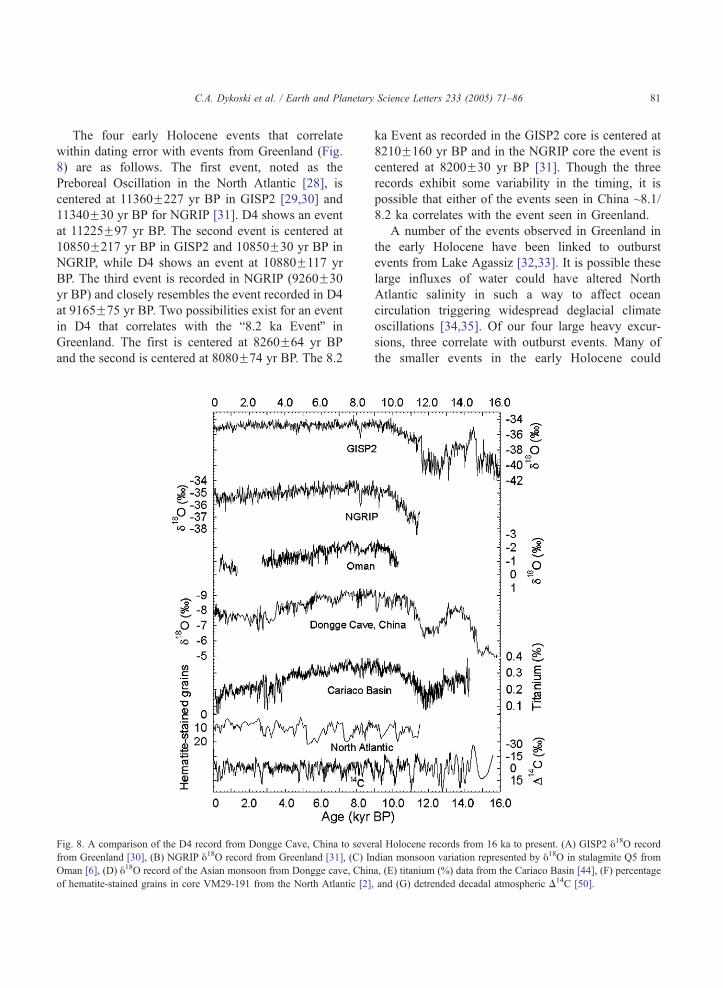
The four early Holocene events that correlate
within dating error with events from Greenland (Fig.
8) are as follows. The first event, noted as the
Preboreal Oscillation in the North Atlantic [28], is
centered at 11360F227 yr BP in GISP2 [29,30] and
11340F30 yr BP for NGRIP [31]. D4 shows an event
at 11225F97 yr BP. The second event is centered at
10850F217 yr BP in GISP2 and 10850F30 yr BP in
NGRIP, while D4 shows an event at 10880F117 yr
BP. The third event is recorded in NGRIP (9260F30
yr BP) and closely resembles the event recorded in D4
at 9165F75 yr BP. Two possibilities exist for an event
in D4 that correlates with the b8.2 ka EventQ in
Greenland. The first is centered at 8260F64 yr BP
and the second is centered at 8080F74 yr BP. The 8.2
Fig. 8. A comparison of the D4 record from Dongge Cave, China to seve
from Greenland [30], (B) NGRIP y18O record from Greenland [31], (C) In
Oman [6], (D) y18O record of the Asian monsoon from Dongge cave, Chin
of hematite-stained grains in core VM29-191 from the North Atlantic [2]
ka Event as recorded in the GISP2 core is centered at
8210F160 yr BP and in the NGRIP core the event is
centered at 8200F30 yr BP [31]. Though the three
records exhibit some variability in the timing, it is
possible that either of the events seen in China ~8.1/
8.2 ka correlates with the event seen in Greenland.
A number of the events observed in Greenland in
the early Holocene have been linked to outburst
events from Lake Agassiz [32,33]. It is possible these
large influxes of water could have altered North
Atlantic salinity in such a way to affect ocean
circulation triggering widespread deglacial climate
oscillations [34,35]. Of our four large heavy excur-
sions, three correlate with outburst events. Many of
the smaller events in the early Holocene could
ral Holocene records from 16 ka to present. (A) GISP2 y18O record
dian monsoon variation represented by y18O in stalagmite Q5 from
a, (E) titanium (%) data from the Cariaco Basin [44], (F) percentage
, and (G) detrended decadal atmospheric D14C [50].
C.A. Dykoski et al. / Earth and Planetary Science Letters 233 (2005) 71–8682
correlate with outburst events but dating uncertainties
preclude making a precise correlation. The Greenland/
Dongge Cave correlations indicate that the close
relationship observed during the glacial period
between the monsoon and Greenland climate [8]
extends into the early Holocene. However, subsequent
to 8 ka, stalagmite D4 shows proportionally more
y18O variability than GISP2 and NGRIP.
The trend toward increasingly lighter y18O values
in the early Holocene and then decline toward
heavier y18O values in the mid–late Holocene
follows the general trend of incoming solar radiation
(Fig. 6). Correlation between monsoon intensity and
insolation has been predicted [36] and demonstrated
[8,37–39] by other records of the monsoon. How-
ever in the Holocene, peak monsoon intensity and
peak insolation values do not exactly coincide as
they do in the last interglacial and glacial periods.
As observed in other Holocene monsoon records
[6,40], maximum monsoon intensity appears to lag
insolation by 2 to 3 ky. To explain this observation,
a correlation between monsoon strength and North
Atlantic warmth in the early–mid Holocene [40]
suggests that glacial climate boundary conditions, in
addition to solar insolation, influenced climate at
this time. It was only after the ice sheets had
retreated that insolation began to dominate the
monsoon. The D4 monsoon record provides evi-
dence to support this as a possible explanation.
Into the mid–late Holocene as solar radiation
values decline, the strength of the summer monsoon
decreases. Previous records of Asian monsoon inten-
sity show a gradually weakening monsoon that
appears to mimic the smooth, declining radiation
values [40,41]. The Dongge Cave stalagmite, D4,
does not show this gradual decline. In fact, it shows a
series of sharp drops in monsoon intensity throughout
the Holocene. The interval between 5650 and 5220 yr
BP is characterized by a generally weakening
monsoon. An initial small, but abrupt drop occurs at
5650F70 yr BP followed by a trend toward heavy
y18O values lasting ~400 yr. This interval coincides
with the abrupt decrease of moisture in the African
continent and the end of the African humid period
(~5490F190 yr BP) [42]. A study using paired t-tests
of multiple proxies of the Asian monsoon from
eastern Africa to northeast China also found evidence
for a sharp drop in monsoon intensity ~4.5 to 5 ka
[43]. In our record, a second, larger decrease in
monsoon intensity occurred at 3550F59 yr BP. This
abrupt event likely correlates with an abrupt shift in
titanium observed in the Cariaco Basin [44], and
possibly correlates with the beginning of Event 2 in
ocean cores from the North Atlantic [2]. The stepwise
decrease in Asian monsoon intensity in the mid–late
Holocene suggests the possibility of threshold effects.
Variation in y18O of 0.5 to 1x is spaced throughout
the Holocene with some similarities to centennial-
scale events seen in other Holocene records [2,6,44].
It is important to note that the magnitude of some of
these y18O changes in the Holocene is almost half the
amplitude of the glacial interstadial events seen in the
last glacial period, which would indicate that signifi-
cant climate variability characterizes the Holocene
monsoon.
The record of the Holocene from Dongge Cave is
similar to other Holocene records collected from other
tropical and subtropical locations. Overall, there is a
close correspondence between the Indian monsoon
record obtained from stalagmite Q5 from Oman [6]
and the monsoon record from D4. Both records show
monsoon intensity generally following changes in
solar insolation with periods of lighter y18O values
representing high monsoon intensity. Missing time in
Q5 coincides with a period of minimum monsoon
intensity in D4 and suggests that a threshold level of
monsoon strength was required for stalagmite growth
to occur in Oman. In addition, two heavy shifts in
y18O values ~9.2 ka and ~8.2 ka occur in both
records. In Q5, a small (~0.5x), period of heavy y18Ovalues occurs between 8.6 ka and 8.2 ka, while D4
records two brief deviations at ~8.1/8.2 ka. Some
minor differences exist such as the sharp shift in y18Oof D4 at ~3.5 ka, which is not observed in the Q5
record. These differences would suggest that the
Indian monsoon in Oman behaves somewhat differ-
ently than the monsoon recorded in China, possibly
due to different moisture source regions (all Indian
Ocean versus Indian and Pacific Ocean sources).
However for most of the Holocene, distinct correla-
tions exist.
D4 and the bulk titanium data from the Cariaco
Basin [44] bear a remarkable resemblance throughout
the Holocene (Fig. 8). Variations are decadal- to
centennial-scale in both records and features are
similar even in the details. From ~4 ka to 2 ka, high
C.A. Dykoski et al. / Earth and Planetary Science Letters 233 (2005) 71–86 83
amplitude variations exist in both records which could
be related to increased El Nino-Southern Oscillation
(ENSO) variability [44]. These two records most
likely are connected as they both represent some
manifestation of the intertropical convergence zone
(ITCZ). The ITCZ directly controls the location of
precipitation over the South American continent and
changes in its position affect how much rainfall occurs
and therefore the degree of river runoff (as inferred
from percent Ti in Cariaco sediments) from northern
South America. The ITCZ has a similar effect in
China whereby the monsoon front, and therefore
precipitation, can be considered a manifestation of the
ITCZ [45].
The monsoon record from Dongge Cave as well as
those records mentioned above document significant
Holocene climate variability at centennial-scales.
Other records from the Holocene also show more
long-term variability [2] similar to that which is
observed during the last glacial period [1]. However,
spectral analysis of stalagmite D4 does not show
significant power at millennial frequencies. Despite
this absence, it is plausible that several of the extreme
lows in our monsoon record correlate with North
Atlantic ice-rafting events [2], with the best example
being the correlation between ice-rafting Event 2 and
the weak monsoon immediately after the 3.5 ka abrupt
drop. The amount of snow cover on the Tibetan
Plateau has been associated with variations in
monsoon intensity [46]. Changes in the strength of
Eurasian winters related to periods of changing North
Atlantic Deep Water formation have the potential to
affect snowfall over the Plateau, which ultimately
could be responsible for the link between the North
Atlantic ice-rafting events and changes in monsoon
intensity [5,6]. Plausibly only the largest ice-rafted
events triggered an observable response in China.
The results from D4 suggest similar changes in the
monsoon between Hulu Cave and Dongge Cave
throughout the last deglacial period. This would
suggest that changes in the monsoon over this region
of China were synchronous over this period. In
addition, the Holocene monsoon record from D4
correlates to monsoon changes in Oman as well as the
hydrological changes in South America suggesting
further synchronicity between the larger Asian mon-
soon system and climate at other tropical and
subtropical localities. These observations do not
support earlier work suggesting spatially asynchro-
nous changes in the monsoon over China [47,48].
However, the low density of our sites in China is
insufficient to definitively address this issue. Thus, the
resolution of this question must await further study.
Solar forcing is a mechanism that has been used
to explain centennial- and shorter-scale variation
observed in climate records. A common proxy for
measuring changes in solar activity is 14C. 14C is
produced in the upper atmosphere and its production
is related to how much magnetic shielding the Earth
experiences. During periods of lowered sunspot
activity, solar wind intensity is reduced, which
increases the influx of galactic cosmic rays. A
higher influx of cosmic rays increases the produc-
tion of 14C in the atmosphere. The reverse is true
during periods of increased sunspot activity when
less 14C is produced. Therefore, changes in atmos-
pheric D14C can be related to changes in solar
activity. Damon and Peristyhk [49] present results of
the Fourier spectral analysis of detrended decadal
[50] and single-year [51] D14C data. Several
periodicities are present and have been interpreted
in terms of solar activity including: (1) the 207-yr
De Vries frequency, (2) the 88-yr Gleissberg
frequency, and (3) the 10.4-yr Schwabe sunspot
cycle.
Bond et al. [2] suggest that the 14C record and the
millennial events seen in North Atlantic sediment
cores are related. The cores were correlated with the
D14C record and explained in large part by a solar
forcing mechanism. Spectral analyses on Oman
speleothems from the early to middle Holocene [5,6]
yield spectral peaks at solar frequencies seen in the
D14C record of tree rings [52], thereby linking
variations in the Indian monsoon to solar activity.
Spectral analysis of D4 also shows that solar output
plays a role in controlling the monsoon and we see
this when we statistically compare it to the D14C
record. If we consider spectral analysis of the full
record, two solar cycles (207 and 88 yr) observed in
the D14C record are similar to two cycles seen in the
y18O record from Dongge cave (208 and 86 yr). If we
analyze only the Holocene portion of the record, two
similar cycles (217 and 85 yr) are present. Consider-
ing the high-resolution portion of the record from 100
to 400 yr we observe a periodicity at 11.6 yr, which is
similar to the D14C periodicity of 10.4 yr. The three
C.A. Dykoski et al. / Earth and Planetary Science Letters 233 (2005) 71–8684
corresponding periodicities of 207, 88 and 11.6 years
were also observed in the monsoon record from Oman
[5,6] demonstrating that solar forcing is an important
control on monsoon intensity for a large part of the
Asian monsoon system. However, the D4 monsoon
spectrum has many other periodicities which do not
correspond to solar frequencies, indicating other
controls of monsoon intensity.
The modern Asian monsoon shows a strong
biennial oscillation between periods of strong and
weak monsoons which is an active part of the
tropospheric biennial oscillation (TBO) [53,54]. This
distinctive periodicity (2–3 yr), which has been
observed in the mid-Holocene [19], is contained in
the spectral analysis results of the high-resolution
portion of D4 from 8110 to 8250 yr BP (2.3 yr). This
would suggest that mechanisms causing the oscilla-
tion in the modern monsoon were in place as early as
8 ka.
It is likely that other controls of monsoon intensity
are broadly related to changes on oceanic and
atmospheric circulation. A specific example of this
broad type of control is El Nino-Southern Oscillation
(ENSO) [55]. The ENSO phenomenon results from a
coupling of oceanic and atmospheric processes and
creates a distinct pattern of anomalies in the Pacific
basin on interannual time scales. Since part of the
Asian monsoon originates from the Western Pacific, it
is likely that ENSO affects the monsoon. The spectral
peaks from the high resolution y18O record between
8110 yr and 8250 yr show a number of signature
periodicities between 2 and 8 yr (Fig. 7C) which
correlate with past and present El Nino periodicities
[56,57]. This suggests that ENSO influences the
monsoon and that changes in ENSO [44] could be
responsible for some of the monsoon variability
observed in the Holocene.
6. Conclusions
The Dongge Cave stalagmite record demonstrates
that Asian monsoon intensity generally follows
changes in insolation and that the response is
similar for a large area of China. The mid–late
Holocene step-wise decreases in Asian monsoon
intensity as well as the presence of centennial-scale
events throughout the record demonstrate the vari-
ability of the monsoon and its ability to shift
abruptly. The centennial- and shorter-scale amplitude
of variation is 0.5 to 1x, up to half of a last glacial
period interstadial event as observed in the Asian
monsoon [30]. Multiple y18O events greater than
1x (11.2 ka, 10.9 ka, 9.2 ka, and 8.2 ka) show
similarities with changes in the North Atlantic
region, possibly related to outburst events from
glacial Lake Agassiz. Therefore, the relationship
between Greenland and the Asian monsoon, which
was observed during the last glacial period, appears
to be maintained into the earliest millennia of the
Holocene.
Throughout the Holocene, the Asian monsoon
exhibits variability, which is highly correlated with
other northern low-latitude records. This correlation
signifies strong ties between the Asian monsoon and
these regions. Asian monsoon intensity and South
American hydrological changes show a very strong
correlation and are related by changes in ITCZ
position. We have clear evidence that some of the
variability in the monsoon can be explained by solar
variability, as we find significant power at DeVries,
Gleissburg, and Schwabe periodicities. However,
additional features besides insolation and solar
variations must also affect the monsoon as there is
significant spectral power at numerous sub-decadal-
to multi-century-scale bnon-solar frequenciesQ. It is
likely that these periodicities are broadly related to
changes in ocean and atmosphere circulations with
ENSO being an example of one such phenomenon.
In addition, a strong biennial oscillation is observed
in the monsoon as early as ~8 ka, suggesting the
mechanism was in place during the early Holocene.
Acknowledgements
We are grateful to G. Comer and W. Broecker for
their generous support of our work and Broecker’s
suggestion of possible links to outflow events.
Financial support for this research was funded by
NSF grants ESH0214041 and MRI0116395; a Gary
Comer Science and Education Foundation Grant
(CC8); the National Science Foundation of China
grants 40328005 and 40231008; and grants from the
Ministry of Land and Resources and the Ministry of
Science and Technology of China.
C.A. Dykoski et al. / Earth and Planetary Science Letters 233 (2005) 71–86 85
Appendix A. Supplementary data
Supplementary data associated with this article can
be found, in the online version, at doi:10.1016/
j.epsl.2005.01.036.
References
[1] P. Grootes, M. Stuiver, Oxygen 18/16 variability in Greenland
snow and ice with 103- to 105-year time resolution,
J. Geophys. Res. 102 (C12) (1997) 26455–26470.
[2] G. Bond, B. Kromer, J. Beer, R. Muscheler, M.N. Evans, W.
Showers, S. Hoffmann, R. Lotti-Bond, I. Hajdas, G. Bonani,
Persistent solar influence on North Atlantic climate during the
Holocene, Science 294 (2001) 2130–2136.
[3] P. deMenocal, J. Ortiz, T. Guilderson, M. Sarnthein, Coherent
high- and low-latitude climate variability during the Holocene
warm period, Science 288 (2000) 2198–2202.
[4] J.H. Yin, D.S. Battisti, The importance of tropical sea surface
temperature patterns in simulations of Last Glacial Maximum
climate, J. Climate 14 (2000) 565–581.
[5] U. Neff, S.J. Burns, A. Mangini, M. Mudelsee, D. Fleitmann,
A. Matter, Strong coherence between solar variability and the
monsoon in Oman between 9 and 6 kyr ago, Nature 411
(2001) 290–293.
[6] D. Fleitmann, S.J. Burns, M. Mudelsee, U. Neff, J. Kramers,
A. Mangini, A. Matter, Holocene forcing of the Indian
Monsoon recorded in a stalagmite from southern Oman,
Science 300 (2003) 1737–1739.
[7] R.L. Edwards, J.H. Chen, G.J. Wasserburg, 238U–234U–230Th–232Th systematics and the precise measurement
of time over the past 500,000 years, Earth Planet. Sci. Lett. 81
(1987) 175–192.
[8] Y.J. Wang, H. Cheng, R.L. Edwards, Z.S. An, J.Y. Wu, C.C.
Shen, J.A. Dorale, A high resolution absolute-dated late
Pleistocene monsoon record from Hulu Cave, China, Science
294 (2001) 2345–2348.
[9] W. Dansgaard, S.J. Johnsen, H.B. Clausen, D. Dahl-Jensen,
N.S. Gundestrup, C.U. Hammer, C.S. Hvidberg, J.P. Steffen-
sen, A.E. Sveinbjornsdottir, J. Jouzel, G. Bond, Evidence for
general instability of past climate from a 250-kyr ice-core
record, Nature 364 (1993) 218–220.
[10] W.S. Broecker, Massive iceberg discharges as triggers for
global climate change, Nature 372 (6505) (1994) 421–424.
[11] Y.H. Ding, C.Y. Li, Y.J. Liu, Overview of the South China
sea monsoon experiment, Adv. Atmos. Sci. 21 (3) (2004)
343–360.
[12] D. Yuan, H. Cheng, R.L. Edwards, C.A. Dykoski, M.J.
Kelly, M. Zhang, J. Qing, Y. Lin, Y.J. Wang, J.Y. Wu, J.A.
Dorale, Z.S. An, Y.J. Cai, Timing, duration, and transitions
of the Last Interglacial Asian monsoon, Science 304 (2004)
575–578.
[13] M.J. Kelly, R.L. Edwards, H. Cheng, D. Yuan, Y.J. Cai, M.
Zhang, Y. Lin, Z.S. An, High resolution characterization of the
Asian monsoon climate during MIS 5 and 6, Palaeogeogr.
Palaeoclimatol. Palaeoecol. (submitted for publication).
[14] J.A. Dorale, R.L. Edwards, E.C. Alexander Jr., C.C. Shen,
D.A. Richards, H. Cheng, Uranium-series Dating of Speleo-
thems: Current Techniques, Limits, and Applications, Kluwer
Academic/Plenum, New York, 2001.
[15] C.C. Shen, R.L. Edwards, H. Cheng, J.A. Dorale, R.B.
Thomas, S.B. Moran, S.E. Weinstein, H.N. Edmonds, Ura-
nium and thorium isotopic concentration measurements by
magnetic sector inductively coupled plasma mass spectrome-
try, Chem. Geol. 185 (2002) 165–178.
[16] J.A. Dorale, R.L. Edwards, E. Ito, L.A. Gonzalez, Climate and
vegetation history of the midcontinent from 75–25 ka: a
speleothem record from Crevice Cave, Missouri, USA,
Science 282 (1998) 1871–1874.
[17] C.H. Hendy, The isotopic geochemistry of speleothems—I.
The calculation of the effects of different modes of formation
on the isotopic composition of speleothems and their applic-
ability as palaeoclimatic indicators, Geochim. Cosmochim.
Acta 35 (1971) 801–824.
[18] I. Friedman, J.R. O’Neil, in: M. Fleischer (Ed.), Data of
Geochemistry, U.S. Geological Survey Professional Paper,
440-KK, 1977.
[19] D. Sun, M. Gagan, H. Cheng, H. Scott-Gagan, C.A. Dykoski,
R. Su, R.L. Edwards, Seasonal and interannual variability of
the mid-Holocene East Asian monsoon in coral y18O records
from the South China Sea, Earth Planet. Sci. Lett. (submitted
for publication).
[20] D.P. Schrag, G. Hampt, D. Murray, Pore fluid constraints on
the temperature and oxygen isotopic composition of the glacial
ocean, Science 272 (5270) (1996) 1930–1932.
[21] R.G. Fairbanks, A 17,000-year glacio-eustatic sea-level
record: influence of glacial melting rates on the Younger
Dryas event and deep-ocean circulation, Nature 342 (1989)
637–642.
[22] E. Bard, B. Hamelin, M. Arnold, L. Montaggioni, G. Cabioch,
G. Faure, F. Rougerie, Deglacial sea-level record from Tahiti
corals and the timing of global meltwater discharge, Nature
382 (1996) 241–244.
[23] R.L. Edwards, C.D. Gallup, H. Cheng, Uranium-series dating
of marine and lacustrine carbonates, in: B. Bourdon, G.M.
Henderson, C.C. Lundstrom, S.P. Turner (Eds.), Uranium-
series Geochemistry, vol. 52, Mineralogical Society of
America, Washington, DC, 2003, pp. 364–405.
[24] R. Gomez, L.A. Gonzalez, H. Cheng, R.L. Edwards, F.
Urbani, GSA Abstracts with Programs, Seattle Annual Meet-
ing, 2003.
[25] M. Bar-Matthews, A. Ayalon, M. Gilmour, A. Matthews, C.J.
Hawkesworth, Sea–land oxygen isotopic relationships from
planktonic foraminifera and speleothems in the Eastern
Mediterranean region and their implication for paleorainfall
during interglacial intervals, Geochim. Cosmochim. Acta 67
(2003) 3181–3199.
[26] W. Dansgaard, Stable isotopes in precipitation, Tellus 16
(1964) 436–468.
[27] J.M. Lees, J. Park, Multiple-taper spectral analysis: a stand-
alone C-subroutine, Comput. Geosci. 21 (1995) 199–236.
C.A. Dykoski et al. / Earth and Planetary Science Letters 233 (2005) 71–8686
[28] S. Bjorck, B. Kromer, S. Johnsen, O. Bennike, D. Hammar-
lund, G. Lemdahl, G. Possnert, T.L. Rasmussen, B. Wohlfarth,
C.U. Hammer, M. Spurk, Synchronized terrestrial-atmospheric
deglacial records from around the North Atlantic, Science 274
(5290) (1996) 1155–1160.
[29] D.A. Meese, A.J. Gow, R.B. Alley, G.A. Zielinski, P. Grootes,
M. Ram, K.C. Taylor, P.A. Mayewski, J.F. Bolzan, The
Greenland ice sheet project 2 depth-age scale: methods and
results, J. Geophys. Res. 102 (C12) (1997) 26411–26423.
[30] GISP2, The Greenland Summit Ice Cores, National Snow
and Ice Data Center, University of Colorado at Boulder,
and the World Data Center-A for Paleoclimatology,
National Geophysical Data Center, Boulder Colorado, 1997.
(CD-ROM).
[31] S. Johnsen, D. Dahl-Jensen, N.S. Gundestrup, J.P. Steffensen,
H.B. Clausen, H. Miller, V. Masson-Delmotte, A.E. Sveinb-
jornsdottir, J. White, Oxygen isotope and palaeotemperature
records from six Greenland ice-core stations: camp century,
Dye-3, GRIP, GISP2, Renland and NorthGRIP, J. Quat. Sci. 16
(4) (2001) 299–307.
[32] J.T. Teller, D.W. Leverington, Glacial Lake Agassiz: a 5000 yr
history of change and its relationship to the 18O record of
Greenland, Geol. Soc. Amer. Bull. 116 (2004) 729–742.
[33] J.T. Teller, D.W. Leverington, J.D. Mann, Freshwater outbursts
to the oceans from glacial Lake Agassiz and their role in
climate change during the last deglaciation, Quat. Sci. Rev. 21
(2002) 879–887.
[34] W.S. Broecker, Salinity history of the Northern Atlantic during
the last deglaciation, Paleoceanography 5 (4) (1990) 459–467.
[35] W.S. Broecker, G. Bond, M. Klas, G. Bonani, W. Wolfli, A
salt oscillator in the glacial Atlantic: 1. The concept,
Paleoceanography 5 (4) (1990) 469–477.
[36] J.E. Kutzbach, Monsoon climate of the early Holocene:
climate experiment with the Earth’s orbital parameters for
9000 years ago, Science 214 (1981) 59–61.
[37] S. Clemens, W. Prell, D. Murray, G. Shimmield, G. Weedon,
Forcing mechanisms of the Indian Ocean monsoon, Nature
353 (6346) (1991) 720–725.
[38] M. Cohmap, Climatic changes of the last 18,000 years:
observations and model simulations, Science 241 (4869)
(1988) 1043–1052.
[39] J.E. Kutzbach, Z. Liu, Response of the African monsoon to
orbital forcing ocean feedbacks in the middle Holocene,
Science 278 (5337) (1997) 440–443.
[40] J. Overpeck, D. Anderson, S. Trumbore, W. Prell, The
southwest Indian Monsoon over the last 18,000 years, Clim.
Dyn. 12 (3) (1996) 213–225.
[41] K. Wei, F. Gasse, Oxygen isotopes in lacustrine carbonates of
West China revisited: implications for post glacial changes in
summer monsoon circulation, Quat. Sci. Rev. 18 (2) (1999)
1315–1334.
[42] P. deMenocal, J. Ortiz, T. Guilderson, J. Adkins, M. Sarnthein,
L. Baker, M. Yarusinsky, Abrupt onset and termination of the
African humid period: rapid climate responses to gradual
insolation forcing, Quat. Sci. Rev. 19 (2000) 347–361.
[43] C. Morrill, J. Overpeck, J.E. Cole, A synthesis of abrupt
changes in the Asian summer monsoon since the last
deglaciation, Holocene 13 (4) (2003) 465–476.
[44] G.H. Haug, K.A. Hughen, D.M. Sigman, L.C. Peterson, U.
Rohl, Southward migration of the intertropical convergence
zone through the Holocene, Science 293 (2001) 1304–1308.
[45] S. Gadgil, The Indian monsoon and its variability, Annu. Rev.
Earth Planet. Sci. 31 (2003) 429–467.
[46] G.A. Meehl, Influence of the land surface in the Asian summer
monsoon: external conditions versus internal feedbacks,
J. Climate 7 (7) (1994) 1033–1049.
[47] Z.S. An, S.C. Porter, J.E. Kutzbach, W. Xihao, W. Suming, L.
Xiaodong, Z. Weijian, Asychronous Holocene optimum of the
East Asian monsoon, Quat. Sci. Rev. 19 (8) (2000) 743–762.
[48] Y. He, W.H. Theakstone, Z. Zhonglin, Z. Dian, Y. Tandong, C.
Tuo, S. Yongping, P. Hongxi, Asynchronous Holocene
climatic change across China, Quat. Res. 61 (2004) 52–63.
[49] P.E. Damon, A.N. Peristykh, Radiocarbon calibration and
application to geophysics, solar physics, and astrophysics,
Radiocarbon 42 (1) (2000) 137–150.
[50] M. Stuiver, P.J. Reimer, E. Bard, J.W. Beck, G.S. Burr, K.A.
Hughen, B. Kromer, G. McCormac, J. Van Der Plicht, M.
Spurk, INTCAL98 radiocarbon age calibration, 24,000-0 cal
BP, Radiocarbon 40 (3) (1998) 1041–1083.
[51] P.E. Damon, C.J. Eastoe, M.K. Hughes, R.M. Kalin, A. Long,
A.N. Peristykh, Secular variation of D14C during the
Medieval Solar Maximum: a progress report, Radiocarbon
40 (1) (1998) 343–350.
[52] M. Stuiver, T.F. Braziunas, Sun, ocean, climate and atmos-
pheric 14CO2: an evaluation of causal and spectral relation-
ships, Holocene 3 (1993) 289–305.
[53] K.M. Kim, K.M. Lau, Dynamics of monsoon-induced biennial
variability in ENSO, Geophys. Res. Lett. 28 (2001) 315–318.
[54] G.A. Meehl, The South Asian monsoon and the tropospheric
biennial oscillation, J. Climate 10 (1997) 1921–1943.
[55] M.A. Cane, El Nino, Annu. Rev. Earth Planet. Sci. 14 (1986)
43–70.
[56] D.T. Rodbell, G.O. Seltzer, D.M. Anderson, M.B. Abbott,
D.B. Enfield, J.H. Newman, An ~15,000-year record of El
Nino-driven alluviation in southwestern Ecuador, Science 283
(1999) 516–520.
[57] K.E. Trenberth, The definition of El Nino, Bull. Am.
Meteorol. Soc. 78 (1997) 2771–2777.
Related Documents