Sensors and Actuators B 111–112 (2005) 193–199 A high-performance measurement system for simultaneous mass and resistance variation measurements on gas sensing polymer films A. Fort a,∗ , S. Rocchi a , M.B. Serrano-Santos a , N. Ulivieri a , V. Vignoli a , G. Pioggia c , F. Di Francesco b a Department of Information Engineering, University of Siena, Via Roma 56, 53100-Siena, Italy b National Research Council, Institute of Clinical Physiology, Via G. Moruzzi 1, 56100-Pisa, Italy c Centro Interdipartimentale Enrico Piaggio, University of Pisa, Via Diotisalvi 2, 56100-Pisa, Italy Abstract This paper describes a high-performance system set-up for measurements with gas sensitive polymeric layers. The polymeric films are deposited on prototypal Quartz Crystal Microbalance sensors that allow both quartz frequency resonance variation and polymer resistance measurements. This capability adds new dimensions to the feature space allowing the improvement of the system performance. The mea- surement system is able to simultaneously measure the polymer resistance as well as the QCM frequency variation with high resolution (<2 /60 k and <0.1 Hz/10 MHz) and fast sampling rate (≈20 ms). © 2005 Elsevier B.V. All rights reserved. Keywords: QCM sensors; Conducting polymers; Electronic nose; IEEE 1451.4 1. Introduction Classification of chemical compounds and gas mixtures is of great interest in many applications like food pack- ing, aroma classification and environmental monitoring. The use of artificial olfactory systems, that are often called “electronic noses”, is one of the common approaches used to accomplish this task. Conductive polymer [1,2,8] and ‘yielded’ conductive (e.g. carbon-black polymers [7]) films are among the gas sensing elements most commonly and widely used in such systems. Polymer films are very attrac- tive for vapor/odor sensing applications because of the wide range of available materials and the ease of deposition, the ability to operate at room temperature (i.e. low device power consumption), and sensitivity to a broad range of volatile organic compounds. Usually polymeric layers are used to realize conductive sensors, for which a change in the sensor ∗ Corresponding author. Tel.: +39 0577 233608; fax: +39 0577 233602. E-mail address: [email protected] (A. Fort). URL: http://www.dii.unisi.it. resistance is monitored while the sensor is exposed to the gas. The polymer mass change upon exposure to gases is also exploited in electronic olfactory systems based on Quartz Crystal Microbalance (QCM) sensors. For this type of sensors, the frequency shift due to the gas sorption, and hence to the mass change, is the measured quantity. This parameter can be measured by means of simple equipment but significant sensor performance improvements can be obtained when exploiting the dynamical behavior of the resonance frequency [3]. This must be accomplished by using sophisticated measurement equipment such as the one presented in [3]. Moreover, a further improvement can be obtained with the simultaneous measurement of the poly- mer resistance as well as the QCM frequency [17,18]. Nev- ertheless, this opportunity is rarely exploited. This paper presents a custom sensor class and a measurement system able to simultaneously track the two mentioned quantities with a very high resolution, both for frequency (<10 ppb) and resistance (<30 ppm) measurements, and fast sampling rate. 0925-4005/$ – see front matter © 2005 Elsevier B.V. All rights reserved. doi:10.1016/j.snb.2005.07.031

Welcome message from author
This document is posted to help you gain knowledge. Please leave a comment to let me know what you think about it! Share it to your friends and learn new things together.
Transcript
Sensors and Actuators B 111–112 (2005) 193–199
A high-performance measurement system forsimultaneous mass and resistance variation measurements on
gas sensing polymer films
A. Forta,∗, S. Rocchia, M.B. Serrano-Santosa, N. Ulivieri a, V. Vignoli a,G. Pioggiac, F. Di Francescob
a Department of Information Engineering, University of Siena, Via Roma 56, 53100-Siena, Italyb National Research Council, Institute of Clinical Physiology, Via G. Moruzzi 1, 56100-Pisa, Italy
c Centro Interdipartimentale Enrico Piaggio, University of Pisa, Via Diotisalvi 2, 56100-Pisa, Italy
Abstract
This paper describes a high-performance system set-up for measurements with gas sensitive polymeric layers. The polymeric films ared r resistancem e. The mea-s resolution(©
K
1
iiu“t‘awtracor
U
o the
es ison
type, and. Thisment
n bethebye onebeoly-
persystemitiespb)pling
0d
eposited on prototypal Quartz Crystal Microbalance sensors that allow both quartz frequency resonance variation and polymeeasurements. This capability adds new dimensions to the feature space allowing the improvement of the system performanc
urement system is able to simultaneously measure the polymer resistance as well as the QCM frequency variation with high<2�/60 k� and <0.1 Hz/10 MHz) and fast sampling rate (≈20 ms).
2005 Elsevier B.V. All rights reserved.
eywords:QCM sensors; Conducting polymers; Electronic nose; IEEE 1451.4
. Introduction
Classification of chemical compounds and gas mixturess of great interest in many applications like food pack-ng, aroma classification and environmental monitoring. These of artificial olfactory systems, that are often calledelectronic noses”, is one of the common approaches usedo accomplish this task. Conductive polymer[1,2,8] andyielded’ conductive (e.g. carbon-black polymers[7]) filmsre among the gas sensing elements most commonly andidely used in such systems. Polymer films are very attrac-
ive for vapor/odor sensing applications because of the wideange of available materials and the ease of deposition, thebility to operate at room temperature (i.e. low device poweronsumption), and sensitivity to a broad range of volatilerganic compounds. Usually polymeric layers are used toealize conductive sensors, for which a change in the sensor
∗ Corresponding author. Tel.: +39 0577 233608; fax: +39 0577 233602.E-mail address:[email protected] (A. Fort).
RL: http://www.dii.unisi.it.
resistance is monitored while the sensor is exposed tgas.
The polymer mass change upon exposure to gasalso exploited in electronic olfactory systems basedQuartz Crystal Microbalance (QCM) sensors. For thisof sensors, the frequency shift due to the gas sorptionhence to the mass change, is the measured quantityparameter can be measured by means of simple equipbut significant sensor performance improvements caobtained when exploiting the dynamical behavior ofresonance frequency[3]. This must be accomplishedusing sophisticated measurement equipment such as thpresented in[3]. Moreover, a further improvement canobtained with the simultaneous measurement of the pmer resistance as well as the QCM frequency[17,18]. Nev-ertheless, this opportunity is rarely exploited. This papresents a custom sensor class and a measurementable to simultaneously track the two mentioned quantwith a very high resolution, both for frequency (<10 pand resistance (<30 ppm) measurements, and fast samrate.
925-4005/$ – see front matter © 2005 Elsevier B.V. All rights reserved.oi:10.1016/j.snb.2005.07.031
194 A. Fort et al. / Sensors and Actuators B 111–112 (2005) 193–199
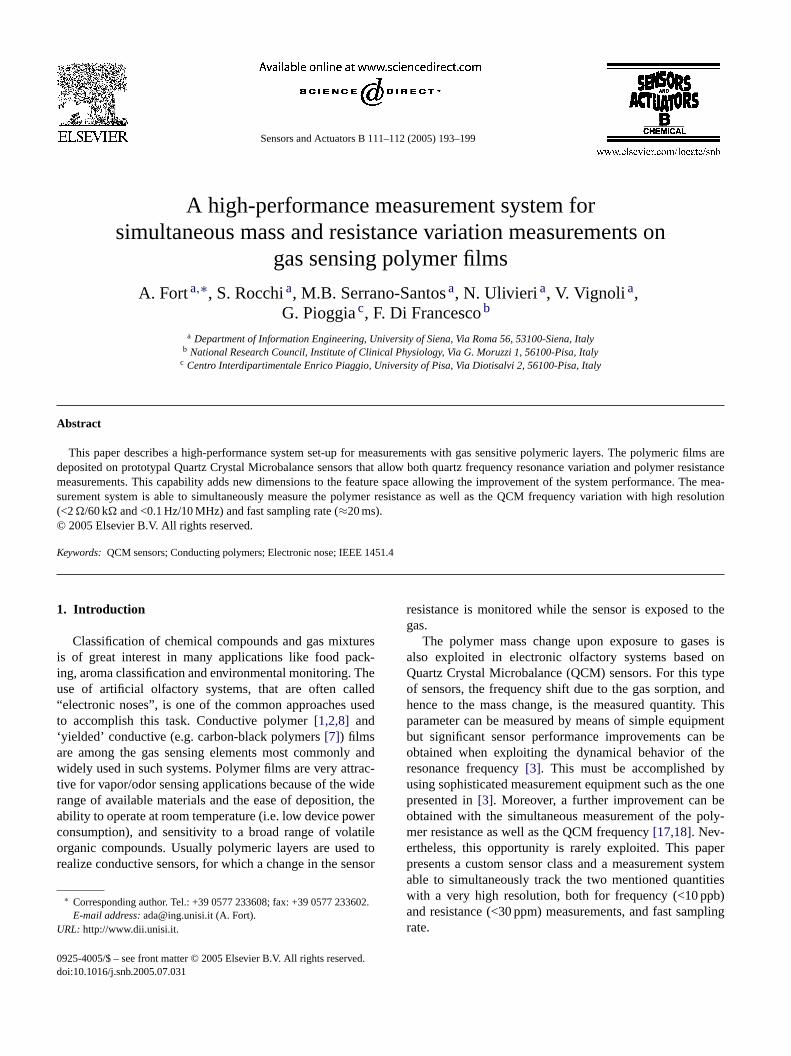
Fig. 1. Prototypal QCM (PQCM) sensor with a third electrode added for the resistance measurement (left) and its equivalent circuit (right).
2. Measurement system
2.1. Sensors
Prototypal QCM sensors (PQCM), that present a thirdelectrode for the resistance measurement of the polymericsensing film, were prepared for this work by the Institute ofClinical Physiology of Pisa (IT), National Research Coun-cil of Pisa. A quartz crystal circular plate (Ø14 and 0.18 mmof thickness) containing pre-printed parallel gold electrodeswas purchased by Nuova Mistral S.p.A.[5] and added witha third gold electrode for the resistance measurement byvacuum evaporation (Fig. 1). Different types of conduct-ing polymer sensors were prepared by chemically dopingpoly(3,3′-dipentoxy-2,2′-bithiophene) (dimer in inTable 1)and poly(3,3′′-dipentoxy-2,2′:5,2′′-terthiophene) (trimer in inTable 1) with different inorganic salts at various levels aspreviously reported[4]. Fabrication was accomplished bydepositing with a pipette 1�l of doped polymer suspensionin chloroform on the quartz crystal and spinning the sensor at1000 rpm until a uniform coating polymer layer was obtained.
2.2. System set-up
In this paper, a high-performance measurement system,based on the prototypal sensors described above, which isa e andt han3 0 ms,i ucture( lockd
d byt tancem EDS
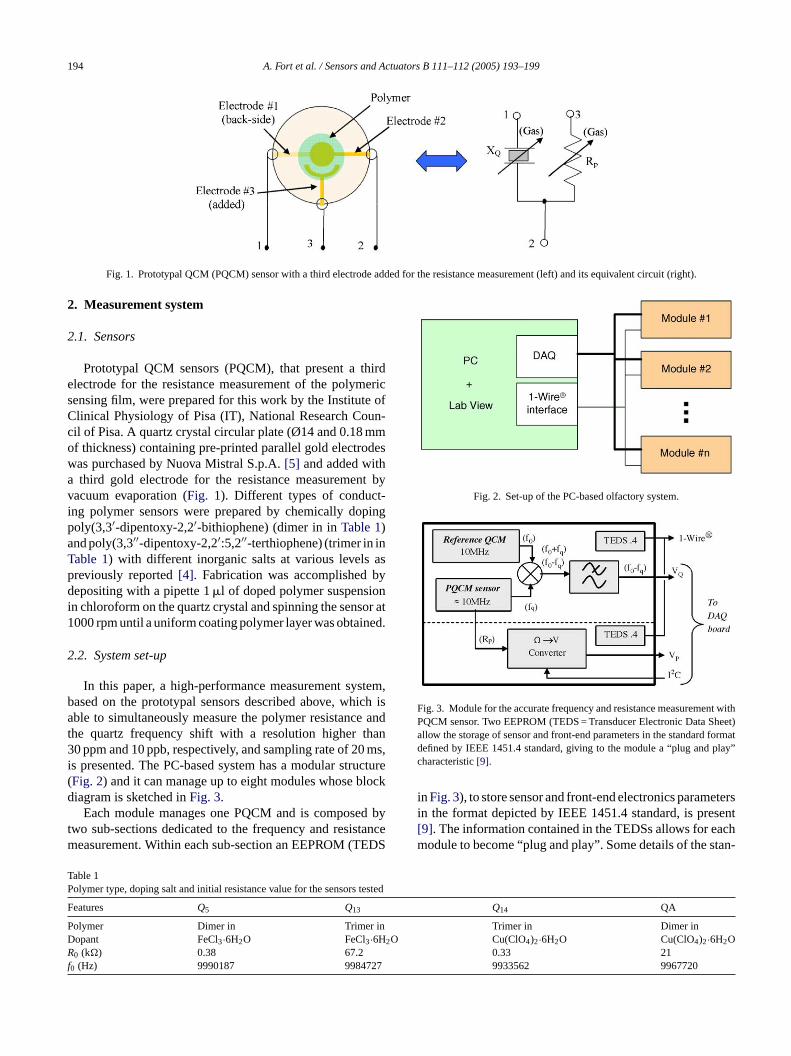
Fig. 2. Set-up of the PC-based olfactory system.
Fig. 3. Module for the accurate frequency and resistance measurement withPQCM sensor. Two EEPROM (TEDS = Transducer Electronic Data Sheet)allow the storage of sensor and front-end parameters in the standard formatdefined by IEEE 1451.4 standard, giving to the module a “plug and play”characteristic[9].
in Fig. 3), to store sensor and front-end electronics parametersin the format depicted by IEEE 1451.4 standard, is present[9]. The information contained in the TEDSs allows for eachmodule to become “plug and play”. Some details of the stan-
TP tested
F Q14 QA
P Trimer in Dimer inD 2O Cu(ClO4)2·6H2O Cu(ClO4)2·6H2OR 0.33 21f 9933562 9967720
ble to simultaneously measure the polymer resistanche quartz frequency shift with a resolution higher t0 ppm and 10 ppb, respectively, and sampling rate of 2
s presented. The PC-based system has a modular strFig. 2) and it can manage up to eight modules whose biagram is sketched inFig. 3.
Each module manages one PQCM and is composewo sub-sections dedicated to the frequency and resiseasurement. Within each sub-section an EEPROM (T
able 1olymer type, doping salt and initial resistance value for the sensors
eatures Q5 Q13
olymer Dimer in Trimer inopant FeCl3·6H2O FeCl3·6H
0 (k�) 0.38 67.2
0 (Hz) 9990187 9984727
A. Fort et al. / Sensors and Actuators B 111–112 (2005) 193–199 195
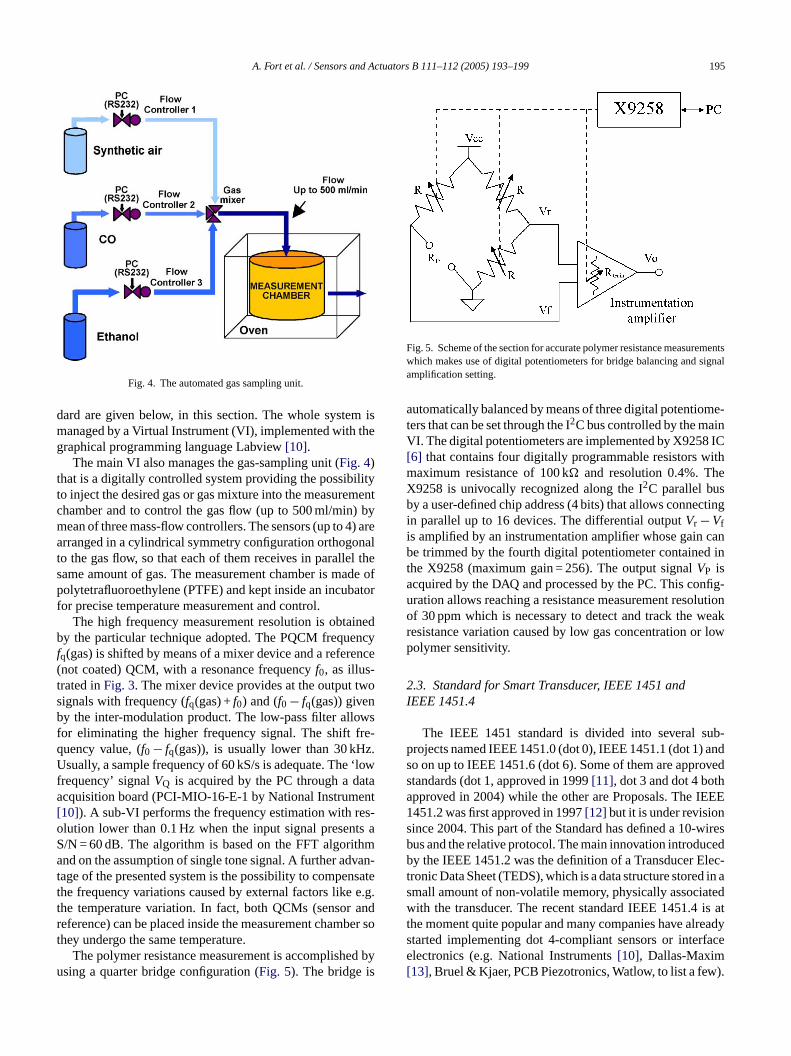
Fig. 4. The automated gas sampling unit.
dard are given below, in this section. The whole system ismanaged by a Virtual Instrument (VI), implemented with thegraphical programming language Labview[10].
The main VI also manages the gas-sampling unit (Fig. 4)that is a digitally controlled system providing the possibilityto inject the desired gas or gas mixture into the measurementchamber and to control the gas flow (up to 500 ml/min) bymean of three mass-flow controllers. The sensors (up to 4) arearranged in a cylindrical symmetry configuration orthogonalto the gas flow, so that each of them receives in parallel thesame amount of gas. The measurement chamber is made ofpolytetrafluoroethylene (PTFE) and kept inside an incubatorfor precise temperature measurement and control.
The high frequency measurement resolution is obtainedby the particular technique adopted. The PQCM frequencyfq(gas) is shifted by means of a mixer device and a reference(not coated) QCM, with a resonance frequencyf0, as illus-trated inFig. 3. The mixer device provides at the output twosignals with frequency (fq(gas) +f0) and (f0 − fq(gas)) givenby the inter-modulation product. The low-pass filter allowsfor eliminating the higher frequency signal. The shift fre-quency value, (f0 − fq(gas)), is usually lower than 30 kHz.Usually, a sample frequency of 60 kS/s is adequate. The ‘lowfrequency’ signalVQ is acquired by the PC through a dataacquisition board (PCI-MIO-16-E-1 by National Instrument[10]). A sub-VI performs the frequency estimation with res-o ts aS thma van-t nsatet e.g.t andr ber st
ed byu
Fig. 5. Scheme of the section for accurate polymer resistance measurementswhich makes use of digital potentiometers for bridge balancing and signalamplification setting.
automatically balanced by means of three digital potentiome-ters that can be set through the I2C bus controlled by the mainVI. The digital potentiometers are implemented by X9258 IC[6] that contains four digitally programmable resistors withmaximum resistance of 100 k� and resolution 0.4%. TheX9258 is univocally recognized along the I2C parallel busby a user-defined chip address (4 bits) that allows connectingin parallel up to 16 devices. The differential outputVr −Vfis amplified by an instrumentation amplifier whose gain canbe trimmed by the fourth digital potentiometer contained inthe X9258 (maximum gain = 256). The output signalVP isacquired by the DAQ and processed by the PC. This config-uration allows reaching a resistance measurement resolutionof 30 ppm which is necessary to detect and track the weakresistance variation caused by low gas concentration or lowpolymer sensitivity.
2.3. Standard for Smart Transducer, IEEE 1451 andIEEE 1451.4
The IEEE 1451 standard is divided into several sub-projects named IEEE 1451.0 (dot 0), IEEE 1451.1 (dot 1) andso on up to IEEE 1451.6 (dot 6). Some of them are approvedstandards (dot 1, approved in 1999[11], dot 3 and dot 4 bothapproved in 2004) while the other are Proposals. The IEEE1 ns wiresb cedb lec-t d in as atedw is att readys facee[ ).
lution lower than 0.1 Hz when the input signal presen/N = 60 dB. The algorithm is based on the FFT algorind on the assumption of single tone signal. A further ad
age of the presented system is the possibility to compehe frequency variations caused by external factors likehe temperature variation. In fact, both QCMs (sensoreference) can be placed inside the measurement chamhey undergo the same temperature.
The polymer resistance measurement is accomplishsing a quarter bridge configuration (Fig. 5). The bridge is
o
451.2 was first approved in 1997[12] but it is under revisioince 2004. This part of the Standard has defined a 10-us and the relative protocol. The main innovation introduy the IEEE 1451.2 was the definition of a Transducer E
ronic Data Sheet (TEDS), which is a data structure storemall amount of non-volatile memory, physically associith the transducer. The recent standard IEEE 1451.4
he moment quite popular and many companies have altarted implementing dot 4-compliant sensors or interlectronics (e.g. National Instruments[10], Dallas-Maxim
13], Bruel & Kjaer, PCB Piezotronics, Watlow, to list a few
196 A. Fort et al. / Sensors and Actuators B 111–112 (2005) 193–199
This part of the Standard defines an interface for analoguetransducers for mixed-mode operation and defines TEDSs tobe associated to the analog transducers that are different fromdot 2-TEDS. The dot 4-TEDSs have different structures (tem-plates) according to the type of transducer to which they areassociated. For instance, it is defined the generic template for“resistive-output sensor” (Template 32), the generic templatefor sensors with “high level voltage output” (Template 30),the template specific for “bridge sensors” (Template 33), andso on. Comprehensive information about dot 4 templates canbe found in[10]. The TEDS allows for analogue transduc-ers to communicate digital information for self-identification,self-configuration, self-calibration, and easy manipulation.The analogue transducer, with associated electronics, sendsout digital information data upon command through 1-Wire®
bus[13] and it senses or controls a physical phenomenon inanalogue mode.
Since there are no templates for gas sensors, one shouldconsider the polymer as a resistive sensor or, in our case, as abridge sensor. The QCM sub-section can be seen as a “Volt-age output” sensor. The module depicted inFig. 3 can beconsidered as the first prototype of Standard gas sensor com-pliant with the IEEE 1451.4. The TEDSs are written through1-Wire® interface (Fig. 3) by using dedicated VIs. A study todefine templates for gas sensors is on the way as well as thedesign of a full self-configurable olfactory electronic systemb
3
QCM(e flowv .F y outt et er tom ts. Inf gnalV cieso rw nt fort
TT ed witht
E
248
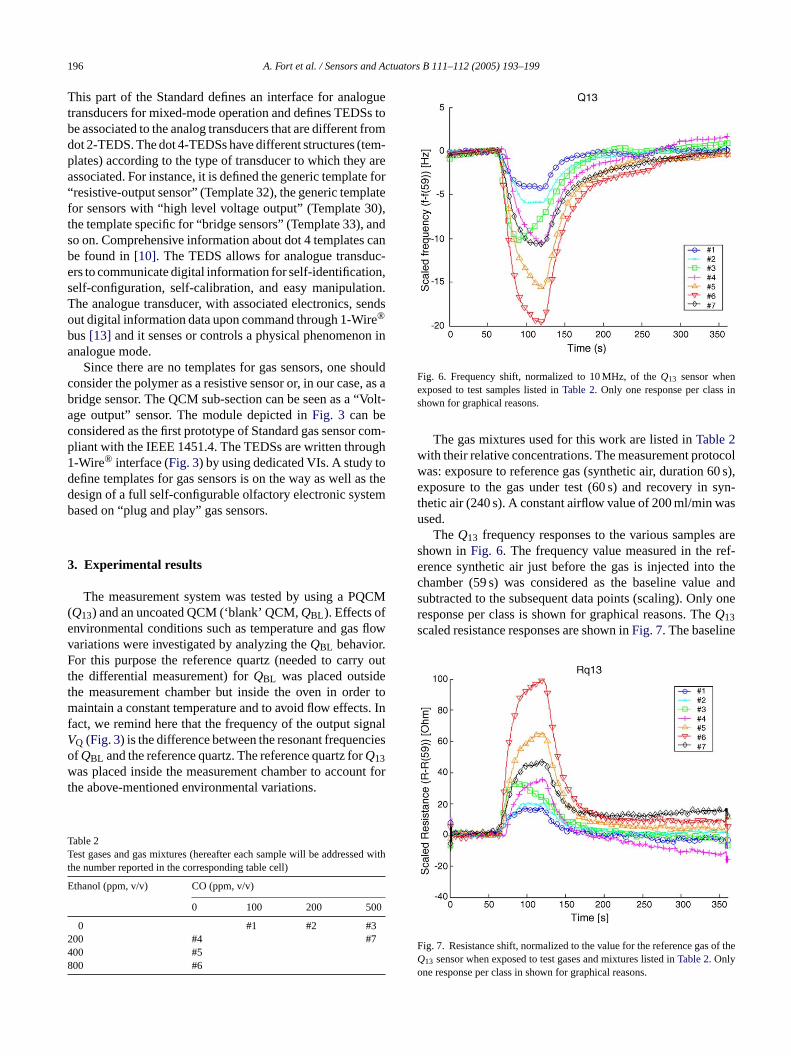
Fig. 6. Frequency shift, normalized to 10 MHz, of theQ13 sensor whenexposed to test samples listed inTable 2. Only one response per class inshown for graphical reasons.
The gas mixtures used for this work are listed inTable 2with their relative concentrations. The measurement protocolwas: exposure to reference gas (synthetic air, duration 60 s),exposure to the gas under test (60 s) and recovery in syn-thetic air (240 s). A constant airflow value of 200 ml/min wasused.
TheQ13 frequency responses to the various samples areshown inFig. 6. The frequency value measured in the ref-erence synthetic air just before the gas is injected into thechamber (59 s) was considered as the baseline value andsubtracted to the subsequent data points (scaling). Only oneresponse per class is shown for graphical reasons. TheQ13scaled resistance responses are shown inFig. 7. The baseline
F of theQo
ased on “plug and play” gas sensors.
. Experimental results
The measurement system was tested by using a PQ13) and an uncoated QCM (‘blank’ QCM,QBL). Effects ofnvironmental conditions such as temperature and gasariations were investigated by analyzing theQBL behavioror this purpose the reference quartz (needed to carr
he differential measurement) forQBL was placed outsidhe measurement chamber but inside the oven in ordaintain a constant temperature and to avoid flow effec
act, we remind here that the frequency of the output siQ (Fig. 3) is the difference between the resonant frequenfQBL and the reference quartz. The reference quartz foQ13as placed inside the measurement chamber to accou
he above-mentioned environmental variations.
able 2est gases and gas mixtures (hereafter each sample will be addresshe number reported in the corresponding table cell)
thanol (ppm, v/v) CO (ppm, v/v)
0 100 200 500
0 #1 #2 #300 #4 #700 #500 #6
ig. 7. Resistance shift, normalized to the value for the reference gas
13 sensor when exposed to test gases and mixtures listed inTable 2. Onlyne response per class in shown for graphical reasons.
A. Fort et al. / Sensors and Actuators B 111–112 (2005) 193–199 197
resistance of the polymer films deposited onQ13 is about67 k� (seeTable 1).
It can be observed that the maximum frequency shift isgiven by the maximum concentration of ethanol (#6) and itis below 20 Hz (≈2 ppm). The need of a high resolution evenfor the resistance measurement is evident fromFig. 7wherea maximum resistance change of about 100� (≈1670 ppm)is also observed for gas #6.
It is interesting to notice that sensor responses (bothresistance and frequency) to gas concentration greater than200 ppm of carbon monoxide (CO) show a peculiar changeof slope around 20 s after the gas injection.
Data analysis ofQ13 responses and gas recognition can-not be accomplished by using traditional feature extractiontechniques such as the maximum shift since responses to dif-ferent gases (e.g. #3, #4, #7 inFig. 6, #3, #4 and #1, #2in Fig. 7) give similar values. Also the single-exponentialfitting technique[14,15] is not suitable for this applica-tion since the not-single-exponential-like responses to CO.For the present study, two integrals of the responses cal-culated between the gas injection (60 s) and 85 s (ell inresponses to CO) and 120 s (start of recovery), were used.These parameters are robust to measurement noise and takeinto account the response shape[15]. It can be demon-strated that this technique is also equivalent to the expo-nential fitting when the responses are single-exponential-l
nlyo howni ot”( howt ents.T ure( s farf ng
F resl
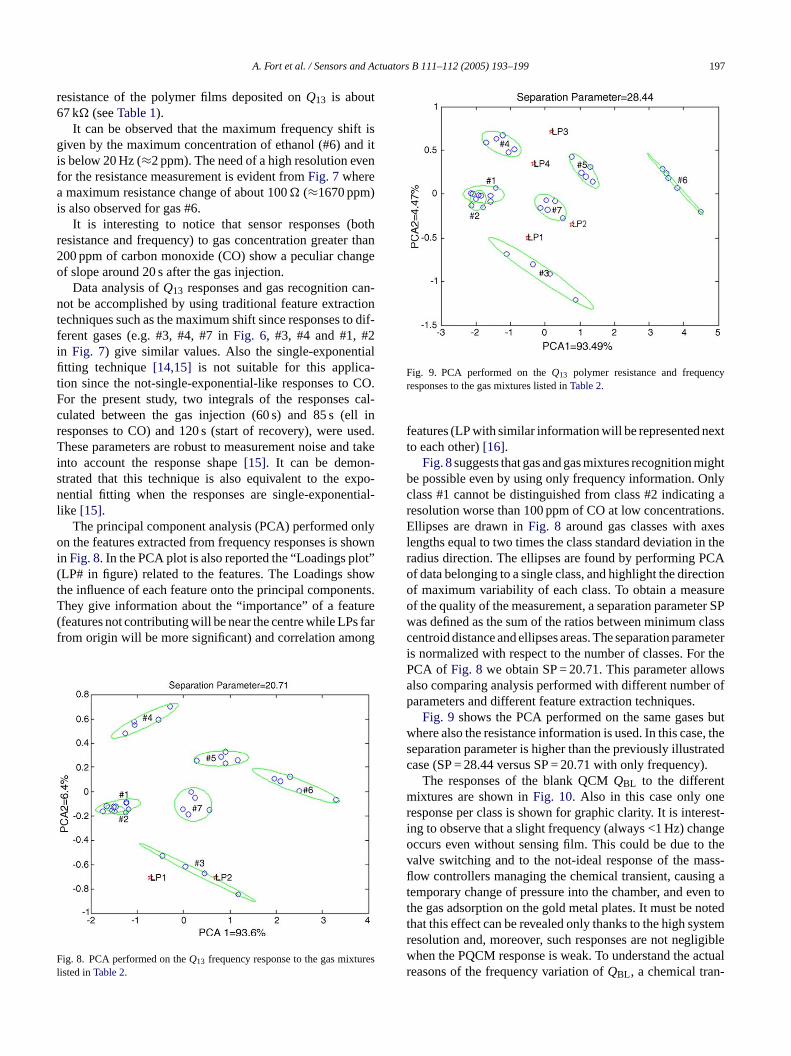
Fig. 9. PCA performed on theQ13 polymer resistance and frequencyresponses to the gas mixtures listed inTable 2.
features (LP with similar information will be represented nextto each other)[16].
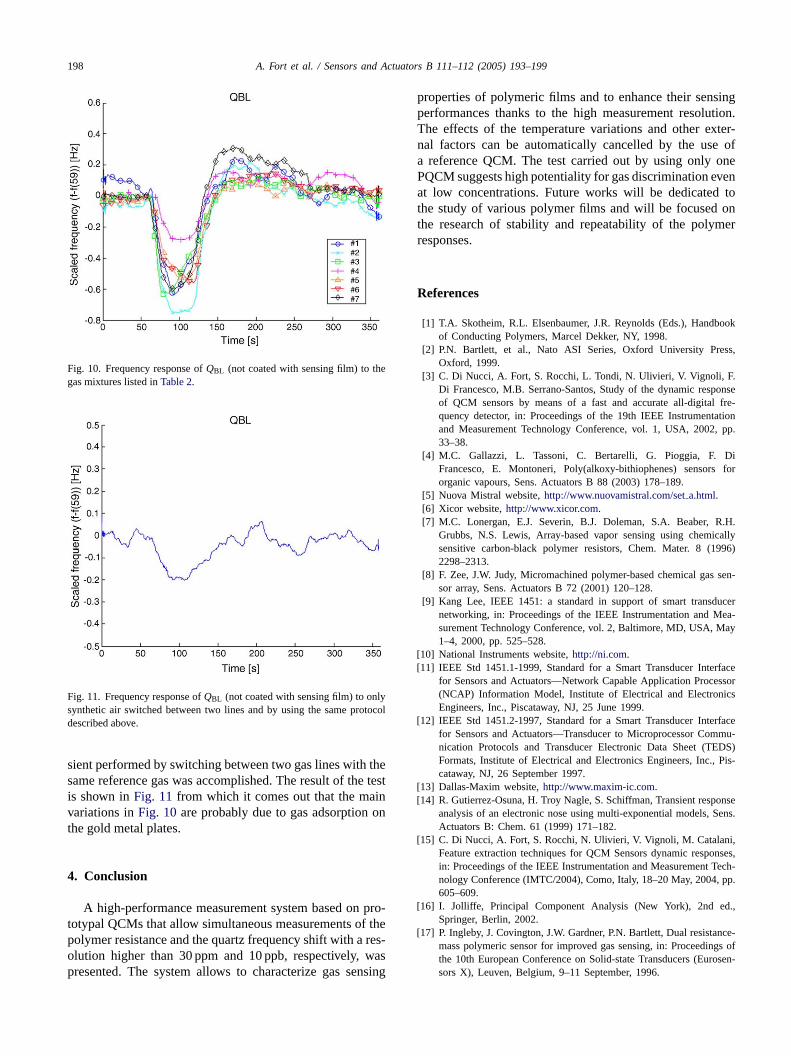
Fig. 8suggests that gas and gas mixtures recognition mightbe possible even by using only frequency information. Onlyclass #1 cannot be distinguished from class #2 indicating aresolution worse than 100 ppm of CO at low concentrations.Ellipses are drawn inFig. 8 around gas classes with axeslengths equal to two times the class standard deviation in theradius direction. The ellipses are found by performing PCAof data belonging to a single class, and highlight the directionof maximum variability of each class. To obtain a measureof the quality of the measurement, a separation parameter SPwas defined as the sum of the ratios between minimum classcentroid distance and ellipses areas. The separation parameteris normalized with respect to the number of classes. For thePCA of Fig. 8 we obtain SP = 20.71. This parameter allowsalso comparing analysis performed with different number ofparameters and different feature extraction techniques.
Fig. 9 shows the PCA performed on the same gases butwhere also the resistance information is used. In this case, theseparation parameter is higher than the previously illustratedcase (SP = 28.44 versus SP = 20.71 with only frequency).
The responses of the blank QCMQBL to the differentmixtures are shown inFig. 10. Also in this case only oneresponse per class is shown for graphic clarity. It is interest-ing to observe that a slight frequency (always <1 Hz) changeo thev ass-fl ing at en tot otedt stemr igiblew ctualr -
ike [15].The principal component analysis (PCA) performed o
n the features extracted from frequency responses is sn Fig. 8. In the PCA plot is also reported the “Loadings plLP# in figure) related to the features. The Loadings she influence of each feature onto the principal componhey give information about the “importance” of a featfeatures not contributing will be near the centre while LProm origin will be more significant) and correlation amo
ig. 8. PCA performed on theQ13 frequency response to the gas mixtuisted inTable 2.
ccurs even without sensing film. This could be due toalve switching and to the not-ideal response of the mow controllers managing the chemical transient, causemporary change of pressure into the chamber, and evhe gas adsorption on the gold metal plates. It must be nhat this effect can be revealed only thanks to the high syesolution and, moreover, such responses are not neglhen the PQCM response is weak. To understand the a
easons of the frequency variation ofQBL, a chemical tran
198 A. Fort et al. / Sensors and Actuators B 111–112 (2005) 193–199
Fig. 10. Frequency response ofQBL (not coated with sensing film) to thegas mixtures listed inTable 2.
Fig. 11. Frequency response ofQBL (not coated with sensing film) to onlysynthetic air switched between two lines and by using the same protocoldescribed above.
sient performed by switching between two gas lines with thesame reference gas was accomplished. The result of the tesis shown inFig. 11 from which it comes out that the mainvariations inFig. 10are probably due to gas adsorption onthe gold metal plates.
4. Conclusion
A high-performance measurement system based on pro-totypal QCMs that allow simultaneous measurements of thepolymer resistance and the quartz frequency shift with a res-olution higher than 30 ppm and 10 ppb, respectively, waspresented. The system allows to characterize gas sensing
properties of polymeric films and to enhance their sensingperformances thanks to the high measurement resolution.The effects of the temperature variations and other exter-nal factors can be automatically cancelled by the use ofa reference QCM. The test carried out by using only onePQCM suggests high potentiality for gas discrimination evenat low concentrations. Future works will be dedicated tothe study of various polymer films and will be focused onthe research of stability and repeatability of the polymerresponses.
References
[1] T.A. Skotheim, R.L. Elsenbaumer, J.R. Reynolds (Eds.), Handbookof Conducting Polymers, Marcel Dekker, NY, 1998.
[2] P.N. Bartlett, et al., Nato ASI Series, Oxford University Press,Oxford, 1999.
[3] C. Di Nucci, A. Fort, S. Rocchi, L. Tondi, N. Ulivieri, V. Vignoli, F.Di Francesco, M.B. Serrano-Santos, Study of the dynamic responseof QCM sensors by means of a fast and accurate all-digital fre-quency detector, in: Proceedings of the 19th IEEE Instrumentationand Measurement Technology Conference, vol. 1, USA, 2002, pp.33–38.
[4] M.C. Gallazzi, L. Tassoni, C. Bertarelli, G. Pioggia, F. DiFrancesco, E. Montoneri, Poly(alkoxy-bithiophenes) sensors fororganic vapours, Sens. Actuators B 88 (2003) 178–189.
[5] Nuova Mistral website,http://www.nuovamistral.com/seta.html.
R.H.ically996)
sen-
ucerea-
May
[[ rface
essorics
[ rfacemu-
EDS)Pis-
[[ onse
Sens.
[ i,onses,Tech-, pp.
[ d.,
[ nce-gs of
rosen-
t
[6] Xicor website,http://www.xicor.com.[7] M.C. Lonergan, E.J. Severin, B.J. Doleman, S.A. Beaber,
Grubbs, N.S. Lewis, Array-based vapor sensing using chemsensitive carbon-black polymer resistors, Chem. Mater. 8 (12298–2313.
[8] F. Zee, J.W. Judy, Micromachined polymer-based chemical gassor array, Sens. Actuators B 72 (2001) 120–128.
[9] Kang Lee, IEEE 1451: a standard in support of smart transdnetworking, in: Proceedings of the IEEE Instrumentation and Msurement Technology Conference, vol. 2, Baltimore, MD, USA,1–4, 2000, pp. 525–528.
10] National Instruments website,http://ni.com.11] IEEE Std 1451.1-1999, Standard for a Smart Transducer Inte
for Sensors and Actuators—Network Capable Application Proc(NCAP) Information Model, Institute of Electrical and ElectronEngineers, Inc., Piscataway, NJ, 25 June 1999.
12] IEEE Std 1451.2-1997, Standard for a Smart Transducer Intefor Sensors and Actuators—Transducer to Microprocessor Comnication Protocols and Transducer Electronic Data Sheet (TFormats, Institute of Electrical and Electronics Engineers, Inc.,cataway, NJ, 26 September 1997.
13] Dallas-Maxim website,http://www.maxim-ic.com.14] R. Gutierrez-Osuna, H. Troy Nagle, S. Schiffman, Transient resp
analysis of an electronic nose using multi-exponential models,Actuators B: Chem. 61 (1999) 171–182.
15] C. Di Nucci, A. Fort, S. Rocchi, N. Ulivieri, V. Vignoli, M. CatalanFeature extraction techniques for QCM Sensors dynamic respin: Proceedings of the IEEE Instrumentation and Measurementnology Conference (IMTC/2004), Como, Italy, 18–20 May, 2004605–609.
16] I. Jolliffe, Principal Component Analysis (New York), 2nd eSpringer, Berlin, 2002.
17] P. Ingleby, J. Covington, J.W. Gardner, P.N. Bartlett, Dual resistamass polymeric sensor for improved gas sensing, in: Proceedinthe 10th European Conference on Solid-state Transducers (Eusors X), Leuven, Belgium, 9–11 September, 1996.
A. Fort et al. / Sensors and Actuators B 111–112 (2005) 193–199 199
[18] E.J. Severin, N.S. Lewis, Relationships among resonant fre-quency changes on a coated quartz crystal microbalance, thicknesschanges, and resistance responses of polymer-carbon black compos-ite chemiresistors, Anal. Chem. 72 (9) (2000) 2008–2015.
Biographies
Ada Fort received the Laurea degree in Elec-tronic Engineering from the University of Flo-rence, Italy, in 1989. She received the PhD degreein non-destructive testing from the same univer-sity in 1993. Since 1997 she joined the Universityof Siena, where she is currently associate pro-fessor of Electrical and Electronic Measurements.Her current interests concern the development ofmeasurement systems based on chemical sensors,and the development of automatic fault diagnosissystems.
Santina Rocchi received the Laurea degree inElectronic Engineering from the University ofFlorence in 1978. From 1981 to 1992 she wasan Assistant Professor of Electronics at the Uni-versity of Florence, where she was involved in thedevelopment of prototype systems for ultrasonicapplications in medical diagnosis, non-destructivetesting and robotics. In 1992, for 1 year, shewas an Associate Professor of Electronics at the
theull
p ring.H tronicsd
tense
e93.
ofndetiche
onthethe
s
Nicola Ulivieri received his Laurea degree inTelecommunication Engineering at the Univer-sity of Siena in 1999. In 2003 he received thePhD degree from the University of Siena, Depart-ment of Information Engineering, thesis title:“Developing, modelling and integration of olfac-tory electronic systems”. Since 2003 is a researchassociate of the Department of Information Engi-neering of the University of Siena. His mainresearch activity is related to the development oflaboratory electronic noses based on metal oxide
sensors and QCM sensors. Recently his interests were also devoted tointegrated analogue and mixed signal electronics design and smart sen-sors development.
Valerio Vignoli received the Laurea degree inElectronic Engineering from the University ofFlorence, Italy, in 1989. He received the PhDdegree in non-destructive testing from the sameUniversity in 1994. Since 1997 he joined theDepartment of Information Engineering of theUniversity of Siena (Italy), where he is currentlyassociate professor of Electronics. His currentresearch interests include sensor and smart sen-sor systems, with particular emphasis in front-endelectronics design.
Giovanni Pioggia graduated in Electronic Engi-neering (specialization in Bioengineering) fromUniversity of Pisa (Italy) in 1997. He received a
er-tlyrde-theising:ess-
F sityo utiond oun-c ggio”w lica-t s andd at theI up,h
University of Perugia. Since 1993 she joinedUniversity of Siena, where she is currently f
rofessor of electronics at the Department of Information Engineeer main research interest is sensor front-end and processing elecesign, with emphasis on chemical, optical and acoustic sensors.
M. Belen Serrano Santos received Graduadegree in Physical Chemistry at the CompluteUniversity of Madrid and Maıtrise in Solid StatChemistry at the University of Paris-Sud in 19She received PhD degree at the UniversitySiena in 2000 for her work on synthesis astructural characterization of natural and synthsilicates with molecular sieving properties. Scurrently works at the University of Sienaa laboratory electronic nose as well as onfabrication of membrane coatings to enhance
electivity of ceramic sensors.
PhD degree in biomimetic robotics from Univsity of Genova (Italy) in 2001. He is currenworking as a research assistant at the Intepartmental Research Centre “E. Piaggio” ofFaculty of Engineering of University of Pisa. Hresearch activities are related to bioengineerbiomimetic sensors and actuators, signal procing, pattern recognition and neural networks.
abio Di Francescograduated as a physicist in 1994 from Univerf Pisa. He worked for 2 years to the development of mercury polletection methods at the Institute of Biophysics (National Research Cil, CNR), then he joined Interdepartmental Research Center “E. Piahere he started working on electronic noses with two distinct app
ion areas, evaluation of olfactory annoyance of industrial emissionetection of olive oils defects. At present, he is research scientist
nstitute of Clinical Physiology (CNR) where, within the MAST groe is responsible for the development and use of electronic noses.
Related Documents


