RESEARCH ARTICLE Open Access A high-density genetic map of Arachis duranensis, a diploid ancestor of cultivated peanut Ervin D Nagy 1 , Yufang Guo 1 , Shunxue Tang 1 , John E Bowers 1 , Rebecca A Okashah 1 , Christopher A Taylor 1 , Dong Zhang 1 , Sameer Khanal 1 , Adam F Heesacker 1 , Nelly Khalilian 1 , Andrew D Farmer 2 , Noelia Carrasquilla-Garcia 3 , R Varma Penmetsa 3 , Douglas Cook 3 , H Thomas Stalker 4 , Niels Nielsen 4 , Peggy Ozias-Akins 5* and Steven J Knapp 1 Abstract Background: Cultivated peanut (Arachis hypogaea) is an allotetraploid species whose ancestral genomes are most likely derived from the A-genome species, A. duranensis, and the B-genome species, A. ipaensis. The very recent (several millennia) evolutionary origin of A. hypogaea has imposed a bottleneck for allelic and phenotypic diversity within the cultigen. However, wild diploid relatives are a rich source of alleles that could be used for crop improvement and their simpler genomes can be more easily analyzed while providing insight into the structure of the allotetraploid peanut genome. The objective of this research was to establish a high-density genetic map of the diploid species A. duranensis based on de novo generated EST databases. Arachis duranensis was chosen for mapping because it is the A-genome progenitor of cultivated peanut and also in order to circumvent the confounding effects of gene duplication associated with allopolyploidy in A. hypogaea. Results: More than one million expressed sequence tag (EST) sequences generated from normalized cDNA libraries of A. duranensis were assembled into 81,116 unique transcripts. Mining this dataset, 1236 EST-SNP markers were developed between two A. duranensis accessions, PI 475887 and Grif 15036. An additional 300 SNP markers also were developed from genomic sequences representing conserved legume orthologs. Of the 1536 SNP markers, 1054 were placed on a genetic map. In addition, 598 EST-SSR markers identified in A. hypogaea assemblies were included in the map along with 37 disease resistance gene candidate (RGC) and 35 other previously published markers. In total, 1724 markers spanning 1081.3 cM over 10 linkage groups were mapped. Gene sequences that provided mapped markers were annotated using similarity searches in three different databases, and gene ontology descriptions were determined using the Medicago Gene Atlas and TAIR databases. Synteny analysis between A. duranensis, Medicago and Glycine revealed significant stretches of conserved gene clusters spread across the peanut genome. A higher level of colinearity was detected between A. duranensis and Glycine than with Medicago. Conclusions: The first high-density, gene-based linkage map for A. duranensis was generated that can serve as a reference map for both wild and cultivated Arachis species. The markers developed here are valuable resources for the peanut, and more broadly, to the legume research community. The A-genome map will have utility for fine mapping in other peanut species and has already had application for mapping a nematode resistance gene that was introgressed into A. hypogaea from A. cardenasii. * Correspondence: [email protected] 5 Department of Horticulture, University of Georgia, Tifton, GA 31793, USA Full list of author information is available at the end of the article © 2012 Nagy et al.; licensee BioMed Central Ltd. This is an Open Access article distributed under the terms of the Creative Commons Attribution License (http://creativecommons.org/licenses/by/2.0), which permits unrestricted use, distribution, and reproduction in any medium, provided the original work is properly cited. Nagy et al. BMC Genomics 2012, 13:469 http://www.biomedcentral.com/1471-2164/13/469

Welcome message from author
This document is posted to help you gain knowledge. Please leave a comment to let me know what you think about it! Share it to your friends and learn new things together.
Transcript
RESEARCH ARTICLE Open Access
A high-density genetic map of Arachis duranensis,a diploid ancestor of cultivated peanutErvin D Nagy1, Yufang Guo1, Shunxue Tang1, John E Bowers1, Rebecca A Okashah1, Christopher A Taylor1,Dong Zhang1, Sameer Khanal1, Adam F Heesacker1, Nelly Khalilian1, Andrew D Farmer2, Noelia Carrasquilla-Garcia3,R Varma Penmetsa3, Douglas Cook3, H Thomas Stalker4, Niels Nielsen4, Peggy Ozias-Akins5* and Steven J Knapp1
Abstract
Background: Cultivated peanut (Arachis hypogaea) is an allotetraploid species whose ancestral genomes are mostlikely derived from the A-genome species, A. duranensis, and the B-genome species, A. ipaensis. The very recent(several millennia) evolutionary origin of A. hypogaea has imposed a bottleneck for allelic and phenotypic diversitywithin the cultigen. However, wild diploid relatives are a rich source of alleles that could be used for cropimprovement and their simpler genomes can be more easily analyzed while providing insight into the structure ofthe allotetraploid peanut genome. The objective of this research was to establish a high-density genetic map ofthe diploid species A. duranensis based on de novo generated EST databases. Arachis duranensis was chosen formapping because it is the A-genome progenitor of cultivated peanut and also in order to circumvent theconfounding effects of gene duplication associated with allopolyploidy in A. hypogaea.
Results: More than one million expressed sequence tag (EST) sequences generated from normalized cDNA librariesof A. duranensis were assembled into 81,116 unique transcripts. Mining this dataset, 1236 EST-SNP markers weredeveloped between two A. duranensis accessions, PI 475887 and Grif 15036. An additional 300 SNP markers alsowere developed from genomic sequences representing conserved legume orthologs. Of the 1536 SNP markers,1054 were placed on a genetic map. In addition, 598 EST-SSR markers identified in A. hypogaea assemblies wereincluded in the map along with 37 disease resistance gene candidate (RGC) and 35 other previously publishedmarkers. In total, 1724 markers spanning 1081.3 cM over 10 linkage groups were mapped. Gene sequences thatprovided mapped markers were annotated using similarity searches in three different databases, and gene ontologydescriptions were determined using the Medicago Gene Atlas and TAIR databases. Synteny analysis betweenA. duranensis, Medicago and Glycine revealed significant stretches of conserved gene clusters spread across thepeanut genome. A higher level of colinearity was detected between A. duranensis and Glycine than with Medicago.
Conclusions: The first high-density, gene-based linkage map for A. duranensis was generated that can serve as areference map for both wild and cultivated Arachis species. The markers developed here are valuable resources forthe peanut, and more broadly, to the legume research community. The A-genome map will have utility for finemapping in other peanut species and has already had application for mapping a nematode resistance gene thatwas introgressed into A. hypogaea from A. cardenasii.
* Correspondence: [email protected] of Horticulture, University of Georgia, Tifton, GA 31793, USAFull list of author information is available at the end of the article
© 2012 Nagy et al.; licensee BioMed Central Ltd. This is an Open Access article distributed under the terms of the CreativeCommons Attribution License (http://creativecommons.org/licenses/by/2.0), which permits unrestricted use, distribution, andreproduction in any medium, provided the original work is properly cited.
Nagy et al. BMC Genomics 2012, 13:469http://www.biomedcentral.com/1471-2164/13/469
BackgroundCultivated peanut (Arachis hypogaea L.) is a major cropin most tropical and subtropical areas of the world andprovides a significant source of oil and protein to largesegments of the population in Asia, Africa and theAmericas. In the U. S., peanut is a high-value cash cropof regional importance, with major production areasconcentrated in the Southeast. Plant breeding efforts topyramid genes for disease and insect resistances, quality,and yield is hampered by the polyploid genetics of thecrop species, the multigenic nature of many traits (e.g.,yield), and the difficulty of selecting for many traitsin the field (e.g., soil borne diseases). Thus, secondaryselection methods that are environmentally neutralwould greatly facilitate crop improvement efforts. Mole-cular markers fit this criterion, but only recently havemarkers been developed that reveal sufficient polymorph-isms in A. hypogaea and related species to have wide-spread application in peanut breeding. Preliminary stepsfor utilizing molecular markers for crop improvementare developing collections of polymorphic markers andutilizing them to construct dense and high-resolutiongenetic maps.Constructing a high-quality genetic map depends
largely upon finding one or more marker systems thatcan detect high levels of polymorphism between twoindividual parents. Unfortunately, low levels of molecu-lar polymorphism were observed within tetraploid(2n = 4x = 40) A. hypogaea throughout the 1990s andearly 2000s with the marker systems available at thattime [1,2]. However, compared with the limited numbersof polymorphic markers detected for the tetraploid, thesame marker systems can uncover high levels of mole-cular polymorphism within and between the diploid(2n = 2x = 20) peanut species. This polymorphism ledresearchers to create molecular maps for Arachis. Thefirst molecular map in peanut was constructed betweenthe diploids A. stenosperma Krapov. and W.C. Gregoryxand A. cardenasii Krapov. and W.C. Gregory by Halwardet al. [3] who used Restriction Fragment Length Poly-morphisms (RFLPs) to associate 117 markers into 11linkage groups. Additional maps were subsequently pub-lished using Randomly Amplified Polymorphic DNA(RAPD) [4] and Simple Sequence Repeats (SSRs) [5,6].Burow et al. [7] published the first tetraploid mapin peanut based on 370 RFLP loci across 23 link-age groups by utilizing the complex interspecific cross,Florunner × 4x [A. batizocoi Krapov. and W.C. Gregory(A. cardenasii × A. diogoi Hoehne)]. Another interspeci-fic tetraploid linkage map of 298 loci and 21 linkagegroups was derived from a backcross population be-tween A. hypogaea and a synthetic amphidiploid [8].Only recently have linkage maps been developed fromcrosses between A. hypogaea genotypes, most with less
than 200 loci and with more than the expected 20 link-age groups [9-13]. An exception is the recently publishedmap containing 1114 loci across 21 linkage groupsthat was constructed in part with highly polymorphicmarkers derived from sequences harboring miniatureinverted repeat transposable elements [14]. Therefore,there is a continuing need to generate dense linkagemaps for the cultivated tetraploid peanut that will notonly cluster the markers into the expected 20 linkagegroups to cover the haplotype chromosomes, but alsoto facilitate marker-trait association and eventually assistin its genetic improvement.The domesticated peanut is thought to have arisen
from a single hybridization event between two diploidwild species followed by whole genome duplicationapproximately 3,500 years ago [15]. This short evolu-tionary history, along with hybridization barriers be-tween diploids and the tetraploid have resulted in anarrow genetic base for the cultivated tetraploid peanut.On the contrary, diploid Arachis species are geneticallydiverse, have simpler inheritance patterns, and most im-portantly, contain a rich source of agronomically import-ant traits for peanut improvement. Due to theseattributes, diploid Arachis species have been proposed asmodel systems to map the peanut genome. Because thegenomes of progenitor diploid species [i.e., A. duranensis(A-genome donor) and A. ipaensis (B-genome donor)]are closely allied to the cultivated peanut [16], mappingthe genome of one or both of these species should beuseful for predicting the positions of loci in the cultivatedpeanut. This approach has been employed in wheat[17,18], alfalfa [19,20], oat [21], and other crop species.One accession of A. ipaensis and 67 accessions of
A. duranensis have been collected in South America.The largest concentration of A. duranensis is in southernBolivia and northern Argentina, with a few populationsbeing reported in Paraguay and one in central Brazil[22,23]. The species is morphologically diverse and theBolivia and Argentina types can be separated cytogeneti-cally and morphologically [24]. Due to the availability ofdiverse accessions to produce intraspecific crosses in thegreenhouse, a dense linkage map in the diploid speciesA. duranensis was produced using large numbers ofmolecular markers derived from transcribed sequences.
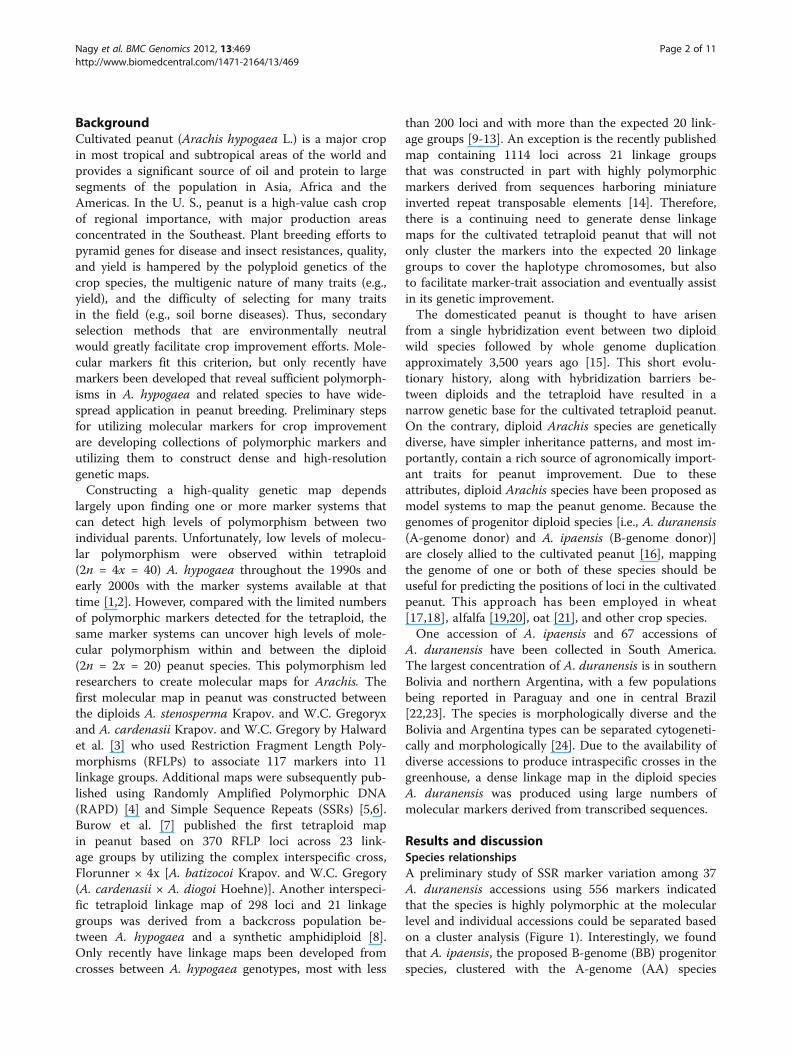
Results and discussionSpecies relationshipsA preliminary study of SSR marker variation among 37A. duranensis accessions using 556 markers indicatedthat the species is highly polymorphic at the molecularlevel and individual accessions could be separated basedon a cluster analysis (Figure 1). Interestingly, we foundthat A. ipaensis, the proposed B-genome (BB) progenitorspecies, clustered with the A-genome (AA) species
Nagy et al. BMC Genomics 2012, 13:469 Page 2 of 11http://www.biomedcentral.com/1471-2164/13/469
A. stenosperma and not with the B-genome species A.batizocoi. Recent molecular cytogenetic analysis of A-and non-A- (i.e., B-) genome species suggests that karyo-type diversity among non-A-genome species is extensiveenough to support separation into additional genomeclasses where A. ipaensis remains in B sensu stricto whileA. batizocoi is placed into a separate group [25]. There-fore, A. batizocoi is less typical of B-genome species.The number of polymorphic SSR markers between
paired A. duranensis accessions ranged from 160 to 375out of 556, which is 29 to 67% of the total number ofSSR markers screened. This is a significant amount ofvariation, which indicates the high genetic diversitywithin the species. Based on cluster analysis, success ofcrosses, and fertility of F1s, accessions PI 475887 andGrif 15036 were selected for subsequent mapping stud-ies using 94 F2 progenies. Screening of the parentalaccessions with 2,138 SSR markers derived from A.hypogaea EST sequences resulted in 1,768 (82.7%) thatwere scorable (detected by ABI3730XL genotyping sys-tems) and 896 (41.9%) that were polymorphic (Guo Y et al:Comparative mapping in intraspecific populationsuncovers a high degree of macrosynteny between A- andB-genome diploid species of peanut, Submitted). Thesame markers were used to create a map betweentwo A. batizocoi accessions and to determine syntenicrelationships between the A and B genome species
(Guo Y et al: Comparative mapping in intraspecific popu-lations uncovers a high degree of macrosynteny betweenA-and B-genome diploid species of peanut, submitted).
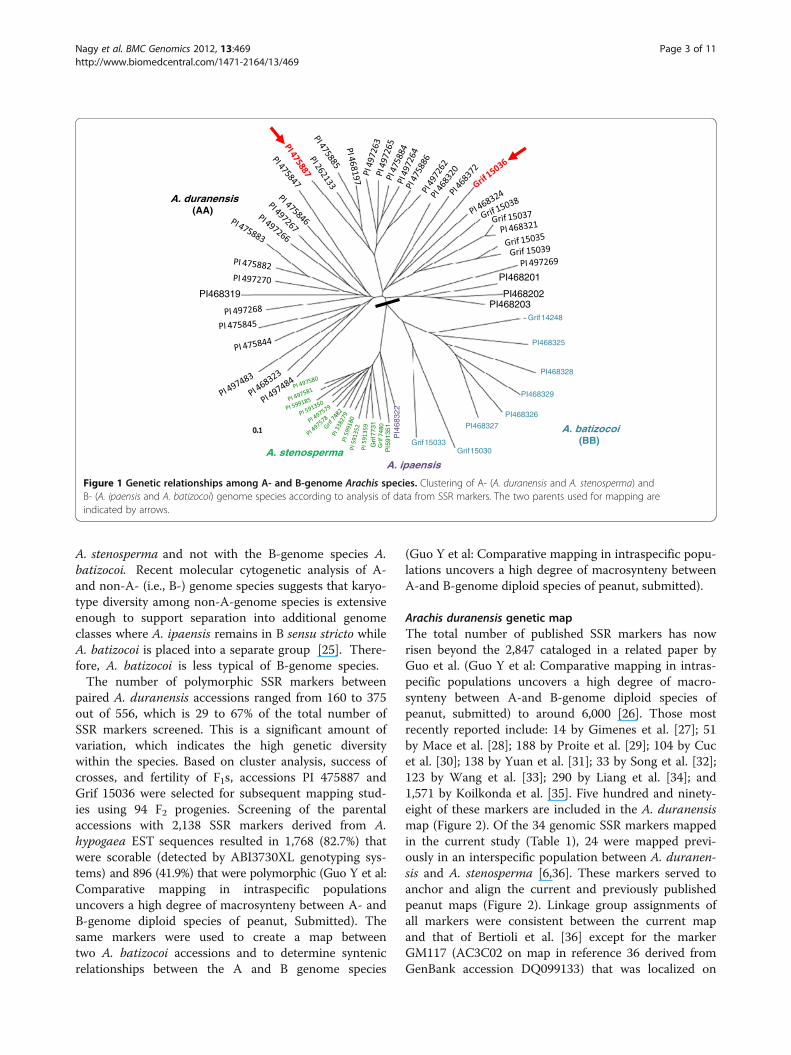
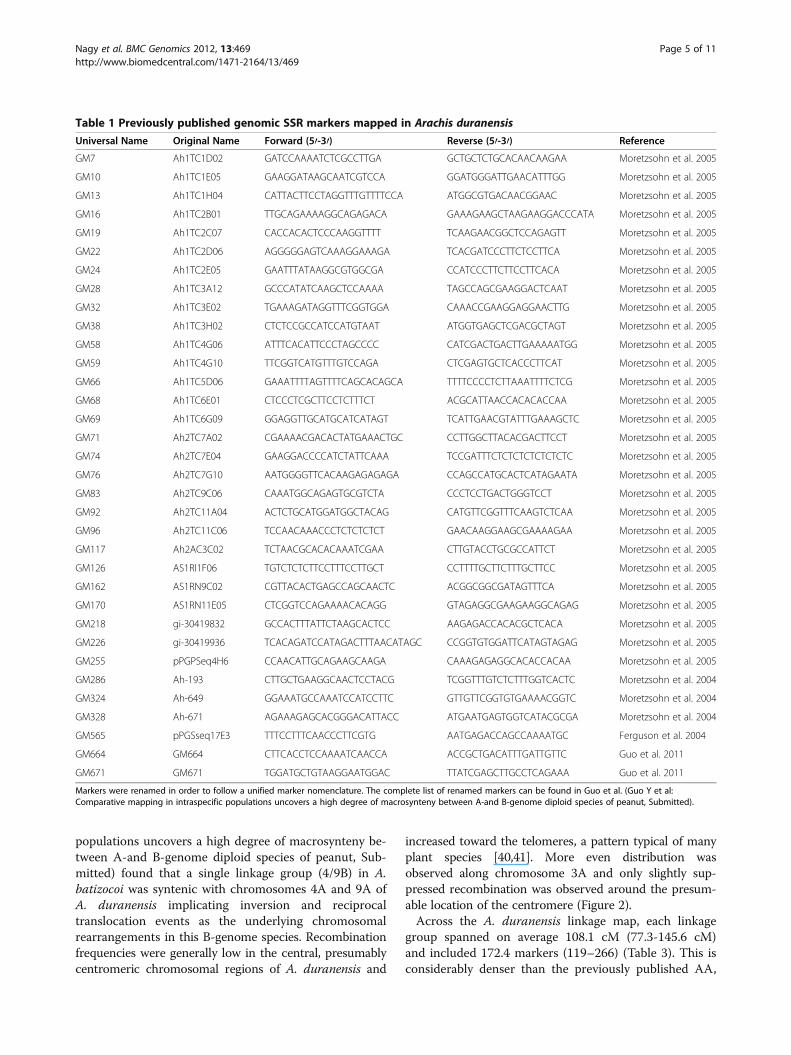
Arachis duranensis genetic mapThe total number of published SSR markers has nowrisen beyond the 2,847 cataloged in a related paper byGuo et al. (Guo Y et al: Comparative mapping in intras-pecific populations uncovers a high degree of macro-synteny between A-and B-genome diploid species ofpeanut, submitted) to around 6,000 [26]. Those mostrecently reported include: 14 by Gimenes et al. [27]; 51by Mace et al. [28]; 188 by Proite et al. [29]; 104 by Cucet al. [30]; 138 by Yuan et al. [31]; 33 by Song et al. [32];123 by Wang et al. [33]; 290 by Liang et al. [34]; and1,571 by Koilkonda et al. [35]. Five hundred and ninety-eight of these markers are included in the A. duranensismap (Figure 2). Of the 34 genomic SSR markers mappedin the current study (Table 1), 24 were mapped previ-ously in an interspecific population between A. duranen-sis and A. stenosperma [6,36]. These markers served toanchor and align the current and previously publishedpeanut maps (Figure 2). Linkage group assignments ofall markers were consistent between the current mapand that of Bertioli et al. [36] except for the markerGM117 (AC3C02 on map in reference 36 derived fromGenBank accession DQ099133) that was localized on
A. duranensis(AA)
A. batizocoi(BB)
PI468328
PI468201
PI468202PI468203
Grif14248
PI468325
PI468329
PI468326
PI468327
PI468319
Grif15030Grif15033G
rif77
31
PI5
9135
1P
I468
322
A. stenospermaA. ipaensis
Figure 1 Genetic relationships among A- and B-genome Arachis species. Clustering of A- (A. duranensis and A. stenosperma) andB- (A. ipaensis and A. batizocoi) genome species according to analysis of data from SSR markers. The two parents used for mapping areindicated by arrows.
Nagy et al. BMC Genomics 2012, 13:469 Page 3 of 11http://www.biomedcentral.com/1471-2164/13/469
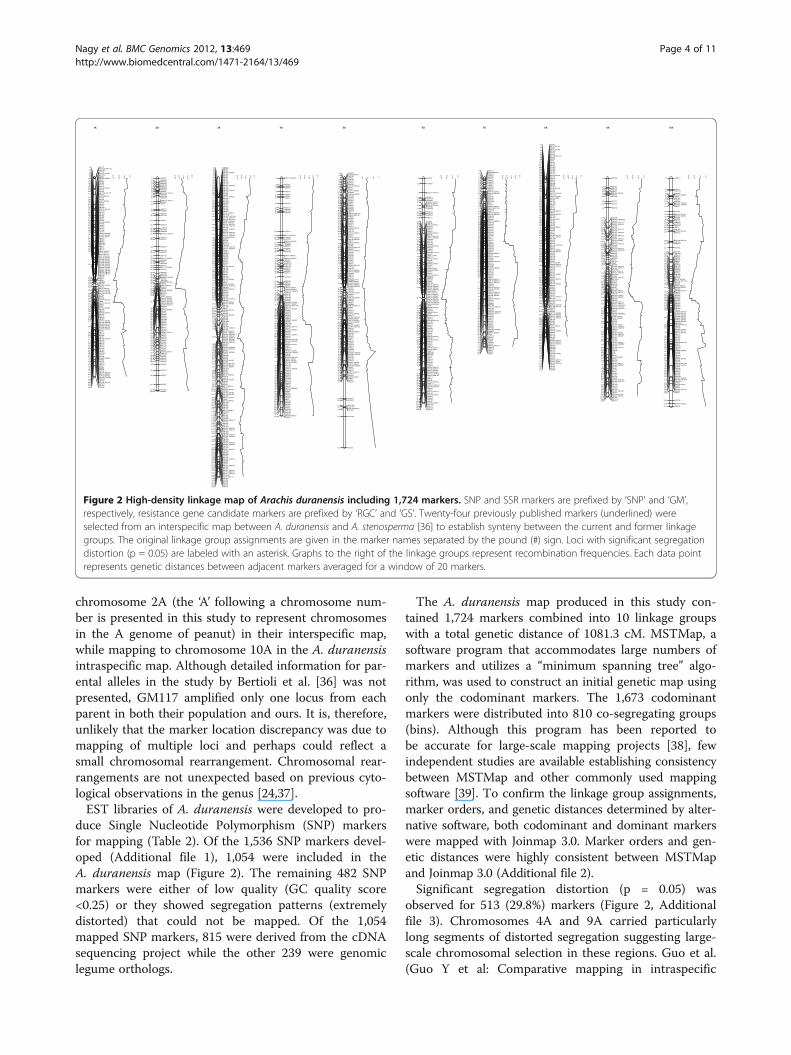
chromosome 2A (the ‘A’ following a chromosome num-ber is presented in this study to represent chromosomesin the A genome of peanut) in their interspecific map,while mapping to chromosome 10A in the A. duranensisintraspecific map. Although detailed information for par-ental alleles in the study by Bertioli et al. [36] was notpresented, GM117 amplified only one locus from eachparent in both their population and ours. It is, therefore,unlikely that the marker location discrepancy was due tomapping of multiple loci and perhaps could reflect asmall chromosomal rearrangement. Chromosomal rear-rangements are not unexpected based on previous cyto-logical observations in the genus [24,37].EST libraries of A. duranensis were developed to pro-
duce Single Nucleotide Polymorphism (SNP) markersfor mapping (Table 2). Of the 1,536 SNP markers devel-oped (Additional file 1), 1,054 were included in theA. duranensis map (Figure 2). The remaining 482 SNPmarkers were either of low quality (GC quality score<0.25) or they showed segregation patterns (extremelydistorted) that could not be mapped. Of the 1,054mapped SNP markers, 815 were derived from the cDNAsequencing project while the other 239 were genomiclegume orthologs.
The A. duranensis map produced in this study con-tained 1,724 markers combined into 10 linkage groupswith a total genetic distance of 1081.3 cM. MSTMap, asoftware program that accommodates large numbers ofmarkers and utilizes a “minimum spanning tree” algo-rithm, was used to construct an initial genetic map usingonly the codominant markers. The 1,673 codominantmarkers were distributed into 810 co-segregating groups(bins). Although this program has been reported tobe accurate for large-scale mapping projects [38], fewindependent studies are available establishing consistencybetween MSTMap and other commonly used mappingsoftware [39]. To confirm the linkage group assignments,marker orders, and genetic distances determined by alter-native software, both codominant and dominant markerswere mapped with Joinmap 3.0. Marker orders and gen-etic distances were highly consistent between MSTMapand Joinmap 3.0 (Additional file 2).Significant segregation distortion (p = 0.05) was
observed for 513 (29.8%) markers (Figure 2, Additionalfile 3). Chromosomes 4A and 9A carried particularlylong segments of distorted segregation suggesting large-scale chromosomal selection in these regions. Guo et al.(Guo Y et al: Comparative mapping in intraspecific
SNP7700.0RGC108b SNP1012SNP10630.3
SNP7165.2SNP370 SNP9845.6SNP10358.2GM24#19.3GM1030 GM82512.8SNP2515.1SNP85015.5SNP30816.0SNP41518.4SNP717*19.1SNP498 SNP97920.8GM133122.9SNP45423.5GM1118b GM1761GM202224.1
SNP14 SNP146SNP16925.4
SNP75426.5SNP78 SNP36328.3SNP87330.9GM150434.1SNP79734.6GM2568*36.3SNP514 GM113237.1SNP106737.3SNP73*38.7GM1208*39.7SNP55540.8SNP56541.0GM260341.4SNP54642.2SNP629 SNP78544.0SNP63644.5GM202445.0SNP36745.6GM142346.0SNP48446.4GM148346.6GM2173 SNP278SNP678 SNP98846.7
SNP271 SNP47147.1GM215348.1GM223348.7GM260749.0GM170#149.3SNP101349.5GM91749.6GM201549.7GM117149.9GM890 GM259750.0SNP19 SNP70SNP79 SNP104SNP110 SNP122SNP127 SNP242SNP258 SNP351SNP388 SNP460SNP466 SNP523SNP536 SNP665SNP846 SNP848SNP861 SNP893SNP901 SNP947GM22#1 GM1649GM1992 GM2527GM1233 GM1972GM2287
50.1
GM104850.2GM67250.3GM82450.5GM286#150.8GM177751.0SNP396 SNP89951.7GM284052.8SNP16 SNP216SNP316 SNP332SNP647 GM1065
53.2
SNP1046 GM135353.6SNP60453.9SNP5554.3SNP23254.5SNP779 GM133055.1GS22b56.0SNP747 GM1339GM93356.9
SNP9557.3SNP412 SNP69257.8GM144458.0GM272458.8SNP808 SNP981GM195059.1
SNP51559.5GM239059.7GM187960.2SNP213 SNP28060.4SNP148 GM2783GM2349 GM1913SNP866 SNP487SNP399 SNP373SNP355 SNP236SNP50
60.6
GM177160.7GM235060.8SNP55860.9GM150161.0GM1542 SNP462GM159961.1
GM241861.4GM213261.5GM187161.9GM200462.2SNP18962.3GM168462.7GM206163.1SNP105663.7SNP30764.5SNP73667.3SNP386 GM265371.0SNP22973.2SNP74473.8GM205374.0GM157374.4SNP5275.9GM38#176.3SNP70676.7SNP34577.1GM1275 GM162079.7SNP610 GM127780.3SNP160 SNP868SNP1042 GM108581.8
GM2344*83.8GM175087.1SNP188 SNP48988.5SNP101189.5GM161291.4SNP928*96.8
0.0
0.5
1.0
1.5
1A
GM28450.0SNP6282.1SNP398*3.2SNP395*4.0GM2186*4.7GM22326.1SNP853*6.2SNP522*6.4GM922*6.8GM1355* SNP416*7.0SNP820*7.6SNP10688.4SNP249*8.7
SNP551* SNP772*GM1655*11.4
SNP3*12.6
GM817*15.4GM2838*15.8
SNP852*17.6RGC193*18.1
SNP53*20.7
SNP405*22.9
GM2808*24.4GM1836*25.5GM2098*25.9
SNP427* GM1910*27.2
GM2814*29.4GM2121*29.6
GM2257*33.6
SNP745*35.5SNP656*36.1
SNP17838.0
SNP106 SNP91839.2SNP662*40.8GM211141.0GM166841.1SNP421*42.9GS110* SNP384*43.5RGC233*44.6
SNP320*46.8SNP962*48.1RGC23649.0SNP228* SNP968*49.1SNP87249.6GM126#249.8SNP407 SNP67050.7SNP72951.3SNP12 SNP499GM247451.4
SNP42051.9SNP180 SNP88352.5SNP64353.0RGC14153.2SNP9053.5SNP10 SNP168SNP185 SNP272SNP494 SNP505SNP570 SNP734SNP756 SNP1003GM2455 GM1516GM1503
53.7
GM107553.9SNP433 SNP88054.2SNP58754.5SNP19054.9SNP86355.3GM249155.5GM159856.2GM138656.7SNP34857.2SNP602*59.6SNP101062.6SNP17763.7SNP10164.2SNP29364.7GM249666.1SNP867 GM1714GM279766.5
SNP39167.7GM194672.8SNP42472.9GM204775.3GM185277.9SNP57478.6GM172479.6GM116079.7RGC5b81.3GM250081.8GM733 SNP799GM201683.1
SNP80784.5SNP59486.4SNP64686.9SNP28888.1GM181988.9
SNP80690.9
GM193093.8
SNP89796.3
SNP687100.7
GM1865103.7SNP88103.9
0.0
0.5
1.0
1.5
2.0
2A
GM32#30.0SNP7128.1GM25998.9SNP927 GM25989.1SNP1259.3GM28189.4SNP9319.7GM226112.1GM237213.4GM176014.0GM114915.7SNP682* GM1609*17.3GM119120.2GM1425*20.4GM2764* SNP478*21.2SNP164*25.3SNP83228.3GM208730.1SNP113* SNP335*SNP342*31.4
SNP780*31.5SNP1045*32.7SNP890*33.9SNP231*35.4SNP491*36.6SNP632*37.5GM1266*37.9GM2407*38.0SNP34* SNP813*SNP1008*38.1
GM1360* RGC146b38.3SNP186* SNP314*SNP904* RGC72a*GM2693* GM2694*
39.1
SNP31* SNP137*SNP534* SNP552*GM1733* RGC17b*
39.9
SNP194*40.2SNP566* GM2230*GM2524*40.8
SNP222* SNP792*RGC177* RGC170*RGC70b* RGC182*
41.4
RGC249 RGC22042.0GM2467*42.3SNP328*43.5SNP601*44.9RGC140b45.8GM1656*46.3GM1487* SNP165*46.7SNP447* SNP856*47.0GM82847.7GM2206*49.5GM2364*49.6SNP660*50.0GM2352*51.2GM218451.7GM227452.1SNP91752.6SNP65353.0GM77454.0SNP330 SNP894GM156654.6
GM103454.9SNP377*56.5SNP93957.1GM89857.2SNP54057.7GM1618*58.6SNP167 SNP823GM147359.1
SNP6959.4SNP30* SNP285*SNP809* GM1763*59.7
GM19#3*60.5SNP241* SNP500*60.7GM200861.0SNP92661.2GM158361.8RGC18b*62.1GM150062.6GM1053* SNP572*GM244963.0
SNP583 SNP605SNP777 SNP783SNP943
63.4
SNP101864.1GM78364.4GM2586 SNP81165.0SNP66165.6SNP896*66.6SNP283 GM240267.6GM164569.4SNP686*71.7SNP90571.8GM1659a75.5SNP524*76.4GM1681*77.4GM1443*77.9GM1369* SNP263*SNP435*78.3
SNP46* SNP223*SNP317* SNP354*SNP383* SNP425*SNP436* SNP445*SNP513* SNP561*SNP666* SNP885*SNP949* SNP980*GM1502* GM1717*
78.5
GM2215*78.6SNP56*78.8GM2556* SNP698*79.1SNP327* SNP349*79.4SNP69079.6SNP262* SNP895*80.1SNP63180.6GM1249*81.6SNP99083.1SNP23383.9SNP300 SNP423SNP54284.6
GM2772 GM172685.0SNP163 SNP440SNP833 GM2051SNP1111
85.7
GM188386.2SNP53188.4SNP1001*89.3SNP32* SNP623*91.7SNP64593.4GM241695.0SNP906 SNP908GM202795.9
GM74397.0SNP80198.7SNP17 SNP60099.1GM2419101.1SNP204 SNP543101.9GM2528102.4SNP390 SNP463GM1108 GM1885GM2069*
102.7
SNP371 SNP576103.0GM866103.3SNP103 SNP644103.8SNP1031*104.0SNP945*104.2GM2765105.1GM1084*108.4SNP176109.3SNP7* SNP886*GM2792a*110.0
GM714110.4SNP264111.4SNP496112.0GM1326*114.5SNP855* SNP970*116.3SNP776*116.9SNP819*118.7SNP153*119.3GM1954*119.8SNP219* SNP353*SNP675* SNP773*120.5
GM1321*121.7GM1652*122.3GM2228* SNP255*SNP326* SNP483*SNP839*
122.9
GM2103*124.6GM2805*124.7SNP507* SNP529*SNP639* SNP966*GM1213*
124.8
GM1591*125.2SNP912* SNP961*126.5GM1536*127.1SNP800*127.6GM74#3*127.7SNP741*128.8SNP725*129.4SNP668* SNP743*129.8GM2302*130.5GM2301*131.2SNP87*132.1SNP120* SNP1051*132.6SNP763*133.2SNP591*136.0SNP341* SNP347*137.4SNP15* SNP612*SNP914* GM1263*138.4
SNP1038*138.6SNP8* SNP719*138.9GM1854139.9SNP492*140.8SNP786141.1SNP175141.8SNP526*143.5GM2757145.6
0.0
0.5
1.0
1.5
2.0
3A
SNP142 SNP8450.0
SNP8573.5GM18403.9SNP5974.6
GM20146.6
SNP3068.1SNP599.2GM20919.5
SNP22712.4
GM112014.8SNP82215.9SNP45816.5SNP88116.7
GM201026.0
SNP97 SNP23528.0GM152829.1SNP22529.7
SNP313 SNP563SNP97631.5
GM76#432.6SNP57133.1
GM164734.7GM146635.5GM210835.6
SNP91 SNP62037.9
SNP778 GM144539.7SNP33740.3SNP50341.7GM244842.9GM173843.3SNP101443.4SNP47243.8GM83944.3SNP30245.1GM117345.9
GM1867*48.3
SNP43850.8SNP27751.7SNP98651.9SNP27052.8SNP269 SNP83153.1GM1565 SNP814*SNP1015* GM2246*55.4
GM1021*57.2GM1720*57.5GM175557.8GM1296*57.9GM2589*58.0SNP268*58.2SNP329* SNP468*SNP909* GM218*SNP1040* SNP1062*SNP1073*
58.4
SNP470* GM2813*58.6GM1887*58.9GM1959*59.3GM2311*59.8SNP983*60.8GM2572*62.1GM2006*62.9SNP689* SNP693*SNP889*63.3
SNP1002*64.0GM1465*64.4GM1995* GM1070*64.7SNP921*65.2SNP387* SNP582*GM1805*65.6
SNP430*66.0SNP453* SNP836*66.3GM916*66.7SNP172*67.0SNP638* SNP1060*GM1186* GM1643*67.4
RGC8967.5SNP593* GM1167*GM96*67.7
GM2142*68.0GM1013*68.7SNP935* SNP960*SNP1024* GM2482*69.4
GM2480*70.2SNP336*70.8RGC205* GM1554*71.2GM162* SNP45*SNP93* SNP183*SNP495* SNP982*GM1190*
71.7
GM114372.0GM1907*72.4SNP451* SNP938*73.8GM1919*74.9GM1679*75.9GM1594*77.0SNP279*79.0SNP323*80.2GM1298*81.0GM1729*81.5GM1223*82.6GM2236*83.2SNP704*85.8SNP28487.5SNP714* GM13#4*90.2GM2583*91.1GM942*94.5GM95595.3GM106296.8SNP944*97.8SNP824*98.9SNP499.9SNP442*100.4SNP954*101.0SNP825101.3GM1817102.0GM735*102.9GM1963*106.3SNP1005109.1GM1045112.0GM2755*112.9SNP290 GM2021GM2020115.8
0.0
0.5
1.0
1.5
2.0
4A
SNP6260.0SNP26 SNP431SNP7320.6
SNP601.6SNP7682.9GM27704.0SNP3335.6GM27036.0SNP493 SNP7536.2RGC446.7SNP9747.3SNP11 GM18989.5SNP98910.1SNP265 SNP93611.8GM172812.4GM125312.7GM151913.7SNP84215.6GM94816.8SNP29117.8GM126118.0SNP86918.5SNP66419.6GM2793*20.6GM111923.8SNP252 GM1118a24.2SNP622 SNP75925.4SNP80426.0SNP69926.4SNP81627.7SNP32528.3SNP37931.7SNP61732.4GM1317*36.3SNP559 SNP76737.0SNP75038.2GM115438.3SNP191 SNP691GM131339.5
SNP5440.1SNP161 SNP162SNP182 SNP504GM2771
40.8
SNP170 SNP702SNP96442.6
GM266344.2SNP757 SNP101945.0GM266246.6SNP737 SNP844GM198747.0
GM133247.6GM209248.7SNP13449.0GM203149.8SNP20150.2GM204350.7GM87451.0GM996 SNP1025SNP103051.5
GM104952.9SNP144 SNP654SNP742 GM282053.1
GM189253.2GM207853.4GM125753.5SNP13553.6GM68#5 SNP72SNP86 SNP207SNP554 SNP810SNP818 SNP859SNP862 SNP1000
53.7
GM157753.8GM216054.4GM148254.8GM1955 SNP562SNP84754.9
GM196755.0SNP108 SNP53856.1GM16#557.1SNP76157.6SNP21158.2GM28#558.7SNP139 SNP21258.8SNP8059.0SNP41160.0GM101860.4GM234761.3SNP156 SNP68063.0SNP81263.5GM1890 GM242963.8SNP66 SNP205SNP720 SNP94164.1
GM1218 GM248764.7SNP8264.8SNP237 GM267265.9GM2673 GM178266.2GM213769.1SNP39269.3SNP129 GM223169.4GM276969.5GM178869.7GM122770.5SNP8970.6SNP17170.8GM122871.1SNP57971.2GM187871.3GM201771.5GM184373.2SNP58074.5GM177876.7SNP253* SNP902*76.8SNP282* GM1293*77.4SNP220*77.9SNP130*79.8SNP723*80.5SNP957*81.1SNP63* SNP903*82.7SNP29* SNP40*83.3SNP199* SNP289*83.9GM944*84.4GM1902*84.8SNP11788.9SNP71 GM191291.0GM181691.1GM190491.7SNP83 SNP65294.2SNP6495.9SNP3596.5RGC27997.1
SNP410107.8SNP294108.3
SNP1066*111.7GM1702*112.0GM1162 SNP62*GM1944*112.1
GM1352*116.4
SNP42*131.7
0 1 2 3
5A
SNP580.0
SNP9992.8
GM2057 SNP4527.2
SNP81710.1SNP103710.6SNP59611.2GM1521 SNP11213.3GM1495 SNP27SNP102 SNP344SNP888
13.8
GM1682*14.2
SNP51816.7SNP54417.3GM194018.0
SNP13119.4
GM22624.5GM156725.4SNP39 SNP28626.9SNP92031.2GM154832.8SNP7633.8GM154734.1SNP898 SNP45034.5SNP95035.1GM2170 SNP497SNP517 SNP92936.1
GM128637.1SNP72638.9SNP103341.1GM138542.4GM1968 SNP39444.8SNP100745.7GM284446.2SNP12847.3SNP408* SNP123*SNP331*49.1
SNP911 SNP9SNP71850.3
SNP752 SNP31150.7SNP86451.3GM206351.7SNP956 SNP26752.6SNP60752.8SNP41753.3GM664 GM95954.5GM1505 SNP69454.9SNP97155.2GM270155.9GM1185 SNP418GM92#656.1
GM270257.1SNP44958.1GM98858.2SNP102358.3GM1461 SNP155SNP352 SNP459SNP480 SNP539SNP575 SNP1032
58.4
GM1035 SNP1SNP44 SNP136SNP179 SNP224SNP310 SNP557SNP578 SNP642SNP705 SNP793SNP821 SNP876SNP1049 GM1096GM1962 GM1896
59.1
GM8359.3SNP625 SNP238SNP62459.4
SNP102759.9GM2366* SNP41*60.1SNP6760.8SNP958 GM230661.4SNP51161.9GM190962.3SNP464 RGC53aRGC53b62.5
SNP72863.2GM161763.6SNP68164.3RGC93b65.4GM174866.4SNP78966.5GM90067.0SNP40067.8SNP969 GM2425SNP32268.4
SNP569 SNP46168.9SNP57369.6SNP18769.7SNP21570.0GM157270.1SNP195 SNP15170.3SNP730 SNP51GM281771.1
GM255#671.7SNP105872.3SNP23972.8GM84773.5GM149874.3SNP31275.2SNP50975.8SNP72177.0GM244677.2SNP991 SNP273SNP299 SNP490SNP553 SNP834SNP858 SNP995
77.7
SNP1041 SNP203*80.1SNP907 GM2109*80.7GM211083.2SNP7583.5SNP45685.0SNP281 SNP63586.8GM2414*89.6SNP246* SNP796*92.6SNP1053 SNP727*93.1GM233793.6GM276794.2SNP143 SNP1047SNP15295.9
SNP676 SNP900SNP94298.0
GM206699.1GM149099.3GM1497100.4SNP700 SNP916100.9SNP1039101.5SNP118104.8GM1506105.3SNP915*109.8
0.0
0.5
1.0
1.5
6A
SNP2100.0SNP23 SNP930GM24730.9
SNP2611.1SNP5081.4SNP7132.2GM8523.1GM16333.4GM20734.0GM9634.6GM21464.9GM21475.0SNP4345.3SNP295 SNP5566.5SNP198 SNP4036.8SNP777.0GM16217.3SNP5857.4SNP9557.8SNP10598.1SNP28.6GM21778.8SNP20 GM19299.5SNP24 SNP1020GM125011.5
GM117512.3SNP357 SNP588SNP782 GM114012.6
GM245413.6GM178514.4SNP58915.1SNP519 GM205015.4GM215615.5GM219915.6SNP56416.5GM194216.7GM149416.8SNP38116.9SNP63417.3GM163217.8SNP46917.9GM111118.6SNP3319.2GM111420.7GM84620.9GM168821.2SNP48121.7GM258821.9GM102322.0GM162322.6SNP60822.9SNP595 SNP83723.1SNP39723.5SNP217 SNP45523.9SNP88224.4GM222224.7SNP339 SNP102625.4SNP70725.8GM185826.7SNP48527.1SNP946 SNP95927.3GM107628.1GM145128.7SNP59229.0SNP47929.3GM203429.4SNP61130.4GM2423 SNP114SNP138 SNP196SNP301 GM1651GM2326
30.9
GM192231.1GM1937 SNP200SNP688 SNP98532.0
GM131532.1GM1829 SNP318SNP520 SNP79132.2
SNP260 SNP655SNP71032.7
SNP375 SNP568SNP87033.0
GM147734.6GM59#7*36.9SNP766*37.3GM1219* GM2747*38.4SNP192*39.6SNP369*40.7SNP586* SNP1036*41.0SNP366* SNP771*43.2SNP932*44.3GM249446.5GM170148.9SNP84151.2SNP54952.5SNP79555.2GM80255.6SNP940*58.6SNP343*59.2SNP784* GM1853*62.3GM69#7*64.3SNP275 SNP65067.3GS3b70.2GM121471.3SNP64174.9SNP38975.5GM98077.2SNP83578.0GM134778.4SNP803 GM1348GM252678.5
SNP101679.0GM84079.6GM95380.6SNP27482.3
0.0
0.5
1.0
1.5
2.0
7A
SNP5450.0SNP74 SNP197GM24210.6
SNP37 SNP126SNP3622.3
SNP1458.2SNP9978.7GM1239 GM10739.8GM22699.9SNP96716.8SNP6117.1SNP18417.8GM113424.1SNP99825.1RGC20625.6RGC26826.6GM162827.6GM132028.4GM157529.3SNP43 SNP34030.0GM187230.4SNP84032.1GM2055*35.0GM193235.8GM10#836.0SNP74036.2GM275836.9SNP48 SNP28738.5SNP29839.4GM196139.8SNP775 SNP1034SNP104841.3
SNP251 SNP32442.7SNP94 GM88343.1GM184443.2SNP15943.6SNP106544.7GM240045.3SNP2245.8GM174446.1SNP39346.6SNP209 GM210147.2SNP47548.1SNP684 SNP925SNP102848.4
GM113648.7SNP360 GM5849.0GM196549.3GM116549.4SNP20849.6SNP44349.7SNP248 SNP501SNP83050.1
SNP36850.6GM74150.8SNP65950.9SNP598 SNP75551.2SNP361 SNP613SNP108551.5
GM218251.6SNP93751.8SNP75852.7SNP1022 SNP1061GM109252.8
GM212553.0SNP319 SNP63753.1SNP166 SNP25954.1GM278754.2GM208955.0SNP132*55.6GM128156.1GM214456.3GM255156.4SNP18 SNP359GM2842 GM1613SNP535 SNP910GM2788
56.6
GM170957.3SNP40157.6GM120157.7SNP315 SNP657SNP79857.8
GM283257.9GM2643 GM100158.1SNP20658.4GM179859.6SNP115 SNP245SNP82660.0
GM264460.4GM264061.3SNP96561.6GM1903a62.1SNP61962.5SNP63362.6SNP1100 SNP214GM124062.9
RGC244 RGC219GM162963.3
GM190163.7SNP663 SNP1064GM1905 GM1934GM2339
63.9
GM231264.4SNP89264.6SNP116 SNP266SNP334 SNP365SNP877 GM2600
64.9
SNP473 SNP84965.1GM183965.5GM260166.0GM193666.3GM183166.9SNP81 SNP221SNP47667.3
GM217667.4SNP924 GM2665GM266467.6
GM191767.9GM118968.2GM150968.7GM282768.9GM2564 GM179769.0SNP419 SNP769GM2712 GM271369.2
SNP91369.6GM71#869.9GM1659b70.2GM171370.7GM123871.5SNP502 SNP56071.7SNP14071.8SNP37472.6GM241773.8SNP432 SNP474SNP891 GS43b74.4
SNP174 SNP105474.8SNP96375.2GM195775.5GM158775.7GM209977.3
0.0
0.5
1.0
1.5
2.0
8A
SNP358*0.0
SNP4674.7GM11745.3SNP6736.6SNP4777.0GM1856 GM18357.4SNP6157.9SNP2568.5
SNP35011.3
SNP64012.6
SNP516*14.6
GM243821.7GM1600* GM324#9*SNP441*23.7
SNP599* SNP1017*24.3SNP887* GM2120*GM1338*24.7
GM1237*27.0SNP149* SNP774*28.2SNP948*28.7SNP577* GM1952*GM1876*28.9
SNP364* SNP437*SNP521*30.0
SNP385* SNP439*30.5GM1559* SNP65*GM1650*33.3
SNP975* GM1732*34.4SNP378*36.2GM1893*36.6SNP218* SNP226*SNP919* SNP1009*36.7
SNP346*37.1SNP679*37.5SNP356*38.0SNP525*39.0SNP630*39.6SNP47*41.5GM1796*42.0GM66*42.3SNP860*43.2SNP296* SNP413*SNP482* SNP711*RGC144b*
43.7
SNP84* SNP111*SNP402* SNP465*SNP1057*
44.2
SNP952*44.8SNP672* SNP762*SNP1043*45.4
SNP446*46.5SNP871*47.1GM2164*48.3GM1069*48.9SNP28*49.9SNP1052*51.2SNP38* SNP616*51.5SNP708* SNP787*51.9GM2172*52.3GM2839* SNP96*SNP733* SNP827*GM2359*
52.6
GM1911*53.2SNP338* SNP701*SNP851* SNP934*SNP1044* SNP1050*
53.7
SNP972* GM1979*GM2792b* GM1834*54.5
GM2778*55.1GM565*55.5SNP429* GM328#9*55.6GM2847*55.7SNP68* SNP85*SNP92* GM2553*GM2292*
55.9
SNP735*56.2GM1851*56.6GM1411* SNP5*SNP567* SNP978*GM2003* GM2389*GM2843*
56.7
GM1291*57.3SNP36* SNP685*57.9SNP422* SNP739*58.4SNP154* SNP874*SNP951*59.5
SNP953*59.7GM1841*59.9SNP790* GM7#9*GM1998* GM1999*GM1047*
60.2
SNP100* SNP150*60.4SNP609*61.0GM2033*62.4S197*63.4SNP6*65.8SNP141*66.2SNP13* SNP550*67.3SNP875*70.0SNP124*70.3SNP977*70.6SNP49* SNP292*SNP584* SNP674*73.0
SNP621*73.3GS20a*73.8SNP794*78.2SNP21*79.8GM1803*83.0RGC63*86.0SNP722*87.7GM2529*89.2SNP533* GM145989.3SNP884* SNP1055*GM1117*91.1
GM1329*93.0GM1312*94.1GM1607*94.2SNP1109*95.0SNP276* SNP748*97.4SNP457*97.8SNP738 GM1199*99.4GM2081 GM1389100.5SNP305*101.0SNP1110*104.6SNP537*106.5
0.0
0.5
1.0
1.5
9A
GM20010.0
GM9505.5GM13736.3
GM22668.4SNP107 GM20828.9GM9519.0GM15629.2GM257710.1SNP372*12.2SNP304* SNP530*SNP614* SNP805*12.7
GM810*12.9
SNP32116.3
SNP157 GM110718.0SNP527 SNP828SNP83818.7
SNP99419.5RGC3320.7GM231621.2SNP100421.9SNP14723.0RGC124.1GM156125.5SNP254 SNP404SNP51025.9
SNP746 GM116330.8GM162431.2GM204131.7
SNP15834.1
SNP87937.0GM176437.2GM214039.6GM202940.7SNP54141.3GM205843.2GM92644.2GM92745.3SNP60347.2GM119547.3GM230348.1SNP23049.0GM272250.3SNP12150.4GM186851.3GM148151.8SNP72452.6SNP57 SNP376SNP715 SNP100653.1
SNP30353.4SNP78153.8SNP99 SNP426SNP506 SNP731SNP996
54.4
SNP788 GM1243GM232055.1
SNP70955.6SNP59055.9GM238356.3SNP82956.7SNP25056.8GM134157.3GM204057.6GM208457.9GM220758.2GM156358.4GM78458.5GM2582 GM1322SNP109 SNP119SNP202 SNP380SNP486 SNP651SNP683 SNP695SNP865 SNP922SNP993 GM1303GM117#2
58.6
GM1526 GM193358.7SNP53258.8GM187559.1SNP234 SNP257SNP627 SNP749GM2104 GM1460GM1172
59.6
SNP40959.8GM158160.1SNP24360.3SNP13360.7GM2348 GM140861.2SNP67762.3SNP24063.3GM145363.6GM253164.2SNP606 SNP658SNP80264.7
SNP64965.4GM152765.7GM228367.0SNP618 SNP92369.1SNP48870.8GM214871.8SNP105 SNP102972.0SNP244 SNP93376.0SNP44478.6SNP52879.7GM221880.6SNP70380.7SNP19381.5SNP66982.4GM1520c83.3SNP581 SNP878GM1886 GM1520aGM1520b
83.4
SNP29783.8SNP548 GM85791.6SNP67196.7SNP54797.3SNP173 SNP102199.0SNP406100.2SNP98103.8
GM2166108.4
SNP815 GM2032110.2
SNP696111.4
0.0
0.5
1.0
1.5
10A
Figure 2 High-density linkage map of Arachis duranensis including 1,724 markers. SNP and SSR markers are prefixed by ‘SNP’ and ‘GM’,respectively, resistance gene candidate markers are prefixed by ‘RGC’ and ‘GS’. Twenty-four previously published markers (underlined) wereselected from an interspecific map between A. duranensis and A. stenosperma [36] to establish synteny between the current and former linkagegroups. The original linkage group assignments are given in the marker names separated by the pound (#) sign. Loci with significant segregationdistortion (p = 0.05) are labeled with an asterisk. Graphs to the right of the linkage groups represent recombination frequencies. Each data pointrepresents genetic distances between adjacent markers averaged for a window of 20 markers.
Nagy et al. BMC Genomics 2012, 13:469 Page 4 of 11http://www.biomedcentral.com/1471-2164/13/469
populations uncovers a high degree of macrosynteny be-tween A-and B-genome diploid species of peanut, Sub-mitted) found that a single linkage group (4/9B) in A.batizocoi was syntenic with chromosomes 4A and 9A ofA. duranensis implicating inversion and reciprocaltranslocation events as the underlying chromosomalrearrangements in this B-genome species. Recombinationfrequencies were generally low in the central, presumablycentromeric chromosomal regions of A. duranensis and
increased toward the telomeres, a pattern typical of manyplant species [40,41]. More even distribution wasobserved along chromosome 3A and only slightly sup-pressed recombination was observed around the presum-able location of the centromere (Figure 2).Across the A. duranensis linkage map, each linkage
group spanned on average 108.1 cM (77.3-145.6 cM)and included 172.4 markers (119–266) (Table 3). This isconsiderably denser than the previously published AA,
Table 1 Previously published genomic SSR markers mapped in Arachis duranensis
Universal Name Original Name Forward (50-30) Reverse (50-30) Reference
GM7 Ah1TC1D02 GATCCAAAATCTCGCCTTGA GCTGCTCTGCACAACAAGAA Moretzsohn et al. 2005
GM10 Ah1TC1E05 GAAGGATAAGCAATCGTCCA GGATGGGATTGAACATTTGG Moretzsohn et al. 2005
GM13 Ah1TC1H04 CATTACTTCCTAGGTTTGTTTTCCA ATGGCGTGACAACGGAAC Moretzsohn et al. 2005
GM16 Ah1TC2B01 TTGCAGAAAAGGCAGAGACA GAAAGAAGCTAAGAAGGACCCATA Moretzsohn et al. 2005
GM19 Ah1TC2C07 CACCACACTCCCAAGGTTTT TCAAGAACGGCTCCAGAGTT Moretzsohn et al. 2005
GM22 Ah1TC2D06 AGGGGGAGTCAAAGGAAAGA TCACGATCCCTTCTCCTTCA Moretzsohn et al. 2005
GM24 Ah1TC2E05 GAATTTATAAGGCGTGGCGA CCATCCCTTCTTCCTTCACA Moretzsohn et al. 2005
GM28 Ah1TC3A12 GCCCATATCAAGCTCCAAAA TAGCCAGCGAAGGACTCAAT Moretzsohn et al. 2005
GM32 Ah1TC3E02 TGAAAGATAGGTTTCGGTGGA CAAACCGAAGGAGGAACTTG Moretzsohn et al. 2005
GM38 Ah1TC3H02 CTCTCCGCCATCCATGTAAT ATGGTGAGCTCGACGCTAGT Moretzsohn et al. 2005
GM58 Ah1TC4G06 ATTTCACATTCCCTAGCCCC CATCGACTGACTTGAAAAATGG Moretzsohn et al. 2005
GM59 Ah1TC4G10 TTCGGTCATGTTTGTCCAGA CTCGAGTGCTCACCCTTCAT Moretzsohn et al. 2005
GM66 Ah1TC5D06 GAAATTTTAGTTTTCAGCACAGCA TTTTCCCCTCTTAAATTTTCTCG Moretzsohn et al. 2005
GM68 Ah1TC6E01 CTCCCTCGCTTCCTCTTTCT ACGCATTAACCACACACCAA Moretzsohn et al. 2005
GM69 Ah1TC6G09 GGAGGTTGCATGCATCATAGT TCATTGAACGTATTTGAAAGCTC Moretzsohn et al. 2005
GM71 Ah2TC7A02 CGAAAACGACACTATGAAACTGC CCTTGGCTTACACGACTTCCT Moretzsohn et al. 2005
GM74 Ah2TC7E04 GAAGGACCCCATCTATTCAAA TCCGATTTCTCTCTCTCTCTCTC Moretzsohn et al. 2005
GM76 Ah2TC7G10 AATGGGGTTCACAAGAGAGAGA CCAGCCATGCACTCATAGAATA Moretzsohn et al. 2005
GM83 Ah2TC9C06 CAAATGGCAGAGTGCGTCTA CCCTCCTGACTGGGTCCT Moretzsohn et al. 2005
GM92 Ah2TC11A04 ACTCTGCATGGATGGCTACAG CATGTTCGGTTTCAAGTCTCAA Moretzsohn et al. 2005
GM96 Ah2TC11C06 TCCAACAAACCCTCTCTCTCT GAACAAGGAAGCGAAAAGAA Moretzsohn et al. 2005
GM117 Ah2AC3C02 TCTAACGCACACAAATCGAA CTTGTACCTGCGCCATTCT Moretzsohn et al. 2005
GM126 AS1RI1F06 TGTCTCTCTTCCTTTCCTTGCT CCTTTTGCTTCTTTGCTTCC Moretzsohn et al. 2005
GM162 AS1RN9C02 CGTTACACTGAGCCAGCAACTC ACGGCGGCGATAGTTTCA Moretzsohn et al. 2005
GM170 AS1RN11E05 CTCGGTCCAGAAAACACAGG GTAGAGGCGAAGAAGGCAGAG Moretzsohn et al. 2005
GM218 gi-30419832 GCCACTTTATTCTAAGCACTCC AAGAGACCACACGCTCACA Moretzsohn et al. 2005
GM226 gi-30419936 TCACAGATCCATAGACTTTAACATAGC CCGGTGTGGATTCATAGTAGAG Moretzsohn et al. 2005
GM255 pPGPSeq4H6 CCAACATTGCAGAAGCAAGA CAAAGAGAGGCACACCACAA Moretzsohn et al. 2005
GM286 Ah-193 CTTGCTGAAGGCAACTCCTACG TCGGTTTGTCTCTTTGGTCACTC Moretzsohn et al. 2004
GM324 Ah-649 GGAAATGCCAAATCCATCCTTC GTTGTTCGGTGTGAAAACGGTC Moretzsohn et al. 2004
GM328 Ah-671 AGAAAGAGCACGGGACATTACC ATGAATGAGTGGTCATACGCGA Moretzsohn et al. 2004
GM565 pPGSseq17E3 TTTCCTTTCAACCCTTCGTG AATGAGACCAGCCAAAATGC Ferguson et al. 2004
GM664 GM664 CTTCACCTCCAAAATCAACCA ACCGCTGACATTTGATTGTTC Guo et al. 2011
GM671 GM671 TGGATGCTGTAAGGAATGGAC TTATCGAGCTTGCCTCAGAAA Guo et al. 2011
Markers were renamed in order to follow a unified marker nomenclature. The complete list of renamed markers can be found in Guo et al. (Guo Y et al:Comparative mapping in intraspecific populations uncovers a high degree of macrosynteny between A-and B-genome diploid species of peanut, Submitted).
Nagy et al. BMC Genomics 2012, 13:469 Page 5 of 11http://www.biomedcentral.com/1471-2164/13/469
BB, and AABB maps consisting of only a few hundredmarkers. For example, the A. ipaensis × A. magna B-genome map published by Moretzsohn et al. [5] had 149SSR markers grouped into 10 linkages, whereas theB-genome SSR-based map in our related paper consistsof 449 loci in 16 linkage groups (Guo Y et al: Compara-tive mapping in intraspecific populations uncovers ahigh degree of macrosynteny between A-and B-genomediploid species of peanut, Submitted). The A-genomemap produced using the interspecific hybrid A. duranen-sis × A. stenosperma had 339 SSRs that were mappedinto 11 linkage groups [6,42]. For A. hypogaea, there arenow several maps with the most dense consensus mapcontaining 324 loci on 21 linkage groups [11].The map produced in the current study is the first
high-density map available in peanut, and because it wasgenerated from a progenitor species of A. hypogaea, weanticipate that it will have significant applications foranalyzing the cultivated genome. For example, the datagenerated in this map was used by Nagy et al. [43]to more precisely map the Rma gene for nematoderesistance that originated from an introgression linebetween A. hypogaea and A. cardenasii. The A-genomeSNP array also has been useful at the tetraploid levelfor genotyping a recombinant inbred line population
derived from a cross between cultivated peanut and asynthetic A. ipaensis x A. duranensis tetraploid (Ozias-Akins, unpublished).
Gene annotation and comparative mappingHomology search of the 1,724 mapped loci resulted insignificant hits for 1,463 loci in at least one of the threedatabases: Medicago, Uniprot and GenBank NR data-base, and 580 of the mapped loci gave significant simi-larities in either of the two gene ontology databases:Medicago Gene Atlas and TAIR (Additional file 4).Altogether 1,366 gene ontology terms were assigned tothe 580 genes. These were distributed among the threemajor gene ontology categories as follows: 521 molecularfunctions, 534 biological processes, and 311 cellularcomponents (Additional file 4).The sequences used to create the A. duranensis map
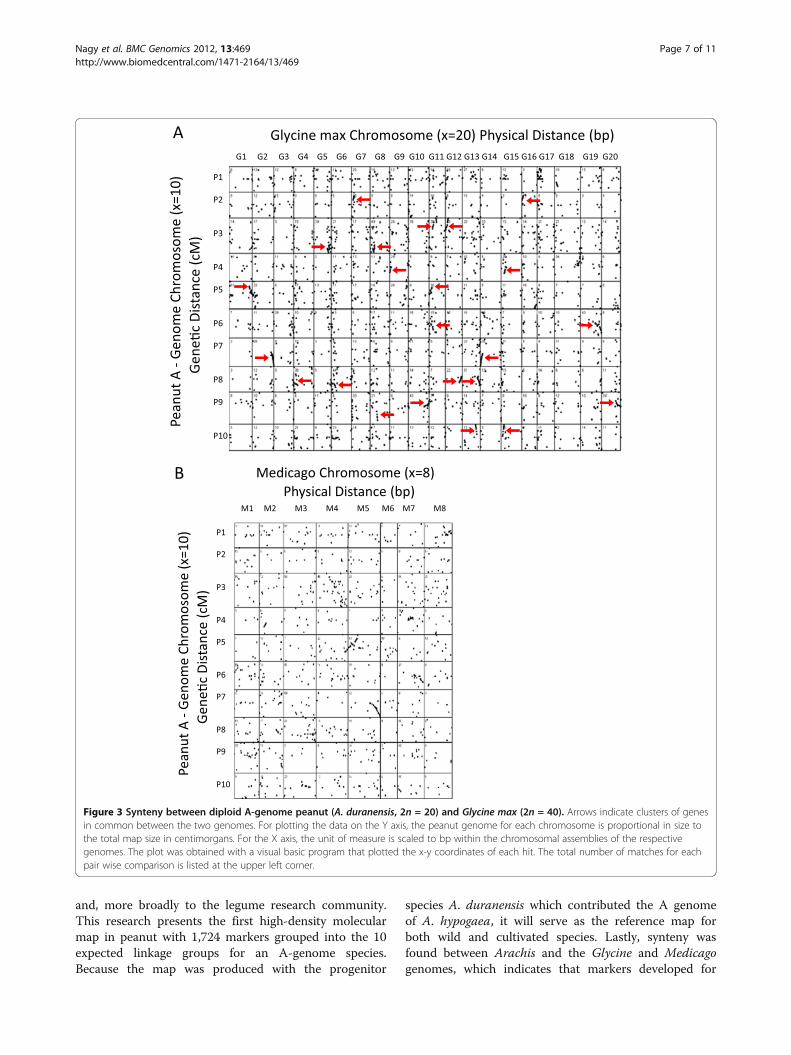
also were compared to the genomes of two legumeswhere 995 loci on the A. duranensis map could bemapped to M. truncatula, and 2,711 matches could befound in G. max (with potentially two hits per mappedlocus). While a majority of the dots in the synteny plotsappear to be random (Figure 3), there are definite clus-ters of markers, and striking examples of colinearity (redarrows), especially for the comparisons to Glycine. Pre-sumably there has been extensive single gene movementsince the last common ancestors in one or both species,but many genes remain in the ancestral locations andcan be detected. Overall, the synteny patterns for G.max showed the recent whole genome duplicationwithin Glycine, with each location in peanut showingcorresponding synteny at two locations in Glycine. Co-linearity between Medicago and Arachis is much lessconserved than between Arachis and Glycine. This couldbe due to extensive inversions in either genome, or morelikely, due to preliminary ordering of sequences withinthe Medicago unfinished genome assembly. In general,the patterns showed strong synteny on the chromosomalends in both genetic and physical distance, while thecentral regions of chromosomes tended to show lesssynteny. Presumably this could be attributed to pericen-tromeric heterochromatin which is known to define lessrecombinogenic regions where genomic rearrangementsare more likely to persist [44]. Chromosome arms tendto be maintained as syntenic between Glycine and Ara-chis, but there is evidence that chromosome arms havebeen translocated in some cases so that synteny exists atthe chromosome arm level, but less so at the wholechromosome level.
ConclusionsThis investigation provided a large number of de novoEST sequences that were deposited into GenBank. Themarkers developed here are valuable resources for peanut
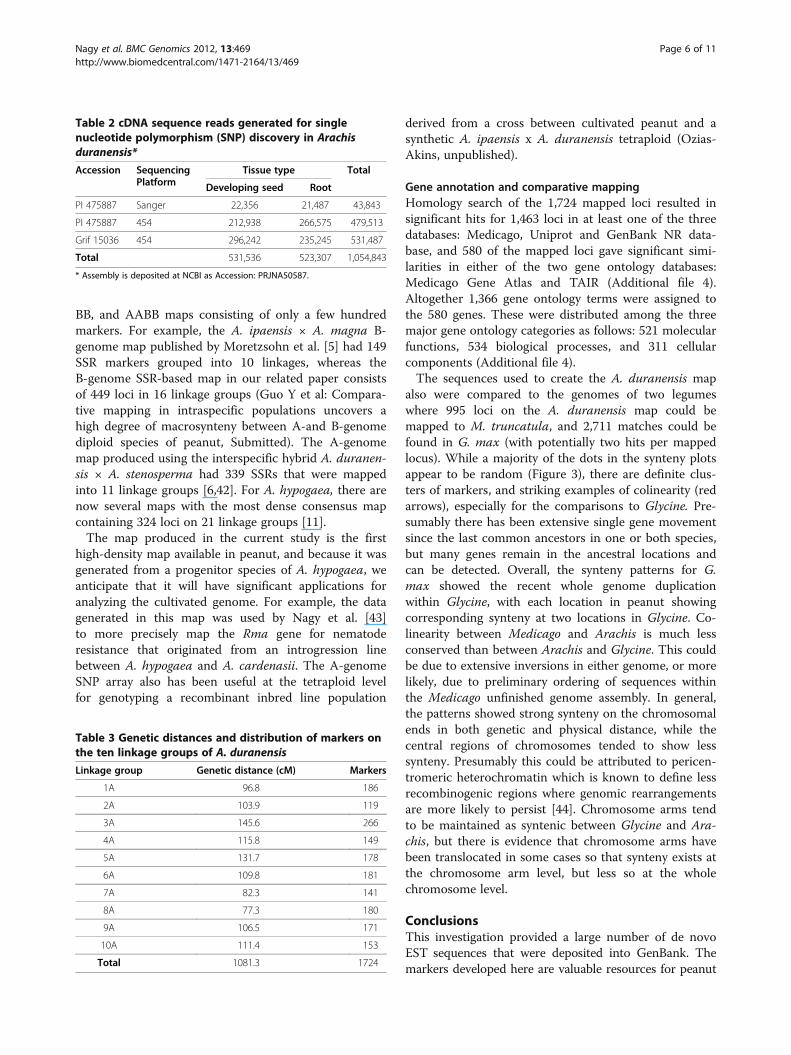
Table 3 Genetic distances and distribution of markers onthe ten linkage groups of A. duranensis
Linkage group Genetic distance (cM) Markers
1A 96.8 186
2A 103.9 119
3A 145.6 266
4A 115.8 149
5A 131.7 178
6A 109.8 181
7A 82.3 141
8A 77.3 180
9A 106.5 171
10A 111.4 153
Total 1081.3 1724
Table 2 cDNA sequence reads generated for singlenucleotide polymorphism (SNP) discovery in Arachisduranensis*
Accession SequencingPlatform
Tissue type Total
Developing seed Root
PI 475887 Sanger 22,356 21,487 43,843
PI 475887 454 212,938 266,575 479,513
Grif 15036 454 296,242 235,245 531,487
Total 531,536 523,307 1,054,843
* Assembly is deposited at NCBI as Accession: PRJNA50587.
Nagy et al. BMC Genomics 2012, 13:469 Page 6 of 11http://www.biomedcentral.com/1471-2164/13/469
and, more broadly to the legume research community.This research presents the first high-density molecularmap in peanut with 1,724 markers grouped into the 10expected linkage groups for an A-genome species.Because the map was produced with the progenitor
species A. duranensis which contributed the A genomeof A. hypogaea, it will serve as the reference map forboth wild and cultivated species. Lastly, synteny wasfound between Arachis and the Glycine and Medicagogenomes, which indicates that markers developed for
Figure 3 Synteny between diploid A-genome peanut (A. duranensis, 2n = 20) and Glycine max (2n = 40). Arrows indicate clusters of genesin common between the two genomes. For plotting the data on the Y axis, the peanut genome for each chromosome is proportional in size tothe total map size in centimorgans. For the X axis, the unit of measure is scaled to bp within the chromosomal assemblies of the respectivegenomes. The plot was obtained with a visual basic program that plotted the x-y coordinates of each hit. The total number of matches for eachpair wise comparison is listed at the upper left corner.
Nagy et al. BMC Genomics 2012, 13:469 Page 7 of 11http://www.biomedcentral.com/1471-2164/13/469
other legume species may be of value for crop improve-ment in peanut. The A-genome map will have utility forfine mapping in other peanut species and has alreadyhad application to mapping a nematode resistance genethat was introgressed to A. hypogaea from A. cardenasii.
MethodsPlant materialsThirty-seven accessions of A. duranensis, 14 accessionsof A. stenosperma (A genome), one accession of A.ipaensis, and eight accessions of A. batizocoi (B genome)were obtained from the USDA or NCSU germplasm col-lections. Plants were then grown in greenhouses at theUniversity of Georgia at Athens. The accessions evalu-ated are shown in Figure 1. Hybrids were made betweenthree pairs of A. duranensis accessions, including PI468200 × PI 468198, PI 468319 × PI 475885, andPI 475887 × Grif 15036. The hybrid combinationPI 475887 × Grif 15036 was one of the most poly-morphic as revealed by using a panel of SSR markersas described below and thus was selected for subse-quent mapping. PI 475887 was originally collected byKrapovickas, Schinini, and Simpson near Salta,Argentina during 1980, and Grif 15036 was originallycollected by Williams, Simpson, and Vargas nearBoqueron, Paraguay during 2002 [22]. Crosses weremade by manually emasculating flowers of the femaleparent PI 475887 during the late afternoon and pollin-ating stigmas between 8 and 10 am the followingmorning with pollen from the male parent Grif 15036.An F2 population was developed by self-pollinatingmultiple F1 individuals. The intraspecific F2 population(n = 94) from a hybrid between two A. duranensisaccessions was then used for mapping studies.
Molecular diversity between and within A- and B-genomediploid speciesDNA was isolated from leaf samples of A. duranensis,A. ipaensis, A. stenosperma, and A. batizocoi accessionsusing a modified CTAB method [45,46]. The 60 DNAsamples were amplified using 709 different SSR primerpairs (GM1-GM709) that had been generated fromsequences reported in the literature [6,29,47-53] andscreened for polymorphisms. SSR markers were geno-typed on an ABI3730XL Capillary DNA Sequencer(Applied Biosystems, Foster City, CA) as described ina related paper by Guo et al. (Guo Y et al: Compara-tive mapping in intraspecific populations uncovers ahigh degree of macrosynteny between A-and B-genomediploid species of peanut, Submitted) using forwardprimers labelled with FAM, HEX, or TAMRA fluoro-phores. Microsat [54] was used for construction of adistance matrix based on the proportion of sharedbands (D = 1 - ps) from 556 primer pairs amplifying
polymorphic fragments. The matrix was imported intoPhylip v3.67 [55] for the construction of the neighbor-joining tree.
Marker developmentSimple sequence repeat (SSR) markersA total of 101,132 unigenes (37,916 contigs (GenBank Acc.No. EZ720985-EZ758900) and 63,216 singletons) fromtetraploid peanut ESTs (GenBank Acc. No. CD037499-CD038843, ES702769-ES768453, GO256999-GO269325,GO322902- GO343529 and short-read Sequence ReadArchive accessions SRX020012, SRX019979, SRX019972,SRX019971) representing ca. 37 Mb of the A. hypogaeagenome were mined for 2,138 EST-SSR markers (GM710-GM2847) (Guo Y et al: Comparative mapping in intraspe-cific populations uncovers a high degree of macrosyntenybetween A-and B-genome diploid species of peanut,Submitted). Unigenes in the transcript assembly werescreened for perfect repeat motifs using SSR-IT http://www.gramene.org/db/markers/ssrtool) and for imperfectmotifs using FastPCR (http://primerdigital.com/fastpcr.html). The repeat count (n) threshold for each motif typewas set for n ≥ 5. SSR markers were genotyped on anABI3730XL Capillary DNA Sequencer (Applied Biosys-tems, Foster City, CA) using forward primers labelledwith FAM, HEX, or TAMRA fluorophores. PCR was per-formed in a 12 μL reaction mixture containing 1.0 × PCRbuffer, 2.5 mM Mg++, 0.2 mM each of dNTPs, 5.0 pmolof each primer, 0.5 unit of Taq polymerase, and 10 ng ofgenomic DNA. Touchdown PCR was used to reducespurious amplification. The SSR markers were screenedfor length polymorphisms using GeneMapper 3.0 software(Applied Biosystems, Foster City, CA). Of the 2,138 EST-SSR primer pairs tested, markers derived from 598 couldbe mapped. A set of 34 SSR markers from genomicsequences of Arachis previously screened for polymor-phism between parents of the A. duranensis mappingpopulation (Guo Y et al: Comparative mapping in intras-pecific populations uncovers a high degree of macrosyn-teny between A-and B-genome diploid species of peanut,Submitted) were also mapped (Table 1).
Single-stranded conformational polymorphism(SSCP) markersSSCP markers were developed from genomic DNA tem-plates for previously described NBS sequences isolatedby targeting conserved sequence motifs in NBS-LRRencoding genes [56,57] and from Arachis unigenesshowing similarity to R-gene homologs identified by min-ing a peanut transcript assembly [43]. SSCP fragmentswere amplified using touch-down PCR and detected bysilver-staining as previously described [58-60]. A totalof 380 SSCP markers were evaluated for polymorphismbetween the parents PI 475887 and Grif 15036. The
Nagy et al. BMC Genomics 2012, 13:469 Page 8 of 11http://www.biomedcentral.com/1471-2164/13/469
resistance gene analog markers are prefixed by either ‘GS’or ‘RGC’ in the map. cDNA sequences for unigenestargeted for SSCP marker development in the presentstudy were deposited in GenBank (Acc. No. GF100476-GF100638). One additional marker, the SCAR markerS197 linked to a root-knot nematode resistance gene inArachis hypogaea [43,61] was also mapped.
Development of single nucleotide polymorphism (SNP)markersTotal RNA was isolated from roots of young seedlings(up to four trifoliate) and from developing seeds (up todevelopmental stage R6) of the two parental genotypes,PI 475887 and Grif 15036 (alias DUR25 and DUR2,respectively). cDNA libraries were developed using theMint cDNA synthesis kit (Evrogen) and normalizedusing the Trimmer cDNA normalization kit (Evrogen).cDNA sequences were generated by Sanger and 454 GS-FLX sequencing methods and assembled using the toolMira [62]. Altogether, more than one million cDNAsequence reads were generated from A. duranensis PI475887 and Grif 15036. These were assembled into81,116 unique transcripts (unigenes) (GenBank Accn.No. HP000001-HP081116). Assemblies were searchedfor single nucleotide polymorphisms (SNPs) that fulfilledthe following two criteria: (a) the SNP position iscovered at least by two reads from each genotype, and(b) at least 80% of the reads call the SNP in the particu-lar genotype. Using these criteria, we identified 8,478SNPs in 3,922 unigenes. To facilitate the selection ofcandidate SNPs for designing and building IlluminaGoldenGate SNP genotyping arrays, putative intronpositions were predicted by aligning Arachis contigs withArabidopsis and Medicago genomic DNA sequencesidentified by BLAST analyses. SNPs within 60 bp of aputative intron were eliminated, thereby reducing thecollection of candidate SNPs to 6,789 in 3,264 unigenesfrom which 1,236 high-quality SNPs, each representingseparate unigenes, were selected for genotyping. SNPswere also detected by allele re-sequencing in a subset of768 conserved legume orthologs identified by coauthors(R.V. Penmetsa, N. Carrasquilla-Garcia, A. D. Farmerand D.R. Cook), and 300 of these SNPs were added tothe GoldenGate array. SNP genotyping on the Golden-Gate array was conducted at the Emory BiomarkerService Center, Emory University. The BeadStudio (Illu-mina) genotyping module was used for calling geno-types. Markers with GC quality scores lower than 0.25were excluded from subsequent analysis.
Map constructionThe program, MSTMap [39] was used to build a coregenetic map including all codominant markers usingthe cut-off p-value of 10-12 for clustering markers into
linkage groups. The recombinant inbred line2 (RIL2) al-gorithm and Kosambi function were used to calculategenetic distances. The program Joinmap 3.0 [63] wasused to localize the dominant markers and to confirmthe marker order, a range of LOD scores of 5–16 wasused to create groups. The Kosambi mapping functionwas used for map length estimations. Markers weretested for segregation distortion by the chi-square test.Graphic presentation of the map was drawn using Map-chart 2.0 software [64].
Gene annotationThe cDNA sequences included in the genetic map havebeen used to search for homologous genes in the Medi-cago (www.medicago.org), Uniprot (www.uniprot.org)and GenBank NR (http://www.ncbi.nlm.nih.gov/genbank)databases using various blast algorithms. Gene ontologyannotations were also added by searching MedicagoGene Atlas (http://mtgea.noble.org) and The ArabidopsisInformation Resource (TAIR, www.arabidopsis.org) data-bases. A significance threshold of E =1e-5 was applied inall inquiries.
Synteny between Arachis, Medicago, and GlycineThe EST sequences used for marker-development werecompared to the whole genome sequences of Glycinemax and Medicago truncatula to establish synteny.Sequences for the genomes G. max V5 and M. trunca-tula MT3.0 were obtained through www.phytozome.net.The sequences associated with each locus on the A. dura-nensis peanut map (Additional file 1 and Additional file 5)were searched against the respective whole genomesequences using blastn and E < =1e-6. For comparison toMedicago, only the best match was retained because dip-loid peanut and M. truncatula are at the same relativeploidy level. However for Glycine, the two best matchesfor each peanut sequence were retained because of the re-cent polyploidy within soybean and the high level of reten-tion of duplicated genes in the species. Blast hits toscaffolds or Bacterial Artificial Chromosomes (BACs) notanchored to the chromosomal assembly in the targetgenomes were discarded. Plotting the data and proces-sing of blast results were performed with Visual Basicprograms written for this study.
Additional files
Additional file 1: SNP markers on Illumina GoldenGate array.Marker ID along with sequence information for OPAs and target ESTsare provided.
Additional file 2: Comparative genetic mapping of Arachisduranensis using two different software programs on the samedataset. Genetic maps were constructed by MSTMap (left) using 1673co-dominant markers and Joinmap 3.0 (right) using 1724 markers.Linkage group assignments, marker orders and genetic distances were
Nagy et al. BMC Genomics 2012, 13:469 Page 9 of 11http://www.biomedcentral.com/1471-2164/13/469
highly consistent, except for the order among a few closely linked loci.Marker positions determined by Joinmap 3.0 are provided in Additionalfile 6.
Additional file 3: Mapped markers with segregation distortion(p = 0.05) and their position on the map. Column A lists the markerpositions on each chromosome, column B indicates marker name,column C is the chromosome number, columns D to H list the numberof individuals in each genotype class, and columns J and K provide χ2
and P values, respectively.
Additional file 4: Annotated loci mapped in Arachis duranensis.Columns B to J include homologs identified in the Medicago (B-D),GenBank-NR (E-G) and Uniprot-Sprot (H- J) databases. Columns L to Sinclude gene ontology (GO) terms identified in the three major GOcategories: molecular function (N, O), biological process (P,Q) and cellularcomponent (R,S).
Additional file 5: Sequences associated with SSR and SSCP markersfor synteny analysis. Column A is the marker name and column B is theGenebank ID or sequence used as query for synteny analysis.
Additional file 6: Marker positions for the linkage map.
Competing interestsThe authors declare that they have no competing interests.
Authors’ contributionsEDN developed the cDNA libraries, organized sequencing and SNPgenotyping, and constructed the initial genetic maps. YG conductedparental genotyping and constructed final genetic maps. EDN and STdeveloped the mapping population. EDN and RAO genotyped the SSR, RGC,and RS markers. JEB performed the synteny analysis. ST, YG, SK, AFH, NKdeveloped the SSR markers. SK performed the genetic diversity study. CATand DZ assembled the ESTs and nominated SNPs for the genic sequences.ADF, NCG, RVP and DC nominated the conserved legume ortholog SNPs.EDN and JEB participated in manuscript writing. DC, HTS and NNcontributed to project design. POA was Co-PI of the project and finalized themanuscript. SJK was the PI of the project, designed experiments, coordinatedthe study, and participated in manuscript writing. All authors read andapproved the final manuscript.
AcknowledgementsThis research was supported by funding from the USDA National Institute ofFood and Agriculture National Research Initiative Competitive GrantsProgram (#2006-35604-17242) awarded to SJK and POA and by the NationalPeanut Board, the Peanut Foundation, the Georgia Seed DevelopmentCommission, and Georgia Research Alliance endowment funding awarded toSJK.
Author details1Institute of Plant Breeding, Genetics and Genomics, University of Georgia,111 Riverbend Rd, Athens, GA 30605, USA. 2National Center for GenomeResources, 2935 Rodeo Park Drive East, Santa Fe, NM 87505, USA.3Department of Plant Pathology, University of California, Davis, CA 95616,USA. 4Department of Crop Science, North Carolina State University, Raleigh,NC 27695, USA. 5Department of Horticulture, University of Georgia, Tifton, GA31793, USA.
Received: 22 December 2011 Accepted: 30 August 2012Published: 11 September 2012
References1. Stalker HT, Mozingo LG: Molecular markers of Arachis and marker-assisted
selection. Peanut Sci 2001, 28:117–123.2. Paterson AH, Stalker HT, Gallo-Meagher M, Burow MD, Dwivedi SL, Crouch
JH, Mace ES: Genomics and genetic enhancement of peanut. In Genomicsfor Legume Crops. Edited by Wilson RF, Stalker HT, Brummer CE. Champaign,IL: Amer Oil Chem Soc; 2004:97–109.
3. Halward T, Stalker HT, Kochert G: Development of an RFLP linkage map indiploid peanut species. Theor Appl Genet 1993, 87:379–384.
4. Garcia GM, Stalker HT, Schroeder E, Lyerly JH, Kochert G: A RAPD-basedlinkage map of peanut based on a backcross population between the
two diploid species of Arachis stenosperma and A. cardenasii. Peanut Sci2005, 32:1–8.
5. Moretzsohn MC, Barbosa AVG, ves-Freitas DMT, Teixeira C, Leal-Bertioli SCM,Guimaraes PM, Pereira RW, Lopes CR, Cavallari MM, Valls JFM, et al: Alinkage map for the B-genome of Arachis (Fabaceae) and its synteny tothe A-genome. BMC Plant Biol 2009, 9:40.
6. Moretzsohn MC, Leoi L, Proite K, Guimaraes PM, Leal-Bertioli SCM,Gimenes MA, Martins WS, Valls JFM, Grattapaglia D, Bertioli DJ: Amicrosatellite-based, gene-rich linkage map for the AA genome ofArachis (Fabaceae). Theor Appl Genet 2005, 111:1060–1071.
7. Burow MD, Simpson CE, Starr JL, Paterson AH: Transmission geneticsof chromatin from a synthetic amphidiploid to cultivated peanut(Arachis hypogaea L.): Broadening the gene pool of a monophyleticpolyploid species. Genetics 2001, 159:823–837.
8. Fonceka D, Hodo-Abalo T, Rivallan R, Faye I, Sall MN, Ndoye O,Favero AP, Bertioli DJ, Glaszmann JC, Courtois B, et al: Genetic mappingof wild introgressions into cultivated peanut: a way toward enlargingthe genetic basis of a recent allotetraploid. BMC Plant Biol 2009,9:103.
9. Varshney RK, Bertioli DJ, Moretzsohn MC, Vadez V, Krishnamurthy L, Aruna R,Nigam SN, Moss BJ, Seetha K, Ravi K, et al: The first SSR-based geneticlinkage map for cultivated groundnut (Arachis hypogaea L.). Theor ApplGenet 2009, 118:729–739.
10. Hong YB, Chen XP, Liang XQ, Liu HY, Zhou GY, Li SX, Wen SJ, Holbrook CC,Guo BZ: A SSR-based composite genetic linkage map for the cultivatedpeanut (Arachis hypogaea L.) genome. BMC Plant Biol 2010, 10:17.
11. Qin H, Feng S, Chen C, Guo Y, Knapp S, Culbreath A, He G, Wang M,Zhang X, Holbrook CC, Ozias-Akins P, Guo B: An integrated genetic linkagemap of cultivated peanut (Arachis hypogaea L.) constructed from twoRIL populations. Theor Appl Genet 2011, 124:653–664.
12. Gautami B, Pandey MK, Vadez V, Nigam SN, Ratnakumar P, Krishnamurthy L,Radhakrishnan T, Gowda MVC, Narasu ML, Hoisington DA, et al:Quantitative trait locus analysis and construction of consensus geneticmap for drought tolerance traits based on three recombinant inbredline populations in cultivated groundnut (Arachis hypogaea L.). Mol Breed2012, 30:757–772.
13. Ravi K, Vadez V, Isobe S, Mir RR, Guo Y, Nigam SN, Gowda MVC,Radhakrishnan T, Bertioli DJ, Knapp SJ, et al: Identification of several smallmain-effect QTLs and a large number of epistatic QTLs for droughttolerance related traits in groundnut (Arachis hypogaea L.). Theor ApplGenet 2011, 122:1119–1132.
14. Shirasawa K, Koilkonda P, Aoki K, Hirakawa H, Tabata S, Watanabe M,Hasegawa M, Kiyoshima H, Suzuki S, Kuwata C, et al: In silicopolymorphism analysis for the development of simple sequence repeatand transposon markers and construction of linkage map in cultivatedpeanut. BMC Plant Biol 2012, 12:80.
15. Singh AK, Simpson CE: In Biosystematics and genetic resources, Chap.4 in theGroundnut crop: A scientific basis for improvement. Edited by Smart J.London: Chapman &Hall; 1994.
16. Kochert G, Stalker HT, Gimenes M, Galgaro L, Lopes CR, Moore K: RFLP andcytogenetic evidence on the origin and evolution of allotetraploiddomesticated peanut, Arachis hypogaea (Leguminosae). Am J Bot 1996,83:1282–1291.
17. Guyomarc'h H, Sourdille P, Charmet G, Edwards KJ, Bernard M:Characterisation of polymorphic microsatellite markers from Aegilopstauschii and transferability to the D-genome of bread wheat. Theor ApplGenet 2002, 104:1164–1172.
18. Gill KS, Lubbers EL, Gill BS, Raupp WJ, Cox TS: A genetic linkage map ofTriticum tauschii (DD) and its relationship to the D-genome of breadwheat (AABBDD). Genome 1991, 34:362–374.
19. Echt CS, Kidwell KK, Knapp SJ, Osborn TC, McCoy TJ: Linkage mapping indiploid alfalfa (Medicago sativa). Genome 1993, 37:61–71.
20. Brummer EC, Bouton JH, Kochert G: Development of an RFLP map indiploid alfalfa. Theor Appl Genet 1993, 86:329–332.
21. Yu GX, Wise RP: An anchored AFLP- and retrotransposon-based map ofdiploid Avena. Genome 2000, 43:736–749.
22. Stalker HT, Ferguson ME, Valls JFM, Pittman RN, Simpson CE, Bramel-Cox P:Catalog of Arachis germplasm collection; 2002. http://wwwicrisatorg/text/research/grep/homepage/groundnut/arachis/starthtm.
23. USDA-ARS: Germplasm Resources Information Network Species Records ofArachis. 2011. http://wwwars-gringov/cgi-bin/npgs/html/splistpl?889.
Nagy et al. BMC Genomics 2012, 13:469 Page 10 of 11http://www.biomedcentral.com/1471-2164/13/469
24. Stalker HT, Kochert GD, Dhesi JS: Genetic diversity within the speciesArachis duranensis Krapov. & W.C. Gregory, a possible progenitor ofcultivated peanut. Genome 1995, 38:1201–1212.
25. Robledo G, Seijo G: Species relationships among the wild B genome ofArachis species (section Arachis) based on FISH mapping of rDNA lociand heterochromatin detection: A new proposal for genomearrangement. Theor Appl Genet 2010, 121:1033–1046.
26. Pandey MK, Monyo E, Ozias-Akins P, Liang X, Guimarães P, Nigam SN,Upadhyaya HD, Janila P, Zhang X, Guo B, et al: Advances in Arachisgenomics for peanut improvement. Biotech Adv 2012, 30:639–651.
27. Gimenes MA, Hoshino AA, Barbosa AVG, Palmieri DA, Lopes CR:Characterization and transferability of microsatellite markers of thecultivated peanut (Arachis hypogaea). BMC Plant Biol 2007, 7:9.
28. Mace ES, Varshney RK, Mahalakshmi V, Seetha K, Gafoor A, Leeladevi Y,Crouch JH: In silico development of simple sequence repeat markerswithin the aeschynomenoid/dalbergoid and genistoid clades of theLeguminosae family and their transferability to Arachis hypogaea,groundnut. Plant Sci 2008, 174:51–60.
29. Proite K, Leal-Bertioli S, Bertioli D, Moretzsohn M, da Silva F, Martins N,Guimaraes P: ESTs from a wild Arachis species for gene discovery andmarker development. BMC Plant Biol 2007, 7:7.
30. Cuc LM, Mace ES, Crouch JH, Quang VD, Long TD, Varshney RK: Isolationand characterization of novel microsatellite markers and theirapplication for diversity assessment in cultivated groundnut (Arachishypogaea). BMC Plant Biol 2008, 8:55.
31. Yuan M, Gong LM, Meng RH, Li SL, Dang P, Guo BZ, He GH: Developmentof trinucleotide (GGC)n SSR markers in peanut (Arachis hypogaea L.).Electronic J Biotech 2010, 13(6):6.
32. Song GQ, Li MJ, Xiao H, Wang XJ, Tang RH, Xia H, Zhao CZ, Bi YP: ESTsequencing and SSR marker development from cultivated peanut(Arachis hypogaea L.). Electronic J Biotech 2010, 13(3):10.
33. Wang CT, Yang XD, Chen DX, Yu SL, Liu GZ, Tang YY, Xu JZ: Isolation ofsimple sequence repeats from groundnut. Electronic J Biotech 2007,10(3):10.
34. Liang XQ, Chen XP, Hong YB, Liu HY, Zhou GY, Li SX, Guo BZ: Utility ofEST-derived SSR in cultivated peanut (Arachis hypogaea L.) and Arachiswild species. BMC Plant Biol 2009, 9:35.
35. Koilkonda P, Sato S, Tabata S, Shirasawa K, Hirakawa H, Sakai H, Sasamoto S,Watanabe A, Wada T, Kishida Y, et al: Large-scale development ofexpressed sequence tag-derived simple sequence repeat markers anddiversity analysis in Arachis spp. Mol Breed 2012, 30:125–138.
36. Bertioli DJ, Moretzsohn MC, Madsen LH, Sandal N, Leal-Bertioli SCM,Guimaraes PM, Hougaard BK, Fredslund J, Schauser L, Nielsen AM, et al:An analysis of synteny of Arachis with Lotus and Medicago sheds newlight on the structure, stability and evolution of legume genomes.BMC Genomics 2009, 10:45.
37. Stalker HT, Dhesi JS, Parry D: An analysis of the B genome species Arachisbatizocoi (Fabaceae). Plant Syst Evol 1991, 174:159–169.
38. Wells DE, Gutierrez L, Xu Z, Krylov V, Macha J, Blankenburg KP, Hitchens M,Bellot LJ, Spivey M, Stemple DL, et al: A genetic map of Xenopus tropicalis.Devel Biol 2011, 354:1–8.
39. Wu Y, Bhat PR, Close TJ, Lonardi S: Efficient and accurate construction ofgenetic linkage maps from the minimum spanning tree of a graph. PLoSGenet 2008, 4:10.
40. Heslop-Harrison JS: Comparative genome organization in plants: Fromsequence and markers to chromatin and chromosomes. Plant Cell 2000,12:617–635.
41. Paape T, Zhou P, Branca A, Briskine R, Young N, Tiffin P: Fine-scalepopulation recombination rates, hotspots, and correlates ofrecombination in the Medicago truncatula genome. Genome Biol Evol2012, 4:726–732.
42. Leal-Bertioli SCM, Jose ACVF, ves-Freitas DMT, Moretzsohn MC, GuimaraesPM, Nielen S, Vidigal BS, Pereira RW, Pike J, Favero AP, et al: Identification ofcandidate genome regions controlling disease resistance in Arachis.BMC Plant Biol 2009, 9:112.
43. Nagy ED, Chu Y, Guo YF, Khanal S, Tang SX, Li Y, Dong WBB, Timper P,Taylor C, Ozias-Akins P, et al: Recombination is suppressed in an alienintrogression in peanut harboring Rma, a dominant root-knot nematoderesistance gene. Mol Breed 2010, 26:357–370.
44. Bowers JE, Arias MA, Asher R, Avise JA, Ball RT, Brewer GA, Buss RW,Chen AH, Edwards TM, Estill JC, et al: Comparative physical mapping links
conservation of microsynteny to chromosome structure andrecombination in grasses. Proc Natl Acad Sci USA 2005, 102:13206–13211.
45. Murray MG, Thompson WR: Rapid isolation of high molecular weightplant DNA. Nucl Acids Res 1980, 8:4321–4325.
46. Doyle JJ, Doyle JL: A rapid DNA isolation procedure for small quantitiesof fresh leaf tissue. Phytochem Bull 1987, 19:11–15.
47. Hopkins MS, Casa AM, Wang T, Mitchell SE, Dean RE, Kochert GD,Kresovich S: Discovery and characterization of polymorphic simplesequence repeats (SSRs) in peanut. Crop Sci 1999, 39:1243–1247.
48. Palmieri DA, Bechara MD, Curi RA, Gimenes MA, Lopes CR: Novelpolymorphic microsatellite markers in section Caulorrhizae (Arachis,Fabaceae). Mol Ecol Notes 2005, 5:77–79.
49. Palmieri DA, Hoshino AA, Bravo JP, Lopes CR, Gimenes MA: Isolation andcharacterization of microsatellite loci from the forage species Arachispintoi (Genus Arachis). Mol Ecol Notes 2002, 2:551–553.
50. He G, Meng R, Newman M, Gao G, Pittman RN, Prakash CS: Microsatellitesas DNA markers in cultivated peanut (Arachis hypogaea L.). BMC PlantBiol 2003, 3:3.
51. Ferguson ME, Burow MD, Schulze SR, Bramel PJ, Paterson AH, Kresovich S,Mitchell S: Microsatellite identification and characterization in peanut(A. hypogaea L.). Theor Appl Genet 2004, 108:1064–1070.
52. Krishna GK, Zhang J, Burow M, Pittman RN, Delikostadinov SG, Lu Y,Puppala N: Genetic diversity analysis in Valencia peanut (Arachishypogaea L.) using microsatellite markers. Cell Mol Biol Lett 2004,9:685–697.
53. Moretzsohn MC, Hopkins MS, Mitchell SE, Kresovich S, Valls JF, Ferreira ME:Genetic diversity of peanut (Arachis hypogaea L.) and its wild relativesbased on the analysis of hypervariable regions of the genome. BMC PlantBiol 2004, 4:11.
54. Minch E, Ruiz-Linares A, Goldstein D, Feldman M, Cavalli-Sforza LL:MICROSAT: A computer program for calculating various statistics onmicrosatellite allele data, ver. 1.5d.: ; 1997. http://hpglstanfordedu/projects/microsat/.
55. Felsenstein J: PHYLIP - Phylogeny Inference Package (version 3.2).Cladistics 1989, 5:164–166.
56. Bertioli DJ, Leal-Bertioli SCM, Lion MB, Santos VL, Pappas G, Cannon SB,Guimaraes PM: A large scale analysis of resistance gene homologues inArachis. Mol Genet Genom 2003, 270:34–45.
57. Yuksel B, Estill JC, Schulze SR, Paterson AH: Organization and evolution ofresistance gene analogs in peanut. Mol Genet Genom 2005, 274:248–263.
58. Orita M, Iwahana H, Kanazawa H, Hayashi K, Sekiya T: Detection ofpolymorphisms of human DNA by gel-electrophoresis as single-strandconformation polymorphisms. Proc Natl Acad Sci USA 1989, 86:2766–2770.
59. Sanguinetti CJ, Neto ED, Simpson AJG: Rapid silver staining and recoveryof PCR products separated on polyacrylamide gels. Biotechniques 1994,17:914.
60. Radwan O, Gandhi S, Heesacker A, Whitaker B, Taylor C, Plocik A, Kesseli R,Kozik A, Michelmore RW, Knapp SJ: Genetic diversity and genomicdistribution of homologs encoding NBS-LRR disease resistance proteinsin sunflower. Mol Genet Genom 2008, 280:111–125.
61. Chu Y, Holbrook CC, Timper P, Ozias-Akins P: Development of a PCR-basedmolecular marker to select for nematode resistance in peanut. Crop Sci2007, 47:841–847.
62. Chevreux B, Pfisterer T, Drescher B, Driesel AJ, Muller WEG, Wetter T, Suhai S:Using the miraEST assembler for reliable and automated mRNAtranscript assembly and SNP detection in sequenced ESTs. Genome Res2004, 14:1147–1159.
63. Van Ooijen JW, Voorrips RE: JoinMap 3.0 software for the calculation ofgenetic linkage maps. Wageningen, the Netherlands: Plant ResearchInternation; 2001.
64. Voorrips RE: MapChart: software for the graphical presentation of linkagemaps and QTLs. J Hered 2002, 93:77–78.
doi:10.1186/1471-2164-13-469Cite this article as: Nagy et al.: A high-density genetic map of Arachisduranensis, a diploid ancestor of cultivated peanut. BMC Genomics 201213:469.
Nagy et al. BMC Genomics 2012, 13:469 Page 11 of 11http://www.biomedcentral.com/1471-2164/13/469
Related Documents