A Health Impact Assessment of the Healthy Families Act of 2009 June 11, 2009 For more information see www.humanimpact.org/PSD or call 510 740 0143.

Welcome message from author
This document is posted to help you gain knowledge. Please leave a comment to let me know what you think about it! Share it to your friends and learn new things together.
Transcript
A Health Impact Assessment of the Healthy Families Act of 2009
June 11, 2009
For more information see www.humanimpact.org/PSD or call 510 740 0143.

Health Impact Assessment of the Healthy Families Act of 2009
-2-
AUTHORS
Human Impact Partners Won Kim Cook, PhD, MPH Jonathan Heller, PhD San Francisco Department of Public Health Rajiv Bhatia, MD, MPH Lili Farhang, MPH
REPORT REVIEWERS
Netsy Firestein – Labor Project for Working Families Vicky Lovell – California Budget Project Karen Minatelli – National Partnership for Women & Families Nancy Rankin – A Better Balance Sara Satinsky – Human Impact Partners Sarah Standiford – Maine Women’s Lobby and Maine Women’s Policy Center
HIA ADVISORY COMMITTEE
Netsy Firestein – Labor Project for Working Families Vicky Lovell – California Budget Project Kevin Miller – Institute for Women’s Policy Research Karen Minatelli – National Partnership for Women & Families Nancy Rankin – A Better Balance Sarah Standiford – Maine Women’s Lobby and Maine Women’s Policy Center
ACKNOWLEDGEMENTS
We would like to thank the National Partnership for Women & Families for commissioning this health impact assessment and the Annie E. Casey Foundation for providing funding. We would also like to thank Tara Zhang with SFDPH for research support, Karen Herman with CDC for providing data, and 9to5 Milwaukee, Mujeres Unidas y Activas, United Domestic Workers of America, and Young Workers United for help organizing focus groups.
SUGGESTED CITATION
Human Impact Partners and San Francisco Department of Public Health. A Health Impact Assessment of the Healthy Families Act of 2009. Oakland, California. June 2009.
Health Impact Assessment of the Healthy Families Act of 2009
-3-
TABLE OF CONTENTS
1. KEY FINDINGS: ANTICIPATED HEALTH IMPACTS OF THE HEALTHY FAMILY ACT OF 2009 ................................................................................................................................................ 5 2. INTRODUCTION.................................................................................................................................... 8 3. BACKGROUND .................................................................................................................................... 10
3.1 HEALTH IMPACT ASSESSMENT OVERVIEW ................................................................. 10 3.2 FEDERAL PAID SICK DAYS LEGISLATION: HEALTHY FAMILIES ACT OF 2009.. 10 3.3 ACCESS TO PAID SICK DAYS IN THE UNITED STATES .............................................. 11 3.4 THE DECISION TO CONDUCT AN HIA ON PAID SICK DAYS LEGISLATION ........ 12 3.5 POTENTIAL HEALTH IMPACTS RESULTING FROM PAID SICK DAYS
REQUIREMENTS .................................................................................................................... 13 2.6 RESEARCH QUESTIONS AND METHODS ........................................................................ 16
4. ASSESSMENT OF THE HEALTH IMPACTS OF PAID SICK DAYS: A SYNTHESIS OF THE FINDINGS......................................................................................................................................... 18
4.1 AVAILABILITY OF PAID SICK DAYS IN RELATIONSHIP TO NEED AND HEALTH STATUS..................................................................................................................................... 18
4.2 EFFECT OF PAID SICK DAYS ON THE UTILIZATION OF SICK LEAVE................... 21 Utilization of Sick Leave among Workers With and Without Paid Sick Days .......................... 21 Care for Dependents among Workers With and Without Paid Sick Days................................. 23
4.3 EFFECT OF PAID SICK DAYS ON RECOVERY FROM ILLNESS ................................. 25 4.4 EFFECT OF PAID SICK DAYS ON PRIMARY CARE UTILIZATION............................ 27 4.5 EFFECT OF PAID SICK DAYS ON PREVENTABLE HOSPITALIZATIONS ................ 28 4.6 EFFECT OF PAID SICK DAYS ON RECOVERY FROM ILLNESS, PRIMARY CARE
UTILIZATION, AND PREVENTABLE HOSPITALIZATIONS FOR DEPENDENTS OF WORKERS................................................................................................................................ 30
4.7 EFFECT OF PAID SICK DAYS ON COMMUNICABLE DISEASE TRANSMISSION IN COMMUNITY SETTINGS ..................................................................................................... 32
Influenza......................................................................................................................................... 32 Transmission of Foodborne Disease in Restaurants .................................................................. 36 Transmission of Infectious Disease in Health Care Facilities................................................... 38 Transmission of Infectious Disease in Childcare Facilities ....................................................... 38
4.8 EFFECT OF PAID SICK DAYS ON WAGE LOSS, RISK OF JOB LOSS, AND EMPLOYER RETALIATION ................................................................................................. 39
Wage Loss...................................................................................................................................... 39 Risk of Job Loss and Employer Retaliation................................................................................. 43
5. REFERENCES....................................................................................................................................... 46 APPENDIX I. NATIONAL HEALTH INTERVIEW SURVEY: RESEARCH METHODS AND FINDINGS................................................................................................................................................... 53
METHODS........................................................................................................................................ 53 FINDINGS ........................................................................................................................................ 58 CONCLUSION ................................................................................................................................. 71
APPENDIX II. PAID SICK DAYS FOCUS GROUPS—METHODS AND FINDINGS............... 73 METHODS........................................................................................................................................ 73 FINDINGS ........................................................................................................................................ 74 CONCLUSION ................................................................................................................................. 80
Health Impact Assessment of the Healthy Families Act of 2009
-4-
LIST OF TABLES
Table 1. Assessment of HIA health outcomes, judgment of the magnitude of impact, and the quality of the evidence
Table 2. Worker eligibility for paid sick days in the United States among private sector employers by occupation
Table 3. Disparities in access to paid sick days by selected population characteristics
Table 4. Worker eligibility for employer-provided paid sick days in the private sector by wage and work schedule characteristics
Table 5. Annual number of children’s sick days during the work week
Table 6. Number of paid sick days available to working mothers
Table 7. Amount of time employed mothers have access to paid sick leave over a 5-year period in relation to children’s chronic health condition
Table 8. Number of work-days missed due to illness and injury and average hourly wage by industry
Table 9. Delayed or no care for family in relation to annual family income
Table 10. Proportion experiencing delayed or no care for family in relation to paid sick days (stratified by family income and health insurance coverage)
Table 11. Average number of days in bed among working adults who had ever spent a day in bed in the past 12 months (stratified by annual family income)
Table 12. Results of multivariate analysis: Predictors of medical visits
Table 13. Preventable hospitalization admission rates per 100,000 persons in the United States
Table 14. Preventable hospitalization admission rates per 100,000 children in the United States
Table 15. Relationships between ER visit in the past 12 months and paid sick days (stratified by selected population characteristics)
Table 16. TFAH’s model: Estimated mortality and morbidity for a severe pandemic
Table 17. Modeled effects of certain social distancing measures on cumulative attack rates of pandemic influenza
Table 18. National occupational employment and wage estimates sorted by percent of workers with paid sick days
Table 19. Impact of a five consecutive day sickness absence on monthly income in two states
Table 20. Paid sick days and difficulty living on total family income in California

Health Impact Assessment of the Healthy Families Act of 2009
-5-
1. Key Findings: Anticipated Health Impacts of the Healthy Families Act of 2009
The Healthy Families Act of 2009 (S. 1152 and H.R. 2460) would guarantee that workers in the United States at firms that employ at least 15 employees accrue at least one hour of paid sick time for every 30 hours worked.
Almost 60 million workers – 48% of the workforce – in the country currently do not have the ability to earn and use paid sick days when ill or when a family member needs care. Many vulnerable populations have less access to paid sick days. For example, 79% of the lowest-paid populations, over 50% of Hispanic workers, 52% of workers who rate their health as fair or poor, and 40% of mothers whose children have asthma do not have paid sick days.
Below we summarize conclusions about the magnitude, direction and certainty of health impacts predicted from the Healthy Families Act, based on the evidence synthesized in this health impact assessment. A summary of the main conclusions is outlined in Table 1.
Almost all available data and evidence we reviewed was consistent with the hypothesis that a requirement for paid sick days would protect and enable worker health, worker care for sick dependents, and the reduction of communicable disease transmission in community settings. Overall, research examining paid sick days benefits in relation to illness vulnerability or the need for medical or dependent care clearly demonstrates that the availability of paid sick days is lower for populations with greater need for medical and dependent care. We also found that the benefits of paid sick days would be greater for these more vulnerable subpopulations. The most specific and persuasive research of the benefits of paid sick days appears to come from studies of community mitigation strategies for pandemic flu and data on the burden of communicable disease associated with ill food service workers. Importantly, no published research suggested that paid sick days would harm health.
Focus groups conducted for this HIA, while limited and not necessarily representative of the working population in the United States, provided evidence supportive of and consistent with the conceptual pathways and hypothesized effects. Similarly, our analysis of the 2007 NHIS survey data provided support of beneficial effects of paid sick days on illness and disability duration.
Based on the evidence, a requirement for paid sick days is highly likely to have the following impacts:
• More workers taking needed leave from work to care for or recover from an illness or to receive preventative care. Existing quantitative research findings, our own analyses of national and state data, and qualitative focus group findings provide evidence consistent with this impact.
• More workers taking needed leave from work to care for ill children and dependents. Limited research findings indicate that a parent’s ability to take paid leave leads to better physical and emotional health outcomes for children with special needs. Quantitative peer-reviewed research and qualitative focus group findings provide evidence consistent with this impact.
Health Impact Assessment of the Healthy Families Act of 2009
-6-
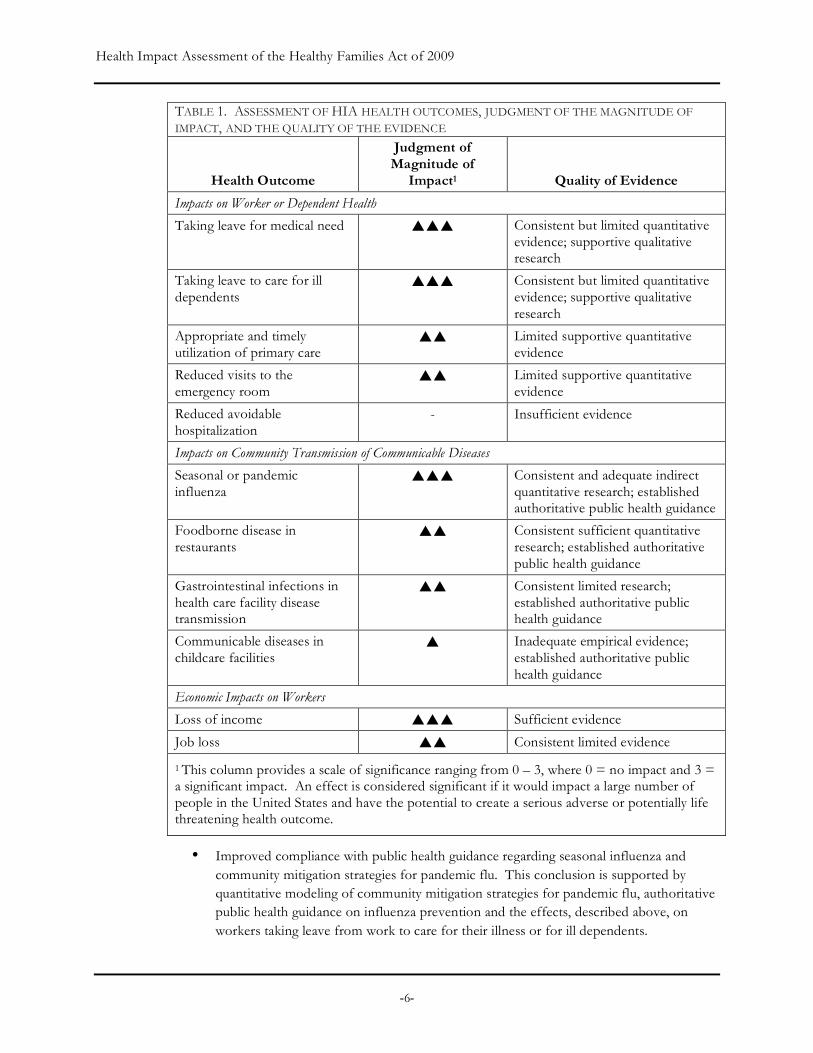
TABLE 1. ASSESSMENT OF HIA HEALTH OUTCOMES, JUDGMENT OF THE MAGNITUDE OF IMPACT, AND THE QUALITY OF THE EVIDENCE
Health Outcome
Judgment of Magnitude of
Impact1 Quality of Evidence
Impacts on Worker or Dependent Health
Taking leave for medical need Consistent but limited quantitative evidence; supportive qualitative research
Taking leave to care for ill dependents
Consistent but limited quantitative evidence; supportive qualitative research
Appropriate and timely utilization of primary care
Limited supportive quantitative evidence
Reduced visits to the emergency room
Limited supportive quantitative evidence
Reduced avoidable hospitalization
- Insufficient evidence
Impacts on Community Transmission of Communicable Diseases
Seasonal or pandemic influenza
Consistent and adequate indirect quantitative research; established authoritative public health guidance
Foodborne disease in restaurants
Consistent sufficient quantitative research; established authoritative public health guidance
Gastrointestinal infections in health care facility disease transmission
Consistent limited research; established authoritative public health guidance
Communicable diseases in childcare facilities
Inadequate empirical evidence; established authoritative public health guidance
Economic Impacts on Workers
Loss of income Sufficient evidence
Job loss Consistent limited evidence
1 This column provides a scale of significance ranging from 0 – 3, where 0 = no impact and 3 = a significant impact. An effect is considered significant if it would impact a large number of people in the United States and have the potential to create a serious adverse or potentially life threatening health outcome.
• Improved compliance with public health guidance regarding seasonal influenza and community mitigation strategies for pandemic flu. This conclusion is supported by quantitative modeling of community mitigation strategies for pandemic flu, authoritative public health guidance on influenza prevention and the effects, described above, on workers taking leave from work to care for their illness or for ill dependents.

Health Impact Assessment of the Healthy Families Act of 2009
-7-
• Reduced hazard of worker-related foodborne disease transmission in restaurants. Surveillance data and empirical research on foodborne disease outbreaks, public health laws on the exclusion of sick workers from sensitive situations (e.g., childcare, health care and food service), and qualitative interviews with disease control professionals provide evidence consistent with this impact.
• Reduced hazard of worker-related gastrointestinal disease transmission in long-term care facilities for the elderly. This conclusion is supported by limited empirical research on employer sick leave policies and disease outbreaks in nursing homes, authoritative public health guidance on the exclusion of sick workers from long-term care facilities, and the effects, concluded above, on workers taking leave to care for their illness.
• Mitigation of income loss, actual job loss, and the threat of job loss for low-income workers during periods of illness or care for ill dependents. The prevention of income loss would be of a magnitude significant enough to prevent food or housing insecurity. This conclusion is supported by both quantitative survey research data and qualitative focus group results.
A requirement for paid sick days is likely to have the following impacts, but these are less well-supported by the available evidence:
• Increased ambulatory or preventive primary care use.
• Reduced visits to emergency rooms by workers with health insurance.
• Increased compliance with infection control policies, limiting the transmission of communicable diseases in childcare facilities and schools.
The following effects are plausible, but not well-supported by the available evidence:
• Reduction in avoidable hospitalization due to the increase in primary care use. There have been no specific studies of this relationship.
Overall, while paid sick days are conceptually and logically linked to these and other health and health care outcomes, our HIA was constrained by the limited evidence compiled in the existing literature. The available research on paid sick days appears to reflect a limited focus of public health research on workplace and employment policy.
Regardless of this limitation, this health impact assessment concludes that the best available public health evidence demonstrates that the Healthy Families Act of 2009 would have significant and beneficial public health impacts. We also conclude that, in the future, extending the act to apply to businesses of all sizes, not just those that employ 15 or more employees, would augment these health benefits.
Health Impact Assessment of the Healthy Families Act of 2009
-8-
2. INTRODUCTION
Paid sick days refer to paid time off from a job that may be used for short-term or long-term illness, routine medical appointments, or to care for family members with medical needs. The goal of paid sick days legislation is to guarantee that workers have access to time off for health-related needs without losing income. Internationally, 145 countries require employers to provide paid sick days or leave for short- or long-term illnesses, and 136 countries provide for a week of paid sick leave or more annually (Heymann 2007a). However, there is no mandate that allows employees in the United States to earn or use paid sick days, with the exceptions of the City and County of San Francisco, the City of Milwaukee, and the District of Columbia. Where available elsewhere in the U.S., such benefits are provided voluntarily by employers.
If enacted, the Healthy Families Act, introduced in the U.S. Congress in May 2009 as bill S. 1152 and H.R. 2460, would allow workers employed by firms of fifteen or more employees to earn up to seven paid sick days per year. This health impact assessment (HIA) uses available data and evidence to evaluate the individual- and community-level health impacts of the bill.
The ability to earn paid sick days and utilize these benefits when ill or when a family member needs care potentially confers substantial benefits to health (Heymann 2007b). At the individual level, paid sick days could help people recover from illness and encourage the use of preventative health care services. Workers that lack paid sick days, compared to those with the them, may have a greater need for sick leave and chronic and acute health care services. They experience a greater vulnerability to adverse health outcomes, because employment characteristics related to health – such as wages, family and sick leave policies, and health, dental and eye care benefits – are correlated among each other. Access to paid sick days can enable workers to provide essential care for family members and dependents without jeopardizing income for other health needs. It also potentially prevents a worsening of illness and avoidable use of expensive hospital care. At the community level, paid sick days may facilitate ill workers and students staying home and help prevent the transmission of infectious diseases in schools and workplaces.
Factors associated with labor and employment – including income, safety of working conditions, and benefits such as paid sick days – are potent determinants of health that contribute to health disparities, particularly those related to individual socio-economic status (Marmot and Wilkinson 2006; Yen and Syme 1999). Understanding the health impacts of employment conditions is necessary for sound workplace policy and may reduce longstanding health disparities associated with employment class.
This health impact assessment builds upon a similar one conducted in 2008 on the health impacts of the California Healthy Families, Healthy Workplaces Act of 2008; legislation that proposed to guarantee paid sick days to workers in the state. This report uses national data to replace California-specific data and:
• updates our review of the published literature (new references in sections 4.6 through 4.8);
• reports on an original analysis of paid sick days and health care utilization measures using the 2007 National Health Interview Survey (NHIS; analysis results appear in sections 4.1 through 4.6 and detailed methods are described in Appendix I);

Health Impact Assessment of the Healthy Families Act of 2009
-9-
• reports on additional focus groups conducted in Milwaukee and California (in section 4.2 and Appendix II); and
• provides data on foodborne illness outbreaks involving sick workers based on data from the Centers for Disease Control and Prevention (CDC; in section 4.7).
Section three of this report provides background for the HIA including a summary of the proposed legislation and a description of the HIA process, describes conceptual pathways by which paid sick days could affect health outcomes, and reviews the methods used to assess impacts in this HIA. Section four summarizes the evidence related to the conceptual pathways between the Healthy Families Act of 2009 and health outcomes.
Health Impact Assessment of the Healthy Families Act of 2009
-10-
3. BACKGROUND
3.1 HEALTH IMPACT ASSESSMENT OVERVIEW
The World Health Organization defines health impact assessment (HIA) as “a combination of procedures, methods, and tools by which a policy or project may be judged as to its potential effects on the health of a population, and the distribution of those effects within the population” (WHO 1999). Increasingly, countries are using health impact assessment to prevent disease and illness, improve the health of their populations, and reduce avoidable and significant economic costs of health care services.
HIA aims to make the health impacts of social decisions more transparent to the public and policy-makers. It uses a range of methods and tools, and engages health experts, decision-makers, and diverse stakeholders to identify and characterize the health effects that result from a policy or proposal and its alternatives (Quigley 2006). HIA draws from various sources of knowledge that include lay experience and professional expertise. HIA also offers recommendations to decision-makers for alternatives or improvements to policy decisions that enhance positive health impacts and eliminate, reduce, or mitigate negative health impacts. HIA is concerned with harmful effects as well as how pubic policy can promote and improve a population’s health. HIA is also explicitly concerned with vulnerable populations and includes an analysis of a proposal’s impacts on health inequalities.
There is no single best approach to HIA. Each HIA process should reflect the needs of its particular context. An HIA is most often carried out prospectively, before a decision is made to enact a policy proposal. A typical HIA involves five stages: screening, scoping, assessment, communication, and monitoring.
STEPS IN THE HIA PROCESS
1. Screening involves determining the need and value of an HIA.
2. Scoping involves determining which health impacts to evaluate, the methods for analysis, and the
workplan for completing the assessment.
3. Asse ssment of impacts involves using existing data, expertise, and experience along with qualitative
and quantitative research methods to judge the magnitude and direction of potential health impacts.
4. Communic at ion of the results of the HIA involves synthesizing the assessment and communicating
the results. This can take many forms including written reports, comment letters, and public
testimony.
5. Monitor i ng describes the process of tracking the effects of the HIA on health determinants and
health status.
3.2 FEDERAL PAID SICK DAYS LEGISLATION: HEALTHY FAMILIES ACT OF 2009
Currently, no federal law guarantees workers the right to paid time off when they or their dependents are ill. The Family and Medical Leave Act (FMLA) provides employees in the U.S. with up to 12 weeks of job-protected unpaid leave per year for a serious health condition, the
Health Impact Assessment of the Healthy Families Act of 2009
-11-
birth of a child, or to care for an immediate family member, and applies to public agencies, public and private elementary and secondary schools, and companies with 50 or more employees (DOL 2008). Family and medical leave and paid sick days are complementary policies; most uses of paid sick days would not be covered by FMLA, as paid sick days cover short-term illness and preventative care. Additionally, because family and medical leave is unpaid, workers may face economic consequences as a result of using such leave; a Department of Labor survey in 2000 found that 78% of workers who needed but did not take family and medical leave could not afford to lose the pay (DOL 2000).
If enacted, the Healthy Families Act would allow workers employed by firms of fifteen or more employees to earn a minimum of one hour of paid sick time for every 30 hours worked, up to 56 hours (seven days) of paid sick days per year, unless the employer selects a higher limit. Paid sick days may be used to receive care for a worker’s own illness or for preventative care; to provide care for a sick family member; or to recover from or seek assistance related to domestic violence, stalking or sexual assault. Employers with existing paid sick days policies that meet the minimums set forth in the Healthy Families Act (for time, types of use, and method of use) would not be affected.
3.3 ACCESS TO PAID SICK DAYS IN THE UNITED STATES
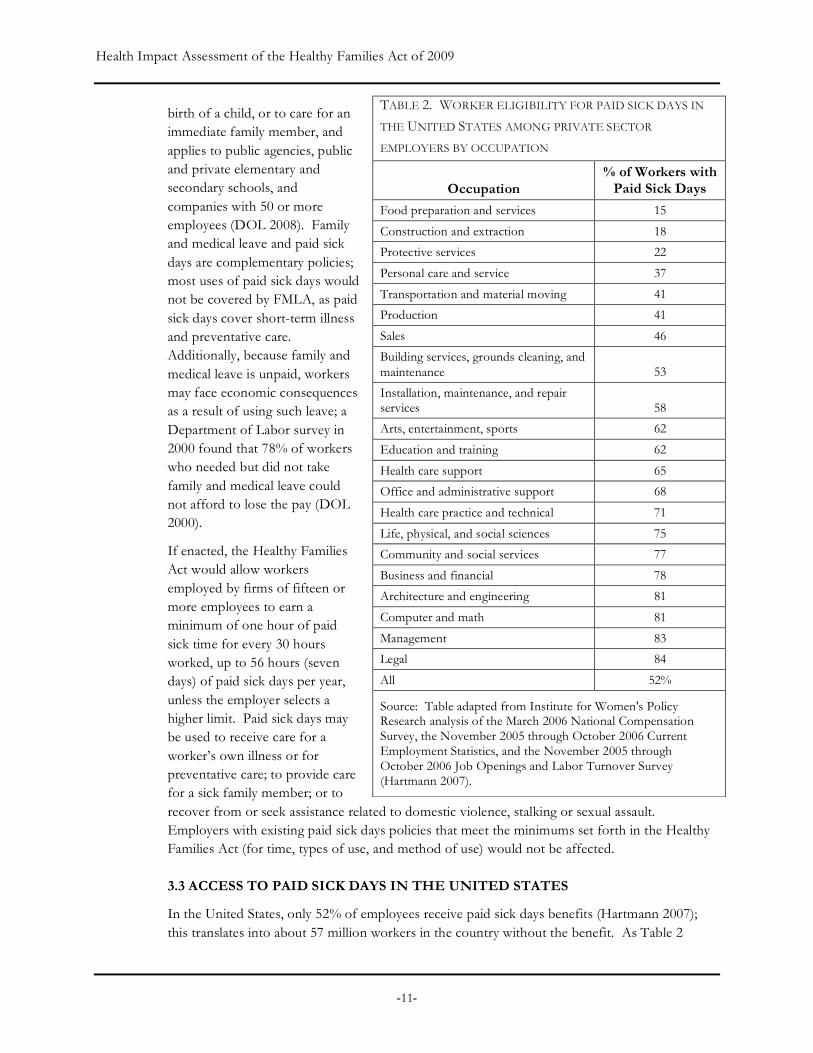
In the United States, only 52% of employees receive paid sick days benefits (Hartmann 2007); this translates into about 57 million workers in the country without the benefit. As Table 2
TABLE 2. WORKER ELIGIBILITY FOR PAID SICK DAYS IN
THE UNITED STATES AMONG PRIVATE SECTOR
EMPLOYERS BY OCCUPATION
Occupation % of Workers with
Paid Sick Days
Food preparation and services 15
Construction and extraction 18
Protective services 22
Personal care and service 37
Transportation and material moving 41
Production 41
Sales 46
Building services, grounds cleaning, and maintenance 53
Installation, maintenance, and repair services 58
Arts, entertainment, sports 62
Education and training 62
Health care support 65
Office and administrative support 68
Health care practice and technical 71
Life, physical, and social sciences 75
Community and social services 77
Business and financial 78
Architecture and engineering 81
Computer and math 81
Management 83
Legal 84
All 52%
Source: Table adapted from Institute for Women's Policy Research analysis of the March 2006 National Compensation Survey, the November 2005 through October 2006 Current Employment Statistics, and the November 2005 through October 2006 Job Openings and Labor Turnover Survey (Hartmann 2007).

Health Impact Assessment of the Healthy Families Act of 2009
-12-
illustrates, availability of paid sick day benefits varies substantially by occupation. While workers in “white-collar” occupations have far higher rates of paid sick day coverage (e.g., 84% in legal, 83% in management, and 81% in computer and math occupations), only 15% of workers in the food preparation and services occupations have paid sick days—the lowest rate among major groups of occupations (Hartmann 2007).
3.4 THE DECISION TO CONDUCT AN HIA ON PAID SICK DAYS LEGISLATION
Screening, the first step in health impact assessment, establishes the value and feasibility of an HIA for a particular decision-making context. Screening informs the decision to conduct an HIA by answering three related questions:
1. Is the proposal associated with potentially significant health impacts that otherwise would not be considered or would be undervalued by decision-makers?
2. Is it feasible to conduct a relevant and timely analysis of the health impacts of the proposal?
3. Are the proposal and decision-making process potentially receptive to the findings and recommendations of a health impact analysis?
The screening step of HIA for paid sick days legislation was carried out and reported on as part of the HIA on the California Healthy Families, Healthy Workplaces Act of 2008. The authors determined the following: i) the legislation had significant potential to affect the health of the entire population; for example, by enabling primary and preventative care for workers and their dependents and reducing the spread of communicable disease; ii) the legislation could address health disparities associated with income, class, and occupational status; iii) an HIA could document the breadth, magnitude, and certainty of potential health benefits associated with policies such as paid sick days; iv) an HIA could be completed in a timely manner; and v) the decision-making process would be receptive to an analysis of the health impacts of the proposed legislation.
Following the publication of the HIA on the paid sick days bill in California, supporters of the federal legislation requested the HIA’s authors to consider conducting a similar analysis of the national Healthy Families Act. The decision to conduct this analysis was based on the analysis described above and the facts that:
• Congressional staff of legislative sponsors, including those of the bill’s Senate author, Senator Edward Kennedy, as well as supporters such as the National Partnership for Women & Families and the Family Values @ Work Consortium believed an assessment would help inform policy makers;
• The magnitude of the impact of the legislation on health and on health inequities would be larger than the impact of the California legislation, given that it would affect a larger population; and,
• Resources, including funding from the Annie E. Casey Foundation, were available to conduct this analysis.
Health Impact Assessment of the Healthy Families Act of 2009
-13-
3.5 POTENTIAL HEALTH IMPACTS RESULTING FROM PAID SICK DAYS REQUIREMENTS
Scoping, the second step of HIA, involves creating a work plan and timeline, prioritizing research questions, and identifying research methods and participants’ roles. The scoping of this HIA was similar to that of the HIA on the California Healthy Families, Healthy Workplaces Act of 2008; however additional research methods and analyses were used in this report, given the availability of additional data and resources.
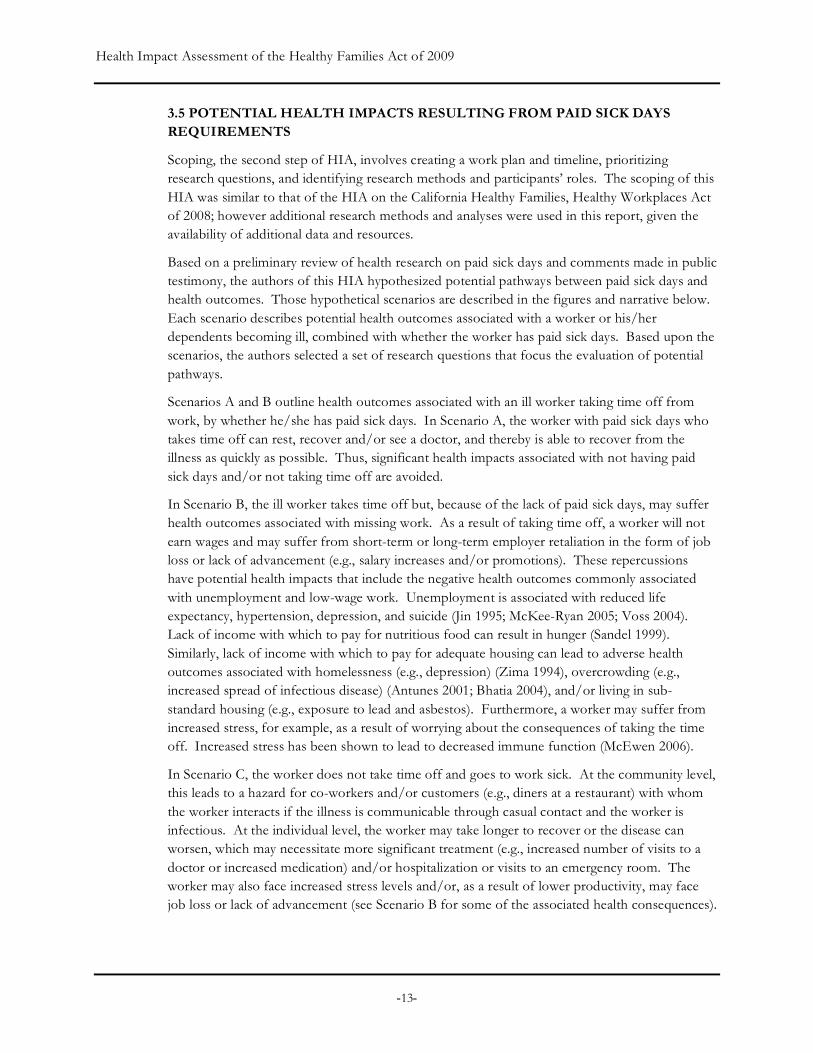
Based on a preliminary review of health research on paid sick days and comments made in public testimony, the authors of this HIA hypothesized potential pathways between paid sick days and health outcomes. Those hypothetical scenarios are described in the figures and narrative below. Each scenario describes potential health outcomes associated with a worker or his/her dependents becoming ill, combined with whether the worker has paid sick days. Based upon the scenarios, the authors selected a set of research questions that focus the evaluation of potential pathways.
Scenarios A and B outline health outcomes associated with an ill worker taking time off from work, by whether he/she has paid sick days. In Scenario A, the worker with paid sick days who takes time off can rest, recover and/or see a doctor, and thereby is able to recover from the illness as quickly as possible. Thus, significant health impacts associated with not having paid sick days and/or not taking time off are avoided.
In Scenario B, the ill worker takes time off but, because of the lack of paid sick days, may suffer health outcomes associated with missing work. As a result of taking time off, a worker will not earn wages and may suffer from short-term or long-term employer retaliation in the form of job loss or lack of advancement (e.g., salary increases and/or promotions). These repercussions have potential health impacts that include the negative health outcomes commonly associated with unemployment and low-wage work. Unemployment is associated with reduced life expectancy, hypertension, depression, and suicide (Jin 1995; McKee-Ryan 2005; Voss 2004). Lack of income with which to pay for nutritious food can result in hunger (Sandel 1999). Similarly, lack of income with which to pay for adequate housing can lead to adverse health outcomes associated with homelessness (e.g., depression) (Zima 1994), overcrowding (e.g., increased spread of infectious disease) (Antunes 2001; Bhatia 2004), and/or living in sub-standard housing (e.g., exposure to lead and asbestos). Furthermore, a worker may suffer from increased stress, for example, as a result of worrying about the consequences of taking the time off. Increased stress has been shown to lead to decreased immune function (McEwen 2006).
In Scenario C, the worker does not take time off and goes to work sick. At the community level, this leads to a hazard for co-workers and/or customers (e.g., diners at a restaurant) with whom the worker interacts if the illness is communicable through casual contact and the worker is infectious. At the individual level, the worker may take longer to recover or the disease can worsen, which may necessitate more significant treatment (e.g., increased number of visits to a doctor or increased medication) and/or hospitalization or visits to an emergency room. The worker may also face increased stress levels and/or, as a result of lower productivity, may face job loss or lack of advancement (see Scenario B for some of the associated health consequences).
Health Impact Assessment of the Healthy Families Act of 2009
-14-
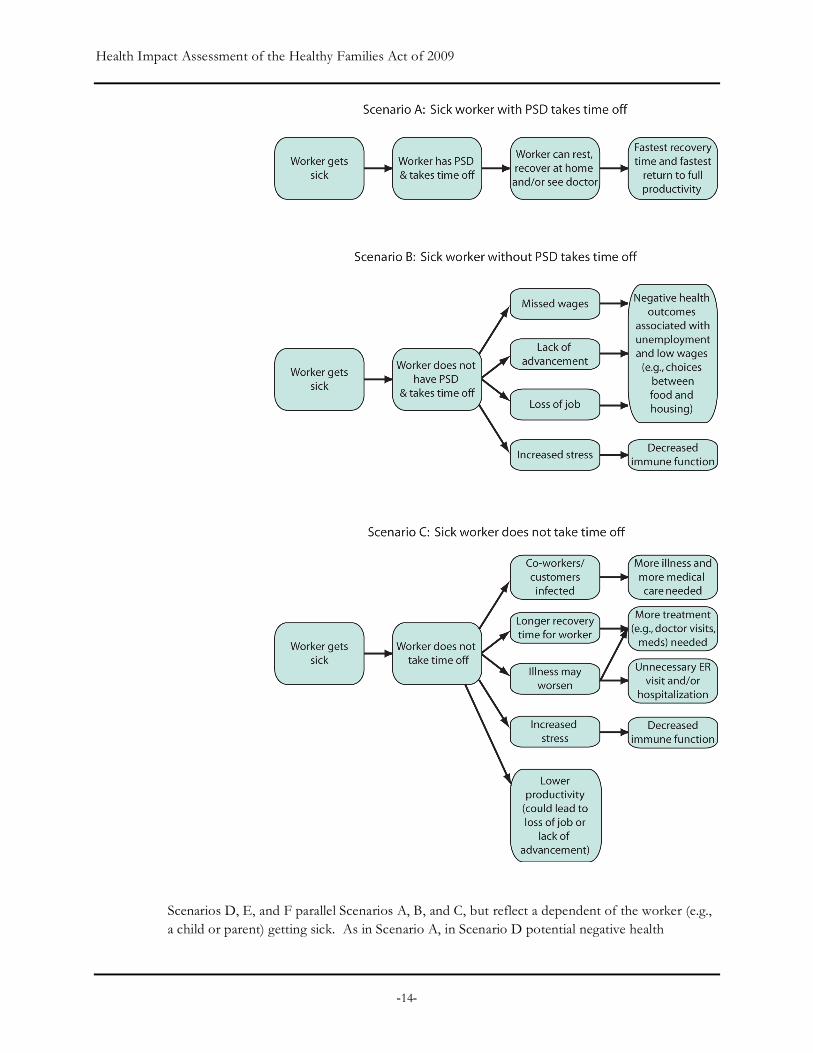
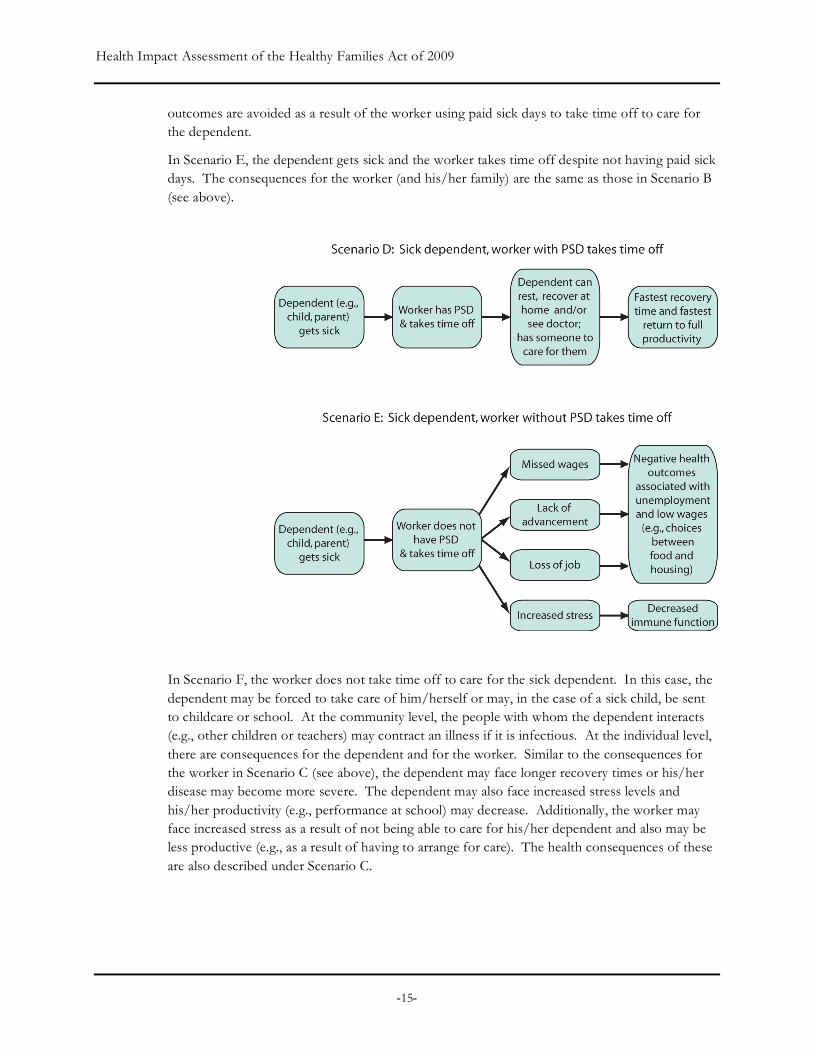
Scenarios D, E, and F parallel Scenarios A, B, and C, but reflect a dependent of the worker (e.g., a child or parent) getting sick. As in Scenario A, in Scenario D potential negative health
Health Impact Assessment of the Healthy Families Act of 2009
-15-
outcomes are avoided as a result of the worker using paid sick days to take time off to care for the dependent.
In Scenario E, the dependent gets sick and the worker takes time off despite not having paid sick days. The consequences for the worker (and his/her family) are the same as those in Scenario B (see above).
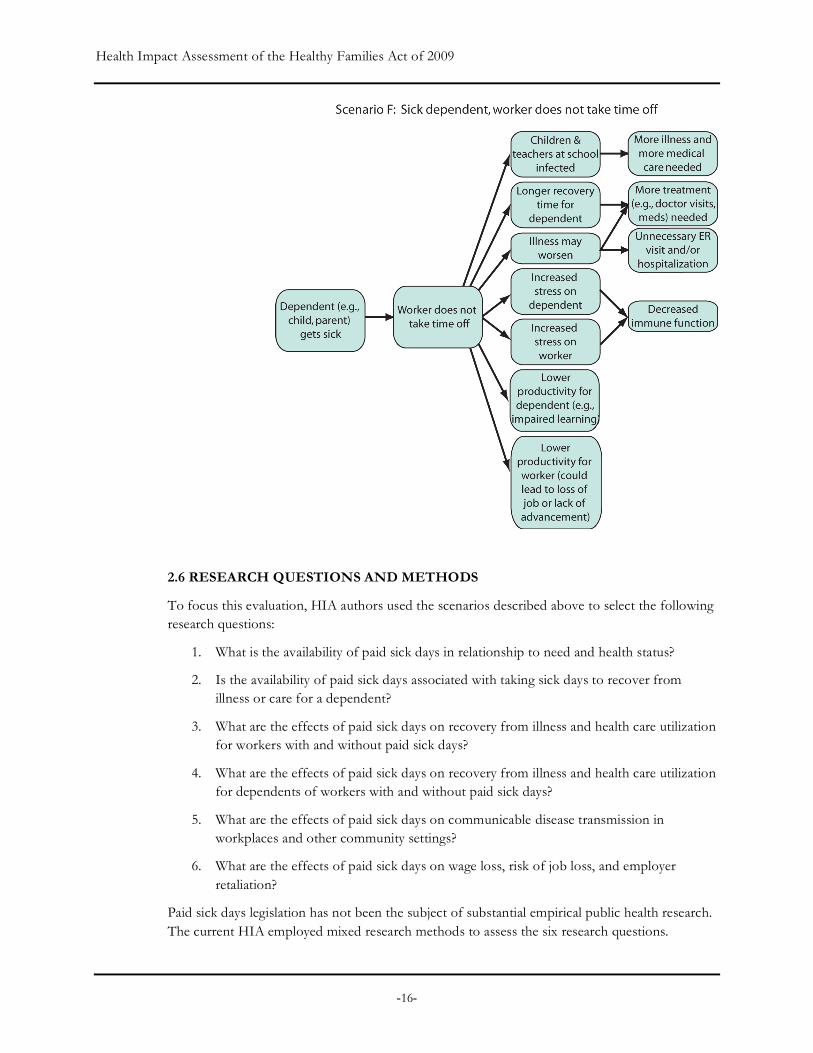
In Scenario F, the worker does not take time off to care for the sick dependent. In this case, the dependent may be forced to take care of him/herself or may, in the case of a sick child, be sent to childcare or school. At the community level, the people with whom the dependent interacts (e.g., other children or teachers) may contract an illness if it is infectious. At the individual level, there are consequences for the dependent and for the worker. Similar to the consequences for the worker in Scenario C (see above), the dependent may face longer recovery times or his/her disease may become more severe. The dependent may also face increased stress levels and his/her productivity (e.g., performance at school) may decrease. Additionally, the worker may face increased stress as a result of not being able to care for his/her dependent and also may be less productive (e.g., as a result of having to arrange for care). The health consequences of these are also described under Scenario C.
Health Impact Assessment of the Healthy Families Act of 2009
-16-
2.6 RESEARCH QUESTIONS AND METHODS
To focus this evaluation, HIA authors used the scenarios described above to select the following research questions:
1. What is the availability of paid sick days in relationship to need and health status?
2. Is the availability of paid sick days associated with taking sick days to recover from illness or care for a dependent?
3. What are the effects of paid sick days on recovery from illness and health care utilization for workers with and without paid sick days?
4. What are the effects of paid sick days on recovery from illness and health care utilization for dependents of workers with and without paid sick days?
5. What are the effects of paid sick days on communicable disease transmission in workplaces and other community settings?
6. What are the effects of paid sick days on wage loss, risk of job loss, and employer retaliation?
Paid sick days legislation has not been the subject of substantial empirical public health research. The current HIA employed mixed research methods to assess the six research questions.

Health Impact Assessment of the Healthy Families Act of 2009
-17-
Methods included developing logic frameworks, reviewing existing secondary data sources and empirical literature, and conducting new analyses of data from the 2007 National Health Interview Survey. Also incorporated are findings of our survey in California and focus groups in California and Wisconsin, conducted specifically to investigate the health effects of paid sick days. The table below briefly describes each method. A synthesis of the key findings from the research is provided in the assessment section below. Appendices I and II provide detailed methods and findings for original research conducted as part of the HIA.
HIA RESEARCH AND ASSESSMENT METHODS
Review of peer-reviewed and other available empirical research studies relevant to the relationship between paid sick days and health, including those focusing on the following outcomes: physical and mental health outcomes, health care utilization, communicable disease transmission, care of family members, and employment retention.
Analysis of the 2007 National Health Interview Survey (NHIS) data to assess: 1) the relationship between paid sick days and socio-demographic characteristics and health status and 2) the relationship between paid sick days and health services utilization. A detailed description of methods and findings of this analysis are presented in Appendix I.
Summary of statistics on the availability of paid sick days and utilization of sick leave in relationship to health status and need.
Summary of statistics on the burden of illness in the United States that could potentially be modified by paid sick days legislation, including the prevalence of communicable diseases and preventable hospitalizations.
A convenience survey of workers in California to assess the use and importance of paid sick days in facilitating health care access, care of dependents, and wellness. A more detailed description of methods and findings of this survey are presented in the HIA of the California Healthy Workplaces, Healthy Families Act of 2008.
Six focus groups with workers in California and Wisconsin to understand the health outcomes and quality of life associated with having or not having paid sick days benefits. A detailed description of methods and findings of the focus groups are presented in Appendix II.
Health Impact Assessment of the Healthy Families Act of 2009
-18-
4. ASSESSMENT OF THE HEALTH IMPACTS OF PAID SICK DAYS: A SYNTHESIS OF THE FINDINGS
We evaluated each of the research questions listed in section 3.6 using available empirical research as well as qualitative and quantitative research that we conducted specifically for health impact assessments of paid sick days, both in California and in the United States. This section summarizes the evidence for each question. Importantly, this section is organized to build a foundation for research questions related to more indirect effects of paid sick days. For example, some of the more indirect impacts (subsections 4.3 – 4.5) depend on the availability and utilization of paid sick days as discussed in subsections 4.1 and 4.2. Subsection 4.6 examines the indirect health impacts of the income and employment consequences on workers that result from the utilization of paid sick days.
4.1 AVAILABILITY OF PAID SICK DAYS IN RELATIONSHIP TO NEED AND HEALTH STATUS
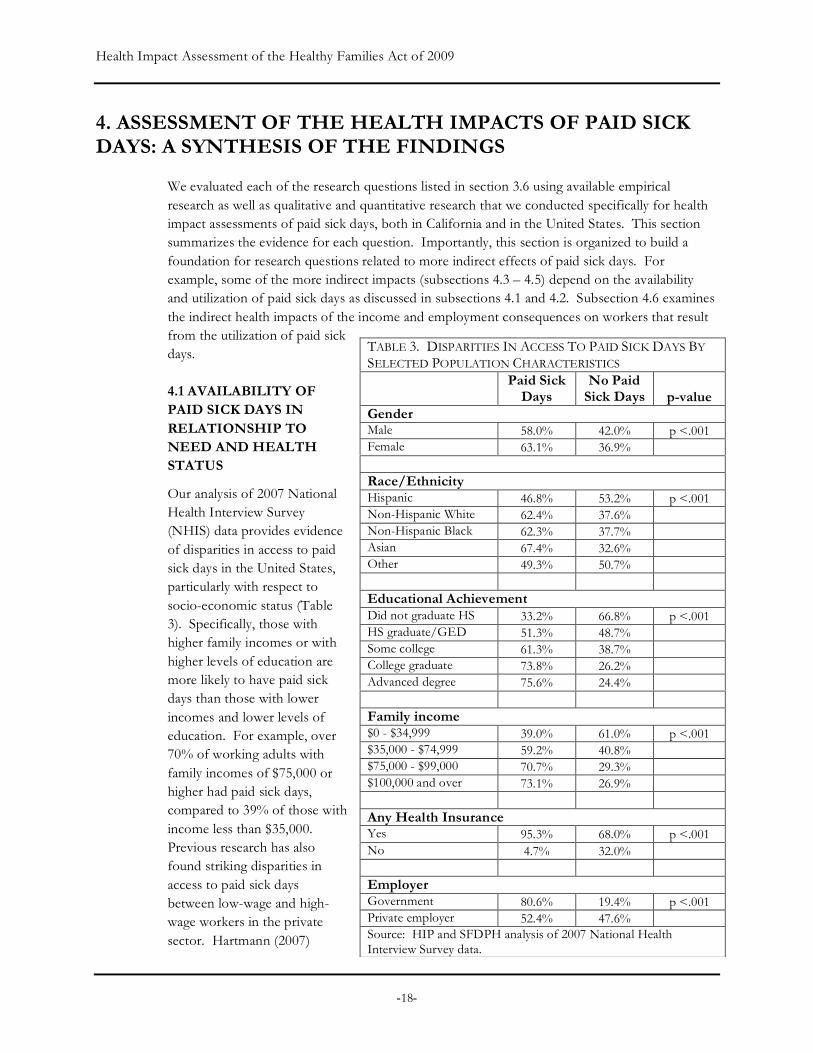
Our analysis of 2007 National Health Interview Survey (NHIS) data provides evidence of disparities in access to paid sick days in the United States, particularly with respect to socio-economic status (Table 3). Specifically, those with higher family incomes or with higher levels of education are more likely to have paid sick days than those with lower incomes and lower levels of education. For example, over 70% of working adults with family incomes of $75,000 or higher had paid sick days, compared to 39% of those with income less than $35,000. Previous research has also found striking disparities in access to paid sick days between low-wage and high-wage workers in the private sector. Hartmann (2007)
TABLE 3. DISPARITIES IN ACCESS TO PAID SICK DAYS BY SELECTED POPULATION CHARACTERISTICS Paid Sick
Days No Paid
Sick Days p-value Gender Male 58.0% 42.0% p <.001 Female 63.1% 36.9% Race/Ethnicity Hispanic 46.8% 53.2% p <.001 Non-Hispanic White 62.4% 37.6% Non-Hispanic Black 62.3% 37.7% Asian 67.4% 32.6% Other 49.3% 50.7% Educational Achievement Did not graduate HS 33.2% 66.8% p <.001 HS graduate/GED 51.3% 48.7% Some college 61.3% 38.7% College graduate 73.8% 26.2% Advanced degree 75.6% 24.4% Family income $0 - $34,999 39.0% 61.0% p <.001 $35,000 - $74,999 59.2% 40.8% $75,000 - $99,000 70.7% 29.3% $100,000 and over 73.1% 26.9% Any Health Insurance Yes 95.3% 68.0% p <.001 No 4.7% 32.0% Employer Government 80.6% 19.4% p <.001 Private employer 52.4% 47.6% Source: HIP and SFDPH analysis of 2007 National Health Interview Survey data.

Health Impact Assessment of the Healthy Families Act of 2009
-19-
found that 72% of workers in the highest income quartile received paid sick days compared to 21% of those in the lowest income quartile (Table 4).
Similarly, a greater percentage of those with a college or more advanced degree had paid sick days, than those who did not graduate high school (greater than 70% vs. 33.2%). Among racial/ethnic groups, Hispanic workers were least likely to have paid sick days.
In addition, disparities in access to paid sick days were closely associated with health insurance, a critical factor that affects access to health care. An overwhelming majority of those who had paid sick days had health insurance coverage, compared to those without paid sick days (95.3% vs. 68.0%).
Notably, the proportion of working adults with paid sick days was far higher among employees of federal, state, or local governments than among those working for private employers: 80.6% of adults who worked for government were likely to have paid sick days compared to 52.4% of those who worked in the private sector.
Disparities in access to paid sick days by income are important for health because lower income is generally associated with greater vulnerability to illness and disease, health-adverse occupational and environmental exposures, and limited ability to buffer a loss of income. Given these disparities, we expect the potential benefits of the Healthy Families Act of 2009 would be greater for more disadvantaged workers who hold low-paying jobs with little or no benefits.
With respect to health status, the 2007 NHIS analysis revealed that a higher proportion of working adults who rated their health as excellent, very good, or good had paid sick days compared to those who viewed their health as fair or poor (61.2% vs. 48.3%; P<.0001; data not shown). This suggests that statutory requirements for paid sick days would disproportionately benefit those with poorer self-rated health and greater need for health care and other therapeutic interventions.
Heymann and colleagues (1996) found that over 50% of poor and non-poor families had an illness burden greater than one week per year (Table 5). Additionally, the study found that one-third of families had a family illness burden of two or more weeks per year (both poor and non-poor), but two-thirds of employed mothers lacked paid sick days at least some of the time that
TABLE 4. WORKER ELIGIBILITY FOR EMPLOYER-PROVIDED PAID SICK DAYS IN THE PRIVATE SECTOR BY WAGE AND WORK SCHEDULE CHARACTERISTICS
Wage Level
% of Workers with Employer-Provided Paid
Sick Days
Fourth quartile (bottom) 21
Third quartile 54
Second quartile 62
First quartile (top) 72
Work Schedule Full-time 62
Part-time 20
Full-year 53
Part-year 26
Full-year, full-time 63
Not full-year, full-time 21
Source: Table adapted from Institute for Women's Policy Research analysis of the March 2006 National Compensation Survey, the November 2005 through October 2006 Current Employment Statistics, and the November 2005 through October 2006 Job Openings and Labor Turnover Survey (Hartmann 2007).
Health Impact Assessment of the Healthy Families Act of 2009
-20-
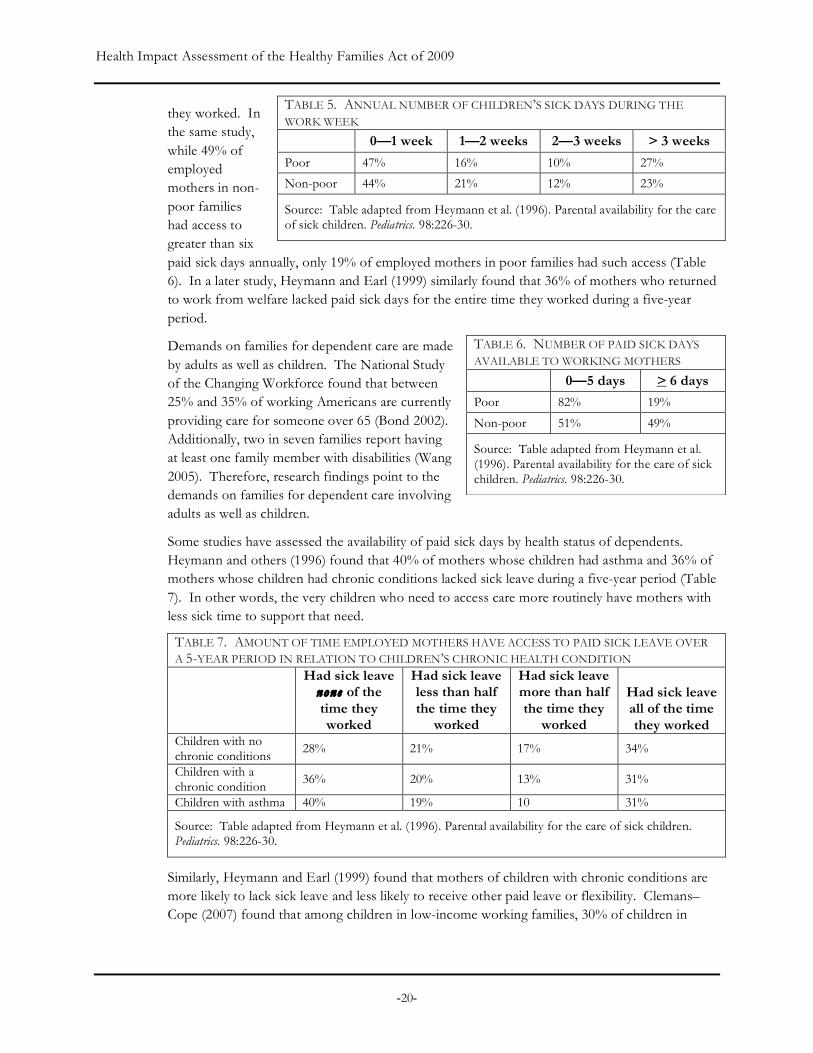
they worked. In the same study, while 49% of employed mothers in non-poor families had access to greater than six paid sick days annually, only 19% of employed mothers in poor families had such access (Table 6). In a later study, Heymann and Earl (1999) similarly found that 36% of mothers who returned to work from welfare lacked paid sick days for the entire time they worked during a five-year period.
Demands on families for dependent care are made by adults as well as children. The National Study of the Changing Workforce found that between 25% and 35% of working Americans are currently providing care for someone over 65 (Bond 2002). Additionally, two in seven families report having at least one family member with disabilities (Wang 2005). Therefore, research findings point to the demands on families for dependent care involving adults as well as children.
Some studies have assessed the availability of paid sick days by health status of dependents. Heymann and others (1996) found that 40% of mothers whose children had asthma and 36% of mothers whose children had chronic conditions lacked sick leave during a five-year period (Table 7). In other words, the very children who need to access care more routinely have mothers with less sick time to support that need.
TABLE 7. AMOUNT OF TIME EMPLOYED MOTHERS HAVE ACCESS TO PAID SICK LEAVE OVER A 5-YEAR PERIOD IN RELATION TO CHILDREN’S CHRONIC HEALTH CONDITION Had sick leave
none of the time they worked
Had sick leave less than half the time they
worked
Had sick leave more than half the time they
worked
Had sick leave all of the time they worked
Children with no chronic conditions 28% 21% 17% 34%
Children with a chronic condition 36% 20% 13% 31%
Children with asthma 40% 19% 10 31%
Source: Table adapted from Heymann et al. (1996). Parental availability for the care of sick children. Pediatrics. 98:226-30.
Similarly, Heymann and Earl (1999) found that mothers of children with chronic conditions are more likely to lack sick leave and less likely to receive other paid leave or flexibility. Clemans–Cope (2007) found that among children in low-income working families, 30% of children in
TABLE 5. ANNUAL NUMBER OF CHILDREN’S SICK DAYS DURING THE WORK WEEK 0—1 week 1—2 weeks 2—3 weeks > 3 weeks
Poor 47% 16% 10% 27%
Non-poor 44% 21% 12% 23%
Source: Table adapted from Heymann et al. (1996). Parental availability for the care of sick children. Pediatrics. 98:226-30.
TABLE 6. NUMBER OF PAID SICK DAYS AVAILABLE TO WORKING MOTHERS 0—5 days > 6 days
Poor 82% 19%
Non-poor 51% 49%
Source: Table adapted from Heymann et al. (1996). Parental availability for the care of sick children. Pediatrics. 98:226-30.
Health Impact Assessment of the Healthy Families Act of 2009
-21-
fair/poor health lived in families that had access to paid sick leave for the entire year compared to 37% of children in good, very good or excellent health.
In summary, research examining the availability of paid sick days to various subpopulations, and in relation to illness vulnerability and the need for medical or dependent care, demonstrates lower availability of paid sick days for populations with a greater need for medical and dependent care.
4.2 EFFECT OF PAID SICK DAYS ON THE UTILIZATION OF SICK LEAVE
Many of the hypothesized effects of paid sick days on health may be mediated through the utilization of sick days to care for oneself or a dependent. Taking sick days in turn has potential effects on health status (e.g., recovery from illness), health care utilization behaviors – including seeking and obtaining diagnosis and treatment for illness – and the transmission of communicable disease in the workplace and larger community. This section explores how access to paid sick days affects a worker’s use of sick days. The impacts of this utilization are salient to each of the pathways evaluated in the subsequent sections.
Util izat i on o f Si ck Leave among Workers Wi th and Withou t Paid S ick Days
Limited evidence is available on the relationship between access to paid sick days and time taken off due to illness. Generally, data suggests that workers with paid sick days tend to take more time off from work because of illness. For example, a recent survey of U.S. workers found that among employed adults aged 19-64, 42% without paid sick days did not miss work because of illness in contrast to 28% of workers with paid sick day benefits. The relationship was even stronger after adjusting for chronic health problems, disabilities, age and wages; employed adults without paid sick days were only half as likely to take time off for illness (Davis 2005).
In analyzing the NHIS data, we found that among workers who missed no more than nine work days due to sickness (i.e., those who did not have a prolonged illness), the average number of missed work days in the past 12 months was somewhat higher for workers with paid sick days than for those without (1.39 vs. 0.92, p <.0001). The difference is similar to that of Lovell’s analysis (2008), which estimated utilization of paid sick days for California workers using data from the 2006 NHIS (1.8 days per year, versus 1.4 days per year among workers with employer-provided paid sick days who used no more than nine paid sick days in large businesses or five paid sick days in small businesses).
Interestingly, disaggregated NHIS data for California, (Table 8) suggests that the relationship between paid sick days and the utilization of sick days varies by industry. A similar analysis was not available at the national level.
These findings suggest that workers without paid sick days may be going to work when sick. In the survey on paid sick days that we conducted as part of the California HIA using a small convenience sample of California workers, the majority (64%) of respondents reported having gone to work sick at least once because of a lack of sufficient paid sick days. This survey identified a number of factors that discouraged them from absence from work while sick, including a loss of wages, a good shift, or even a job, which we discuss in more detail in section 4.8.

Health Impact Assessment of the Healthy Families Act of 2009
-22-
TABLE 8. NUMBER OF WORK-DAYS MISSED DUE TO ILLNESS AND INJURY AND AVERAGE HOURLY WAGE BY INDUSTRY IN CALIFORNIA
Industry
Workers with paid sick days
Workers without paid
sick days All
workers
Average hourly wage
Mining 2.02 3.9 2.5 $32.00 Utilities 3.36 8.02 3.83 $26.45 Construction 4.44 3.36 3.69 $18.75 Manufacturing 6.02 3.53 5.02 $19.20 Wholesale trade 2.75 1.06 2.29 $18.13 Retail trade 3.70 3.12 3.64 $13.43 Transportation and warehousing 5.56 2.96 4.57 $15.88 Information 2.28 5.69 2.97 $25.10 Finance and insurance 3.72 2.29 3.45 $20.63 Real estate and rental 2.85 2.63 2.72 $16.50 Professional and technical services 2.45 1.30 2.13 $24.62 Management 3.40 0.10 2.81 $19.06 Administration and waste services 4.48 3.90 4.11 $12.81 Educational services 3.41 2.70 3.25 $20.51 Health care and social assistance 4.24 4.85 4.37 $17.71 Art, entertainment, and recreation 3.13 2.26 2.66 $14.43 Accommodation and food service 2.45 4.12 3.72 $10.00 Other service 3.31 3.74 3.51 $11.73
Source: Institute for Women's Policy Research analysis of the 2006 National Health Interview Survey and the 2005-7 ASEC files of the Current Population Survey.
In the several focus groups we conducted in California and Wisconsin (see Appendix II for detailed methods and findings), many workers gave examples of times they or their co-workers worked while sick. A receptionist in Milwaukee related her experience of having to work when she was experiencing a spinal headache – a condition that inflicts some people who undergo a lumbar puncture – with pain as severe as giving birth. A homecare worker in California described substantial growth in a uterine cyst over a year long period. She could not afford to take the time off work for the recommended surgical procedure.
In some workplaces, there are norms against taking time off when ill. A restaurant worker in California indicated that such norms led to workers’ passing illness to each other, decreased productivity among workers, and significantly longer recovery times. She stated, “The staff of the restaurant is pretty big. People have kids. People get sick all the time. There’s someone always sick out…..It gets passed from one person to the next. People cover each others’ shifts and try to help each other out when necessary but there isn’t such thing as sick leave.”

Health Impact Assessment of the Healthy Families Act of 2009
-23-
Compounding these issues, focus group participants also expressed guilt for abandoning co-workers, and some perceived being seen by their employer as “irresponsible.” Collectively, participants’ responses suggested that such experiences with taking sick days contributed to an overall pressure to go to work while they or their family members were sick.
As we discuss below, those who had indeed taken time off in the absence of the benefit often experienced real and/or perceived consequences, such as being reprimanded, the loss of wages, good shifts, or even a job.
Care f o r Dependen ts among Worke rs Wi th and Without Paid S ick Days
Caring for sick children is a routine activity for parents. Young children in particular need parental presence when they are sick to take them in for medical care and to administer medicine. Similarly, adult children have responsibilities for their parents who age or suffer from illness or disease.
Employed workers in households with children are among those with the greatest need for paid sick days due to responsibilities for the care of children and requirements excluding sick children from schools and childcare settings. Sick children with contagious diseases are asked to stay home from childcare as they may contribute to a higher rate of observed infections in daycare centers. The Centers for Disease Control and Prevention recommends that childcare providers encourage parents of sick children to keep their children home until they have been without fever for 24 hours, to prevent spreading illness to others (CDC 2008b). The American Academy of Pediatrics published explicit exclusion guidelines for sick children identifying 28 specific symptoms and diseases that warrant temporary exclusion of children, and most childcare facilities enforce policies that sick children with infectious diseases stay home from school (Copeland 2006). Furthermore, legally, parents cannot leave young dependent children under 12 years alone. In 2006, 70% of mothers with children under 18 were in the workforce (BLS 2006).
In 2005, with most parents actively in the workforce, about 61% of children ages 0–6 (12 million children) received some form of childcare on a regular basis from persons other than their parents. Children in families with incomes at least twice the poverty level were more likely than children in families with incomes below the poverty level to have non-parental childcare (68% versus 51%, respectively; Childstats.gov 2008).
Absenteeism of children from daycare centers due to sickness is significant (Dahl 1991; Mottonen and Uhari 1992), and translates into a need for parental absenteeism from work. In one study of children in a prepaid health plan in Memphis, illness in a child accounted for 40% of parental absenteeism from work. Among study subjects, parents of children in daycare centers lost about half a day a month from work due to child illness (Bell 1989).
Heymann and colleagues (1996) found that 56% of non-poor families and 53% of poor families had an annual illness burden of a week or more with 23% and 27%, respectively, having an illness burden of over three weeks. Direct care for sick children and labor to meet a child’s or family’s other needs are activities that compete for the time of parents and other caregivers. Adults must meet a child’s demands for nutrition, shelter, and other material needs. When a child is not well, parents might reasonably view staying home to care for a child as jeopardizing their ability to earn income to pay for essential health services, food, or housing. Higher income,
Health Impact Assessment of the Healthy Families Act of 2009
-24-
replacement income for time off, or another capacity to meet the needs for basic material consumption would intuitively enable direct care for an ill dependent.
Limited evidence is available on the factors that influence parents’ decisions to care for sick children. Heymann and colleagues (1999b) analyzed data in the Baltimore Parenthood Study to assess what factors affected parents’ decisions to care for sick children. Overall, the study found that parents who had either paid sick or vacation leave were 5.2 times as likely to care for their children when they were sick. Of the working parents in the sample, 42% cared for their own sick children while the remainder entrusted sick children to others. Half of the parents who cared for their own sick children reported that paid leave enabled them to miss work.
Clemans-Cope and others (2007) analyzed determinants of taking sick leave among the families of a sample of 10,790 children in low-income families (less than 200% of the federal poverty level) using data from the Medical Expenditure Panel Survey. In the sample, only 36% of the children in working families had access to paid sick days for the entire year (49% had access to paid sick leave for at least part of the year). Prevalence of access to paid sick days was higher for children in families with two full-time employees relative to those with one full-time employee (66% vs. 53%). In families with paid sick days, employees were much more likely to miss work to care for family members (44% vs. 26%).
Another recent study found that the enhanced ability to take paid sick days allows parents to care for children with special health care needs. In a study of over 1,100 Chicago and Los Angeles parents with children who have special care needs in Chicago and Los Angeles, Chung and colleagues (2007) found that parents with paid leave benefits had 2.8 times greater odds than other parents of taking time off work for their child.
Responses to our survey of California workers provide further corroborating data on this question. Over half (62%) of respondents had children under the age of 18, and 38% of respondents were responsible for the care of a non-child family member (e.g., parents). Forty-four percent acknowledged sending kids to school sick because of the lack of paid sick days. In total, 54% of respondents reported times when they could not care for dependents because of the lack of paid sick days.
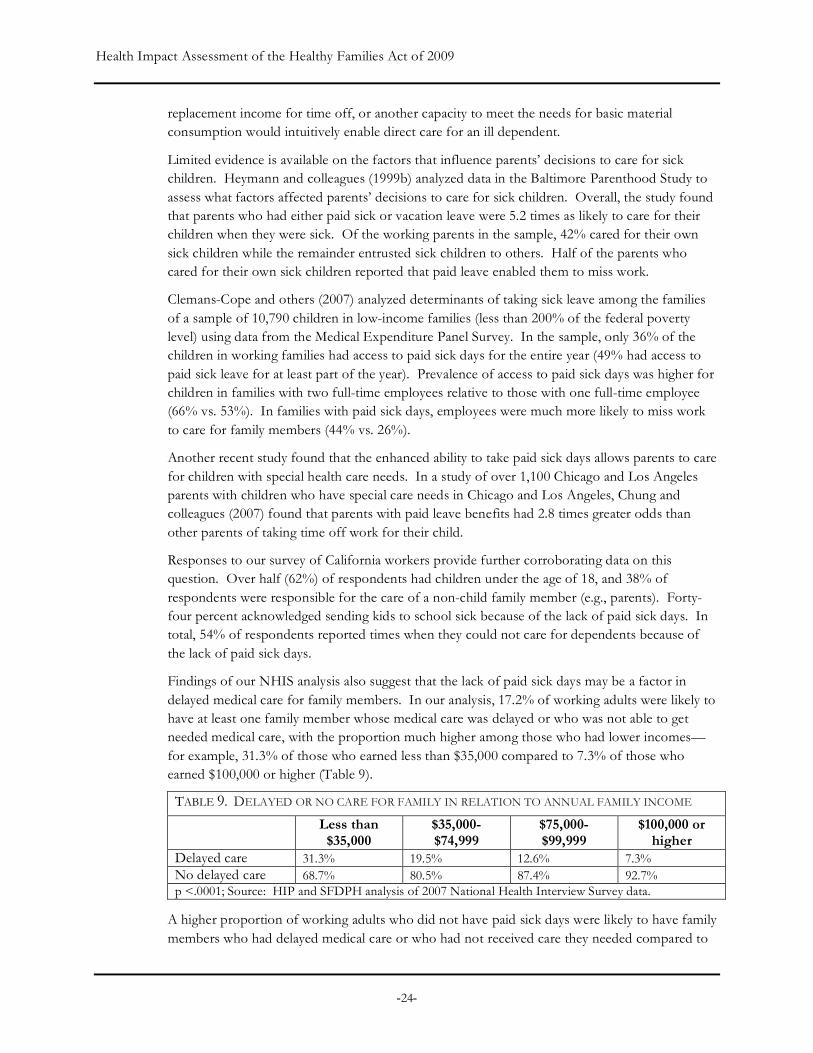
Findings of our NHIS analysis also suggest that the lack of paid sick days may be a factor in delayed medical care for family members. In our analysis, 17.2% of working adults were likely to have at least one family member whose medical care was delayed or who was not able to get needed medical care, with the proportion much higher among those who had lower incomes—for example, 31.3% of those who earned less than $35,000 compared to 7.3% of those who earned $100,000 or higher (Table 9).
TABLE 9. DELAYED OR NO CARE FOR FAMILY IN RELATION TO ANNUAL FAMILY INCOME
Less than $35,000
$35,000-$74,999
$75,000-$99,999
$100,000 or higher
Delayed care 31.3% 19.5% 12.6% 7.3% No delayed care 68.7% 80.5% 87.4% 92.7% p <.0001; Source: HIP and SFDPH analysis of 2007 National Health Interview Survey data.
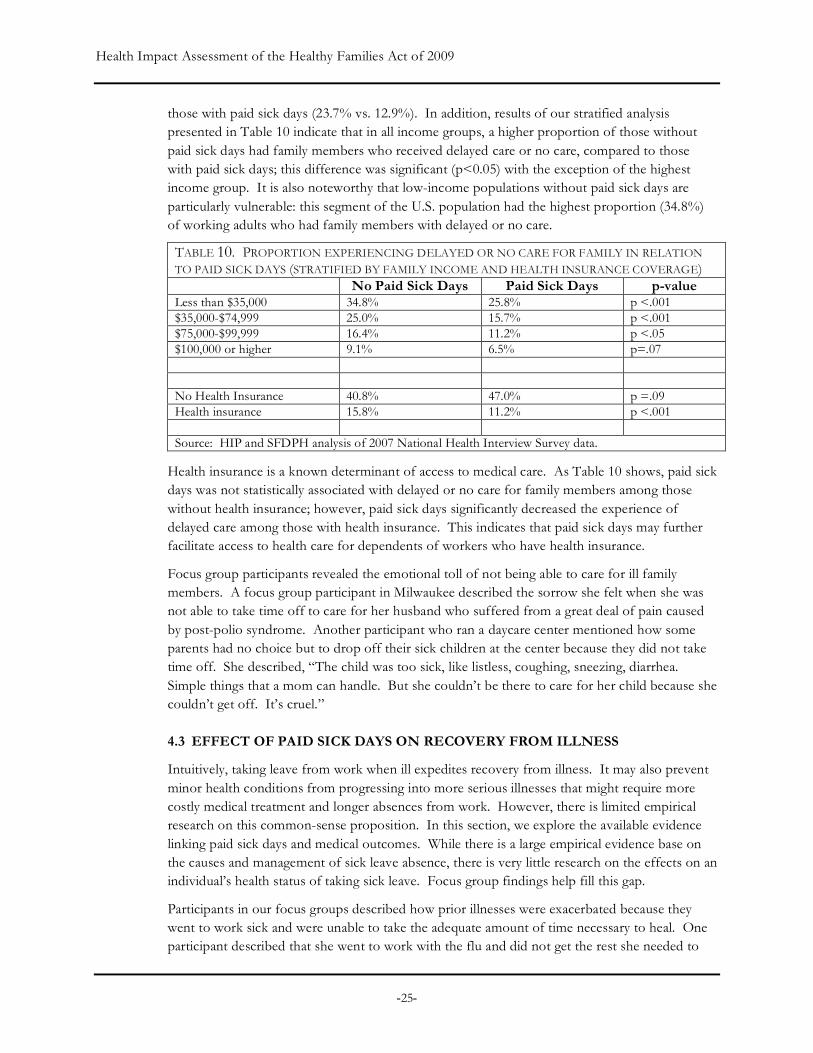
A higher proportion of working adults who did not have paid sick days were likely to have family members who had delayed medical care or who had not received care they needed compared to
Health Impact Assessment of the Healthy Families Act of 2009
-25-
those with paid sick days (23.7% vs. 12.9%). In addition, results of our stratified analysis presented in Table 10 indicate that in all income groups, a higher proportion of those without paid sick days had family members who received delayed care or no care, compared to those with paid sick days; this difference was significant (p<0.05) with the exception of the highest income group. It is also noteworthy that low-income populations without paid sick days are particularly vulnerable: this segment of the U.S. population had the highest proportion (34.8%) of working adults who had family members with delayed or no care.
TABLE 10. PROPORTION EXPERIENCING DELAYED OR NO CARE FOR FAMILY IN RELATION TO PAID SICK DAYS (STRATIFIED BY FAMILY INCOME AND HEALTH INSURANCE COVERAGE) No Paid Sick Days Paid Sick Days p-value Less than $35,000 34.8% 25.8% p <.001 $35,000-$74,999 25.0% 15.7% p <.001 $75,000-$99,999 16.4% 11.2% p <.05 $100,000 or higher 9.1% 6.5% p=.07 No Health Insurance 40.8% 47.0% p =.09 Health insurance 15.8% 11.2% p <.001 Source: HIP and SFDPH analysis of 2007 National Health Interview Survey data.
Health insurance is a known determinant of access to medical care. As Table 10 shows, paid sick days was not statistically associated with delayed or no care for family members among those without health insurance; however, paid sick days significantly decreased the experience of delayed care among those with health insurance. This indicates that paid sick days may further facilitate access to health care for dependents of workers who have health insurance.
Focus group participants revealed the emotional toll of not being able to care for ill family members. A focus group participant in Milwaukee described the sorrow she felt when she was not able to take time off to care for her husband who suffered from a great deal of pain caused by post-polio syndrome. Another participant who ran a daycare center mentioned how some parents had no choice but to drop off their sick children at the center because they did not take time off. She described, “The child was too sick, like listless, coughing, sneezing, diarrhea. Simple things that a mom can handle. But she couldn’t be there to care for her child because she couldn’t get off. It’s cruel.”
4.3 EFFECT OF PAID SICK DAYS ON RECOVERY FROM ILLNESS
Intuitively, taking leave from work when ill expedites recovery from illness. It may also prevent minor health conditions from progressing into more serious illnesses that might require more costly medical treatment and longer absences from work. However, there is limited empirical research on this common-sense proposition. In this section, we explore the available evidence linking paid sick days and medical outcomes. While there is a large empirical evidence base on the causes and management of sick leave absence, there is very little research on the effects on an individual’s health status of taking sick leave. Focus group findings help fill this gap.
Participants in our focus groups described how prior illnesses were exacerbated because they went to work sick and were unable to take the adequate amount of time necessary to heal. One participant described that she went to work with the flu and did not get the rest she needed to

Health Impact Assessment of the Healthy Families Act of 2009
-26-
overcome the illness. As a result, she continued to be ill for two months with symptoms from the flu. Participants agreed there was a sense to “just power through…don’t get fixed.” Another participant described going to work while recovering from dental surgery. Although the dentist recommended taking two days off to recover, this was not an option for her because she would not get paid time off. Another described going to work with the flu and being feverish while at work. While her employer noticed she was sick, “she never told me to go home and rest, until I finally made the decision not to go to work--but she didn't pay me for that day.”
Furthermore, lack of paid sick days was described by focus group participants as contributing to a culture of not taking care of oneself when injured at work. For example, one focus group participant discussed how she made a deep cut in her finger that bled profusely while at work. Rather than encourage her to seek immediate medical attention, co-workers provided ideas on how to treat the injury on the spot so she could return to work. There was a strong workplace culture that supported taking care of each other, but “nobody said go to the hospital now….or go home.” This sentiment was echoed by another participant who described working with glass for custom framing, and that everyone had lacerated hands but that “No one ever really like went home….Because there’s also a culture…don’t want to seem like you’re complaining.” Another participant continued to say, “If they felt they could handle it [an injury]…there’s pressure of not wanting to look bad to your employer.”
Our NHIS analysis provides some evidence that paid sick days is associated with less severe illness and a reduced duration of disability due to sickness. The data do not allow us to confirm a clear explanatory mechanism. As stated above, on average, those who had sick days tended to miss more work days due to illness or injury than those who did not. However, considering only those who missed at least one work day because of illness or injury, those who had paid sick days missed about 1.5 fewer work days than those who did not have paid sick days (8.44 vs. 9.91; p<.05). First, this suggests people without paid sick days may avoid taking leave from work when they have some illnesses. This also suggests that those without paid sick days were less likely to miss work due to illness overall, but may be experiencing more severe illnesses. A more severe illness could result from an inability to take time off to manage a less severe stage of the illness related to the lack of paid sick days. It also could reflect risk factors and vulnerabilities associated with the lack of paid sick days.
Further supporting the hypothesis that those without paid sick days may experience either more severe illness or longer illness duration, the average number of days in bed due to illness in the past year was higher for those without paid sick days than for those with paid sick days (4.48 vs. 3.54; p<.05). This difference was larger when considering only those who had ever spent at least one day in bed (12.87 vs. 8.88; p<.0001).
In additional analysis, we stratified paid sick days by family income and found that among those in the lowest income group (annual family incomes of less than $35,000) who had ever spent any number of days in bed, people with paid sick days had significantly fewer days in bed on average than those who did not have paid sick days (5.71 vs. 8.39; p<.05). With the exception of the highest income group, a similar tendency was observed in all the other groups, although the differences were not significant (Table 11).

Health Impact Assessment of the Healthy Families Act of 2009
-27-
4.4 EFFECT OF PAID SICK DAYS ON PRIMARY CARE UTILIZATION
Access to and utilization of timely primary care has well-documented health benefits. First, access to primary care allows patients to bring a wide range of health problems to appropriate attention. Second, it guides patients through the health system, including appropriate referrals for services for other health professionals. Third, it provides opportunities for disease prevention and health promotion, as well as early detection of problems (IOM 1996). Therefore, timely receipt of primary care may not only ensure better quality of life and more productive longevity but may also lower health care costs as a result of reduced hospitalization, improved prevention, and better coordination of chronic disease care (ACP 2008).
Timely primary and preventative care is dependent on a number of factors including the ability to pay for care, insurance, the types of services available, transportation access, and the ability to take time off from work to access health care services (Billings 1996; Newacheck 1998). Given that employed individuals without paid sick days appear less likely to take time off work when ill, the lack of access to paid sick days may be a barrier to the utilization of primary and preventive care.
Little empirical research has been reported on the relationship between access to paid sick days specifically and primary care utilization. Gleason and Kneipp (2004) surveyed 77 employed low-income rural residents in North Central Florida to assess the importance of job flexibility on ability to access primary care services. While the study is small and not representative, 60% of the participants reported difficulty in leaving work during the day to access non-emergency health services. Qualitatively, the reasons for difficulty in leaving work when ill included the absence of paid sick time, the loss of pay, the lack of help at work, and the lack of permission from one’s supervisors.
Using NHIS data, we evaluated the relationship between contact with medical care providers, as a proxy for primary care contacts, and paid sick days, controlling for other potential predictors of medical visits (see Appendix I for detailed methods and findings). The multivariate model described in Table 12 illustrates the association between medical visits and paid sick days controlling for age, gender, race/ethnicity, education, family income, health insurance, self-rated health status, and chronic health conditions.
Understanding that the medical visits variable represents a universe greater than primary care contacts, we found that paid sick days was a statistically significant predictor of medical visits after controlling for all the other predictors (odds ratio=1.14; p<.05). This result suggests that paid sick days may facilitate access to medical care, independent of health insurance.
TABLE 11. AVERAGE NUMBER OF DAYS IN BED AMONG WORKING ADULTS WHO HAD EVER SPENT A DAY IN BED IN THE PAST 12 MONTHS (STRATIFIED BY ANNUAL FAMILY INCOME) No Paid Sick Days Paid Sick Days p-value
Less than $35,000 8.39 5.71 p < .05
$35,000-74,999 5.59 4.67 p >.05
$75,000-99,999 4.79 4.28 p > .05
$100,000 and over 3.31 3.54 p > .05
Source: HIP and SFDPH analysis of 2007 National Health Interview Survey data.

Health Impact Assessment of the Healthy Families Act of 2009
-28-
Our NHIS analysis stands in contrast to the results of studies with smaller sample sizes. For example, in a study using the Medical Expenditure Panel Survey, Kneipp (2002) analyzed the relationship between employment factors and reported difficulty obtaining health care in a sample of single mothers. Among a subgroup of mothers who were employed full-time, the analysis did not find that paid sick leave had an independent and statistically significant effect (odds ratio=0.339; confidence interval=0.084-1.359). The study’s small sample size (N=100) may have limited its statistical power to detect effects.
4.5 EFFECT OF PAID SICK DAYS ON PREVENTABLE HOSPITALIZATIONS
Many hospital admissions for common chronic diseases such as asthma, hypertension, and diabetes are preventable with timely and effective outpatient and primary care (Parker 2005). Outpatient care can potentially prevent the need for hospitalization, complications, or more severe disease (AHQR 2004). Patients may be hospitalized or seek acute hospital care for avoidable reasons including misdiagnosis or a failure to detect the condition, inappropriate management including the lack of patient adherence to treatment recommendations, or failure by the patient to interpret symptoms as important (AHRQ 2004). Because the lack of paid sick days may create a barrier to the utilization of primary and preventive care, it could also increase the utilization of more expensive therapeutic and hospital care. For example, early treatment of a flare-up of asthma in a doctor’s office or clinic can prevent deterioration to the point where hospital care is required.
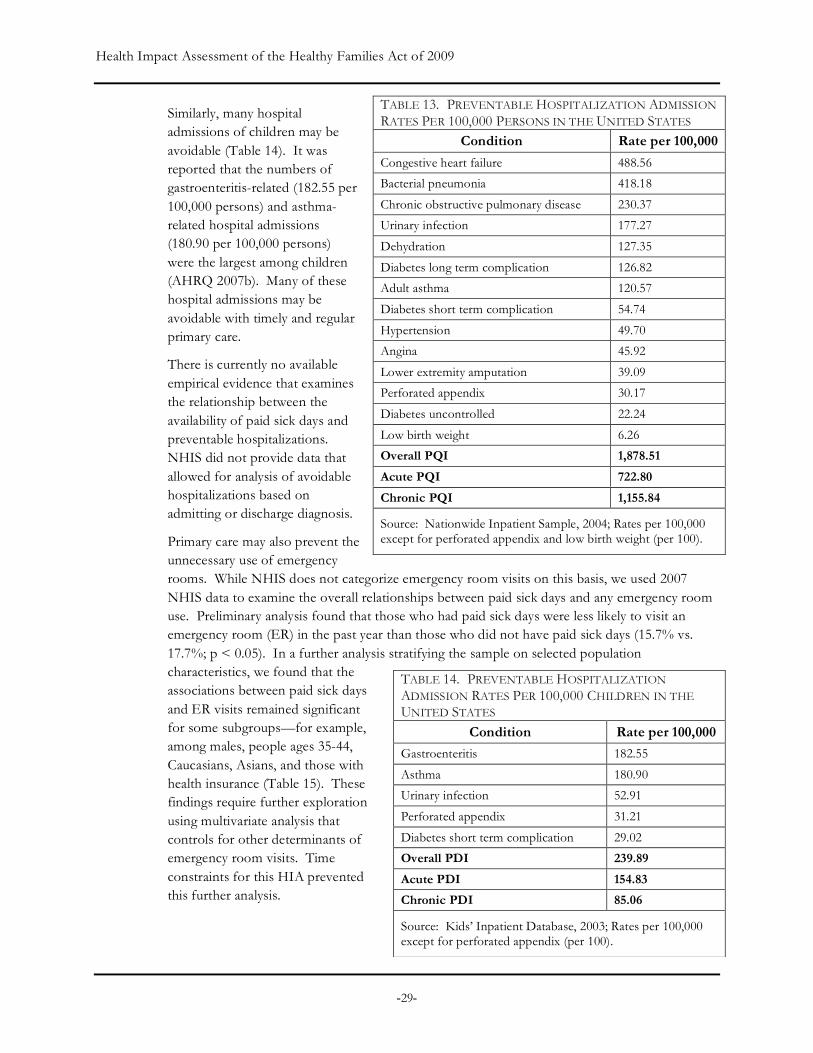
As Table 13 shows, the conditions that led to the largest number of hospital admissions per 100,000 persons in the United States were congestive heart failure (488.56), followed by bacterial pneumonia (418.18), chronic obstructive pulmonary disease (230.37), and urinary infection (117.27) (AHRQ 2007a).
TABLE 12. RESULTS OF MULTIVARIATE ANALYSIS: PREDICTORS OF MEDICAL VISITS
Predictors Odds Ratio
95% Confidence Interval p-value
Paid sick days 1.14 1.01-1.29 p <.05
Male 0.33 0.29-0.36 p < .001
Age over 50 1.33 1.17-1.51 p < .001
Hispanic 0.69 0.59-0.80 p < .001
Asian 0.59 0.46-0.76 p < .001
College education 1.38 1.22-1.56 p < .001
$75,000 or higher in family income 1.60 1.40-1.82 p < .001
Health insurance coverage 3.36 2.93-3.86 p < .001
Self-rated health status 0.52 0.41-0.66 p < .001
Chronic condition 2.36 2.08-2.69 p < .001
Source: HIP and SFDPH analysis of 2007 National Health Interview Survey data.
Almost every hospitalization for asthma is preventable with timely primary care. Nationally, there are almost 200,000 hospitalizations for childhood asthma each year. A single hospitalization in California costs over $13,000.
Health Impact Assessment of the Healthy Families Act of 2009
-29-
Similarly, many hospital admissions of children may be avoidable (Table 14). It was reported that the numbers of gastroenteritis-related (182.55 per 100,000 persons) and asthma-related hospital admissions (180.90 per 100,000 persons) were the largest among children (AHRQ 2007b). Many of these hospital admissions may be avoidable with timely and regular primary care.
There is currently no available empirical evidence that examines the relationship between the availability of paid sick days and preventable hospitalizations. NHIS did not provide data that allowed for analysis of avoidable hospitalizations based on admitting or discharge diagnosis.
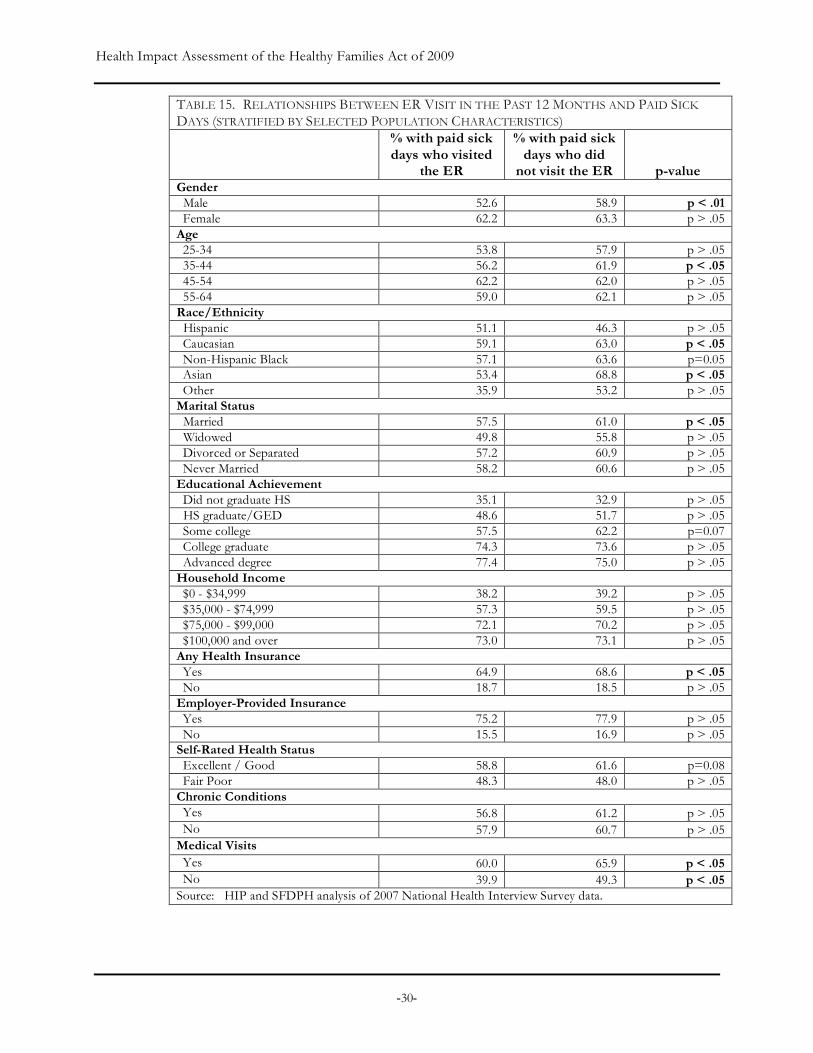
Primary care may also prevent the unnecessary use of emergency rooms. While NHIS does not categorize emergency room visits on this basis, we used 2007 NHIS data to examine the overall relationships between paid sick days and any emergency room use. Preliminary analysis found that those who had paid sick days were less likely to visit an emergency room (ER) in the past year than those who did not have paid sick days (15.7% vs. 17.7%; p < 0.05). In a further analysis stratifying the sample on selected population characteristics, we found that the associations between paid sick days and ER visits remained significant for some subgroups—for example, among males, people ages 35-44, Caucasians, Asians, and those with health insurance (Table 15). These findings require further exploration using multivariate analysis that controls for other determinants of emergency room visits. Time constraints for this HIA prevented this further analysis.
TABLE 13. PREVENTABLE HOSPITALIZATION ADMISSION RATES PER 100,000 PERSONS IN THE UNITED STATES
Condition Rate per 100,000
Congestive heart failure 488.56
Bacterial pneumonia 418.18
Chronic obstructive pulmonary disease 230.37
Urinary infection 177.27
Dehydration 127.35
Diabetes long term complication 126.82
Adult asthma 120.57
Diabetes short term complication 54.74
Hypertension 49.70
Angina 45.92
Lower extremity amputation 39.09
Perforated appendix 30.17
Diabetes uncontrolled 22.24
Low birth weight 6.26
Overall PQI 1,878.51
Acute PQI 722.80
Chronic PQI 1,155.84
Source: Nationwide Inpatient Sample, 2004; Rates per 100,000 except for perforated appendix and low birth weight (per 100).
TABLE 14. PREVENTABLE HOSPITALIZATION ADMISSION RATES PER 100,000 CHILDREN IN THE UNITED STATES
Condition Rate per 100,000
Gastroenteritis 182.55
Asthma 180.90
Urinary infection 52.91
Perforated appendix 31.21
Diabetes short term complication 29.02
Overall PDI 239.89
Acute PDI 154.83
Chronic PDI 85.06
Source: Kids’ Inpatient Database, 2003; Rates per 100,000 except for perforated appendix (per 100).
Health Impact Assessment of the Healthy Families Act of 2009
-30-
TABLE 15. RELATIONSHIPS BETWEEN ER VISIT IN THE PAST 12 MONTHS AND PAID SICK DAYS (STRATIFIED BY SELECTED POPULATION CHARACTERISTICS)
% with paid sick days who visited
the ER
% with paid sick days who did
not visit the ER p-value Gender Male 52.6 58.9 p < .01 Female 62.2 63.3 p > .05 Age 25-34 53.8 57.9 p > .05 35-44 56.2 61.9 p < .05 45-54 62.2 62.0 p > .05 55-64 59.0 62.1 p > .05 Race/Ethnicity Hispanic 51.1 46.3 p > .05 Caucasian 59.1 63.0 p < .05 Non-Hispanic Black 57.1 63.6 p=0.05 Asian 53.4 68.8 p < .05 Other 35.9 53.2 p > .05 Marital Status Married 57.5 61.0 p < .05 Widowed 49.8 55.8 p > .05 Divorced or Separated 57.2 60.9 p > .05 Never Married 58.2 60.6 p > .05 Educational Achievement Did not graduate HS 35.1 32.9 p > .05 HS graduate/GED 48.6 51.7 p > .05 Some college 57.5 62.2 p=0.07 College graduate 74.3 73.6 p > .05 Advanced degree 77.4 75.0 p > .05 Household Income $0 - $34,999 38.2 39.2 p > .05 $35,000 - $74,999 57.3 59.5 p > .05 $75,000 - $99,000 72.1 70.2 p > .05 $100,000 and over 73.0 73.1 p > .05 Any Health Insurance Yes 64.9 68.6 p < .05 No 18.7 18.5 p > .05 Employer-Provided Insurance Yes 75.2 77.9 p > .05 No 15.5 16.9 p > .05 Self-Rated Health Status Excellent / Good 58.8 61.6 p=0.08 Fair Poor 48.3 48.0 p > .05 Chronic Conditions Yes 56.8 61.2 p > .05 No 57.9 60.7 p > .05 Medical Visits Yes 60.0 65.9 p < .05 No 39.9 49.3 p < .05 Source: HIP and SFDPH analysis of 2007 National Health Interview Survey data.

Health Impact Assessment of the Healthy Families Act of 2009
-31-
4.6 EFFECT OF PAID SICK DAYS ON RECOVERY FROM ILLNESS, PRIMARY CARE UTILIZATION, AND PREVENTABLE HOSPITALIZATIONS FOR DEPENDENTS OF WORKERS
A substantial burden of illness is potentially preventable through policies that support needed care for dependents. For example, California, where a single hospitalization for asthma costs over $13,000 (CDPH 2008), has a pediatric asthma hospitalization rate of 134 hospitalizations per 100,000 (OSHPD 2006). As presented above in Tables 13 and 14, nationally there were over 180 hospitalizations per 100,000 children due to pediatric asthma, and over 120 adult hospitalizations per 100,000 due to asthma. Early treatment of a flare-up of asthma in a doctor’s office or clinic can prevent deterioration to the point where hospital care is required. Studies of hospitalized children have shown that sick children have shorter recovery periods, better vital signs, and fewer symptoms when their parents share in their care (Palmer 1993). The presence of parents has also been found to shorten children’s hospital stays by 31% (Taylor and O’Connor 1989).
In section 4.2, we discussed the relationship between having paid sick day benefits and taking leave to care for dependents. In this section, we explore the consequences of care-giving for health and well-being of dependents, including children and elders. Children left home alone may be unable to access physicians for diagnoses, needed medications, or emergency help if their conditions worsen. For dependents with chronic or acute illnesses, access to caregivers can be a matter of life and death.
Among ill adults, receiving care from another can benefit health. Elderly individuals live longer when they have higher levels of social support from friends and family members (Seeman 2000; Berkman 1995). Other studies have consistently found that receiving material or emotional support from family members leads to a faster and fuller recovery from conditions such as heart attacks and strokes (Gorkin 1993; Tsouna-Hadjis 2000).
In one of the only available studies evaluating the relationship between maternal employment conditions and children’s medical visits, Pimoff and Hamilton (1995) modeled the effect of employment and socio-demographic factors on preventative and illness-related ambulatory care visits in a sample of 4,169 children aged 0-15 using the national Medical Expenditure Panel Survey. Overall, findings of this analysis suggested that working mothers had fewer sick child visits than non-working mothers. The authors found that a 10% increase in “sick visit price,” computed by multiplying visit time by post-tax wages, reduced the number of visits for sick children by 2.3%. Mothers who could use sick leave for doctor visits had 27% more sick-child visits than those without this benefit.
A recent study (Schuster 2009) found the beneficial effect of paid leave on children with special health care needs, reporting that children with special needs whose parents received full pay during leave were more likely than parents receiving no pay to report positive effects on children’s physical (odds ratio=1.85) and emotional health (odds ratio=1.68), as well as parents’
“There were several occasions when my children were small, and I was a divorced single mom, that I sent them to school sick. This was because I used up my sick-days. Almost all of my sick-days were used for my children, so I went to work sick several times. As I had a lot of contact with the public as social worker, I probably spread illness.” - Survey Respondent

Health Impact Assessment of the Healthy Families Act of 2009
-32-
own emotional health (odds ratio=1.70). The former were also less likely to report financial problems (odds ratio=0.20).
4.7 EFFECT OF PAID SICK DAYS ON COMMUNICABLE DISEASE TRANSMISSION IN COMMUNITY SETTINGS
Many common infectious diseases are transmitted in workplaces, schools, and other public venues through casual contact. These diseases include influenza or the “flu,” viral gastroenteritis or the "stomach flu," viral meningitis, and the common cold. For each of these common diseases, ensuring that a sick worker can stay out of their workplace and that sick children can stay home from school helps keep infections from spreading. Intuitively, if working adults are able to stay home when they are sick, they are also less likely to spread their illness to co-workers. Collectively, the burden of infectious illnesses transmitted through casual contact in community settings is significant.
Some workplaces are of greater importance as sites of communicable disease transmission because workers have more direct contact with the public (e.g., health care and childcare providers, teachers), prepare food consumed by the public (e.g., food service workers), or work with populations who are susceptible to infection (e.g., health care workers). For occupations such as health care workers, childcare providers, and food service workers, it is critical and even legally required to keep sick employees out of the workplace.
Inf luenza
Each year in the United States, 5% to 20% of the population gets seasonal influenza (flu), more than 200,000 people are hospitalized from flu complications, and about 36,000 people die from flu (CDC 2008b). Hospitalization rates grossly underestimate the clinical burden of influenza. For example, Poehling and colleagues (2006) analyzed data from parent surveys and chart reviews and found that outpatient visits attributable to influenza were 250 times as high as hospitalization rates for children 2-4 years of age. Similarly, outpatient visits for children six months to two years of age were 100 times as high as hospitalization rates for that age group. Importantly, the CDC has found an overall increasing trend in influenza-related hospitalizations using hospital records from 1979 to 2001. Researchers believe this trend is due to the overall aging of the population, the predominance of Influenza A (H3N2) viruses in many recent seasons, and – most important with respect to paid sick days – a general trend for influenza viruses to circulate for longer periods (Thompson 2004).
Transmission of influenza occurs through the generation of aerosol droplets by infectious individuals and through contact with infectious individuals. An estimated 30% of influenza transmission occurs in homes, 37% in schools and workplaces, and 33% in other community settings (Ferguson 2006). One study estimates the probability of an individual contracting influenza from community contacts at 16.4% (Longini 1988). Additional analysis suggests that a sick worker who is in the workplace while contagious is likely to infect 1.8 of every 10 co-workers (Lovell 2005).
The U.S. Centers for Disease Control and Prevention (CDC 2008a) provides the very common sense recommendation to people with influenza: “stay home from work, school, and errands when you are sick.”
Health Impact Assessment of the Healthy Families Act of 2009
-33-
Currently, substantial attention and public health planning is focused on the prevention of a pandemic with a novel strain of influenza. Research has shown that the emergence of a highly infectious novel influenza strain as a pandemic is likely to result in 68% of the population being affected and 34% suffering a clinical infection, translating into 100 million sick individuals in the United States (Ferguson 2006). The nonprofit organization, Trust for America’s Health, used Flu Aid, a modeling program developed by the CDC, to forecast influenza-related illness and death rates in the event of a severe pandemic for each state. TFAH’s state estimates are similar to the assumptions made by the Centers for Disease Control and Prevention and the White House Homeland Security Council for a severe pandemic resembling the pandemic outbreak of 1918. The model assumes 30% of the population getting ill and a 2.5% case-fatality rate, and adjusts for the age distribution of each state. In the event of such an outbreak, according to their predictions, approximately 90 million Americans would get ill, and of those 90 million, roughly 2.25 million would die. Table 16 highlights projected morbidity and mortality rates by state. (TFAH 2007).
Both pharmacological strategies (e.g., vaccines, prophylaxis) and non-pharmacological strategies (e.g., quarantine, isolation, school closure) exist to prevent the spread of influenza. According to researchers who studied the effectiveness of strategies to limit transmission of influenza using mathematical models, a combination of effective strategies will be necessary to control an influenza pandemic (Halloran 2008).
The hazard of a new strain of the influenza virus will depend on factors such as its infectivity and the percentage of infected individuals with clinical symptoms. However, strategies to minimize social contacts between people can be highly effective in controlling the spread of influenza. Such strategies include having a sick person remain at home when symptomatic, quarantine of an infected individual and his or her family members for a specified period, isolation of infected individuals, closing schools, closing workplaces, and limiting travel. The U.S. Department of Health and Human Services now recommends “liberal leave” policies to help control pandemic flu (USDHHS 2007). In addition, to prepare for an influenza pandemic, the Occupational Safety and Health Administration (OSHA) recommends that every employer should “develop a sick leave policy that does not penalize sick employees, thereby encouraging employees who have influenza-related symptoms (e.g., fever, headache, cough, sore throat, runny or stuffy nose, muscle aches, or upset stomach) to stay home so that they do not infect other employees.” Similarly, OSHA states that employers should “recognize that employees with ill family members may need to stay home to care for them” (OSHA 2007).
The effect of community strategies to control the spread of influenza depends ultimately on compliance. In general, strategies that restrict movement to a greater degree are much less feasible. Most social distancing strategies require people to take leave from work for periods of time when they or their family members are potentially infectious.
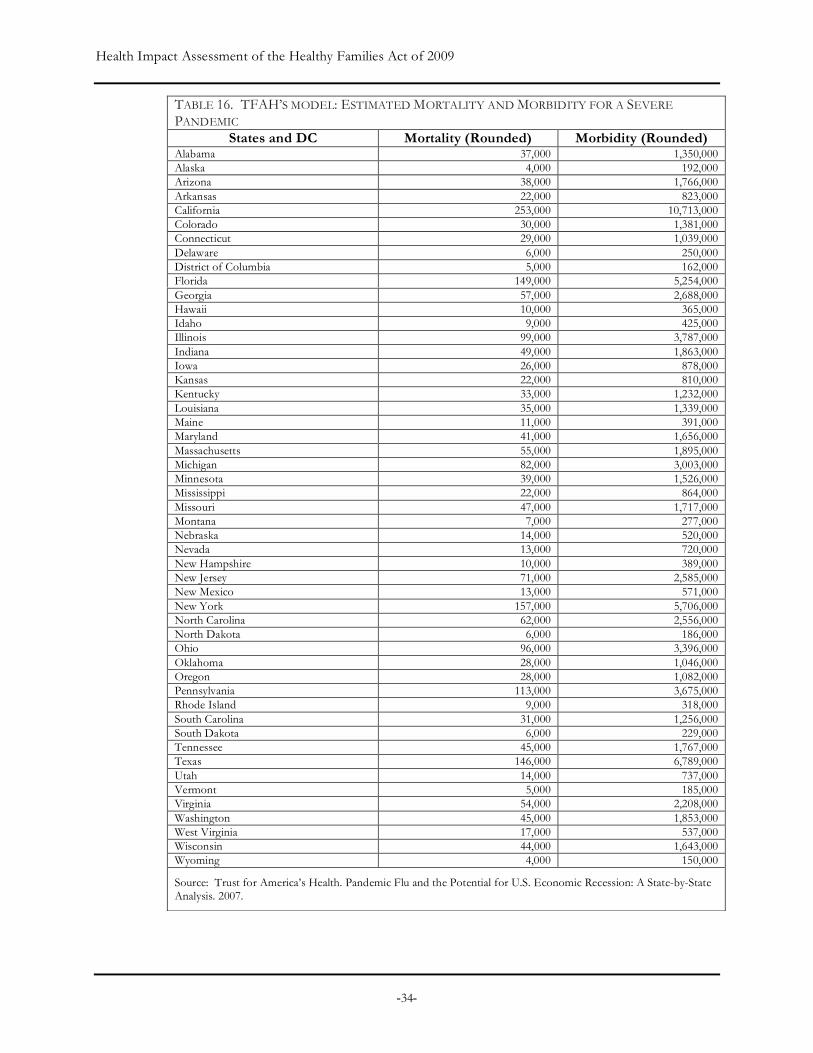
Health Impact Assessment of the Healthy Families Act of 2009
-34-
TABLE 16. TFAH’S MODEL: ESTIMATED MORTALITY AND MORBIDITY FOR A SEVERE PANDEMIC
States and DC Mortality (Rounded) Morbidity (Rounded) Alabama 37,000 1,350,000 Alaska 4,000 192,000 Arizona 38,000 1,766,000 Arkansas 22,000 823,000 California 253,000 10,713,000 Colorado 30,000 1,381,000 Connecticut 29,000 1,039,000 Delaware 6,000 250,000 District of Columbia 5,000 162,000 Florida 149,000 5,254,000 Georgia 57,000 2,688,000 Hawaii 10,000 365,000 Idaho 9,000 425,000 Illinois 99,000 3,787,000 Indiana 49,000 1,863,000 Iowa 26,000 878,000 Kansas 22,000 810,000 Kentucky 33,000 1,232,000 Louisiana 35,000 1,339,000 Maine 11,000 391,000 Maryland 41,000 1,656,000 Massachusetts 55,000 1,895,000 Michigan 82,000 3,003,000 Minnesota 39,000 1,526,000 Mississippi 22,000 864,000 Missouri 47,000 1,717,000 Montana 7,000 277,000 Nebraska 14,000 520,000 Nevada 13,000 720,000 New Hampshire 10,000 389,000 New Jersey 71,000 2,585,000 New Mexico 13,000 571,000 New York 157,000 5,706,000 North Carolina 62,000 2,556,000 North Dakota 6,000 186,000 Ohio 96,000 3,396,000 Oklahoma 28,000 1,046,000 Oregon 28,000 1,082,000 Pennsylvania 113,000 3,675,000 Rhode Island 9,000 318,000 South Carolina 31,000 1,256,000 South Dakota 6,000 229,000 Tennessee 45,000 1,767,000 Texas 146,000 6,789,000 Utah 14,000 737,000 Vermont 5,000 185,000 Virginia 54,000 2,208,000 Washington 45,000 1,853,000 West Virginia 17,000 537,000 Wisconsin 44,000 1,643,000 Wyoming 4,000 150,000
Source: Trust for America’s Health. Pandemic Flu and the Potential for U.S. Economic Recession: A State-by-State Analysis. 2007.
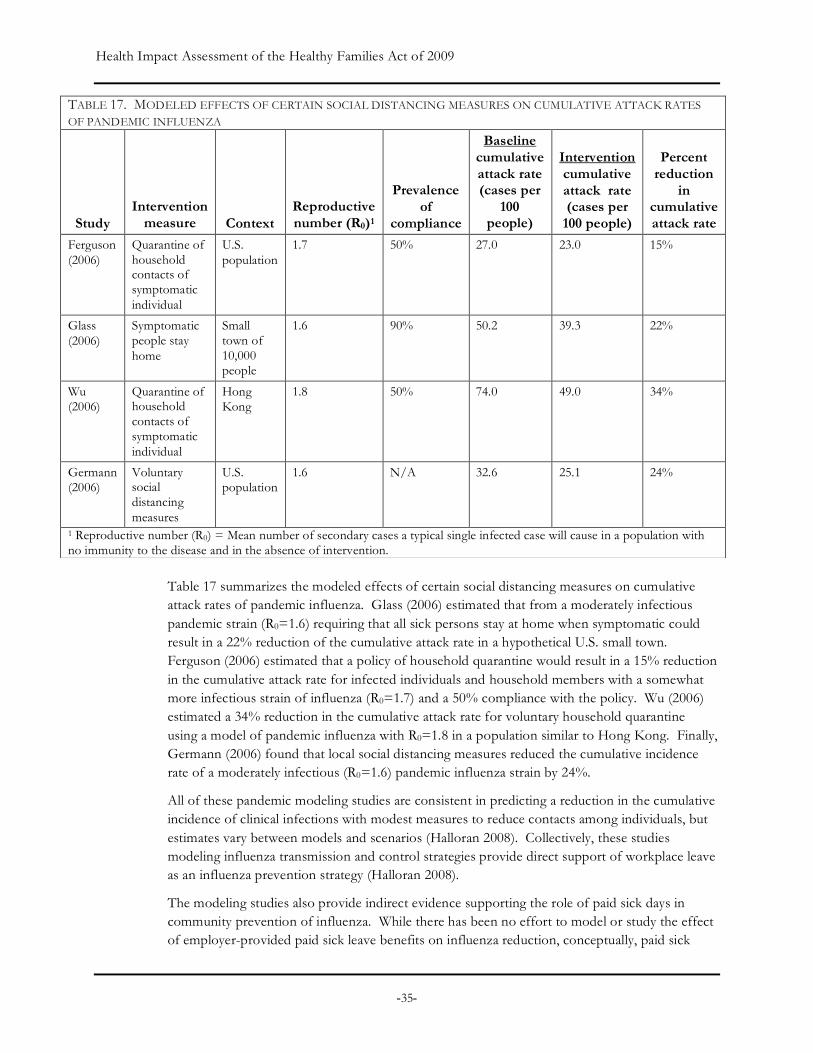
Health Impact Assessment of the Healthy Families Act of 2009
-35-
Table 17 summarizes the modeled effects of certain social distancing measures on cumulative attack rates of pandemic influenza. Glass (2006) estimated that from a moderately infectious pandemic strain (R0=1.6) requiring that all sick persons stay at home when symptomatic could result in a 22% reduction of the cumulative attack rate in a hypothetical U.S. small town. Ferguson (2006) estimated that a policy of household quarantine would result in a 15% reduction in the cumulative attack rate for infected individuals and household members with a somewhat more infectious strain of influenza (R0=1.7) and a 50% compliance with the policy. Wu (2006) estimated a 34% reduction in the cumulative attack rate for voluntary household quarantine using a model of pandemic influenza with R0=1.8 in a population similar to Hong Kong. Finally, Germann (2006) found that local social distancing measures reduced the cumulative incidence rate of a moderately infectious (R0=1.6) pandemic influenza strain by 24%.
All of these pandemic modeling studies are consistent in predicting a reduction in the cumulative incidence of clinical infections with modest measures to reduce contacts among individuals, but estimates vary between models and scenarios (Halloran 2008). Collectively, these studies modeling influenza transmission and control strategies provide direct support of workplace leave as an influenza prevention strategy (Halloran 2008).
The modeling studies also provide indirect evidence supporting the role of paid sick days in community prevention of influenza. While there has been no effort to model or study the effect of employer-provided paid sick leave benefits on influenza reduction, conceptually, paid sick
TABLE 17. MODELED EFFECTS OF CERTAIN SOCIAL DISTANCING MEASURES ON CUMULATIVE ATTACK RATES OF PANDEMIC INFLUENZA
Study Intervention
measure Context Reproductive number (R0)1
Prevalence of
compliance
Baseline cumulative attack rate (cases per
100 people)
Intervention cumulative attack rate (cases per
100 people)
Percent reduction
in cumulative attack rate
Ferguson (2006)
Quarantine of household contacts of symptomatic individual
U.S. population
1.7 50% 27.0 23.0 15%
Glass (2006)
Symptomatic people stay home
Small town of 10,000 people
1.6 90% 50.2 39.3 22%
Wu (2006)
Quarantine of household contacts of symptomatic individual
Hong Kong
1.8 50% 74.0 49.0 34%
Germann (2006)
Voluntary social distancing measures
U.S. population
1.6 N/A 32.6 25.1 24%
1 Reproductive number (R0) = Mean number of secondary cases a typical single infected case will cause in a population with no immunity to the disease and in the absence of intervention.
Health Impact Assessment of the Healthy Families Act of 2009
-36-
days enable and increase the likelihood of compliance with both voluntary and mandatory social distancing strategies, including the home isolation of sick individuals and related household members. Access to paid sick days would also affect the feasibility of other social distancing strategies, particularly for families with children. School closure is an effective strategy in several modeling scenarios, as transmission among school-aged children is an important driver of influenza transmission. Closing schools, either for short or long periods of time, will require adults who are not sick to stay home to supervise their children. Families with young children may be a less wealthy group than average workers, and thus may have a greater need for employer support during periods of workplace leave.
While it is not possible to estimate the magnitude of the change in compliance that is specifically attributable to paid sick days using available data or existing research, even if the effect was small, because of the large burden of disease associated with influenza, the overall magnitude of the health benefit of paid sick days could be substantial. An indirect benefit of effective compliance with social distancing strategies would include not only a reduction of morbidity and mortality but also a reduction of hospital and health care costs and less dependence on pharmacological strategies to control seasonal epidemics and pandemics.
Transmiss ion o f Foodborne Dise ase in Rest au rants
Foodborne diseases cause approximately 76 million illnesses, 325,000 hospitalizations, and 5,000 deaths in the United States each year (Mead 1999). More than half of all U.S.-reported foodborne illness outbreaks occur in restaurants (Jones 2006).
Various state retail food codes require local health officers to restrict a food service worker from a food facility if the employee is diagnosed with an infectious agent, symptomatic, and still considered infectious. In reality, public health officials rely on workers to recognize the illness and their employers to self-enforce requirements that protect the public. Unfortunately, however, 85% of workers in the food service industry do not have access to paid sick days (Lovell 2008). This means that many food service workers have barriers to accessing treatment and diagnosis for infectious diseases and have disincentives to taking time off when ill.
Delay in diagnosis creates public health risks. A worker may recognize a symptom but may not associate it with a foodborne illness. A food worker may not want to take unpaid time to obtain a diagnosis or may defer care until the symptom worsens, potentially infecting co-workers and patrons in the meantime.
Guzewich and Ross (1999) reviewed published scientific literature for reports of foodborne disease believed to have resulted from contamination of food by workers, finding 81 published outbreaks involving 14,712 infected persons. Eighty-nine percent (n=72) of the outbreaks occurred at food service establishments, such as restaurants, cafeterias and catered functions. Hepatitis A and Norwalk-like viruses accounted for 60% (n=49) of outbreaks. Ninety-three percent of these outbreaks involved food workers who were ill either prior to or at the time of the outbreak.
With regards to specific etiologic agents, norovirus is responsible for 50% of all foodborne illnesses in the U.S (Widdowson 2005). Between 48% and 93% of all norovirus outbreaks may be linked to ill food service workers (Guzewich 1999). Contamination of food by an infected
Health Impact Assessment of the Healthy Families Act of 2009
-37-
food worker is also the most common mode of transmission of hepatitis A in foodborne disease outbreaks (Guzewich 1999). A review of foodborne hepatitis A outbreaks in the United States found that in many cases the infected food handler either did not seek medical care or delayed getting medical care (Fiore 2004).
The impact of food worker-related disease outbreaks can be significant. For example, in 2005, an ill worker without paid sick day benefits at a sandwich shop in Kent County, Michigan was responsible for the illness in over 100 customers (MMWR 2006). In 2006, a restaurant-worker without paid sick day benefits infected over 350 customers (MMWR 2007) with norovirus at a restaurant in Lansing, Michigan.
More recent data provided by the Centers for Disease Control’s Electronic Foodborne Outbreak Disease Report System (eFORS) for this HIA provides a contemporary assessment of the disease burden associated with ill food service workers. Based on available, reported data, there were 5754 foodborne disease outbreaks between 2003 and 2007 nationally, with 121,948 related cases of illness. The majority of these outbreaks (71%) and cases (61%) occurred in institutional and workplace settings including schools, day care settings, restaurants or delis, workplace cafeterias, grocery stores, hospitals, and jails. In these settings, workers with a communicable disease have a significant potential to contribute to a communicable disease outbreak if they work when ill.
Of the 4,079 outbreaks occurring in the specific settings listed above, for 14% of outbreaks (n=586) and 24% of cases (n=18,030), food handling by an infected person or carrier of a pathogen was identified as a contributing cause. In an additional 1,007 reported outbreaks and 22,847 related cases during this time period, bare-or glove-handed food contact was identified as a contributing cause of the outbreak. In total, 39% of all outbreaks and 55% of all cases occurring in an institutional setting had contributing causes involving a food handler/worker/preparer. Norovirus was the most commonly implicated illness in these outbreaks.
Additional information obtained through a 2009 survey of local health officers in California also provides support for the significance of ill food service workers as a cause of disease outbreaks. In one large urban California county, 17 of 155 confirmed outbreaks in a five-year period (2003–2007) could be traced back to an ill food service worker. In another moderate-sized county, five of eight confirmed foodborne outbreaks involving 165 cases involved an infected food handler. In one case, an employee with confirmed norovirus illness was implicated in a single outbreak at a restaurant that infected 80 people.
Results from focus groups corroborate the above findings. One participant described that workplace conditions in the restaurant industry could exacerbate illness among workers. She explained that employers expected workers to find someone to cover their shift if they called in sick. Given examples of co-workers being fired for calling in sick, one worker felt that they had no choice but to go to work sick. She elaborated the reason for this by saying, “we’re so expendable…we’re service [workers].” She went on to describe how such workplace norms, in combination with close working conditions, led to habitually passing illness around to one another, decreased productivity among workers, and significantly longer recovery times. She stated, “The staff of the restaurant is pretty big. People have kids. People get sick all the time. There’s someone always sick out….It’s gets passed from one person to the next.”
Health Impact Assessment of the Healthy Families Act of 2009
-38-
These findings illustrate that a substantial burden of avoidable communicable disease is associated with foodborne disease outbreaks related to food service employees who are working while ill. Paid sick days may facilitate accountability to workplace exclusion policies that are designed to prevent such outbreaks.
Transmiss ion o f Inf e c t ious Dise ase in Heal t h Care Faci l i t i e s
Recently, nursing homes have experienced a large number of norovirus outbreaks. For example, according to the CDC, 23% of all norovirus outbreaks occur in nursing homes (CDC 2006). The vast majority of patients will recover from norovirus illness within a few days, but an estimated 10% experience more serious symptoms, including acute dehydration that ultimately requires hospitalization (Calderon-Margalit 2005). In addition, approximately 2% of those afflicted face the risk of death (Calderon-Margalit 2005).
In 2007, there were 1,641 reported cases of norovirus infections in nursing homes in Wisconsin. These led to 22 hospitalizations and two deaths (WDHS 2009). In California, 100-200 norovirus outbreaks occur in nursing homes each year (CDHS 2006). Between 2002 and 2004, California reported 480 outbreaks of viral gastroenteritis. Half of the outbreaks occurred in long-term care facilities and 40% were in skilled nursing facilities (nursing homes). Nursing home outbreaks accounted for 6,500 patient illnesses, 120 hospitalizations, and 29 deaths (CDPH 2008).
Nursing home-based respiratory and gastrointestinal disease outbreaks involve residents and staff. Analogous to legal requirements for food service workers, several states have guidelines for illness prevention that suggest that ill staff with viral gastroenteritis should be symptom-free for some period of time (e.g., 24 hours) before returning to work. However, as a significant proportion (27% nationally; Lovell 2009) of nursing home workers do not have paid sick day benefits, these workers may be more likely to come to work sick, thus putting patients and co-workers at risk of contracting illness.
A study of New York State nursing homes conducted in 1993 found that risk of respiratory and gastrointestinal infectious disease outbreaks was significantly less for nursing homes with paid sick leave policies (adjusted relative risk=0.38, 95% confidence interval 0.15-0.99) (Li 1996). Capozza et al. (2008) estimated the number of norovirus outbreaks in California nursing homes potentially avoided though a universal paid sick day policy. The analysis assumed: i) the effect of this workplace policy found in the analysis of Li and others (1996) would be similar to the effect in California nursing homes; ii) the prevalence of paid sick day benefits among nursing homes would be the same as the prevalence of the benefit among nursing home workers nationally (73%); and iii) nursing home workers would utilize this benefit to take leave from work when ill with norovirus. Using these assumptions, Capozza et al. estimated that between 30 and 45 fewer nursing homes would experience norovirus outbreaks annually under a policy of paid sick days. Additionally, Capozza et al. estimated that the reduction in nursing home outbreaks would result in between 939 and 1407 fewer resident cases of norovirus and between 667 and 999 fewer employee cases of norovirus.
Transmiss ion o f Inf e c t ious Dise ase in Chil dca re Faci l i t i e s
Children placed in childcare have an increased risk for respiratory and gastrointestinal communicable diseases, particularly in the first two years of care (Wald 1991; NICHHD 2001).
Health Impact Assessment of the Healthy Families Act of 2009
-39-
As discussed above, both common childhood illness and sick-child exclusion policies that are in place in schools and childcare facilities create a substantial burden on work leave for parents.
Non-compliance with sick-child exclusion policies at childcare facilities is a potentially avoidable cause of communicable disease transmission in these settings. Conceptually, paid sick days could enable parental compliance with these policies. As discussed above, findings from the survey conducted for the California HIA indicated that over half of survey participants reported times when they could not care for dependents because of the lack of paid sick days. Furthermore, communication with some communicable disease control investigators highlighted that enforcement of restrictions is most difficult in the childcare arena because there are many childcare settings and not all are licensed. Similarly, investigators felt that the process for keeping ill children home from childcare is less regulated than restrictions for workers in sensitive occupations such as food service and health care.
However, we found no other published research to support an effect of paid sick days on parental compliance. Research discussed above suggests that the availability of paid sick days makes it more likely that a parent will care for his or her own sick child (Heymann 1999b). Similarly, Clemans-Cope et al. (2007) found that in families with employer-provided paid sick leave, employees were more likely to miss work to care for family members (44% vs. 26%). Overall, it is not possible to infer from this limited research whether the absence of paid sick days predicts non-compliance with child exclusion policies.
4.8 EFFECT OF PAID SICK DAYS ON WAGE LOSS, RISK OF JOB LOSS, AND EMPLOYER RETALIATION
As reasoned from the evidence above, the absence of paid sick days can be expected to have important economic impacts on workers as well as employers. Workers without paid sick days experience wage loss when they take time off to care for themselves and their family members. In addition, some workers may place themselves at risk of job loss if absence for sickness is not approved by their employers (Heymann 2000). Furthermore, having the ability to earn and utilize paid sick days may enable some with chronic or frequent illnesses to remain employed. Each of these economic impacts would be expected to have important indirect effects on health outcomes.
Wage Loss
Income is one of the strongest and most consistent predictors of poor health and disease in public health research literature (Yen and Syme 1999). The magnitude of income’s effect on health is significant. For example, people with average family incomes of $15,000 to $20,000 were three times as likely to die prematurely as those with family incomes greater than $70,000 (Sorlie 1995). The strong relationship between income and health is not limited to a single illness or disease. People with lower incomes have higher risks than people with higher incomes for giving birth to low birth weight babies, suffering injuries or violence, getting most cancers, and getting chronic conditions (Yen 1999).
An adequate and stable income allows an individual or household to access critical material needs for health including food, shelter, clothing, and transport. In 1999, 31 million people (including 12 million children) were either uncertain of having or unable to acquire adequate food to meet

Health Impact Assessment of the Healthy Families Act of 2009
-40-
basic needs at some time during the previous year because there was not enough money for food according to the U.S. Department of Agriculture. Nationally, those with incomes in the bottom fifth of the income distribution and who pay 50% of their incomes for housing have an average of $417 to cover all non-housing monthly expenses (JCHS 2003). Furthermore, income is essential for heating and cooling homes and transport to jobs and schools.
Therefore even a small loss of income on a monthly basis may lead to trade-offs for those with low incomes between housing, food, and health care services. One focus group participant stated that if “I only work three shifts this week and if I’m like too sick and I can’t make my $150 that I need… I’m totally not paying rent and I definitely can’t buy groceries…a lot of times there’s no choice but to keep working. I never call in sick. And I’ve been working in restaurants for seven years.” This sentiment was echoed by others as well. “We don't have that privilege--not even to get sick… I know if I don't work, because of the two or three days I'm not feeling well, I won't be able to cover my rent and my bills. That's the way it is.”
A survey of American cities found that low-paying jobs and high housing costs are the most frequently cited reasons for hunger (Sandel 1999). For those with lower income, short-term financial instability also creates risks of displacement, homelessness, or risk of living in crowded or substandard conditions with moisture or mold, poor ventilation, cockroaches, rodents, asbestos or lead, or homes that may be structurally unsafe (SFDPH 2004). Because people will often work extra hours or second jobs to meet financial obligations, overwork may generate psychosocial stress, compromise personal or family relationships, and result in punitive or low-effort strategies to resolve conflict with children (Dunn 2002).
As discussed in section 3.3, workers in occupations that pay lower wages are more likely to lack paid sick days than those working in higher-income occupations. Table 18, which details wages for various occupational categories sorted by the percent of workers that have paid sick days, further illustrates this point. For example, in May 2008, the median ($8.59) and mean ($9.72) hourly wages were lowest for food preparation and services jobs, 85% of which do not offer paid sick days benefits. Lovell (2008) and Hartmann (2007) found that workers in California without paid sick leave were disproportionately in low-wage occupations, and the average hourly wage of workers without paid sick days ($15.70) was substantially lower than the median wage ($17.42). Therefore, disparities in access to paid sick days would place lower-wage workers at a greater risk of income loss due to sickness or family illness.
Given the differences in wages and living costs across states and among different segments of the working population in the United States, it is difficult to provide meaningful national estimates of the effects of income loss due to unpaid sick days. It is clear that minimum wage workers in many places in the country currently do not earn enough to cover basic needs of their families, including housing, food, childcare, transportation, and health care. For example, in
“I have to go to work, or I end up broke. Because I have….the rent, the rent has to be paid, the phone, money for the kids. No, I could be dying, but I have to work, I have to work.” - Focus Group Participant
“Then you find yourself eating more cheaply… maybe not taking the time to nourish yourself the way you should because you’re really strained on money. I go on the mac and cheese diet or the ramen noodle diet. You go into survival mode…because it’s about making the money that you need at the end of the month.” - Focus Group Participant
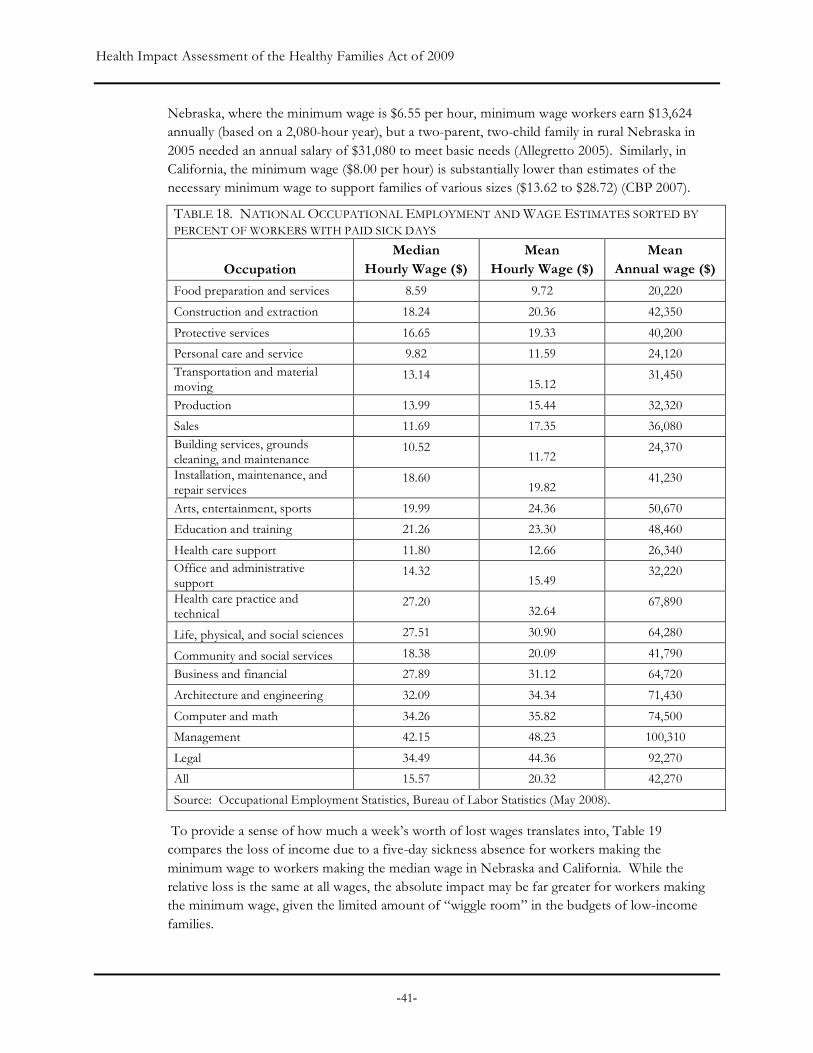
Health Impact Assessment of the Healthy Families Act of 2009
-41-
Nebraska, where the minimum wage is $6.55 per hour, minimum wage workers earn $13,624 annually (based on a 2,080-hour year), but a two-parent, two-child family in rural Nebraska in 2005 needed an annual salary of $31,080 to meet basic needs (Allegretto 2005). Similarly, in California, the minimum wage ($8.00 per hour) is substantially lower than estimates of the necessary minimum wage to support families of various sizes ($13.62 to $28.72) (CBP 2007).
TABLE 18. NATIONAL OCCUPATIONAL EMPLOYMENT AND WAGE ESTIMATES SORTED BY PERCENT OF WORKERS WITH PAID SICK DAYS
Occupation Median
Hourly Wage ($) Mean
Hourly Wage ($) Mean
Annual wage ($)
Food preparation and services 8.59 9.72 20,220
Construction and extraction 18.24 20.36 42,350
Protective services 16.65 19.33 40,200
Personal care and service 9.82 11.59 24,120 Transportation and material moving
13.14 15.12
31,450
Production 13.99 15.44 32,320
Sales 11.69 17.35 36,080 Building services, grounds cleaning, and maintenance
10.52 11.72
24,370
Installation, maintenance, and repair services
18.60 19.82
41,230
Arts, entertainment, sports 19.99 24.36 50,670
Education and training 21.26 23.30 48,460
Health care support 11.80 12.66 26,340 Office and administrative support
14.32 15.49
32,220
Health care practice and technical
27.20 32.64
67,890
Life, physical, and social sciences 27.51 30.90 64,280
Community and social services 18.38 20.09 41,790
Business and financial 27.89 31.12 64,720
Architecture and engineering 32.09 34.34 71,430
Computer and math 34.26 35.82 74,500
Management 42.15 48.23 100,310
Legal 34.49 44.36 92,270
All 15.57 20.32 42,270
Source: Occupational Employment Statistics, Bureau of Labor Statistics (May 2008).
To provide a sense of how much a week’s worth of lost wages translates into, Table 19 compares the loss of income due to a five-day sickness absence for workers making the minimum wage to workers making the median wage in Nebraska and California. While the relative loss is the same at all wages, the absolute impact may be far greater for workers making the minimum wage, given the limited amount of “wiggle room” in the budgets of low-income families.
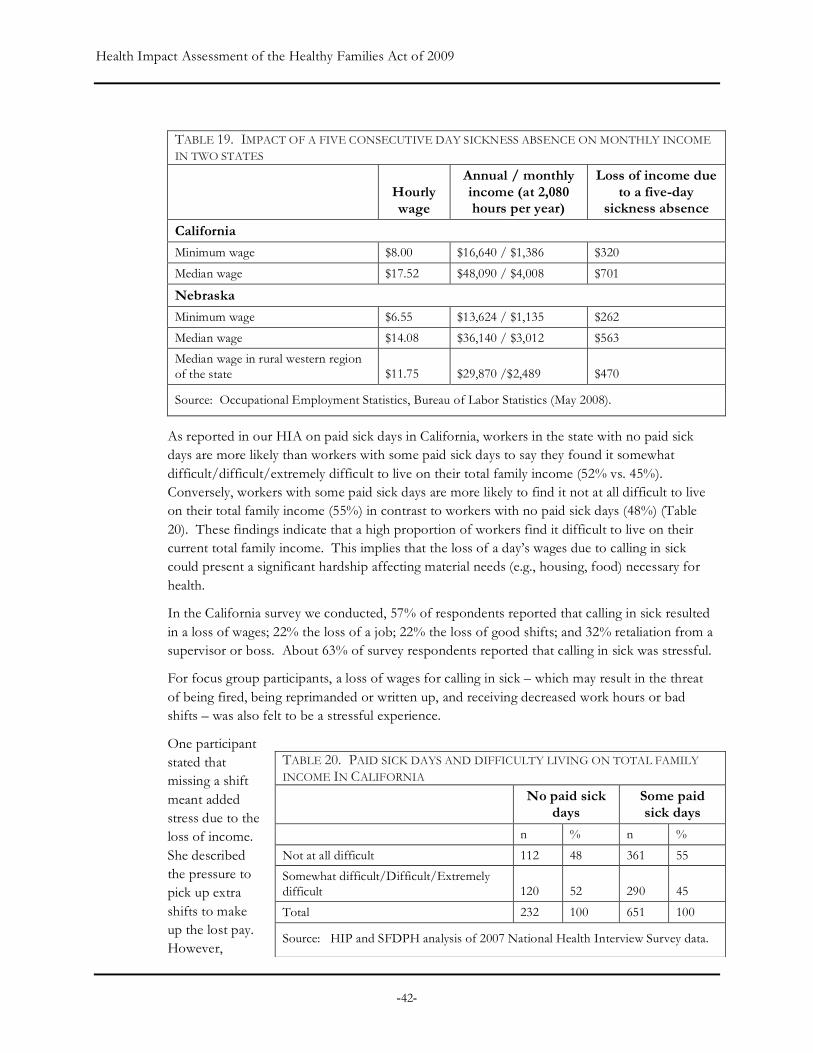
Health Impact Assessment of the Healthy Families Act of 2009
-42-
TABLE 19. IMPACT OF A FIVE CONSECUTIVE DAY SICKNESS ABSENCE ON MONTHLY INCOME IN TWO STATES
Hourly wage
Annual / monthly income (at 2,080 hours per year)
Loss of income due to a five-day
sickness absence
California
Minimum wage $8.00 $16,640 / $1,386 $320
Median wage $17.52 $48,090 / $4,008 $701
Nebraska Minimum wage $6.55 $13,624 / $1,135 $262
Median wage $14.08 $36,140 / $3,012 $563
Median wage in rural western region of the state $11.75 $29,870 /$2,489 $470
Source: Occupational Employment Statistics, Bureau of Labor Statistics (May 2008).
As reported in our HIA on paid sick days in California, workers in the state with no paid sick days are more likely than workers with some paid sick days to say they found it somewhat difficult/difficult/extremely difficult to live on their total family income (52% vs. 45%). Conversely, workers with some paid sick days are more likely to find it not at all difficult to live on their total family income (55%) in contrast to workers with no paid sick days (48%) (Table 20). These findings indicate that a high proportion of workers find it difficult to live on their current total family income. This implies that the loss of a day’s wages due to calling in sick could present a significant hardship affecting material needs (e.g., housing, food) necessary for health.
In the California survey we conducted, 57% of respondents reported that calling in sick resulted in a loss of wages; 22% the loss of a job; 22% the loss of good shifts; and 32% retaliation from a supervisor or boss. About 63% of survey respondents reported that calling in sick was stressful.
For focus group participants, a loss of wages for calling in sick – which may result in the threat of being fired, being reprimanded or written up, and receiving decreased work hours or bad shifts – was also felt to be a stressful experience.
One participant stated that missing a shift meant added stress due to the loss of income. She described the pressure to pick up extra shifts to make up the lost pay. However,
TABLE 20. PAID SICK DAYS AND DIFFICULTY LIVING ON TOTAL FAMILY INCOME IN CALIFORNIA
No paid sick
days Some paid sick days
n % n %
Not at all difficult 112 48 361 55
Somewhat difficult/Difficult/Extremely difficult 120 52 290 45
Total 232 100 651 100
Source: HIP and SFDPH analysis of 2007 National Health Interview Survey data.
Health Impact Assessment of the Healthy Families Act of 2009
-43-
“doing a double shift at a restaurant” meant working fourteen hours straight, and being “incapacitated for a day.” If the participant couldn’t pick up that extra shift, she described making up the lost pay by adjusting her eating habits: “Then you find yourself eating more cheaply…maybe not taking the time to nourish yourself the way you should because you’re really strained on money. I go on the mac and cheese diet or the ramen noodle diet. You go into survival mode…because it’s about making the money that you need at the end of the month.”
Another participant who also worked in the restaurant industry described that employers expected workers to find someone to cover their shift if they needed to call in sick. As noted in section 4.7, having co-workers fired for calling in sick makes such workers feel “expendable.”
Lost wages also had the impact of creating tension with others. In particular, several focus group participants discussed how loss of wages affected their relationships with their husbands, primarily because they were unable to contribute to family wages, or because their wage input was less than usual. One participant said, “And if we stop working and aren’t earning, how are we going to contribute the other half that’s our share?” Several participants identified domestic violence as being triggered by such tension.
Risk o f Job Loss and Employe r Retal iat ion
Health problems can translate into unemployment through several mechanisms. Earle and Heymann (2002) found that a health problem led to a 53% increase in job loss among low-wage mothers and having a child with health problems led to a 36% increase in job loss even after taking into account the mother’s years of education, her skills, and the local environment in which she was looking for work.
Chronic unemployment is associated with a number of adverse health outcomes, including shortened life expectancy and higher rates of cardiovascular disease, hypertension, depression and suicide (Jin 1995; McKee-Ryan 2005; Voss 2004). Precarious or unstable employment also has adverse impacts on physical and mental health (Ferrie 2005).
Paid sick days and other forms of paid leave also appear to prevent unemployment by encouraging a return to work after a serious illness. For example, one study found that nurses with paid sick days were 2.6 times more likely to return to work after a heart attack or angina (Earle 2006).
The above finding suggests that paid sick days may be a component of a workplace culture that is more likely to accept and accommodate employee absence for illness. According to a recent poll (Smith 2008), workers are often penalized by employers when time off is needed to deal with personal or family illnesses. Of workers polled:
• 11% indicated that they or a family member had been fired, suspended or otherwise punished for taking time off for an illness;
• 11% indicated that they had lost a job for this reason;
“I know it’s good for me to stay home like another day or two…but just knowing like you really would be looked down upon by management. They would use that against you.” - Focus Group Participant
Health Impact Assessment of the Healthy Families Act of 2009
-44-
• 13% had been told that they would be fired, suspended, or otherwise punished if they missed work due to a personal or family illness; and
• 12% indicated that they would lose their job if they took time off for a personal or family illness.
In total, about one in six workers reported that they or a family member had been fired, suspended, punished, or threatened by an employer due to needing time off for illness.
This data is corroborated by our focus group discussions. According to participants, employer retaliation for calling in sick was closely tied to the threat of job loss. In the most extreme situation of a penalty being levied, one participant described being laid off after taking time off to bring her daughter to the doctor. Another described seeing a co-worker, “someone who worked there for two years,” get fired because she didn’t show up for a shift.
Others described consequences in terms of the type of work they were asked to do or the number of hours they were assigned after calling in sick. One domestic worker talked about how, when she returned to work after taking time off, she was asked to complete more difficult tasks. Participants perceived such treatment to be a “punishment” for taking time off.
A worker who did manual jobs talked about another form of penalty – a “three strikes” rule – at one job, where calling in sick could count as a strike in performance evaluations. He stated, “Calling in sick too often could cause some strikes against you, which would look bad during an upcoming review” which also meant that “[workers] would bring their illness into the work environment. Because instead of being at home they didn’t want to like jeopardize their job...”
Related to the threat of job loss was the role that social pressure and guilt played as obstacles for workers to call in sick, or to take adequate time to get well. One participant discussed how she was made to feel guilty by her employer for taking time off while her children were sick. She quoted her employer as saying, “When you want, you can go, and I’ll never get a person who has children again, because the ones with children are really problematic, because they have to leave work to take care of their children.” Another participant said, “it's hard to claim it [sick days]….because sometimes you're grateful to have work, and sometimes, as my fellow worker said, you end up working harder for fear of losing the little bit you've got.” Participants also agreed that often, “After being home sick for a day, people feel like they need to work extra hard the next day.”
Job loss could also result from employers going out of business due to the extra costs associated with providing paid sick days to employees. However a study of employers’ reactions to paid sick days policies in San Francisco (Boots 2009) found that “by and large, most employers were able to implement the paid sick leave ordinance with minimal to moderate effects on their overall business and their bottom line.” Small- and medium-sized businesses were impacted more than large businesses. Medium size businesses found it necessary to cut other costs, including changing other employee policies. Small businesses were impacted less because many of them had informal paid sick day policies in place before the requirement was enacted. The report does not find that there was significant loss of jobs in San Francisco in the year after the policy was implemented. It is important to note that the study could not differentiate between effects of the paid sick day policy and a policy that imposed a fee for health care coverage for workers that
Health Impact Assessment of the Healthy Families Act of 2009
-45-
were not already covered by health insurance and were employed by businesses with more than 20 workers. These two requirements were put in place at approximately the same time.
A guaranteed right to paid sick days may foster a workplace culture that is more conducive to taking time off when sick and that makes illegal employer retaliations against sick time off.
Health Impact Assessment of the Healthy Families Act of 2009
-46-
5. References Agency for Healthcare Research and Quality (AHRQ). (2004). Prevention quality indicators overview. Available at http://www.qualityindicators.ahrq.gov/pqi_overview.htm.
Agency for Healthcare Research and Quality (AHRQ). (2007a). Prevention quality indicators. Available at: www.qualityindicators.ahrq.gov/downloads/pqi/pqi_comparative_v31.pdf.
Agency for Healthcare Research and Quality (AHRQ). (2007b). Pediatric quality indicators. Available at: www.qualityindicators.ahrq.gov/downloads/pdi/pdi_area_comparative_v31.pdf.
Allegretto SA. (2005) Basic family budgets: Working families’ incomes often fail to meet living expenses around the US. Economic Policy Institute. Briefing Paper No. 165. Available at: http://www.epi.org/publications/entry/bp165/.
American College of Physicians (ACP). (2008). Primary care provides patients with better outcomes at lower cost. Available at: http://esciencenews.com/articles/2008/11/19/primary.care.provides.patients.with.better.outcomes.lower.cost.
Antunes JL, Waldman EA. (2001). The impact of AIDS, immigration and housing overcrowding on tuberculosis death in Sao Paulo, Brazil, 1994-1998. Social Science and Medicine. 52:1071-1080.
Aronsson G, Gustafsson K, Dallner M. (2000). Sick but yet at work: An empirical study of sickness and presenteeism. Journal of Epidemiology and Community Health. 54:502-509.
Berkman LF. (1995). The role of social relations in health promotion. Psychosomatic Medicine. 57:245-254.
Bell DM, Gleiber DW, Atkins-Mercer A et al. (1989). Illness associated with child day care: A study of incidence and cost. American Journal of Public Health. 79: 479-484.
Bhatia R, Guzman C. (2004). The case for housing impacts assessment: The human health and social impacts of inadequate housing and their consideration in CEQA policy and practice. San Francisco, CA: San Francisco Department of Public Health. Available at: http://www.sfphes.org.
Billings J, Anderson GM, Newman LS. (1996). Recent findings on preventable hospitalizations. Health Affairs. 15:239-49.
BLS (U.S Bureau of Labor Statistics). (2006). Employment characteristics of families in 2005. Washington, D.C.: U.S. Department of Labor. Available at: http://www.bls.gov/news.release/pdf/famee.pdf.
Bond JT, Thompson C, Galinksy E, Prottas D. (2002). The national study of the changing workforce. New York: Families and Work Institute.
Boots SW, Martinson K, Danziger A. (2009). Employers’ perspectives on San Francisco’s paid sick leave policy. Washington, D.C.: Urban Institute. Available at http://www.urban.org/publications/411868.htm
Health Impact Assessment of the Healthy Families Act of 2009
-47-
Calderon-Margalit, R, et al. (2005). A large-scale gastroenteritis outbreak associated with Norovirus in nursing homes. Epidemiol Infect. 133(1):35-40.
Capozza K, Graham-Squire D. (2008). Unpublished Results. Center for Research on Labor and Employment, University of California Berkeley.
CBP (California Budget Project). (2007). Making ends meet: How much does it cost to raise a family in California. Sacramento, CA: California Budget Project. Available at: http://www.cbp.org/pdfs/2005/0509mem.pdf.
CDC (Centers for Disease Control and Prevention). (2008a). U.S. key facts about seasonal flu. Available at: http://www.cdc.gov/flu/keyfacts.htm.
CDC (Centers for Disease Control and Prevention). (2008b). Preventing the spread of influenza (the flu) in child care settings: Guidance for administrators, care providers, and other staff Available at: http://www.cdc.gov/flu/professionals/infectioncontrol/childcaresettings.htm.
CDC (Centers for Disease Control and Prevention). (2006). U.S. norovirus technical fact sheet. Available at: http://www.cdc.gov/ncidod/dvrd/revb/gastro/norovirus-factsheet.htm.
CDHS (California Department of Health Services). (2006). Recommendations for the prevention and control of viral gastroenteritis outbreaks in California long-term care facilities. Richmond, CA: California Department of Health Services.
CDPH (California Department of Public Health) / Surveillance & Statistics Section. (2008). Available at: http://www.cdph.ca.gov/data/statistics/Pages/CD_Tables.aspx.
Childstats.gov. (2008). Forum on child and family statistics. Available at: http://www.childstats.gov/americaschildren/index.asp.
Center for Law and Social Policy (CLASP). (2006). Paid sick days legislation: A legislator’s guide. Available at http://74.125.93.132/search?q=cache:EA5AiJ8Y2kIJ:www.clasp.org/publications/paid_sick_days.pdf+paid+sick+days+benefits,+definition&cd=1&hl=en&ct=clnk&gl=us.
Chung PJ, Garfield CF, Elliott MN, Carey C, Eriksson C, Schuster MA. (2007). Need for and use of family leave among parents of children with special health care needs. Pediatrics 119(5):e1047-55.
Clemans-Cope L, Perry CD, Kenney GM, Pelletier JE, Pantell M. (2007). Access to and use of paid sick leave among low-income families with children. Washington, D.C.: Urban Institute.
Copeland KA, Harris EN Wag NY, Cheng Tl. (2006). Compliance with American Academy of Pediatrics and American Public Health Association illness exclusion guidelines for child care centers in Maryland: Who follows them and when. Paediatrics. 118:1369-1380.
Dahl IL, Grufman M, Hellberg C, Krabbe M. (1991). Absenteeism because of illness at daycare centers and in three-family systems. Acta Paediatr Scand. 80:436.
Davis K, Colins SR, Doty MM, Ho A, Holmgren AL. (2005). Health and productivity among U.S. workers. Washington D.C.: The Commonwealth Fund. Available at: http://www.commonwealthfund.org/publications/publications_show.htm?doc_id=294176
Health Impact Assessment of the Healthy Families Act of 2009
-48-
DOL (Department of Labor). (2000). FMLA survey. Available at: http://www.dol.gov/esa/whd/fmla/foreword.htm.
DOL (Department of Labor). (2008). Family and Medical Leave Act. Available at: http://www.dol.gov/dol/topic/benefits-leave/fmla.htm.
Dunn, James R. (2002) A population health approach to housing: A framework for research. Report prepared for the National Housing research Committee and the Canada Mortgage and Housing Committee. University of Calgary.
Earle A, Heymann SJ. (2002). What causes job loss among former welfare recipients? The role of family health problems. Journal of the American Medical Women’s Association. 57:5-10.
Earle A, Ayanian JZ, Heymann SJ. (2006). What predicts women’s ability to return to work after newly diagnosed coronary heart disease: Findings on the importance of paid leave. Journal of Women's Health. 15(4):430-441.
Ferguson NM, Cummings DA, Fraser C, Cajka JC, Cooley PC, Burke DS. (2006). Strategies for mitigating an influenza pandemic. Nature. 442:448-52.
Ferrie JE, Shipley MJ, Newman K, Stansfeld SA, Marmot M. (2005). Self-reported job insecurity and health in the Whitehall II study: Potential explanations of the relationship. Social Science & Medicine. 60:1593-1602.
Fiore A. (2004). Hepatitis A transmitted by food. Clinical Infectious Diseases. 38:705-15.
Germann TC, Kadau K, Longini IM Jr, Macken CA. (2006). Mitigation strategies for pandemic influenza in the United States. Proc Natl Acad Sci USA. 103:5935-40.
Glass RJ, Glass LM, Beyeler WE, Min HJ. (2006). Targeted social distancing design for pandemic influenza. Emerg Infect Dis. 12:1671-81.
Gleason RP, Kneipp SM. (2004). Employment related constraints: Determinants of primary health care access? Policy, Politics, and Nursing Practice. 5:73-83.
Gorkin L, Schron EB, Brooks MM, Wiklund I, Kellen J, Verter J, Schoenberger JA, Pawitan Y, Morris M, Shumaker S. (1993). Psychosocial predictors of mortality in the Cardiac Arrhythmia Suppression Trial-1 (CAST-1). American Journal of Cardiology. 71:263-267.
Guzewich J, Ross M. (1999). Evaluation of risks related to microbiological contamination of ready-to-eat food by food preparation workers and the effectiveness of interventions to minimize those risks. Washington, D.C: Food and Drug Administration. Available at: http://www.cfsan.fda.gov/~ear/rterisk.html.
Halloran ME, Ferguson NM, Eubank S, Longini IM Jr, Cummings DA, Lewis B, Xu S, Fraser C, Vullikanti A, Germann TC, Wagener D, Beckman R, Kadau K, Barrett C, Macken CA, Burke DS, Cooley P. (2008). Modeling targeted layered containment of an influenza pandemic in the United States. Proc Natl Acad Sci USA. 105:4639-44.
Hartmann HI. (2007). The Healthy Families Act: Impacts on workers, businesses, the economy, and public health. Testimony before the U.S. Senate Committee on Health, Education, Labor,
Health Impact Assessment of the Healthy Families Act of 2009
-49-
and Pensions; February 13, 2007; Washington D.C. Available at: http://help.senate.gov/Hearings/2007_02_13/2007_02_13.html.
Heymann J. (2007b). The Healthy Families Act: The importance to Americans’ livelihoods, families, and health. Testimony to the U.S. Senate Health Education Labor and Pensions Committee. February 13, 2007; Washington D.C.
Heymann J. (2000). The widening gap: Why America’s working families are in jeopardy and what can be done about it. New York, NY: Basic Books.
Heymann J, Earle A, Hayes J. (2007a). The work, family, and equity index: How does the United States measure up? Boston/Montreal: Project on Global Working Families. Available at: http://www.mcgill.ca/files/ihsp/WFEIFinal2007.pdf.
Heymann SJ, Earle A, Egleston B. (1996). Parental availability for the care of sick children. Pediatrics. 98:226-30.
Heymann SJ, Earle A. (1999). The impact of welfare reform on parents' ability to care for their children's health. American Journal of Public Health. 89(4):502-5.
Heymann SJ, Toomey S, Furstenberg F. (1999b). Working parents: what factors are involved in their ability to take time off from work when their children are sick? Arch Pediatrics and Adolescent Medicine. 153:870-4.
Institute of Medicine (IOM). 1996. Primary care America's health in a new era. Washington D.C.: National Academic Press. Available at: http://uclibs.org/PID/103619
Jin RL, Shah CP, Svoboda TJ. (1995). The impact of unemployment on health: a review of the evidence. The Journal of the Canadian Medical Association. 153:529–540.
Jones TF, Angulo FJ. (2006). Eating in restaurants: a risk factor for foodborne disease? Clinical Infectious Diseases. 43:1324-8.
Kneipp SM. (2002). The relationships among employment, paid sick leave, and difficulty obtaining health care of single mothers with young children. Policy, Politics & Nursing Practice. 3:20-30.
JCHS (Joint Center for Housing Studies). (2003). State of the Nation’s Housing. Cambridge, MA: Harvard University. Available at: http://www.jchs.harvard.edu/publications/markets/son2008/index.htm.
Li JH, Birkhead GS, Strogatz DS, Coles FB. (1996). Impact of institution size, staffing patterns, and infection control practices on communicable disease outbreaks in New York State nursing homes. American Journal of Epidemiology. 143:1042-9.
Longini, IM, Koopman JS, Haber M, Cotsonis GA. (1988). Statistical inference for infectious diseases: Risk-specific household and community transmission parameters. American Journal of Epidemiology. 128:845 – 859.
Lovell V. (2004). No time to be sick: Why everyone suffers when workers don’t have paid sick days. Washington D.C.: Institute for Women’s Policy Research. Available at: www.iwpr.org/pdf/B242.pdf.
Health Impact Assessment of the Healthy Families Act of 2009
-50-
Lovell V. (2005). Valuing good health: An estimate of costs and savings for the Healthy Families Act. Washington, D.C.: Institute for Women’s Policy Research. Available at: http://www.iwpr.org/pdf/B248.pdf.
Lovell V. (2008). Valuing good health in California: The costs and benefits of the Healthy Families, Healthy Workplaces Act of 2008. Washington D.C.: Institute for Women’s Policy Research. Available at: http://www.paidsickdaysca.org/pdf/IWPR_CA_report.pdf.
Lovell V. (2009). Valuing good health in Illinois: The costs and benefits of paid sick days. Washington D.C.: Institute for Women’s Policy Research. Available at: http://www.iwpr.org/pdf/B270Ill.pdf.
Marmot M, Wilkinson RG. (eds) (2006). Social Determinants of Health. 2nd Edition. Oxford: Oxford University Press.
Mead PS, Slutsker L, Dietz V, McCaig LF, Bresee JS, Shapiro C, Griffin PM, Tauxe RV. (1999). Food-related illness and death in the United States. Emerg Infect Dis. 5:605-625.
McEwen BS. (2006). Protective and damaging effects of stress mediators: central role of the brain. Dialogues Clinical Neurosciences. 8:367-81.
McKee-Ryan F, Song Z, Wanberg CR, Kinicki AJ. (2005). Psychological and physical well-being during unemployment: a meta-analytic study. J Appl Psychol. 90:53-76.
MMWR (Morbidity and Mortality Weekly Report). (2006). Multisite outbreak of norovirus associated with a franchise restaurant—Kent County, Michigan, May 2005. MMWR Morb Mortal Wkly Rep, 2006. 55(14):395-7.
MMWR (Morbidity and Mortality Weekly Report). (2007). Norovirus outbreak associated with ill food-service workers—Michigan, January–February 2006. MMWR Morb Mortal Wkly Rep, 2007. 56(46):1212-6.
Mottonen M. Uhari M. (1992). Absences for sickness among children in day care. Acta Paediatr. 81:929.
Newacheck PW, Stoddard JJ, Hughes DC, Pearl M. (1998). Health insurance and access to primary care for children. New England Journal of Medicine. 338:513-9.
NICHHD (National Institute of Child Health and Human Development) Early Child Care Research Network. (2001). Child care and common communicable illnesses: results from the National Institute of Child Health and Human Development Study of Early Child Care. Arch Pediatrics Adolescent Medicine. 155:481-8.
OSHA (Occupational and Health Safety Administration). (2007). Guidance on preparing workplaces for an influenza pandemic. Available at www.osha.gov/Publications/influenza_pandemic.html.
OSHPD (Office of Statewide Health Planning and Development). (2006). Data Products. Available at: http://www.oshpd.ca.gov/HID/DataFlow/HospData.html.
Palmer SJ. (1993). Care of sick children by parents: A meaningful role. Journal Advances in Nursing. 18:185.
Health Impact Assessment of the Healthy Families Act of 2009
-51-
Parker JP, Simon V, Parham C, Teague J, li Z. (2005). Preventable hospitalization in California: statewide and county trends (1997-2003). Sacramento, CA: Office of Statewide Health Planning and Development.
Pimoff and Hamilton (1995). The time and monetary costs of outpatient care for children. The American Economic Review. 85:117-121.
Poehling KA, Edwards KM, Weinberg GA, Szilagyi P, Staat MA, Iwane MK., et al. (2006). The underrecognized burden of influenza in young children. N Engl J Med. 355(1):31-40.
Quigley R, den Broeder L, Furu P, Bond A, Cave B, Bos R. (2006). Health Impact Assessment. International Best Practice Principles. Special Publication Series No. 5. Fargo, North Dakota: International Association of Impact Assessment. Available at: http://www.iaia.org/modx/index.php?id=74.
Sandel M, Sharfstein J, Shaw R. (1999). There’s no place like home: How America’s housing crisis threatens our children. San Francisco, CA: Housing America.
Schuster MA, Chung PJ, Elliott MN, Garfield CF, Vestal KD, Klein DJ. 2009. Perceived effects of leave from work and the role of paid leave among parents of children with special health care needs. American Journal of Public Health. 99(4): 698-705.
Seeman TE. (2000). Health promoting effects of friends and family on health outcomes in older adults. American Journal of Health Promotion. 14:362-370.
SFDPH (San Francisco Department of Public Health). (2004). The case for housing impacts assessment: The human health and social impacts of inadequate housing and their consideration in CEQA policy and practice. San Francisco, CA: San Francisco Department of Public Health.
Smith T. (2008). Paid sick days: A basic labor standard for the 21st century. Chicago, IL: National Opinion Research Center, University of Chicago. Available at http://news.uchicago.edu/news.php?asset_id=1433.
Sorlie PD, Backlund E, Keller JB. (1995). US mortality by economic, demographic, and social characteristics: the National Longitudinal Mortality Study. American Journal of Public Health. 85:949-56.
Taylor M, O’Connor P. (1989). Resident parents and shorter hospital stay. Archives of Disease in Childhood. 64: 274-276.
Thompson WW, Shay D., Weintraub E, Brammer L, Bridges CB, Cox NJ, et al. (2004). Influenza-associated hospitalizations in the United States. JAMA. 292(11):1333-1340.
Trust for America’s Health (TFAH). (2007). Pandemic flu and the potential for U.S. economic recession: A state-by-state analysis. Available at healthyamericans.org/reports/flurecession/.
Tsouna-Hadjis E, Vemmos KN, Zakopoulos N, Stamatelopoulos S. (2000). First-stroke recovery process: The role of family support. Archives of Physical Medicine and Rehabilitation. 81:881-887.
USDHHS (U.S. Department of Health and Human Services). (2007). U.S. community strategy for pandemic influenza mitigation. Washington D.C.: U.S. Department of Health and Human Services. Available at: http://www.pandemicflu.gov/plan/community/commitigation.html#V.
Health Impact Assessment of the Healthy Families Act of 2009
-52-
Voss M, Nylén L, Floderus M, Diderichsen F, Terry P. (2004). Unemployment and early cause-specific mortality: A study based on the Swedish twin registry. American Journal of Public Health. 94(12):2155-2161.
Wald ER, Guerra N, Byers C. (1991). Frequency and severity of infections in day care: three-year follow-up. Journal of Pediatrics. 118:509-14.
Wang Q. (2005). Disability and American Families: 2000. Washington, D.C.: U.S. Census Bureau. Available at: http://www.census.gov/prod/2005pubs/censr-23.pdf.
Widdowson MA, Sulka A, Bulens SN, Beard RS, Chaves SS, Hammond R, Salehi EDP. Swanson E, Totaro J, Woron R, Mead PS, Bresee JS, Monroe SS, Glass RI. (2005). Norovirus and foodborne disease, United States, 1991-2000. Emerg Infect Dis. 11:95-102.
WDHS (Wisconsin Department of Health Services). (2009) Data provided to 9to5 Milwaukee by email.
WHO (World Health Organization). (1999). Gothenburg Consensus Paper. Health impact assessment: main concepts and suggested approach. Brussels: European Centre for Health Policy, World Health Organization Regional Office for Europe. Available at: http://www.euro.who.int/document/PAE/Gothenburgpaper.pdf.
Wu JT, Riley S, Fraser C, Leung GM. (2006). Reducing the impact of the next influenza pandemic using household-based public health interventions. PLoS Med. Sep;3(9):e361.
Yen IH and Syme SL. (1999). The Social Environment and Health: A Discussion of the Epidemiologic Literature. Annual Review of Public Health. 20:287-308.
Zima BT, Wells KB, Freeman HE. (1994). Emotional and behavioral problems and severe academic delays among sheltered homeless children in Los Angeles County. American Journal of Public Health. 84:260-264.

Health Impact Assessment of the Healthy Families Act of 2009
-53-
Appendix I. National Health Interview Survey: Research Methods And Findings
In this appendix, we summarize the methods and findings of our analysis of the 2007 National Health Interview Survey (NHIS) data. The purpose of the analysis was to assess associations between availability of paid sick days and the following health and health care outcomes, cognizant of the limits of the data set and cross-sectional methodology:
• Recovery from illness among workers;
• Primary care utilization among workers;
• Avoidable hospital use among workers;
• Avoidable emergency room use among workers; and
• Delayed medical care for dependents of workers.
Explanation and rationale for the above is provided in the scoping section of the main HIA report.
METHODS
Study Population
NHIS is an annual cross-sectional household interview survey conducted by the Centers for Disease Control and Prevention (CDC) to monitor the health of the civilian and non-institutional population in the United States on a broad range of health topics.
The CDC collects NHIS data through a complex sample design involving stratification, clustering, and multistage sampling. Blacks, Hispanics, and Asians were over-sampled in the 2007 NHIS. The probabilities of selection, along with nine adjustments for non-response and post-stratification, were reflected in the sample weights, one of which was to be used as appropriate in analysis to generate estimates generalizable to the U.S. population. The NHIS data files have a nested structure with the Household file as the base file from which all other files are built. The Family-Level file, which also served as a sampling frame for individual-level samples, contains variables that describe characteristics of the 29,915 families living in households. From each family in NHIS, one sample adult and one sample child (if any children under age 18 are present) were randomly selected; the Sample Adult file (N=23,393) had data collected on adults, and the Person-level file on all individuals, both adults and children (N=75,764). For this analysis, we selected variables from three linked NHIS data files—Family, Person, and Sample Adult.
Because our interest was in the health effects of an employment benefit, we selected a subset of the adult sample for this analysis: those aged 24 to 64 who were employed for pay at a job or business in the previous week. We excluded those who were self-employed, those working without pay at a family-owned job or business, those who were looking for work, and those who were not working and not looking for work. Based on these criteria, 12,432 individuals were included in our final sample.

Health Impact Assessment of the Healthy Families Act of 2009
-54-
Measures
Availability of paid sick days was the predictor of interest in this analysis. As stated above, the primary outcome variables of interest included: recovery from illness among workers, primary care utilization among workers, avoidable hospital use among workers, avoidable emergency room use among workers, and delayed medical care for dependents of workers.
We selected variables from the 2007 NHIS data as proxies for outcomes of interest (Table A1). For “recovery from illness”, we used the NHIS variables “number of missed work days due to illness and “number of days spent in bed” as proxies. For primary care utilization, we identified NHIS variables for contact visits with four types of health care practitioners in the past year (i.e., general practitioner, specialist, nurse practitioner, ob/gyn) and created a composite variable for “any medical visit in the past year” to reflect the variable of interest. For “avoidable hospital use”, we did not identify a suitable proxy variable. The variable that recorded an overnight hospital stay was a family level variable and also did not allow for disaggregation by admitting or discharge diagnosis. We selected the NHIS variable of “emergency room visit in the past 12 months” as a proxy for avoidable emergency room visits, recognizing that many ER visits are not avoidable. Finally, for “delayed medical care for dependents”, we used two NHIS variables as proxies “any family member who had delayed medical care” and “any family member who had received no medical care.”
TABLE A1. OUTCOMES IN OUR ANALYSIS AND NHIS VARIABLES USED AS PROXIES
Outcome Proxy
Number of missed work days due to illness Recovery from illness
Number of days spent in bed
Primary care utilization Medical visit to any of the medical practitioners listed in Table 2
Avoidable hospital use No available variable
Avoidable emergency room visit Emergency room use in the past 12 months
Any family member who had delayed medical care Delayed medical care for dependents Any family member who had received no medical care
We selected predictor variables based on available literature on the above outcomes or assumed relationships to paid sick days. This included age, gender, race/ethnicity, marital status, educational achievement, household income, employer-type, health insurance, chronic health conditions, and self-rated health status.
Variables for paid sick days, age, gender, marital status, chronic conditions, medical visits, the number of missed work days, the number of days spent in bed due to sickness, and employer-type were extracted from the Sample Adult file; those for race, education, health insurance, and self-rated health status from the Person file; and those for household income, any family member who had delayed or not received medical care, and number of dependents from the Family file. To merge the Sample Adult and the Person files, household serial number, family number, and person number were used. To merge the thus created person-level file with the Family file, household serial number and family number were used.
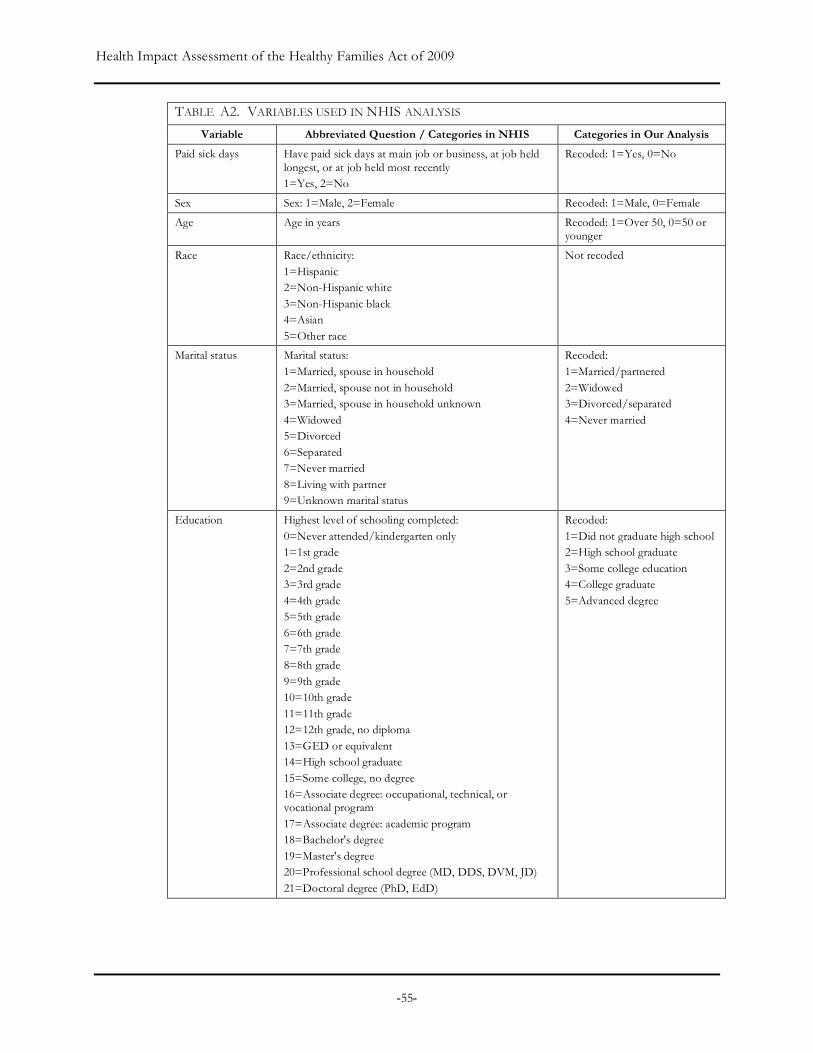
Health Impact Assessment of the Healthy Families Act of 2009
-55-
TABLE A2. VARIABLES USED IN NHIS ANALYSIS
Variable Abbreviated Question / Categories in NHIS Categories in Our Analysis
Paid sick days Have paid sick days at main job or business, at job held longest, or at job held most recently 1=Yes, 2=No
Recoded: 1=Yes, 0=No
Sex Sex: 1=Male, 2=Female Recoded: 1=Male, 0=Female
Age Age in years Recoded: 1=Over 50, 0=50 or younger
Race Race/ethnicity: 1=Hispanic 2=Non-Hispanic white 3=Non-Hispanic black 4=Asian 5=Other race
Not recoded
Marital status Marital status: 1=Married, spouse in household 2=Married, spouse not in household 3=Married, spouse in household unknown 4=Widowed 5=Divorced 6=Separated 7=Never married 8=Living with partner 9=Unknown marital status
Recoded: 1=Married/partnered 2=Widowed 3=Divorced/separated 4=Never married
Education Highest level of schooling completed: 0=Never attended/kindergarten only 1=1st grade 2=2nd grade 3=3rd grade 4=4th grade 5=5th grade 6=6th grade 7=7th grade 8=8th grade 9=9th grade 10=10th grade 11=11th grade 12=12th grade, no diploma 13=GED or equivalent 14=High school graduate 15=Some college, no degree 16=Associate degree: occupational, technical, or vocational program 17=Associate degree: academic program 18=Bachelor's degree 19=Master's degree 20=Professional school degree (MD, DDS, DVM, JD) 21=Doctoral degree (PhD, EdD)
Recoded: 1=Did not graduate high school 2=High school graduate 3=Some college education 4=College graduate 5=Advanced degree
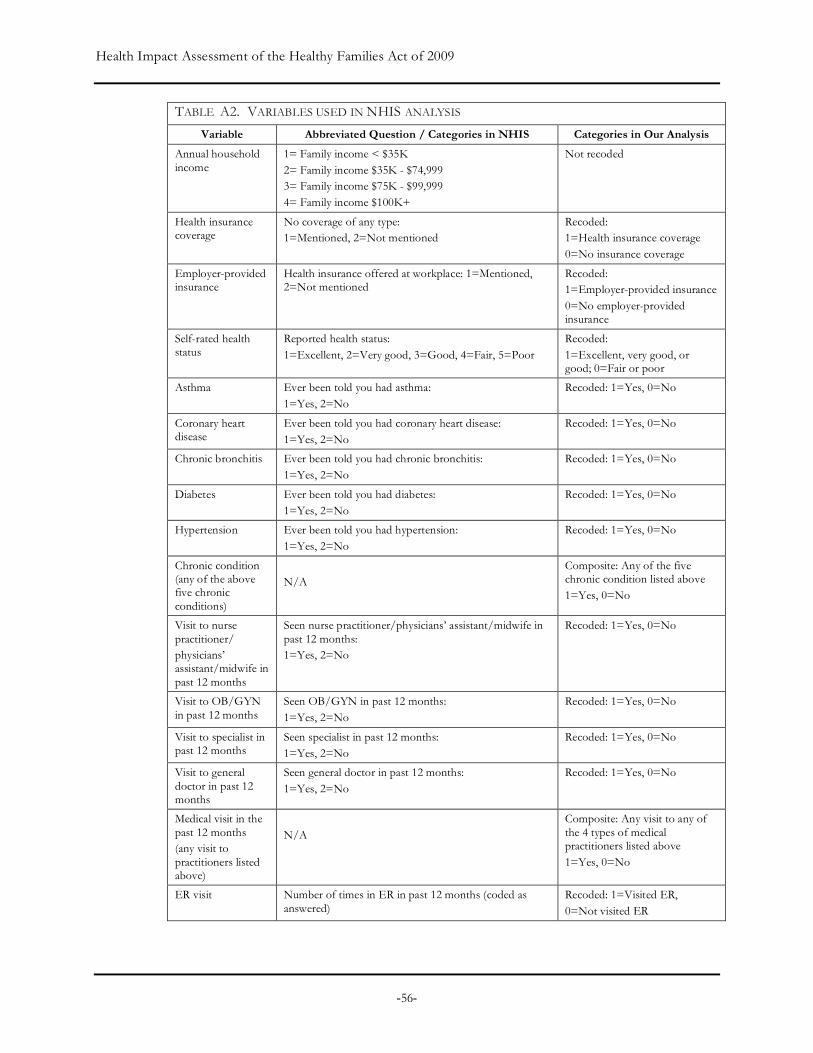
Health Impact Assessment of the Healthy Families Act of 2009
-56-
TABLE A2. VARIABLES USED IN NHIS ANALYSIS
Variable Abbreviated Question / Categories in NHIS Categories in Our Analysis
Annual household income
1= Family income < $35K 2= Family income $35K - $74,999 3= Family income $75K - $99,999 4= Family income $100K+
Not recoded
Health insurance coverage
No coverage of any type: 1=Mentioned, 2=Not mentioned
Recoded: 1=Health insurance coverage 0=No insurance coverage
Employer-provided insurance
Health insurance offered at workplace: 1=Mentioned, 2=Not mentioned
Recoded: 1=Employer-provided insurance 0=No employer-provided insurance
Self-rated health status
Reported health status: 1=Excellent, 2=Very good, 3=Good, 4=Fair, 5=Poor
Recoded: 1=Excellent, very good, or good; 0=Fair or poor
Asthma Ever been told you had asthma: 1=Yes, 2=No
Recoded: 1=Yes, 0=No
Coronary heart disease
Ever been told you had coronary heart disease: 1=Yes, 2=No
Recoded: 1=Yes, 0=No
Chronic bronchitis Ever been told you had chronic bronchitis: 1=Yes, 2=No
Recoded: 1=Yes, 0=No
Diabetes Ever been told you had diabetes: 1=Yes, 2=No
Recoded: 1=Yes, 0=No
Hypertension Ever been told you had hypertension: 1=Yes, 2=No
Recoded: 1=Yes, 0=No
Chronic condition (any of the above five chronic conditions)
N/A
Composite: Any of the five chronic condition listed above 1=Yes, 0=No
Visit to nurse practitioner/ physicians’ assistant/midwife in past 12 months
Seen nurse practitioner/physicians’ assistant/midwife in past 12 months: 1=Yes, 2=No
Recoded: 1=Yes, 0=No
Visit to OB/GYN in past 12 months
Seen OB/GYN in past 12 months: 1=Yes, 2=No
Recoded: 1=Yes, 0=No
Visit to specialist in past 12 months
Seen specialist in past 12 months: 1=Yes, 2=No
Recoded: 1=Yes, 0=No
Visit to general doctor in past 12 months
Seen general doctor in past 12 months: 1=Yes, 2=No
Recoded: 1=Yes, 0=No
Medical visit in the past 12 months (any visit to practitioners listed above)
N/A
Composite: Any visit to any of the 4 types of medical practitioners listed above 1=Yes, 0=No
ER visit Number of times in ER in past 12 months (coded as answered)
Recoded: 1=Visited ER, 0=Not visited ER

Health Impact Assessment of the Healthy Families Act of 2009
-57-
TABLE A2. VARIABLES USED IN NHIS ANALYSIS
Variable Abbreviated Question / Categories in NHIS Categories in Our Analysis
Delayed care for family
Number of family members for whom medical care was delayed in past 12 months (coded as answered)
Recoded: 1: One or more family member 0: None
No care for family Number of family members who needed and did not get medical care in past 12 months
Recoded: 1: One or more family member 0: None
Delayed/no care for family
N/A Composite: One or more family member who had received delayed or no care
Number of work loss days
Number of missed workdays due to illness or injury, not including maternity leave, in past 12 months
Not recoded
Number of days in bed due to illness
Number of days in bed due to illness or injury, including days in hospital, in past 12 months
Not recoded
Employer type In current job, job held the longest, job held most recently: 1=Employee of private company 2=Federal government employee 3=State government employee 4=Local government employee 5=Self-employed in own business 6=Working without pay in family-owned business
Recoded: 1=Private employer 2=Government employer 3=Other
All NHIS variables we used in this study are listed in Table A2. In some cases, we recoded variables to produce fewer categories or to produce empirically or theoretically more meaningful categories for analysis. In multivariate analyses, indicator (i.e., dummy) variables for categorical variables—each of which is a binary variable with values of 1 (indicating yes to the category) and 0 (no)—were used. All chronic conditions presumably were doctor-diagnosed, measured by responses to questions, “Have you ever been told you had…..?” There was only one continuous predictor, age, among the variables we selected for our analysis. Where possible, we explored the inclusion of variables (e.g., age) as both continuous and categorical variables.
Analysis
All analysis was conducted using STATA (version 10.0) and its survey estimation procedure. With the exception of univariate analysis to learn about the sample characteristics, all analysis was conducted with a weighted sample using NHIS’s Final Sample Adult Weight that includes all design, ratio, non-response and post-stratification adjustments.
We conducted the following analyses:
• a univariate analysis, using both the unweighted and weighted sample, to examine sample characteristics and estimated population characteristics (Table A3);
• a series of bivariate analyses to explore the relationship between paid sick days and population characteristics (Table A4);
• a series of bivariate analysis to explore the relationship between paid sick days and outcome variables including recovery from illness (Table A5), delayed care for dependents (Tables A6-A8), emergency room visits and medical visits (Table A10);
Health Impact Assessment of the Healthy Families Act of 2009
-58-
• analyses evaluating the association between paid sick days and emergency room visits (Table A9) and between paid sick days and medical visits (Tables A11) stratified on potential covariates;
• multivariate analyses of the relationship between paid sick days and medical visits in the past year (Table A12).
We chose to focus multivariate analysis on the outcome “medical visit” given the time limitations of this project and the relative specificity of the variable for the outcome of interest. While other relationships could have benefited from further multivariate analyses, time constraints prevented us from doing this.
The following describes our incremental approach to developing the model for medical visits: Model 1 is the base model including only paid sick days (PSD), the predictor of interest. Model 2 includes PSD, gender and age. In Model 3, we added demonstrated social determinants of health—race, annual household income, and education. Model 4 adds health insurance variables. Finally, in Model 5, we added variables capturing health status and chronic health conditions. During this process, covariates with p-values of .20 or smaller in the preceding model were included in subsequent models. Model 5, the full main effects model, included PSD, gender, age over 50, indicator variables for race with p-values of .20 or smaller in an earlier model (i.e., Hispanic and Asian), college education (with those who did not receive college or higher education as baseline), household income of $75,000 or higher (with those whose household earned less than $75,000 as baseline), health insurance coverage, self-rated health status, and chronic health condition. Results of analysis using all five models are discussed below.
We also tested for interaction between PSD and each of the other covariates by adding interaction terms, one at a time, to the full main effects model. Specifically, we tested multiplicative interactions between PSD and age, gender, income, education, ethnicity, health insurance, self rated health, and chronic disease conditions.
FINDINGS
Sample Characteristics
Table A3 describes both weighted and unweighted frequency distributions for both predictor and response variables in the study sample.
About 49.7% of the participants were male and the rest (50.3%) were female. The mean age of the respondents was 42.2 with a standard deviation of 10.9. The majority of the sample identified themselves as White (59.6%), while 18.7% identified as Hispanic, 15.4% as black, 5.5% as Asian, and 0.9% as some other race. Over half (58.1%) of respondents reported being married or living with partner, 18.9% were divorced or separated, 21.0% had never been married, and a small minority (2.1%) reported being widowed. Only 12.2% had not graduated from high school, 25.5% had a high school diploma, 28.7% had received some college education, 22.2% had a college degree, and 11.5% a graduate degree. With respect to income, 29.5% of respondents had a total combined family income of less than $35,000, 38% reported an income of $35,000-$74,999, and 32.8% reported an income of $75,000 or higher.
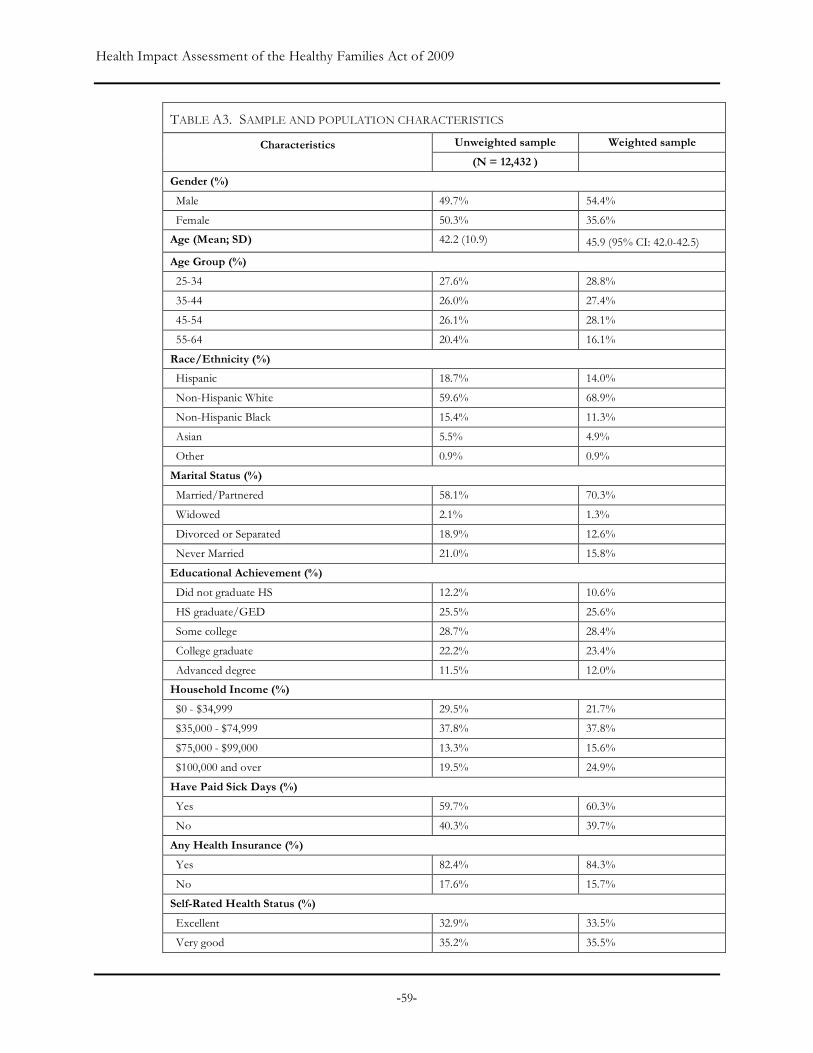
Health Impact Assessment of the Healthy Families Act of 2009
-59-
TABLE A3. SAMPLE AND POPULATION CHARACTERISTICS
Unweighted sample Weighted sample Characteristics (N = 12,432 )
Gender (%)
Male 49.7% 54.4%
Female 50.3% 35.6%
Age (Mean; SD) 42.2 (10.9) 45.9 (95% CI: 42.0-42.5)
Age Group (%)
25-34 27.6% 28.8%
35-44 26.0% 27.4%
45-54 26.1% 28.1%
55-64 20.4% 16.1%
Race/Ethnicity (%)
Hispanic 18.7% 14.0%
Non-Hispanic White 59.6% 68.9%
Non-Hispanic Black 15.4% 11.3%
Asian 5.5% 4.9%
Other 0.9% 0.9%
Marital Status (%)
Married/Partnered 58.1% 70.3%
Widowed 2.1% 1.3%
Divorced or Separated 18.9% 12.6%
Never Married 21.0% 15.8%
Educational Achievement (%)
Did not graduate HS 12.2% 10.6%
HS graduate/GED 25.5% 25.6%
Some college 28.7% 28.4%
College graduate 22.2% 23.4%
Advanced degree 11.5% 12.0%
Household Income (%)
$0 - $34,999 29.5% 21.7%
$35,000 - $74,999 37.8% 37.8%
$75,000 - $99,000 13.3% 15.6%
$100,000 and over 19.5% 24.9%
Have Paid Sick Days (%)
Yes 59.7% 60.3%
No 40.3% 39.7%
Any Health Insurance (%)
Yes 82.4% 84.3%
No 17.6% 15.7%
Self-Rated Health Status (%)
Excellent 32.9% 33.5%
Very good 35.2% 35.5%
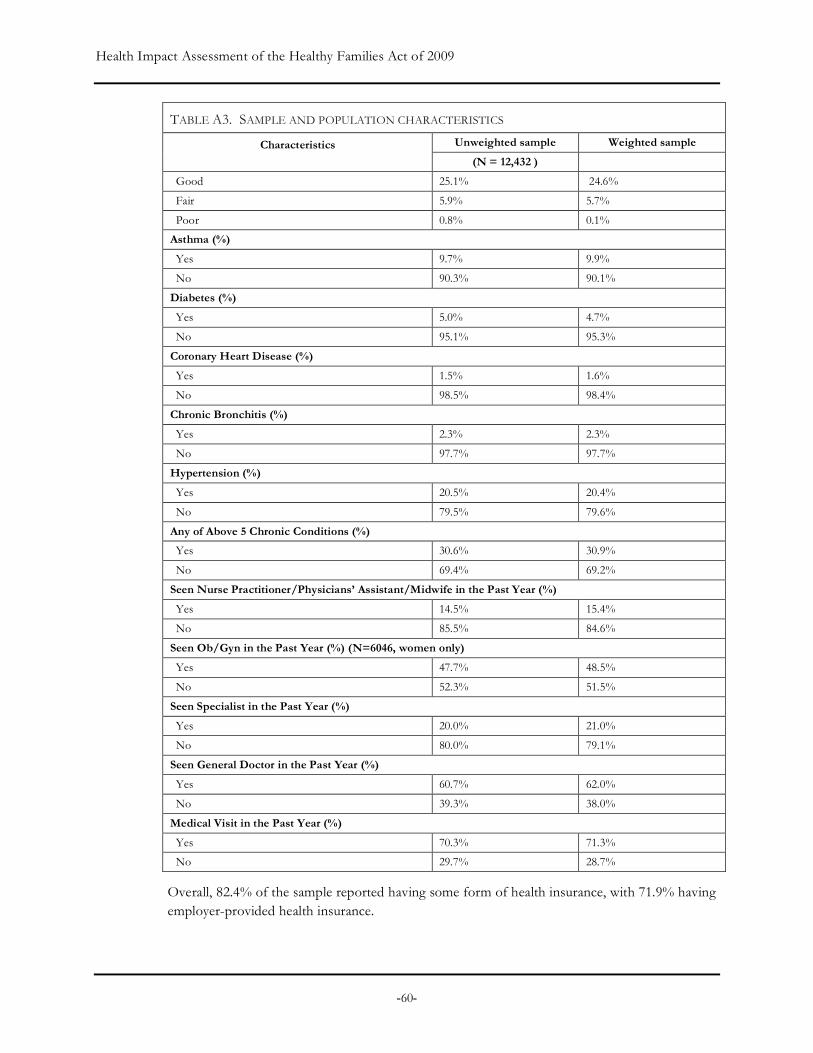
Health Impact Assessment of the Healthy Families Act of 2009
-60-
TABLE A3. SAMPLE AND POPULATION CHARACTERISTICS
Unweighted sample Weighted sample Characteristics (N = 12,432 )
Good 25.1% 24.6%
Fair 5.9% 5.7%
Poor 0.8% 0.1%
Asthma (%)
Yes 9.7% 9.9%
No 90.3% 90.1%
Diabetes (%)
Yes 5.0% 4.7%
No 95.1% 95.3%
Coronary Heart Disease (%)
Yes 1.5% 1.6%
No 98.5% 98.4%
Chronic Bronchitis (%)
Yes 2.3% 2.3%
No 97.7% 97.7%
Hypertension (%)
Yes 20.5% 20.4%
No 79.5% 79.6%
Any of Above 5 Chronic Conditions (%)
Yes 30.6% 30.9%
No 69.4% 69.2%
Seen Nurse Practitioner/Physicians’ Assistant/Midwife in the Past Year (%)
Yes 14.5% 15.4%
No 85.5% 84.6%
Seen Ob/Gyn in the Past Year (%) (N=6046, women only)
Yes 47.7% 48.5%
No 52.3% 51.5%
Seen Specialist in the Past Year (%)
Yes 20.0% 21.0%
No 80.0% 79.1%
Seen General Doctor in the Past Year (%)
Yes 60.7% 62.0%
No 39.3% 38.0%
Medical Visit in the Past Year (%)
Yes 70.3% 71.3%
No 29.7% 28.7%
Overall, 82.4% of the sample reported having some form of health insurance, with 71.9% having employer-provided health insurance.

Health Impact Assessment of the Healthy Families Act of 2009
-61-
The vast majority (93.3%) of the sample rated their health as good (25.1%), very good (35.2%), or excellent (32.9%); only a small minority (6.8%) reported having fair or poor health. However, many respondents indicated that they had chronic health conditions. Hypertension (20.5%) was most prevalent, followed by asthma (9.7%) and diabetes (5.0%); prevalence of chronic bronchitis (2.3%) and coronary heart disease (1.5%) were lowest. When all chronic diseases were combined together, 30.1% of respondents reported that they had at least one of these five chronic conditions.
As for visits to medical practitioners, 60.7% reported having seen a general doctor in the past 12 months, 14.5% reported having seen a nurse practitioner, physician’s assistant or midwife, and 20% reported having seen a specialist. Among women, close to half (47.7%) indicated that they had visited an obstetrician or gynecologist in the past year. Overall, over 70% of the sample reported having one of these types of medical visits in the past 12 months.
Relationships between Access to Paid Sick Days and Population Characteristics
Table A4 illustrates access to paid sick days by demographic, health insurance and health status characteristics. There are notable disparities in the access to paid sick days by age, education and income status. With the exception of marital status and all chronic health conditions, paid sick days had a statistically significant relationship with all other variables.
Gender and Age Men (57.9%) were less likely to have access to paid sick days than women (63.1%). While the mean age of those without paid sick days was slightly lower than that of those with paid sick days, there was no significant association between being older than 50 and having access to paid sick days.
Race/Ethnicity Hispanic workers (46.8%) were the least likely to have paid sick days as compared to non-Hispanic whites (62.4%) and non-Hispanic blacks (62.3%). The proportion of workers with paid sick days was higher for Asians (67.4%) than for any other racial/ethnic group.
Marital Status Working adults who were widowed (54.4%) were less likely to have paid sick days than those who were married or lived with partners (60.4%), who were divorced or separated (60.2%), or who had never been married (60.4%), although these differences were not statistically significant.
Education and Income The proportion of workers with paid sick days was lowest among those who did not graduate from high school (33.2%) and higher as educational achievement increased: 51.3% of workers who had graduated from high school or received a GED diploma and 61.3% of those with some college education had paid sick days, compared to 73.8% of those with a college degree and 75.6% of those with an advanced degree. Correspondingly, a similar pattern was evident by income, with only 39% of those earning less than $35,000 receiving paid sick days as compared to 59.2% of those earning $35,000 - $74,999, 70.7% of those earning between $75,000 - $99,000, and 73.1% of those earning over $100,000.
Health Insurance Coverage An overwhelming majority of working adults who had paid sick days also had health insurance (95.3%). The majority of those who did not have paid sick days had health insurance, but the proportion was much lower (68%).
Self-Rated Health Status and Chronic Health Conditions With respect to health status, 61.2% of respondents who rated their health as excellent, very good, or good had paid sick days while only
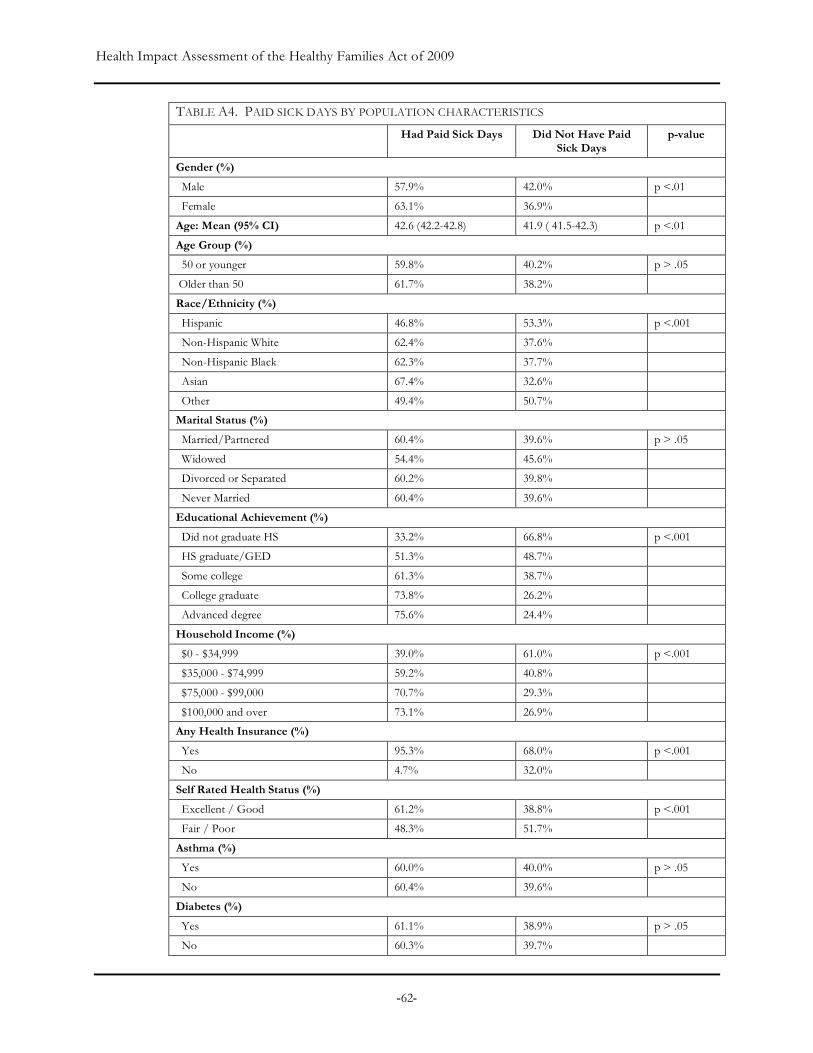
Health Impact Assessment of the Healthy Families Act of 2009
-62-
TABLE A4. PAID SICK DAYS BY POPULATION CHARACTERISTICS
Had Paid Sick Days Did Not Have Paid Sick Days
p-value
Gender (%)
Male 57.9% 42.0% p <.01
Female 63.1% 36.9%
Age: Mean (95% CI) 42.6 (42.2-42.8) 41.9 ( 41.5-42.3) p <.01
Age Group (%)
50 or younger 59.8% 40.2% p > .05
Older than 50 61.7% 38.2%
Race/Ethnicity (%)
Hispanic 46.8% 53.3% p <.001
Non-Hispanic White 62.4% 37.6%
Non-Hispanic Black 62.3% 37.7%
Asian 67.4% 32.6%
Other 49.4% 50.7%
Marital Status (%)
Married/Partnered 60.4% 39.6% p > .05
Widowed 54.4% 45.6%
Divorced or Separated 60.2% 39.8%
Never Married 60.4% 39.6%
Educational Achievement (%)
Did not graduate HS 33.2% 66.8% p <.001
HS graduate/GED 51.3% 48.7%
Some college 61.3% 38.7%
College graduate 73.8% 26.2%
Advanced degree 75.6% 24.4%
Household Income (%)
$0 - $34,999 39.0% 61.0% p <.001
$35,000 - $74,999 59.2% 40.8%
$75,000 - $99,000 70.7% 29.3%
$100,000 and over 73.1% 26.9%
Any Health Insurance (%)
Yes 95.3% 68.0% p <.001
No 4.7% 32.0%
Self Rated Health Status (%)
Excellent / Good 61.2% 38.8% p <.001
Fair / Poor 48.3% 51.7%
Asthma (%)
Yes 60.0% 40.0% p > .05
No 60.4% 39.6%
Diabetes (%)
Yes 61.1% 38.9% p > .05
No 60.3% 39.7%
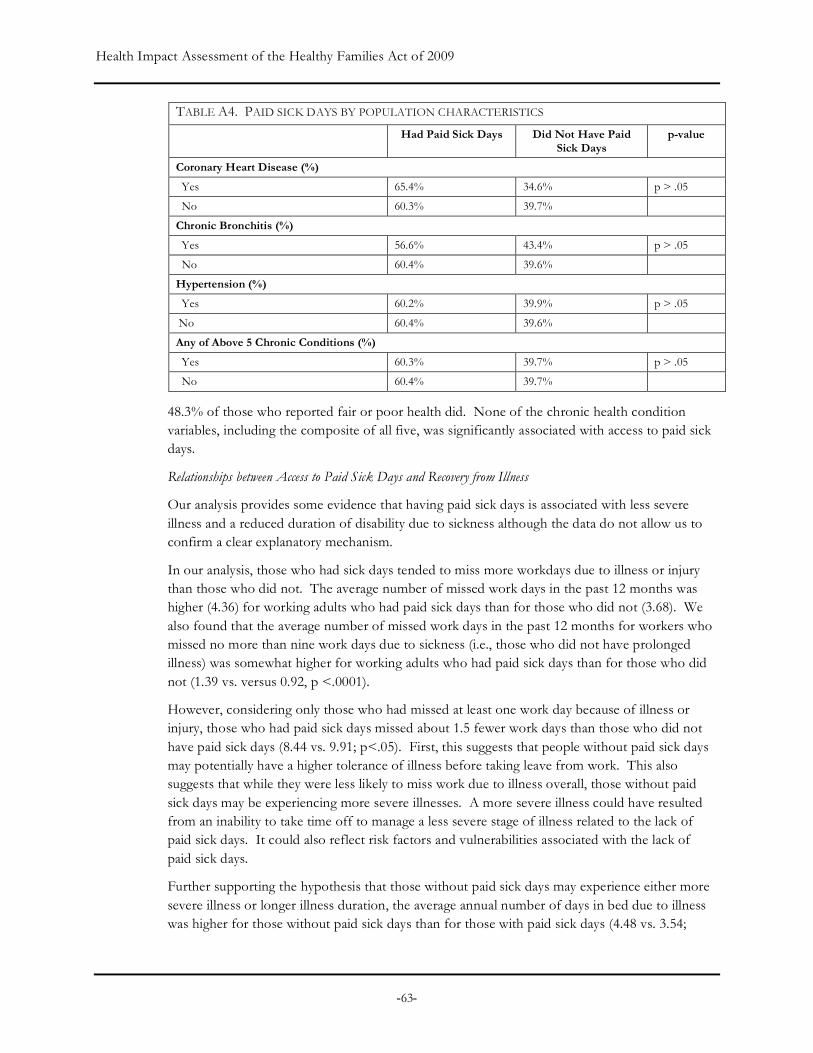
Health Impact Assessment of the Healthy Families Act of 2009
-63-
TABLE A4. PAID SICK DAYS BY POPULATION CHARACTERISTICS
Had Paid Sick Days Did Not Have Paid Sick Days
p-value
Coronary Heart Disease (%)
Yes 65.4% 34.6% p > .05
No 60.3% 39.7%
Chronic Bronchitis (%)
Yes 56.6% 43.4% p > .05
No 60.4% 39.6%
Hypertension (%)
Yes 60.2% 39.9% p > .05
No 60.4% 39.6%
Any of Above 5 Chronic Conditions (%)
Yes 60.3% 39.7% p > .05
No 60.4% 39.7%
48.3% of those who reported fair or poor health did. None of the chronic health condition variables, including the composite of all five, was significantly associated with access to paid sick days.
Relationships between Access to Paid Sick Days and Recovery from Illness
Our analysis provides some evidence that having paid sick days is associated with less severe illness and a reduced duration of disability due to sickness although the data do not allow us to confirm a clear explanatory mechanism.
In our analysis, those who had sick days tended to miss more workdays due to illness or injury than those who did not. The average number of missed work days in the past 12 months was higher (4.36) for working adults who had paid sick days than for those who did not (3.68). We also found that the average number of missed work days in the past 12 months for workers who missed no more than nine work days due to sickness (i.e., those who did not have prolonged illness) was somewhat higher for working adults who had paid sick days than for those who did not (1.39 vs. versus 0.92, p <.0001).
However, considering only those who had missed at least one work day because of illness or injury, those who had paid sick days missed about 1.5 fewer work days than those who did not have paid sick days (8.44 vs. 9.91; p<.05). First, this suggests that people without paid sick days may potentially have a higher tolerance of illness before taking leave from work. This also suggests that while they were less likely to miss work due to illness overall, those without paid sick days may be experiencing more severe illnesses. A more severe illness could have resulted from an inability to take time off to manage a less severe stage of illness related to the lack of paid sick days. It could also reflect risk factors and vulnerabilities associated with the lack of paid sick days.
Further supporting the hypothesis that those without paid sick days may experience either more severe illness or longer illness duration, the average annual number of days in bed due to illness was higher for those without paid sick days than for those with paid sick days (4.48 vs. 3.54;
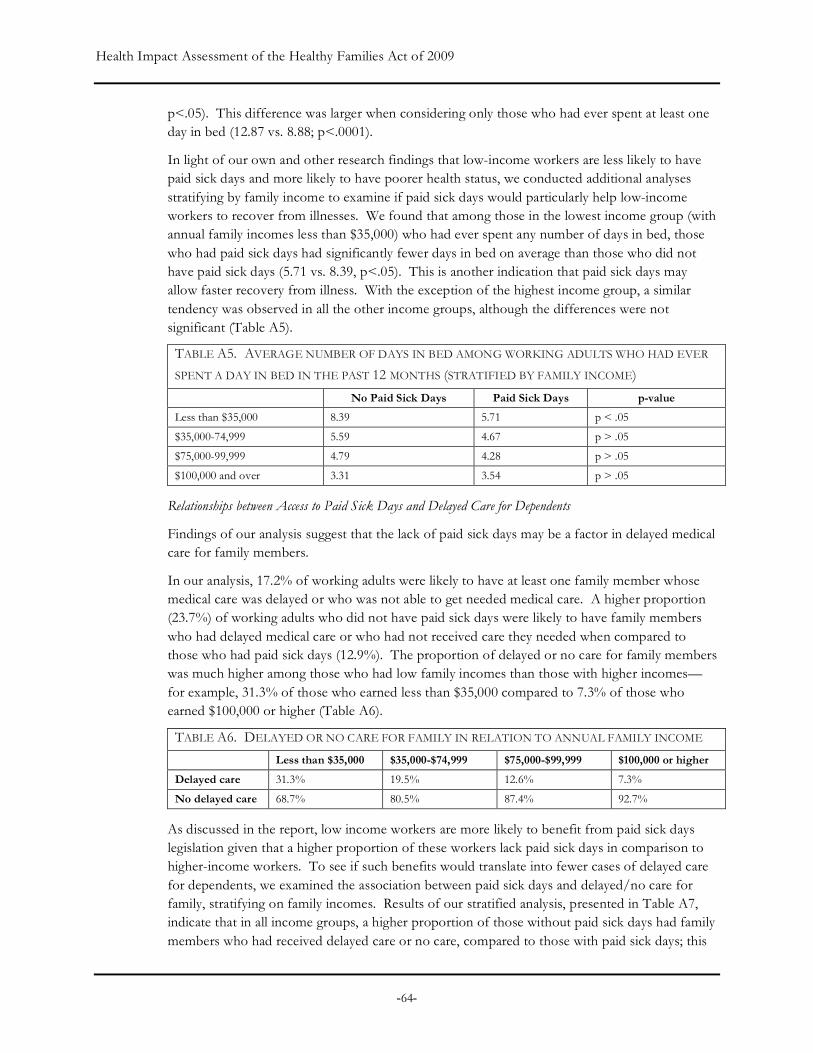
Health Impact Assessment of the Healthy Families Act of 2009
-64-
p<.05). This difference was larger when considering only those who had ever spent at least one day in bed (12.87 vs. 8.88; p<.0001).
In light of our own and other research findings that low-income workers are less likely to have paid sick days and more likely to have poorer health status, we conducted additional analyses stratifying by family income to examine if paid sick days would particularly help low-income workers to recover from illnesses. We found that among those in the lowest income group (with annual family incomes less than $35,000) who had ever spent any number of days in bed, those who had paid sick days had significantly fewer days in bed on average than those who did not have paid sick days (5.71 vs. 8.39, p<.05). This is another indication that paid sick days may allow faster recovery from illness. With the exception of the highest income group, a similar tendency was observed in all the other income groups, although the differences were not significant (Table A5).
TABLE A5. AVERAGE NUMBER OF DAYS IN BED AMONG WORKING ADULTS WHO HAD EVER
SPENT A DAY IN BED IN THE PAST 12 MONTHS (STRATIFIED BY FAMILY INCOME)
No Paid Sick Days Paid Sick Days p-value
Less than $35,000 8.39 5.71 p < .05
$35,000-74,999 5.59 4.67 p > .05
$75,000-99,999 4.79 4.28 p > .05
$100,000 and over 3.31 3.54 p > .05
Relationships between Access to Paid Sick Days and Delayed Care for Dependents
Findings of our analysis suggest that the lack of paid sick days may be a factor in delayed medical care for family members.
In our analysis, 17.2% of working adults were likely to have at least one family member whose medical care was delayed or who was not able to get needed medical care. A higher proportion (23.7%) of working adults who did not have paid sick days were likely to have family members who had delayed medical care or who had not received care they needed when compared to those who had paid sick days (12.9%). The proportion of delayed or no care for family members was much higher among those who had low family incomes than those with higher incomes—for example, 31.3% of those who earned less than $35,000 compared to 7.3% of those who earned $100,000 or higher (Table A6).
TABLE A6. DELAYED OR NO CARE FOR FAMILY IN RELATION TO ANNUAL FAMILY INCOME
Less than $35,000 $35,000-$74,999 $75,000-$99,999 $100,000 or higher
Delayed care 31.3% 19.5% 12.6% 7.3%
No delayed care 68.7% 80.5% 87.4% 92.7%
As discussed in the report, low income workers are more likely to benefit from paid sick days legislation given that a higher proportion of these workers lack paid sick days in comparison to higher-income workers. To see if such benefits would translate into fewer cases of delayed care for dependents, we examined the association between paid sick days and delayed/no care for family, stratifying on family incomes. Results of our stratified analysis, presented in Table A7, indicate that in all income groups, a higher proportion of those without paid sick days had family members who had received delayed care or no care, compared to those with paid sick days; this

Health Impact Assessment of the Healthy Families Act of 2009
-65-
difference was significant (p<0.05) with the exception of the highest income group. It is also worth noting that those of low incomes and without paid sick days are particularly vulnerable. For example, the proportion (34.8%) of working adults who had had family members with delayed or no care was the highest in this segment of the U.S. population.
TABLE A7. DELAYED OR NO CARE FOR FAMILY IN RELATION TO PAID SICK DAYS
(STRATIFIED BY FAMILY INCOME)
No Paid Sick Days Paid Sick Days p-value
Less than $35,000 34.8% 25.8% p <.001
$35,000-$74,999 25.0% 15.7% p <.001
$75,000-$99,999 16.4% 11.2% p <.05
$100,000 or higher 9.1% 6.5% p =.07
Given that the lack of health insurance coverage may constitute a significant barrier in seeking needed medical care, perhaps independently of the availability of paid sick days, we conducted a similar analysis stratifying on health insurance coverage (Table A8). Paid sick days was not statistically associated with delayed or no care for family members among those without health insurance, suggesting that health insurance may be a more dominant factor in delayed dependent care. However, paid sick days did significantly decrease the experience of delayed family care among those who had health insurance: the proportion of those with delayed dependent care being about 3.5% higher among those who did not have paid sick days than among those who did. This indicates that paid sick days may further facilitate access to health care for dependents of workers who have health insurance.
TABLE A8. DELAYED OR NO CARE FOR FAMILY IN RELATION TO PAID SICK DAYS
(STRATIFIED BY HEALTH INSURANCE COVERAGE)
No Paid Sick Days Paid Sick Days p-value
No Health Insurance 40.8% 47.0% p =.09
Health insurance 15.8% 11.2% p <.001
Relationships between Paid Sick Days and Emergency Room Visits
Our preliminary analysis found that those who had paid sick days were less likely to visit an emergency room (ER) in the past year than those who did not have paid sick days (15.7% vs. 17.7%; p < 0.05). In a further analysis stratifying the sample on selected population characteristics, we found that the associations between paid sick days and ER visits remained significant for some subgroups—for example, among males, those ages 35-44, Caucasians, Asians, and those with health insurance (Table A9).

Health Impact Assessment of the Healthy Families Act of 2009
-66-
TABLE A9. RELATIONSHIPS BETWEEN EMERGENCY ROOM (ER) VISIT AND PAID SICK DAYS
(STRATIFIED BY SELECTED POPULATION CHARACTERISTICS
ER Visit in Past 12 Months No ER Visit in Past 12 Months Paid Sick Days Paid Sick Days
Yes (%) No (%) Yes (%) No (%) p-value Gender (%) Male 52.6% 47.4% 58.9% 41.1% p < 0.01 Female 62.2% 37.8% 63.3% 36.7% p > .05 Age Group (%) 25-34 53.8% 46.2% 57.9% 42.1% p > .05 35-44 56.2% 43.8% 61.9% 38.1% p < .05 45-54 62.2% 37.8% 62.0% 38.0% p > .05 55-64 59.0% 41.1% 62.1% 37.9% p > .05 Race/Ethnicity (%) Hispanic 51.1% 48.9% 46.3% 53.8% p > .05 Non-Hispanic White 59.1% 40.9% 63.0% 37.0% p < .05 Non-Hispanic Black 57.1% 42.9% 63.6% 36.4% p = .05 Asian 53.4% 46.6% 68.8% 31.2% p < .05 Other 35.9% 64.1% 53.2% 46.8% p > .05 Marital Status (%) Married 57.5% 42.5% 61.0% 39.0% p < .05 Widowed 49.8% 50.2% 55.8% 44.2% p > .05 Divorced or Separated 57.2% 42.9% 60.9% 39.1% p > .05 Never Married 58.2% 41.8% 60.6% 39.4% p > .05 Educational Achievement (%) Did not graduate HS 35.1% 65.0% 32.9% 67.2% p > .05 HS graduate/GED 48.6% 51.4% 51.7% 48.3% p > .05 Some college 57.5% 42.5% 62.2% 37.8% p = .07 College graduate 74.3% 25.7% 73.6% 26.4% p > .05 Advanced degree 77.4% 22.6% 75.0% 25.0% p > .05 Household Income (%) $0 - $34,999 38.2% 61.8% 39.2% 60.9% p > .05 $35,000 - $74,999 57.3% 42.8% 59.5% 40.5% p > .05 $75,000 - $99,000 72.1% 27.9% 70.2% 29.8% p > .05 $100,000 and over 73.0% 27.0% 73.1% 26.9% p > .05 Any Health Insurance (%) Yes 64.9% 35.1% 68.6% 31.4% p < .05 No 18.7% 81.3% 18.5% 81.5% p > .05 Employer Provided Insurance (%) Yes 75.2% 24.8% 77.9% 22.1% p > .05 No 15.5% 84.5% 16.9% 83.1% p > .05 Self Rated Health Status (%)
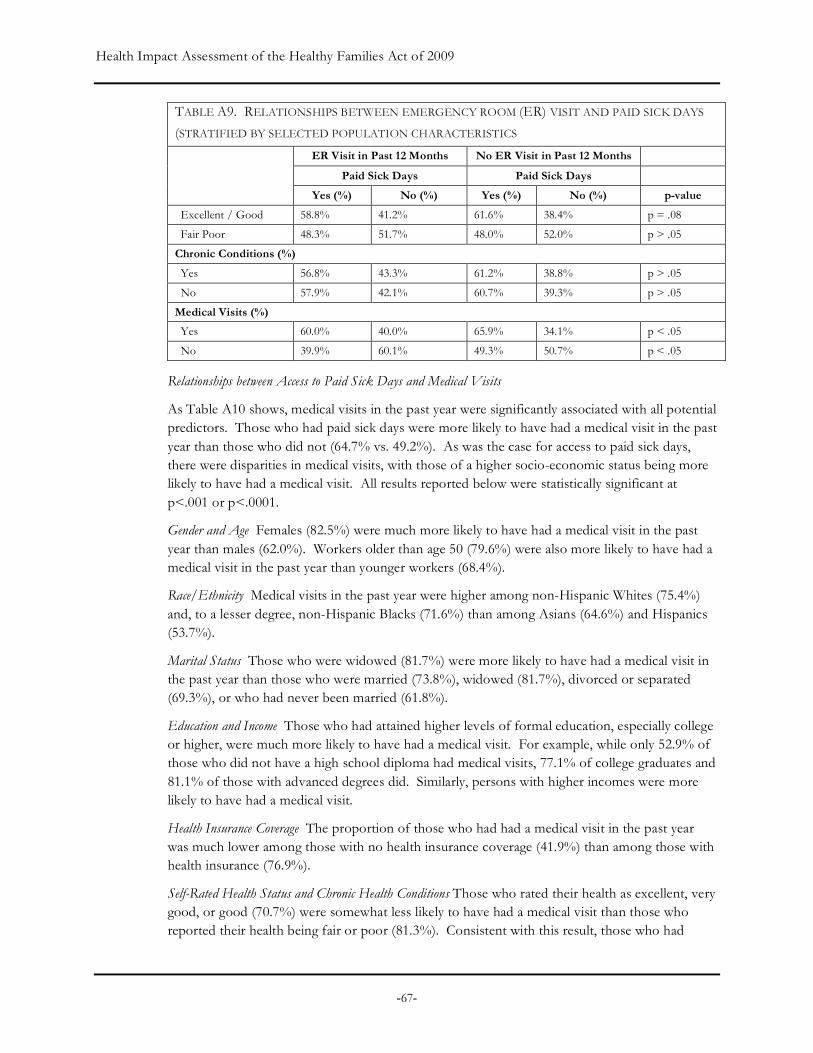
Health Impact Assessment of the Healthy Families Act of 2009
-67-
TABLE A9. RELATIONSHIPS BETWEEN EMERGENCY ROOM (ER) VISIT AND PAID SICK DAYS
(STRATIFIED BY SELECTED POPULATION CHARACTERISTICS
ER Visit in Past 12 Months No ER Visit in Past 12 Months Paid Sick Days Paid Sick Days
Yes (%) No (%) Yes (%) No (%) p-value Excellent / Good 58.8% 41.2% 61.6% 38.4% p = .08 Fair Poor 48.3% 51.7% 48.0% 52.0% p > .05 Chronic Conditions (%) Yes 56.8% 43.3% 61.2% 38.8% p > .05 No 57.9% 42.1% 60.7% 39.3% p > .05 Medical Visits (%) Yes 60.0% 40.0% 65.9% 34.1% p < .05 No 39.9% 60.1% 49.3% 50.7% p < .05
Relationships between Access to Paid Sick Days and Medical Visits
As Table A10 shows, medical visits in the past year were significantly associated with all potential predictors. Those who had paid sick days were more likely to have had a medical visit in the past year than those who did not (64.7% vs. 49.2%). As was the case for access to paid sick days, there were disparities in medical visits, with those of a higher socio-economic status being more likely to have had a medical visit. All results reported below were statistically significant at p<.001 or p<.0001.
Gender and Age Females (82.5%) were much more likely to have had a medical visit in the past year than males (62.0%). Workers older than age 50 (79.6%) were also more likely to have had a medical visit in the past year than younger workers (68.4%).
Race/Ethnicity Medical visits in the past year were higher among non-Hispanic Whites (75.4%) and, to a lesser degree, non-Hispanic Blacks (71.6%) than among Asians (64.6%) and Hispanics (53.7%).
Marital Status Those who were widowed (81.7%) were more likely to have had a medical visit in the past year than those who were married (73.8%), widowed (81.7%), divorced or separated (69.3%), or who had never been married (61.8%).
Education and Income Those who had attained higher levels of formal education, especially college or higher, were much more likely to have had a medical visit. For example, while only 52.9% of those who did not have a high school diploma had medical visits, 77.1% of college graduates and 81.1% of those with advanced degrees did. Similarly, persons with higher incomes were more likely to have had a medical visit.
Health Insurance Coverage The proportion of those who had had a medical visit in the past year was much lower among those with no health insurance coverage (41.9%) than among those with health insurance (76.9%).
Self-Rated Health Status and Chronic Health Conditions Those who rated their health as excellent, very good, or good (70.7%) were somewhat less likely to have had a medical visit than those who reported their health being fair or poor (81.3%). Consistent with this result, those who had

Health Impact Assessment of the Healthy Families Act of 2009
-68-
doctor-diagnosed chronic conditions were more likely to have had a medical visit than those who did not.
TABLE A10. MEDICAL VISITS BY POPULATION CHARACTERISTICS
Predictors Medical Visit in Past Year
No Medical Visit in Past Year
p-value
Paid sick days (%)
Yes 64.7% 35.3% p < .001
No 49.2% 50.7%
Gender (%)
Male 62.0% 38.0% p < .001
Female 82.5% 17.5%
Mean Age 47.7 40.2 p < .001
Age Group (%)
50 or younger 68.4% 31.6% p < .001
Older than 50 79.6% 20.4%
Race/Ethnicity (%)
Hispanic 53.7% 46.3% p < .001
Non-Hispanic White 75.4% 24.6%
Non-Hispanic Black 71.6% 28.4%
Asian 64.6% 35.4%
Other 71.2% 28.4%
Marital Status (%)
Married/Partnered 73.8% 26.2% p < .001
Widowed 81.7% 18.3%
Divorced or Separated 69.3% 30.7%
Never Married 61.8% 38.2%
Educational Achievement (%)
Did not graduate HS 52.9% 47.1% p < .001
HS graduate/GED 66.3% 33.7%
Some college 74.6% 25.4%
College graduate 77.1% 22.9%
Advanced degree 81.1% 18.9%
Household Income (%)
$0 - $34,999 60.2% 39.8% p < .001
$35,000 - $74,999 69.1% 31.0%
$75,000 - $99,000 77.6% 22.4%
$100,000 and over 82.3% 17.7%
Any Health Insurance (%)
Yes 76.9% 23.1% p < .001
No 41.9% 58.2%
Self Rated Health Status (%)
Excellent / Good 70.7% 29.3% p < .001
Fair / Poor 81.3% 18.7%
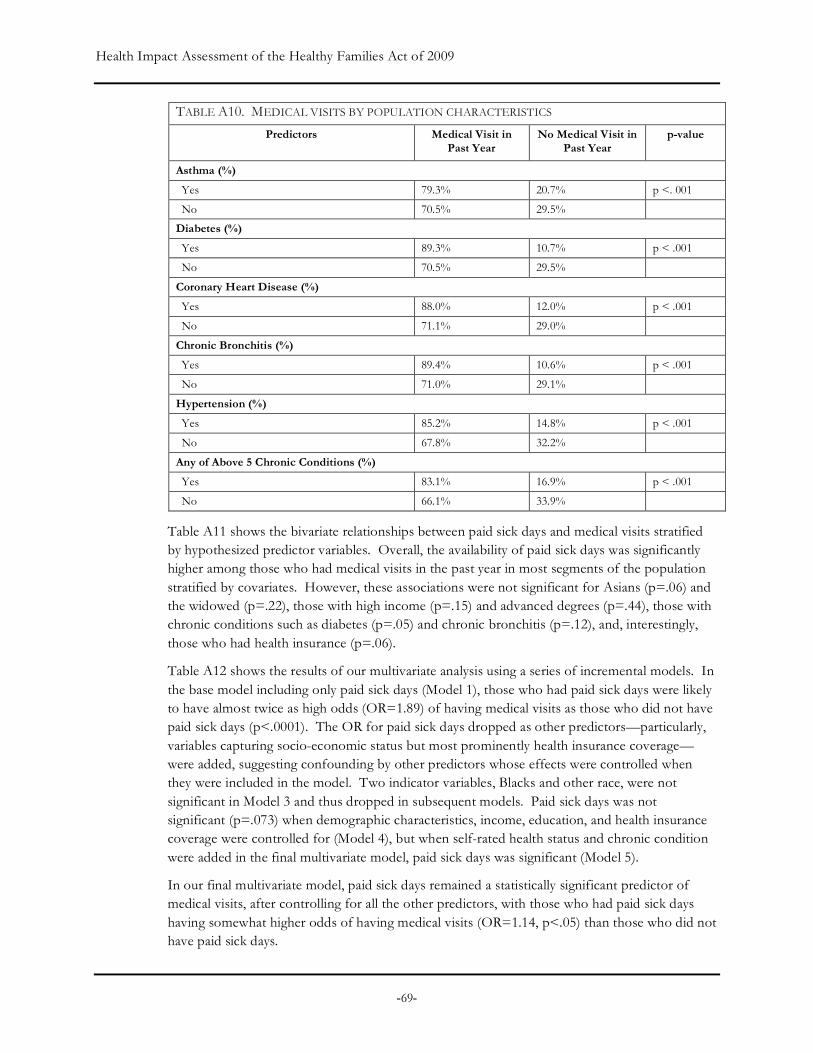
Health Impact Assessment of the Healthy Families Act of 2009
-69-
TABLE A10. MEDICAL VISITS BY POPULATION CHARACTERISTICS
Predictors Medical Visit in Past Year
No Medical Visit in Past Year
p-value
Asthma (%)
Yes 79.3% 20.7% p <. 001
No 70.5% 29.5%
Diabetes (%)
Yes 89.3% 10.7% p < .001
No 70.5% 29.5%
Coronary Heart Disease (%)
Yes 88.0% 12.0% p < .001
No 71.1% 29.0%
Chronic Bronchitis (%)
Yes 89.4% 10.6% p < .001
No 71.0% 29.1%
Hypertension (%)
Yes 85.2% 14.8% p < .001
No 67.8% 32.2%
Any of Above 5 Chronic Conditions (%)
Yes 83.1% 16.9% p < .001
No 66.1% 33.9%
Table A11 shows the bivariate relationships between paid sick days and medical visits stratified by hypothesized predictor variables. Overall, the availability of paid sick days was significantly higher among those who had medical visits in the past year in most segments of the population stratified by covariates. However, these associations were not significant for Asians (p=.06) and the widowed (p=.22), those with high income (p=.15) and advanced degrees (p=.44), those with chronic conditions such as diabetes (p=.05) and chronic bronchitis (p=.12), and, interestingly, those who had health insurance (p=.06).
Table A12 shows the results of our multivariate analysis using a series of incremental models. In the base model including only paid sick days (Model 1), those who had paid sick days were likely to have almost twice as high odds (OR=1.89) of having medical visits as those who did not have paid sick days (p<.0001). The OR for paid sick days dropped as other predictors—particularly, variables capturing socio-economic status but most prominently health insurance coverage—were added, suggesting confounding by other predictors whose effects were controlled when they were included in the model. Two indicator variables, Blacks and other race, were not significant in Model 3 and thus dropped in subsequent models. Paid sick days was not significant (p=.073) when demographic characteristics, income, education, and health insurance coverage were controlled for (Model 4), but when self-rated health status and chronic condition were added in the final multivariate model, paid sick days was significant (Model 5).
In our final multivariate model, paid sick days remained a statistically significant predictor of medical visits, after controlling for all the other predictors, with those who had paid sick days having somewhat higher odds of having medical visits (OR=1.14, p<.05) than those who did not have paid sick days.

Health Impact Assessment of the Healthy Families Act of 2009
-70-
TABLE A11. PAID SICK DAYS AND MEDICAL VISITS STRATIFIED BY POTENTIAL
CONFOUNDING AND MEDIATING FACTORS
No Medical Visit in
the Past Year Medical Visit in the
Past Year p-value
Gender (%)
Male 51.2% 63.5% p < .001
Female 50.3% 65.8% p < .001
Age Group (%)
50 or younger 25.3% 74.7% p < .001
Older than 50 17.0% 83.0% p < .001
Race/Ethnicity (%)
Hispanic 33.1% 58.4% p < .001
Non-Hispanic White 54.7% 64.9% p < .001
Non-Hispanic Black 47.8% 68.0% p < .001
Asian 61.7% 70.4% p = .06
Other 37.1% 54.2% p > .05 Marital Status (%)
Married/Partnered 49.8% 64.2% p < .001
Widowed 43.1% 56.8% p > .05 Divorced or Separated 44.5% 67.1% p < .001
Never Married 50.9% 66.1% p < .001
Educational Achievement (%)
Did not graduate HS 24.3% 41.2% p < .001
HS graduate/GED 42.4% 55.7% p < .001
Some college 54.2% 63.7% p < .001
College graduate 66.3% 76.0% p < .001
Advanced degree 73.5% 76.1% p > .05 Household Income (%)
$0 - $34,999 30.2% 44.7% p < .001
$35,000 - $74,999 49.6% 63.4% p < .001
$75,000 - $99,000 65.3% 72.2% p < .05
$100,000 and over 69.6% 73.9% p > .05 Any Health Insurance (%)
Yes 16.6% 20.9% p = .06
No 64.5% 69.1% p < .01
Self Rated Health Status (%)
Fair/Poor 31.6% 52.1% p < .001
Excellent / Good 50.0% 65.7% p < .001
Asthma (%)
No 49.1% 75.0% p < .001
Yes 51.0% 62.3% p < .01
Diabetes (%)
No 49.3% 64.8% p < .001

Health Impact Assessment of the Healthy Families Act of 2009
-71-
Yes 46.4% 62.8% p=.05
Coronary Heart Disease (%)
No 49.4% 64.7% p < .001
Yes 39.5% 68.8% p < .05
Chronic Bronchitis (%)
No 49.3% 64.9% p < .001
Yes 40.4% 58.6% p > .05 Hypertension (%)
No 49.4% 65.5% p < .001
Yes 48.2% 62.2% p < .001
Have Any of Above 5 Chronic Conditions (%)
No 49.4% 72.6% p < .001
Yes 48.8% 62.6% p < .001
All other predictors in our multivariate model were also significantly associated with medical visits. Compared to females, males (OR=0.33) were far less likely to have had medical visits, and persons older than 50 (OR=1.33) were more likely to have had a medical visit than those who were younger. Persons with higher socio-economic status were more likely to have had a medical visit, with those who had achieved college or more advanced education (OR=1.33) and those with annual household incomes of $75,000 or higher (OR=1.60) having higher odds of having a medical visit than those who did not attend college and those whose families earned less income.
Not surprisingly, health insurance and health status appeared to be strong predictors of medical visits. Those who had any health insurance coverage were over three times as likely to have had a medical visit as those who did not have health insurance coverage (OR=3.36). Those who reported that their health was good, very good, or excellent were also far less likely to have had a medical visit (OR=.52) than those who rated their health to be fair or poor. Those who had at least one of the five most common chronic conditions were more than twice as likely to have had a medical visit (OR=2.36) as those who did not.
CONCLUSION
Findings of our analysis suggest that paid sick days may facilitate recovery from illness and use of primary care use for workers, and receipt of medical care for dependents. The analysis provides limited evidence of an impact on emergency room visits in subgroups.
This study has important strengths. The large sample size may have enhanced study power to detect significant effects of paid sick days. NHIS sampling strategy allowed our findings to be generalizable to the U.S. population.
Limitations of our study should also be noted. Due to the cross-sectional design of the NHIS, the temporal relationship between paid sick days and medical visit cannot be established; however, we presume that health care utilization does not lead to a change in employment benefits in the short-term. A major limitation of our study involves the lack of specific and/or accurate variables to be used as outcomes in this analysis. We used available variables for medical visits as a proxy for outpatient or primary care, assuming that medical visits most
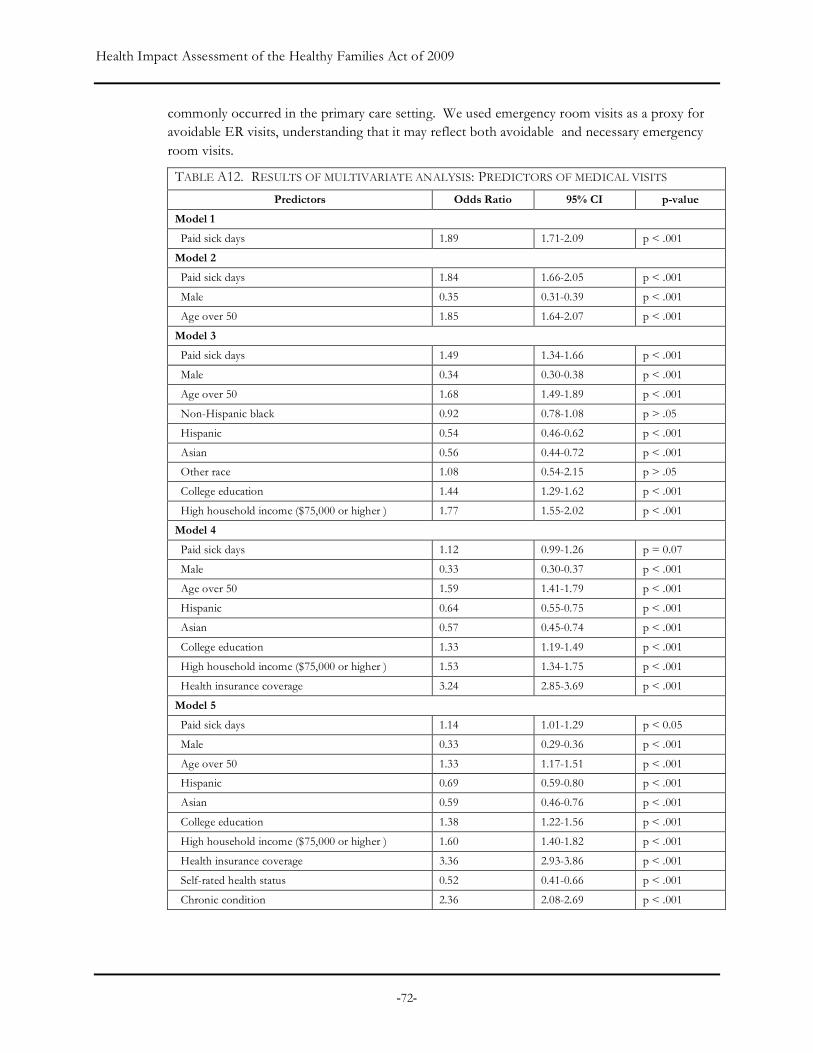
Health Impact Assessment of the Healthy Families Act of 2009
-72-
commonly occurred in the primary care setting. We used emergency room visits as a proxy for avoidable ER visits, understanding that it may reflect both avoidable and necessary emergency room visits.
TABLE A12. RESULTS OF MULTIVARIATE ANALYSIS: PREDICTORS OF MEDICAL VISITS
Predictors Odds Ratio 95% CI p-value
Model 1
Paid sick days 1.89 1.71-2.09 p < .001 Model 2
Paid sick days 1.84 1.66-2.05 p < .001 Male 0.35 0.31-0.39 p < .001 Age over 50 1.85 1.64-2.07 p < .001 Model 3
Paid sick days 1.49 1.34-1.66 p < .001 Male 0.34 0.30-0.38 p < .001 Age over 50 1.68 1.49-1.89 p < .001 Non-Hispanic black 0.92 0.78-1.08 p > .05 Hispanic 0.54 0.46-0.62 p < .001 Asian 0.56 0.44-0.72 p < .001 Other race 1.08 0.54-2.15 p > .05 College education 1.44 1.29-1.62 p < .001 High household income ($75,000 or higher ) 1.77 1.55-2.02 p < .001 Model 4
Paid sick days 1.12 0.99-1.26 p = 0.07
Male 0.33 0.30-0.37 p < .001 Age over 50 1.59 1.41-1.79 p < .001 Hispanic 0.64 0.55-0.75 p < .001 Asian 0.57 0.45-0.74 p < .001 College education 1.33 1.19-1.49 p < .001 High household income ($75,000 or higher ) 1.53 1.34-1.75 p < .001 Health insurance coverage 3.24 2.85-3.69 p < .001 Model 5
Paid sick days 1.14 1.01-1.29 p < 0.05
Male 0.33 0.29-0.36 p < .001 Age over 50 1.33 1.17-1.51 p < .001 Hispanic 0.69 0.59-0.80 p < .001 Asian 0.59 0.46-0.76 p < .001 College education 1.38 1.22-1.56 p < .001 High household income ($75,000 or higher ) 1.60 1.40-1.82 p < .001 Health insurance coverage 3.36 2.93-3.86 p < .001 Self-rated health status 0.52 0.41-0.66 p < .001 Chronic condition 2.36 2.08-2.69 p < .001
Health Impact Assessment of the Healthy Families Act of 2009
-73-
Appendix II. Paid Sick Days Focus Groups—Methods and Findings This narrative summarizes the findings of six focus groups conducted as part of health impact assessments of paid sick day benefit legislation in California and in Milwaukee, Wisconsin. The purpose of these focus groups was to gather qualitative information on workers’ experiences accessing paid sick day benefits and the effect of having (or not having) such a benefit on their health and the health of their families. This narrative is primarily based on the experiences of workers who do not have access to paid sick days.
Given the limited availability of data of how access to paid sick days affects health, findings from these focus groups help to fill some of these data gaps. While these findings may not be representative of all workers, the results provide powerful perspectives often overlooked in a discourse dominated by economic cost-benefit analysis.
METHODS
Three of the six focus groups were conducted in California: two in San Francisco in April and June, 2008; and one in Riverside in April 2009. Three focus groups were conducted in Milwaukee, Wisconsin in October 2008.
Participants in the two San Francisco focus groups were recruited by Mujeres Unidas y Activas (MUA) and Young Workers United (YWU). Participants in Riverside focus group were recruited by the United Domestic Workers of America (UDW). These organizations have a membership base of low-wage workers in occupations that must interact with the public and/or with sensitive populations. MUA members provide childcare and homecare services, YWU members mostly work in the restaurant industry, and the UDW represents homecare providers in California. The HIA authors conducted all three focus groups in California.
The three focus groups in Milwaukee were recruited and conducted by staff of 9to5, the labor advocacy group based in Milwaukee whose constituents are mainly low-wage female workers working in traditionally female jobs.
With the exception of one group in the Bay Area conducted in Spanish, all focus groups were conducted in English. The MUA focus group, conducted in Spanish, was simultaneously transcribed and translated into English. Focus groups lasted between one and two hours, with groups with fewer participants being shorter. Participation in the group was completely voluntary, and participants were told that names and identifying information would be kept confidential. Each participant in the California focus groups received a grocery store gift card as compensation. Focus group moderators asked for permission to audiotape and take notes at the outset of the meeting in an effort to obtain an accurate description of the discussion.
In total, 29 participants participated in the six focus groups. Most of the participants were employed half- or part-time, although two were unemployed at the time of the focus group and shared experiences they had during the time they had been employed. Participants worked in a range of areas, including: domestic work; child/day care; patient care; casual labor; service work in restaurant, retail and banking; community organizing; and political canvassing. Three of the homecare providers were Caucasian, and the remaining participants were Latina, African-American, Asian American, or Native American. The vast majority of the participants were female.
Health Impact Assessment of the Healthy Families Act of 2009
-74-
FINDINGS
Workpl ace Cul tur es and Norms
Most focus group participants lacked paid sick days. They also worked in places where missed workdays due to illness were neither expected nor tolerated. Workplace norms, though informal in many workplaces, were that workers would come to work even when sick. Some focus group participants described the uneasiness they would feel from potentially being seen by their employer as “irresponsible” if they called in sick. One participant who worked in the restaurant industry also described how employers expected that workers would find someone to cover their shift if they needed to call in sick. If they were unable to find replacements, then their coworkers, who were already dealing with the fast-paced and often dangerous work in restaurant kitchens, had to do more work. The guilt that participants felt for abandoning co-workers added to an overall pressure to force them to go to work while they or their family members were sick.
When workers in such workplaces do indeed take time off while sick, consequences may follow. Participants reported real or perceived consequences associated with taking sick time off. These include the threat of being fired, loss of wages, being reprimanded or written up, and receiving decreased work hours or bad shifts, which we describe in detail below.
Given such workplace norms and potential consequences, most participants felt that they had no choice but to go to work sick. A former bank teller shared her experience: “One morning I had been feeling really, really sick. I never complained but I still kept throwing up in a trash can next to me. It was just horrible, and I hadn’t eaten anything. My managers saw I had thrown up probably four times. Even the customers were like, why are you here? But the managers were not thinking that.” A department store clerk pointed out the harshness of such indifference: “People get sick. You’re not working with robots here. You’re working with human beings.”
A restaurant worker expressed the sense of resignation she felt while working in an environment where workers’ health or well-being was not valued: “we’re so expendable…we’re service [workers].” She went on to describe how such work place norms, in combination with close working conditions, led to habitually passing illness around to one another, decreased productivity among workers, and significantly longer recovery times. She stated, “The staff of the restaurant is pretty big. People have kids. People get sick all the time. There’s someone always sick out…..It’s gets passed from one person to the next. People cover each others’ shifts and try to help each other out when necessary but there isn’t such thing as sick leave.” In the most extreme situation of a penalty being levied, one participant described being laid off after taking time off to take her daughter to the doctor. Another described seeing a co-worker, “someone who worked there for two years,” as getting fired because she didn’t show up for a shift.
In the case of homecare workers, especially those who cared for their own family members, the main challenge they faced when they were sick was to find family members and friends who could fill in for them while they rested or sought medical care. However, most participants agreed that they simply could not “count on family” or that “blood family is the hardest one” to enlist because “they don’t want to deal with it,” “they have their own lives,” “not everybody has a close-knit family,” or “not everyone has their family living in the area.” Still, the expectations of others and of homecare workers themselves were that they should care for their family
Health Impact Assessment of the Healthy Families Act of 2009
-75-
members who were ill. Without reliable support, most of the focus group participants who were homecare workers agreed that they had no choice but to soldier on while sick or bearing potentially life-threatening health conditions of their own, which we describe below.
Economic Impa ct and S tr ess
Many participants considered loss of wages due to sick time off to be a significant impact on their quality of life, especially given that they were low-wage workers who could ill afford to lose income. One participant stated that if, “I only work three shifts this week and if I’m like too sick and I can’t make my $150 that I need…I’m totally not paying rent and I definitely can’t buy groceries…a lot of times there’s no choice but to keep working. I never call in sick. And I’ve been working in restaurants for seven years.” The sentiment was echoed by others as well. “We don't have that privilege--not even to get sick…I know if I don't work, because of the two or three days I'm not feeling well, I won't be able to cover my rent and my bills. That's the way it is.” A participant shared a story that involved a former co-worker who suffered from mental illness and whose partner had AIDS. They worked in a small restaurant with only five staff members and did not receive paid sick days, though calling in sick was somewhat tolerated. The participant described situations in which the co-worker would have an acute mental health crisis at work, but could not afford to go home because she needed the money to buy medicines for her partner. She stated, “She would be having an episode at work…and I’m serving with her in a small restaurant….there’s nothing to be done…she would have to come and work because she needed to money…you’re clearly sick but you have to be here.”
The participant acknowledged that, even for herself, missing a shift meant added stress due to the loss of income. She described the pressure to pick up extra shifts to make up the lost pay. However, “doing a double shift at a restaurant” meant working fourteen hours straight, and being “incapacitated for a day.” If the participant couldn’t pick up that extra shift, she described making up the lost pay by adjusting her eating habits, “Then you find yourself eating more cheaply…maybe not taking the time to nourish yourself the way you should because you’re really strained on money. I go on the mac and cheese diet or the ramen noodle diet. You go into survival mode…because it’s about making the money that you need at the end of the month.”
Most homecare workers who participated in focus group discussion reported that they were very reluctant to leave their clients unattended because it may lead to devastating consequences. Most of them provided care for elderly patients suffering from Alzheimer’s disease, often combined with other age-related health conditions such as heart disease; one participant cared for a son with uncontrollable seizures who needed to be monitored at all times. One provider mentioned how her client “can put herself into a coma” and “once crushed her head against hard things” when unattended. On rare occasions when they had to leave their patients, they usually had to “pay someone to come in while recuperating” or “when going out,” essentially giving up their wages from homecare work. Understandably, their low wages mostly prohibited them from hiring help, which forced them to be “on the go 24/7.”
“Then you find yourself eating more cheaply…maybe not taking the time to nourish yourself the way you should because you’re really strained on money. I go on the mac and cheese diet or the ramen noodle diet. You go into survival mode…because it’s about making the money that you need at the end of the month.”

Health Impact Assessment of the Healthy Families Act of 2009
-76-
Not being able to receive timely medical care due to the lack of paid sick days also seemed to directly result in greater medical care costs. The participant who was working as a bank teller related her experience: “When I went in for the early contractions which were causing my dehydration, if I had gone sooner instead of having to wait till my day off— my only day off that week—I think I may have not been stuck with the hospital bill. You let the problem go on and blow up into this bigger situation rather than catch it earlier on so you end up losing money.”
Lost wages also had the impact of creating tension with family members. Several focus group participants discussed how job loss and loss of wages negatively affected their relationships with their husbands, primarily because they were unable to contribute to family wages, or because their wage input was less than usual. One participant said, “And if we stop working and aren’t earning, how are we going to contribute the other half that’s our share?” Several participants identified domestic violence as resulting from such tension.
Focus group participants felt strongly that a benefit that protected their wages if they called in sick would help to alleviate much of this fear and stress, since they would not be forced to choose between their income and their health.
Employe r Retal ia t ion
Another theme that emerged throughout the discussions was that going back to work after taking sick time off sometimes had consequences in terms of the type of work participants were asked to do or the number of work hours they were assigned. For example, a woman who did domestic work talked about how, when she returned to work after having taken time off, she was assigned more difficult tasks to perform.
Another participant, a gift wrapper at a department store, described how her absence one day due to food poisoning antagonized her boss and almost cost her the pay raise she had anticipated. She stated: “Not only was my relationship with my manager a little strained after that because she was so angry that I couldn’t come in that day but, she actually mentioned that it might come up during review.”
These participants perceived such treatment to be a “punishment” for taking time off. A worker who did manual jobs talked about another form of penalty at one job—a “three strikes” rule—where calling in sick could count as a strike in performance evaluations. He stated, “Calling in sick too often could cause some strikes against you, which would look bad during an upcoming review” which also meant that “[workers] would bring their illness into the work environment. Because instead of being at home they didn’t want to like jeopardize their job...”
“Something that happens to us all the time--accidents. Because when we're taking care of patients, we hurt our backs, our arms, also when we're taking care of children, our backs. We have to climb up to high places when we're cleaning. Accidents happen. And as my fellow worker here was saying, they lay you off or they fire you, but they never give you a sick day.”
“I can say I’m not going to work, but the money isn’t just going to fly into my wallet, and that’s the problem.”
Health Impact Assessment of the Healthy Families Act of 2009
-77-
Il lness , In ju ry and Recov ery
Our focus group participants described the exacerbation of an illness because they went to work sick, and were unable to take the adequate amount of time necessary to get well. One participant described how she went to work with the flu and did not get the rest she needed to overcome the illness. As a result, she continued to be ill for two months with symptoms from the flu. Participants agreed there was a sense to “just power through…don’t get fixed.” Another participant described going to work while recovering from dental surgery. While the dentist had recommended taking two days off to recover, not getting paid for the time off meant that taking time off was not an option for her. Another described going to work with the flu and being feverish while at work. While her employer noticed she was sick, “she never told me to go home and rest, until I finally made the decision not to go to work--but she didn't pay me for that day.”
In some cases, poor working conditions, which low-wage workers often suffer from, exacerbated illnesses and prolonged recovery. One participant described how their place of work was “poorly insulated especially during the winter season in San Francisco...people’s immune systems would be weaker because of cold,” and this, she believed, prolonged recovery for workers who suffered from respiratory illnesses.
Two homecare providers reported having to postpone medical interventions. One of them had not been able to schedule a surgery to remove a uterine tumor for two years, even with repeated urging by her doctor to do so, due to the lack of a replacement to care for her parents for a month while she would recuperate from such a surgery; as a result, the tumor had grown from the size of about 6 centimeters when it was first diagnosed to 8.9 centimeters at the time of the focus group. The other stated how the lack of paid sick days was forcing her to continually postpone the tests for breast cancer her doctor had ordered. Without finding a replacement who would care for her clients during her repeated visits to the hospital, she kept postponing her tests, even with the stress of dealing with the possibility of having a potentially life-threatening illness. The same provider related an episode of having to undergo a surgery to remove a cyst on her neck of “the size of a golf ball,” scars from which she showed to the group. She said that since there was nobody else to take care of her parents, she was forced to take them to the hospital, drive them back after the surgery, and then cook dinner for them and clean them. The wound from the surgery did not heal properly because “You’re sweaty, you’re lifting them, bathing them, cleaning them.” Both of these home care providers emphatically said, “we do need paid sick days.”
Even workers injured on the job were not given the latitude to take the time to recover. For example, one participant discussed how she had fallen on the job and hurt her knee, which required an operation on her meniscus. She was unable to take enough time for the surgery to heal and as a result, developed cysts at the site of her operation, which then required additional surgery. After that, she heard that “my boss didn’t want me on light duty,” meaning that they would not adjust her work to accommodate her recovery process – to date, she had not been called back into work. Another participant discussed how she made a deep cut in her finger that
“just power through …don’t get fixed.”
“A lot of guys at work cut themselves really badly, or burn themselves. A lot of guys get burns on their arms…and they will just wrap it up and be at work the next day…”

Health Impact Assessment of the Healthy Families Act of 2009
-78-
bled profusely while at work. Rather than encourage her to seek immediate medical attention, co-workers provided ideas on how to treat the injury on the spot so she could return to work. There was a strong culture of taking care of each other, but “nobody said go to the hospital now….or go home.” This sentiment was echoed by another participant who described working with glass doing custom framing, and everyone having cut up hands but that “No one ever really like went home….Because there’s also a culture…don’t want to seem like you’re complaining.”1 Another participant continued to say, “If they felt they could handle it [an injury]…there’s pressure of not wanting to look bad to your employer.”
Inabi l i ty to P rovi de Care f o r Dependents
Participants also shared stories of family members not being cared for when ill because of the lack of paid sick days. A participant described the sorrow she felt when she was not able to take time off to care for her husband when he was suffering from a great deal of pain from a post-polio syndrome: “There were times when he wasn’t really feeling well. Post-polio syndrome is where some of the symptoms of polio he had as a child – when he was three – and the pain come back on you. There were a couple of mornings when I really didn’t want to leave him but I did.”
The lack of paid sick days also means that, with no parents at home who could care for them, sick children are sent to schools or daycare centers. A daycare worker described how some parents had no choice but to drop off their sick children at the daycare because they did could not take time off: “That’s more normal than not, children coming in sick, and the parents know they’re sick, but they have to work. If you gotta go, you gotta go. It doesn’t sound good but that’s the fact of the matter.” She added: “The child was too sick, like listless, coughing, sneezing, diarrhea – simple things a mom can handle. But she couldn’t be there to care for her child because she couldn’t get off. It’s cruel.”
When sick children are sent to schools or day care, there may be repercussions going beyond the well-being of the sick children. A participant, who was a mother, was clearly aware of such repercussions: “I would send her to daycare sick and I felt bad because I knew it was going to get other kids sick. If another kid was sick at daycare I would just hold my breath and pray that she wouldn’t get it, ‘cause if she does then I’m gonna get sick.”
Soci al P ressur es and Gu il t
Another major theme that emerged in our focus groups was an informal mechanism in which social pressure prevented workers from calling in sick or taking sufficient time off to get well. One participant discussed how she was made to feel guilty by her employer for taking time off while her children were sick. She quoted her employer as saying,
1 Notably, the Coalition for Domestic Workers Rights conducted a survey of 247 domestic workers in San Francisco. The responses from these workers about occupational health and survey illustrated that 63% of the domestic workers surveyed believed their jobs were dangerous; however, only 26% of participants reported receiving protective equipment to prevent occupational exposure or injuries. Of all the domestic workers surveyed, only 14% had received occupational health training. Source: Kappagoda M, Bhatia R, Farhang L, Sargent M. Tales of a City’s Workers: A Profile of Jobs and Health in San Francisco. San Francisco Department of Public Health, Program on Health, Equity and Sustainability, June 2007. Available at: www.sfdph.org/phes.
“The child was too sick, like listless, coughing, sneezing, diarrhea—simple things a mom can handle. But she couldn’t be there to care for her child because she couldn’t get off. It’s cruel.”
Health Impact Assessment of the Healthy Families Act of 2009
-79-
“When you want, you can go, and I’ll never get a person who has children again, because the ones with children are really problematic, because they have to leave work to take care of their children.” Participants also agreed that often, “After being home sick for a day, people feel like they need to work extra hard the next day.”
The restaurant industry was described as particularly susceptible to pressure to be as productive as possible. For example, a participant described that retribution from co-workers was not uncommon if they perceived you as lagging on the job. For example, “they’ll f**k up your orders. And they’ll make it a little hard for you if you abuse them, they’ll abuse you back in a way.” The sentiment was also expressed as, “[you] don’t want people to dislike you at your job.” In contrast, another participant described how the pressure to not call in sick was rooted in the need to be perceived as “responsible.” He described a story in which “one of the women I work with, she has kids and really bad allergies, but she runs the whole office. She won’t take off because she doesn’t want to look like she’s leaving [because] she has so many responsibilities.” Regarding getting the flu, one participant talked about having the flu and “feeling like I should probably stay home…I know it’s good for me to stay home like another day or two…but just knowing like you really would be looked down upon by management. They would use that against you.”
Othe r Work-Rel ate d Cond it io ns
Absence of sick days was not the only work-related condition that participants discussed. Among our Latina participants in the MUA group, there was a clear sense that they were being taken advantage of by their employers. As examples of such exploitation, participants pointed to the lack of health, sick days and vacation benefits; the piling on of work that was not agreed to; a lack of consistency in their work schedule and expected time commitment; and, continuous threats of being fired. Importantly, however, participants did not accept their work environments as normal or healthy. Participants routinely used the language of fairness, rights, and dignity in reflections of how they were treated, and how they should be treated.
Interestingly, whereas participants acknowledged that some workers might take advantage of a sick days benefit, everyone agreed that that was not sufficient reason to deny the benefit to all workers. Furthermore, one participant stated, “Is taking a day for your self really an abuse of the system?” Another noted that employers routinely took advantage of the system as well. One story that drew strong negative reactions from other participants related to a San Francisco-based employer who, when the sick days benefit went into effect, rescinded a policy of giving five vacation days to workers and converting them into the sick days benefit. The participant said, “They took away all of our vacation and just gave us sick days.” He described the employer’s action further by saying, “The company had figured out this way…. this cool law had just passed [sick days benefit]…but we’re going to like flip it and just take away everyone’s vacation because there’s no vacation law…that caused a lot of despair…..this company had used a passing of a law that was good and had manipulated it and manipulated us with it.”
“So I think that if I've been working for a person for two years I have the right to pay, a salary, if I get sick. Even if it's just one day, I have a right. Also [there are] the demands they make of us. We work harder and they don't pay us more, not what they should pay us.”
Health Impact Assessment of the Healthy Families Act of 2009
-80-
In the situations described in the focus groups, it was clear that many factors, aside from having the paid sick days benefit, also compounded the difficulty of calling in sick. For example, participants discussed the role that language and immigration status played in this fear of job loss and calling in sick – as one participant stated “undocumented workers would never risk calling in sick.” This sentiment, in particular, highlights the complex set of issues that workers must navigate before deciding when to take a sick day. When asked whether lack of sick days meant that participants did not seek out routine preventative care, a participant responded that, “well that’s more because you couldn’t afford to….if you weren’t insured at your job…you couldn’t really afford going and paying the whole coverage.” This illustrated how a sick day benefit only went so far. Without the ability to access routine and affordable health care – sick days provided an opportunity for respite when ill, but did not necessarily address preventative care and treatment needs. One participant summed up the relationship by saying, sick days and health insurance “go hand-in-hand.”
The way homecare workers reported their hours made it more difficult for them to take time off. Most of them had been authorized to work only part-time, and the hours they reported had little bearing on actual hours worked because they were instructed to allocate their hours evenly across all seven days a week in filling out their time sheets. Therefore, homecare providers, most of whom were paid part-time, could not take time off without wage loss. To take some paid time off, they would have to endure “questioning and humiliation the social worker will put you through,” which is very “demeaning” and “kills your self-esteem and dignity.” Consequently, they took little sick time off, worked fatigued and sleep-deprived on most days, and were forced to give up their wages to pay their replacements on rare occasions when they took time off.
CONCLUSION
The experiences reported by our focus group participants provide strong evidence that the absence of paid sick days negatively affected the health and well-being of participants. There are a number of different mechanisms this may occur. Fear of job loss and lost wages may have been the most prominent reasons why participants did not take time off when sick. Other forms of employer retaliation and penalization, such as receiving less working hours, being reprimanded, or receiving a “strike”, were also prevalent. At times, internalized workplace or cultural norms put pressure on workers to force them to work while sick, as illustrated by stories of going to work while ill, elevated stress levels associated with missing workdays, and family and workplace conflict. Participants described their inability to seek timely medical attention, recover from illness (even when illness was job-related), and to support dependents in their recovery. Some described how they believed their work environment not being amenable to sick workers made them particularly susceptible to illness because of close working quarters, an overall atmosphere of “toughing it out,” and pressure to not abandon co-workers.
Some focus group participants who worked in San Francisco, where the paid sick days ordinance had already been passed but unenforced in many workplaces, suggested a number of ways in which paid sick cays could be better enforced. These included: requiring employers to list sick time on pay stubs, running an educational campaign on public transit, employers developing back-up plans in the event that workers called in sick, and requiring employers to discuss employee benefits with all new hires. One participant strongly noted, “The laws are there. The enforcement is always lacking. There needs to be some kind of employer accountability.”
Health Impact Assessment of the Healthy Families Act of 2009
-81-
Additionally, for the law to be effective, employer retaliation must be discouraged, they maintained.
These focus groups highlight that the lack of sick day benefits means that workers go to work while ill, take longer to recover and have significant fears of job loss and stress related to lost wages. They also illustrate that in many ways, workplace norms and policies have a strong influence on whether employees feel they can take a sick day.
Focus group participants clearly understood the paid sick days issue as a health-related issue, both through the direct impacts on health (e.g., longer recovery times, lack of full recovery) and through indirect impacts (e.g., loss of job or wages leading to hunger or loss of housing, domestic violence). Importantly, they also saw the policy as a human rights issue, a question of fairness, and a policy that would afford them basic dignity.
Related Documents