Citation: Foudah, A.I.; Shakeel, F.; Salkini, M.A.; Alshehri, S.; Ghoneim, M.M.; Alam, P. A Green High-Performance Thin-Layer Chromatography Method for the Determination of Caffeine in Commercial Energy Drinks and Formulations. Materials 2022, 15, 2965. https://doi.org/10.3390/ma15092965 Academic Editors: Mihkel Koel and Piotr Cysewski Received: 8 March 2022 Accepted: 7 April 2022 Published: 19 April 2022 Publisher’s Note: MDPI stays neutral with regard to jurisdictional claims in published maps and institutional affil- iations. Copyright: © 2022 by the authors. Licensee MDPI, Basel, Switzerland. This article is an open access article distributed under the terms and conditions of the Creative Commons Attribution (CC BY) license (https:// creativecommons.org/licenses/by/ 4.0/). materials Article A Green High-Performance Thin-Layer Chromatography Method for the Determination of Caffeine in Commercial Energy Drinks and Formulations Ahmed I. Foudah 1 , Faiyaz Shakeel 2 , Mohammad A. Salkini 1 , Sultan Alshehri 2 , Mohammed M. Ghoneim 3 and Prawez Alam 1, * 1 Department of Pharmacognosy, College of Pharmacy, Prince Sattam Bin Abdulaziz University, Al-Kharj 11942, Saudi Arabia; [email protected] (A.I.F.); [email protected] (M.A.S.) 2 Department of Pharmaceutics, College of Pharmacy, King Saud University, Riyadh 11451, Saudi Arabia; [email protected] (F.S.); [email protected] (S.A.) 3 Department of Pharmacy Practice, College of Pharmacy, AlMaarefa University, Ad Diriyah 13713, Saudi Arabia; [email protected] * Correspondence: [email protected] or [email protected] Abstract: The literature on green analytical approaches for caffeine estimation is limited. As a consequence, this study aimed to establish a reverse-phase high-performance thin-layer chromatog- raphy (HPTLC) technique for caffeine estimation in a variety of commercial energy drinks (ED) and pharmaceutical formulations that is rapid, sensitive, and green. The combination of ethanol-water (55:45 vv -1 ) was used as a mobile phase. The detection of caffeine was carried out at 275 nm. The green reverse-phase HPTLC method was linear in the concentration range of 50–800 ng band -1 . Furthermore, the developed method for caffeine estimation was simple, quick, economical, accurate, precise, robust, sensitive, and green. The amount of caffeine in different marketed ED (ED1–ED10) was recorded in the range of 21.02–37.52 mg 100 mL -1 using the developed HPTLC method. However, the amount of caffeine in different commercial formulations (F1–F3) was estimated as 10.63–20.30 mg 100 mL -1 using the same method. The “analytical GREEnness (AGREE)” scale for the developed analytical method was predicted to be 0.80, utilizing 12 distinct components of green analytical chemistry, indicating the HPTLC approach’s excellent greener profile. Overall, the developed method for estimating caffeine in marketed ED and dosage forms was found to be reliable. Keywords: AGREE scale; caffeine; energy drinks; formulations; green HPTLC; validation 1. Introduction Caffeine (1,3,7-trimethylxanthine) is a pseudo-alkaloidal compound, obtained from various plants, such as tea leaves (Thea sinensis), coffee beans (Coffea arabica), and kola nuts (Cola nitida)[1,2]. It has several pharmacological activities, such as central nervous system stimulant, analgesic, antipyretic, anti-inflammatory, antimigraine, and anticancer activity [1–4]. It is an active component of various painkillers and antimigraine pharma- ceutical products [2] in combination with paracetamol [5]. Caffeine is also present in various commercially available energy drinks (ED) and herbal products [2]. As a result, it is critical to conduct a qualitative and quantitative investigation of caffeine in ED and herbal products. A wide range of analytical methods is available for caffeine estimation in commercial ED and herbal products. Several UV-based spectrometry methods have been used to quantify caffeine in commercial ED and herbal products [6–10]. Caffeine has also been determined in commercial ED and herbal products using a variety of high-performance liquid chromatography (HPLC) methods [11–18]. Caffeine in commercial ED has also been determined using ultra-fast liquid chromatography and ultra-performance liquid Materials 2022, 15, 2965. https://doi.org/10.3390/ma15092965 https://www.mdpi.com/journal/materials

Welcome message from author
This document is posted to help you gain knowledge. Please leave a comment to let me know what you think about it! Share it to your friends and learn new things together.
Transcript
�����������������
Citation: Foudah, A.I.; Shakeel, F.;
Salkini, M.A.; Alshehri, S.; Ghoneim,
M.M.; Alam, P. A Green
High-Performance Thin-Layer
Chromatography Method for the
Determination of Caffeine in
Commercial Energy Drinks and
Formulations. Materials 2022, 15, 2965.
https://doi.org/10.3390/ma15092965
Academic Editors: Mihkel Koel and
Piotr Cysewski
Received: 8 March 2022
Accepted: 7 April 2022
Published: 19 April 2022
Publisher’s Note: MDPI stays neutral
with regard to jurisdictional claims in
published maps and institutional affil-
iations.
Copyright: © 2022 by the authors.
Licensee MDPI, Basel, Switzerland.
This article is an open access article
distributed under the terms and
conditions of the Creative Commons
Attribution (CC BY) license (https://
creativecommons.org/licenses/by/
4.0/).
materials
Article
A Green High-Performance Thin-Layer ChromatographyMethod for the Determination of Caffeine in CommercialEnergy Drinks and FormulationsAhmed I. Foudah 1 , Faiyaz Shakeel 2 , Mohammad A. Salkini 1 , Sultan Alshehri 2 ,Mohammed M. Ghoneim 3 and Prawez Alam 1,*
1 Department of Pharmacognosy, College of Pharmacy, Prince Sattam Bin Abdulaziz University,Al-Kharj 11942, Saudi Arabia; [email protected] (A.I.F.); [email protected] (M.A.S.)
2 Department of Pharmaceutics, College of Pharmacy, King Saud University, Riyadh 11451, Saudi Arabia;[email protected] (F.S.); [email protected] (S.A.)
3 Department of Pharmacy Practice, College of Pharmacy, AlMaarefa University, Ad Diriyah 13713, Saudi Arabia;[email protected]
* Correspondence: [email protected] or [email protected]
Abstract: The literature on green analytical approaches for caffeine estimation is limited. As aconsequence, this study aimed to establish a reverse-phase high-performance thin-layer chromatog-raphy (HPTLC) technique for caffeine estimation in a variety of commercial energy drinks (ED) andpharmaceutical formulations that is rapid, sensitive, and green. The combination of ethanol-water(55:45 v v−1) was used as a mobile phase. The detection of caffeine was carried out at 275 nm. Thegreen reverse-phase HPTLC method was linear in the concentration range of 50–800 ng band−1.Furthermore, the developed method for caffeine estimation was simple, quick, economical, accurate,precise, robust, sensitive, and green. The amount of caffeine in different marketed ED (ED1–ED10)was recorded in the range of 21.02–37.52 mg 100 mL−1 using the developed HPTLC method. However,the amount of caffeine in different commercial formulations (F1–F3) was estimated as 10.63–20.30 mg100 mL−1 using the same method. The “analytical GREEnness (AGREE)” scale for the developedanalytical method was predicted to be 0.80, utilizing 12 distinct components of green analyticalchemistry, indicating the HPTLC approach’s excellent greener profile. Overall, the developed methodfor estimating caffeine in marketed ED and dosage forms was found to be reliable.
Keywords: AGREE scale; caffeine; energy drinks; formulations; green HPTLC; validation
1. Introduction
Caffeine (1,3,7-trimethylxanthine) is a pseudo-alkaloidal compound, obtained fromvarious plants, such as tea leaves (Thea sinensis), coffee beans (Coffea arabica), and kolanuts (Cola nitida) [1,2]. It has several pharmacological activities, such as central nervoussystem stimulant, analgesic, antipyretic, anti-inflammatory, antimigraine, and anticanceractivity [1–4]. It is an active component of various painkillers and antimigraine pharma-ceutical products [2] in combination with paracetamol [5]. Caffeine is also present invarious commercially available energy drinks (ED) and herbal products [2]. As a result,it is critical to conduct a qualitative and quantitative investigation of caffeine in ED andherbal products.
A wide range of analytical methods is available for caffeine estimation in commercialED and herbal products. Several UV-based spectrometry methods have been used toquantify caffeine in commercial ED and herbal products [6–10]. Caffeine has also beendetermined in commercial ED and herbal products using a variety of high-performanceliquid chromatography (HPLC) methods [11–18]. Caffeine in commercial ED has alsobeen determined using ultra-fast liquid chromatography and ultra-performance liquid
Materials 2022, 15, 2965. https://doi.org/10.3390/ma15092965 https://www.mdpi.com/journal/materials
Materials 2022, 15, 2965 2 of 12
chromatography methods [19,20]. Some gas-chromatography tandem mass-spectrometry(GC-MS) methods have also been utilized for caffeine estimation in ED [21–23]. Caf-feine measurement in commercial ED, herbal products, and pharmaceutical formula-tions has also been conducted using several high-performance thin-layer chromatography(HPTLC) techniques [2,9,22,24–26]. Furthermore, solid-phase Fourier-transform Ramanspectroscopy [27], surfactant-mediated matrix-assisted laser desorption/ionization [28],microemulsion electrokinetic chromatography [29], and micellar electrokinetic chromatog-raphy [30] methods have been used for the estimation of caffeine in ED and herbal products.A single green HPTLC approach was utilized for caffeine estimation in commercial ED andherbal products using the binary combination of ethyl acetate and methanol as the greensolvents [2]. However, its greenness scale was not estimated. Using ethyl-acetate-ethanol(EtOH) and EtOH-water as the mobile phases, we recently published the green normal-phase and reverse-phase HPTLC methods for the simultaneous determination of caffeineand paracetamol in allopathic formulations [31].
The safety and ecofriendly aspects of most of the reported analytical methods ofcaffeine estimation were not taken into consideration. Green HPTLC methods offer a widerange of advantages, including simplicity, economical performance, low operation costs,rapid analysis, parallel analysis of many samples, rapid detection, and reduced environ-mental pollution in comparison to other methods of analysis [32–35]. As a consequence,a reverse-phase HPTLC method for caffeine estimation was developed in the currentstudy. For the assessment of greenness index of analytical methods, several ecofriendlyapproaches are reported [34–39]. However, the “analytical GREEnness AGREE” approachuses all twelve principles of “green analytical chemistry (GAC)” for the assessment ofgreener index of these techniques [38]. As a consequence, the “AGREE metric methodol-ogy” was utilized for the assessment of the developed reverse-phase HPTLC method’sgreen scale [38]. The investigated solvents such as EtOH and water are categorized asgreen solvents according to GAC principle [40–42]. Due to the safety and non-toxicityof EtOH and water towards the environment, these solvents are considered to be greensolvents [42,43]. Accordingly, the binary mixture of EtOH and water was selected as thegreen solvent system in this research. The goal of the current investigation is to design andvalidate a rapid, sensitive, and environmentally friendly reverse-phase HPTLC methodfor determining caffeine in ED and herbal products. The International Conference for Har-monization (ICH)-Q2-(R1) guidelines [44] were used to validate the green reverse-phaseHPTLC method of caffeine quantification.
2. Materials and Methods2.1. Materials
The working standard of caffeine (potency: 98.8%) was procured from Sigma Aldrich(St. Louis, MO, USA). HPLC-grade solvents ethanol, methanol, and chloroform were pro-cured from E-Merck (Darmstadt, Germany). Commercial ED (ED1–ED10) and herbalproducts (F1–F3) containing caffeine were procured from a local market in Al-Kharj,Saudi Arabia.
2.2. Chromatography and Analytical Conditions
The reverse-phase HPTLC analysis was performed using the CAMAG HPTLC in-strument (CAMAG, Muttenz, Switzerland). The estimation of caffeine was performed on10 × 20 cm glass plates precoated with reverse-phase silica gel 60 F254S plates (E-Merck,Darmstadt, Germany). The samples to the reverse-phase TLC plates were spotted as the6 mm bands utilizing a CAMAG Automatic Sampler 4 (ATS4) applicator (CAMAG, Geneva,Switzerland). The sample applicator was fitted with CAMAG Microliter Syringe (Hamilton,Bonaduz, Switzerland). The application rate for caffeine estimation was constant at 150 nLs−1. The TLC plates were developed in an Automatic Developing Chamber 2 (ADC 2)(CAMAG, Muttenz, Switzerland) to a distance of 80 mm using EtOH-water (55:45, v v−1)greener mobile phase. The development chamber was saturated with vapors of EtOH-water
Materials 2022, 15, 2965 3 of 12
(55:45, v v−1) for 30 min at 22 ◦C. Caffeine was detected using a wavelength of 275 nm at ascanning rate of 20 mm s−1 and slit size set to 4 × 0.45 mm.
2.3. Preparation of Caffeine Standard Solutions for Calibration and Quality Control (QC) Samples
Caffeine standard (10 mg) was dissolved in 100 mL of EtOH-water (55:45, v v−1)solvent system to generate a stock solution of caffeine with a concentration of 100 µg mL−1.To achieve caffeine concentrations in the 50–800 ng band−1 range, different amounts ofthis stock solution were diluted further using EtOH-water (55:45, v v−1) solvent system.Caffeine solutions were spotted onto TLC plates and peak area for caffeine was measured.The caffeine calibration curve was created by plotting caffeine concentrations vs. observedpeak area. In addition, three QC solutions were obtained separately for derivation ofvalidation parameters for the HPTLC method, including low QC (LQC; 100 ng band−1),middle QC (MQC; 500 ng band−1), and high QC (HQC; 800 ng band−1).
2.4. Sample Processing of Caffeine from Marketed ED
Diverse ingredients are present in commercial ED of caffeine. To eliminate all producedgases, the commercial ED (ED1–ED10) samples were degassed using an ultrasonic bath.All ED samples were lyophilized for five days by transferring them into lyophilizer. Afterthe lyophilization process, the obtained dried samples were dissolved in methanol-water(25: 75 v v−1). The liquid-liquid extraction was performed using chloroform to extractcaffeine. The collected chloroform fractions were dried under reduced pressure using arotary evaporator at 40 ◦C. The collected samples were utilized as test solutions to assessthe presence of caffeine in marketed ED.
2.5. Processing of Samples for the Determination of Caffeine in Marketed Herbal Products
The average weight of ten marketed tablets from each herbal product (F1–F3) wascomputed. For each brand (equivalent to 10 mg of caffeine), the tablets were crushed andpowdered. A quantity of each brand’s powder was extracted separately using chloroform(3 × 70 mL) for 30 min. The chloroform extracts from each sample were combined andconcentrated in vacuo. The concentrate from each sample was separately reconstitutedin 10 mL chloroform and stored under refrigeration till further use. Using the developedmethod, the acquired samples were used to quantify the caffeine contents in marketedherbal products.
2.6. Validation Parameters
Using ICH-Q2-R1 guidelines [44], the developed analytical method for caffeine esti-mation was validated for linearity range, accuracy, precision, robustness, sensitivity, andspecificity. Caffeine linearity was assessed by plotting caffeine concentrations vs. observedpeak area. Caffeine linearity was determined in the 100–800 ng band−1 range. The systemsuitability was assessed using the “retardation factor (Rf), asymmetry factor (As), andnumber of theoretical plates per meter (N m−1)”. The “Rf, As, and N m−1” values werecalculated using their stated formulae at MCQ (500 ng band−1) [45].
The accuracy of the suggested analytical procedure was evaluated using the percentrecovery. The percent recovery of caffeine was evaluated at LQC (100 ng band−1), MQC(500 ng band−1), and HQC (800 ng band−1).
Caffeine was measured at LQC, MQC, and HQC on the same day to evaluate intradayprecision, while, it was measured at LQC, MQC, and HQC on three consecutive days toassess intermediate precision for the developed analytical method [44].
To evaluate the robustness of the developed HPTLC method, slight deliberate changesin the mobile phase composition were introduced. For this purpose, mobile phase waschanged to EtOH-water (57:43, v v−1) and EtOH-water (53:47, v v−1), and the changes inpeak area and Rf values were recorded [44].
Materials 2022, 15, 2965 4 of 12
The method sensitivity was determined for limit of detection (LOD) and limit ofquantification (LOQ), utilizing a standard deviation approach. The LOD and LOQ valuesfor the developed analytical method were determined using their regular equations [44,45].
The method specificity/peak purity was assessed by comparing the Rf values and UVspectra of caffeine in ten different marketed ED and three different herbal products to thoseof standard caffeine.
2.7. Determination of Caffeine in Marketed ED and Herbal Products
The caffeine peak areas of the prepared solutions of ten different marketed ED andthree different herbal products were obtained on reverse-phase TLC plates. The amount ofcaffeine in all these samples was determined using the caffeine calibration curve for thedeveloped method.
2.8. Greenness Assessment
The “AGREE metric technique” [38] was used to assess the greener profile of thedeveloped method. The AGREE scales (in the range of 0.0–1.0) for the developed methodwere determined using “AGREE: The Analytical Greenness Calculator (version 0.5, GdanskUniversity of Technology, Gdansk, Poland, 2020)”.
3. Results and Discussion3.1. Method Development
Literature survey revealed a limited number of green analytical methods for thedetermination of caffeine. As a consequence, this investigation was designed to developand validate a green reverse-phase HPTLC method for caffeine estimation in ten differentmarketed ED and three different herbal products.
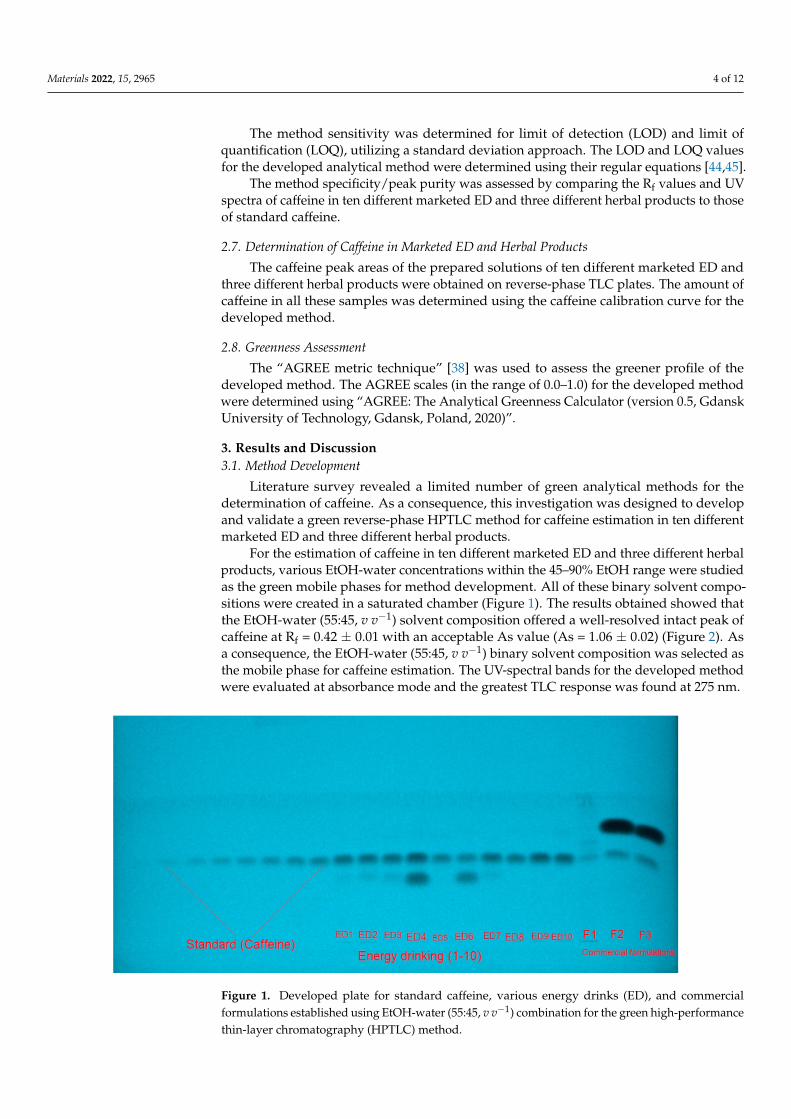
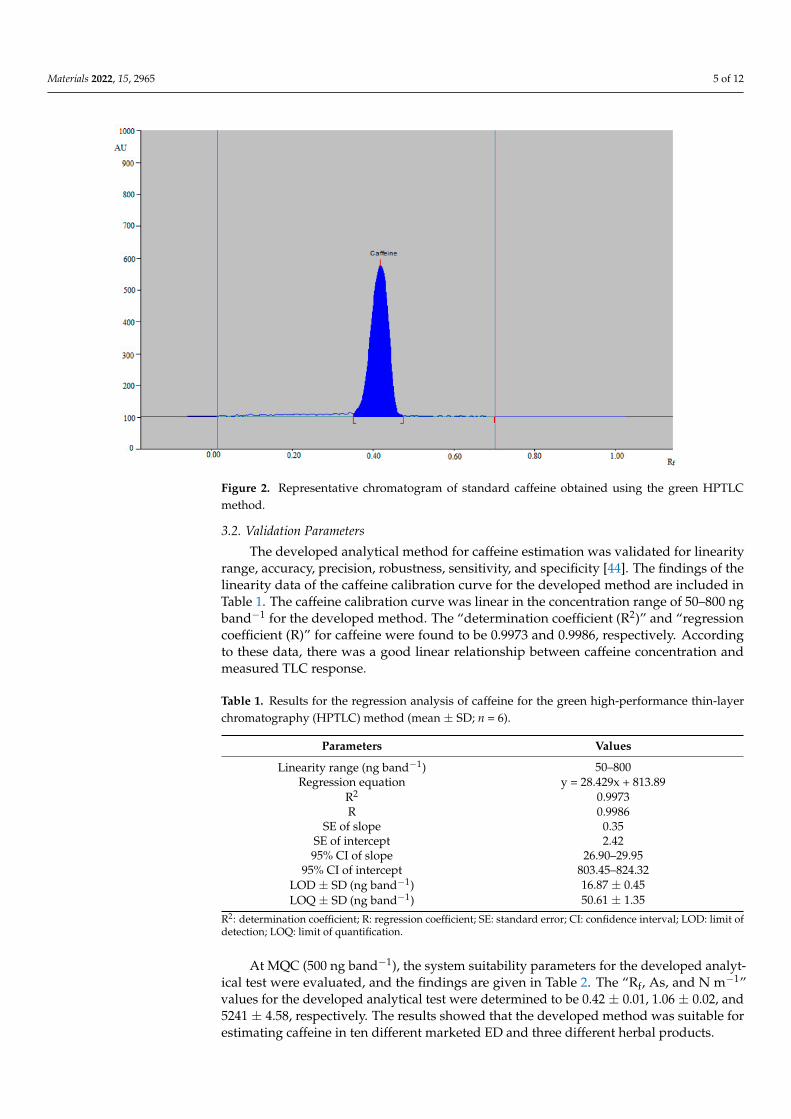
For the estimation of caffeine in ten different marketed ED and three different herbalproducts, various EtOH-water concentrations within the 45–90% EtOH range were studiedas the green mobile phases for method development. All of these binary solvent compo-sitions were created in a saturated chamber (Figure 1). The results obtained showed thatthe EtOH-water (55:45, v v−1) solvent composition offered a well-resolved intact peak ofcaffeine at Rf = 0.42 ± 0.01 with an acceptable As value (As = 1.06 ± 0.02) (Figure 2). Asa consequence, the EtOH-water (55:45, v v−1) binary solvent composition was selected asthe mobile phase for caffeine estimation. The UV-spectral bands for the developed methodwere evaluated at absorbance mode and the greatest TLC response was found at 275 nm.
Figure 1. Developed plate for standard caffeine, various energy drinks (ED), and commercialformulations established using EtOH-water (55:45, v v−1) combination for the green high-performancethin-layer chromatography (HPTLC) method.
Materials 2022, 15, 2965 5 of 12
Figure 2. Representative chromatogram of standard caffeine obtained using the green HPTLCmethod.
3.2. Validation Parameters
The developed analytical method for caffeine estimation was validated for linearityrange, accuracy, precision, robustness, sensitivity, and specificity [44]. The findings of thelinearity data of the caffeine calibration curve for the developed method are included inTable 1. The caffeine calibration curve was linear in the concentration range of 50–800 ngband−1 for the developed method. The “determination coefficient (R2)” and “regressioncoefficient (R)” for caffeine were found to be 0.9973 and 0.9986, respectively. Accordingto these data, there was a good linear relationship between caffeine concentration andmeasured TLC response.
Table 1. Results for the regression analysis of caffeine for the green high-performance thin-layerchromatography (HPTLC) method (mean ± SD; n = 6).
Parameters Values
Linearity range (ng band−1) 50–800Regression equation y = 28.429x + 813.89
R2 0.9973R 0.9986
SE of slope 0.35SE of intercept 2.4295% CI of slope 26.90–29.95
95% CI of intercept 803.45–824.32LOD ± SD (ng band−1) 16.87 ± 0.45LOQ ± SD (ng band−1) 50.61 ± 1.35
R2: determination coefficient; R: regression coefficient; SE: standard error; CI: confidence interval; LOD: limit ofdetection; LOQ: limit of quantification.
At MQC (500 ng band−1), the system suitability parameters for the developed analyt-ical test were evaluated, and the findings are given in Table 2. The “Rf, As, and N m−1”values for the developed analytical test were determined to be 0.42 ± 0.01, 1.06 ± 0.02, and5241 ± 4.58, respectively. The results showed that the developed method was suitable forestimating caffeine in ten different marketed ED and three different herbal products.
Materials 2022, 15, 2965 6 of 12
Table 2. System suitability parameters of caffeine for the green HPTLC method (mean ± SD; n = 3).
Parameters Green HPTLC Method
Rf 0.42 ± 0.01As 1.06 ± 0.02
N m−1 5241 ± 4.58
Rf: retardation factor; As: asymmetry factor; N m−1: number of theoretical plates per meter.
The accuracy assessment findings for the developed method are listed in Table 3.The percent caffeine recovery for the developed method was found to be between 98.5and 101.6 percent at three distinct QC levels. The accuracy of the developed method forcaffeine estimation in ten different marketed ED and three distinct herbal products wasdemonstrated by these percent caffeine recoveries.
Table 3. Accuracy assessment findings of caffeine for the green HPTLC method (mean ± SD; n = 6).
Conc. (ng Band−1) Conc. Found (ng Band−1) ± SD Recovery (%) CV (%)
100 98.52 ± 1.36 98.5 1.38500 508.23 ± 3.54 101.6 0.69800 788.36 ± 6.94 98.5 0.88
The precision for the developed method was measured as the percent of the coefficientof variance (% CV) and the findings are listed in Table 4. The results revealed the precisionof the developed method for caffeine estimation in ten different marketed ED and threedifferent herbal products.
Table 4. Precision assessment findings of caffeine for the green HPTLC method (mean ± SD; n = 6).
Conc.(ng Band−1)
Intraday Precision Interday Precision
Conc. Found (ngBand−1) ± SD
StandardError CV (%) Conc. Found (ng
Band−1) ± SDStandard
Error CV (%)
100 101.45 ± 0.84 0.34 0.82 99.21 ± 0.92 0.37 0.92500 494.31 ± 3.11 1.26 0.62 491.23 ± 3.53 1.44 0.71800 792.34 ± 4.74 1.93 0.59 806.32 ± 5.15 2.10 0.63
The data from the robustness study for the developed method are listed in Table 5.The percent CVs for the robustness analysis for the developed method were 0.65–0.77%.The Rf values of caffeine were found to be 0.41–0.43. The minor deviations in the Rf valuesof caffeine and lower % CVs revealed the robustness of the developed method for caffeineestimation in ten ED and three herbal products.
Table 5. Robustness assessment of findings of caffeine for the green HPTLC method (mean ± SD; n = 6).
Conc.(ng Band−1)
Mobile Phase Composition (EtOH-Water) ResultsOriginal Used Conc. (ng Band−1) ± SD CV (%) Rf
57:43 +2.0 492.54 ± 3.22 0.65 0.41500 55:45 55:45 0.0 504.51 ± 3.66 0.72 0.42
53:47 −2.0 511.21 ± 3.97 0.77 0.43
The sensitivity of the developed method was measured as “LOD and LOQ” andthe findings are presented in Table 1. The “LOD and LOQ” for the developed methodwere determined to be 16.87 ± 0.45 and 50.61 ± 1.35 ng band−1, respectively, for caffeineestimation. These values of “LOD and LOQ” for the developed method revealed thesensitivity for the estimation of low levels of caffeine in ten different marketed ED andthree different herbal products.
Materials 2022, 15, 2965 7 of 12
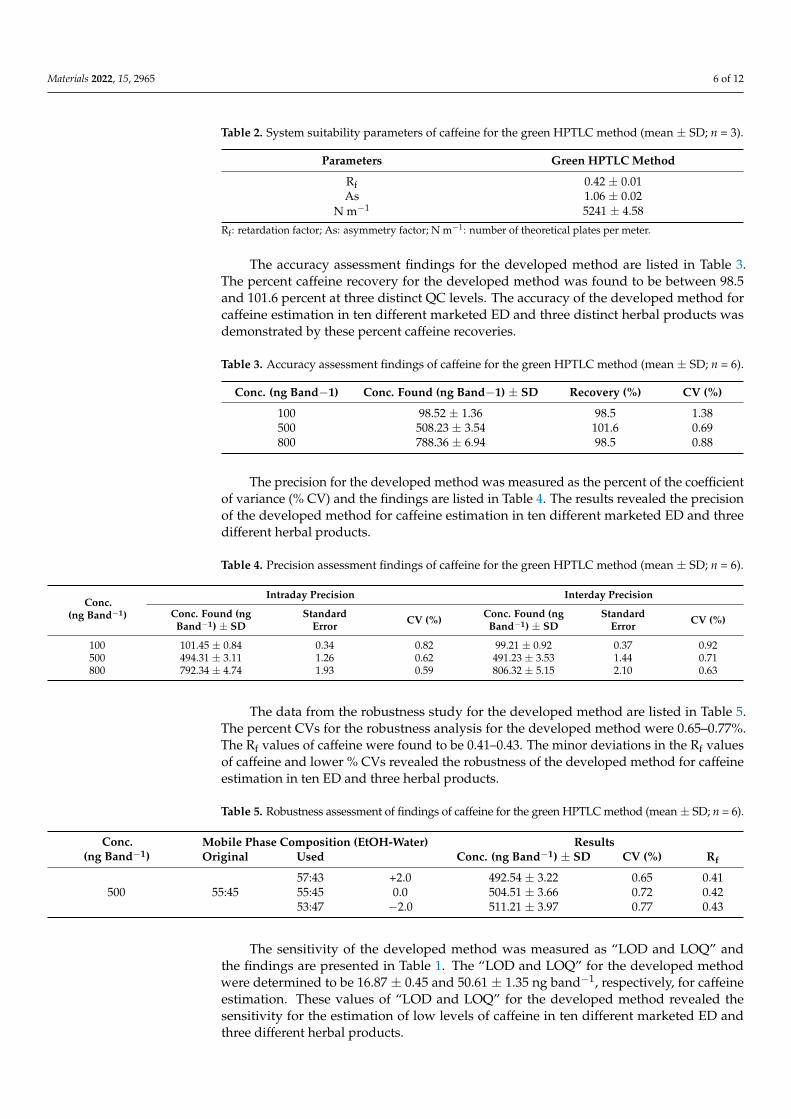
The peak purity and specificity of the developed method was determined by compar-ing the UV spectra of caffeine (275 nm) in ten different marketed ED and three differentherbal products with that of standard caffeine. Figure 3 presents the UV spectra of standardcaffeine and caffeine in ten different marketed ED and three different herbal products,superimposed. The identical UV spectra, Rf values, and detection wavelength of caffeine instandard caffeine, ten commercial ED, and three herbal products demonstrated the peakpurity and specificity of the developed method.
Figure 3. UV absorption spectra of standard caffeine, different ED, and various commercial formula-tions, superimposed.
3.3. Determination of Caffeine in Marketed ED and Herbal Products
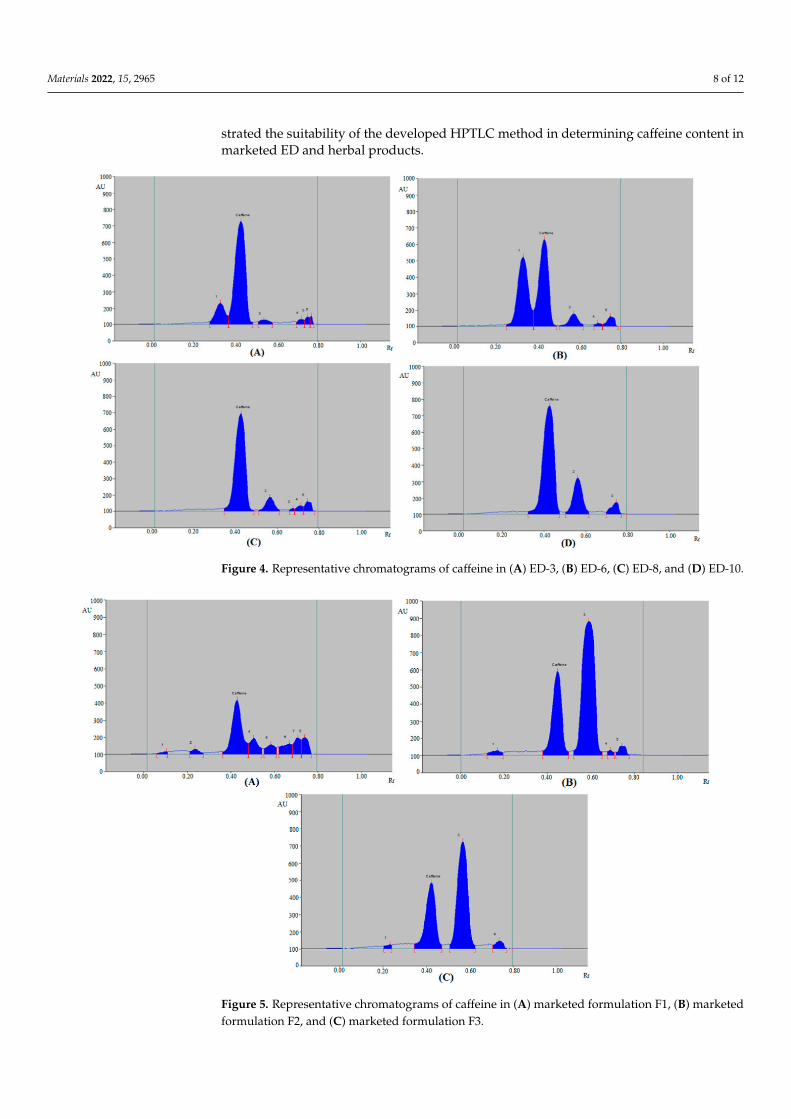
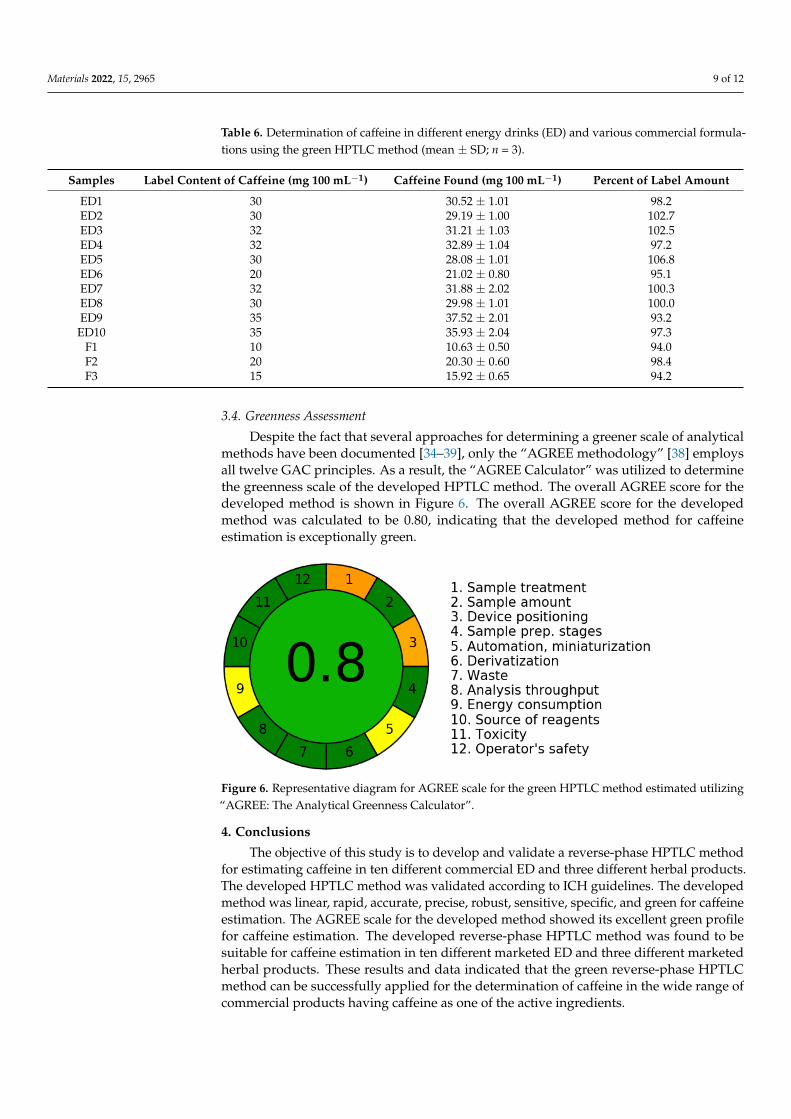
The validated method was applied to estimate caffeine content in ten marketed EDand three herbal products. By comparing the single TLC spot at Rf = 0.42 ± 0.01 for caffeinein ED and herbal products with those of standard caffeine, the HPTLC peak of caffeinefrom ten ED and three herbal products was verified. The representative densitograms ofcaffeine in some ED, such as ED3, ED6, ED8, and ED10 are included in Figure 4, which pre-sented concordant peaks of caffeine with that of standard caffeine. Similar chromatogramswere also recorded for other ED, such as ED1, ED2, ED4, ED5, ED7, and ED9 (Figure notshown). Furthermore, five, four, four, and two additional peaks were also detected inED3 (Figure 4A), ED6 (Figure 4B), ED8 (Figure 4C), and ED10 (Figure 4D), respectively.The densitograms of caffeine in herbal products F1–F3 are included in Figure 5, whichalso presented the caffeine peak. Additionally, seven, four, and three peaks were alsodetected in herbal products F1 (Figure 5A), F2 (Figure 5B), and F3 (Figure 5C), respec-tively. The existence of extra peaks in various ED and herbal products indicated thatthe developed HPTLC method might be used to estimate caffeine in the presence of im-purities/different substances. The caffeine content of ten different ED and three herbalproducts was estimated using caffeine calibration curve and the findings are summarizedin Table 6. The amount of caffeine in the ED (ED1–ED10) was recorded in the range of21.02–37.52 mg 100 mL−1. However, the amount of caffeine in the herbal products (F1–F3)was 10.63–20.30 mg 100 mL−1. The caffeine content of the products was expressed as apercentage of the label claim for each product as recorded in Table 6. These results demon-
Materials 2022, 15, 2965 8 of 12
strated the suitability of the developed HPTLC method in determining caffeine content inmarketed ED and herbal products.
Figure 4. Representative chromatograms of caffeine in (A) ED-3, (B) ED-6, (C) ED-8, and (D) ED-10.
Figure 5. Representative chromatograms of caffeine in (A) marketed formulation F1, (B) marketedformulation F2, and (C) marketed formulation F3.
Materials 2022, 15, 2965 9 of 12
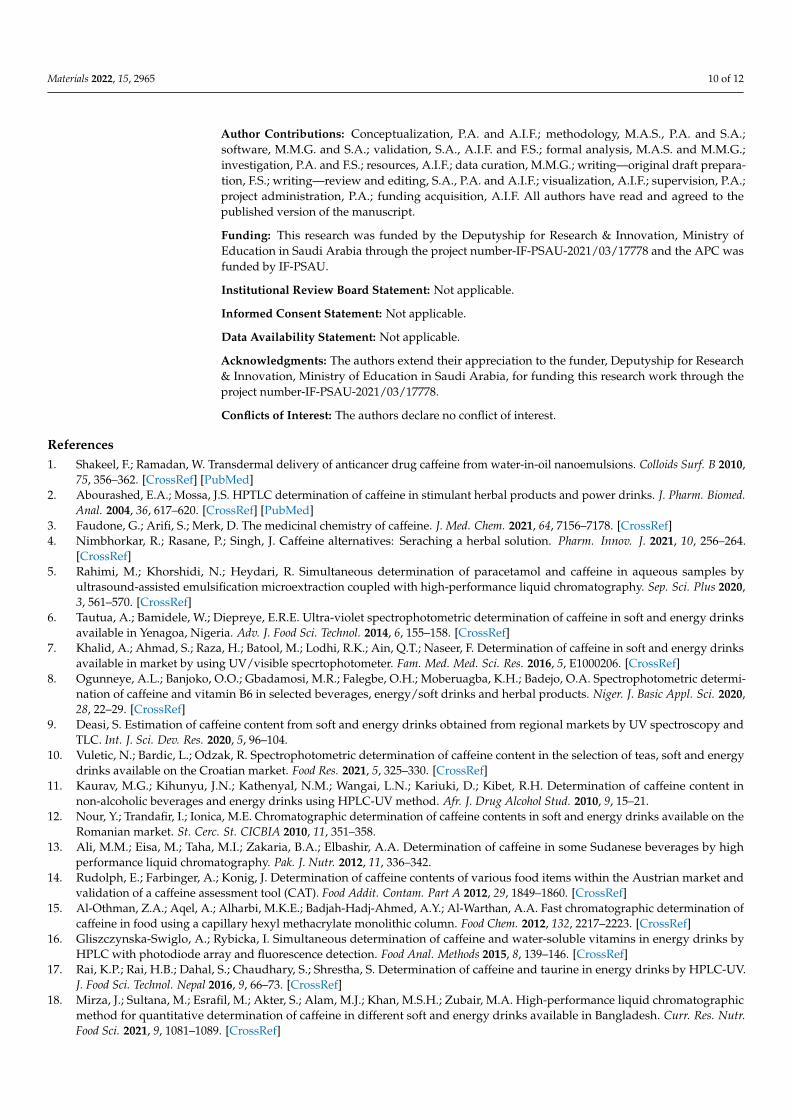
Table 6. Determination of caffeine in different energy drinks (ED) and various commercial formula-tions using the green HPTLC method (mean ± SD; n = 3).
Samples Label Content of Caffeine (mg 100 mL−1) Caffeine Found (mg 100 mL−1) Percent of Label Amount
ED1 30 30.52 ± 1.01 98.2ED2 30 29.19 ± 1.00 102.7ED3 32 31.21 ± 1.03 102.5ED4 32 32.89 ± 1.04 97.2ED5 30 28.08 ± 1.01 106.8ED6 20 21.02 ± 0.80 95.1ED7 32 31.88 ± 2.02 100.3ED8 30 29.98 ± 1.01 100.0ED9 35 37.52 ± 2.01 93.2ED10 35 35.93 ± 2.04 97.3
F1 10 10.63 ± 0.50 94.0F2 20 20.30 ± 0.60 98.4F3 15 15.92 ± 0.65 94.2
3.4. Greenness Assessment
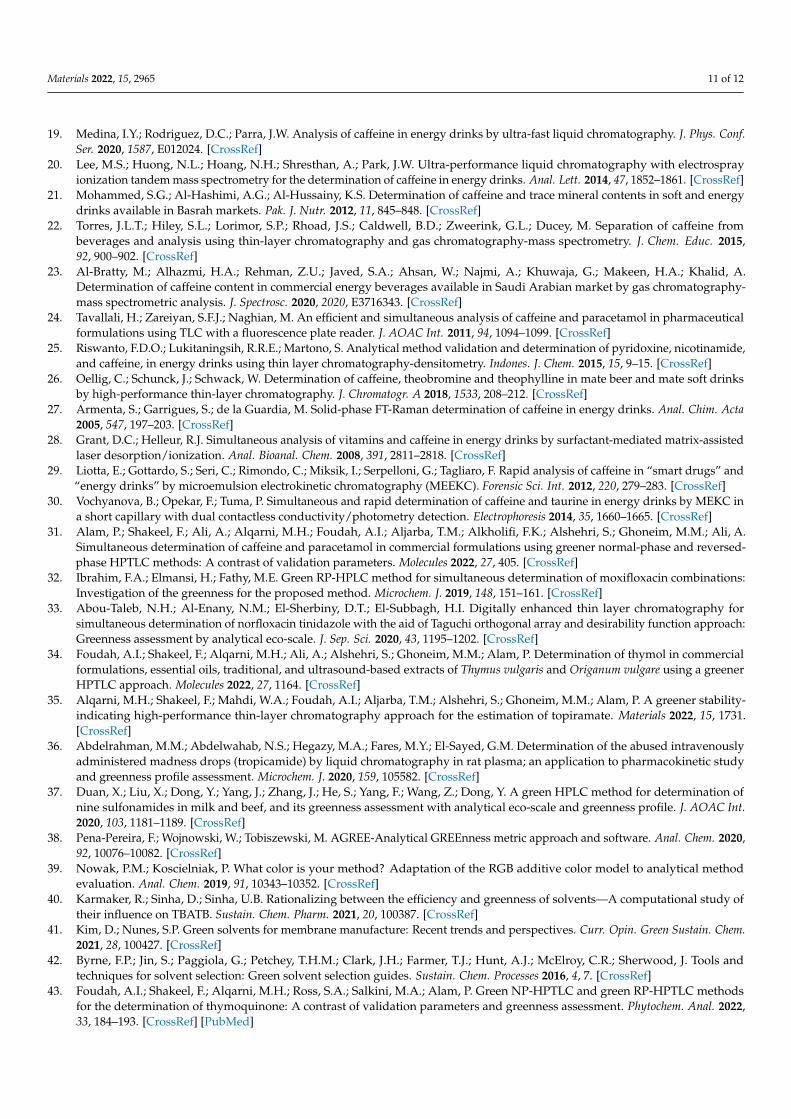
Despite the fact that several approaches for determining a greener scale of analyticalmethods have been documented [34–39], only the “AGREE methodology” [38] employsall twelve GAC principles. As a result, the “AGREE Calculator” was utilized to determinethe greenness scale of the developed HPTLC method. The overall AGREE score for thedeveloped method is shown in Figure 6. The overall AGREE score for the developedmethod was calculated to be 0.80, indicating that the developed method for caffeineestimation is exceptionally green.
Figure 6. Representative diagram for AGREE scale for the green HPTLC method estimated utilizing“AGREE: The Analytical Greenness Calculator”.
4. Conclusions
The objective of this study is to develop and validate a reverse-phase HPTLC methodfor estimating caffeine in ten different commercial ED and three different herbal products.The developed HPTLC method was validated according to ICH guidelines. The developedmethod was linear, rapid, accurate, precise, robust, sensitive, specific, and green for caffeineestimation. The AGREE scale for the developed method showed its excellent green profilefor caffeine estimation. The developed reverse-phase HPTLC method was found to besuitable for caffeine estimation in ten different marketed ED and three different marketedherbal products. These results and data indicated that the green reverse-phase HPTLCmethod can be successfully applied for the determination of caffeine in the wide range ofcommercial products having caffeine as one of the active ingredients.
Materials 2022, 15, 2965 10 of 12
Author Contributions: Conceptualization, P.A. and A.I.F.; methodology, M.A.S., P.A. and S.A.;software, M.M.G. and S.A.; validation, S.A., A.I.F. and F.S.; formal analysis, M.A.S. and M.M.G.;investigation, P.A. and F.S.; resources, A.I.F.; data curation, M.M.G.; writing—original draft prepara-tion, F.S.; writing—review and editing, S.A., P.A. and A.I.F.; visualization, A.I.F.; supervision, P.A.;project administration, P.A.; funding acquisition, A.I.F. All authors have read and agreed to thepublished version of the manuscript.
Funding: This research was funded by the Deputyship for Research & Innovation, Ministry ofEducation in Saudi Arabia through the project number-IF-PSAU-2021/03/17778 and the APC wasfunded by IF-PSAU.
Institutional Review Board Statement: Not applicable.
Informed Consent Statement: Not applicable.
Data Availability Statement: Not applicable.
Acknowledgments: The authors extend their appreciation to the funder, Deputyship for Research& Innovation, Ministry of Education in Saudi Arabia, for funding this research work through theproject number-IF-PSAU-2021/03/17778.
Conflicts of Interest: The authors declare no conflict of interest.
References1. Shakeel, F.; Ramadan, W. Transdermal delivery of anticancer drug caffeine from water-in-oil nanoemulsions. Colloids Surf. B 2010,
75, 356–362. [CrossRef] [PubMed]2. Abourashed, E.A.; Mossa, J.S. HPTLC determination of caffeine in stimulant herbal products and power drinks. J. Pharm. Biomed.
Anal. 2004, 36, 617–620. [CrossRef] [PubMed]3. Faudone, G.; Arifi, S.; Merk, D. The medicinal chemistry of caffeine. J. Med. Chem. 2021, 64, 7156–7178. [CrossRef]4. Nimbhorkar, R.; Rasane, P.; Singh, J. Caffeine alternatives: Seraching a herbal solution. Pharm. Innov. J. 2021, 10, 256–264.
[CrossRef]5. Rahimi, M.; Khorshidi, N.; Heydari, R. Simultaneous determination of paracetamol and caffeine in aqueous samples by
ultrasound-assisted emulsification microextraction coupled with high-performance liquid chromatography. Sep. Sci. Plus 2020,3, 561–570. [CrossRef]
6. Tautua, A.; Bamidele, W.; Diepreye, E.R.E. Ultra-violet spectrophotometric determination of caffeine in soft and energy drinksavailable in Yenagoa, Nigeria. Adv. J. Food Sci. Technol. 2014, 6, 155–158. [CrossRef]
7. Khalid, A.; Ahmad, S.; Raza, H.; Batool, M.; Lodhi, R.K.; Ain, Q.T.; Naseer, F. Determination of caffeine in soft and energy drinksavailable in market by using UV/visible specrtophotometer. Fam. Med. Med. Sci. Res. 2016, 5, E1000206. [CrossRef]
8. Ogunneye, A.L.; Banjoko, O.O.; Gbadamosi, M.R.; Falegbe, O.H.; Moberuagba, K.H.; Badejo, O.A. Spectrophotometric determi-nation of caffeine and vitamin B6 in selected beverages, energy/soft drinks and herbal products. Niger. J. Basic Appl. Sci. 2020,28, 22–29. [CrossRef]
9. Deasi, S. Estimation of caffeine content from soft and energy drinks obtained from regional markets by UV spectroscopy andTLC. Int. J. Sci. Dev. Res. 2020, 5, 96–104.
10. Vuletic, N.; Bardic, L.; Odzak, R. Spectrophotometric determination of caffeine content in the selection of teas, soft and energydrinks available on the Croatian market. Food Res. 2021, 5, 325–330. [CrossRef]
11. Kaurav, M.G.; Kihunyu, J.N.; Kathenyal, N.M.; Wangai, L.N.; Kariuki, D.; Kibet, R.H. Determination of caffeine content innon-alcoholic beverages and energy drinks using HPLC-UV method. Afr. J. Drug Alcohol Stud. 2010, 9, 15–21.
12. Nour, Y.; Trandafir, I.; Ionica, M.E. Chromatographic determination of caffeine contents in soft and energy drinks available on theRomanian market. St. Cerc. St. CICBIA 2010, 11, 351–358.
13. Ali, M.M.; Eisa, M.; Taha, M.I.; Zakaria, B.A.; Elbashir, A.A. Determination of caffeine in some Sudanese beverages by highperformance liquid chromatography. Pak. J. Nutr. 2012, 11, 336–342.
14. Rudolph, E.; Farbinger, A.; Konig, J. Determination of caffeine contents of various food items within the Austrian market andvalidation of a caffeine assessment tool (CAT). Food Addit. Contam. Part A 2012, 29, 1849–1860. [CrossRef]
15. Al-Othman, Z.A.; Aqel, A.; Alharbi, M.K.E.; Badjah-Hadj-Ahmed, A.Y.; Al-Warthan, A.A. Fast chromatographic determination ofcaffeine in food using a capillary hexyl methacrylate monolithic column. Food Chem. 2012, 132, 2217–2223. [CrossRef]
16. Gliszczynska-Swiglo, A.; Rybicka, I. Simultaneous determination of caffeine and water-soluble vitamins in energy drinks byHPLC with photodiode array and fluorescence detection. Food Anal. Methods 2015, 8, 139–146. [CrossRef]
17. Rai, K.P.; Rai, H.B.; Dahal, S.; Chaudhary, S.; Shrestha, S. Determination of caffeine and taurine in energy drinks by HPLC-UV.J. Food Sci. Technol. Nepal 2016, 9, 66–73. [CrossRef]
18. Mirza, J.; Sultana, M.; Esrafil, M.; Akter, S.; Alam, M.J.; Khan, M.S.H.; Zubair, M.A. High-performance liquid chromatographicmethod for quantitative determination of caffeine in different soft and energy drinks available in Bangladesh. Curr. Res. Nutr.Food Sci. 2021, 9, 1081–1089. [CrossRef]
Materials 2022, 15, 2965 11 of 12
19. Medina, I.Y.; Rodriguez, D.C.; Parra, J.W. Analysis of caffeine in energy drinks by ultra-fast liquid chromatography. J. Phys. Conf.Ser. 2020, 1587, E012024. [CrossRef]
20. Lee, M.S.; Huong, N.L.; Hoang, N.H.; Shresthan, A.; Park, J.W. Ultra-performance liquid chromatography with electrosprayionization tandem mass spectrometry for the determination of caffeine in energy drinks. Anal. Lett. 2014, 47, 1852–1861. [CrossRef]
21. Mohammed, S.G.; Al-Hashimi, A.G.; Al-Hussainy, K.S. Determination of caffeine and trace mineral contents in soft and energydrinks available in Basrah markets. Pak. J. Nutr. 2012, 11, 845–848. [CrossRef]
22. Torres, J.L.T.; Hiley, S.L.; Lorimor, S.P.; Rhoad, J.S.; Caldwell, B.D.; Zweerink, G.L.; Ducey, M. Separation of caffeine frombeverages and analysis using thin-layer chromatography and gas chromatography-mass spectrometry. J. Chem. Educ. 2015,92, 900–902. [CrossRef]
23. Al-Bratty, M.; Alhazmi, H.A.; Rehman, Z.U.; Javed, S.A.; Ahsan, W.; Najmi, A.; Khuwaja, G.; Makeen, H.A.; Khalid, A.Determination of caffeine content in commercial energy beverages available in Saudi Arabian market by gas chromatography-mass spectrometric analysis. J. Spectrosc. 2020, 2020, E3716343. [CrossRef]
24. Tavallali, H.; Zareiyan, S.F.J.; Naghian, M. An efficient and simultaneous analysis of caffeine and paracetamol in pharmaceuticalformulations using TLC with a fluorescence plate reader. J. AOAC Int. 2011, 94, 1094–1099. [CrossRef]
25. Riswanto, F.D.O.; Lukitaningsih, R.R.E.; Martono, S. Analytical method validation and determination of pyridoxine, nicotinamide,and caffeine, in energy drinks using thin layer chromatography-densitometry. Indones. J. Chem. 2015, 15, 9–15. [CrossRef]
26. Oellig, C.; Schunck, J.; Schwack, W. Determination of caffeine, theobromine and theophylline in mate beer and mate soft drinksby high-performance thin-layer chromatography. J. Chromatogr. A 2018, 1533, 208–212. [CrossRef]
27. Armenta, S.; Garrigues, S.; de la Guardia, M. Solid-phase FT-Raman determination of caffeine in energy drinks. Anal. Chim. Acta2005, 547, 197–203. [CrossRef]
28. Grant, D.C.; Helleur, R.J. Simultaneous analysis of vitamins and caffeine in energy drinks by surfactant-mediated matrix-assistedlaser desorption/ionization. Anal. Bioanal. Chem. 2008, 391, 2811–2818. [CrossRef]
29. Liotta, E.; Gottardo, S.; Seri, C.; Rimondo, C.; Miksik, I.; Serpelloni, G.; Tagliaro, F. Rapid analysis of caffeine in “smart drugs” and“energy drinks” by microemulsion electrokinetic chromatography (MEEKC). Forensic Sci. Int. 2012, 220, 279–283. [CrossRef]
30. Vochyanova, B.; Opekar, F.; Tuma, P. Simultaneous and rapid determination of caffeine and taurine in energy drinks by MEKC ina short capillary with dual contactless conductivity/photometry detection. Electrophoresis 2014, 35, 1660–1665. [CrossRef]
31. Alam, P.; Shakeel, F.; Ali, A.; Alqarni, M.H.; Foudah, A.I.; Aljarba, T.M.; Alkholifi, F.K.; Alshehri, S.; Ghoneim, M.M.; Ali, A.Simultaneous determination of caffeine and paracetamol in commercial formulations using greener normal-phase and reversed-phase HPTLC methods: A contrast of validation parameters. Molecules 2022, 27, 405. [CrossRef]
32. Ibrahim, F.A.; Elmansi, H.; Fathy, M.E. Green RP-HPLC method for simultaneous determination of moxifloxacin combinations:Investigation of the greenness for the proposed method. Microchem. J. 2019, 148, 151–161. [CrossRef]
33. Abou-Taleb, N.H.; Al-Enany, N.M.; El-Sherbiny, D.T.; El-Subbagh, H.I. Digitally enhanced thin layer chromatography forsimultaneous determination of norfloxacin tinidazole with the aid of Taguchi orthogonal array and desirability function approach:Greenness assessment by analytical eco-scale. J. Sep. Sci. 2020, 43, 1195–1202. [CrossRef]
34. Foudah, A.I.; Shakeel, F.; Alqarni, M.H.; Ali, A.; Alshehri, S.; Ghoneim, M.M.; Alam, P. Determination of thymol in commercialformulations, essential oils, traditional, and ultrasound-based extracts of Thymus vulgaris and Origanum vulgare using a greenerHPTLC approach. Molecules 2022, 27, 1164. [CrossRef]
35. Alqarni, M.H.; Shakeel, F.; Mahdi, W.A.; Foudah, A.I.; Aljarba, T.M.; Alshehri, S.; Ghoneim, M.M.; Alam, P. A greener stability-indicating high-performance thin-layer chromatography approach for the estimation of topiramate. Materials 2022, 15, 1731.[CrossRef]
36. Abdelrahman, M.M.; Abdelwahab, N.S.; Hegazy, M.A.; Fares, M.Y.; El-Sayed, G.M. Determination of the abused intravenouslyadministered madness drops (tropicamide) by liquid chromatography in rat plasma; an application to pharmacokinetic studyand greenness profile assessment. Microchem. J. 2020, 159, 105582. [CrossRef]
37. Duan, X.; Liu, X.; Dong, Y.; Yang, J.; Zhang, J.; He, S.; Yang, F.; Wang, Z.; Dong, Y. A green HPLC method for determination ofnine sulfonamides in milk and beef, and its greenness assessment with analytical eco-scale and greenness profile. J. AOAC Int.2020, 103, 1181–1189. [CrossRef]
38. Pena-Pereira, F.; Wojnowski, W.; Tobiszewski, M. AGREE-Analytical GREEnness metric approach and software. Anal. Chem. 2020,92, 10076–10082. [CrossRef]
39. Nowak, P.M.; Koscielniak, P. What color is your method? Adaptation of the RGB additive color model to analytical methodevaluation. Anal. Chem. 2019, 91, 10343–10352. [CrossRef]
40. Karmaker, R.; Sinha, D.; Sinha, U.B. Rationalizing between the efficiency and greenness of solvents—A computational study oftheir influence on TBATB. Sustain. Chem. Pharm. 2021, 20, 100387. [CrossRef]
41. Kim, D.; Nunes, S.P. Green solvents for membrane manufacture: Recent trends and perspectives. Curr. Opin. Green Sustain. Chem.2021, 28, 100427. [CrossRef]
42. Byrne, F.P.; Jin, S.; Paggiola, G.; Petchey, T.H.M.; Clark, J.H.; Farmer, T.J.; Hunt, A.J.; McElroy, C.R.; Sherwood, J. Tools andtechniques for solvent selection: Green solvent selection guides. Sustain. Chem. Processes 2016, 4, 7. [CrossRef]
43. Foudah, A.I.; Shakeel, F.; Alqarni, M.H.; Ross, S.A.; Salkini, M.A.; Alam, P. Green NP-HPTLC and green RP-HPTLC methodsfor the determination of thymoquinone: A contrast of validation parameters and greenness assessment. Phytochem. Anal. 2022,33, 184–193. [CrossRef] [PubMed]

Materials 2022, 15, 2965 12 of 12
44. Q2 (R1) validation of analytical procedures–text and methodology. In Proceedings of the International Conference on Harmoniza-tion (ICH), Geneva, Switzerland, 1–13 November 2005.
45. Foudah, A.I.; Shakeel, F.; Alqarni, M.H.; Alam, P. A rapid and sensitive stability-indicating RP-HPTLC method for the quantitationof flibanserin compared to green NP-HPTLC method: Validation studies and greenness assessment. Microchem. J. 2021,164, 105960. [CrossRef]
Related Documents