A Graphical, Self-Organizing Approach to Classifying Electronic Meeting Output Richard E. Orwig and Hsinchun Chen MIS Department, Karl Eller Graduate School of Management, University of Arizona, McClelland Hall, Tucson, AZ 85721. E-mail: [email protected]; [email protected] Jay F. Nunamaker, Jr. MIS Department, College of Business and Public Administration, University of Arizona, Tucson, AZ 85721. E-mail: nunamaker @bpa.arizona.edu This article describes research in the application of a ( topics ) in an electronic meeting setting. Electronic meet- Kohonen Self-Organizing Map ( SOM ) to the problem of ing systems (EMSs) provide support for large groups classification of electronic brainstorming output and an interactively working on a single problem or collection evaluation of the results. Electronic brainstorming is one of problems ( Nunamaker, Dennis, Valacich, & Vogel, of the most productive tools in the Electronic Meeting 1991; Vogel, Nunamaker, Martz, Grohowski, & McGoff, System called GroupSystems. A major step in group problem solving involves the classification of electronic 1989 ) . Large groups of people are thereby enabled to use brainstorming output into a manageable list of concepts, a network of computers to discuss complex organizational topics, or issues that can be further evaluated by the problems electronically. These electronic discussions cre- group. This step is problematic due to information over- ate large quantities of text in a very short period of time. A load and the cognitive demand of processing a large major stage in the group problem solving process involves quantity of textual data. This research builds upon previ- ous work in automating the meeting classification pro- classifying these large quantities of text into a manageable cess using a Hopfield neural network. Evaluation of the list or set of concepts/topics. Experience with this classi- Kohonen output comparing it with Hopfield and human fication process has shown that meeting convergence is expert output using the same set of data found that the problematic for participants and meeting facilitators. Kohonen SOM performed as well as a human expert in representing term association in the meeting output and The prevailing EMS provides only clerical classifica- outperformed the Hopfield neural network algorithm. In tion support for browsing the text and creating a list of addition, recall of consensus meeting concepts and top- topics for group members. However, it does not provide ics using the Kohonen algorithm was equivalent to that system support for managing or organizing the large vol- of the human expert. However, precision of the Kohonen results was poor. The graphical representation of textual ume of text that may be created as output from an elec- data produced by the Kohonen SOM suggests many op- tronic brainstorming session. The synthesis of electronic portunities for improving information organization of tex- brainstorming comments is a classification problem. It is tual information. Increasing uses of electronic mail, com- something that humans currently do well, but not will- puter-based bulletin board systems, and world-wide ingly, a situation that suggests using an artificial intelli- web services present unique challenges and opportuni- ties for a system-aided classification approach. This re- gence approach to understanding how humans classify search has shown that the Kohonen SOM may be used concepts and developing a system to test whether better to automatically create ‘‘a picture that can represent a classification support for groups can be provided. thousand ( or more ) words.’’ This research is a continuation of research previously reported in Chen, Hsu, Orwig, Hoopes, & Nunamaker 1. Introduction (1994) in which the underlying classification algorithm This research used an artificial intelligence approach used was a Hopfield neural network. This research used to understanding the problem of classification of concepts a Kohonen Self-Organizing Map (SOM) to classify elec- tronic meeting output, and reports the experiment that Received July 18, 1995; revised January 29, 1996; accepted January was performed to evaluate the classification output of a 29, 1996. human, the Hopfield algorithm, and the Kohonen SOM. Section 2 provides a description of an electronic meet- q 1997 John Wiley & Sons, Inc. JOURNAL OF THE AMERICAN SOCIETY FOR INFORMATION SCIENCE. 48(2):157–170, 1997 CCC 0002-8231/97 / 020157-14 876 / 8n11$$0002 12-04-96 19:37:48 jasa W: JASIS

Welcome message from author
This document is posted to help you gain knowledge. Please leave a comment to let me know what you think about it! Share it to your friends and learn new things together.
Transcript

A Graphical, Self-Organizing Approach to ClassifyingElectronic Meeting Output
Richard E. Orwig and Hsinchun ChenMIS Department, Karl Eller Graduate School of Management, University of Arizona, McClelland Hall, Tucson,AZ 85721. E-mail: [email protected]; [email protected]
Jay F. Nunamaker, Jr.MIS Department, College of Business and Public Administration, University of Arizona, Tucson, AZ 85721.E-mail: [email protected]
This article describes research in the application of a ( topics) in an electronic meeting setting. Electronic meet-Kohonen Self-Organizing Map (SOM) to the problem of ing systems (EMSs) provide support for large groupsclassification of electronic brainstorming output and an interactively working on a single problem or collectionevaluation of the results. Electronic brainstorming is one
of problems (Nunamaker, Dennis, Valacich, & Vogel,of the most productive tools in the Electronic Meeting1991; Vogel, Nunamaker, Martz, Grohowski, & McGoff,System called GroupSystems. A major step in group
problem solving involves the classification of electronic 1989). Large groups of people are thereby enabled to usebrainstorming output into a manageable list of concepts, a network of computers to discuss complex organizationaltopics, or issues that can be further evaluated by the problems electronically. These electronic discussions cre-group. This step is problematic due to information over-
ate large quantities of text in a very short period of time. Aload and the cognitive demand of processing a largemajor stage in the group problem solving process involvesquantity of textual data. This research builds upon previ-
ous work in automating the meeting classification pro- classifying these large quantities of text into a manageablecess using a Hopfield neural network. Evaluation of the list or set of concepts/ topics. Experience with this classi-Kohonen output comparing it with Hopfield and human
fication process has shown that meeting convergence isexpert output using the same set of data found that theproblematic for participants and meeting facilitators.Kohonen SOM performed as well as a human expert in
representing term association in the meeting output and The prevailing EMS provides only clerical classifica-outperformed the Hopfield neural network algorithm. In tion support for browsing the text and creating a list ofaddition, recall of consensus meeting concepts and top-
topics for group members. However, it does not provideics using the Kohonen algorithm was equivalent to thatsystem support for managing or organizing the large vol-of the human expert. However, precision of the Kohonen
results was poor. The graphical representation of textual ume of text that may be created as output from an elec-data produced by the Kohonen SOM suggests many op- tronic brainstorming session. The synthesis of electronicportunities for improving information organization of tex- brainstorming comments is a classification problem. It istual information. Increasing uses of electronic mail, com-
something that humans currently do well, but not will-puter-based bulletin board systems, and world-wideingly, a situation that suggests using an artificial intelli-web services present unique challenges and opportuni-
ties for a system-aided classification approach. This re- gence approach to understanding how humans classifysearch has shown that the Kohonen SOM may be used concepts and developing a system to test whether betterto automatically create ‘‘a picture that can represent a
classification support for groups can be provided.thousand (or more) words.’’This research is a continuation of research previously
reported in Chen, Hsu, Orwig, Hoopes, & Nunamaker1. Introduction(1994) in which the underlying classification algorithmThis research used an artificial intelligence approachused was a Hopfield neural network. This research usedto understanding the problem of classification of conceptsa Kohonen Self-Organizing Map (SOM) to classify elec-tronic meeting output, and reports the experiment that
Received July 18, 1995; revised January 29, 1996; accepted January was performed to evaluate the classification output of a29, 1996.
human, the Hopfield algorithm, and the Kohonen SOM.Section 2 provides a description of an electronic meet-q 1997 John Wiley & Sons, Inc.
JOURNAL OF THE AMERICAN SOCIETY FOR INFORMATION SCIENCE. 48(2) :157–170, 1997 CCC 0002-8231/97/020157-14
876/ 8n11$$0002 12-04-96 19:37:48 jasa W: JASIS

ing system and describes in more detail the classificationproblem that exists in the group problem-solving process.Section 3 surveys the literature concerning classification.Section 4 describes this research—the application of theKohonen SOM to the meeting output classification prob-lem. Section 5 describes an experiment that evaluatedthe classification performed by the Kohonen SOM bycomparing it with those of a human expert and a Hopfieldneural network. Finally, Section 6 discusses conclusionsand directions for future research.
2. The Problem: Classification in an ElectronicMeeting System
EMSs are a subset of a general category of systems,called ‘‘groupware.’’ Ellis et al. define groupware as FIG. 1. Electronic meeting system research model.‘‘computer-based systems that support groups of peopleengaged in a common task (or goal) and that provide aninterface to a shared environment’’ (Ellis, Gibbs, & Rein, mum, unstructured, and anonymous participation is de-
sired. Idea Organization (IO) techniques and tools may1991). In addition to Electronic Meeting Systems, othertypes of groupware include electronic mail, group calen- then be used to organize the information into a list of
topics or concepts that address the complex problem (thedar systems, group project management, and multi-userdocument editing systems. convergent stage) . Techniques and tools for Voting may
then be used to test whether all meeting participants agreeWhat distinguishes an EMS from other types ofgroupware is that the common goal (problem resolution) on the definitions of those topics or concepts or on the
importance of particular topics with respect to the particu-typically involves complex organizational problems,which benefit from maximum participation from appro- lar goal.priate organizational members. Examples of such prob-lems include performance of organizational analyses
2.1. Description of an EMS: GroupSystemsthrough vision or mission statement construction or orga-nizational model building, strategic plan development, or- An EMS consists of hardware, specialized software,
and facilitation methods and techniques for solving groupganizational decision making, and project status re-porting. Research and experience with EMSs have dem- problems. An EMS typically includes 8–30 networked
personal computers or workstations, special software thatonstrated that electronic support of group meetings canimprove meeting productivity through greater participa- allows people to enter comments and manipulate shared
data, and support for electronic projection of the sharedtion by organizational membership and shorter time re-quired for information gathering and for group problem data as well as other audio/visual equipment that supports
meetings. Software for general-purpose group problemresolution (Nunamaker, Dennis, Valacich, Vogel, &George, 1991; Post, 1992). In particular, groups using solving consists of a set of programs that can be mixed
and matched to suit the characteristics of the problem asEMS have been found to generate more unique alterna-tives for creative tasks and higher quality of decisions well as the characteristics of the group of participants.
GroupSystems is an specific example of such specializedrelated to intellective tasks than non-EMS-supportedgroups (George, Easton, Nunamaker, & Northcraft, software tools that was developed at the University of
Arizona. A pioneering example of meeting software tech-1990).EMS experience has demonstrated a consistent pattern nology, GroupSystems has been installed at more than 80
universities and a total of more than 400 organizationalof use that may be described as a ‘‘group problem solv-ing’’ process. This process is goal-directed insofar as spe- sites in business, government, and university settings.
Figure 1 presents a diagram of the types of EMS activi-cific types of information are identified for support ofproblem resolution. The EMS then is used to gather the ties that occur in an electronic meeting as well as a map-
ping of particular GroupSystems tools that support theinformation that is appropriate for the goal. We label thestages of the information gathering process as ‘‘diver- group problem-solving activities. Four EMS activities di-
agrammed in the center of the figure are the main typesgence,’’ ‘‘convergence,’’ and ‘‘consensus checking.’’Particular EMS tools are selected for each of these stages of tools needed for group problem solving: Idea Genera-
tion, Idea Organization, Prioritizing, and Policy Develop-depending upon the characteristics of the particular goalor task before the group. Electronic brainstorming (EBS) ment. Session planning software controls the overall
meeting and is, itself, a set of software tools for creatingis a particularly good divergent technique/tool for collect-ing information related to complex tasks in which maxi- an agenda, starting and stopping participant tools, and
158 JOURNAL OF THE AMERICAN SOCIETY FOR INFORMATION SCIENCE—February 1997
876/ 8n11$$0002 12-04-96 19:37:48 jasa W: JASIS

implementing system utilities such as saving data and to browse comments and consolidate ideas. Meeting parti-cipants are often impressed with the number of ideas theyprinting reports. Facilitation is the activity of matching
appropriate EMS hardware and software tools to the orga- have generated, but become overwhelmed by the task oforganizing the ideas into categories or topics.nizational problem to be solved. This requires collecting
information from organizational members to gain an un-derstanding of the characteristics of the problem, charac-
Vocabulary problemteristics of the group, and the organizational context ofthe problem (Nunamaker et al., 1991). The facilitator is Much of the complexity in interpersonal communica-
tion is related to semantics. Connotations surroundingtypically NOT an expert in the group problem-solvingdomain. Rather, the facilitator is responsible for under- terms vary according to the perspectives of different indi-
viduals and even within the same individual in differentstanding the group’s problem well enough to select theappropriate EMS tools to be used in the appropriate cir- problem settings. One aspect of the vocabulary problem
is that meeting participants may have different definitionscumstances and guide meeting participants’ use of thesetools during the meeting. Like an arbitrator, the facilitator of the same terms. Another aspect is the converse: Multi-
ple terms may have a single meaning for meeting partici-is supposed to play an objective, non-biased role in help-ing the meeting participants solve the group problem us- pants. In prior research, Furnas, Landauer, Gomez, and
Dumais (1983, 1987) found that in spontaneous wording the tools of the EMS.The benefits of group problem solving using an EMS choice for objects in five domains, two people favored
the same term with less than 20% probability. This vocab-come from three major EMS attributes: Anonymous par-ticipant input, parallel data entry, and electronic recording ulary difference is even more problematic in the context
of collaborative systems which involve a large numberof all user input. Allowing anonymous input of informa-tion by participants often results in a freer exchange of of participants (Chen, 1994).ideas. Parallel data entry allows multiple participants toenter ideas or comments at the same time. Participants
Increased cognitive demandcan enter information while ideas and thoughts are freshin their minds. Electronic recording of all of the partici- EBS comments need to be consolidated and organized
by meeting participants within a short period of time.pant input supports the creation of reusable ‘‘organiza-tional memory.’’ However, experience with GroupSys- Usually each participant has to browse and understand the
ideas generated in the EBS comments, judge the merits oftems has shown that the unique features of anonymity,parallel data entry, and electronic recording are less effec- these ideas, merge similar ideas, eliminate redundant or
irrelevant ideas, consult other members’ opinions, and sotive in supporting the convergent stage of group problemsolving (Chen et al., 1994). on in less than an hour. Because the EBS process encour-
ages creative, diverse, and uncensored ideas, many EBScomments are raw or unpolished and it may require spe-
2.2. Convergence Problems in EMScial effort from meeting participants to synthesize them.Because the group topic organization process is some-The objective of the Idea Organization activity in an
EMS is to classify the participants’ comments into a list times frustrating and sub-optimal, the satisfaction leveland productivity of the meeting participants may go downof important topics that is appropriate for the desired
outcome, goal, or subgoal. Difficulties in performing this significantly, and/or some unique EBS ideas may be lostduring the process.idea organizing activity are due to various aspects of the
output of the divergent process that precedes it: Largenumbers of comments and different interpretations of the
EMS interface problemsvocabulary within the comments. Other difficulties arerelated to the increased cognitive demand of the Idea Most EMSs are based on windows (Microsoft or X-
Windows). However, a 30/ line computer screen is stillOrganization process itself as well as software interfaceproblems with the current Idea Organization tools. a severe constraint for someone browsing hundreds of
lines of text while trying to synthesize ideas into a list ofissues. Several windows may be needed: A window for
Information overloadbrowsing the comments, a window for formulating a par-ticipant’s local list of issues, a window for viewing theSuccessful use of the electronic brainstorming tool has
been found to result in an unanticipated information over- public list, and a window for attaching comments to thelist items. However, management of these windows couldload problem (Chen et al., 1994). In a typical meeting
of 10–20 participants, several hundred EBS comments be difficult for even computer experts, let alone the aver-age person participating in a meeting.can be generated in less than an hour. The characteristics
of parallel and anonymous data entry often result in hun- The need for automated and ‘‘intelligent’’ support ofthe convergent process arises from dissatisfaction experi-dreds of lines of text being generated in a short period
of time, which makes it extremely difficult for participants enced by meeting participants, the inconsistency of the
JOURNAL OF THE AMERICAN SOCIETY FOR INFORMATION SCIENCE—February 1997 159
876/ 8n11$$0002 12-04-96 19:37:48 jasa W: JASIS

group topics generated, and the time constraint for meet- course integration, and pragmatic analysis. Morphologicalanalysis separates the input text into terms and/or terming convergence. In light of these problems, this research
was undertaken to build upon prior research in artificial phrases. Syntactic analysis parses the output of morpho-logical analysis and applies a sentence structure or otherintelligence and information science, and our extensive
experience in EMS, in order to develop a more pro-active grammatical structure to the input. Semantic analysis de-rives meaning from the input by mapping the terms intoand ‘‘intelligent’’ EMS idea classification system.appropriate objects in a knowledge base and converts thesyntactical structure into a structure consistent with that
3. Classification Literature Reviewrepresented in the knowledge base (‘‘frames’’ or‘‘scripts,’’ for example) . Linking these structures to-The classification of EMS ideas involves an under-
standing of the mapping of that idea text into a set of gether to demonstrate the linkages between the structurescreated in semantic analysis (e.g., link pronouns of onecategories that model or represent that text. Thus, to de-
velop an automated approach to classifying electronic sentence with their antecedents of previous sentences)is the objective of discourse integration. Finally, actualbrainstorming comments, we needed to review the textual
analysis and cluster analysis literatures to review methods interpretation of the input and determining what action totake in response to the input is the objective of pragmaticfor mapping the text into an appropriate representation.
For further details and a more in depth literature review, analysis.Work in syntax and grammars of English text has beensee Orwig (1995).
Textual analysis techniques aim to identify descriptors occurring for decades. Several techniques in particularhave attracted special attention. Noam Chomsky (1965)and develop an unambiguous internal representation for
a document. In clustering, documents are analyzed and is best known for his work in syntax theory. Context-free grammars attempt to identify the building blocks ofstructured based on their degrees of similarity or rele-
vance. language with syntax providing the rules of construction,which is limited to phrases and sentences. Woods (1972)describes the augmented transition network (ATN
3.1. Textual Analysisparser)—a system similar to a finite state machine ofstates and arcs, where the states of the network representAutomatic indexing in information science and natural
language processing in artificial intelligence are two sets positions through a text passage and arcs represent possi-ble words, word categories, or procedures which cause aof techniques frequently used for textual analysis.transition to the next state. An ATN parser includes bothcontext-free grammars and transformational grammars,
Automatic indexingboth considered syntactic analysis. Semantic grammars,developed by Burton (1976), include semantic rules as wellAutomatic indexing is defined as the machine perfor-
mance of the process of constructing document surrogates as syntactic functions in grammar rules. Rather than embedthe semantics within the grammar rules, Fillmore (1968)by assigning content identifiers to text items (Salton,
1989). Salton describes three theories for indexing terms creates semantic relations to structure the syntactic rules andcalled this a case grammar. Thirty years of work in syntaxto aid in discriminating among terms to better address
term specificity: Term-frequency, term-discrimination, and semantics have demonstrated the complexity of pro-cessing the English language (or any human language).and probabilistic term weighting. Three blueprints for au-
tomatic indexing are summarized in Salton (1989). Two There is still much work to do to create semantic analysisoutput in a generalizable and domain-independent way.of these blueprints depend upon the existence of a thesau-
rus. Since electronic brainstorming text is generated in The lexical analysis associated with NLP today still hasfar to go before generalizable text processing is achievable.‘‘real time’’ during a meeting and since most organiza-
tions do not have a documented ‘‘organizational thesau- The ‘‘noise’’ found in EBS comments (typographical errors,poor sentence structure, unique vocabulary, etc.) combinedrus,’’ the third approach of word identification, stop word-
ing, stemming, and term-phrase formation seems more with unpredictable topics of discussion make the implemen-tation of natural language understanding techniques imprac-appropriate for the EMS application.tical for concept categorization. As will be discussed below,the automatic indexing technique was later adopted in our
Natural language processingresearch.
Natural language processing (NLP) aims to developunambiguous internal representations for human lan-
3.2. Cluster Analysisguages. Identification of concepts contained within elec-tronic brainstorming comments would seem to demon- Classification of EBS comments requires grouping (or
clustering) similar concepts/ terms as a category or topic,strate some level of natural language understanding. NLPtypically involves several levels of analysis, i.e., morpho- a process calling for cluster analysis techniques. Two
approaches to cluster analysis exist: The serial, statisticallogical analysis, syntactic analysis, semantic analysis, dis-
160 JOURNAL OF THE AMERICAN SOCIETY FOR INFORMATION SCIENCE—February 1997
876/ 8n11$$0002 12-04-96 19:37:48 jasa W: JASIS
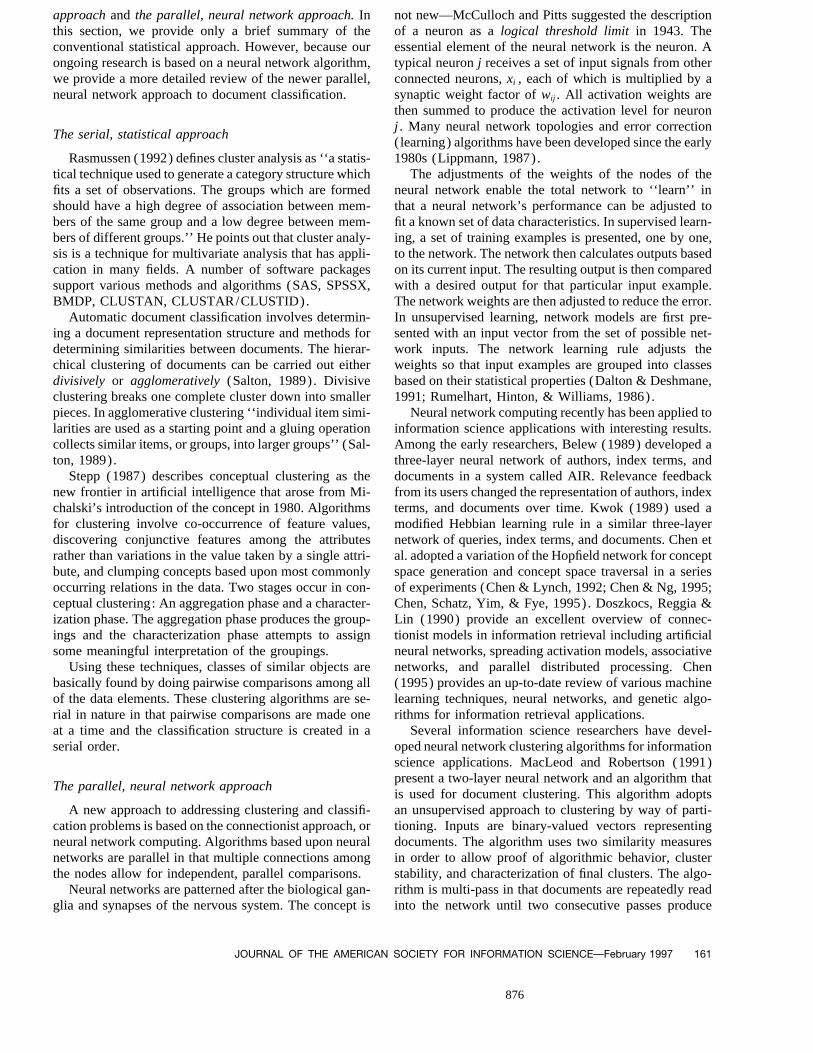
approach and the parallel, neural network approach. In not new—McCulloch and Pitts suggested the descriptionof a neuron as a logical threshold limit in 1943. Thethis section, we provide only a brief summary of the
conventional statistical approach. However, because our essential element of the neural network is the neuron. Atypical neuron j receives a set of input signals from otherongoing research is based on a neural network algorithm,
we provide a more detailed review of the newer parallel, connected neurons, xi , each of which is multiplied by asynaptic weight factor of wij . All activation weights areneural network approach to document classification.then summed to produce the activation level for neuronj . Many neural network topologies and error correction
The serial, statistical approach( learning) algorithms have been developed since the early1980s (Lippmann, 1987).Rasmussen (1992) defines cluster analysis as ‘‘a statis-
tical technique used to generate a category structure which The adjustments of the weights of the nodes of theneural network enable the total network to ‘‘learn’’ infits a set of observations. The groups which are formed
should have a high degree of association between mem- that a neural network’s performance can be adjusted tofit a known set of data characteristics. In supervised learn-bers of the same group and a low degree between mem-
bers of different groups.’’ He points out that cluster analy- ing, a set of training examples is presented, one by one,to the network. The network then calculates outputs basedsis is a technique for multivariate analysis that has appli-
cation in many fields. A number of software packages on its current input. The resulting output is then comparedwith a desired output for that particular input example.support various methods and algorithms (SAS, SPSSX,
BMDP, CLUSTAN, CLUSTAR/CLUSTID). The network weights are then adjusted to reduce the error.In unsupervised learning, network models are first pre-Automatic document classification involves determin-
ing a document representation structure and methods for sented with an input vector from the set of possible net-work inputs. The network learning rule adjusts thedetermining similarities between documents. The hierar-
chical clustering of documents can be carried out either weights so that input examples are grouped into classesbased on their statistical properties (Dalton & Deshmane,divisively or agglomeratively (Salton, 1989). Divisive
clustering breaks one complete cluster down into smaller 1991; Rumelhart, Hinton, & Williams, 1986).Neural network computing recently has been applied topieces. In agglomerative clustering ‘‘individual item simi-
larities are used as a starting point and a gluing operation information science applications with interesting results.Among the early researchers, Belew (1989) developed acollects similar items, or groups, into larger groups’’ (Sal-
ton, 1989). three-layer neural network of authors, index terms, anddocuments in a system called AIR. Relevance feedbackStepp (1987) describes conceptual clustering as the
new frontier in artificial intelligence that arose from Mi- from its users changed the representation of authors, indexterms, and documents over time. Kwok (1989) used achalski’s introduction of the concept in 1980. Algorithms
for clustering involve co-occurrence of feature values, modified Hebbian learning rule in a similar three-layernetwork of queries, index terms, and documents. Chen etdiscovering conjunctive features among the attributes
rather than variations in the value taken by a single attri- al. adopted a variation of the Hopfield network for conceptspace generation and concept space traversal in a seriesbute, and clumping concepts based upon most commonly
occurring relations in the data. Two stages occur in con- of experiments (Chen & Lynch, 1992; Chen & Ng, 1995;Chen, Schatz, Yim, & Fye, 1995). Doszkocs, Reggia &ceptual clustering: An aggregation phase and a character-
ization phase. The aggregation phase produces the group- Lin (1990) provide an excellent overview of connec-tionist models in information retrieval including artificialings and the characterization phase attempts to assign
some meaningful interpretation of the groupings. neural networks, spreading activation models, associativenetworks, and parallel distributed processing. ChenUsing these techniques, classes of similar objects are
basically found by doing pairwise comparisons among all (1995) provides an up-to-date review of various machinelearning techniques, neural networks, and genetic algo-of the data elements. These clustering algorithms are se-
rial in nature in that pairwise comparisons are made one rithms for information retrieval applications.Several information science researchers have devel-at a time and the classification structure is created in a
serial order. oped neural network clustering algorithms for informationscience applications. MacLeod and Robertson (1991)present a two-layer neural network and an algorithm that
The parallel, neural network approachis used for document clustering. This algorithm adoptsan unsupervised approach to clustering by way of parti-A new approach to addressing clustering and classifi-
cation problems is based on the connectionist approach, or tioning. Inputs are binary-valued vectors representingdocuments. The algorithm uses two similarity measuresneural network computing. Algorithms based upon neural
networks are parallel in that multiple connections among in order to allow proof of algorithmic behavior, clusterstability, and characterization of final clusters. The algo-the nodes allow for independent, parallel comparisons.
Neural networks are patterned after the biological gan- rithm is multi-pass in that documents are repeatedly readinto the network until two consecutive passes produceglia and synapses of the nervous system. The concept is
JOURNAL OF THE AMERICAN SOCIETY FOR INFORMATION SCIENCE—February 1997 161
876/ 8n11$$0002 12-04-96 19:37:48 jasa W: JASIS

identical classifications for each document (conver- (1989) apply the Kohonen SOM to textual analysis in anattempt to detect the logical similarity between wordsgence). Only those clusters that are successful in classify-from the statistics of their contexts. Their first approaching one or more documents during the last pass are active.represents context of terms as a set of attribute valuesInactive clusters do not take part in any subsequent re-that occur in conjunction with the words. The secondtrieval operations.approach defines context by the sequences in which wordsChen et al. (1994) describe an algorithm for conceptoccur without consideration of any associated attributes.classification of electronic brainstorming comments thatThey analyze simple verbal statements consisting ofcombines automatic indexing of the electronic brain-nouns, verbs, and adverbs and suggest that ‘‘such phrasesstorming comments, term co-occurrence concept spaceor clauses involve some of the abstractions that appeargeneration, and a Hopfield neural network classifierin thinking, namely, the most common categories, into(Hopfield, 1982). Results of experiments comparing thewhich the words are then automatically grouped’’ (Rit-output of their algorithm with human experts and novicester & Kohonen, 1989). They argue that a similar processfound that the Hopfield classifier performed as well asmay be at work in the brain. Typical self-organizing mapsthe novices but two human experts out-performed thereflect metric distance relations between patterned repre-novices and Hopfield classifier significantly. Reasonssentation vectors. Ritter and Kohonen associate this withgiven for the performance differences centered on thelower levels of perception. To map symbols topographi-ability of the experts to associate terms more appropri-cally one must present the symbol ‘‘in due context, i.e.,ately.in conjunction with all or part of the attribute values ofIn addition to these unique neural network based clus-the item it encodes, or with other, correlating symbols’’tering algorithms for information science applications,(Ritter & Kohonen, 1989). The example they give usesprior research in neural networks has strongly suggested16 animal types (dove, hen, fox, tiger, cow, etc.) and 13the Kohonen SOM as an ideal candidate for clustering ofattributes (size, number of legs, hunts, swims, etc.) . Inputtextual documents.of these attributes for each of the animal types into theKohonen (1989) bases his neural network on the asso-SOM produces an organization of the animals on a mapciative neural properties of the brain. This network con-where animals are spatially ordered into essential ‘‘familytains two layers of nodes—an input layer and a mappingrelationships.’’(output) layer in the shape of a two-dimensional grid
Miikkulainen (1993) developed DISCERN (DIstrib-(Caudill, 1993; Hiotis, 1993). The input layer acts as auted SCript processing and Episodic memoRy Network)distribution layer. The number of nodes in the input layeras his dissertation project. DISCERN is a prototype of ais equal to the number of features or attributes associatedsubsymbolic natural language processing system thatwith the input. Each node of the mapping layer also hasshows how script instantiation and inferences can bethe same number of features as there are input nodes.learned from examples by a parallel distributed processingThus, the input layer and each node of the mapping layerarchitecture that is based upon a Kohonen Self-Organiz-can be represented as a vector which contains the numbering Map. However, DISCERN does not implement theof features of the input. The network is fully connectedentire computational theory or even the full complexityin that every mapping node is connected to every inputof symbolic script-processing systems. Miikkulainen pro-node. The mapping nodes are initialized with randomvides an interesting discussion concerning expansion of
numbers. Each actual input gets compared with each nodeclassification into a hierarchy of layers of abstraction
on the mapping grid. The ‘‘winning’’ mapping node iswhereby classification occurs between each level of ab-
defined as that with the smallest Euclidean distance be- straction.tween the mapping node vector and the input vector. The In support of using Kohonen for textual document clas-input thus maps to a given mapping node. The value of sification, Lin, Soergei and Marchionini (1991) used thethe mapping node vector is then adjusted to reduce the Kohonen SOM for classifying documents for informationEuclidean distance. In addition, all of the neighboring retrieval. Documents are represented as vectors of binarynodes of the winning node are adjusted proportionally. values. Each coordinate of the vector represents a specificIn this way, the multi-dimensional ( in terms of features) term or term phrase with the value set to ‘‘1’’ if the terminput nodes get mapped to a two-dimension output grid. or term phrase is found within the document and ‘‘0’’After all of the input is processed (usually after hundreds otherwise. After several passes through the input file (aor thousands of repeated presentations) , the result should collection of similar documents) , the Kohonen layer isbe a spatial organization of the input data organized into trained. The resulting map provides an intuitively-appeal-clusters of similar (neighboring) regions. Many engi- ing organization of the input data. The documents areneering and scientific applications which involve numeric classified according to their content and conceptual re-data (e.g., image recognition, signal processing) have gions are formed and named on a two-dimensional grid.successfully adopted the SOM approach to parallel clus-
4. Kohonen Classification for EBS Commentstering (Kohonen, 1995).Several recent studies adopted the SOM approach to Lin’s work first demonstrated the feasibility of using
the Kohonen algorithm for classification of textual docu-textual analysis and classification. Ritter and Kohonen
162 JOURNAL OF THE AMERICAN SOCIETY FOR INFORMATION SCIENCE—February 1997
876/ 8n11$$0002 12-04-96 19:37:48 jasa W: JASIS
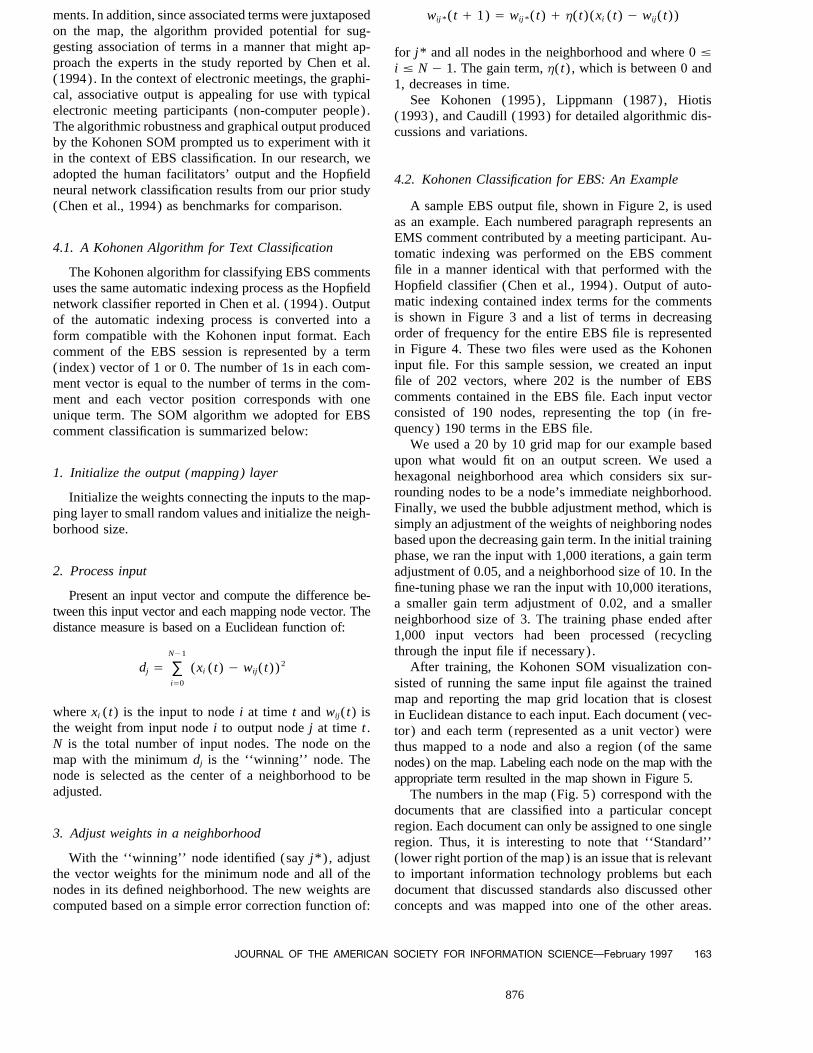
ments. In addition, since associated terms were juxtaposed wij*( t / 1) Å wij*( t) / h( t)(xi ( t) 0 wij( t))on the map, the algorithm provided potential for sug-gesting association of terms in a manner that might ap- for j* and all nodes in the neighborhood and where 0 °proach the experts in the study reported by Chen et al. i ° N 0 1. The gain term, h( t) , which is between 0 and(1994). In the context of electronic meetings, the graphi- 1, decreases in time.cal, associative output is appealing for use with typical See Kohonen (1995), Lippmann (1987), Hiotiselectronic meeting participants (non-computer people) . (1993), and Caudill (1993) for detailed algorithmic dis-The algorithmic robustness and graphical output produced cussions and variations.by the Kohonen SOM prompted us to experiment with itin the context of EBS classification. In our research, weadopted the human facilitators’ output and the Hopfield 4.2. Kohonen Classification for EBS: An Exampleneural network classification results from our prior study(Chen et al., 1994) as benchmarks for comparison. A sample EBS output file, shown in Figure 2, is used
as an example. Each numbered paragraph represents anEMS comment contributed by a meeting participant. Au-
4.1. A Kohonen Algorithm for Text Classification tomatic indexing was performed on the EBS commentfile in a manner identical with that performed with theThe Kohonen algorithm for classifying EBS commentsHopfield classifier (Chen et al., 1994). Output of auto-uses the same automatic indexing process as the Hopfieldmatic indexing contained index terms for the commentsnetwork classifier reported in Chen et al. (1994). Outputis shown in Figure 3 and a list of terms in decreasingof the automatic indexing process is converted into aorder of frequency for the entire EBS file is representedform compatible with the Kohonen input format. Eachin Figure 4. These two files were used as the Kohonencomment of the EBS session is represented by a terminput file. For this sample session, we created an input( index) vector of 1 or 0. The number of 1s in each com-file of 202 vectors, where 202 is the number of EBSment vector is equal to the number of terms in the com-comments contained in the EBS file. Each input vectorment and each vector position corresponds with oneconsisted of 190 nodes, representing the top (in fre-unique term. The SOM algorithm we adopted for EBSquency) 190 terms in the EBS file.comment classification is summarized below:
We used a 20 by 10 grid map for our example basedupon what would fit on an output screen. We used a
1. Initialize the output (mapping) layer hexagonal neighborhood area which considers six sur-rounding nodes to be a node’s immediate neighborhood.Initialize the weights connecting the inputs to the map-Finally, we used the bubble adjustment method, which isping layer to small random values and initialize the neigh-simply an adjustment of the weights of neighboring nodesborhood size.based upon the decreasing gain term. In the initial trainingphase, we ran the input with 1,000 iterations, a gain term
2. Process input adjustment of 0.05, and a neighborhood size of 10. In thefine-tuning phase we ran the input with 10,000 iterations,
Present an input vector and compute the difference be-a smaller gain term adjustment of 0.02, and a smaller
tween this input vector and each mapping node vector. Theneighborhood size of 3. The training phase ended after
distance measure is based on a Euclidean function of:1,000 input vectors had been processed (recyclingthrough the input file if necessary) .
After training, the Kohonen SOM visualization con-dj Å ∑N01
iÅ0
(xi ( t) 0 wij( t))2
sisted of running the same input file against the trainedmap and reporting the map grid location that is closest
where xi ( t) is the input to node i at time t and wij( t) is in Euclidean distance to each input. Each document (vec-the weight from input node i to output node j at time t . tor) and each term (represented as a unit vector) wereN is the total number of input nodes. The node on the thus mapped to a node and also a region (of the samemap with the minimum dj is the ‘‘winning’’ node. The nodes) on the map. Labeling each node on the map with thenode is selected as the center of a neighborhood to be appropriate term resulted in the map shown in Figure 5.adjusted. The numbers in the map (Fig. 5) correspond with the
documents that are classified into a particular conceptregion. Each document can only be assigned to one single3. Adjust weights in a neighborhoodregion. Thus, it is interesting to note that ‘‘Standard’’( lower right portion of the map) is an issue that is relevantWith the ‘‘winning’’ node identified (say j*), adjust
the vector weights for the minimum node and all of the to important information technology problems but eachdocument that discussed standards also discussed othernodes in its defined neighborhood. The new weights are
computed based on a simple error correction function of: concepts and was mapped into one of the other areas.
JOURNAL OF THE AMERICAN SOCIETY FOR INFORMATION SCIENCE—February 1997 163
876/ 8n11$$0002 12-04-96 19:37:48 jasa W: JASIS

FIG. 2. Sample EBS session output file.
One would need to search for the keyword ‘‘standard’’ put) . And interestingly, ‘‘Video,’’ ‘‘Networks,’’ and‘‘Hardware’’ issues seemed to be clustered on the bottom-to obtain all of the documents that discussed this concept
(or find them in the conceptual areas adjacent to ‘‘Stan- left corner of the SOM map. ‘‘People’’ and ‘‘Training’’issues are adjacent, as well as ‘‘(Lotus) Notes’’ anddard.’’) Thus, the Kohonen algorithm seems to produce
a conceptual map of the textual data with the one best ‘‘Memory/Tool.’’The size of the region also seemed to bear some rela-place for storing each document on the conceptual map.
From a document management perspective, the algorithm tionship to the importance of the topic. The largest areaswere represented by terms that addressed the brainstorm-would seem to provide an organizing structure but one
would need to use the keywords of a storage area to ing question directly, ‘‘What are the most important infor-mation technology problems with respect to collaborativesearch for documents in order to get higher recall of docu-
ments related to the issues of that given storage area. systems to be solved over the next five years?’’ ‘‘Tools,’’‘‘Meeting,’’ ‘‘Technology,’’ ‘‘Collaborative,’’ ‘‘Sys-Analysis of several session outputs revealed that there
seemed to be a general relationship between terms that tems,’’ and ‘‘Facilitator’’ were among the largest regionson the map. Due to the competition among regions, somewere adjacent on the map. For example, the sample Koho-
nen EBS output revealed that ‘‘Collaborative’’ and ‘‘Sys- regions were formed without any comment having beenassigned. On the other hand, some comments did nottems’’ ( top-right corner) were terms frequently used to-
gether as well as ‘‘Distributed’’ and ‘‘Meetings’’ (bot- contain any relevant or specific ideas and thus weremapped to a ‘‘miscellaneous’’ area, e.g., 31 commentstom-right corner) all on neighboring regions of the map
(see Fig. 5: A Sample Kohonen EBS Classification Out- were mapped to a node at the bottom center of Figure
164 JOURNAL OF THE AMERICAN SOCIETY FOR INFORMATION SCIENCE—February 1997
876/ 8n11$$0002 12-04-96 19:37:48 jasa W: JASIS

measured the relative degrees of association that existed be-tween each of the terms on the three lists. This stage addressedthe significance of the adjacent areas of the Kohonen mapand whether the apparent high degree of association actuallyexists between the areas. If so, the Kohonen SOM mightprove more useful in supporting group convergence by sug-gesting graphical conceptual clusters as regions in the map.
First stage: List comparison
EBS output from an actual electronic brainstormingsession was used in our experiment ( the same sessionshown in Fig. 2) . The session was chosen because thesubject domain was in ‘‘collaborative systems,’’ an areawith which all our facilitator subjects were familiar. Dur-
FIG. 3. Sample EBS automatic indexing output. ing the actual group electronic brainstorming process, anexpert facilitator browsed the participants’ comments andcreated a set of keywords to categorize the comments
5. These comments were mostly noise (i.e., typos) or pertaining to the question: ‘‘What are the most importantcompletely unique ideas. information technology problems with respect to Collabo-
In summary, the Kohonen map seemed to provide a rative Systems to be solved over the next five years?’’graphical representation of the collective discussion of The 21 meeting participants were all researchers and prac-the group of 21 people in approximately 6 minutes. Not titioners in this area. The EBS session output file was thenonly are the issues related to important information tech- run through the Hopfield classifier (Chen et al., 1994) andnology problems surfaced but the relatedness of the issues the Kohonen algorithm described above. The facilitatorwith respect to subject area and importance (size of the took about 40 minutes to generate his topic list; whilearea) seem to be represented. This objective and quick the Hopfield classifier and the Kohonen algorithm took 4analysis of the Kohonen algorithm would seem preferableto the potentially-biased and slow (/40 minutes) methodinvolving a human facilitator. Further evaluation of theoutput was warranted.
5. Evaluation of Kohonen Classification
Several research questions arise in looking at the Ko-honen classification results. How does the Kohonen net-work compare with a human facilitator in classifying EBScomments? Does the Kohonen neural network produceresults better than those generated by the Hopfield classi-fier developed earlier? And does the graphical, associativenature of Kohonen classification help in producing morerelevant classification?
5.1. Experiment Design
To address the above research questions, we recently de-signed and conducted a three-stage experiment. The first stageinvolved comparing the topic lists generated by a humanexpert facilitator, the Hopfield Algorithm, and the KohonenSOM. This stage addressed SOM list quality in comparisonwith the output of the human expert and the Hopfield algo-rithm. To address the issue of term relevance, we pooled allof the terms in the three lists, presented them to severalfacilitator subjects in alphabetical order, and asked the sub-jects to rate the relevance of the terms to the EBS question.Thus, the second stage measured the degree of relevance of
FIG. 4. Ranked terms in a sample EBS file.the terms contained within the topic lists. The third stage
JOURNAL OF THE AMERICAN SOCIETY FOR INFORMATION SCIENCE—February 1997 165
876/ 8n11$$0002 12-04-96 19:37:48 jasa W: JASIS

FIG. 5. A sample Kohonen EBS classification output.
minutes and 6 minutes, respectively. The topic lists cre- terms. Combinations of terms forming individual topics(e.g., ‘‘video/projection’’) were split and treated as sepa-ated by the three methods are shown in Table 1.
Eight subjects of the experiment were given the com- rate terms. Term phrases were retained (e.g., ‘‘distanceissues’’ was treated as one term as was ‘‘distance’’) .plete text output of the electronic brainstorming session
and the three lists—each on a separate sheet of paper. Subjects were not allowed to re-visit the three individuallists to determine the source of the terms.Subjects read through the comments (optionally creating
their own lists) . They then ranked the three lists from Subjects were asked to rate the relevance of the termswith respect to whether they should be included within amost appropriate to least. Criteria for evaluating the lists
were the options of the facilitator-subjects but they were topic list pertaining to the electronic brainstorming ses-sion. The ranking scale was: 0—irrelevant ( too vague,given the task as ‘‘Rank the lists as most appropriate for
addressing the EBS question.’’ too specific, or otherwise inappropriate) ; 1—somewhatrelevant; 2—most relevant. The instructions plus the 83Subjects were then asked to ‘‘correct’’ each list by
deleting inappropriate terms and adding terms that were terms were listed on a single sheet of paper. Subjectscalled out the number of the term plus a score of ‘‘0,’’missing. A past experiment had demonstrated that facilita-
tors had a criteria of a correct list as a list of issues that ‘‘1,’’ or ‘‘2’’ to the experimenter. Subjects completedthis task in 10 to 15 minutes.covered all of the EBS discussion appropriate to the EBS
question and ‘‘balanced’’ with respect to level of abstrac-tion (Chen et al., 1994). Subjects could use the lists thatthey created themselves in order to make each list of Third stage: Term association evaluationcollaborative technology problem issues more appropriate
The list of 83 terms was converted to a shorter list byto the EBS question. The size of each corrected list ascombining terms which were singular and plural formsidentified by the subjects are reflected in the Target rowsof the same term (e.g., ‘‘application’’ and ‘‘applica-of Table 2.tions’’) and removing terms which did not have semanticSubjects completed this stage in times that ranged fromcontent or were obviously too general (e.g., ‘‘matter’’just under 1 hour to over 2 hours.and ‘‘issues’’) . Term phrases were also combined withindividual terms (e.g., ‘‘culture,’’ ‘‘cultural,’’ and ‘‘cul-
Second stage: Term relevance evaluation tural differences’’ into ‘‘culture/cultural differences’’) .A list of 59 topics resulted. Subjects were given a one-The terms on the three lists (Facilitator, Hopfield, and
Kohonen) were pooled into one alphabetical list of 83 page printout of the numbered 59 terms and asked to rate
166 JOURNAL OF THE AMERICAN SOCIETY FOR INFORMATION SCIENCE—February 1997
876/ 8n11$$0002 12-04-96 19:37:48 jasa W: JASIS

TABLE 1. Three sample EBS topic lists.
Facilitator Hopfield Kohonen
1. video/projection 1. technology/dealing/cultural differences 1. technology2. network/bandwidth 2. collaborative systems 2. tools3. multimedia/hypertext/multi-media 3. meetings/distributed/human 3. meeting4. group memory/project memory/repository 4. linear thread meeting 4. support5. voice 5. ai/data/amounts 5. collaborative6. culture/style 6. environments/virtual 6. facilitator7. language 7. voice recognition 7. matter8. standards 8. tools/culture 8. systems9. distributed/distance issues/distance/ 9. people 9. people/issues/communication
different place 10. technologies 10. application/integration/groupware10. facilitation 11. information/ability 11. recognition11. research methodologies 12. video/desktop 12. cultural12. cost/money 13. networks 13. video13. team 14. ussues 14. hardware14. reward 15. hardware 15. networks15. integration 16. distributed meetings 16. dealing16. social/societal/society 17. training 17. users/group/reward17. performance 18. groups 18. collaboration/seamless18. virtual 19. applications 19. memory/tool19. education/train/learn/teach 20. distributed environment 20. training20. human/people/user/individual/interpersonal 21. virtual
22. environment23. notes24. information/ability25. distributed26. standard27. bandwidth
the associations between any term-pair (0: not associated; the number of concepts identified by the human facilitator,1: somewhat associated; 2: strongly associated) . This Hopfield algorithm, and Kohonen SOM (i.e., the number ofstage required 1,711 pairwise comparisons (59 1 58 4 list items). The ‘‘Target’’ row contains the number of con-2) and assumed that terms were symmetrically associated. cepts that were contained in each list after the subject addedTimes to complete this third stage ranged from just under missing concepts and deleted inappropriate concepts. The1 hour to about 2 hours. ‘‘Relevant’’ row contains the number of concepts in the origi-
Eight subjects completed the three stages. Three of nal lists that remained in the corrected lists. ‘‘Recall’’ is thethe subjects were experienced facilitators who each had number of relevant concepts divided by the number of targetfacilitated more than 25 meetings over the past 2 years. concepts identified by each subject. ‘‘Precision’’ is the num-Two subjects were less experienced but had been trained ber of relevant concepts divided by the number of conceptsin facilitation and had each facilitated five to 10 meetings. originally identified in the ‘‘Identified’’ row.The three remaining subjects had facilitated several ses- The Stage 1 row of Table 3 contains the results of statisticalsions or assisted in many electronic meetings over a 2- analysis (using MINITAB; Ryan, Joiner, & Ryan, 1985) ofyear period. While relatively inexperienced in guiding the comparison of the recall levels of the three lists as judgedgroups through the convergent process, they were very by the subjects. Analysis of variance (ANOVA) among themuch aware, as observers and participants, of the objec- recall scores of the eight subjects indicated that there weretives of the meeting convergence process. no differences among the three lists (p Å 0.362) and t-tests
also indicated no significant differences among the three lists(at the 10% significance level). However, analysis of vari-5.2. Experimental Resultsance and t-tests among the precision scores indicated that the
List comparison: The Kohonen output was less precise facilitator list out-performed the Kohonen list (p Å 0.021).than the facilitator output. However, the recall levels of Except for some obvious noise generated by the two algo-the three lists were not statistically different rithms, the Kohonen list and the Hopfield net produced 81
and 74% recall, comparable to the 89% recall generated byIn overall list ranking, each subject selected the facilitatorthe facilitator. Considering the time required of the facilitatorlist as the best. For stage one, the relative quality of the threeto generate such a list manually and the cognitive demand andlists was measured by recall and precision, commonly useddissatisfaction involved in this meeting convergence processin information retrieval. Table 2 contains a summary of the
results of list comparison. The ‘‘Identified’’ row pertains to (described earlier), our Hopfield classifier and Kohonen
JOURNAL OF THE AMERICAN SOCIETY FOR INFORMATION SCIENCE—February 1997 167
876/ 8n11$$0002 12-04-96 19:37:48 jasa W: JASIS

TABLE 2. List comparison results.
Facilitator Hopfield KohononSubjects Identified 20 20 27
1 Target 15 20 11Relevant 14 18 9
Recall 93% 90% 82%Precision 70% 90% 33%
2 Target 32 32 32Relevant 14 10 11
Recall 44% 31% 34%Precision 70% 50% 41%
3 Target 10 10 10Relevant 10 6 7
Recall 100% 60% 70%Precision 50% 30% 26%
4 Target 22 22 20Relevant 20 14 18
Recall 91% 64% 90%Precision 100% 70% 67%
5 Target 19 19 22Relevant 18 17 21
Recall 100% 89% 95%Precision 90% 85% 78%
6 Target 17 16 14Relevant 16 13 13
Recall 94% 81% 93%Precision 80% 65% 48%
7 Target 19 15 24Relevant 18 14 24
Recall 95% 93% 100%Precision 90% 70% 89%
8 Target 22 17 19Relevant 20 14 16
Recall 91% 82% 84%Precision 100% 70% 59%
Average recall 89% 74% 81%Average precision 81% 66% 55%
SOM algorithm for EBS have demonstrated the potential and were summed for the terms on each list and an averagescore per item was computed for each list. Each of thefeasibility of such system-aided meeting facilitation approach.eight subject’s average scores for each list was then ana-lyzed statistically using ANOVA and t-test. The results
Term relevance evaluation: Scores of term relevanceare listed in the Stage 2 row of Table 3. Terms selected
for the Hopfield list and the Kohonen list wereby the facilitator scored significantly better than those
significantly worse than that of the facilitator listgenerated by either the Hopfield classifier or the Kohonenalgorithm (p Å .042 and p Å .037, respectively) . TheWith respect to relevance of the terms used in the three
lists (Stage 2), the scores given each term by each subject two system-generated lists clearly were out-performed in
TABLE 3. Experimental statistical results.
T-test
ANOVA Facil vs. Hopfield Facil vs. Kohonen Hopfield vs. Kohonen
Stage 1List recall 0.362 0.16 0.460 0.50List precision 0.046 0.12 0.021 0.30
Stage 2Term relevance 0.055 0.042 0.037 0.71
Stage 3Term association 0.000 0.000 0.64 0.0009
168 JOURNAL OF THE AMERICAN SOCIETY FOR INFORMATION SCIENCE—February 1997
876/ 8n11$$0002 12-04-96 19:37:48 jasa W: JASIS

the term relevance evaluation because of their low preci- similar areas of the map into one conceptual region, orto place comments/ terms in regions that they may feelsion levels.are more appropriate. Algorithmic fine-tuning and testingof different actual EBS sessions will also be performed
Term association evaluation: The score of termin the near future.
association of the Kohonen list was comparable to thatThe graphical representation of the Kohonen SOM pro-
of the facilitator list and both of these werevides an intuitive abstraction that should also be useful for
significantly better than that of the Hopfield listorganizing large-scale information spaces such as digitallibraries, internet homepages, and other business data col-In the term association evaluation, our hypothesis was
that the Kohonen map would be better than the Hopfield lections (or organizational memory). These larger collec-tions may require extending the Kohonen algorithm tolist and comparable to that of the human facilitator due
to its graphical display of term-association proximity on provide multiple layers of maps to aid in concept-basedorganization and retrieval of relevant documents. Our on-a map. Statistical analysis of the term association results
(Table 3) shows a significant difference between the Hop- going semantic retrieval research involving the Illinoisdigital library project is investigating such a multi-layeredfield list and both the facilitator and Kohonen lists (p Å
0.000 and 0.0009, respectively) and no difference be- SOM approach "cite{ChenChris95}.tween the facilitator list and the Kohonen list (p Å 0.64),verifying this hypothesis.
7. AcknowledgmentIn summary, the results from our evaluation were en-couraging. The Kohonen SOM approach was shown to This project was supported mainly by the followingbe comparable to human facilitation in generating high research contract and grants: U.S. Army Corp of Engi-concept recall and rich term association. Its term associa- neers Waterways Experimental Station Research Con-tion capability was also significantly superior to the Hop- tract, DACA39-92-K-0042-P00003, 1992–1995 (J. F.field classifier we had developed earlier. However, the Nunamaker); NSF/ARPA/NASA Digital Library Initia-precision levels of the system-generated lists were inferior tive, 1994–1998 (B. Schatz, H. Chen, et al., ‘‘Building theto that of the facilitator output. In light of the cognitive Interspace: Digital Library Infrastructure for a Universitydemand and the cumbersome nature of the meeting con- Engineering Community System’’); NSF CISE Researchvergence process, we believe this research has shed light Initiation Award, IRI-9211418, 1992–1994 (H. Chen,on a promising and intuitively appealing neural network ‘‘Building a Concept Space for an Electronic Communitybased textual analysis and classification approach. System’’); and AT&T Foundation Special Purpose
Grants in Science and Engineering, 1994–1995 (H.Chen). We would also like to thank the following people6. Conclusions and Future Directionsfor their kind assistance in system development and evalu-
This research demonstrates how software can be de- ation: Doug Dean, Jim Lee, Jon Stapley, Boris Nevstru-signed to perform an intelligent classification of EBS out- jev, Nina Katic, Jeff McKibben, Andrea Houston, Kenput. In evaluation, we compared the software’s perfor- Walsh, Karen Ng, Dorbin Ng, Joanne Martinez, Chrismance with that of a human expert facilitator in solving Schuffels, Siunie Sutjaho, and Dr. Jerome Yen.the same complex problem as well as with results ofprevious work using a Hopfield neural network algorithm.
ReferencesSpecific conclusions from this research include: Recall ofthe topic list generated by the Kohonen was not different Belew, R. K. (1989). Adaptive information retrieval. Paper presented
at the Twelfth Annual International ACM/SIGIR Conference on Re-from that of the human expert or of the output of thesearch and Development in Information Retrieval, Cambridge, MA.Hopfield algorithm. Topics produced by the Kohonen al-
Burton, R. R. (1976). Semantic grammar: A technique for efficientgorithm were less precise than those produced by thelanguage understanding in limited domains. Unpublished doctoral
human facilitator but not different from those produced dissertation, Computer Science Department, University of Californiaby the Hopfield algorithm. With respect to relevance of at Irvine.
Caudill, M. (1993). A little knowledge is a dangerous thing. AI Expert,the terms to the electronic brainstorming question itself,8(6) , 16–22.both the Kohonen and Hopfield algorithms suffered in
Chen, H. (1994). Collaborative systems: Solving the vocabulary prob-comparison with the facilitator’s selection of terms. Fi-lem. IEEE Computer, 27(5), 58–66.
nally, in term association, the Kohonen algorithm per- Chen, H. (1995). Machine learning for information retrieval: Neuralformed as well as the expert facilitator. networks, symbolic learning, and genetic algorithms. Journal of the
American Society for Information Science, 46, 194–216.More work is needed to enhance the SOM-based userChen, H., Hsu, P., Orwig, R., Hoopes, L., & Nunamaker, J. F., Jr.interface. Better real-time classification support should be
(1994). Automatic concept classification of text from electronic meet-provided in order to allow adjustment of the dimensionsings. Communications of the ACM, 37(10), 56–73.
of the Kohonen map. Users will need to be able to browse Chen, H., & Lynch, K. J. (1992). Automatic construction of networksand change the underlying comments/ terms within map of concepts characterizing document databases. IEEE Transactions
on Systems, Man and Cybernetics, 22(5) , 885–902.regions to apply better labels to the regions, to merge
JOURNAL OF THE AMERICAN SOCIETY FOR INFORMATION SCIENCE—February 1997 169
876/ 8n11$$0002 12-04-96 19:37:48 jasa W: JASIS

Chen, H., & Ng, D. T. (1995). An algorithmic approach to concept mantic map for information retrieval. Paper presented at the Proceed-ings of the Fourteenth Annual International ACM/SIGIR Conferenceexploration in a large knowledge network (automatic thesaurus con-on Research and Development in Information Retrieval, Chicago, IL.sultation): Symbolic branch-and-bound vs. connectionist Hopfield net
Lippmann, R. P. (1987). An introduction to computing with neuralactivation. Journal of the American Society for Information Science,nets. IEEE ASSP Magazine, 4, 4–22.46, 348–369.
MacLeod, K. J., & Robertson, W. (1991). A neural algorithm for docu-Chen, H., Schatz, B. R., Yim, T., & Fye, D. (1995). Automatic thesaurusment clustering. Information Processing & Management, 27(4), 337–generation for an electronic community system. Journal of the Ameri-346.can Society for Information Science, 46, 175–193.
McCulloch, W. S., & Pitts, W. (1943). A logical calculus of the ideasChomsky, N. (1965). Aspects of the theory of syntax. Cambridge, MA:imminent in neural nets. Bulletin of Mathematical Biophysics, 5, 115–MIT Press.137.Dalton, J., & Deshmane, A. (1991). Artificial neural networks: An
Miikkulainen, R. (1993). Subsymbolic natural language processing:approach to increasing machine intelligence. IEEE Potentials, 4(33),An integrated model of scripts, lexicon, and memory. Cambridge,33–36.MA: The MIT Press.Doszkocs, T. E., Reggia, J., & Lin, X. (1990). Connectionist models
Nunamaker, J. F., Jr., Dennis, A. R., Valacich, J. S., & Vogel, D. R.and information retrieval. Annual Review of Information Science and(1991). Information technology for negotiating groups: GeneratingTechnology (ARIST), 25, 209–260.options for mutual gain. Management Science, 37(10), 1325–1346.Ellis, C. A., Gibbs, S. J., & Rein, G. L. (1991). Groupware: some
Nunamaker, J. F., Jr., Dennis, A. R., Valacich, J. S., Vogel, D. R., &issues and experiences. Communications of the ACM, 34(1), 38–58.George, J. F. (1991). Electronic meeting systems to support groupFillmore, C. J. (1968). The case for case. In E. Bach & R. T. Harmswork. Communications of the ACM, 34(7), 40–61.(Eds.) , Universals in linguistic theory. New York: Holt, Rinehart,
Orwig, R. E. (1995). A graphical, self-organizing approach to classify-and Winston.ing electronic meeting output. Unpublished doctoral dissertation, Uni-Furnas, G. W., Landauer, T. K., Gomez, L. M., & Dumais, S. T. (1983).versity of Arizona, Tucson, AZ.Statistical semantics: Analysis of the potential performance of key-
Post, B. (1992). Building the business case for group support technol-word information systems. Bell System Technical Journal, 62(6) ,ogy. Paper presented at the 25th Hawaii International Conference on1753–1806.System Sciences, Maui, Hawaii.
Furnas, G. W., Landauer, T. K., Gomez, L. M., & Dumais, S. T. (1987).Rasmussen, E. (1992). Clustering algorithms. Englewood Cliffs, NJ:
The vocabulary problem in human-system communication. Communi-Prentice Hall.
cations of the ACM, 30(11), 964–971.Ritter, H., & Kohonen, T. (1989). Self-organizing semantic maps. Bio-
George, J. F., Easton, G. K., Nunamaker, J. F., Jr., & Northcraft, G. B. logical Cybernetics, 61, 241–254.(1990). A study of collaborative group work with and without com- Rumelhart, D. E., Hinton, G. E., & Williams, R. J. (1986). Learningputer-based support. Information Systems Research, 1(4) , 394–415. internal representations by error propagation. Cambridge, MA: The
Hiotis, A. (1993). Inside a self-organizing map. AI Expert, 8(4) , 38– MIT Press.43. Ryan, B. F., Joiner, B. L., & Ryan, T. A. (1985). MINITAB Handbook,
Hopfield, J. J. (1982). Neural network and physical systems with collec- 2nd ed. Boston: PWS-KENT Publishing Company.tive computational abilities. Proceedings of the National Academy of Salton, G. (1989). Automatic text processing. Reading, MA: Addison-Science, 79(4), 2554–2558. Wesley Publishing Company, Inc.
Kohonen, T. (1989). Self-organization and associative memory. Berlin: Stepp, R. E. (1987). Concepts in conceptual clustering. Paper presentedSpringer-Verlag. at the Proceedings of the Tenth International Joint Conference on
Kohonen, T. (1995). Self-organization maps. Berlin, Heidelberg: Artificial Intelligence, Milan, Italy.Springer-Verlag. Vogel, D. R., Nunamaker, J. F. J., Martz, W. B. J., Grohowski, R., &
Kwok, K. L. (1989). A neural network for probabilistic information McGoff, C. (1989). Electronic meeting system experience at IBM.retrieval. Paper presented at the Twelfth Annual International ACM/ Journal of Management Information Systems, 6(3) , 25–43.SIGIR Conference on Research and Development in Information Re- Woods, W. A. (1972). An experimental parsing system for transitiontrieval, Cambridge, MA. network grammars. In R. Rustin (Ed.) , Natural language processing.
New York: Algorithmics Press.Lin, X., Soergei, D., & Marchionini, G. (1991). A self-organizing se-
170 JOURNAL OF THE AMERICAN SOCIETY FOR INFORMATION SCIENCE—February 1997
876/ 8n11$$0002 12-04-96 19:37:48 jasa W: JASIS
Related Documents