Summer Internship in Computer Science Research 2007 Dr. Riccardo Mazza, Prof. Fabio Crestani A graphical reporting tool for Moodle Project description The goal of this project is to implement a graphical and textual reporting tool for the Moodle Course Management System. The main purpose of this tool is to mine and discover the usage of specific Moodle courses. The tool has to provide a graphical interface that, at a glance, shows of the usage of a specific module (for instance: discussions, quiz, content module, ...) in every course managed by the Course Management System. The tool will allow comparing the usage in different courses, and seeing the distribution of the usage over time. Textual reports, in form of tabular data, that summarize statistics on courses’ usage has to be provided as well. The target users of this tool are the administrators of the Course Management System (who need to know how much the modules have been used in courses), the administration of the university, and the faculties (for organizational and educational purposes). Organization The project will be supervised by Riccardo Mazza and Fabio Crestani. The student will work in contact with people from the ”Laboratorio per applicazioni di eLearning (eLab)”, http://www.elearninglab.org. Since the Moodle platform is implemented in the PHP programming language, it is required the the student will implement the tool in such language and learns the details of the Moodle tool. Contact For more information, please contact Riccardo Mazza.

Welcome message from author
This document is posted to help you gain knowledge. Please leave a comment to let me know what you think about it! Share it to your friends and learn new things together.
Transcript

Summer Internship in Computer Science Research 2007
Dr. Riccardo Mazza, Prof. Fabio Crestani
A graphical reporting tool for Moodle
Project descriptionThe goal of this project is to implement a graphical and textual reporting tool for the Moodle Course ManagementSystem. The main purpose of this tool is to mine and discover the usage of specific Moodle courses. The tool hasto provide a graphical interface that, at a glance, shows of the usage of a specific module (for instance: discussions,quiz, content module, ...) in every course managed by the Course Management System. The tool will allow comparingthe usage in different courses, and seeing the distribution of the usage over time. Textual reports, in form of tabulardata, that summarize statistics on courses’ usage has to be provided as well. The target users of this tool are theadministrators of the Course Management System (who need to know how much the modules have been used incourses), the administration of the university, and the faculties (for organizational and educational purposes).
OrganizationThe project will be supervised by Riccardo Mazza and Fabio Crestani. The student will work in contact with peoplefrom the ”Laboratorio per applicazioni di eLearning (eLab)”, http://www.elearninglab.org. Since the Moodle platformis implemented in the PHP programming language, it is required the the student will implement the tool in suchlanguage and learns the details of the Moodle tool.
ContactFor more information, please contact Riccardo Mazza.
Covering, Independent Sets and Other NP-Complete ProblemsProject supervisors: Laura Pozzi ([email protected])
Paolo Bonzini ([email protected])Project duration: Two–three months
Research Background
The architecture of embedded systems (such as cell phones and set-top boxes) is different from that ofgeneral-purpose computers. Traditionally, embedded processors used application-specific hardware to-gether with very simple and low-power processors. However, because of the increased power of these em-bedded systems (think of how your mobile phone is evolving!), it is becoming less and less cost-effective todevelop custom hardware.
For the areas where performance is still not sufficient, microprocessor producers are exploring the areaof customizable processors. These processors can include custom instructions that are arbitrarily complexand that have the purpose of speeding up specific applications, such as cryptography or audio/video de-coding. Our goal is to develop effective ways of automatically extracting these custom instructions from Ccode.
Project Description
Many algorithms that deal with program analysis for the sake of processor customization work on graphs,and are in the class of NP-complete problems. This means basically two things: first, that they are hard tosolve exactly; second, that many of these problems naturally transform into each other. The latter is oftena breath of fresh air, because it is possible to find good solutions to a problem (though not necessarily theoptimal one) by transforming the task to a different one.
The project’s goal is to concentrate on covering, one of the steps to automatically derive custom instruc-tions, and analyze how to solve it. To this end, we’ll analyze both approximations to the covering problem(like branch-and-bound), and transformations of the task into different NP-complete problems (such as themaximum independent set problem).
Required Skills
The student must have interest in algorithms, and have completed both the Discrete Structures and Algo-rithms And Data Structures courses.
The student should have a good knowledge of C, and a willingness to become a serious, disciplined Chacker.
How to Apply
Please contact Paolo Bonzini.
UROP Project Proposal 2007
Advisor: Michele Lanza Co-Advisor: Romain Robbes
Project: Animating SpyWare
ContextSpyWare is a research prototype we have implemented. SpyWare monitors programmer activity to allow a fine-grainedanalysis of their programs and their behaviors. SpyWare records all the actions the programmer performs, and convertsit to change operations. Examples of change operations are:
• On 03/04/06, at 14:42, the programmer (let’s call him Bob) added the class Bar to the system.
• On 03/04/06, at 14:45, Bob added the method ’baz’ to class Bar.
• On 03/04/06, at 14:50, Bob changed the method ’baz’ in class Bar.
• On 03/04/06, at 15:02, Bob extracted two line of code from ’baz’, to the new method ’foo’, in class Bar.
SpyWare provide tools to exploit, export and visualize this information, such as graphs, time-aware code browsers,and a change matrix, as shown in this screen capture:
DescriptionSpyWare provides graphical visualizations of its data, but they are static. To visualize the change information in anefficient manner, animations are needed. Support for animations and incremental layout of graphical entities wouldallow SpyWare to display the history of a system as a “movie”, rather than a “photo album”.
Here is a tentative roadmap of the tasks you will have to do during the project.
• Investigate the Mondrian graphical framework, which can be used to implement static visualizations of data.
• Read articles about algorithms laying out graphs incrementally. Such algorithms are necessary to considerobjects appearing after a visualization is displayed.
• Extend Mondrian to support incremental addition of figures to a visualization.
• Extend Mondrian to support animations.
• Implement a lot of cool visualizations!

UROP Project Proposal: CC++ 2007
Advisor: Michele Lanza Co-Advisor: Richard Wettel
Figure 1: ArgoUML in CodeCity[1, 2].
α : OpenCroquet
β : X3D
γ : DynaMoose
δ : Software Tycoon
References
[1] R. Wettel and M. Lanza. Program comprehension through software habitability. In Pro-ceedings of ICPC 2007 (15th International Conference on Program Comprehension), page to bepublished. IEEE CS Press, 2007.
[2] R. Wettel and M. Lanza. Visualizing software systems as cities. In Proceedings of VISSOFT2007 (4th International Workshop on Visualizing Software for Understanding and Analysis),page to be published. IEEE CS Press, 2007.

UROP Project Proposal 2007
Advisor: Michele Lanza Co-Advisor: Mircea Lungu
Project: Extending the X-Ray Eclipse PluginStudent: Jacopo Malnati
Context
When developers are faced with a new system that they have to understand, a visual representation of the system is animportant aid in comprehension. Many software visualization tools exist that support program comprehension (e.g.,SHriMP, Rigi, CodeCrawler, PBS, Softwarenaut, etc.) but most of them are stand-alone tools. Recently, X-Ray, asimplified version of Softwarenaut has been integrated in the Eclipse development framework. However, there aremany features which still have to be added to the tool.
Description
Some of the tasks that have to be done in relation to X-Ray are:
• A user study which would show which are the preferred tool usage patterns. This is important to get the pulseof what is really important for the user. Probably new implementation requirements will follow from this.
• Provide a mechanism for view customization and persistence. The user should be able to define multiple per-spectives on the system.
• Implement other features that the user study suggests, or the student considers important in the limit of theavailable time.
Milestones
The length of the project will be two months. There will be weekly meetings between the adivsors and the student.
UROP Project Proposal 2007
Fernando Pedone
Clustered In-Memory Databases
Project Description
In-memory databases (IMDBs) provide high throughput and low response time by avoiding disk I/O. IMDBs havetraditionally been used by specific classes of applications (e.g., telecommunication). Current performance require-ments and cheaper semiconductor memories, however, have pushed them to more general contexts (e.g., web servers,trading systems, content caches). In most cases, applications are limited by the memory capacity of the server runningthe IMDB. In a clustered environment, the database could be partitioned and replicated into segments and stored inthe main memory of several nodes. Applications would be limited by the aggregated memory capacity of the cluster,and not by the capacity of a single node.
The goal of this ambitious project is to extend FastDB, and IMDB, to a cluster of servers.
More information about FastDB: http://www.garret.ru/ knizhnik/fastdb.html

Distributed Orchestration of Composite Web Services
Advisor: Walter Binder
Service-oriented computing, a new approach to software development, enables the con-struction of distributed applications by integrating services that are available over the web.The building blocks of such applications are web services that are accessed using standardprotocols. The composition of individual web services into an added-value, composite webservice is usually represented as a workflow.
Even though a workflow may invoke services distributed over multiple servers, the orches-tration of the workflow is typically centralized. E.g., BPWS4J acts as centralized coordinatorfor all interactions among the individual services within a workflow. While this approachgives complete control over the workflow orchestration to a single entity (which may moni-tor the progress), it often leads to inefficient communication, as all intermediary results aretransmitted to the central workflow orchestration site, which may become a bottleneck. Thisis particularly problematic, if a workflow is executed on a mobile device with limited or ex-pensive network connection.
This UROP project will investigates a new model of fully decentralized workflow orches-tration. We will introduce proxies for individual service invocations that collect the requiredinput data before they invoke the service. Moreover, they forward service outputs to exactlythose sites where they are actually needed, supporting multicast. Therefore, inefficient routingof intermediary results through a centralized coordinator can be avoided.
In this UROP project, the student will be involved in the following tasks:
1. Specification of the proxy functionality and of the necessary communication protocols.
2. Development of an algorithm to translate workflows so as to leverage the proxy infras-tructure.
3. Evaluation of savings in network bandwidth compared with centralized orchestration insimulation.
4. Prototype implementation in Java.
In tasks 1 and 2, we will consider typical workflow patterns and find an optimal tradeoffbetween completeness regarding the supported workflow patterns and simplicity of the proxyinfrastructure. Furthermore, we consider optimizations for the frequent case where the sameworkflow is executed multiple times.
1

Distributed Simulation Environment
Project supervisors: Cyrus Hall, Jeff Rose, and Antonio CarzanigaProject duration: Two months
Project Background
Many types of research require massive amounts of simulation. Often simulations grow too large to runin a reasonable amount of time on a single machine. While running multiple simulations simultaneouslyacross many machines can offer large speedups, the parameter space exploration process would be mademuch easier if individual simulations were faster. Further, some simulation are just too large to fit into mainmemory on a single machine, and therefor need to be distributed.
Project Description
The student will help with design and implementation of a distributed simulation environment. In partic-ular, we will be trying to identify good strategies for simulation object placement across many machines, inorder that communication betweenmachines is minimized. Other integrated efforts will include organizingdata collection and workload distribution. There is lots of room for experimentation in this project.
Project Organization
The project will be under the supervision of Antonio Carzaniga, Cyrus Hall, and Jeff Rose. The projectshould last about 8 weeks, with set two week goals to measure progress. The student must have an avidinterest in networking and modeling, have completed the Computer Networking class and have a workingknowledge of Ruby (with a willingness to become a serious Ruby hacker).

Dynamic On-the-fly Code Generation for Efficient Trace Analysis & VisualizationMentor: Matthias Hauswirth
Today’s computing platforms (hardware, operating systems, virtual machines, middleware) consist ofhighly dynamic components. Engineers and researchers study the dynamic behavior of these platformsto find opportunities for new performance improvements. For this purpose they often instrument theplatforms to generate a trace (a log) of relevant events. When capturing the behavior of commonly usedbenchmark applications, the size of such traces can vary from a few dozen events (e.g. one event foreach garbage collection in a virtual machine), to thousands of events (e.g. one event per time slice ofa multithreaded application), to millions of events (e.g. one event for each virtual method call in anobject-oriented application), to several billion events (e.g. one event for each completed instruction on amodern CPU, traced for one second).
Due to the large number of events, trace data often is aggregated before it is written to disk. Forexample, instead of a sequence of individual instruction completion events, the trace file may contain asequence of values (a time series), where each value corresponds to the number of events observed overa fixed time interval (e.g. 10 ms). Traces often contain a mix of different types of individual events inaddition to aggregate time series.
Due to this heterogeneity and size of the traces, classical tools for data analysis and visualizationoften break down. Researchers thus often produce special purpose tools for each new type of trace theyneed to analyze. At USI and at the IBM T. J. Watson Research Center we are developing a flexibletrace analysis and visualization infrastructure that can efficiently handle large traces. Moreover, theinfrastructure can even process traces online, as they are received from the instrumented application.
In this UROP project you will develop and evaluate various design alternatives of a crucial componentfor this infrastructure. Your component will compile trace format specifications (definitions of all eventtypes and time series) into Java classes for the efficient processing and in-memory storage of correspondingtraces. The component will generate the bytecode for these classes and load them on-the-fly, so arunning trace processing application can read the trace specification and immediately start processingthat trace. You can use a parser generator (such as ANTLR or JavaCC) for producing a parser of theevent specifications, and a library like the BCEL (Apache Byte Code Engineering Library) to generatethe class files.
Required Skills
Java. OOP. Creative. Motivated. Persistent. Communicative.
Università della Svizzera Italiana
UROP internship project proposal Sponsors: Paolo Giordano, Alberto Vancheri, Denise Andrei (MACS-Lab, USI) Mentor: Giovanni Ciampaglia
Georeferencing with heterogeneous Web APIs
Project description The intern student may select one or more tracks for his project among the following; note that some tracks are dependant on some other tracks:
- extraction of a graph representing road connections out of Google Maps or Swissgeo imagery. The graph must be detailed with street names and information about one way streets. Each street is described as a polyline. The graph will be stored as a shapefile. The shapefile (shp) format is an industry standard for GIS applications, developed by ESRI.
- Construction of an approximate graph out from the previous one. In the detailed graph a link is a part of a street that connects two consecutive junctions between different streets. The union of consecutive links that follow a straight path can be aggregated in a single component. The goal is to provide a faithful description of a road map, yet as lightweight as possible.
- Extraction and georeferencing of commercial activities stored in Google Maps and other mapping services on the Web.
- Design and implementation of an algorithm for the selection of routes for agents with an agenda-based planning process.
Internship description The intern student will work in close connection to the researchers of MACS-Lab to design and implement solutions for the above tracks. Part of the student work will be to select and integrate existing sets of API to access and manipulate data from several heterogeneous sources (e.g. Javascript API to access Google Maps imagery, MATLAB API etc.). This is a research oriented project; internships characterized by a high degree of autonomy and that provide brilliant results are open to the possibility of publication on a scientific journal in the field of geographical computing.

Informa ClickerDesign, Implementation, and Evaluation of Solution Similarity Measures
Mentor: Matthias Hauswirth
Informa is a classroom response system developed at USI. In the classroom, students run the InformaClicker Java application on their notebooks, while the instructor runs the Informa Instructor application.The instructor publishes a question or problem to be solved by students in their clicker application.Students solve the problem, and anonymously submit the solution to the instructor. Besides presentingeach individual submitted solution, the instructor application also provides aggregate information thathelps the instructor and the students identify problems of understanding.
The research aspect in the Informa project is the automatic summarization of the submitted solutions.For multiple choice problems (the simplest type of problem implemented in Informa) this summarizationis trivial: a histogram presents the number of students who picked each available choice. However, forless constrained problems, for example where a solution consists of an arbitrary list of words, a snippetof Java code, a UML diagram, or a digital logic circuit, summarization becomes a challenge. Are twodigital logic circuits (two graphs) the same? How similar are they? Did the students who created thetwo circuits have the same issue in understanding the problem? A system that can automatically answerthese questions can eliminate similar solutions and present a summary that consists of one solution foreach issue the students had.
Visualization of the hierarchical agglomerative clustering of solutions of the regular expression problem“select the first substring matching the regular expression ab+”
In this research project you will focus on one type of problem (e.g. the digital logic circuit, orthe list of words, . . . ), and provide the means to effectively summarize a large number of solutions ina visualization that fits on a single screen. One approach to such summarization is the clustering ofsolutions based on their similarity. The summary consists of the presentation of representative solutionsfrom a small number of clusters of similar solutions. Clustering algorithms require a means to computethe similarity of two solutions (a similarity measure).
You will design and implement a set of such similarity measures for the chosen type of problem. Youwill then use these similarity measures to cluster a set of solutions, and you will evaluate the usefulnessof the resulting clusters. The result of your project should be a plug-in for Informa that provides themost useful automatic summarization of the chosen problem type.
Required Skills
Java. OOP. Creative. Motivated. Persistent. Communicative.

Monitoring conversational web services
Project Mentor Domenico Bianculli ([email protected])Project Sponsor prof. Carlo Ghezzi ([email protected])
Project Background
Web services support a dynamic architectural style where the binding among components may changeat run-time. New services may be developed and published in registries, and then discovered by possi-ble clients. Previously available services may disappear or become unavailable. This situation has beencharacterized by the term open-world software, to describe a situation where applications are composed outof parts that may change unpredictably and dynamically. It has been observed that open-world softwareintroduces the requirement of continuous validation. Since a software architecture evolves dynamically,validation must extend from development time to run-time.
Monitoring is a necessary component of a run-time validation facility. Monitoring consists of collectingdata about a monitored service and checking that the data conform to the expected behavior of that service.
Project Description
In this project, we will focus on conversational web services, i.e. stateful services whose expected behaviordepends on the history of previous interactions between a client and a given service instance. We assumethe expected behavior to be described as a formal, algebraic specification of the monitored service.
The goal of this project is to extend an open source BPEL engine, ActiveBPEL, to support monitoring ofconversational web services, by integrating a symbolic evaluator of algebraic specifications. The monitoringarchitecture will be developed using aspect-oriented programming techniques.
Required skills
Good programming skills in Java are required. The student should also be interested in learning webservices technologies, as well as AspectJ (aspect-oriented programming language) and CafeOBJ (algebraicspecification language).
Contact
For more information, contact Domenico Bianculli.
Model Annotation, Constraint and Code Generation
for Self-Checking Programs
Project mentor/sponsor: Jochen Wuttke, Mauro Pezze
Models are commonly used to describe the structure and behavior of software on a higher, moreabstract level than the actual source code. Unfortunately, current modeling techniques for system be-havior have only limited possibilities to express in detail what is the correct behavior. To make modelsmore complete with respect to the requirements and the actual implementation, a mechanism to specifyconstraints on the allowed behavior is required. In addition, if these high-level constraints can then beautomatically translated into code, which checks the program while it is running, we also have a meansto check if our program actually behaves like we specified.
This project has the goal to use annotations in software models (e.g. UML or EMF class models) toautomatically derive constraints in the form of pre- and post-conditions, translate them into source-levelchecks, and integrate them into existing applications to control their runtime behavior.
Details
The final outcome of this project should be an Eclipse plug-in that transforms EMF and/or UML2 modelsand annotations into Java aspects, which check the constraints on the program. To do this you needto familiarize yourself with the EMF and UML2 plug-in frameworks to assess which one is better suitedfor the task. With the chosen framework, you then have to create a model of the Java Pet Store webapplication as the running example throughout this project. The code generator based on the modelshould generate Java aspects and possibly a comprehensive OCL specification of the constraints. Toknow which aspect oriented framework to use, you would also have to assess the available frameworks,and chose one that is suitable for the project. Once you are able to generate code, you will then have toassess the effectiveness of the generated checks, and possibly propose improvements on the constraints.
The key research questions you will need to tackle are how to find the right places to add checkingcode just by looking at the model. And once you know how to do that, what kind of checks are actuallyuseful, how much information must the model contain, so that you are able to create the checks, etc.
Key Outcomes
• You learn how to generate code from software models.
• You learn how to use aspect oriented programming to deal with cross-cutting concerns in programs.
• You learn how to use (and how not to use) specification techniques like pre/post-conditions toimprove software quality and reliability.
• You learn how to write an Eclipse plug-in.
• You get to write a nice project report ;-)
1

Service Composition Algorithms Operating on aCompact Directory Digest
Advisor: Walter Binder
Service-oriented computing enables the construction of distributed applications by inte-grating services that are available over the web. The building blocks of such applications areweb services. Service discovery is the process of locating providers advertising services thatcan satisfy a given service request. Automated service composition addresses the problemof assembling individual services based on their functional specifications in order to create avalue-added, composite service that fulfills a service request. Most approaches to automatedservice composition are based on AI planning techniques and assume that all relevant serviceadvertisements are initially loaded into a reasoning engine.
However, due to the large number of service advertisements and to the loose couplingbetween service providers and consumers, services are indexed in service directories. Asloading a large directory of service advertisements into a reasoning engine is not practical, weinvestigate a compact encoding of service directories as Zero-Suppressed Reduced OrderedBinary Decision Diagrams (ZDDs) in this UROP project. In such an encoding, only thoseaspects of service specifications are preserved that are relevant for automated service compo-sition. The ZDD representing a large service directory shall be small enough to make frequentdistribution to service composition engines practical.
In this UROP project, the student will be involved in the following tasks:
1. Design of service composition algorithms operating on ZDDs.
2. Implementation of these algorithms in Java.
3. Creation of a testbed for large-scale, automated service composition.
4. Evaluation of the implemented service composition algorithms.
5. Improvement of a ZDD library implemented in Java (improvement of the programmingmodel as well as performance optimizations).
1

Summer Internship in Computer Science Research 2007
Anna Egorova-Forster, Amy Murphy
Simulating MAC-Level Protocols for Sensor Networks
Project DescriptionThe goal of this project is to implement a small suite of established, well-known MAC-Level protocols for wirelesssensor networks. The protocols should be implemented in C++ for the network simulator Omnet++. The project willgive you the opportunity to learn quite in depth how sensor networks work and what are their goals and challenges.The ready suite will be published as an official part of the Omnet++ simulator and probably be used widely fromresearchers in that area.
Project OrganizationThe project will be under the supervision of Anna Egorova-Forster and Amy Murphy. Together with them you willlearn how to use the Omnet++ simulator and how to program for it, and discuss the protocols to be implemented.Some basic networking knowledge (as from the Computer Networking course) and very good programming skills inJava or C++ are required.
ContactFor more information, please contact Anna Egorova-Forster.

Summer Internship in Computer Science Research 2007
Anna Egorova-Forster, Amy Murphy
Simulating Routing Protocols for Sensor Networks
Project DescriptionThe goal of this project is to implement a small suite of established, well-known routing protocols for wireless sensornetworks. The protocols should be implemented in C++ for the network simulator Omnet++. The project will give youthe opportunity to learn quite in depth how sensor networks work and what are their goals and challenges. The readysuite will be published as an official part of the Omnet++ simulator and probably be used widely from researchers inthat area.
Project OrganizationThe project will be under the supervision of Anna Egorova-Forster and Amy Murphy. Together with them you willlearn how to use the Omnet++ simulator and how to program for it, and discuss the protocols to be implemented.Some basic networking knowledge (as from the Computer Networking course) and very good programming skills inJava or C++ are required.
ContactFor more information, please contact Anna Egorova-Forster.

UNDERGRADUATE RESEARCHOPPORTUNITIES PROGRAM
Project: Verification Conditions with StringsMentor: Stefano Tonetta
Sponsor: Natasha Sharygina
University of LuganoFaculty of Informatics
Project Description
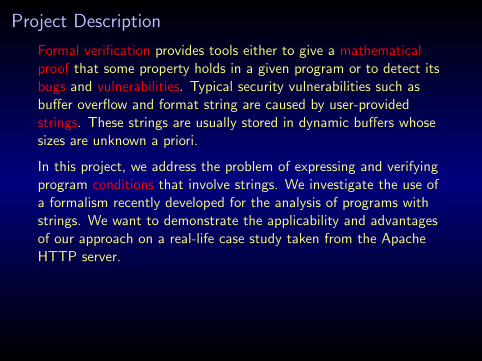
Formal verification provides tools either to give a mathematicalproof that some property holds in a given program or to detect itsbugs and vulnerabilities. Typical security vulnerabilities such asbuffer overflow and format string are caused by user-providedstrings. These strings are usually stored in dynamic buffers whosesizes are unknown a priori.
In this project, we address the problem of expressing and verifyingprogram conditions that involve strings. We investigate the use ofa formalism recently developed for the analysis of programs withstrings. We want to demonstrate the applicability and advantagesof our approach on a real-life case study taken from the ApacheHTTP server.
Project Goals
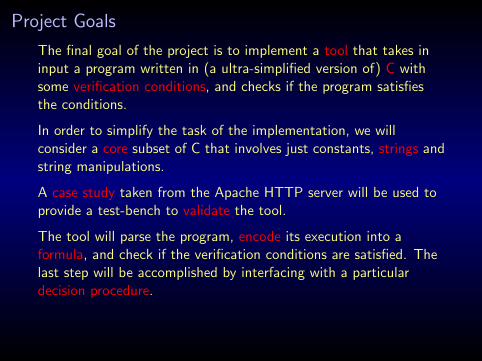
The final goal of the project is to implement a tool that takes ininput a program written in (a ultra-simplified version of) C withsome verification conditions, and checks if the program satisfiesthe conditions.
In order to simplify the task of the implementation, we willconsider a core subset of C that involves just constants, strings andstring manipulations.
A case study taken from the Apache HTTP server will be used toprovide a test-bench to validate the tool.
The tool will parse the program, encode its execution into aformula, and check if the verification conditions are satisfied. Thelast step will be accomplished by interfacing with a particulardecision procedure.

Project Organization
The project activity will be organized according to the followingschedule:
I definition of case study: 1 weekI identify interesting functionsI insert verification conditionsI simplify the code
I tool design: 1 weekI tool implementation: 4 weeks
I lexical analyzerI parserI program simulationI interface with decision procedure
I tool validation: 1 week
I report: 1 week

Dr. Peter Kunszt Tel : +41 91 610 82 11 Manager of Grid and User and Application Support Services direct : +41 91 610 82 22 Galleria 2, Via Cantonale fax: +41 91 610 82 09 CH – 6928 Manno email: [email protected]
Proposal for a Summer Internship: Web Service for a Metadata Catalog Several Grid projects that CSCS is part of are in need of a metadata service for small and large datasets. The community has already invested a lot into providing such services, however the problem always was that these services were too specific, had proprietary interfaces or were abandoned after the project has stopped. The internship would be about reviving and modernizing an existing service, filling out the gaps and adding features. The existing metadata catalog comes from the EGEE project (Enabling Grids for e-Science in Europe II), which CSCS is member of. The internship project would need to
• Start from the existing middleware • Brush up the Web Service Definition Language • Apply newer service technologies to it (later versions of Axis, Tomcat, etc) • Provide a catalog instance for one of CSCS’s projects (with specialized client-
side APIs). • If time allows: provide a web interface through AJAX.
The programming environment can be freely chosen by the student, we would prefer to use IntelliJ Idea, for which we have a project-license; a commercial development environment, which is similar to (but in many ways better than) Eclipse. The contact person at CSCS is Peter Kunszt, details see below.

Hugo Boss Shoe Design Proof of concept of a two-handed 3D manipulation environment We are looking for motivated students for an intern ship at the Innovation Department working on a project in the area of virtual shoe design. Shoe design is a task still performed with mock-ups, pen and paper, at best with graphical applications like for example Illustrator. This makes the design process inflexible and relatively time consuming. One of the main obstacles to designing in a 3D virtual environment seems to be the hardware interface; single-handed interfaces based on conventional devices such as a mouse and/or track ball are poor substitutes for the freedom experienced when working with pencil and paper. The object of this project is to create a ‘demonstrator’; showing the potential of having an environment that supports two handed input. You will develop a simple 3D design environment supporting the simplest of use cases (for example drawing a line on a 3D object) for two-handed interaction using two out of the box input devices. More information Fred Voorhorst, tel: 091 696 6642
IMPLEMENTAZIONE SISTEMA INFORMATIVO INTERNO
Descrizione progetto Il progetto prevede inizialmente la verifica dei processi interni. Tale analisi permetterà, da un lato, di verificare se siano possibili delle ottimizzazioni che possano garantire un incremento di efficienza e, dall’altro, garantirà che il futuro sistema informativo sia coerente con l’operatività aziendale. Dopo tale fase di analisi, inizierà quella di implementazione articolata in diverse attività, sia tecniche che applicative. L’implementazione si protrarrà per diversi mesi, permettendo gradualmente all’impresa di familiarizzare con il nuovo sistema e verificarne la rispondente alle necessità dell’azienda stessa. Soluzione adottata Microsoft Dynamics NAV Requisiti • Buona capacità di analisi delle procedure aziendali • Buona visione dell’intera operatività aziendale • Capacità di relazione e di formalizzazione della documentazione di progetto
Competenze acquisibili A fine progetto lo studente avrà acquisito maggiori competenze analitiche nelle diverse aree aziendali, che gli permetteranno di poter affrontare in maniera confidente le sfide proposte dal mondo professionale. In un progetto di tale portata inoltre si apprende, da un lato, a rispettare tempi e costi di progetto e, dall’altro, a lavorare sia in autonomia che in team. Infine, grazie a questo progetto, lo studente apprenderà a rapportarsi con i propri clienti (in questo caso i futuri utenti del sistema) in maniera professionale. Persona di riferimento [email protected] Massagno, maggio 2007
Related Documents