A GIS-based Flood Risk Assessment Tool: Supporting Flood Incident Management at the local scale Meghan Alexander, Christophe Viavattene, Hazel Faulkner and Sally Priest Flood Hazard Research Centre, Middlesex University July 2011 FRMRC Research Report SWP3.2 Project Website: www.floodrisk.org.uk

A gis based flood risk assessment tool supporting flood incident management at the local scale
Aug 16, 2015
Welcome message from author
This document is posted to help you gain knowledge. Please leave a comment to let me know what you think about it! Share it to your friends and learn new things together.
Transcript
A GIS-based Flood Risk Assessment Tool:
Supporting Flood Incident Management at
the local scale
Meghan Alexander, Christophe Viavattene, Hazel Faulkner and Sally Priest Flood Hazard Research Centre, Middlesex University
July 2011
FRMRC Research Report SWP3.2
Project Website: www.floodrisk.org.uk

A GIS-based Flood Risk Assessment Tool:
Supporting Flood Incident Management at the local scale
i
Document Details
Document History
Version Date Lead
Authors
Institution Joint Authors Comments
001 25th July
2011
Meghan
Alexander
FHRC Christophe Viavattene,
Hazel Faulkner and
Sally Priest
Draft - complete
002 26th
July,
2011
Meghan
Alexander
FHRC Christophe Viavattene,
Hazel Faulkner and
Sally Priest
Submitted to
FRMRC for review
and comment
Statement of Use This report is intended to be used by researchers working on decision support tools in flood risk
management. It describes the construction of a GIS-based flood risk assessment tool, trialled with
emergency professionals in the UK. A more detailed methodology is presented in a companion
document (Alexander et al. 2011). This document presents the feedback from emergency
professionals and some practical recommendations for future tool development.
Acknowledgements This research was performed as part of a multi-disciplinary programme undertaken by the Flood Risk
Management Research Consortium. The Consortium is funded by the UK Engineering and Physical
Sciences Research Council under grant GR/S76304/01, with co-funders including the Environment
Agency, Rivers Agency Northern Ireland and Office of Public Works, Ireland.
Disclaimer This document reflects only the authors’ views and not those of the FRMRC Funders. The information
in this document is provided ‘as is’ and no guarantee or warranty is given that the information is fit for
any particular purpose. The user thereof uses the information at its sole risk and neither the FRMRC
Funders nor any FRMRC Partners is liable for any use that may be made of the information.
© Copyright 2009 The content of this report remains the copyright of the FRMRC Partners, unless specifically
acknowledged in the text below or as ceded to the Funders under the FRMRC contract by the
Partners.

A GIS-based Flood Risk Assessment Tool:
Supporting Flood Incident Management at the local scale
ii
Summary
AIM The original objective of this research was to develop an exploratory tool that addressed the
potential for incorporating vulnerability assessments into risk mapping; ‘bolting’ this information onto
local, urban scale flood modelling developed within Phase 1 of the Consortium and mapping these
data at a relevant scale to emergency professionals (Wilson, 2008). Preliminary discussions with
professional stakeholders (i.e. Category One Responders, as identified under the Civil Contingencies
Act, 2004) supported Wilson’s (ibid) statement that the household scale of vulnerability and risk
mapping was desirable; however, responders acknowledged not only the impracticality of this goal,
but also the dangers of relying on household information given the highly variable and dynamic
nature of vulnerability, (unless derived from up-to-date databases, such as the health service and
utility companies). Furthermore, the Data Protection Act (1998) constrains the storing, sharing and
mapping of personal information. The vulnerability component in this tool is therefore reliant upon
census-derived data. Rather than allowing this to become a restriction, this research sought to
explore the ways in which potential indicators of vulnerability and a composite vulnerability index
(the Social Flood Vulnerability Index, SFVI after Tapsell et al., 2002), could be adjusted and
manipulated to suit the varied tasks carried out by professional end-users, in the context of Flood
Incident Management (FIM). A key research question regarded the utility of social vulnerability
assessment and whether more interactive engagement with vulnerability data could facilitate its
usage within FIM decision making.
METHODS This study sought to engage with emergency professionals throughout the research
process i.e. both pre and post tool completion. Preliminary interviews with professional stakeholders
(i.e. Category One Responders) were conducted to elicit; i) Professional views on vulnerability, its
application in decision making and how it should be assessed; ii) As the target end-user of the tool,
responders were asked to rate a number of design ideas and make further suggestions on how a tool
of this nature might be packaged together. From these discussions, the tool was designed and
constructed and then demonstrated to a sample of responders originally interviewed. Professional
feedback from this has been used to steer a number of more practical recommendations for future
tool-developers.
“THE TOOL” was approached almost as an ‘eggs all in one basket’ to see how different end-user react
and rate different design features, to inform some practical recommendations for how such a tool
might be more specifically tailored in real-life applications. Datasets are stored within a Personal
Geodatabase constructed in ArcCatalogue and the tool itself, has been designed within, and launches
from, the ESRI product ArcMap. Rather than simply allowing layers to be added and removed, this
tool enables users to manipulate these layers to suit their needs and perform calculations on the data
to produce vulnerability and risk profiles from a number of flood scenarios. This interactive nature
seeks to engage the end-user to become actively involved in the assessment process and map
production. The tool provides a means for integrating the informed subjectivities of the end-user,
with the objectivity of the ‘scientific expert’ that is inherently built within the tool. The tool has been
developed for two case studies: Cowes, Isle of Wight and Keighley, West Yorkshire. The tool is
designed with three key interfaces isolating hazard and vulnerability and allowing the user to bring
these together in the calculation of risk.
The Hazard Interface: Utilises the model outputs from 1D-2D modelling developed for Cowes, Isle of
Wight (Allitt et al., 2009) and Keighley, West Yorkshire (Chen et al. 2009) and provides a range of
scenarios for pluvial flooding. Users can adjust hazard thresholds, ‘clean’ the map to view flooding to
road network and property; where the latter offers two hazard models based on risk to life or depth-
damage thresholds. The user can also launch an interactive flood animation.
The Vulnerability Interface: Utilises existing census data (2001) and adapts the original SFVI
methodology, allowing users to adjust the spatial scale at which relative vulnerability is calculated.
Users can view indicators in isolation, alongside rationales, and construct their own vulnerability index
where selection and weighting of indicators is user-defined.

A GIS-based Flood Risk Assessment Tool:
Supporting Flood Incident Management at the local scale
iii
The Risk Interface: Brings together the hazard and vulnerability models at the property scale. User
can define the weighting between hazard and vulnerability and view an automated property and
people count to summarise risk categories.
FINDINGS Options to animate and interact with flood inundation modelling rated highly on the end-
users ‘wish list’ and professionals commented on the application-potential of this feature for
exercising/training, planning and responding to flood events. The indicator/indices approach to
measuring and monitoring social vulnerability is widely acknowledged as limited for informing
emergency response, which requires accurate and timely information at the household scale: Only
during broad-scale flood events requiring strategic decision making (such as 2007 floods), could this
form of assessment be helpful for prioritising stretched resources. For the purpose of planning and
targeting future mitigation strategies vulnerability indicators are deemed valuable, providing there is
a clear expert-declared rationale underlining each potential indicator. Professionals interviewed
highly rated the option to view vulnerability indicators in isolation, rather than as a product score (e.g.
the SFVI, after Tapsell et al., 2002), with the additional option to adjust the spatial scale at which
relative vulnerability is calculated. The ability to ‘build their own’ vulnerability index, incorporating the
user’s informed subjectivities concerning the relative importance of each indicator, was highly
regarded for the right context (i.e. not during their ‘response’ phase of professional activities).
Furthermore, the interactive nature of the Risk interface of the tool allowed the user to explore the
variability in the risk picture, by varying the weighting assigned to hazard and vulnerability for
assessing local risk; this feature was deemed particularly useful for professional training.
RECOMMENDATIONS
� Design flood scenarios (including different flood drivers and return periods) are useful for
planning and training and exercising; however, the worst case scenario is essential.
Visualising flood scenarios is a useful tool for prompting proactive thinking (rather than
merely reactive), and providing a visual example of the possible spatial patterning of the
flood. Tools supporting emergency response should enable an interactive feature for the
user to manipulate river/rainfall levels to mirror incoming real-time information.
� Interactive animation is in invaluable means of depicting the spatial-temporal patterning of
the flood (as it accumulates, recedes and ponds): Where and when are key questions in
planning for and responding to flood incidents. Providing the animation is a slick operation
i.e. can be sped-up/slowed-down/paused etc. Summary tables should be used to support the
visualisation and give a rapid summary of what is being displayed on screen (e.g. flood start,
end, peak).
� Future vulnerability assessment needs to be malleable and flexible to the broad base of FIM
practitioners, with varied demands, responsibilities and professional constraints. Interactive
assessments and map-making is a powerful tool for not only communicating science at the
professional interface, but integrating professional knowledge and supporting the increasing
demands on FIM in the UK.
� Pragmatic flood research requires the stakeholder to become an active participant in the
research process; thereby acknowledging the importance of a two-way knowledge exchange
in facilitating the uptake of new ideas and tools in practice, as well as prompting new
thinking. This constitutes a broader effort to enhance the translation of science at the
practitioner interface.
� The requisite for simplistic tools is tied to a contentious debate concerning the dualistic
meaning of simplicity: Do practitioners require simplistic-user-friendly tools or simplistic-
information tools. It is apparent from the professional interviews reported on in this report,
that simplistic-user-friendly tools are essential. This is due mainly to the varied demands
placed on professionals which mean flood-related matters are but one, small component of
the day-job; and inexperience, and a lack of confidence and self-efficacy in using new

A GIS-based Flood Risk Assessment Tool:
Supporting Flood Incident Management at the local scale
iv
software. There is mixed support for the interpretation that the desire for simplicity reflects
a desire for simplistic-information. For instance, most responders acknowledged the
difficulties of defining and mapping vulnerability and appreciated the nuances in this
concept; on the other hand, while acknowledging uncertainties in flood modelling, some
responders seemed reluctant to engage with it – this may be because they found it difficult
to visualise how uncertainty might be integrated in mapping, or because uncertainty is
common place in the day-job and therefore not regarded as an issue. There is a need for
further research on this matter which implies a greater tension involving the translation of
science to practitioners and the professional context.
REFLECTIONS Although this research illustrates that there are possibilities for extending and utilising
vulnerability indicators within pragmatic decision support tools, the response from professional
stakeholders demonstrate that there are some fundamental limitations of this approach. In particular
there is a mismatch between the scales available for assessing flood hazard and social vulnerability,
which inherently constrain local risk assessments. On one hand, flooding can be modelled and
depicted through space and time and thus easily transformed into useable visualisations (e.g.
animation), capturing the dynamism of the hazard; conversely, vulnerability assessment remains
constrained by a static-snapshot-layering approach. Professionals interviewed in this study heavily
discussed these limitations (e.g. the decadal timescale of the census and issues of accuracy), which
means that this form of vulnerability assessment is considered useful only as a ‘broad brush’ approach
to painting an areas social make-up. The two approaches in hazard and vulnerability appraisal are
divorced in terms of scale (spatial and temporal) and must be equally resolved in order to inform a
meaningful risk assessment.
It has been argued that more meaningful assessments of vulnerability could derive for instance, from
the use of existing social data regarding people’s attitudes and responses to flood risk (Twigger-Ross,
2010). One might question who has the authority to impart this information and define what is
meaningful; is it the professional stakeholder, the academic researcher or the role of the community
under scrutiny? This report highlights potential methods for adapting existing vulnerability
approaches (using the SFVI as an example) and the potential for integrating this flexibility and end-
user control within a decision support tool. Limitations in the area-wide approach, resulting from the
dependency upon existing census data, could be resolved with the inclusion of locally-informed
information; whether this arises from exiting social surveys regarding flood experience and responses
specifically or from more generic discussions with the public in at-risk locations. Social science could
facilitate this process of seeking more meaningful assessments of social vulnerability.

A GIS-based Flood Risk Assessment Tool:
Supporting Flood Incident Management at the local scale
v
Table of Contents
1 Introduction ............................................................................................................................................. 6
2 The professional context: Flood Incident Management in the UK .................................... 6
2.1 A framework for Integrated Emergency Management (IEM)…………………………7
2.2 Extending the “toolkit” for FIM .............................................................................................. 8
2.3 A note on visualisation ............................................................................................................ 10
3 Research design .................................................................................................................................... 11
3.1 Study sites ..................................................................................................................................... 13
3.2 Preminary interviews: The end-user “wish list”........................................................... 17
4 A flood risk assessment tool ............................................................................................................ 23
4.1 The Hazard Interface ................................................................................................................ 25
4.2 The Vulnerability Interface.................................................................................................... 31
4.3 The Risk Interface ...................................................................................................................... 35
5 Evaluating the tool: Professional feedback ............................................................................... 37
6 Recommendations for future tools in practice ........................................................................ 49
7 Reflections………………………………………………………………………………………………………..52
8 Conclusions ............................................................................................................................................. 54

A GIS-based Flood Risk Assessment Tool:
Supporting Flood Incident Management at the local scale
6
1 Introduction
Flood risk is defined in the UK by the probability of flood occurrence and its potential consequences
(Flood and Water Management Act, 2010). The risk management approach adopted in the UK is seen
as a holistic and sustainable strategy (EA, 2009); as such, alleviating risk is both a matter of addressing
the likelihood of flooding (e.g. flood defences and development planning) and the potential impacts
(e.g. forecasting and warning, and emergency management). Risk is thus a function of the hazard (i.e.
frequency and magnitude of the flood) and the vulnerability (susceptibility) of the receptor exposed to
the hazard. Mapping has become the keystone for flood risk management and communication in
representing the spatial relationship between hazard and vulnerability and resulting risk. In light of
growing climate change concerns and the predicted escalation of flooding, the EU Floods Directive
(2007) means member states are now required to develop and utilize flood hazard and risk mapping to
inform flood risk management plans by 2015. The purpose of these plans is to steer strategies towards
prevention, protection and preparedness, in attempts to alleviate future costs from flooding. This
research seeks to build upon this cornerstone of mapping and develop an interactive, GIS-based tool
for local-scale flood risk assessment.
This report establishes the context of Flood Incident Management (FIM) within the UK and describes
some of the current tools which are employed in practice to support decision making. The research
process is reviewed in section 3. Two study sites have been selected based on i) the availability of
existing flood modelling developed within FRMRC Phase 1 and ii) the socially-contrasting nature of
these locations in Keighley, West Yorkshire and Cowes, Isle of Wight Hampshire. Feedback from
preliminary interviews with professional stakeholders (namely Category One Responders: section 3.2)
was used to inform the construction of the GIS-based flood risk assessment tool. The completed tool is
illustrated and explained in section 4 and followed with a discussion of the secondary-feedback from
emergency professionals to whom the tool was demonstrated. A number of practical
recommendations are outlined in section 6 and it is suggested that further tailoring is required to
launch such a tool in practice. Limitations in the vulnerability approach adopted in this study are
acknowledged and it is recognised that this exists partly because the spatial and temporal scales of
vulnerability and hazard assessment are mismatched, making the assessment of local risk problematic.
2 The professional context: Flood Incident Management
(FIM) in the UK
A central objective to this research was to tailor and trial a flood risk assessment tool with potential
professional end-users; namely Category One Responders concerned with flood incident management.
This section reviews this professional context, which is situated within a framework of Integrated
Emergency Management (IEM). There has been a growth of decision support tools, for data storing,
mining, sharing and visualisation and a sample of these are presented in section 2.2. Although the tool
developed here is not intended for real-life application at this stage, an understanding of what is currently
‘on the market’ was deemed useful for steering the design of the tool (alongside stakeholder
recommendations) and highlighting current gaps – in this instance, the lack of interactive assessment for
social vulnerability for flood risk assessment. This section concludes with a note on visualisation, drawing
heavily from Cartography literature to highlight the scope for continuing tool development which utilises
visualisation and interactivity; to facilitate the communication and knowledge transfer across the
scientific-practitioner divide, ownership and prompt new modes of thinking.

A GIS-based Flood Risk Assessment Tool:
Supporting Flood Incident Management at the local scale
7
2.1 A framework of Integrated Emergency Management (IEM) Risk is acknowledged as changing in dynamic ways during the course of an emergency
1 event; ‘New risks
emerge, previously recognised risks recede and the balance between risks change continuously’ (HM
Government, 2004). Balancing risks is a crucial part of planning, training and exercising emergency
situations. While the UK is faced with a number of climatologically-related hazards (snow storms, heat
waves, drought) flooding has arguably been at the forefront of discussions and subject to recent policy
amendments. Emergency management in the UK is organised through the statutory framework of the
Civil Contingencies Act (HM Government, 2004), set within the wider context of integrated emergency
management (IEM). The aspiration of IEM is to facilitate joined-up, multi-agency response from the local,
regional and national scale. Local Resilience Forums (LRF) provide the setting for multi-agency discussion,
planning and exercising for the array of threats posed to civil protection in the UK. LRF membership
consists of representatives from Category One and Two Responder groups (Table 1). Regional Resilience
Forums (RRF) similarly aim to enhance multi-agency coordination for regional-wide emergency
preparedness and mediate new initiatives and policy amendments effected in Central Government, with
the region, and from the region to local responders.
Table 1: Category One and Category Two Responders
Category One Responders Category Two Responders
Local Authority
A county council, district
council; including emergency
planning
Utilities
Electricity; Gas; Water and
sewerage; Public
communication providers
Emergency Services
A chief officer of Police: A chief
constable of British Transport
Police force: A Fire and Rescue
authority: Maritime and
Coastguard agency: Ambulance
service
Transport Operators
Network Rail: Train operating
companies: London
underground and Transport
for London: Airport
operators: Harbour
authorities: Highways Agency
Health authority
A NHS Truest: A Primary Care
Trust (PCT): Health Protection
Agency (HPA): Foundation
trusts: Acute trusts
Health and Safety
Executive
Environment Agency Strategic Health
Authority
Category One responders are central to emergency response and are subject to the full set of civil
protection duties: These include putting into place a number of plans (contingency, emergency, business
continuity); establishing arrangements for sharing information (with other responders, as well as the
public); meeting the responsibilities within the existing remits of the agency, as well as ensuring the
‘joined-up’ working across agencies. Category Two responders function as ‘cooperating bodies’ to the
Category One response and are principally tasked with sharing information and advice with all necessary
responders involved (for full details of civil protection duties consult the CCA, 2004). Integrated
emergency response is coordinated through a tiered command structure; from broad scale events
requiring a strategic response, through to the tactical and operational command required on the ground.
Within the remits of the individual agencies involved these tiers of command and control are referred to
as gold, silver and bronze, respectively.
1 Where emergency is defined as an event of situation which threatens serious damage to human welfare / or the
environment of a place in the UK (Civil Contingencies Act: HM Government, 2004)

A GIS-based Flood Risk Assessment Tool:
Supporting Flood Incident Management at the local scale
8
In the context of flooding, Multi-Agency Flood Plans (MAFP) necessitate this joined-up working to
coordinate flood response; indeed this process of working together is considered equally as important as
the final product (HM Government et al., 2008). Vulnerable groups are identified and accounted for
within MAFP via the mapping of key facilities; such as schools, elderly care homes, hospitals etc. The
impracticalities of creating inclusive repositories of household-scale vulnerabilities (i.e. keeping it up to
date and issues surrounding data protection), means that emergency planners and responders are
required to build inclusive lists, not of vulnerable groups2 per se, but detailing the appropriate agencies
(and databases) responsible for these groups and pathways for accessing these lists as and when required
(HM Government, 2008); of which the Local Authority and constituent departments of Adult and Social
Care, lead. This central list of partners and contact details are used to infer the potential scale and nature
of the response required in the event of an emergency. The guidance document for identifying vulnerable
people further emphasises the importance of employing this methods as a means of ‘pushing’ warning
messages and ‘pulling’ potentially vulnerable individuals towards the authorities in advance of an
emergency. Vulnerability mapping and the use of Geographic Information Systems (GIS) is highlighted as
an invaluable tool for appreciating both the scale of the response required (e.g. location of rest centres)
and potential impact (i.e. nature of aftercare). This guidance document in particular emphasises the
importance of complementing the mapping of vulnerable groups, with estimated people counts and
appropriate response mechanisms required (HM Government, 2008).
While national flood risk management (and coastal erosion) remains within the remits of the Environment
Agency, the Flood and Water Management Act (2010) assigns Local Authorities (LA) as the lead agency in
response to local flood risk management; including flooding from surface water, small watercourse,
canals, reservoirs and groundwater. Under the Flood Risk Regulations (20093) LAs are required to
complete flood risk assessments by June 2011: Social vulnerability mapping is inexplicitly incorporated
within these maps through the mapping of ‘human health’ (risk indicator) and is based on a property
count, estimated people count (i.e. 2.5 people per property) and the mapping of critical services (e.g.
hospitals: Environment Agency, 2010). It is not a requirement to consider the social make-up of these
properties.
These recent policies, the Flood Risk Regulations (2009), the Flood and Water Management Act (2010)
and earlier suggestions from the Pitt Review (2007), place a mounting pressure on Local Authorities to
identify and map localised flood risk, and coordinate appropriate responses to meet the goals of
sustainable flood risk management. Furthermore, this ‘devolution’ of FRM, places responsibility into the
hands of professional stakeholders with less and less formal training in flood science (Faulkner et al., in
press). There is a need to develop new tools with the ability to not only support the shifting roles of local-
based practitioners and decision making, but also in translating flood science to professional end-users of
this knowledge. It is argued that this translation process could not only facilitate the up-take on new
ideas, knowledge and tools in practice, but also augment practitioner engagement in flood science. In the
long-term this form of translation and focus on pragmatic flood research which seeks to adjoin science
and practitioners, could meet the goals for capacity building and improve local flood risk management
(Defra, 2010).
2.2 Extending the ‘toolkit’ for FIM Information mining is a critical task in FIM. The nature of multi-agency working means professionals
must strive toward a commonly recognised information picture (CRIP) before coming to a collective
decision. Web-based portals have been effectively used to centralise incoming, up-to-date information,
as well as acting as a store house for relevant documents. Hazard Manager is one such example and uses
mapping and real-time weather (e.g. links into the Flood Forecasting Centre for extreme weather alerts)
and incident related information, to facilitate CRIP and joint decision making activities between
2 Where vulnerable people are defined as those that are less able to help themselves in the circumstances of an
emergency. This may include the elderly, young children, mobility impaired, minority language speakers etc. (for a full
list please consultant HM Government, 2008) 3 The Flood Risk Regulations 2009 represent the UKs response to the EC Floods Directive 2007.

A GIS-based Flood Risk Assessment Tool:
Supporting Flood Incident Management at the local scale
9
professional partners (http://www.metoffice.gov.uk/publicsector/hazardmanager). This system was
developed by the Met Office and is considered to be a “one-stop information source”.
The National Resilience Extranet (NRE) has similarly sought to establish itself as an information portal to
facilitate multiagency working through shared knowledge, emergency planning and managing real-time
incidents (Cabinet Office, 2010). The main function of the NRE is to serve data sharing (current, archived
and classified documents), but the system also provides an inclusive contact list of all key responders,
updates on good practice, expertise sharing and an open-shared calendar for organising meetings.
Although this system is currently being used by 350 organisations (mainly local authorities: Cabinet
Office, 2010), it has been greeted with mixed responses. During the course of semi-structured interviews
with emergency professionals in this research, it seems the main failing of the NRE was its attempts to
be a ‘one stop’ tool. Rather than offering limitless capabilities, end users felt that the system would have
been effective if it can kept to its original brief as a storehouse of key documents and contacts only. The
implication of this for the flood risk assessment tool developed in this research, is that it must have a
clear focus; indeed supporting a small number of tasks, but supporting the well, is better than trying to
everything to everyone and hence nothing to no one.
Computer technology is a crucial tool for simulating emergency events and facilitating joined-up
working. A number of tools exist for training and exercising purposes. The HYDRA-MINERVA system used
by Fire and Rescue provide a number of scenarios within fire rescue, to chemical incidents and heavy
snowfall events. Each scenario runs in real-time, feeding-in information from multiple sources, allowing
for fast and slow decision making and tactical and strategic levels of command. Decisions are logged and
audited for the purpose of debriefing – flooding is not currently included in the portfolio of emergency
events simulated in this tool (http://www.hydrafire.org/).
Simulating real-life events is an important part of building-up professional skills and expertise, and
trialling new tools to support decision making. FloodViewer© for instance, was trailed in the UK EA-lead,
national Exercise Watermark 2011. This tool enables end users to view flood information in a dynamic
way, employing functions of zoom, pan and animation, whilst visualising the spatial patterning of
flooding onto vulnerable hot spots (e.g. key roads, hospitals etc.). Users of this tool can select a specific
return period for flooding or view a given water level using a slider control bar, and visualise the corresponding
flood extent. Crucially this tool is designed outside off expensively-licensed products (such as ArcGIS) and
is viewed universally (e.g. online) by multiple decision making partners (Halcrow, 2011).
There has been a growth in the development of commercial products designed to support decision
making in flood risk management. UK consultancies such as Gaist Ltd have sought specialism in
emergency management with products such as Inca (Incident command administrator) and a multi-
agency collaborative tool, ‘Gaist emergency’ (Gaist, 2010). This latter system is specifically designed to
facilitate multi-agency working with universal display, an interactive and user-friendly interface and
provides access to a virtual earth server to access Bing maps. This system is compatible with INCA
(Incident command administrator) tailored to meet the demands of the Fire and Rescue Service and
enables on-the-ground risk assessments (‘tough books’) to be electronically sent and logged into the
INCA interface and used to inform the incident commander and control room.
Socio-demographic data has been exploited for commercial products such as MOSAIC, developed by
Experian Ltd. Details regarding the demographics, lifestyles and behaviour of all individuals and
households in the UK are centralised into this one tool and derived from the census, media and market
research. The tool is essentially based on a classification criterion which identifies 146 person types
and groups these into 69 categories based on lifestyle types; these categories are further reduced into
15 main socio-economic groups (according to MOSAIC Public Sector; Experian 2009). This 3-tier
classification system means that the MOSAIC tool can be deployed at the individual, household or
postcode scale to suit the decision maker’s needs. While this tool was originally designed to support
commercial decision making, it has application potential for emergency management. For instance,
MOSAIC is employed by the Fire and Rescue Service for targeting risk communication and fire safety
campaigns. Other products from this line such as MOSAIC Daytime have application potential for
emergencies. This particular tool records the shift in population patterns from day to evening and is

A GIS-based Flood Risk Assessment Tool:
Supporting Flood Incident Management at the local scale
10
currently deployed for targeting home selling; in an emergency situation this information could prove
highly useful for prioritising response into certain areas.
The tool developed within this research aimed to explore how end-users interacted with an interactive
feature of vulnerability assessment; indeed, when given the choice, do professionals value a
vulnerability ‘product’ (e.g. the social flood vulnerability index), over the option to select and weight
indicators and essentially build their own vulnerability index, adjusted to their professional needs.
Given the partnership with the hazard in governing overall risk, this tool also sought to gauge how
professionals rate different approaches to hazard assessment and the calculation of risk at the local
scale. For example, how might end-users negotiate the balance between hazard and vulnerability
when given an option to weight them within the risk equation? The findings from semi-structured
interviews and questionnaires with professional stakeholders were used to inform some practical
recommendations for real-life application (see section 6).
2.3 A note on visualisation There is an ever-expanding reservoir of accessible, georeferenced data, which has arguably
corresponded with changing scientific and societal demands and applications of these data
(Maceachren, 1998). Visualisation techniques have received considerable attention over the past
twenty years with developments in technology opening new windows into previously inconceivable
approaches. The development of Geographic Information Systems (GIS) for instance, has made
possible the handling (from storing, visualising and analysing) of spatially-referenced data in interactive
ways.
Mapping has become the keystone for flood risk assessment and communication. Presentation is a
crucial element to successful map-based communication (i.e. does the user infer the map information
in the way it was intended?). Visualisation decisions have been shown to exert a profound influence on
the effectiveness of information transfer and the receptiveness of the end-user to this information
(Alphen et al., 2009). Alphen et al. (2009) note the use of colour and the role of social conditioning in
map interpretation; for instance, blue is widely recognised as a sign for water and a scale of red,
orange, green as a scaling for danger. While computer technology has increasingly enabled the
rendering of ‘realistic 3D worlds’ (Kot et al., 2005), it has been stressed that the power of visualisation
rests with its ability to abstract reality (Muehrcke, 1990; cited in DiBiase et al., 1992); for instance
maps can be adjusted to varying scales, employ numerous symbols etc. This enables the viewer to
more readily identify patterns in the data; ‘distinguishing pattern from noise’ (Maceachren and Ganter,
1990).
While traditional, top-down approaches to map making have developed map products for end-user
delivery, there is now a shifting agenda towards tailoring the final product to the end-user themselves.
Visualisation is defined within the Cartography literature under two paradigms; a communication
model and a visualisation model. The first perspective for communication has dominated the field of
Cartography (and other disciplines utilising cartographic principals) and emphasises the value of maps
as communicating ‘what we know’ (Maceachren and Ganter, 1990). Conversely the visualisation
perspective on map function emphasises ‘what is yet unknown’; that is to say, the map is a stimulant
or facilitator for new ways of thinking and in this light has profound implications for exciting scientific
creativity (ibid). The work of Maceachren and colleagues in particular has emphasised the importance
of the visualisation perspective and the associated potential for visualisation techniques in prompting
new ideas and modes of thinking. Visualisation should therefore be viewed as a facilitator, rather than
the end product in itself.
Viewpoints from Cartography have been offered and have proposed a shift from seeking ‘optimal
design’ and visual communication to facilitating visual thinking (DiBiase et al., 1992). Flood science has
thus far focussed on the enhancement of communication i.e. to transfer ‘what we know’, but how
might visualisations prompt new thinking in users? Will this new generation of visualisations and
decision support instruments change the data requirements of end-users in the long-term? McCarthy
et al., (2007) show that user-interaction with new visualisation tools and with tools designers can alter

A GIS-based Flood Risk Assessment Tool:
Supporting Flood Incident Management at the local scale
11
initial assumptions and facilitate the want for new techniques; and most importantly the self-efficacy
of the end-user to utilise new techniques. The expressed desire for ‘simplicity’ voiced by end-users
arguably stems from an uneasiness with new and seemingly complicated tools. For new tools to be
fully integrated and not viewed as ‘the shiny new toy’ (only to be neglected soon after) it is crucial that
any new visualisation tool presented is user-friendly and self-explanatory. Engaging with target end-
users in the design process is a necessary step towards end-user satisfaction. Morss et al. (2005) argue
that the traditional, scientific view of the ‘end-user’ as the passive receiver of knowledge should be
replaced by the inclusion of the ‘end user’, enabling them to become active members of the research
process. This strategy is deemed beneficiary to both science and professional stakeholder groups and
can facilitate co-knowledge production, a sense of shared ownership and encourage the uptake of new
ideas and tools in practice. Visualisation tools in their own right offer the potential for user
engagement with the data and can be considered as useful aids to the decision-making process.
3 Research design
This research is centred on the development of a GIS-based flood risk assessment tool (“the tool”). The
methodological stages of this research are illustrated in Figure 1. Although the tool was not designed for
real-life application, Figure 1 recognises the need for multiple iterations between tool developer and end-
users to tailor the tool to professional cultures and requirements. This report reflects on the first stage of
iteration only and discusses the tool’s construction and evaluation with a select sample of emergency
professionals.
STAGE 1 sought to draw upon existing scientific knowledge to infer what should be included, whilst
equally framing the possibilities for what ‘could’ be included in such a tool. In this research, the scientific
input derived from the interdisciplinary contributions from physical and social sciences to represent the
hazard and vulnerability dimensions of the risk equation respectively. Available to this study were
relatively small-scale flood inundation visualisations, produced as outputs from previous 1D-2D
inundation modelling developed under the auspices of the Flood Risk Management Consortium’s research
(FRMRC Phase1). These model outputs were developed for two UK locations; in Keighley, near Bradford in
West Yorkshire (Djordjević et al., 2005) and Cowes on the Isle of Wight (IOW), in Hampshire (Allitt et al.,
2009). The original objective of this research was to utilise these existing 1D-2D model outputs for pluvial
flooding and address the extent to which vulnerability data can be successfully ‘bolted-on’ to give a
calculation of risk at the local scale. A key research question regards the utility of social vulnerability
assessment and whether more interactive engagement with vulnerability data could facilitate its usage
within FIM decision making. In this first stage, expert consultations and literature review helped inform
the scope for the vulnerability interface of the tool (Wilson, 2008).
STAGE 2 involved the preliminary engagement with emergency professionals. Semi-structured interviews
with the Category One Responders chosen for the study were administered to elicit professional
viewpoints on flood risk assessment, how it is currently assessed and how a decision support tool might
aid current practice. These interviews also helped contextualise the roles and responsibilities of
emergency professionals. A total of 18 professionals participated in preliminary interviews, representing
the Police, Fire and Rescue, Ambulance service, Environment Agency, Emergency Planning (county and
district council), Health Protection Agency and a utility company. Interviews were complemented by
structured questionnaires, which asked respondents to rate the design suggestions proposed by the
scientists (concerning tool functionality and presentation).
STAGE 3 concerned the tool’s construction, which was designed to be exploratory in this first stage (i.e.
not a final product). The tool was written in Visual Basic for ESRI and constructed as an interface to the
commercial GIS application, ESRI’s ArcMap (9.3). Datasets are launched from a personal geodatabase and
automatically situated within the tool’s interfaces for hazard, vulnerability and risk assessment. This ‘GIS-
interface’ approach, aimed to facilitate user-friendliness, whilst maintaining the GIS interactive
capabilities (e.g. zoom, pan). As the user’s interacts with this interface, both the global map in ArcMap
and a corresponding ‘summary window’ on the interface itself are updated.

A GIS-based Flood Risk Assessment Tool:
Supporting Flood Incident Management at the local scale
12
STAGE 4 is essentially the ‘tailoring stage’. Firstly, the completed tool was demonstrated to a sample of
Category One Responders (n=8) and each interface and feature was explained. Responders were also
given the opportunity to interact with certain features. Throughout this process, responders were invited
to give their views on what worked well and whether there was application potential for supporting FIM
decision making; this was essentially an open-interview approach. Finally, following this extensive
interaction and discussion phase, professionals completed a short questionnaire to rate each feature in
turn. All interviews were transcribed and analysed in the qualitative data software NVivo using thematic
analysis (via open and selective coding: e.g. Fereday and Muir-Cochrane, 2006), to locate key themes and
identify different and convergent opinions expressed across stakeholder groups. Professional feedback
from this has been used to steer a number of more practical recommendations for future tool-developers
(section 6).
Figure 1: Summary of research stages

A GIS-based Flood Risk Assessment Tool:
Supporting Flood Incident Management at the local scale
13
3.1 Study sites
This research focuses on two contrasting UK locations in Keighley, near Bradford in West Yorkshire and
Cowes on the Isle of Wight (IOW), in Hampshire. Both locations are exposed to pluvial flooding, resulting
from the interaction between heavy rainfall and failings in managed drainage networks. Pluvial flood
event matrices have been modelled for both areas within the research of the Flood Risk Management
Research Consortium (FRMRC), thus providing the ‘hazard’ details required for a flood risk assessment
tool. This section describes the geographical setting of these case studies, the flood histories and
respective modelling work simulating these.
Moreover, there are some interesting socio-economic differences which make Keighley and Cowes an
interesting comparison. This section addresses these differences drawn from the Index and Multiple
Deprivation (IMD) and less clearly from the Social Flood Vulnerability Index (SFVI). These differences could
prove important to understanding how vulnerability is conceptualised by professionals responsible for
these areas.
3.1.1 Keighley, West Yorkshire
The Stockbridge area of Keighley is situated at a confluence between the River Aire and the River Worth
(Figure 1). Significant fluvial flooding in October 2000 caused damage to 370 residential properties
(Wilkinson, 2007) and represented the worst scale of flooding witnessed in the area for fifty years. While
those registered at the time to receive the EA flood warning had one hour to respond, the event occurred
at 5am local time and was therefore a ‘surprise event’. It took 6-12 months for people to be able to return
to their properties. Post event reviews revealed insurance to be a significant issue, with nearly half of the
affected population lacking either contents of buildings insurance (Wilkinson, 2007). Furthermore,
localised storm events over Keighley have since caused localised flooding in July and August 2003
(CBMDC, 2005).
These events sparked an independent enquiry into water management within the Bradford district which
highlighted the importance of joined-up working, information sharing and need for community
engagement to engender an awareness of ownership of responsibilities for dealing with risk and
mitigations. The Flooding Local Action Plan (FLAP) emerged from this enquiry, which sought to promote
community involvement in flood issues (Cashman, 2009); funding cuts has since meant that the ten FLAPs
set up now cease to exist. However, Bradford city council remains committed to gauging its population’s
awareness of flood risk and suggestions for flood risk management (e.g. current Bradford District online
questionnaire as part of the EU project FloodResilienCities www.bradofrd.gov.uk). Over three thousand
properties are at flood risk within Bradford, with an estimated value of £247m; this figure accounts for
fluvial flood risk only and does not include surface water flooding.
Flood defences have been installed in response to the significant 2000 flood in Stockbridge, including a
levee and reinforcements to the river channel; these flood defences are designed to protect Stockbridge
against the 100 year event (CBMDC, 2005). However, the area remains susceptible to surface water
flooding which has been identified as an increasing problem (EA, 2008). As part of the government’s
Making Space for Water (Defra, 2005a), the River Aire in Bradford and Leeds was one of 15 projects
informing the Integrated Urban Drainage Programme (CBMDC et al., 2008). Hydraulic modelling
conducted in this research suggested a potential rise in surface water flooding by 200% by 2085, resulting
from patterns of climate change and urbanisation.

A GIS-based Flood Risk Assessment Tool:
Supporting Flood Incident Management at the local scale
14
Figure 1: Flood hazard map of Keighley, West Yorkshire (Environment Agency Flood Map)
Flood modelling is integrated in this research and utilised to equate the ‘Hazard’ component of the flood
risk assessment tool. 1D-2D modelling in Stockbridge simulates the interaction between urban sewer
systems and overland flow, based on the SIPSON-UIM model (Chen et al., 2009: Djordjević et al.,2005).
Whereas SIPSON is a 1D hydraulic model which records the flow routing in the sewer systems and rainfall-
runoff hydrographs, the 2D UIM model stimulates ground surface inundation. These models are coupled
via discharge through manholes to reflect drainage and surcharge flows. The spatial distribution of
flooding has been modelled for various combinations of rainfall-runoff intensity and duration (pluvial and
fluvial flood matrices), modelled with and without the presence of flood defences and for scenarios of
levee breach and overbanking (for more details on SIPSON-UIM the reader is referred to Chen et al.,
2009).
Several scenarios were considered suitable for inclusion in the tool. Firstly, a range of scenarios with
depth and depth-velocity details were integrated. These simulate pluvial flood events and are modelled
for a series of return period (2 yr, 5 yr, 10 yr, 20 yr, 50 yr and 100 yr) and storm duration (15 min, 30 min
and 60 min). Ultimately each scenario is modelled for 12 hours and therefore illustrates the progression of
flood water, its flow pathways, ponding and ultimate recession. Secondly, a scenario for a fluvial flood
event was used and simulates a breach and overbanking scenario on the levee system. The breached
scenario was calculated by removing the levee system from the model; water overflows when it surpasses
the grid elevation of the surrounding cells. In the overbanking scenario, water overflows when the flood
stage in the channel exceeds the crest elevation of the levee (100 yr flood + 10 cm). This model runs for 10
hours. Thirdly, a scenario for fluvial-pluvial combined flooding is included, based on the 100 year event,
for a 60 minute storm duration (and again, is run for 10 hours). This model also includes scenarios for
breach and overbanking.
There are a number of underlying assumptions which underwrite the uncertainty of this flood model.
Firstly, the rainfall input is assumed to be spatially and temporally uniform. This is a common assumption
made in pluvial flood modelling which is naturally highly variable in space and time and very difficult to
predict. Secondly, the propagation of flooding (flow routing, pooling) is dominated by the underlying
elevation model and is a potential source of error. In this instance, the elevation surface is based on OS
Mastermap and high resolution LiDAR and thus minimises this source of uncertainty. Finally, the
governing equations of any modelling tool can amplify uncertainty. The SIPSON-UIM model has been
benchmarked with the Environment Agency’s 2D model and trialled in eight different types of case
studies; one can be confident at least that the model is producing similar results. Communicating

A GIS-based Flood Risk Assessment Tool:
Supporting Flood Incident Management at the local scale
15
uncertainty in flood science is a contentious issue and current debates surround the responsibility and
ownership of these data (Faulkner et al., 2007). The tool presents these sources of uncertainties as a
series of bullet points in a pop-up window. Arguably there is a need to consider graphical and cartographic
means of visualising this and a case for avoiding the ‘prescription note’ or ‘health warning’ of uncertainty
(Faulkner, pers coms). The cascade of uncertainty in flood modelling means that there are even
uncertainties in uncertainty communication and while professionals were asked whether the uncertainty
information was something they used, it was not a pivotal research question addressed in the tool.
3.1.2 Cowes, Isle of Wight, Hampshire
Cowes is situated at the mouth of the Medina River as it drains into the sea off the Isle of Wight (IOW). In
theory the Island is an extended arm of Hampshire on the mainland, but in practise its isolated nature
means that in terms of emergency management it often relies upon its own resources. Flooding is a
recurring issue Island-wide. In Cowes, the main source of flooding is tidal and the tourist centre of the
town, the High street (Figure 2), is periodically inundated with more significant flood events occurring in
October 2004 and July, 2006.
Figure 2: Flood hazard map of Keighley, West Yorkshire (Environment Agency website)
As with Keighley, the complex nature of pluvial flooding has been modelled for the West Cowes
catchment. Allit et al (2009) have used Infoworks CS 2D model, in conjunction with a 1D sewer model. The
assimilation of 1D-2D modelling aims to capture the dynamics of minor and major systems respectively,
between the underground sewer network and overland flow pathways. For Cowes, the following model
outputs have been supplied to this research through the Flood Risk Management Research Consortium
(FRMRC phase 1). Firstly, the tool integrates a number of design storms for the 2, 5, 10, 20 and 50 year
return periods, modelled at 30, 60 and 90 minutes. These files include the maximum depth and hazard
values obtained in each model run; where the hazard has been calculated according to the recent Defra
guidelines including debris factors (HR Wallingford et al., 2006). Secondly, a 100 year storm event was
used to constitute the animation feature of the tool, based on model outputs at one minute time-steps
and simulating an event over 120 minutes. These results were based on the SIPSON-UIM model (run for
Keighley, by Exeter University); these two models are compared in Allitt et al (2009).

A GIS-based Flood Risk Assessment Tool:
Supporting Flood Incident Management at the local scale
16
The resulting simulations correlate strongly with known sites of flooding and flood records from actual
rainfall events (Allitt et al., 2009). Field observations have also been integrated into the model to capture
the dynamics between surface features (e.g. walled entrances to properties, alleyways) that can divert or
constrain flow pathways. This model also captures the pluvial runoff within the catchment, based off the
surface topography; assuming no infiltration, initial losses or depression storage (Allitt et al., 2009). The
results presented illustrate the model-run with the inclusion of sewers and buildings.
3.1.3 Contrasting Keighley and Cowes
Both towns have a common flood driver in the form of pluvial flooding, which is used within the
respective tools for these locations. It was decided to utilise earlier research developed within FRMRC
Phase 1 and to use these two socially-contrasting locations to explore whether this exerts any effect upon
professionals’ perspectives of vulnerability, or indeed upon the residents in these respective areas.
Social vulnerability is currently recorded within Catchment Flood Management Plans (CFMP) according to
the Index of Multiple Deprivation (CLG, 2008). The IMD calculates a rank of England-wide Lower Super
Output Areas (LSOA), an aggregation of ca. 1000 properties. A rank of 1 indicates the highest deprivation
and 32,482 indicates the lowest; these are based on the aggregation of seven domain indices, including
income, employment, health and disability, education skills and training, barriers to housing and services,
living environment and crime. Keighley displays a wide range in IMD ranks, from a minimum rank of 199
(high deprivation) to a relatively high rank 29,061 (low deprivation), with an average rank of 9296. Cowes
by comparison has an average rank of 17,917 and is a considerably less deprived area than Keighley
(Graph 1).
Graph 1: The Index of Multiple Deprivation for Keighley and Cowes; Descriptive statistics (based IMD,
2007: CLG, 2008)
The predecessor to the IMD was the Social Flood Vulnerability Index (SFVI, Tapsell et al., 2002). In terms of
recorded social vulnerability, both locations have an average SFVI score of 3 i.e. a national average
category. There are noticeably variations between the two locations and the range of SFVI categories
(Table 2), as Keighley displays a wider range of SFVI categories (from low to very high vulnerability),
compared to Cowes which consistently records an SFVI category of 3 or 4 (from average to high
vulnerability). It was originally hypothesised that Cowes and Keighley would provide to socially-
contrasting areas for comparison: For instance, Keighley is regarded as a diverse, multi-ethnic setting,
with 10% of the population of Asian ethnicity (predominantly Pakistani, based on 2001 census). In terms
of the Social Flood Vulnerability Index (SFVI) however, these differences are masked within this
composite, additive model. Each indicator is treated with equal importance in terms of its influence upon
vulnerability (explained further in section 3.3.2). Graph 2 illustrates the break-down of the SFVI and
presents the average percentage of each indicator within Keighley and Cowes. Lone parent households

A GIS-based Flood Risk Assessment Tool:
Supporting Flood Incident Management at the local scale
17
and non-car ownership dominate vulnerability within Keighley; whereas Cowes is dominated by non-car
ownership, non-home ownership and illness indicators.
Table 2: Observations from the SFVI categories in Stockbridge, Keighley and Cowes, IOW (when SFVI is a relative
measure of vulnerability for England and Wales, based on the original dataset from Tapsell et al., 2002)
SFVI statistics
Stockbridge, Keighley Cowes, IOW
Mean
3.17 3.55
Minimum
2 3
Maximum
5 4
Graph 2: The break-down of the SFVI indicators within Keighley and Cowes, based on average percentages recorded
in the 2001 census
The SFVI methodology represents a ‘classical’ approach to vulnerability assessment, based on
assumptions of demographic indicators, all equally as important in governing vulnerability. This research is
interested in adapting this approach and investigating the ways in which it might be adjusted and made
malleable to suit the varied needs of Category One Responders (as identified under the Civil Contingencies
Act 2004). Aside from the tool, fieldwork was conducted in Keighley, using questionnaire surveys to
appreciate the perception of vulnerability amongst those ‘objectively’ labelled as being vulnerable; i.e. is
there a resonance between the SFVI classification system and householder declared vulnerability?
3.2 Preliminary interviews: The end users “wish list” In both case study locations, a sample of Category One and Two responders were interviewed at the
preliminary stage of enquiry to ascertain current views on vulnerability and its application in decision
making. Furthermore respondents were asked to rate a number of initial design suggestions for the tool
and disclose their opinions on the value of integrating hazard and vulnerability data at the local scale.

A GIS-based Flood Risk Assessment Tool:
Supporting Flood Incident Management at the local scale
18
Although all Category One Responders have a statutory requirement to communicate and integrate their
response, the emphasis on responding agencies shifts throughout the course of the emergency
management cycle; from preparation, response and recovery (Figure 3). It is important to remain mindful
of this when interpreting their responses from the semi-structured interviews. Each interview has been
transcribed and analysed in the qualitative data analysis software, NVivo.
Figure 3: Locating the principal roles of Category One Responders within the emergency management cycle
3.2.1 Findings There was a wide agreement across responders as to what constitutes vulnerability and a high level of
awareness regarding its complexities. For those particularly concerned with the ground-response (e.g. Fire
and Rescue, Police and Ambulance), risk to life is at the forefront of decision making.
Vulnerability was considered by some to be an all-encompassing term; from people’s socio-demographic
characteristics, people’s attitudes and awareness towards flooding, human behaviour, to an area’s
infrastructure etc. From the professional’s interviews, this was regarded as a potential limitation; “ It’s
such an umbrella terms….It’s so broad so as to be meaningless” (Fire and Rescue, West Yorkshire).
However, whilst acknowledging the highly variable nature of vulnerability, given their professional focus,
vulnerability is defined as any characteristic which will limit a person’s ability to save themselves; most
notably, people suffering with a limiting long-term illness or disability. The elderly population is also a
recurring indicator, based on the assumption that it correlates highly with illness and disability
perspective
A GIS-based Flood Risk Assessment Tool:
Supporting Flood Incident Management at the local scale
19
While respondent’s cited a number of indicators and discussed the value of the common indicators cited
in the literature, many emphasised the grey nature of these and observed how an indicator can both
indicate both, high or low vulnerability.
“Yeah I was looking at the home ownership one and it’s kind of a mix because a lot of the council tenants
get a lot of support from the local council when their properties flood because it’s the council’s duty to
maintained council-owned properties. And then you’ve got the other side of people who own their own
homes and are slightly richer and can afford insurance. But then you’ve got in the middle of that people
who own their own homes but can’t necessarily afford insurance and they go uninsured and they shouldn’t
really in a flood risk band or wherever they live and their kind of in that middle ground, they’re not rich
enough to help themselves but they’re not in a council owned property so the council can do very little to
support them.” (Environment Agency, West Yorkshire)
Furthermore some responders challenged the assumptions of vulnerability indicators. While indicators
such as elderly suggest a level of social dependence that is not to say that all elderly people will require
assistance. Prioritising certain social groups when responding to an event, could be at the detriment to
others; “There the people who fall through the gaps and you’ve got this list here, yeah we could target
those but actually it’s the single male in the late 40’s who’s on the disability allowance who spends the day
drinking whisky in the middle of the day. So vulnerability is both about lifestyles, about attitude and our
response I think in the main is to take a very equality and diversity sort of attitude to response (West
Yorkshire Fire and Rescue). This comment from Fire and Rescue is very informative. The literature
suggests that vulnerability assessments are potentially useful for prioritising actions. In the context of
flood response in the UK, this comment from Fire and Rescue implies that this goal may conflict with the
need to offer an equitable service. Targeting certain social groups is instead considered a matter of
prevention; “we probably carry out most of our prevention work with people who you would {276} identify
as being vulnerable in one way or another” (ibid).This perspective suggests that vulnerability may be more
useful from a planning perspective as opposed to informing the operational phase of FIM where it is
informed by incoming 999 calls. Similarly, the IOW council reported that; “The compromise that we came
to was vulnerable is anyone who describes themselves as being vulnerable in response to a situation (680)
because they, the people who are affected by flooding in this case, will be able to know more than any
external label that we put on them.(IOW emergency planning).
From these discussions it can be concluded that the role of vulnerability assessment during the immediate
response phase is limited. Immediate response necessitates accessible and accurate information. While
responders indicated that an overview of an area’s social make-up can do no harm and agreed that it
could play a part in wide-scale flood events, ultimately it is the nature of the hazard which influences
priority setting. Where will it flood first? How bad will the flood be? Second to this, who are the
vulnerable people within these areas? Vulnerability is understood as the location of elderly care homes
and critical patients. Information is passed between organisations such as social services, NHS and PCTs,
and utility companies to locate these people and is not stored centrally by any one organisation due to
data protection (DPA, 2004). While some responders commented on the frustration associated with this
(e.g. Emergency Planning Hampshire), it was widely acknowledge that any database that sought to
centralise critical vulnerabilities (i.e. at the household scale), although a ‘dream tool’, could never function
in reality; indeed given the variable nature of vulnerability how could such a database ever be kept up to
date? Including vulnerability within operational response is a matter of pooling information from a
number of agencies (social services, PCT, utility companies). This is of course supplemented with the 999
calls where households have identified themselves as vulnerable and in need of assistance. During the
other phases of FIM the household scale is considered to be too refined to inform decision making, rather
it is the overview of an area that is required. For instance, demographic profiling is a crucial part of
targeting and tailoring community engagement and flood awareness campaigns, currently being trailed
within the EA’s internal project, FloodWise (EA, Hampshire); for which the proportion of elderly, low-
income families and families with young children are the leading indicators.
Responders were asked to rate a number of design suggestions for the tool, relating to the information
and presentation of the hazard, vulnerability and risk (Graph 3; Table 3).

A GIS-based Flood Risk Assessment Tool:
Supporting Flood Incident Management at the local scale
20
0
2
4
6
8
10
12
1 2 3 4 5 6 7
Nu
mb
er
of
resp
on
de
rs w
ho
ra
ted
th
e
fea
ture
1 t
o 5
Question number (see corresponding Table 3)
Graph 3: Category One Responders feedback on design suggestions for the tool, based on a 1 to 5 rating scale of
usefulness in informing decision making (5 being very useful). This graph presents a count of responders rating each
feature 1 to 5.
Question
Table 3: Professionals were asked to rate initial design suggestions (1 to 7)
1 Ability to select a number of flood scenarios (2yr, 10yr, 20yr, 30yr, 50yr and 100yr return period
flood events)
2 Ability to either run the full duration of the event (up to 720 minutes) (i.e. animation), or to
select a given time (snapshot)
3 Ability to zoom in or out of a given area of interest
4 Ability to obtain summary flood statistics at a point location (e.g. depth and velocity details at a
specific manhole, for a specific event and the range across all events)
5 The option to use an enquiry function, whereby the user can ask a specific question (e.g.
identify all areas flooded to depths greater than … within a …specified time… or specified
event/across all events).
6 The ability to view results within a 3D environment (based on terrestrial LiDAR scanning of the
area)
7 Ability to obtain summary statistics for social vulnerability i.e. at the street level
Any information on the hazard, from the extent of different scenarios, depth and velocity details and
ability to view these at given points in time, rate highly on a scale of usefulness; and could support
decisions regarding the allocation of resources (time, equipment), safety and continuity planning. The
hazard posed to the road network was also cited by the blue light services as crucial for flagging-up issues
of access and planning alternative routes. Visualisation is considered to be a powerful communication
tool; however 3D visualisation (question 6) was considered to be less important for decision making but a
potential tool for communicating with the public. What is also clear from these results is that users value
the ability to switch between spatial scales, from the broad overview down to the local picture to mirror
Rating 5: Highly useful
Rating 4
Rating 3: Neither useful nor not
useful
Rating 2
Rating 1: Not useful

A GIS-based Flood Risk Assessment Tool:
Supporting Flood Incident Management at the local scale
21
the nature of a flood event which might occur very locally only, or may become a region-wide problem.
Responders also highly rated the ability to query vast quantities of data very quickly, supporting the rapid
pace of immediate response.
Question 7 asked responders whether it would be useful to view vulnerability at the local scale. Graph 3
illustrates the mixed response to this. Presenting data obtained at the household scale would be highly
impractical, not only in terms of the labour intensive nature of data collection but also in actually using
these data which could change very rapidly. Furthermore, there are issues surrounding data protection as
previously discussed. The semi-structured interviews queried responders about the use of indices, such as
the Social Flood Vulnerability Index (SFVI, Tapsell et al., 2002) and the value of plotting relative
vulnerability across a district, town etc. Responders commented that they would want to know how the
score had been constructed and be able to deconstruct it to view the individual indicators and their
contribution towards vulnerability.
“…this sort of information would be hugely useful but not in the response plan to the flood, but more in an
evacuation plan and a rest centre plan; in the fact that, as is best practice with the CCA and how we’re
meant to plan and respond rather than just chucking ourselves into it, fire fighting and responding…It
would allow us to target our efforts. At the moment we could target efforts if we had the resource to do
so, in the areas that we know are at flood risk, but within that there are areas that perhaps have more
vulnerabilities which would feed into that prioritisation about where you’re going to do first. {talking about
targeting parishes to write their own flood plans: IOW Emergency Planning)
The phase-relevance of vulnerability indicators was also noted. During response the primary concern is
risk to life, therefore indicators such as the elderly, illness and disability are paramount. Vulnerability is
also manifest after a flood event, effecting single parent households for example (EA, West Yorkshire).
This observation suggests that it is inappropriate to apply a universal vulnerability index, stretching across
the phases of a flood event; rather what is required is a flexible system of selecting and weighting
vulnerability indicators according to the context in which they will be applied.
Vulnerability indicators are already held within council databases, such as social services, housing register
etc. These indicators are not specifically flood related. Instead, there is a common view that vulnerability
is generic in nature across hazard events. For example, “our flood management is just part of our overall
crisis management. We do the same things for snow as we do for floods…”(Fire and Rescue, West
Yorkshire). The same indicators that are used to identify social vulnerability for heat waves, snow storms,
swine flu etc., are equally applied to the context of flooding.
The professionals reported that for them vulnerability assessment is a tool for planning response and
longer term mitigation strategies (e.g. tailoring awareness raising campaigns), as opposed to informing
the immediate response phase of FIM. In addition, there is a role for vulnerability assessment in planning
the recovery strategy of an area, in highlighting the nature of support that might be required from local
authorities (IOW Emergency Planning).
The perceived value of integrating vulnerability during response, varied across groups. For the ground
response teams, vulnerability data appeared secondary to the hazard; i.e. responders indicated a
preference towards where not who; with the exception of the ambulance service where this statement is
reversed. Conversely the emergency planning departments of the council display a keen interest in
vulnerability information.
“All we want to know is, where is it going to be wet? That’s all we want to know because that’s all we base
our response on…we can see you know that’s a residential street and we’ll assume there is 2.4 people in
every house and that gives us a rough estimate of we’re going to have to evacuate that many number of
people” (West Yorkshire Police)
“I think we would be very much focused on responding to water, on rescue and water management. The
actual people issues I don’t think would, I think we would work on the advice of other agencies, I don’t
think it is something that we would (716) in first instance be thinking off, we would be reliant upon other
A GIS-based Flood Risk Assessment Tool:
Supporting Flood Incident Management at the local scale
22
agencies and they would be there anyway so why would we need additional information” (West Yorkshire
F&R)
“Obviously knowing information about vulnerability helps us a lot in terms of gearing-up what response
we need. So if we know that there’s an area affected that’s got a lot of people in care homes, that means
that we can save ourselves a whole lot of grief by before someone getting there and realising there’s a
problem, we can say well actually there’s a likelihood that a lot of people will need medical support in our
residential homes, we can make the call before we get there to make sure that we’ve got a building set up
with adequate facilities, people with professional knowledge, whether that’s from NHS, to make sure they
can go in there and care for them”. (IOW, emergency planning)
3.2.2 Some conclusions There are some conclusions that may be made from this initial survey of the target professional group in
relation to their understanding and need for vulnerability assessment. It would seem we can summarise
the view that “there is a time and a place for vulnerability assessment”. It emerged as a consensus that
vulnerability can be more meaningfully used for prevention, planning, recovery and training but has a
limited role during the immediate response phase of a flood incident. Vulnerability is considered to be a
subjective and disputed concept, and ultimately from a response perspective, responders must prioritise
their efforts to where the hazard is and key vulnerable people. This latter information is provided through
data sharing (health services, utility companies and social scare databases) in accordance with the Data
Protection Act 2004. This information is supplemented by those who disclose themselves to be vulnerable
and actively seek assistance (i.e. 999 calls). The rapid pace of response decision making and the need for
accurate information (exact location, up-to-date details on vulnerability) means that the composite, area-
wide index approach for measuring vulnerability would not be used during a response situation. Instead,
responders felt that this type of information could perhaps be more usefully applied to support broad
scale assessments and for painting the social ‘make-up’ of the area. In this light, this form of social
vulnerability assessment could help inform the planning of response.
This tool was designed to facilitate a host of research questions, rather than as an application that could
roll-out in practise; although it is recognised that the feedback from professionals could help inform some
practical recommendations for the future assessment and presentation of hazard, vulnerability and risk
within FIM. ArcGIS was selected as the platform for designing and demonstrating the tool. It is
acknowledged that this software has a number of limitations which would prevent this tool functioning in
real-life situations. Aside from expensive licensing, the desktop application is not suitable for creating and
sharing a ‘common picture’ of the situation as required for multi-agency working and discussed with this
sample of professional stakeholders. The software is also unfamiliar to practitioners and would require
training. The platform for launching a tool of this nature would need to be something that is user-friendly,
not reliant of licensing and open to all potential users. An open source GIS via a secure website would
probably be the closest to meeting these requirements. This would appease the recurring comment that
any successful decision support tool should K.I.S.S.; Keep It Stupid Simple. This In vivo statement (i.e. in
the respondent’s own words) reflects the nature of the professional context, as responders discussed,
flooding is but one part of the day-job and therefore any supporting tool needs to be simple and self-
explanatory to use after potentially long time-gaps. Furthermore it needs to be user friendly and easily
‘fixable’ should it go wrong, without relying upon the tool’s developer.
The requirement for simplicity raises an interesting debate. Is simplicity a requisite of the tool itself, i.e.
synonymous to user-friendly? Or is the desire for simplicity reflective of a desire to disengage with the
complexities of flood science? This might be framed within two simplicity models: (1) simplistic-user-
friendly and (2) simplistic-information tool. The latter is arguably indicative of a greater tension involving
the translation of science to practitioners and the professional context. On the basis of these preliminary
interviews it seems that there is a cross-over between this dualistic meaning of simplicity: It is very
apparent amongst all responders that a simplistic-user-friendly tool is essential, whereas simplistic-
information received mixed views. This is discussed further in section 6 and 7.

A GIS-based Flood Risk Assessment Tool:
Supporting Flood Incident Management at the local scale
23
Multi-agency working means that any system designed to calculate flood risk needs to be flexible to
multiple users, with different data requirements and different emphases on hazard and vulnerability. The
tool’s potential and limitations also need to be apparent. For instance, the IOW council commented that a
tool which seems to portray the ‘answer’ from a series of tick boxes is arguably less informative than a
tool which prompts new thinking.
“… I was concerned that if it would be something that is a bit more scripted, tick a box if (663) we did that,
tick a box of we did this, it would then funnel the mind into being a bit more closed and blinkered, rather
than opening up to the fullest extent of what one’s day job role is, to think outside of the box, because if
they’re thinking that they’ve got a handy tool that does all this for them and seems to be looking right and
giving them the right answers, it’s just too good to be true and they don’t need to think so therefore they
won’t. (IOW emergency planning)
The importance of being able to view the bigger picture was stressed in these interviews. Examples such
as 2007 flooding were used by some responders to demonstrate the complicated nature of decision
making when resources become stretched and priorities need to be set. Therefore, while this tool focuses
on the very local scale of the case study areas it is considered to be an example of a tool that could be
extended to include a number of local ‘hot spot’ flood locations, framed within the district. The
development of the tool, which is described in the following section, is heavily influenced by these views
expressed in the preliminary interviews.
4 A flood risk assessment tool
This section describes the features of the flood risk assessment tool that were developed in response to
the preliminary interviews discussed in the previous section. The tool was approached almost as an ‘eggs
all in one basket’ to see how different end-user react and rate different design features, to inform some
practical recommendations for how such a tool might be more specifically tailored in real-life applications.
The tool itself loads the datasets from a Personal Geodatabase constructed in ArcCatalogue. Rather than
simply allowing layers to be added and removed, this tool enables users to manipulate these layers to suit
their needs and perform calculations on the data to produce vulnerability and risk profiles from a number
of flood scenarios. This interactive nature seeks to engage the end-user to become actively involved in the
assessment process and map production. This moves away from the traditional paradigm of
communicating “what we know” and targeting an ‘information deficit’ model (Lane et al., 2010); to one
that recognises the end-user as an expert in their right and providing the means in which they can
integrate their informed subjectivities from the day-job, with the objectivity of the ‘scientific expert’ that
is inherently built within the tool.
The tool is written in Visual Basic for ESRI and designed with the ESRI application ArcMap where the tool is
launched. This is a commercial product for Geographic Information Systems (GIS). In the preliminary
interviews with professional stakeholders, many reported unfamiliarity with this system or felt that they
‘knew the basics’ but did not feel comfortable using ArcGIS. If this tool was to be used in practise, the
platform from which it is launched would need to be reconsidered. For the purpose of this research it was
considered appropriate but it was consciously decided to minimise the user’s4 interaction with ArcMap as
far as possible. Therefore the tool uses a display window to illustrate what is going on the main screen; if
the user wishes to view the main screen as opposed to this ‘summary window’ then they need only drag
and slide the interface of the tool aside. Further options to zoom in and out on the main screen are
provided on the interface of the tool (Figure 4).
4 Category One Responders are the target user of this tool and the tool has been designed according to the feedback
from preliminary interviews; as such, the terms end-user (or user) and responder are used interchangeably in this
discussion.

A GIS-based Flood Risk Assessment Tool:
Supporting Flood Incident Management at the local scale
24
Figure 4: Screenshot of the upload-page of the tool, with contents page and summary window on the right.
The tool is designed with three key interfaces (i.e. separate pages), isolating hazard and vulnerability and
allowing the user to bring these together in the calculation of risk. Each interface seeks to address a
number of minor research questions. This is summarised in Figure 5.
Ability to zoom in and out on the main screen Ability to clear all layers from the map
Summary window:
Updates as new layers
are added to ArcMap
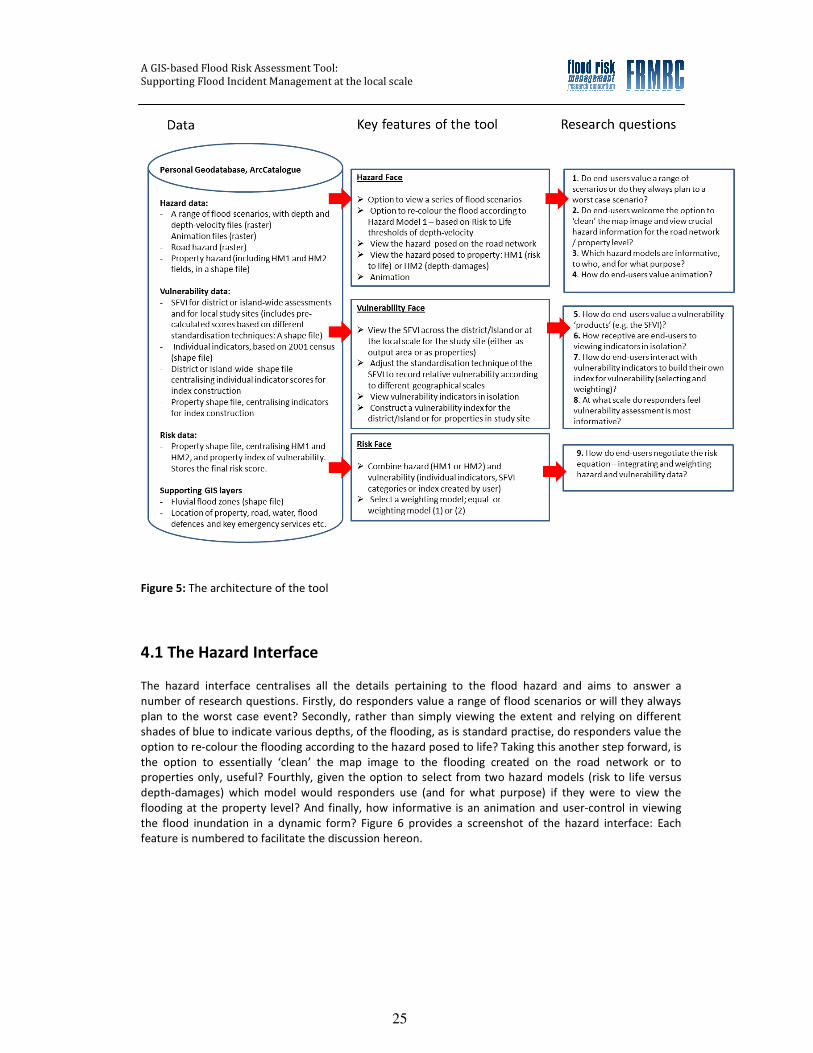
A GIS-based Flood Risk Assessment Tool:
Supporting Flood Incident Management at the local scale
25
Figure 5: The architecture of the tool
4.1 The Hazard Interface
The hazard interface centralises all the details pertaining to the flood hazard and aims to answer a
number of research questions. Firstly, do responders value a range of flood scenarios or will they always
plan to the worst case event? Secondly, rather than simply viewing the extent and relying on different
shades of blue to indicate various depths, of the flooding, as is standard practise, do responders value the
option to re-colour the flooding according to the hazard posed to life? Taking this another step forward, is
the option to essentially ‘clean’ the map image to the flooding created on the road network or to
properties only, useful? Fourthly, given the option to select from two hazard models (risk to life versus
depth-damages) which model would responders use (and for what purpose) if they were to view the
flooding at the property level? And finally, how informative is an animation and user-control in viewing
the flood inundation in a dynamic form? Figure 6 provides a screenshot of the hazard interface: Each
feature is numbered to facilitate the discussion hereon.
A GIS-based Flood Risk Assessment Tool:
Supporting Flood Incident Management at the local scale
26
Figure 6: The Hazard Interface to the GIS-based flood risk assessment tool
[1] In the first instance, the user can select from a flood scenario and view the spatial extent of the flood
(based on the maximum flood value). Scenarios range from high frequency, low impact events to low
frequency, high impact events (i.e. 2 year to 50 year rainfall events respectively). Cowes offers pluvial
flood scenarios only, whereas Keighley has additional scenarios for fluvial flooding (100 year event),
including scenarios for overbanking or breaching the levee system; furthermore, Keighley stimulates
pluvial-fluvial interaction. Preliminary interviews with professionals indicated that the ability to upload
and view a range of flood scenarios was deemed useful and highly useful.
[2] The tool provides the user with the option to reload the flood scenario of their choice, but this time
viewing the model outputs for depth-velocity interaction (rather than merely depth offered in the
previous option). Expert-declared thresholds are provided adjacent to this, from which the user can either
select go and view the flooding when it is re-coloured according to risk to life thresholds; or the user can
decide whether to manipulate these thresholds and adjust the hazard classification according to their
choice. The expert-declared thresholds are automatically entered into the tool and are set to those based
on Risk to Life research (HR Wallingford et al., 2006).The Flood Risk to People methodology calculates
flood hazard ratings on the principles of equation 1.
Flood Hazard Rating = ((v + 0.5) * D) + DF Equation 1 (HR Wallingford et al., 2006)
Where: v = velocity (m/s), D = depth (m), DF = debris factor (0.5)
1
2
4
3
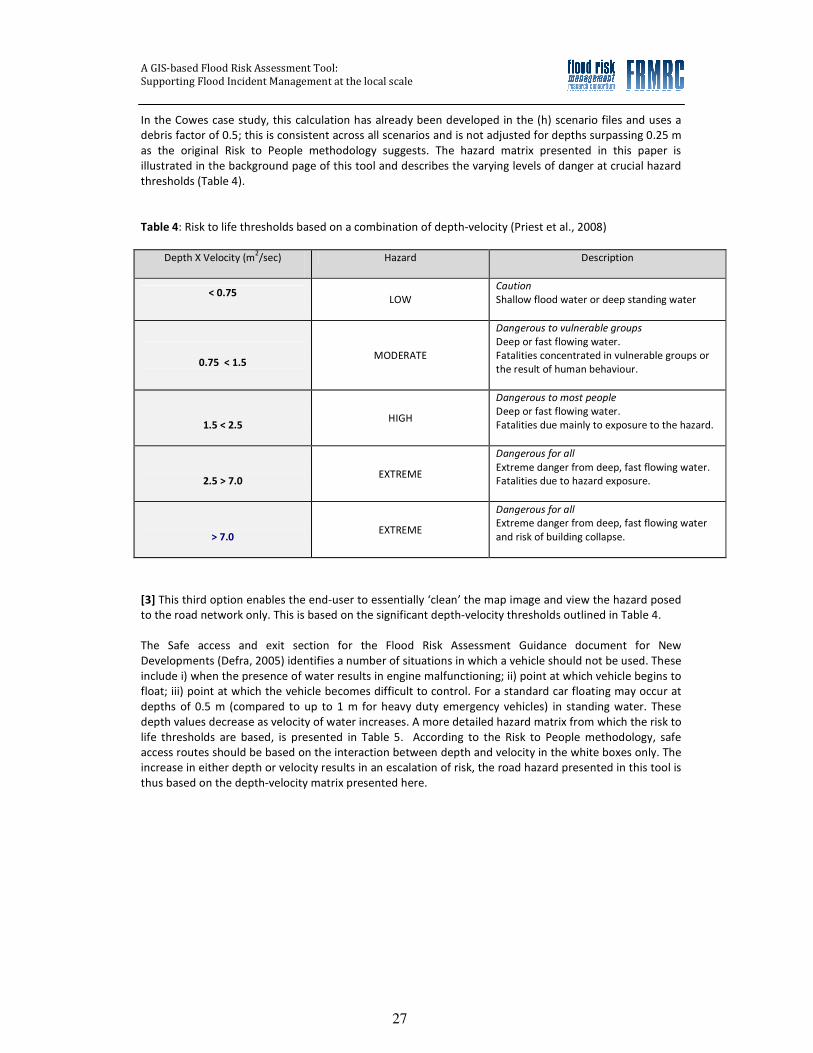
A GIS-based Flood Risk Assessment Tool:
Supporting Flood Incident Management at the local scale
27
In the Cowes case study, this calculation has already been developed in the (h) scenario files and uses a
debris factor of 0.5; this is consistent across all scenarios and is not adjusted for depths surpassing 0.25 m
as the original Risk to People methodology suggests. The hazard matrix presented in this paper is
illustrated in the background page of this tool and describes the varying levels of danger at crucial hazard
thresholds (Table 4).
Table 4: Risk to life thresholds based on a combination of depth-velocity (Priest et al., 2008)
Depth X Velocity (m2/sec)
Hazard Description
< 0.75
LOW
Caution
Shallow flood water or deep standing water
0.75 < 1.5 MODERATE
Dangerous to vulnerable groups
Deep or fast flowing water.
Fatalities concentrated in vulnerable groups or
the result of human behaviour.
1.5 < 2.5 HIGH
Dangerous to most people
Deep or fast flowing water.
Fatalities due mainly to exposure to the hazard.
2.5 > 7.0 EXTREME
Dangerous for all
Extreme danger from deep, fast flowing water.
Fatalities due to hazard exposure.
> 7.0 EXTREME
Dangerous for all
Extreme danger from deep, fast flowing water
and risk of building collapse.
[3] This third option enables the end-user to essentially ‘clean’ the map image and view the hazard posed
to the road network only. This is based on the significant depth-velocity thresholds outlined in Table 4.
The Safe access and exit section for the Flood Risk Assessment Guidance document for New
Developments (Defra, 2005) identifies a number of situations in which a vehicle should not be used. These
include i) when the presence of water results in engine malfunctioning; ii) point at which vehicle begins to
float; iii) point at which the vehicle becomes difficult to control. For a standard car floating may occur at
depths of 0.5 m (compared to up to 1 m for heavy duty emergency vehicles) in standing water. These
depth values decrease as velocity of water increases. A more detailed hazard matrix from which the risk to
life thresholds are based, is presented in Table 5. According to the Risk to People methodology, safe
access routes should be based on the interaction between depth and velocity in the white boxes only. The
increase in either depth or velocity results in an escalation of risk, the road hazard presented in this tool is
thus based on the depth-velocity matrix presented here.

A GIS-based Flood Risk Assessment Tool:
Supporting Flood Incident Management at the local scale
28
Table 5: Depth-velocity matrix based on danger posed to people. Safe access routes identified d-v interaction within
the white boxes (Priest et al., 2008)
This model is essentially a risk-based model, as it considers both the hazard parameters and the
population characteristics (whether demographic or behaviour-related) which might heighten
susceptibility towards harm in its classification of risk. Nonetheless it is included within the hazard section
of the tool. The reason for this is that the vulnerability component of this model is generic and not based
on data from the area; the vulnerability pages introduce these data and encourage the end-user to
explore a number of indicators to explain the make-up of the population first, before uniting hazard and
vulnerability together in the risk page.
[4] The final feature of this page provides the user with the option to view whether a potential hazard
exists at the property level. Again, this option provides another means of cleansing the map, but it also
provides the user with the option to view two different hazard models. Firstly, the user can view the risk
to life model (HM1) as previously discussed. On the basis of the hazard rating calculated (equation 1) this
option will re-colour the properties according to whether there is a potential danger to life. Hazard model
2 (HM2) classifies the hazard according to depth information only. The thresholds in this instance are
based on depth-damage thresholds (Table 6 and Table 7). Each threshold is assigned a score on a 1 to 5,
according to the degree of hazard posed; this scoring system corresponds to the one used for vulnerability
assessment and was required for the final risk calculation.

A GIS-based Flood Risk Assessment Tool:
Supporting Flood Incident Management at the local scale
29
Hazard Model 1: Risk to Life
thresholds, based on a hazard
factor (m3
s-1
)
Hazard
category
< = 0.01
1
0.02 <= 0.75
2
0.76< 1.5 3
1.5 < 2.5 4
< 2.5 5
The depth-based hazard model uses critical thresholds identified in the Multi-coloured Manual (MCM)
developed at the Flood Hazard Research Centre, Middlesex University (FHRC, 2010), for depth-damages
arising for the average residential property, based on 2010 prices and flood duration of less than 12 hours.
According to the MCM there are 15 categories of depth-damages; these were simply divided by 5 to
obtain hazard thresholds (Table 7). Although more detailed information is provided for types and classes
of property, this is not considered in this tool; however If this tool were to become a real life application it
is suggested that the EA’s property database could be used to inform a more detailed classification. The
rationale for applying a depth-damage based model relates to the nature of vulnerability, which is not
only exhibited during the actual event but manifests during the post-event, recovery phase also. Users
engaged in this phase of emergency management may wish to identify properties that are particularly
susceptible towards damage, may need to evacuate or seek support during the aftermath of a flood
event.
In addition to this option to select from two types of hazard model, the user can further decide whether
to base this hazard classification according to the minimum, maximum or average flood statistics
calculated in the flood model. A 20 m buffer from the central point of each property was used to ascertain
flood statistics (Figure 7). As such, the user can select whether they wish to view the minimum, maximum
or average hazard value or depth value; these values have all been pre-classified according to the hazard
threshold and assigned a score of 1 to 5, representing very low hazard to very high hazard respectively.
Hazard Model
2: Depth
thresholds (m)
Damage estimates; based on
total damages calculated for
the average residential
property (max damage per
threshold, £)
Hazard
category
<= 0.05
£8529.98 1
0.06 <= 0.3
£ 11,952.27 2
0.31 <= 1.2
£33,225.92 3
1.21 <= 2.1
£41,882.69 4
> 2.1
£51,438.33 5
Table 7: Hazard categories based on depth-damage estimates
for the average residential property (FHRC, 2010)
Table 6: Hazard categories based on Risk to Life
thresholds (Priest et al., 2008)
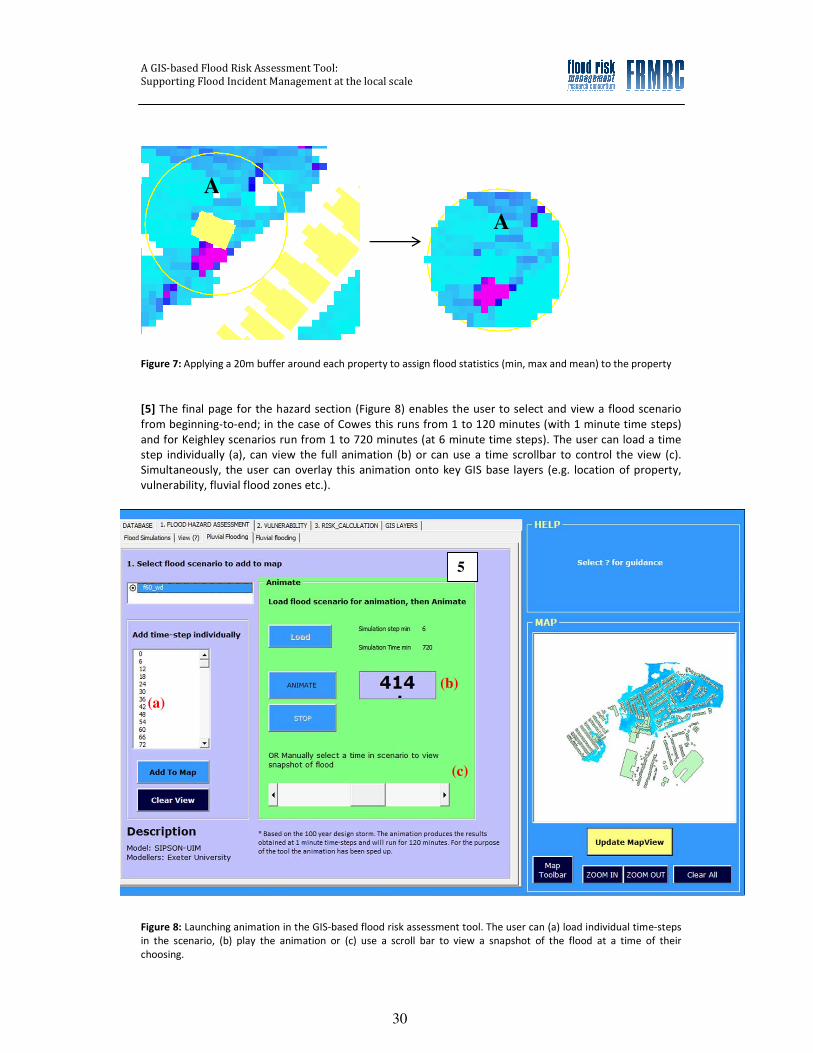
A GIS-based Flood Risk Assessment Tool:
Supporting Flood Incident Management at the local scale
30
Figure 7: Applying a 20m buffer around each property to assign flood statistics (min, max and mean) to the property
[5] The final page for the hazard section (Figure 8) enables the user to select and view a flood scenario
from beginning-to-end; in the case of Cowes this runs from 1 to 120 minutes (with 1 minute time steps)
and for Keighley scenarios run from 1 to 720 minutes (at 6 minute time steps). The user can load a time
step individually (a), can view the full animation (b) or can use a time scrollbar to control the view (c).
Simultaneously, the user can overlay this animation onto key GIS base layers (e.g. location of property,
vulnerability, fluvial flood zones etc.).
Figure 8: Launching animation in the GIS-based flood risk assessment tool. The user can (a) load individual time-steps
in the scenario, (b) play the animation or (c) use a scroll bar to view a snapshot of the flood at a time of their
choosing.
A
A
5
(a)
(b)
(c)

A GIS-based Flood Risk Assessment Tool:
Supporting Flood Incident Management at the local scale
31
4.2 The Vulnerability Interface
Vulnerability is similarly navigated through a series of pages, the main purpose of which is to explore the
end-users views on scale, dynamic indicator selection and the context in which such information might be
applicable. This section of the tool explores a series of questions. Firstly, to what extent do responders
desire only the ‘answer’ i.e. a vulnerability product such as the SFVI (Tapsell et al. 2002) or the Index of
Multiple Deprivation (IMD, 2007)? To what extent can isolated indicators help support decision making?
How do responders regard the usefulness of being able to select, weight and construct their own index of
vulnerability? And finally, at what scale should vulnerability be assessed, and indeed, what activities
within FIM do responders feel vulnerability could support.
The Social Flood Vulnerability Index is employed in the tool to represent a ‘vulnerability product’; that is
to say it has been packaged together by expert academics. The disadvantage of such a product is that it is
based on assumptions that may not be apparent to end users. Perhaps the strongest critique for the SFVI
is the treatment of vulnerability indicators as equal partners in governing risk. The SFVI represents an
aggregated index for social vulnerability, based on an additive model of four variables (Table 8). The
Townsend Index is handled separately in this approach, with its individual components summed
separately and then multiplied by 0.25 before inclusion into the overall SFVI. All variables are firstly
equated as percentages and then transformed (Table 9): Results are then standardised as z-values before
summation. Final scores are classified into five bands; with 1 to 5 representing low to high social
vulnerability respectively. This method was utilised by the UK Environment Agency as a means of
highlighting socially vulnerable areas more sensitive to the adverse impacts generated from flood events,
but has since been replaced by the Index of Multiple Deprivation (discussed below).
Table 8: The Social Flood Vulnerability Index (after Tapsell et al., 2002); with data sources for this research
Variable Measure
Townsend Index for
Deprivation
Including;
Unemployment
Overcrowding
Non-car ownership
Non-home ownership
Unemployed residents 16yrs and over, as a percentage of all economically
active residents
Households with more than one person per room, as a percentage of all
households.
Households with no car as a percentage of all households.
Households not owning their own home as a percentage of all households
75 years + Residents aged 75years and over as a percentage of all residents
Lone parent households Lone parents as a percentage of all residents
Long-term illness Residents suffering from a limiting long-term illness, as a percentage of all
residents

A GIS-based Flood Risk Assessment Tool:
Supporting Flood Incident Management at the local scale
32
Table 9: Transformation methods selected to reduce skewness and kurtosis in the distribution (Tapsell et al., 2002)
Indicator
Transformation method
Lone parents Log natural (x + 1)
Aged 75 + Log natural (x + 1)
Long-term sick Square root
Non-homeowners Square root
Unemployed Log natural (x + 1)
Non-car owners Square root
Overcrowding Square root
Figure 9 presents a snap-shot of the vulnerability interface developed within this research.
Figure 9: The Vulnerability Interface to the GIS-based flood risk assessment tool
[6] The first feature of the vulnerability interface enables users to view the SFVI for the Bradford district or
Island-wide, or focus the SFVI to the census Output Areas (OA) or properties of Stockbridge or Cowes only.
It is noteworthy that although the SFVI can be illustrated at the property level, the score remains based on
the OA (i.e. properties are merely assigned the score of the OA in which they are located); the scaling
challenge for vulnerability assessments is discussed further in section 7. By enabling the user to switch
between the local to district-wide view, this feature targets the preliminary feedback from professionals.
Furthermore, the SFVI scoring system can be adjusted by the end-user to reflect the relative vulnerability
according to different geographical scales. This adjusts the standardisation technique within the original
6

A GIS-based Flood Risk Assessment Tool:
Supporting Flood Incident Management at the local scale
33
method, which produces a score for each variable on the basis of national measures of central tendency
(i.e. z scores are calculated according to the mean and standard deviation of the national dataset). The
original approach thus paints a picture of relative vulnerability across the England and Wales. While
arguably appropriate for broad scale decision making these scores have little relevance to district or local
based decision making. Vulnerability is recorded as a relative measure and therefore the standardisation
technique must reflect the spatial scale at which decisions will be made. This tool provides this flexibility
and enables the end-user to view the original scores standardised to the nation, as well as further scores
based on the region, the district and the local case study area. As figure 10 illustrates, the distribution of
vulnerability alters as a result of the standardisation technique applied. This feature in the tool serves to
demonstrate the relative nature of vulnerability and the importance of scale in informing decision making.
Figure 10: The SFVI for the Isle of Wight when standardised to (A) the Island and (B) England and Wales
[7] Figure 11 presents the next page within the vulnerability interface of the tool. Here the user can view
individual indicators in isolation and their influence on vulnerability across the district or the Island. Each
indicator on this page has been standardised to the district or the island and classified according to the
relative contributions towards vulnerability; scores of 1 represent very low vulnerability, 3 is an average
level and 5 is a very high degree of vulnerability. One of the recommendations from stakeholder
interviews was that this feature would be useful providing that an expert-declared rationale is provided to
explain the ways in which the indicator may contribute towards vulnerability. In response to this, the tool
provides a question mark icon which brings up a pop-up, explanation.
(A) (B)
A GIS-based Flood Risk Assessment Tool:
Supporting Flood Incident Management at the local scale
34
Figure 11: Loading individual vulnerability indicators within the GIS-based flood risk assessment tool.
All indicators are based on 2001 census data. Expert-declared rationales are opened via this icon,
and appear in the top-right hand corner of the screen.
[8] The ‘combine-indicators’ page (Figure 12) enables the user to essentially build their own vulnerability
index. The user is required to rate the indicators listed in terms of the degree of importance (i.e. high,
moderate, low, to no importance). Each indicator has been manipulated on a scale of 0 to 1; the data is
multiplied by 1 in the ‘high’ scenario, multiplied by 0.66 in the moderate scenario and 0.33 in the low
scenario. The “construct index” command combines these indicators together into a simple additive
model. This is then reclassified in the tool to present vulnerability categories (1 to 5) based on the
minimum to maximum spread in the data.
7

A GIS-based Flood Risk Assessment Tool:
Supporting Flood Incident Management at the local scale
35
Figure 12: Building a vulnerability index according to user-declared relevance of each indicator
One of the recurring critiques of the index approach in the literature is the lack of a defensible weighting
scheme which results in the equal treatment of indicators. By enabling the end-user to communicate and
integrate their subjectivities on the weighting of indicators, this removes the responsibility off the
objective-scientist and builds-in an inherent flexibility into the tool to be adapted and adopted by a
number of different end-users who will each consider the matter differently.
4.3 The Risk Interface
Risk is understood as the probability of hazard occurrence (of a given magnitude) and the consequences
of this (economic, environmental, social or otherwise). Risk is therefore widely acknowledged as the result
of the following calculation (Gouldby and Samuels et al., 2005):
Risk = f (hazard, vulnerability)
This final page thus centralises the hazard information (hazard models 1 and 2) and the vulnerability
details at the property level, within the local case study area. This part of the tool examines how
responders negotiate this risk equation and weight the hazard and vulnerability information within this
(Figure 13).
8

A GIS-based Flood Risk Assessment Tool:
Supporting Flood Incident Management at the local scale
36
Figure 13: The Risk Interface of the GIS-based flood risk assessment tool
[9] To address this research question, the tool provides the user with 5 models for aggregating hazard and
vulnerability data. Firstly there is the option to select an equal weighted model, whereby hazard and
vulnerability are treated as equally important in the assessment of risk. A score of 1 for vulnerability and 5
for hazard is regarded as the same as a score of 1 for hazard and 5 for vulnerability. The next two options
present a minor weight on either the hazard or vulnerability (1), the respective scores for the model
selected are firstly multiplied by 2 before multiplied with the other. The final two options extend this and
assign a greater weight (2) to either hazard or vulnerability; in this case, the scores of the chosen model
are multiplied by 4 before being combined. This system of selecting a weighting model (1 or 2) gives the
user the flexibility to decide whether one is slightly more important or significantly more important in
governing risk. This feature of the tool is designed to offer flexibility in the treatment of hazard and
vulnerability which could conceivably change between different phases of emergency management; while
the hazard is paramount during incident response, vulnerability is perhaps more informative for recovery
efforts.
[10] An automatic property count is calculated on the basis of the risk model that the user has selected.
This provides a simple count of all properties which fall within each risk category; the user can select to
view this in terms of people which are crudely measured according to the EA’s assumption of 2.4 people
per property. This result can be stored on a final page for “Notes” so the user can compare between
different combinations of hazard and vulnerability data and weighting criterion.
10
9

A GIS-based Flood Risk Assessment Tool:
Supporting Flood Incident Management at the local scale
37
5 Feedback from Professional Stakeholders
A sample of the professional stakeholders who took part in the preliminary interviews, were re-
interviewed following a demonstration of the tool; these included representatives from Emergency
Planning (Local Authority and County Council), the Environment Agency, Police and Fire & Rescue for
Hampshire and West Yorkshire. Responders were asked to complete a short questionnaire, rating each
design feature of the tool in turn and considering the potential for these to support aspects of FIM. This
section summarises the feedback obtained for the hazard interface (4.1), the vulnerability interface (4.2)
and the risk interface of the tool (4.3), drawing from the questionnaire results and surrounding
discussions.
5.1 The Hazard Interface of the tool The hazard interface of the tool centralises a number of different features for calculating and presenting
flood hazard information, as discussed in section 4.1. This ‘all in’ approach was used to simulate
discussions with emergency responders; while the preliminary interviews sought to ascertain the data
needs of these professionals, the demonstration and visualisation of the tool was used in attempts to
simulate new thinking and encourage responders to consider the potential usefulness of new forms of
data use and presentation, not currently provided in the current ‘tools of the trade’.
Responders were asked to rate each feature of the tool in turn on a scale of usefulness i.e. to what extent
could feature X support professional decision making (Graph 4: Table 10).
Graph 4: Ratings for the Hazard features of the tool; average score and standard deviation, based on responders’
feedback
Question
(corresponding
to Graph)
Table 10: Professionals were asked to rate each feature according to its degree of usefulness in
supporting decision making
1 Option to select a number of flood scenarios (2yr, 10yr, 20yr, 30yr, 50yr and 100yr return period
flood events)
2 Option to select different types of flood events (pluvial, fluvial, combined)
3 Option to view flooding in terms of the hazard posed to life
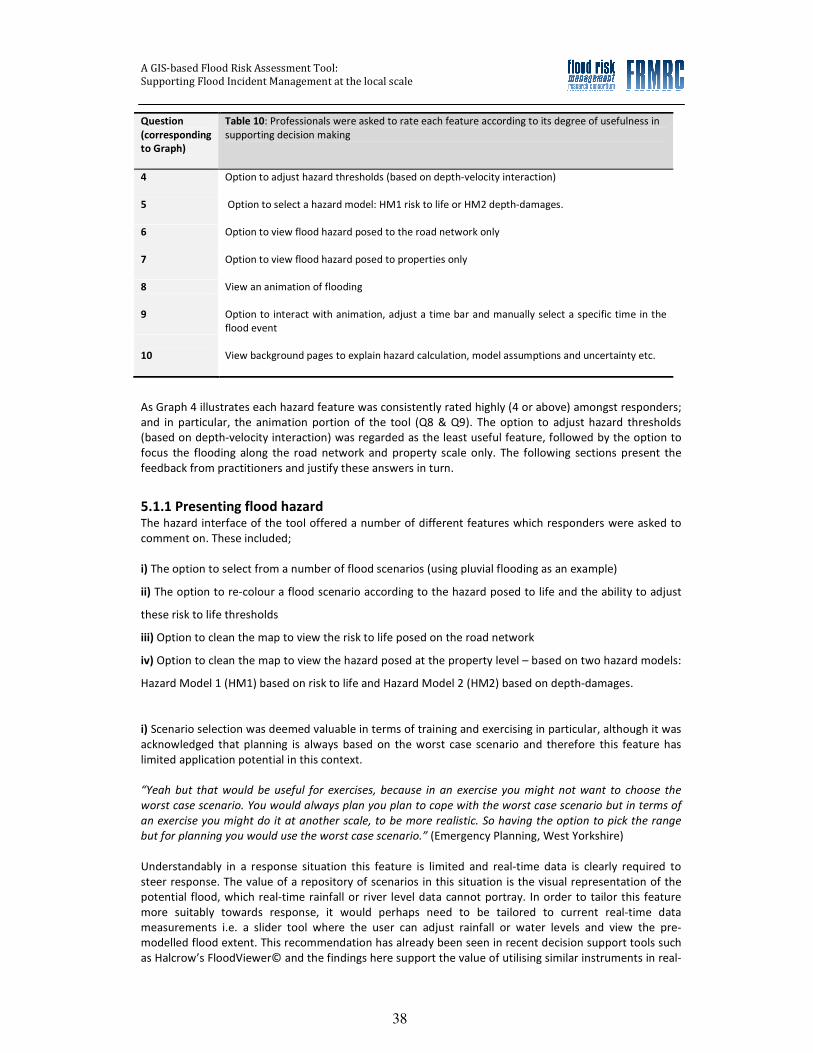
A GIS-based Flood Risk Assessment Tool:
Supporting Flood Incident Management at the local scale
38
Question
(corresponding
to Graph)
Table 10: Professionals were asked to rate each feature according to its degree of usefulness in
supporting decision making
4 Option to adjust hazard thresholds (based on depth-velocity interaction)
5 Option to select a hazard model: HM1 risk to life or HM2 depth-damages.
6 Option to view flood hazard posed to the road network only
7 Option to view flood hazard posed to properties only
8 View an animation of flooding
9 Option to interact with animation, adjust a time bar and manually select a specific time in the
flood event
10
View background pages to explain hazard calculation, model assumptions and uncertainty etc.
As Graph 4 illustrates each hazard feature was consistently rated highly (4 or above) amongst responders;
and in particular, the animation portion of the tool (Q8 & Q9). The option to adjust hazard thresholds
(based on depth-velocity interaction) was regarded as the least useful feature, followed by the option to
focus the flooding along the road network and property scale only. The following sections present the
feedback from practitioners and justify these answers in turn.
5.1.1 Presenting flood hazard The hazard interface of the tool offered a number of different features which responders were asked to
comment on. These included;
i) The option to select from a number of flood scenarios (using pluvial flooding as an example)
ii) The option to re-colour a flood scenario according to the hazard posed to life and the ability to adjust
these risk to life thresholds
iii) Option to clean the map to view the risk to life posed on the road network
iv) Option to clean the map to view the hazard posed at the property level – based on two hazard models:
Hazard Model 1 (HM1) based on risk to life and Hazard Model 2 (HM2) based on depth-damages.
i) Scenario selection was deemed valuable in terms of training and exercising in particular, although it was
acknowledged that planning is always based on the worst case scenario and therefore this feature has
limited application potential in this context.
“Yeah but that would be useful for exercises, because in an exercise you might not want to choose the
worst case scenario. You would always plan you plan to cope with the worst case scenario but in terms of
an exercise you might do it at another scale, to be more realistic. So having the option to pick the range
but for planning you would use the worst case scenario.” (Emergency Planning, West Yorkshire)
Understandably in a response situation this feature is limited and real-time data is clearly required to
steer response. The value of a repository of scenarios in this situation is the visual representation of the
potential flood, which real-time rainfall or river level data cannot portray. In order to tailor this feature
more suitably towards response, it would perhaps need to be tailored to current real-time data
measurements i.e. a slider tool where the user can adjust rainfall or water levels and view the pre-
modelled flood extent. This recommendation has already been seen in recent decision support tools such
as Halcrow’s FloodViewer© and the findings here support the value of utilising similar instruments in real-

A GIS-based Flood Risk Assessment Tool:
Supporting Flood Incident Management at the local scale
39
life applications.
While pluvial flood modelling is the example used in this tool, it is conceivable that it could supplement
scenarios based on other flood types (e.g. fluvial and coastal); responders were therefore asked
(hypothetically) whether this would be an asset to them. Responders involved in Emergency Planning (LA,
CC) and the Environment Agency considered this to be important, particularly for locations of combined
flood drivers and furthermore in gearing-up the response to varied impacts that result from different
types of flooding. On the basis of these interviews, this is considered less useful from the perspective of
blue-light services.
“…we know that the impacts from different types of flooding are very different. For us what we call surface
water flooding has the main impact on the highways. But if we had environment agency, met office or
coastguard warning us about tidal, coastal flooding then we know that’s more about properties. So how
we might react to what we might expect to happen and have to do, would be different to different
flooding.” (Emergency Planning, Hampshire)
“…it’s nice but from the police’s point of view we don’t need to speculate. It is either a flood or it isn’t.
There’s no half way. We have a plan for a flood, regardless of whether it’s a little one, a big one or a
massive one. It’s just how many resources we throw at it that depends on the size. In terms of planning I
wouldn’t say right if it was a 10 year flood I would have this plan, or if it was a 100 year flood I would have
this plan. I’ve just got a plan. But it’s useful, it’s just not essential. It’s nice to have.” (Police, West
Yorkshire)
ii) The tool provides a feature whereby the user can re-colour the flood extent according to the risk posed
to life, based on expert-defined thresholds identified in Risk to Life Modelling (Priest et al., 2008). While
this may have limited value in terms of pluvial flooding which was the example used in this tool,
responders were asked to consider the value of this more broadly in terms of other flood drivers. Some
commented on the value of representing the flood hazard in terms of the potential impact it may cause
and the importance of visualising the hazard according to a RAG rating (Red, Amber and Green), reflecting
high to low hazard posed.
“On a straightforward RAG rating that’s quite good because you can then have that quick judgement on
what you’ve got to do. I don’t think we’d adjust those thresholds [AS agrees], I think we’d take them out.
From my point of view I go with what the experts tell me…” (Emergency Planning, West Yorkshire)
Users of the tool are able to adjust these thresholds of depth-velocity, which automatically re-colours the
resulting map; however this was widely considered to be inappropriate. Indeed, many commented that
they trust the expert view and would be reluctant to manipulate these thresholds, raising issues of liability
and ‘who’s to say we have a right’ (Police, West Yorkshire).
iii) Users have the option to essentially ‘clean’ the map image and view the flooding where it intersects
the road network only. This was widely regarded as a valuable feature in terms of assessing the access for
people and in particular emergency vehicles. From this it was suggested that further tailoring of the tool
should take the interactive feature of adjusting hazard thresholds (described above) and instead place this
with the road network for accessing safe vehicle access; the user could then adjust a specific depth or
depth-velocity to suit the vehicle, or simply select a vehicle from a list box (e.g. Fire appliance, standard
4x4 car) and view a binary Yes/No for safe access on the resulting map. The challenges of using this
information were also mentioned; for instance it does not consider a debris factor and hidden dangers
under the water (Police, West Yorkshire), but nonetheless as a guideline tool for directing resources this
feature was highly rated.
iv) This final feature enables the user to ‘clean’ the map to view the flooding at the property level, based
on the selection of two hazard models; HM1 based on the risk to life thresholds and HM2 based on depth-
damage thresholds, based on the rationale that the first model could help inform response, while the
latter could support recovery efforts. This initial rationale was supported in the feedback from
professional stakeholders.

A GIS-based Flood Risk Assessment Tool:
Supporting Flood Incident Management at the local scale
40
“I think it’s useful, it would be more helpful for recovery planning to be able to look at the impact on
buildings, on properties and depth; rather than, there’s not much that we’re going to be looking at for life
risk, very useful for fire service no doubt and for us to know. So it’s useful to have those two things.”
(Emergency Planning, IOW)
Responders were asked which of these models they would use to visualise the hazard posed to the
property (Table 11). The predominant answer was a selection of both models would be used; however
where responders did select a specific hazard model it seems the decision is divided amongst the police
and emergency planning officers interviewed in this study, as to which model is most appropriate. The
main justification supporting HM2 was that these responders considered flooding in the UK to pose a very
small risk to life and as such, felt that impact is better recorded in terms of depth-damages to properties.
Table 11: Responders’ selection choice for hazard model
Number of responders who selected
this option
Affiliation
Hazard Model 1: Risk to Life 3
EA (Hants), Police (WY), Emergency
Planning (IOW)
Hazard Model 2: Depth-damages 3
Emergency Planning (Hants), Police
(Hants), Emergency Planning (IOW)
Hazard Model 1 and 2
4
Emergency Planning (WY), Fire and
Rescue (WY), Environment Agency
(WY)
It is noteworthy that while some blue-light representatives gave an answer for this question, it was
commented that the resulting map highlighting certain properties is less useful than a map indicating the
flood extent. From this it might be inferred that the property level presentation is useful in partnership
with traditional flood extent, rather than as a standalone product in itself.
“It’s not particularly useful to me to just be able to select property. I just want a map that’s got the
properties on, got the roads on with the flood extent on it.” (Police, West Yorkshire)
Within this final feature, users have an additional option to view the minimum, average or maximum
result obtained in the model (i.e. where HM1 is based on the depth-velocity, and HM2 is based on depth
only). Responders expressed an appreciation of being able to ‘play’ with these options to view best case
to worst case scenarios; but again, while this would be suitable for exercising and training, the worst case
scenario is relied upon for planning purposes.
5.1.2 Animating flood hazard The interactive animation was the best received feature amongst all the professionals interviewed. This
form of dynamic visualisation was regarded as an effective communication tool for illustrating the spatial
patterning of the flood to other partners (e.g. a briefing tool; Emergency Planning, IOW) and painting a
clear picture of when and where for supporting planning and emergency response. Furthermore many
regarded this as a useful tool for exercising and training.
Some limitations of the animation were commented on. For instance, in response where time is of the
essence an animation of what the flood could look like on the basis of a design storm, i.e. not calibrated to
incoming real-time data, may paint an image of accuracy but is in fact bounded by a number of
uncertainties.
“So even if we start with here’s the model, it’s got these uncertainties, when you show an animation you
get caught up in it and you forget this is plus or minus depth, time. I think it’s good because animation
A GIS-based Flood Risk Assessment Tool:
Supporting Flood Incident Management at the local scale
41
engages people better and makes them more interested and anything that makes people more interested
in flood risk is a good thing. But it’s that uncertainty that kind of gets forgotten when you watch a film of
something.” (Environment Agency, Hampshire)
Conversely, it was also noted that any visualisation of the potential flood is in fact a way of reducing the
uncertainty during response and a useful tool for directing resources; reducing it from nothing (Fire &
Rescue, West Yorkshire). It was suggested by some that users within the response context in particular,
might prefer the static maps that can be produced at incremental times (T15 mins, T30 mins etc:
Environment Agency West Yorkshire); or summary tables to provide rapid, digestible information
describing i) flood start, ii) flood end, iii) flood peak, iv) max depth and v) max velocity (EA, Hampshire).
5.1.3 Background information Responders were asked to comment on the usefulness of the background pages provided throughout the
tool. It was commonly accepted that these pages helped support the user in understanding the underlying
data in the resulting map. A recurring theme throughout these interviews, concerned the rarity of flood
events and multiple demands placed on emergency professionals which mean FIM is but one small aspect
of their professional roles; therefore, a tool which is flood-centred needs to provide clear background
pages such as these to not only refresh the users knowledge on the data, but also the capabilities of the
tool itself. The presentation of these pages is important for ensuring these points are clearly and
succinctly communicated and to avoid misunderstandings. Currently, the tool provides a range of
background pages style – detailed descriptions, bullet points, diagrams and illustrations and small pop-up
boxes. Many of the responders interviewed suggested that a successful background page should include a
mix of bullet points and wherever possible a clear diagram or table to explain the information. A further
requirement is to maintain consistency in how these pages appear to the user.
5.1.4 Communicating uncertainty Communicating uncertainty in flood science has been a growing research interest in recent years (e.g.
Faulkner et al., 2011; 2007). In this tool, the underlying uncertainty is accounted for in a simple list of
model assumptions. While some have researched the importance of visualising this uncertainty (e.g. XXX)
and integrating this into decision support tools (Leedal et al., 2010), this was has not been calculated in
the original modelling research utilised in this study, and thus it was not possible to visualise this in this
instance. However, responders were asked their views on how best to represent uncertainty, and if
indeed they considered uncertainty to be an important element to be integrated within decision making.
While some commented that they would like certain or uncertain information to be discussed more (EA,
Hampshire), there were mixed views on how this could achieved. Simple describing the uncertainty and
providing a ‘health warning’ for example (Faulkner pers comms.), could be difficult for users to
understand (EA, Hampshire) and in light of the earlier views on ‘wordy’ background pages, the first
challenge may be in actually getting users to read this information in the first instance. One way forward
may be too simply provide a range of scenarios and summarise the range of depth or depth-velocity
recorded within the model within each scenario (EA, Hampshire). Some responders expressed the risk of
communicating uncertain information, which could otherwise cloud the overall picture and message of
the map.
The thing is it’s always good to have various elements that give a rounded picture of the situation and
uncertainty is one of those elements, but I think if one represented it in graphics and what-not, instead of
just having it as a statement it may end up becoming a larger element than it actually proportionally
needs to be and end up clouding the message you’re trying to get through…(Emergency Planning, IOW)
An important point to take forward from these discussions was that some users did express an interest in
viewing a series of options for communicating certain/uncertainty data and this certainly warrants further
research.

A GIS-based Flood Risk Assessment Tool:
Supporting Flood Incident Management at the local scale
42
5.2 The Vulnerability Interface of the tool Responders were similarly asked to rate the vulnerability features of the tool. Graph 5 illustrates that
these features were consistently rated lower in terms of usefulness in comparison to those demonstrated
within the hazard face of the tool; the average score of 3 shows that responders felt these features were
neither useful nor not useful. That is not to say that those interviewed didn’t have an opinion on these
features and these are discussed in the following sections.
Graph 5: Ratings for the Vulnerability features of the tool; average score and standard deviation, based on
responders’ feedback
Question
(corresponding
to Graph)
Table 12: Professionals were asked to rate each feature according to its degree of usefulness in
supporting decision making
1 Option to view vulnerability at different geographical scales (based on the Social flood
vulnerability index)
2 Option to adjust the social flood vulnerability index to different geographical scales (nation,
region, district, town)
3 Option to view vulnerability indicators at the very local scale
4 Selection of a number of potential indicators of vulnerability
5 An expert-declared explanation accompanying each vulnerability indicator
6 Combine indicators of vulnerability and build your own vulnerability index
5.2.1 Manipulating the Social Flood Vulnerability Index (SFVI) The tool utilises the Social Flood Vulnerability Index (SFVI, after Tapsell et al., 2002) and uses this as an
example of a ‘vulnerability product’ The first feature of this interface enables the user to view the SFVI at
3 spatial scales; district or Island-wide and the town (Keighley or Cowes), mapping the score to census-
defined Output Area (OA; ca. 200 households), and at property scale in Cowes and the Stockbridge area of
Keighley. The user also has the option to adjust the SFVI score and can therefore view relative
vulnerability according to the nation, the region, the district or Island or the town itself. There were mixed
views on this form of assessment in terms of its usefulness in decision making; the reasons for this are

A GIS-based Flood Risk Assessment Tool:
Supporting Flood Incident Management at the local scale
43
discussed in more detail in 4.2.3, but within the context of this method it was considered useful to be able
to adjust the score to suit the spatial scale of decision making.
“I think definitely like you said, on the Island they’d want to know relative to the Island and they don’t
really mind whether it’s relative to whatever’s happening in London. So in that way the national one is the
least important and being able to make it more local is more important.” (EA, Hampshire)
Secondly, users can view potential indicators of vulnerability in isolation, along with an accompanying
rationale based on an academic literature review. The original indicators used in the SFVI (after Tapsell et
al., 2002) were used in this tool as a sample of indicators only and it was recognised that a real-life
application could provide a more extensive list, utilising the census data. Responders commented that this
feature could help facilitate an understanding behind the SFVI scoring system, visualising the ‘make-up’ of
the area (rather than necessarily relying of pre-conceived assumptions: Emergency Planning, IOW) and
furthermore tailoring awareness-raising campaigns (EA, West Yorkshire).
5.2.2 Building your own vulnerability index The final page of the vulnerability interface gives the user the opportunity to construct their own
vulnerability index; using the sample of indicators selected and weighting each in turn according to its
relative importance in the user’s decision making. This represents a move away from the original SFVI
method which treated each indicator as equally important in governing vulnerability, which is a recurring
problem highlighted in the literature and results from the lack of defensible, objective weighting schemes
(Wilson, 2008; Cutter et al., 2003). It is argued here, that the search for objectivity is not a key
requirement; indeed it is the subjectivity of the responder, which is informed by their professional roles
and responsibilities that is required to shape more meaningful assessments of social vulnerability.
Furthermore, it is conceivable that an index for vulnerability (its indicators and weightings) may vary
between different applications in FIM; as such, this approach was considered appropriate for
incorporating this flexibility.
There was a mixed response to this feature (Graph 6). Responders representing emergency planning (EP)
and the Environment Agency all rated this option as highly useful (score 5); with the exception of
emergency planning Hampshire. Scores of 3 and below were recorded by the blue-light services
interviewed as part of this research who explained the limitations of this approach in real-time
operational and tactical response, as well as in supporting strategic decision making: These points are
discussed in more detail in the following section.
Graph 6: Responders’ views on constructing their own vulnerability index

A GIS-based Flood Risk Assessment Tool:
Supporting Flood Incident Management at the local scale
44
“I think that’s really good and just to see as you went down, e.g. well unemployment that’s not really so
important to responding to a flood event, but some of them like elderly really are. So to be able to select
them out a bit I think is really important and I’d almost want to go straight to this page if I was looking at
this information and I wouldn’t look at the other pages.” (EA, Hampshire)
It was also noted that this feature could prove useful when comparing between locations: “..I think that’s
where these drop downs could really come into their own, because you would choose these which are
relevant to Cowes, you know unemployment is not that important; however in Ryde you might have other
variables rated high or less in your drop-downs and therefore comparing Cowes to Ryde in the colours
would then show me more… actually seeing it in the round, comparing place to place “ (Emergency
Planning, IOW). The flexibility in this approach could also prove useful if the scope of the tool were
extended beyond the realms of flooding and integrated further hazard types.
One concerned voiced by Emergency Planning and the Police for Hampshire, was that each responder
may use this tool, set it to different weightings and arrive at different results of vulnerability. In practice,
this feature would probably need to be worked-on within the context of multi-agency working to reach a
consensus on the appropriate indicators and aggregation. This is suggested in section 7 as an area for
further research.
5.2.3 Limitations in assessing vulnerability There was a recurring theme of discouragement surrounding the indicator/index approach to
representing social vulnerability. Ultimately it seems that these views reflect a mismatch in scale between
the flood hazard assessment based at the property level and the vulnerability assessment nestled at a
scale above this. For a true local scale assessment of vulnerability, and risk, responders require locally-
informed information. This information is primarily sourced from local authority adult and social care
services (e.g. the SWIFT database) and health services (e.g. PCT) during flood incident response to locate
key vulnerable households (e.g. dialysis patients). However, for reasons of data protection this
information cannot be centrally stored or mapped and requires the joined-up working of agencies, as
established within the principles of integrated emergency management. Broader-scale assessments of
vulnerability based on the census data can be used to provide the background context, but for local-scale
events it is this key household level information that is required to support FIM. Given the decadal nature
of the census, many responders commented on the danger of relying on out-dated information for
informing any aspect of response. From these views it seems that this type of vulnerability assessment
‘sets the scene’ for flood incident response but does not dictate actions. However, it was suggested that
this role could change in the context of wide spread flooding, similar too if not exceeding the scale of
flooding witnessed in 2007; events of this nature, requiring strategic decision making and priority-setting
when resources become stretched, could find a use for vulnerability assessment of this nature. Although
the mapping of area-wide vulnerability could facilitate this scale of decision making, key point-locations of
vulnerability sources are still required; such as the location of hospitals, blue-light service stations etc.
The temptation as a responder is that you go down one of these streets and somebody’s shouting from
their upstairs window and they become embroiled in the first person that they meet, because they’re at a
tactical level, an operational level even. Strategically, when you’re sat back in the command unit it might
be that that person sat in the upstairs window is perfectly safe…What you have to do is get past them and
stop it going to the sub-station. That’s just one example. (Fire and Rescue, West Yorkshire)
“It gives you that general picture because I think to get to that we’d still have our normal links into the
health service, our normal links into our adult and social care, so we’ve got our normal links running as
well but this will give us a .... Actually it’s a fantastic training tool.” (Emergency Planning, West Yorkshire)
“I think I’d only use these indicators in terms of planning and I don’t think you have time to look at it in
terms of response; then that’s the time when you need to be looking more at the local authority contact

A GIS-based Flood Risk Assessment Tool:
Supporting Flood Incident Management at the local scale
45
details for what they’ve got for vulnerable people and trying to contact them.” (EA, Hampshire)
5.3 The Risk Interface of the tool This final major interface of the tool brings together the hazard and vulnerability assessment and allows
the user to integrate these together to infer risk at the property scale. The risk model depends on the
user’s weighting between hazard and vulnerability (each on a scale of 1 to 5; low to high); whether these
two scores are treated equally and simply multiplied together, or whether one is considered to be more
important over the other in governing the user’s decision making. The option to combine the hazard and
vulnerability scores at the property level and the additional option to weight these components both
received an average rating of 3.8 and are nearly considered as being useful amongst those interviewed.
This feature of the tool seemed to create some confusion amongst responders and even when the
weighting system was re-explained some had difficulty in comprehending the resulting map i.e. is the
property highlighted as high risk due to hazard or vulnerability? In some of the discussions this led to ‘risk’
being treated as synonymous to vulnerability. The initial intention was that the resulting map would again
represent a ‘clean’ image and move away from merely overlaying the flood extent with vulnerability
information; however, there was a wide agreement amongst responders that they would continue to
overlay the flood extent data.
“I think it’s interesting to see the risk calculation shown as a map but I would always like to break it back
down into hazard and vulnerability”. (EA, Hampshire)
In terms of weighting, it seems the hazard dominated (Graph 7). This is perhaps understanding given the
view that to be considered as vulnerable, a household must be vulnerable to something. This is perhaps a
short-sighted view which, while required during the response phase of an event, does not consider the
wider impact of the flood on the surrounding community.
I think it would probably be equal to be honest, because we were very much driven to look at the hazard …
but we are expected to know a lot more about the community and what’s going to flood and what the
impact of that flood’s going to be, so I think that into the future vulnerability is going to definitely rise up in
terms of how important [it is] … (EA, West Yorkshire)
Graph 7: Weighting hazard and vulnerability to inform risk
An interesting point made by emergency planning, IOW, was that the ability to adjust these weightings
could prove useful in times of interacting hazards:

A GIS-based Flood Risk Assessment Tool:
Supporting Flood Incident Management at the local scale
46
“…If we were in a situation of pandemic flu already and then went into a period of flooding in the new
year, then perhaps we would weight vulnerability higher because we’re in an abnormal situation anyway.
Or for example at the moment with all the cuts and recession, all that kind of stuff, people’s vulnerability
could be exacerbated from their general deprivation, so the deprived people could be more deprived, the
people who are middle class, second home owners that we have a prevalence of on the Island suddenly
dip-down to become more vulnerable, just from their social level, so therefore the weighting of vulnerable
could be more than equal, because of the current climate that we’re in. So I like that flexibility.”
(Emergency Planning, IOW)
This report has thus far advocated flexibility in vulnerability indicator-selection and weighting between
different phases of a flood event, but this latter finding also supports the need for flexible systems in a
multi-hazard context. The spatial and temporal shape (or ‘etiology’) of the hazard can influence social
vulnerability (Tapsell et al. 2010). Although emergency professionals commented on the generic nature of
vulnerability in terms of responding to rapid onset and short duration hazard events (e.g. flooding, snow
storm, heat wave), vulnerability can manifest differently between the different flow-out characteristics of
these hazards or for slow onset, long-lasting events such as drought. Therefore, it is conceivable that
vulnerability criterion and hazard-vulnerability weighting could change between certain hazard events and
at times of interacting hazards (Emergency Planning, IOW).
Responders also reported on the tasks within FIM that this risk calculation could support. Once more it
seems to have a very limited role in the context of response, but has potential for planning and in
exercising and learning. The resulting counts of properties and estimated people count within each risk
category, ranked very highly in responders feedback and was considered as something that should be
repeated throughout the tool (i.e. in the hazard and vulnerability face also).
“we used to only use property information and most partners like to know the number of people, so having
them both is really important so I think that’s really good. And having a summary for use during a
response is helpful, more helpful than actually looking at the maps.” (EA Hampshire)
“…the property and people count, how many do I need to put into a rest centre, what do I need to do. Give
us a quick clue, a heads up. I do like that.” (Emergency Planning, West Yorkshire)
5.4 Overall views of the tool In the questionnaire responders were asked to rate the tool in terms of its simplicity, user-friendliness,
interactivity and the overall presentation (Graph 8).
Graph 8: General design of the tool (based on the average score and standard deviation)
Interactive User-friendly
Simple General
presentation

A GIS-based Flood Risk Assessment Tool:
Supporting Flood Incident Management at the local scale
47
Keep It Simple Stupid (K.I.S.S) was a recurring theme and essential requirement in the end-user’s ‘wish
list’: “Keep it simple stupid. The simpler it is the more likely it is to get used”. (Emergency Planning,
Hampshire). Furthermore, any tool should be designed to be user-friendly, that is to say it is self-
explanatory, intuitive and requires very little training to use. Indeed many responders commented on the
shortcomings of the National Resilience Extranet which seems to have failed by trying to be ‘the Swiss
army knife’ (Fire and Rescue West Yorkshire).
“…the NRE… started off as it’s going to be a document storing site where all organisations can store their
documents, and it’s gone now to something which has gone so big that’s it’s lost the initial meaning of
why it was created….It had a very clear start, initiation of what people wanted which was a tool to share
information, that they’ve tried to bolt on so many other bits to it that people have actually stopped using
it.” (Police, Hampshire)
The main justification for these criterions (i.e. simplicity and use-friendly) is due to the nature of
professional’s roles; as previously mentioned, flooding is but one small part of the day-job (with the
exception of those interviewed within the Environment Agency). If a tool is flood-centred, then it needs to
be something that can be like riding a bike (Emergency Planning Hampshire). While interactivity was also
highly rated, this was regarded as less important than the goals of simplicity and user-friendliness. It was
also suggested that interactivity was a requirement of a tool supporting planning and exercising, thereby
allowing the user to play with a number of scenarios and features; whereas for response, the user would
require rapid answers and the interactive nature of the tool would rate less highly if it slowed this process.
“Our work is very different, our day job is planning, training and doing exercises; that is very different from
the response. The day job is measured and calm, everything changes with response, you don’t have time to
sit down with a computer and play with a system. Time is always a luxury in emergency response.”
(Emergency Planning, Hampshire)
Many reflected on separate faces to the tool and felt that isolating hazard and vulnerability, and
combining them on a separate page for risk, was logical, clear and appropriate given that different
responders will value these differently.
“It makes sense, it’s good that you can separate hazard, from vulnerability and then putting it all together
because of the multi-agency thing, some people wouldn’t be interested in vulnerability they’d just be
interested in velocity and depth. But other agencies would find vulnerability the most informative to
them.” (EA West Yorkshire)
The current version of the tool uses a summary window to illustrate the main screen in ArcMap and limits
the user’s interaction with the software itself; based on the preliminary feedback that responders felt
uncomfortable using ArcGIS, or indeed any complicated system and required a simple and user-friendly
tool. There was a restriction with the licensing arrangement with ArcGIS which meant that it was not
possible to interact with the summary window (i.e. zoom in/out, pan view); however this is feasible with
the appropriate license. An ideal tool would completely eliminate the user’s interaction with ArcMap and
preferably would exist independently from such a system that requires expensive licensing. While the
desktop application was appropriate for this ‘mock tool’ which was concerned with asking a number of
research questions rather than becoming a real-life application at this stage, in practice the tool would
need to be accessible to all to facilitate the goal for a Common Recognised Information Picture (CRIP).
Open-source GIS via the internet could be a potential step forward in meeting this goal.
Professionals interviewed were asked to rate the each face of the tool in terms of its application potential
for different phases within FIM (Graph 9).

A GIS-based Flood Risk Assessment Tool:
Supporting Flood Incident Management at the local scale
48
Graph 9: Responders’ views on the application-potential of each face of the tool, for different phases of FIM (based
on the average rating)
On average, responders can see the potential of this tool for real-life application to support activities
involved in planning, response, recovery, mitigation strategies and exercising and training. Both hazard
and vulnerability information are regarded as equally as important in terms of emergency planning, i.e.
knowing where will flood and who will be exposed and vulnerable to that flood. Hazard information
understandably dominates emergency response, but as has been previously commented on, hazard
information presented in the form of design events (as this tool utilised) has a limited role if it cannot be
calibrated or supported by incoming real-time data. Limitations in the vulnerability assessment (as
outlined in 5.2.3) are inherently transferred into the risk calculation at the local scale and thus these two
components (vulnerability and risk) have very limited roles to play in informing response; indeed many
responders felt that the form of vulnerability assessment presented here, has a role to play in strategic
decision making only. Vulnerability assessment becomes more valuable for supporting recovery activities
and targeting and tailoring longer-term mitigation strategies.
5.5 Suggestions for further tailoring The tool was designed on the basis of preliminary interviews and was essentially an ‘all in’ tool. The
purpose of these secondary interviews was to ascertain what aspects/features of the tool were valued
and by which professional stakeholder groups, which section 5 has so far addressed. Responders were
also asked for their views on further tailoring the tool. It was widely accepted that any successful tool
must have an apparent purpose. If the tool is to be an inclusive flood risk assessment tool then it needs to
be designed to distinguish between the phases of FIM; from planning, response, recovery and longer-term
mitigation strategies, and exercising. Some agreed that the tool would then further divide to reflect the
operational/tactical and strategic tiers of decision making. A final suggestion was made that the tool
should distinguished between responders (i.e. police, fire and rescue, emergency planning etc.); but many
disagree with this suggestion and concluded that it went against the efforts of multi-agency working.
It is the research team’s suggestion that a real-life application of this tool would be a district-wide version
(within the boundaries of LRF) and would have a drop-down menu for the user to select from a number of

A GIS-based Flood Risk Assessment Tool:
Supporting Flood Incident Management at the local scale
49
‘hotspot’ locations of flooding – of which Keighley and Cowes are but one example. At the local scale
detailed flood inundation modelling could be commissioned, whereas district-wide flood assessments
could be supported by the existing fluvial and coastal flood zones, and broad scale surface water flooding
outputs already available from the Environment Agency. Existing GIS-layers mapping key locations of
emergency services and critical infrastructure etc. could then be centralised and mapped alongside the
census-derived indicators of vulnerability.
6 Recommendations for designing and implementing
future flood risk assessment tools
Flood incident management in the UK is evolving in light of the predicted increase in flood risk into a
structure of multi-agency working; with the aim of facilitating communication, data and resource sharing,
and enhancing overall response, to minimise the overall impact and losses that may ensue from flooding.
Effective emergency management requires forward-thinking and while to some extent the actual
response to a flood event will contain a degree of ‘fire fighting’ (i.e. reactive response), the success of this
will be largely determined by the proactive activities of FIM (emergency planning, targeted and tailored
mitigation and exercising and training of emergency professionals). There is a mounting pressure upon
FIM professionals to not only to communicate and operate effectively with multiple stakeholders, each
with different professional roles, responsibilities and constraints, and various knowledge domains; but to
realise this when resources are stretched (i.e. financial constraints) and meet performance targets.
Rapidly evolving technologies, decision support systems and visualisation could provide ‘tools’ to support
this goal. The challenge then for future ‘tool’ developers, is a matter of tailoring:
� Who is the end-user?
� What tasks does the tool support?
� How practical is the tool (e.g. can new data be easily integrated, updated, shared?)
� What can the tool NOT do?
Clarity is a key requirement and tool developers need to make it explicit what their system can and cannot
achieve. A recurring example cited in professionals’ responses was the failings of the National Resilience
Extranet (NRE) and it was widely acknowledge that the ‘all in’ approach has been the major failing in the
system. Simplicity is essential. This means a tool needs to be not only simple and user-friendly to use, but
needs to be simple in its objectives and intended purpose. User-friendly is a further requirement so from
the tool’s handover from developer to user, it must be as self-explanatory as possible and require minimal
training. This is particularly important given the diverse nature of the typical Category One Responder’s
day job, of which flooding is but one aspect.
The tool developed in this study was not intended for real-life application but sought to ask many
research questions which could help steer the design of future flood risk assessment tools for practical
application. This study is thus considered to be a stepping stone for future pragmatic flood research and
highlights the importance of engaging with the ultimate end-user of the tool from the early stages of its
design, construction and appraisal. This following section bullet points a number of things to take forward.
Figure 14 summarises the features that would be essential for a flood-centric decision support tool;
however, it is noteworthy that the malleable vulnerability and risk features presented in this research
could be adapted for a multi-hazard decision support tool.
� Design flood scenarios (including different flood drivers and return periods) are useful for
planning and training and exercising; however, the worst case scenario is essential. Visualising
flood scenarios is a useful tool for prompting proactive thinking (rather than merely reactive),
and providing a visual example of the possible spatial patterning of the flood. Tools supporting
emergency response should enable an interactive feature for the user to manipulate river/rainfall
levels to mirror incoming real-time information.
A GIS-based Flood Risk Assessment Tool:
Supporting Flood Incident Management at the local scale
50
� Flood extents should be complemented with depth and depth-velocity data to give an indication
of the hazard threat – whether this is based on risk to life thresholds or depth-damage
thresholds. These are arguably mislabelled indications of risk rather than hazard (as referred to in
this study; the purpose of placing these within the hazard face of the tool was to emphasise that
the calculation was based on the flood parameters only, rather than calibrated to actual
household data (as would be required for this to be a true calculation of risk). Nonetheless, the
household presentation of flood data serves as a useful means of clarifying where flooding may
have a tangible impact.
� Depth-damage hazard thresholds should be calibrated to the EA’s property database and FHRC’s
multi-coloured manual to give a more accurate representation of impact.
� ‘Cleansed’ map images that show only the impact on the road network or properties, are useful
but not essential. According to the responders interviewed here, these layers would be
supplemented with the flood extent and are not therefore as useful when considered as stand-
alone layers.
� Re-colouring flood extent to clearly indicate and enable the user to interpret the varying degrees
of the hazard posed, was a useful but those interviewed on the whole, would not want to
manipulate these hazard thresholds; expert-declared, pre-set thresholds will suffice.
� Interactive animation is in invaluable means of depicting the spatial-temporal patterning of the
flood (as it accumulates, recedes and ponds): Where and when are key questions in planning for
and responding to flood incidents. Providing the animation is a slick operation i.e. can be sped-
up/slowed-down/paused etc. Summary tables should be used to support the visualisation and
give a rapid summary of what is being displayed on screen (e.g. flood start, end, peak).
� Uncertainty in flood modelling needs to be communicated. One concern for visualisation is that it
portrays an image of accuracy and although a caveat of uncertainty may accompany this it is not
likely that it will be understood unless it can be equally visualised in some form. Whether and
how certain or uncertain information is visualised is a matter for further research; this study has
shown that a key requirement is that this information shouldn’t add confusion and risk
complicating the key message of the map. Many of those interviewed did however express an
interest in seeing visualisations of uncertainty.
� There is a mismatch between the hazard and vulnerability data, both in terms of spatial and
temporal resolution. Whilst the hazard information can be calculated and mapped at the
household scale, the vulnerability data for the same household is based on an aggregated score
of the census-defined output area (ca. 150-200 households). Flood modelling captures the
dynamics of the hazard in both in space and time; yet vulnerability assessments provide only a
static snapshot, limited by the decadal nature of the census. Consequently vulnerability
information cannot support operational or tactical response, given its lack of spatial and
temporal clarity; however, it is conceivable that it may have a role to play in broad scale events
exceeding the nature of 2007 summer floods in the UK.
� Vulnerability information is best utilised in meeting the sustainability goals of FIM i.e. targeting
and tailoring mitigation strategies.
� Vulnerability is integrated into operational and tactical response via information sharing (e.g.
location of critical patients). This information cannot be centrally stored unless the said-
household has formally signed permission for authorities to do this; this is in accordance to the
Data Protection Act 1998. Future tools could facilitate the integration of this information with
hazard data when there is sufficient time to do so.
� A novel feature of this tool is the interactive, user-control construction of a vulnerability index. It
is acknowledge that this feature is not necessarily suitable in the context emergency response,

A GIS-based Flood Risk Assessment Tool:
Supporting Flood Incident Management at the local scale
51
and its associated time constraints. However, given the number of FIM activities beyond the
response phases, it is argued here that this level of interactivity and the ability for the users to
integrate their informed subjectivities is an asset. This recognises the limitations of the objective
scientific expert when it comes to informing professional’s decision making – i.e. the subjectivity
of the professional becomes the expert voice in the tool. This feature provides an adjustable and
malleable vulnerability index and has the ability to meet various end-user needs and to support a
variety of FIM activities.
� The limitations of vulnerability assessments, means that a meaningful calculation of risk at the
household scale is not appropriate. Furthermore, this feature seemed to create some confusion
amongst professionals, who would have preferred the standard layering of hazard and
vulnerability information. Some professionals expressed an interest in weighting hazard and
vulnerability information to view how the property and people estimates changed between
different combinations. There may be a context for weighting hazard and vulnerability differently
to support different tasks within FIM, although the limited number and nature of professionals
interviewed in this study cannot shed further light on this and requires further research to
ascertain its potential value to decision makers.
� The requisite for simplistic tools is tied to a contentious debate concerning the dualistic meaning
of simplicity: Do practitioners require simplistic-user-friendly tools or simplistic-information tools.
It is apparent from the professional interviews reported on in this report, that simplistic-user-
friendly tools are essential. This is due mainly to i) the varied demands placed on professionals
which mean flood-related matters are but one, small component of the day-job; and ii)
inexperience, and a lack of confidence and self-efficacy in using new software. There is mixed
support for the interpretation that the desire for simplicity reflects a desire for simplistic-
information. For instance, most responders acknowledged the difficulties of defining and
mapping vulnerability and appreciated the nuances in this concept; on the other hand, while
acknowledging uncertainties in flood modelling, some responders seemed reluctant to engage
with it – this may be because they found it difficult to visualise how uncertainty might be
integrated in mapping, or because uncertainty is common place in the day-job and therefore not
regarded as an issue. There is a need for further research on this matter which implies a greater
tension involving the translation of science to practitioners and the professional context.
� ArcGIS was selected as the building-and-launch platform for this tool for the purpose of
facilitating discussion with professional stakeholders and addressing a number of research
questions. It is acknowledged that this software has a number of limitations which would prevent
this tool functioning in real-life situations. Aside from expensive licensing, the desktop
application is not suitable for creating and sharing a ‘common picture’ of the situation as
required for multi-agency working. The software is also unfamiliar to many practitioners and
would require training. The platform for launching a tool of this nature would need to be
something that is not reliant upon licensing and open to all potential users. An open source GIS
via a secure website would probably be the closest to meeting these requirements.

A GIS-based Flood Risk Assessment Tool:
Supporting Flood Incident Management at the local scale
52
Figure 14: The ‘ingredients’ for developing future decision support tools in flood incident management
7 Reflections This research sought to understand the utility of social vulnerability assessment within the context of
flood incident management. The previous section of this report concluded that different aspects of
vulnerability (indicators and scales of mapping) are required to meet the diverse needs of emergency
responders and the different demands placed of responders through different phases of FIM. These
included;
1. Specific locations of critical infrastructure (e.g. hospitals, electrical substations): To support strategic-
scale decision making
2. Location of critical households (e.g. dialysis patients): To support operational and tactical response

A GIS-based Flood Risk Assessment Tool:
Supporting Flood Incident Management at the local scale
53
3. Area-wide vulnerability indicators, adjustable to different contexts: To support strategic-scale decision
making, emergency planning, targeting mitigation initiatives and supporting training and learning amongst
professionals
The flood risk assessment tool developed within this research has principally engaged with the third type
of vulnerability assessment and demonstrated a novel way of allowing the user to manipulate a classical
approach for measuring vulnerability. This approach is arguably more appropriate than the traditional
method which imposes an objective, scientific view on what constitutes vulnerability; indeed, even within
academic literature indicator selection and aggregation are hotly debated and there is a tendency to
reproduce equal-weighted additive models – which in itself imposes a bold statement about the
relationship between vulnerability indicators. This research has argued a case for not only integrating the
end-users views on the matter, but allowing the user to actively construct their own vulnerability index,
acknowledging that the subjectivities of the end-user, informed by professional roles, responsibilities and
context, in fact represent the expert voice (rather than the objective scientist).
Although this research illustrates that there are possibilities for extending and utilising vulnerability
indicators within pragmatic decision support tools, the response from professional stakeholders
demonstrate that there are some fundamental limitations of this approach. In particular there is a
mismatch between the scales available for assessing flood hazard and social vulnerability, which
inherently constrain local risk assessments. On one hand, flooding can be modelled and depicted through
space and time and thus easily transformed into useable visualisations (e.g. animation), capturing the
dynamism of the hazard; conversely, vulnerability assessment remains constrained by a static-snapshot-
layering approach.
The Social Flood Vulnerability Index (SFVI, after Tapsell et al., 2002) is adopted as an example here and
represents a classical approach in vulnerability assessment. This method may be adapted so that
vulnerability is standardised according to different spatial scales and relative metrics of vulnerability are
assigned accordingly. Furthermore, vulnerability metrics can be simply intersected in ArcGIS with smaller
units of interest. Both these methods have been integrated into the flood risk assessment tool. However,
the fact still remains that the underlying data structure originates from a broader spatial scale. This is
commonly dictated by available spatial boundaries, such as that used by the census. The smallest spatial
unit of the census in the UK is the output area (OA), which includes ca. 200 households. Households
within this output area are then assigned a category of vulnerability – that is to say, they are all assigned
the same category. The abrupt and meaningless shifts in vulnerability that are created at the boundaries
of administrative districts is particularly problematic. Figure 15 illustrates this. Indeed, what is the
rationale for a category jump of 2 to 5 between neighbours A and B?
Figure 15: Abrupt shifts in vulnerability. Household A is a
category 5 (very high vulnerability); Household B is a
category 2 (low vulnerability); Household C is a category 4
(high vulnerability); and Household D is a category 3
(average vulnerability).
This form of vulnerability assessment is subject to the principles of ecological fallacy (Lloyd, 2010).
Essentially, the aggregation and mapping of data within such census-defined boundaries creates an

A GIS-based Flood Risk Assessment Tool:
Supporting Flood Incident Management at the local scale
54
impression of area homogeneity and masks the intrinsic variability that exists within. In terms of FIM, this
assumption is acceptable in the context of high-level, strategic decision making, but becomes problematic
when seeking to adopt such methods to inform local-based (operational and tactical) decision making; in
this context, knowledge concerning the local variability (i.e. ‘hotspots’ of vulnerability and critical
households) is essential. Furthermore, area-wide assessments of vulnerability are also subject to what has
been termed by Openshaw and Taylor (1979) as the Modifiable Areal Unit Problem (MAUP). Essentially,
the scale at which vulnerability is calculated will directly influence the resulting score and interpretations
of vulnerability. Assessments of vulnerability are subject to these principles. Professionals interviewed in
this study heavily discussed these limitations in adopting census-derived indicators to support decision
making; indeed this received proportionally more discussion-time than the uncertainties surrounding
flood modelling. The acute awareness of these limitations (e.g. the decadal timescale of the census and
issues of accuracy) means that this form of vulnerability assessment is considered useful only as a ‘broad
brush’ approach to painting an areas social make-up. It cannot therefore be bolted-onto local flood
modelling and applied to a risk calculation. The two approaches in hazard and vulnerability appraisal are
divorced in terms of scale (spatial and temporal) and must be equally resolved in order to inform a
meaningful risk assessment.
It has been argued that more meaningful assessments of vulnerability could derive for instance, from the
use of existing social data regarding people’s attitudes and responses to flood risk (Twigger-Ross, 2010).
One might question who has the authority to impart this information and define what is meaningful; is it
the professional stakeholder, the academic researcher or the role of the community under scrutiny? This
report highlights potential methods for adapting existing vulnerability approaches (using the SFVI as an
example) and the potential for integrating this flexibility and end-user control within a decision support
tool. Limitations in the area-wide approach, resulting from the dependency upon existing census data,
could be resolved with the inclusion of locally-informed information; whether this arises from exiting
social surveys regarding flood experience and responses specifically or from more generic discussions with
the public in at-risk locations. Social science could facilitate this process of seeking more meaningful
assessments of social vulnerability.
Although there is scope to continue research which seeks more meaningful indicators for vulnerability,
and its partner resilience, issues remain with the static nature of the assessment. Future technological
advancements in agent-based modelling may serve to capture the dynamics of vulnerability in time. This
approach has already been applied for instance in simulating city-scale rescues (Jennings, 2011: Ramchurn
et al., 2009), evacuation (EA, 2009) and the effects of catastrophic flood events upon behavioural
dynamics and resulting loss to life (Dawson et al., 2011: Lumbroso et al., 2005; Johnson et al., 2005).
There is a clear application-potential for this type of research for informing operational planning and flood
incident management. While there are a number of constraints and uncertainties governed by the
underlying algorithms which dictate agent behaviour, this approach is the best means available for
capturing the dynamic nature of vulnerability that results from human decision making (collective and
individual) and institutional responses (e.g. emergency management); as well as the effect of the hazard
itself upon predisposing vulnerability characteristics (i.e. demographic details). Furthermore, agent-based
methodologies illustrate the dynamic partnership between the hazard and vulnerability in governing risk.
However, whether agent-based modelling can become a practical reality remains to be seen and is
proposed here as a potential addition to the FIM toolkit.
Conclusions
Flood risk is set to escalate over the coming century and therefore, there is a necessity to develop and
refine tools to support decision making to alleviate the increasing burden on practitioners and the future
costs from flooding. This research aimed to utilise 1D-2D urban flood modelling developed in FRMRC1
(Exeter University and Richard Allitt Associates) and integrate these outputs with social vulnerability
metrics in two socially contrasting locations; Keighley, West Yorkshire and Cowes, Isle of Wight. Both

A GIS-based Flood Risk Assessment Tool:
Supporting Flood Incident Management at the local scale
55
hazard and vulnerability assessments are centralised in a GIS-based tool to facilitate local-scale risk
profiling.
The tool was designed on the basis of preliminary interviews with emergency professionals (e.g. blue light
services, emergency planning and Environment Agency) and the completed product has since been
demonstrated to a sample of these stakeholders for evaluation. The tool was not designed to roll-out in
practice but rather to inspire some practical recommendations for improving the assessment and
visualisation of hazard, vulnerability and risk for future real-life applications. Furthermore, the tool has
facilitated researcher-professional engagement and furthered understanding into the utility of social
vulnerability assessment within flood incident management.
It is argued here that future vulnerability assessments which rely on census-derived indicators should be
presented to FIM professionals in an interactive and malleable form to suit the flexibility required in
meeting the diverse needs of different professional groups; as well as the varied requirements of different
phases within FIM. This approach to vulnerability is considered appropriate for purposes of emergency
planning, steering recovery efforts, targeting and tailoring mitigation strategies and for professional
exercising and training. There is a limited role for this form of assessment in informing emergency
response, which instead requires accurate, point-scale information on critical facilities and households. It
was suggested that strategic decision making required for broad-scale flood events could employ this
form of vulnerability assessment to help target resources when stretched; however, as this scale of event
is yet to be seen in the UK it is difficult to infer whether vulnerability could practically play a role.
Limitations in this approach and the mismatch between vulnerability and hazard scales (temporal and
spatial) mean that the calculation of local risk as presented in this tool is problematic. While the weighting
criterion seems to have some scope, it is arguably inappropriate to calculate risk at this scale (unless
household level vulnerabilities are available).
Interactive assessments and map-making are seen as a powerful tool for not only communicating science
at the professional interface, but also integrating professional knowledge; i.e. mixing objectivity with
informed subjectivities of professional end-users. Arguably, pragmatic flood research requires the
stakeholder to become an active participant in the research process. True end-to-end research (as
described by Morss et al., 2005) could facilitate two-way knowledge exchange between science and
practitioners, the uptake of new ideas and tools in practice and prompt new thinking; otherwise stifled
behind traditional communication barriers. This type of pragmatic research constitutes a broader effort to
enhance the translation of science at the practitioner interface – and one of the main goals sort by the
Flood Risk Management Research Consortium.
Acknowledgement This research was performed as part of a multi-disciplinary programme undertaken by the Flood Risk
Management Research Consortium. The Consortium is funded by the UK Engineering and Physical
Sciences Research Council under grant GR/S76304/01, with co-funders including the Environment Agency,
Rivers Agency Northern Ireland and Office of Public Works, Ireland. We would like to further acknowledge
the work of Richard Allitt Associates Ltd and their data providers, Southern Water, as well as the team at
Exeter University (Albert Chen and Slobodan Djordjević in particular) for supplying the relevant inundation
outputs for Cowes and Keighley, respectively.

A GIS-based Flood Risk Assessment Tool:
Supporting Flood Incident Management at the local scale
56
References
Alexander, M., Viavattene, C., Faulkner, H. and Priest, S. (2011) Methods for creating a flood risk assessment tool.
Guideline report submitted to the Flood Risk Management Research Consortium (FRMRC2). July 2011.
Allitt, A., Blanksby, J., Djordjevic, S., Maksimovic, C. and Stewart, D. (2009) Investigations into 1D-1D and 1D-2D urban
flood modelling. WaPUG Autumn Conference 2009.
Alphen, J.V., Martini, F., Loat, R., Slomp, R. and Passchier, R. (2009) Flood risk mapping in Europe, experiences and
best practices. Journal of Flood Risk Management. 1-8
Brown, J.D. and Damery, S.L. (2002) Managing flood risk in the UK: Towards an integration of social and technical
perspectives. Transactions of the institute of British Geographers. 27 (4). 412-426
Cabinet Office (2010) Emergency response and recovery: Non statutory guidance accompanying The Civil
Contingencies Act 2004. Available from http://interim.cabinetoffice.gov.uk/ukresilience.aspx (accessed 14/04/2011)
Cabinet Office CCS (2010) National Resilience Extranet Newsletter. Vol 1 (7). November 2010.
Cashman, A.C. (2009) Alternative manifestations of actor responses to urban flooding: Case studies from Bradford and
Glasgow. Water Science and Technology. 60 (1).
Chen, A.S., Viavattene, C., Faulkner, H., Blanksby, J., Djordjevic, S., Saul, A. and Savic, D.A. (2009) Urban flood risk
communication using modelling results. COST C22 Final conference, ‘Road map towards a flood resilient urban
environment’, Paris 25-27th
November
City of Bradford Metropolitan District Council, Leeds City Council, Yorkshire Water, Environment Agency and Pennine
Water Group. (2008) River Aire Strategic Studies Report. TR344. April 2008
City of Bradford Metropolitan District Council (2005) Review to consider the future of water management and the
associated problems of flooding in the Bradford district. City of Bradford Metropolitan District Council.
Communities and Local Government (2008) The English Indices of Deprivation 2007. March 2008.
Dawson, R., Peppe, R. and Wang, M. (2011) An agent based model for risk-based flood incident management.
Natural Hazards.
Department for Environment Food and Rural Affairs (2005a) Making space for water: Taking forward a new
Government strategy for flood and coastal erosion risk management in England. Defra Publications: London
Department for Environment Food and Rural Affairs (2005) Flood Risk Assessment Guidance for New Developments:
Phase 2, R & D Technical Report FD2320/TR2
DiBiase, D.A.M., Maceachren, A.M., Krygier, J.B., and Reeves, C. (1992) Animation and the role of map design in
scientific visualisation. Cartography and Geographic Information Systems. 19. 201-214
Djordjević, S., Prodanović, D., Maksimović, C., Ivetić, M. and Savić, D., (2005). SIPSON - Simulation of interaction
between pipe flow and surface overland flow in networks. Wat. Sci. & Tech., 52(5): 275-283
Environment Agency (2010) Preliminary flood risk assessments: “Living draft” guidance for lead local flood authorities.
May 2010. EA: Bristol
Environment Agency (2009a) Flood in England: A national assessment of flood risk. EA: Bristol
Environment Agency (2009b) Reliability in flood incident management planning. Final Report – Part B: Technical
report. SC060063/SR2. EA: Bristol
Environment Agency (2008) River Aire Catchment Flood Management Plan. Draft main stage summary document.
Environment Agency: Leeds

A GIS-based Flood Risk Assessment Tool:
Supporting Flood Incident Management at the local scale
57
European Commission (2007) EU Floods Directive 2007. 2007/60/EC
Experian (2009) Improve outcomes through applied customer insight: Experian’s Mosaic Public Sector citizen
classification for the United Kingdom. http://publicsector.experian.co.uk/Products/Mosaic%20Public%20Sector.aspx
Faulkner, H., Parker, D., Green, C. and Beven, K. (2007) Developing a translational discourse to communicate
uncertainty in flood risk between science and the practitioner. Ambio. 36 (7). 692-703
Faulkner, H., Alexander, M. and Leedal, D. (2012) Translating uncertainty in flood risk science. [In] Hall, J. and Bevan,
K. (eds) Applied uncertainty analysis for flood risk management. (in press)
Fereday, J. and Muir-Cochrane, E. (2006) Demonstrating rigor using thematic analysis: A hybrid approach of inductive
and deductive coding and theme development. International Journal of Qualitative Methods. 5 (1)
Flood Hazard Research Centre, Middlesex University (2010) The benefits of flood and coastal risk management: A
handbook of assessment techniques 2010.
Gaist (2010) Emergency services: Commanders Resource Platform.
http://www.gaist.co.uk/BusinessLines/EmergencyServices.aspx (accessed 25/07/2011)
Gouldby, B. and Samuels, P. et al., (2005) Language of risk – project definitions. T32-04-01. March 2005, FLOODsite
Halcrow (2011) Instant insight into flood risk: FloodViewer. Available from
http://www.halcrow.com/Documents/flood_alert/FloodViewer.pdf (accessed 20/07/2011)
HM Government (2010)The Flood and Water Management Act 2010.
HM Government (2009) The Flood Risk Regulations 2009.
HM Government (2008) Identifying people who are vulnerable in a crisis – Guidance for emergency planners and
responders. Civil Contingencies Secretariat. February 2008
HM Government, Environment Agency and Defra (2008) Preliminary guidance: Developing a Multi-Agency Flood Plan
(MAFP). Guidance for local resilience forums and emergency planners. Civil Contingencies Secretariat. February 2008.
HM Government (2004) Civil Contingencies Act 2004. Available from
http://www.legislation.gov.uk/ukpga/2004/36/introduction (accessed 16/06/2011)
HR Wallingford, Flood Hazard Research Centre and Risk and Policy Analysts Ltd (2006) Flood Risks to people. Phase 2.
FD2321/TR2. Guidance document. Defra/Environment Agency Flood and Coastal Defence R&D Programme.
Johnstone, W.M., Sakamoto, D., Assaf, H. and Bourban, S. (2005) Architecture modelling framework and validation of
the BC Hydro’s virtual reality life safety model. [In] Vrijling et al. (eds). Proceedings of the international symposium on
stochastic hydraulics. May 23rd
– 24th
2005, Nijmegen, Netherlands
Kot, B., Wuensche, B., Grundy, J. and Hosking, J. (2005) Information visualisation using 3D computer game engines
case study: A source code comprehension tool. CHINZ 2005 Proceedings of the 6th
ACM SIGCHI New Zealand
Chanpter’s Internation Conference on Computer-Human Interaction: Making CHI natural.
Lane, S.N., Odoni, N., Landstrom, C., Whatmore, S.J., Ward, N. And Bradley, S. (2010) Doing flood risk science
differently: an experiment in radical scientific method. Transactions of the Institute of British Geographers. 36 (1). 15-
36
Leedal, D., Neal, J., Bevan, K., Young, P. and Bates, P. (2010) Visualisation approaches for communicating real-time
flood forecasting level and inundation information. Journal of Flood Risk Management. 3. 140-150
Lloyd, C.D. (2010) Spatial data analysis. An introduction for GIS users. Oxford University Press: New York
Lumbroso, D., Di Mauro, M. and Ramsbottom, D. (2008) Recent developments in loss of life modelling for flood
defence and dambreak risk assessments. 43rd
Defra Flood and Coastal Management Conference. 1-3 July, 2008.
Manchester University

A GIS-based Flood Risk Assessment Tool:
Supporting Flood Incident Management at the local scale
58
McCarthy, S., Tunstall, S., Parker, D., Faulkner, H. And Howe, J. (2007) Risk communication in emergency response to
extreme floods. Environmental Hazards.7 (3). 179-192
MacEachren, A.M., Robinson, A., Hopper, S., Gardner, S., Murray, R., Gahegan, M. and Hetzler, E. (2005) Visualising
geospatial information uncertainty: What we know and what we need to know. Cartography and Geographic
Information Science. 32 (3). 139-161
Maceachren, A.M. and Ganter, J.H. (1990) A pattern identification approach to cartographic visualisation.
Cartographica. 27 (2), 64-81
Morss, R.E., Wilhelmi, O.A., Downton, M.W. and Gruntfest, .E. (2005) Flood risk, uncertainty and scientific information
for decision making: Lessons from an interdisciplinary project. American Meteorological Society. BAMS-86-11-1593
Met Office (2011) Hazard Manager. Available from http://www.metoffice.gov.uk/publicsector/hazardmanager
(accessed 16/06/2011)
Openshaw, S. and Taylor, P.J. (1979) A million or so correlation coefficients: three experiments on the modifiable area
unit problem. [In] Wrigley, H. (ed) Statistical applications in the spatial sciences. Pion: London. Pp127-144
Pitt M Sir (2007) "The Pitt review, interim report". HM Government Cabinet Office, London
Priest, S., Tapsell, S., Penning-Orwsell, E., Viavattene, C., and Wilson, T. (2008) Task 10: Building models to estimate
loss of life for flood events. Produced for FLOODsite, Report number T10-08-10
Priest, S., Wilson,, T., Tapsell, S., Penning-Rowsell, E., Viavattene, C. and Fernandez-Bilbao, A. (2007) Building a model
to estimate risk to life for European flood events – Final report. T10-07-10 FLOODsite.
Ramchurn, A.D., Farinelli, A., Macarthyr, K.S. and Jennings, N.R. (20010) Decentralised coordination in RoboCup
Rescue. The Computer Journal. 53 (9). 1447-1461
Tapsell, S., Penning-Rowsell, E., Tunstall, S.And Wilson, T. (2002) Vulnerability to flooding: Health and social
dimensions. Flood risk in a changing climate. Philosophical Transactions of the Royal Society of Mathematical, Physical
and Engineering Sciences.360 (1796). 1511-1525
Tapsell, S., McCarthy, S., Faulkner, H. and Alexander, M. (2010) Social Vulnerability and Natural Hazards. WP4 Report
for CapHaz-Net, Social Capacity Buildings for Natural Hazards. Available from http://caphaz-net.org/ (accessed
01/04/12)
Twigger-Ross (2010) Developing and using measures of social vulnerability and resilience in FRM. [In] Living with
Environmental Change (2010) Social and economic theme topic review index.
Wilkinson, D. (2007) Flooding at Stockbridge, Keighley October 30th, 2000: A case study of response and recovery.
(from an EA report ‘joining-up: Stockbridge pathfinder, science report E2-9057/SR4
Wilson, T. (2008) Defining and Mapping Societal Vulnerability and Resilience: A Literature Review. Deliverable 3.7a for
FRMRC2, from FHRC at Middlesex University.
Related Documents


