A Genetic Algorithm Based Microscopic Simulation To Develop The Evacuation Plan For Multi- institutional Centers Fengxiang Qiao, Ph.D., Assistant Professor, Texas Southern University Ruixin Ge, M.S., Assistant Transportation Planner, KOA Corporation, California, USA Lei Yu, Ph.D., P.E., Dean and Professor of Texas Southern University Presented at the Intelligent Transportation Society of America’s 20 th Meeting and Exposition, Houston, TX, U.S.A., May 3-5, 2009

A Genetic Algorithm Based Microscopic Simulation To Develop The Evacuation Plan For Multi-institutional Centers Fengxiang Qiao, Ph.D., Assistant Professor,
Jan 01, 2016
Welcome message from author
This document is posted to help you gain knowledge. Please leave a comment to let me know what you think about it! Share it to your friends and learn new things together.
Transcript

A Genetic Algorithm Based Microscopic Simulation To Develop The Evacuation Plan
For Multi-institutional Centers
A Genetic Algorithm Based Microscopic Simulation To Develop The Evacuation Plan
For Multi-institutional Centers
Fengxiang Qiao, Ph.D., Assistant Professor, Texas Southern University
Ruixin Ge, M.S., Assistant Transportation Planner, KOA Corporation, California, USA
Lei Yu, Ph.D., P.E., Dean and Professor of Texas Southern University
Presented at the Intelligent Transportation Society of America’s 20th Meeting and Exposition, Houston, TX, U.S.A., May 3-5, 2009

Transportation EvacuationTransportation Evacuation
• Large Scale Evacuation– Hurricane– Radiological incidents
• Small Scale Evacuation– Terrorists’ bombing threat– Toxic material leakage– Can cause equally severe consequences as
the large scale emergencies if they take place in an area with a high-density population

Models Evacuation Planning and Operation
Models Evacuation Planning and Operation
• SLOSH (Sea, Lake, and Overland Surges from Hurricanes)
• HURREVAC (HURRicane EVACuation)
• HAZUS-MH (HAZards US Multi-Hazards)
• CATS/JACE (Consequence Assessment Tool Set/Joint Assessment of Catastrophic Events), and
• ETIS (Evacuation Traffic Information Systems)
Source: U.S. DOT and Department of Homeland Security
Analytical Tools For Transportation Modeling and Analysis
Analytical Tools For Transportation Modeling and Analysis
• NETVAC (NETwork emergency eVACuation, 6)
• MASSVAC (MASS eVACuation, 8), and
• OREMS (Oak Ridge Evacuation Modeling System, 9)
Source: U.S. DOT and Department of Homeland Security

Typical Evacuation PlansTypical Evacuation Plans
• For Large Scale Emergencies– Contraflow plan developed in response to
evacuation difficulties caused by hurricane Katrina in New Orleans
– Traffic signal plan for the Hampton Roads region of Virginia to facilitate the movement of large numbers of vehicles in advance of a storm
• For Relatively Small-scale Emergencies– Major focuses are on the simulation of traffic within
buildings and evacuation by elevators – Less attention on evacuation in small & dense area

Research ObjectivesResearch Objectives
• To Build Up a Microscopic Simulation Framework that Helps to Develop a Transportation Evacuation Plan for Dense Multi-Institutional Center (MIC)

Proposed FrameworkProposed Framework
• Identifying Study Road Network
• Selecting Microscopic Simulation Model
• Collecting Field Data
• Coding Simulation Network
• Defining Modeling Scenarios
• Calibrating Traffic Simulation Model
• Validating Traffic Simulation Model
• Executing Network Simulation; and
• Evaluating Scenarios and Optimizing Evacuation Plan

Framework of Developing Evacuation Plans
Framework of Developing Evacuation Plans
Identifying the Study Roadway Network
Selecting Traffic Simulation Model
Collecting the Field Data
Coding the Simulation Network for the Study Area
Defining Model Scenarios
Calibrating the Simulation Model
Executing the Network Simulation
Outputting Evaluation
Meeting Criterion?
END
Modify the Network
NO
YES

Case Study: Texas Medical Center
Case Study: Texas Medical Center
• More Than Five Million Patient Visits Annually and One of The Highest Densities of Clinical Facilities and Basic Science and Translational Research of any Location
• 44 Medicine-related Institutions, 13 Hospitals, and Two Medical Schools, With Nearly 100,000 People Working or Studying in the Area
• A Very Typical Grouped Institutional Center With High Density

Map of TMCMap of TMC
VISSIM NetworkVISSIM Network

Three Types of Data CollectedThree Types of Data Collected
• Traffic Volume and Capacity of Each Garage
• Vehicle Instantaneous Speed– Using GPS in the testing vehicle that followings
the average traffic flows
• Signal timing schema and other traffic control related information

Simulation in VISSIMSimulation in VISSIM
Flight view of a typical intersection In-car view showing instant vehicle running and roadway message in the box

Speed Collectors in VISSIMSpeed Collectors in VISSIM

Parameter Calibration in VISSIM
Parameter Calibration in VISSIM
•Waiting time before diffusion, expressed as x1 ;
•Minimum headway, x2;
•Maximum deceleration, x3;
• per distance, x4;
•Accepted deceleration, x5;
•Maximum look ahead distance, x6;
•Average standstill distance, x7;
•Additive part of desired safety distance, x8;
•Multiple part of desired safety distance, x9; and
•Distance of standing at 30 mph, x10.
2/ 1 sm
The parameters can be calibrated using real traffic data

Parameter Calibration in VISSIM
Parameter Calibration in VISSIM
• GPS field collected speed and VISSIM calibrated speed under different generation of gene during peak hour
• Genetic Algorithm is used in parameter calibration
0
5
10
15
20
25
30
35
0 50 100 150 200
Speed Collector
Spee
d (m
i/hr
)
GPS Speed Gen=1 Gen=22Gen=100 Gen=255

Evacuation PlansEvacuation Plans• Plan 1
– All garages be cleared in one hour– Inbound traffic volumes are controlled, only allowing
emergency vehicles to enter– No traffic control was optimized
• Plan 2– Optimization of signal timing– Traffic assignment is considered in one hour base
• Plan 3– Optimization of signal timing– Traffic assignments are in every ¼ hour
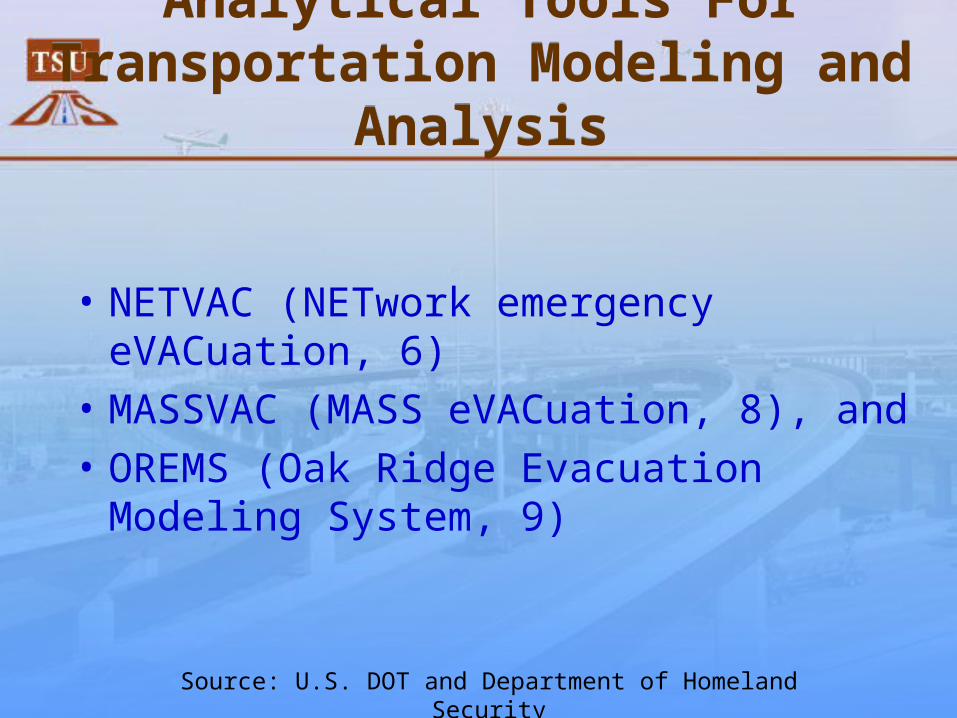
Network Performance of Different Evacuation PlanNetwork Performance of Different Evacuation Plan
Plan 1 Plan 2 Plan 3
Average speed [mi/hr] 7.914 9.416 11.85
Total delay time [hr] 293.565 227.508 172.967
Average delay time per vehicle [s] 201.149 140.751 97.722
Total stopped delay [hr] 182.312 114.746 76.301
Average stopped delay per vehicle [s] 124.919 70.989 43.108
Average number of stops per vehicles 5.965 4.433 3.966

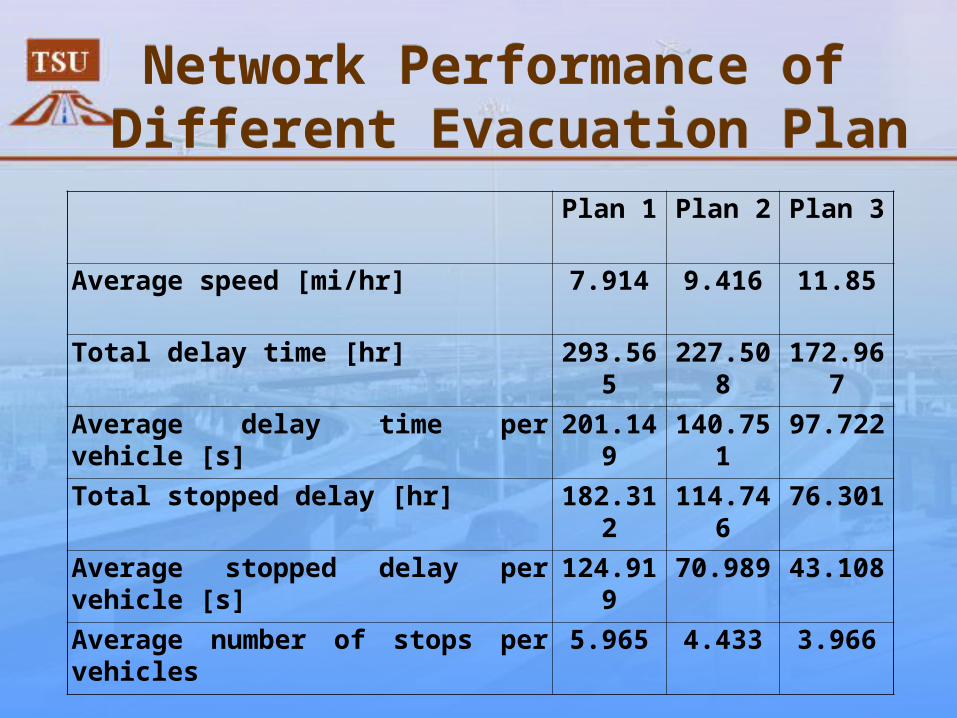
Number of Vehicles Evacuated from Garages
Number of Vehicles Evacuated from Garages
Garage #
Plan 1: 1hr Plan 2: 1hr Plan 3: 1/4hr
Plan 3: 1/2hr
Plan 3: 3/4hr
Plan 3: 1hr
1 187 187 46 96 146 1872 82 82 21 41 62 823 522 530 130 264 396 5294 86 96 95 199 297 4115 113 139 112 196 280 3746 378 438 126 227 319 4177 496 496 125 251 376 4958 599 599 155 293 461 5999 410 423 108 215 330 438
10 215 491 116 236 349 47411 494 510 128 255 389 51512 129 284 66 136 201 28113 433 437 99 196 297 40014 310 463 131 262 393 525
Total: 4454 5175 1458 2867 4296 5727

Evacuation Time Related to Percentage of Vehicles for Plan 3
Evacuation Time Related to Percentage of Vehicles for Plan 3
Percentage of Vehicles Time
0% 0:00:0010% 0:06:0220% 0:12:2130% 0:18:4040% 0:25:0050% 0:31:1960% 0:37:3870% 0:43:5880% 0:50:1790% 0:56:36
100% 1:02:56
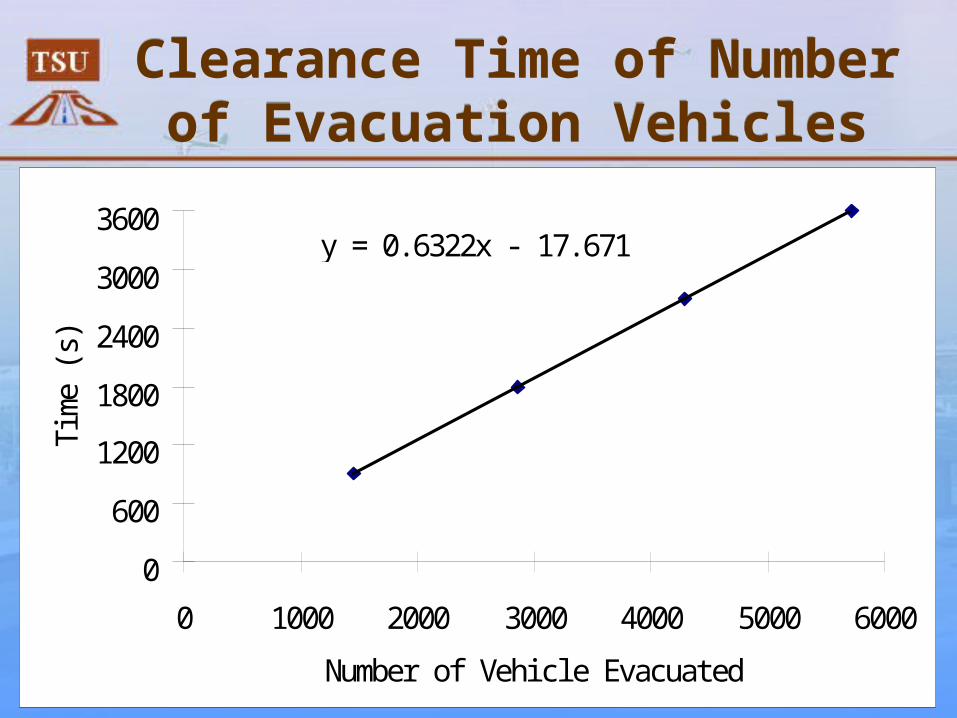
Clearance Time of Number of Evacuation Vehicles
Clearance Time of Number of Evacuation Vehicles
y = 0. 6322x - 17. 671
0
600
1200
1800
2400
3000
3600
0 1000 2000 3000 4000 5000 6000
Number of Vehi cl e Evacuated
Time
(s)
ConclusionConclusion
• Proposed a Framework for Developing a Transportation Evacuation Plan for Dense Multi-Institutional Centers.
• Microscopic Traffic Simulation VISSIM and the Optimization Algorithm Genetic Algorithm are Used
• Case Study Show that the Framework is Powerful and Practical
Related Documents