AUSTIN, L.G., MENACHO, J.M. and PEARCY, F. A general model for semi-autogenous and autogenous milling. APCOM 87. Proceedings of the Twentieth International Symposium on the Application of Computers and Mathematics in the Mineral Industries. Volume 2: Metallurgy. Johannesburg, SAIMM, 1987. pp. 107 - 126. A General Model for Semi-autogenous and Autogenous Milling L.G. AUSTIN, J.M. MENACHO and F. PEARCY Pennsylvania State University, Philadelphia, Penn., USA This paper was the subject of a cross-disciplinary presentation under the chairmanship of Dr A .M. Edwards The paper summarizes the current state of development of simulation models for SAG and FAG mills, and gives the results of recent investigations of the physical processes occurring in autogenous grinding. The breakage process is treated as the sum of three regions of breakage actions: normal breakage caused by nipping of particles between media (steel balls or pebbles); abnormal breakage caused by media when the particle or lump is too big in relation to the media to be readily nipped; and self-breakage resulting from the chip- ping fracture and abrasion of the tumbling action of rock lumps. Each region of breakage action has associated specific rates of breakage and primary progeny fragment distributions. A simplified form of the model was used to predict the performance of an 8 m diameter SAG mill with LID = 0.5 grinding a copper ore, and predicted maximum capacity and minimum kWh/ton at about 6070 ball load at 25070 total filling. Two FAG mills of LID = 2 were necessary to give the same capacity, and the simulations indicated a lower kWh/ton for these mills. For this ore, both systems were technically feasible. Introduction Although the use of simulation models for the design of ball mills has advanced (1) significantly in recent years, progress has been slow in applying the concepts of specific rates of breakag"e and primary breakage distributions in the construction f . I' d I (2-4) f . o Slmu atl0n mo e s or seml- autogenous (SAG) and fully-autogenous (FAG) mills. This is largely because the physical processes of breakage occurring in these mills are more complex than those in it and then use an approximate simplified form of the models to compare the performance of a typical SAG mill design (LID = 0.5) with that of a representative FAG mill with LID = 2. It is assumed that the reader is familiar with the concepts and symbolism of construction of mill models. (1) Mill models The basic mass balance ball mills. Several recent papers by It is assumed that this type of mill . (5-9) Austln and co-workers have approximates to a fully mixed reactor where investigated certain aspects of this the grate acts like a size classifier to problem. prevent large material leaving the mill. In this paper, we will first summarize The simple concept of residence time the current state of development as we see distribution loses meaning in such a system A GENERAL MODEL FOR SAG AND FAG MILLING 107

Welcome message from author
This document is posted to help you gain knowledge. Please leave a comment to let me know what you think about it! Share it to your friends and learn new things together.
Transcript

AUSTIN, L.G., MENACHO, J.M. and PEARCY, F. A general model for semi-autogenous and autogenous milling. APCOM 87. Proceedings of the Twentieth International Symposium on the Application of Computers and Mathematics in the Mineral Industries. Volume 2: Metallurgy. Johannesburg, SAIMM, 1987. pp. 107 - 126.
A General Model for Semi-autogenous and Autogenous Milling
L.G. AUSTIN, J.M. MENACHO and F. PEARCY
Pennsylvania State University, Philadelphia, Penn., USA
This paper was the subject of a cross-disciplinary presentation under the chairmanship of Dr A .M. Edwards
The paper summarizes the current state of development of simulation models for SAG and FAG mills, and gives the results of recent investigations of the physical processes occurring in autogenous grinding. The breakage process is treated as the sum of three regions of breakage actions: normal breakage caused by nipping of particles between media (steel balls or pebbles); abnormal breakage caused by media when the particle or lump is too big in relation to the media to be readily nipped; and self-breakage resulting from the chipping fracture and abrasion of the tumbling action of rock lumps. Each region of breakage action has associated specific rates of breakage and primary progeny fragment distributions.
A simplified form of the model was used to predict the performance of an 8 m diameter SAG mill with LID = 0.5 grinding a copper ore, and predicted maximum capacity and minimum kWh/ton at about 6070 ball load at 25070 total filling. Two FAG mills of LID = 2 were necessary to give the same capacity, and the simulations indicated a lower kWh/ton for these mills. For
this ore, both systems were technically feasible.
Introduction
Although the use of simulation models for
the design of ball mills has advanced (1)
significantly in recent years, progress
has been slow in applying the concepts of
specific rates of breakag"e and primary
breakage distributions in the construction
f . I' d I (2-4) f . o Slmu atl0n mo e s or seml-
autogenous (SAG) and fully-autogenous (FAG)
mills. This is largely because the
physical processes of breakage occurring in
these mills are more complex than those in
it and then use an approximate simplified
form of the models to compare the
performance of a typical SAG mill design
(LID = 0.5) with that of a representative
FAG mill with LID = 2. It is assumed that
the reader is familiar with the concepts
and symbolism of construction of mill
models. (1)
Mill models
The basic mass balance
ball mills. Several recent papers by It is assumed that this type of mill . (5-9) Austln and co-workers have approximates to a fully mixed reactor where
investigated certain aspects of this the grate acts like a size classifier to
problem. prevent large material leaving the mill.
In this paper, we will first summarize The simple concept of residence time
the current state of development as we see distribution loses meaning in such a system
A GENERAL MODEL FOR SAG AND FAG MILLING 107

because the residence time is determined by
the rates of breakage of feed material to
less than the grate size, so it is a
complex function of the feed size
distribution and specific rates of
breakage. However, it is still convenient
to define a mean residence time by solid
hold-up W divided by solid feed rate,
T=W/F. The basic mass balance is simple to
write:
i-I Fp.=Ff.+(W i: b .. S.w.)-WS.w., i=I,2, ..•. n
1. 1. j=1 1.,J J J 1. 1.
or
f .+ 1.
i-I T ( i:
j=1 i>1
b .. S.W.)-TS.W. 1.,JJJ 1.1.
[1]
where p. is the fraction of mill product in 1.
size class i; f. is fraction of feed in 1.
size class i; S. is the specific rate of 1.
breakage of size i material; b .. is the 1.,J
fraction of material broken from size class
j which appears in size class i; w. is the 1.
fraction of hold-up of size class i; and n
is the total number of size intervals.
There is evidence that material less than
the grate size undergoes classification as
it passes through the grate (see later).
Therefore, the system is treated as shown
in Figure 1, with material rejected by the
grate thrown back into the mill charge with
an equivalent internal circulation ration
of Cl. Since F'=(l+C')F, the mass balance
,A the apparent mill feed is
(l+C')Ff: = Ff. + F(I+C')w.c. 1. 1. 1. 1.
where the value of c. is the fraction of 1.
size i material returned to the mill. The
value of C' is defined by
C'=i: F(l+C')w.c./i: F(l+C')w. Cl-c.) • 1.1.. 1. 1. 1. 1.
=i:w.c./i:w. (l-c.) .1.1. • 1. 1. 1. 1.
or
I+C' = 1/i: w.(I-c.) .1.1. 1.
Applying Eq. [1] to this system using w. 1.
p: gives 1.
W. 1.
i-I f . +T i: b. . S . w .
1. • 1 1.,J J J J= TS.+(l+C') (l-c.)
1. 1.
i=1,2, .. n
The equation is readily converted to the
close-circuit form.
The hold-up in the mill of sizes le~s
[2]
[3]
r-------------l I I GRATE
F f· I
108
I I I I
I I I I
FI
f~ I
w pI
p~ I
I c' I L ___________ .J OVERALL MILL
CLASSI FICATION
FIGURE 1. Illustration of grate classification treatment as an exit classifier
METALLURGY: MODELLING

than the grate opening depends on the ease
with which slurry flows from the mills:
the level must increase in order to permit
slurry to flow out at a higher rate. Thus,
the system is only precisely defined if a
mass transport relation is used. We will
use the empirical function
f /f = (F /F )Nm [4] s so v vo
where f is the fractional filling of the s
mill by slurry, with slurry defined by
sizes less than the grate opening. F is a v
volume flow rate and N is an empirical m
constant. In terms of the hold-up of
material of sizes less than grate opening
in a mill of effective volume V,
[5]
where C s
is the volume fraction of solid in
the slurry; p is the true density of the s
solid; and i g
is the interval number
corresponding to the grate size. The value
of F is a standard flow rate which gives vo
a standard filling of f (10) so
F is expected vo
to be related to mill size
F =k ~ A D3 . 5 (L/D) vo m c g
by
[6]
where ~ is fraction of critical speed and c
A g
is the fraction of mill cross-section
which is open grate area. The simultaneous
solution of Eq. [4], [5] and [6] gives
I/N m
For given values of f i , bi,j,Sj and ci there is only one value of T which will
satisfy both Eq. [3] and [7].
A more complex mass balance
[7]
The problem with the simple mass balance
given above is that it considers overall
first-order Si values, whereas there is the
possibility of a substantial component of
A GENERAL MODEL FOR SAG AND FAG MILLING
abrasion in addition to normal breakage
processes, and abrasion follows a different
set of laws than breakage. Thus, Austin
and Menacho(ll) have formulated the overall
balance on size i as 'Rate of size i
material out= (rate of size i material in)
+ (net rate of material wearing in to size
i by abrasion of rounded pebbles through
the upper and lower limits of size interval
i) - (rate of loss of fragments by abrasion
of pebbles in size interval i) + (rate or
production of size i material from the
products of abrasion of larger sizes) -
(rate of production of size i material by
fracture) + (rate of production of size i
material from the products of fracture
breakage of larger sizes)'.
Considering abrasion according to a
1 · l ' d 1 h (7,12) ~near wear aw it ~s rea i y sown
that the net rate of increase of mass due
to pebbles of equivalent radius r wearing
in and out of a differential size element
dr is WK(d2P/dr
2)dr, where P is the
cumulative mass fraction size distribution
of hold-up Wand K is the linear wear rate
(L/T). Similarly, the mass loss from the
intervals is (3K/r) (dP/dr)dr. Incorpor
ating these with the usual first-order
mass-rate balance due to fracture gives
Fp! Ff! + Wf~ Kd(dP/dr)dr_3W f~ (~)dPdr ~ ~ ~+1 dr ~+1 r dr
i-I j K dP i-I +3W ~ a .. f'+I(-)~r-S.w.W+W ~ b .. S.w.
j = 1 ~J J r r ~ ~ j = 1 ~J J J
where a .. is the fraction of material ~J
abraded from size j which appears in size
interval i.
The value of K is not necessarily
constant over a wide size range but it can
be assumed that it is approximately
constant within a size interval; K. is thus ~
defined as the mean value of K for particle
sizes xi +1 <2r<xi . Then
f i K d(dP/dr) d dP I dP I i+l dr r=K i _ 1 dr i-Kidr i+l
109

i Also, by definition Ji+l(dP/dr)dr=wi , so it
convenient to define a mean value r.by the 1
product of some factor 0 and the upper size
of sieve size i, r.=o~ and make the reason-1 1
able approximation {!I(K/r) (dP/dr)dr -
Kiwi/r i • The derivative dP/dr is approxi-
mated by (dP/dr) .~w. l/(x. l-x.)~ 1 1- 1- 1
w. l/x. l(l-R), giving 1- 1-
T(K. IW' I-K.w.IR) , 1- 1- 1 1 p~=f.+ ----~~~-----
1 1 x Ri - 2 (I_R) 1
3K .TW. 1 1
i-I + oxlR
3T i-I w. i-I La .. K • (~l) -S. W • T + T Lb .. S . W •
oX I j=l 1J J RJ- 1 1 j=l 1J J J
where R is the ratio of lower to upper
sieve size of the size interval (=12).
It is convenient to define the specific
rate of loss of material by abrasion to
fragments as a fraction of the specific
rate of fracture; letting i-I y.=(3K./ox IR )/s., putting o/3(I-R)=K, 1 1 1
and setting p~=w. gives as before 1 1
i-I f.+Ky. ITw. IS. I+T L (a .. y.+b .. )S.w.
W.= 1 1- 1- 1- j=l 1J J 1J J J 1 ( He ' ) (l-c . ) + T { S . [ Hy . (l +K) ] }
1 1 1 [8]
to be used in place of Eq. [3] if abrasion
processes are significant. The size
distribution of the product stream from the
grate classification is then given by
p.=(w.)(l+e')(l-c.). For closed circuit 111
the values of f. are readily replaced in 1
terms of make-up feed g. using the s. 1 1
parameters for the external classifier.
FAG mill model
The FAG mill model is essentially
identical to that to the SAG mill model
given as Eq. [8] except that it is applied
as an equivalent series of reactors(8,9)
with various degrees of recycle of the
material rejected back to the mill by the
grate, as indicated in Figure 2. A grate
classification action is necessary to
retain the pebbles in the mill. Of course,
the calculation of the effective overall S. 1
values will not include a term for breakage
by balls. In addition, the mass transport
constant k will correspond to that for a m
long LID ball mill and not a short SAG
mill.
Calculation of Sand B values
Breakage by balls and pebbles
In order to allow for different ball and
pebbles sizes in the mill, the values of
specific rates of breakage of smaller sizes
by impact from media were calculated from
the equations developed for b~ll mills. (1)
The relations between the specific rates of
GRATE CLASSIFICATION
r----~~-------------- ---, I I I MILL I MILL 2 MILL m I
F I wltl wl t2 wltm
Yel)
J p c------ r-
f I I (I T2 lm I Pi
I ( I I I I e,c' e
2C' emC'
c' I I I L __________________________ J
OVERALL MILL
FIGURE 2. Reactors-in-series formulation for a FAG mill with grate classification
110 METALLURGY: MODELLING

breakage determined using a single ball
size in a laboratory test mill of diameter
DT and those for a mixture of balls in a
larger mill of diameter Dare
x. a S "S (....2:) .=L.mk . k= T x
1 k 1:, 0
~C2,k (C3)L: A'
k 1+(x. Ic. k11T)
S n
with
o
N2 N3 C1,k=(D/DT) (dkidT)
NO C2 ,k=(dTidk)
N 2.3
1 1,
n>i>l [9]
[lOa]
[lOb]
C =(~) 1(3.81)1I(1+6. 6JT_) 3 DT D 1+6.6J2 ,3
exp[-c(U-UT)]
~ -0.1 l+exp [15.7(~cT-0.94)] ( c ) ( ) ~cT-0.1 l+exp [15.7(~c-0.94)]
[10c]
where 1I=0 for SAG milling; 1I=0 for D<3.81 m
and = 0.2 for D>3.81 m for ball milling or
long LiD FAG milling.
The subscript T denotes conditions in the
test mill, and mk
is the mass fraction of
the kth size class of balls in the
full-scale mill: NO' NI' N2 , N3 are
empirical exponents based on experience
with ball mills. The value of U is the
fractional interstitial filling of the
media voids by particles and J is the
fractional filling of the- mill by media.
The values used for the exponents were
N1=0.5, N2=0.2, N3=1.0 and NO=1.0, and the
cushioning factor c was taken as 1.3.
The cumulative primary progeny fragment
distributions (B .. ) for normal breakage by 1,J
a single size of ball of class k have been
found to be fitted by the empirical
function
x i _1 Yk x'_ l 8 B .. k=1>k(--) +(lH
k) (_1_) ,i>j>l [11]
1,J, Xj Xj
as illustrated in Figure 3, For comparison
mixture of balls can be calculated from
B. . = L: ~ S. k B . . k I L: mk SJ' , k [ 12 ] 1,J k J, 1,J, k
Figure 4 illustrates the decrease of
breakage rates as the particles become too
large to be nipped properly by the balls.
In Region 2, the breakage of the material
in a batch rate test becomes non-first
order (abnormal) because it consists of a
mixture of normal fracture caused by a
direct impact and chipping caused by a
glancing, less violent impact. Figure 3
shows the variation of overall B values as
particle size increases with respect to the
ball size. It is clear that chipping
becomes more important as the size
increases.
Equations [9] and [10] were used for both
balls and pebbles, with the values of the
characteristic parameters T and 11T
adjusted by
T pebbles = density pebbles Pp
T balls x density balls p
f13]
[14]
The value of J to be used in Eq. [10c] is
based on the total media filling which
defines how media tumbles in the mill, that
is, it must be the sum of filling by balls
and pebbles, J=JB+Jp ' Calculation of
breakage due to balls using this J would
only be valid if all the media were steel,
so the value is corrected by the factor of
fractional volume JB/J, S(B)i=(JB/J) L:
mkS(dk)i' Similarly, S(P)i = (Jp/J) L:
w.S(x.). where w. is the mass fraction of J J 1 J
pebbles of size interval j in the tumbling
charge. It is assumed that all rock larger
than the grate size, plus balls,
contributes to the media filling level of
the mill.
The term exp[-c(U-UT)] in Eq. [10c]
represents the decrease of specific
purposes, the overall B .. value for a breakage rates when the media void spaces 1,J
A GENERAL MODEL FOR SAG AND FAG MILLING 111

1.0 ~-.----Y-----.---'----r----r----'r---"--O
0.1
16 x20
4 x6 0.0 I L-..-L-__ .l...-_--l. __ ---'-__ --L..... __ ..L...-_----I'---_---'-__ ......
0.004 0.008 0.016 0.031 0.063 0.125 0.250 0.500 1.000
FIGURE 3. Typical variation of the breakage distribution values for large particles. Dry batch grinding of quartz in a 0.6 m diameter mill. U = 0.5, JB = 0.2,26.4 mm diameter balls, 75070 of the critical speed
are overfilled. This effect states that
excessive powder in the media cushions the
breakage action on the powder. It seems
reasonable that the cushioning action
depends on the media size, that is, a 10 mm
diameter lump will be media to small sizes
but should be counted in the cushioning
powder for pebbles of 100 mm diameter. . (13)
USlng the Weymont voidage (n) factors a
simple method of defining powder is that
all material of size less than 0.125 of the
media size is considered to be powder.
This corresponds to a voidage factor of
size i with respect to media size k of 0.5.
Then the term in Eq. [IOc] becomes
exp[-c(Uk-UT)], since the effective value
of U depends on the media size being
considered.
112
Self-breakage
As particle size is increased the
particles are not nipped by tumbling balls.
However, they eventually become big enough
to break by the impact of their own fall,
in the stream of tumbling rock and balls.
Then the breakage rates increase with
increased lump size due to the increased
impact force, giving Region 3 of Figure 4.
The transition from Region 2 to Region 3 is
obtained by simple addition,
S.=S(B) .+S(P) .+S(S). where S(B). and S(P). 1 1 1 1 1 1
are breakage due to nipping by balls and
pebbles (which become small at large
sizes), and S(S). has been termed self-1
breakage. The values of S(S). appear also 1
to follow a power function
METALLURGY: MODELLING
10.0r--------,---------,---------.---------r---------.
, 1.0 REGION .. I .,
S,,, Qa( xl/xO)cta -::lI c:
E
(I) 0.1
0.01~ ______ ~ ________ ~ ________ ~ ________ -L ________ ~
0.01 0.10 1.00 10.00 100.00 1000.00
SIEVE SIZE. mm
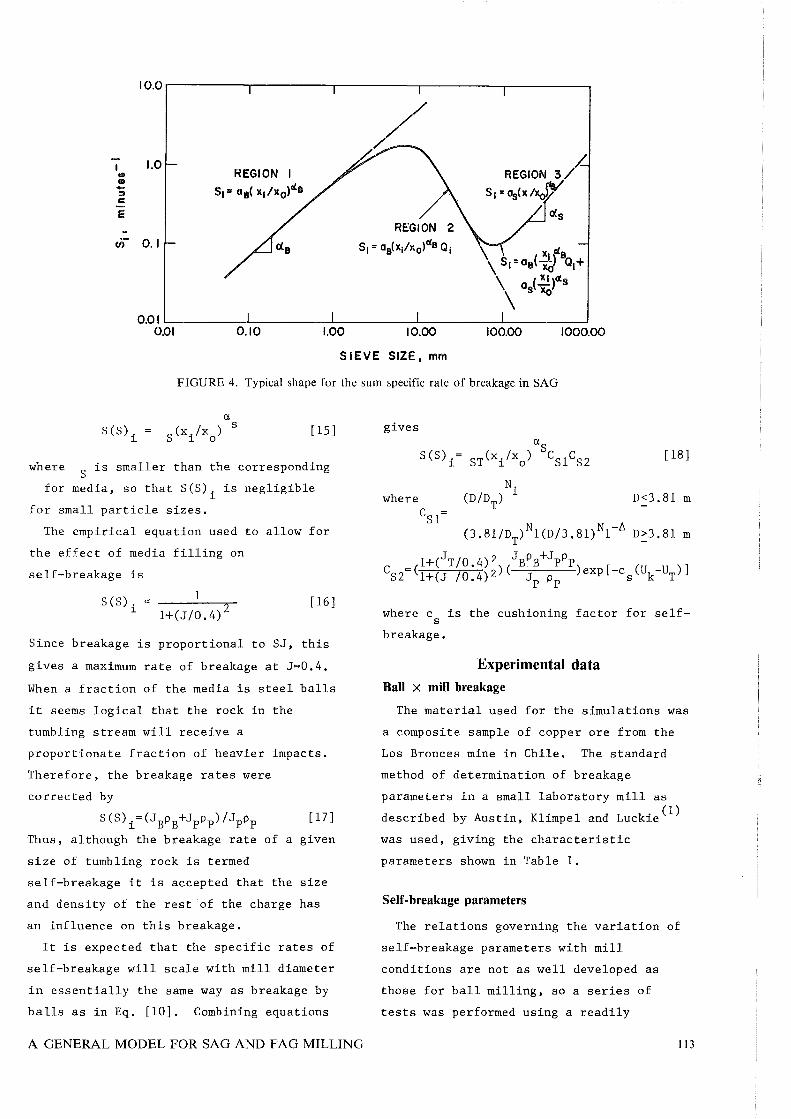
FIGURE 4. Typical shape for the sum specific rate of breakage in SAG
where
S(S). = l
[15]
is smaller than the corresponding S
for media, so that S(S). is negligible l
for small particle sizes.
The empirical equation used to allow for
the effect of media filling on
self-breakage is
S (S). <X 1 l 1+(J/0.4)2
[16]
Since breakage is proportional to SJ, this
gives a maximum rate of breakage at J=0.4.
When a fraction of the media is steel balls
it seems logical that the rock in the
tumbling stream will receive a
proportionate fraction of heavier impacts.
Therefore, the breakage rates were
corrected by
[17]
Thus, although the breakage rate of a given
size of tumbling rock is termed
self-breakage it is accepted that the size
and density of the rest of the charge has
an influence on this breakage.
It is expected that the specific rates of
self-breakage will scale with mill diameter
in essentially the same way as breakage by
balls as in Eq. [10]. Combining equations
A GENERAL MODEL FOR SAG AND FAG MILLING
gives cts
S(S)i= ST(xi/xo) CS1 CS2
N (D/D
T) 1
[18]
D<3.81 m
(3.81/DT)N1(D/3.81)N1-~ D~3.81 m
1+(JT/ 0 •4)2 JBPB+JpPp CS2=(1+(J /0.4)2)( Jp Pp )exp[-cs(Uk-UT)]
where c is the cushioning factor for selfs
breakage.
Experimental data Ball X mill breakage
The material used for the simulations was
a composite sample of copper ore from the
Los Bronces mine in Chile. The standard
method of determination of breakage
parameters in a small laboratory mill as
described by Austin, Klimpel and Luckie(l)
was used, giving the characteristic
parameters shown in Table 1.
Self-breakage parameters
The relations governing the variation of
self-breakage parameters with mill
conditions are not as well developed as
those for ball milling, so a series of
tests was performed using a readily
113
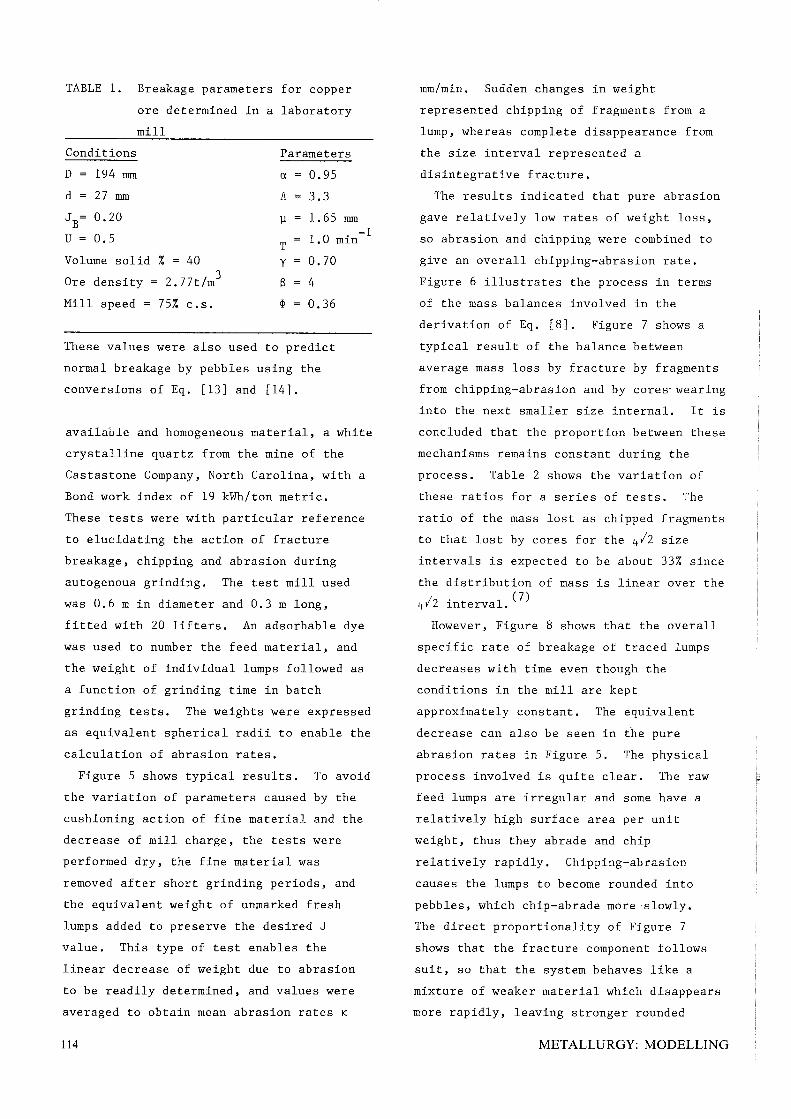
TABLE 1. Breakage parameters for copper
ore determined in a laboratory
mill
Conditions Parameters
D
d
194 mm
27 mm
CL = 0.95
A 3.3
jl 1. 65 mm
T 1. 0 min
Volume solid % = 40
Ore density = 2.77t/m3
Mill speed = 75% C.s.
Y
8 q,
0.70
4
0.36
These values were also used to predict
normal breakage by pebbles using the
conversions of Eq. [13] and [14].
-1
available and homogeneous material, a white
crystalline quartz from the mine of the
Castastone Company, North Carolina, with a
Bond work index of 19 kWh/ton metric.
These tests were with particular reference
to elucidating the action of fracture
breakage, chipping and abrasion during
autogenous grinding. The test mill used
was 0.6 m in diameter and 0.3 m long,
fitted with 20 lifters. An adsorbable dye
was used to number the feed material, and
the weight of individual lumps followed as
a function of grinding time in batch
grinding tests. The weights were expressed
as equivalent spherical radii to enable the
calculation of abrasion rates.
Figure 5 shows typical results. To avoid
the variation of parameters caused by the
cushioning action of fine material and the
decrease of mill charge, the tests were
performed dry, the fine material was
removed after short grinding periods, and
the equivalent weight of unmarked fresh
lumps added to preserve the desired J
value. This type of test enables the
linear decrease of weight due to abrasion
to be readily determined, and values were
averaged to obtain mean abrasion rates K
114
mm/min. Sudden changes in weight
represented chipping of fragments from a
lump, whereas complete disappearance from
the size interval represented a
disintegrative fracture.
The results indicated that pure abrasion
gave relatively low rates of weight loss,
so abrasion and chipping were combined to
give an overall chipping-abrasion rate.
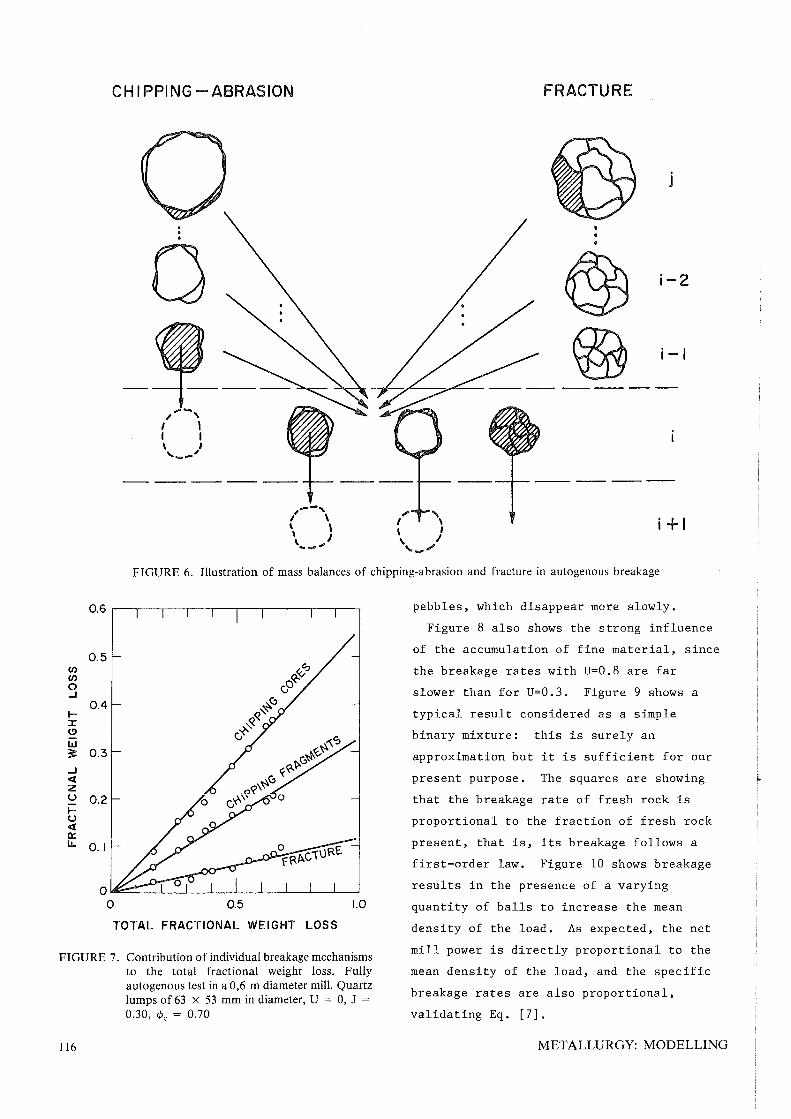
Figure 6 illustrates the process in terms
of the mass balances involved in the
derivation of Eq. [8]. Figure 7 shows a
typical result of the balance between
average mass loss by fracture by fragments
from chipping-abrasion and by cores' wearing
into the next smaller size internal. It is
concluded that the proportion between these
mechanisms remains constant during the
process. Table 2 shows the variation of
these ratios for a series of tests. The
ratio of the mass lost as chipped fragments
to that lost by cores for the 4/2 size
intervals is expected to be about 33% since
the distribution of mass is linear over the
4 12 interval. (7)
However, Figure 8 shows that the overall
specific rate of breakage of traced lumps
decreases with time even though the
conditions in the mill are kept
approximately constant. The equivalent
decrease can also be seen in the pure
abrasion rates in Figure 5. The physical
process involved is quite clear. The raw
feed lumps are irregular and some have a
relatively high surface area per unit
weight, thus they abrade and chip
relatively rapidly. Chipping-abrasion
causes the lumps to become rounded into
pebbles, which chip-abrade more ·slowly.
The direct proportionality of Figure 7
shows that the fracture component follows
suit, so that the system behaves like a
mixture of weaker material which disappears
more rapidly, leaving stronger rounded
METALLURGY: MODELLING
>
Cl
t'd
Z
LOO
t'd
:;0
,-
0
>
.......
r '-
~
.. 0
(f)
0.98
~1
tI
t'd
::::>
r >-rj
0 0
<{
:;0
0:
(fl
>
...J
Cl
<{
>
u 0
.96
z
0:
tI
>-rj
W
>
:::t:
Cl
Cl..
~
(f)
.....
0.9
4
r I-
r .....
Z
Z
W
Cl
...J
<{ >
::::>
0.9
2
0 w
...J
<{ z
0.9
0
0 I- U
<{
0:
LL
0.8
8 0
-VI
-'V6rn~
rn/m
' --
0--_
__
LUM
P
NO
. 2
7
--0
----
--__
'n
4 8
12
16
20
2
4
28
GR
IND
ING
T
IME
, m
in
FIG
UR
E 5
. C
hang
e o
f eq
uiva
lent
sph
eric
al r
adiu
s w
ith
tim
e fo
r 86
ind
ivid
uall
y-tr
aced
lum
ps w
ithi
n th
e si
eve
rang
e 63
X
53
mm
; m
ean
Ro
= 3
1 m
m,
uppe
r ro
= 3
5 m
m,
low
er r
o =
27
mm
(D
=
0.6
m,
fine
mat
eria
l re
mov
ed a
fter
gri
ndin
g pe
riod
)
"'T
I:
--'
32
3
6
CH I PPING - ABRASION
o
--, /\ \ , \ I ' .... _",
FRACTURE
i-2
i-I
\ , , , I
'--'" i+1
FIGURE 6. Illustration of mass balances of chipping-abrasion and fracture in autogenous breakage
0.6
0.5 Ul Ul 0 .J
0.4 I-J: (!)
IJ.I ~ 0.3 .J « z 0 0.2 ~ u « Cl:: lA.. 0.1
0 0 0.5 1.0
TOTAL FRACTIONAL WEIGHT LOSS
FIGURE 7. Contribution of individual breakage mechanisms to the total fractional weight loss. Fully autogenous test in a 0,6 m diameter mill. Quartz lumps of 63 x 53 mm in diameter, U = 0, J = 0.30, c/Jc = 0.70
116
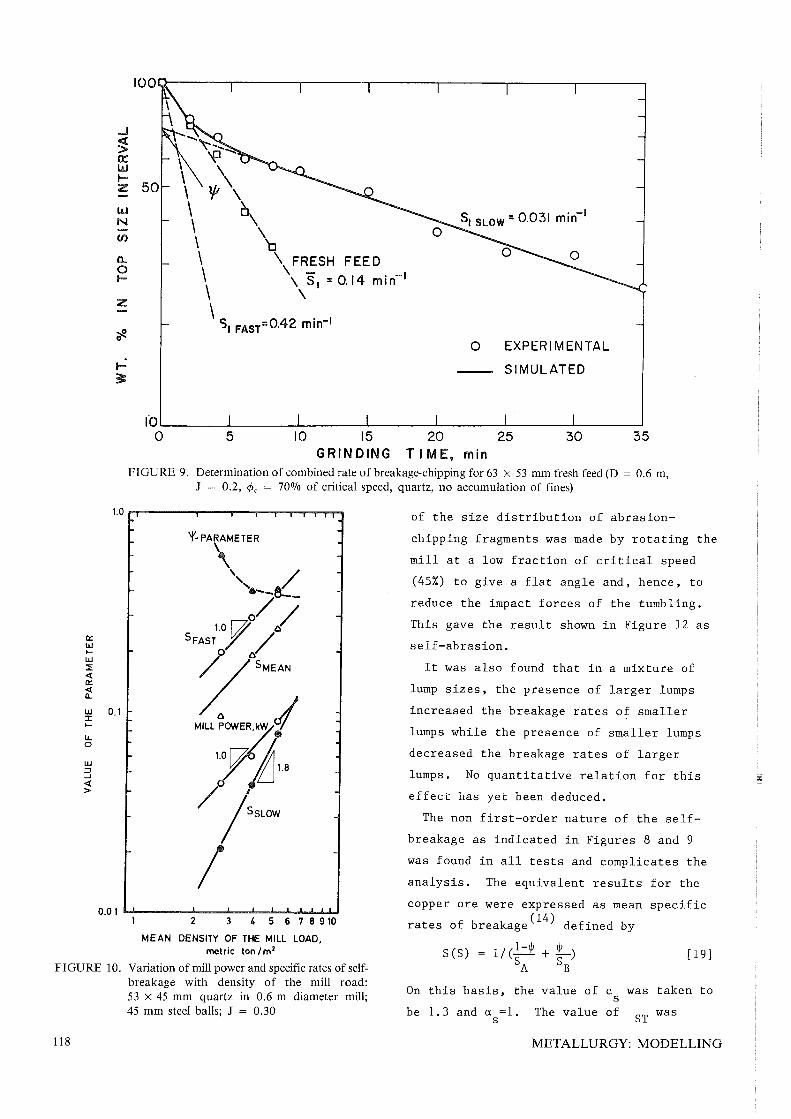
pebbles, which disappear more slowly.
Figure 8 also shows the strong influence
of the accumulation of fine material, since
the breakage rates with U=0.8 are far
slower than for U=0.3. Figure 9 shows a
typical result considered as a simple
binary mixture: this is surely an
approximation but it is sufficient for our
present purpose. The squares are showing ~
that the breakage rate of fresh rock is
proportional to the fraction of fresh rock
present, that is, its breakage follows a
first-order law. Figure 10 shows breakage
results in the presence of a varying
quantity of balls to increase the mean
density of the load. As expected, the net
mill power is directly proportional to the
mean density of the load, and the specifi.c
breakage rates are also proportional,
validating Eq. [7].
METALLURGY: MODELLING

100 a.. 90 o~
80 1-'::: z ~- 70
- 60 1-...1 z<t w> 50 uO:: o::w wl-
40 a..z
I-w IN t!) - 30 w(/) 3:
o 5 10 15 20 25 30 35
GRINDING TIME, min
FIGURE 8. Rates of self-breakage for 26.5 x 22.4 mm copper ore. Dry batch autogenous grinding D = 0.6 m, <Pc = 0.7, J = 0.2, powder minus 100 mesh
TABLE 2. Deconvolution of chipping and fracture (quartz; D=0.6 m)
Steel balls Pebbles Powder Relative Breakage
Test Size JB Size Jp Size
mm mm mesh
1 65x53 0.30 2 53x45 0.30 3 45x38 0.30
53x45 0.15 5-B 45x38 0.15 6-C 45x38 0.10 7 63x53 0.07 53x45 0.23 8 45x38 0.07 53x45 0.23 9 53x45 0.07 53x45 0.23
10 45x38 0.07 45x38 0.23 11 63x53 0.07 63x53 0.23
_1~0t! 12 53x45 0.30 14 53x45 0.30 -lOOt! 15 53x45 0.30 -lOOt! 16 38x31 0.30 17 31x27 0.30 18 27x22 0.30 19-A 63x53 0.05 19-B 53x45 0.05 19-C 45x38 0.05 19-E 38x31 0.05 19-F 31x27 0.05 19-G 27x22 0.05
Test 19 is a mixture of 6 different sizes
Figure 11 shows that the primary breakage
distributions are approximately normalized
with respect to the breaking size, but are
very different for the fresh feed and the
rounded pebbles. In addition, the shapes
of the distributions are quite different
A GENERAL MODEL FOR SAG AND FAG MILLING
U Fracture Cores Chips Chips/ (Cores+Chips)
0.14 0.56 0.30 0.35 0.12 0.57 0.31 0.35 0.13 0.57 0.30 0.34 0.23 0.51 0.25 0.33 0.17 0.64 0.19 0.23 0.16 0.61 0.23 0.27 0.18 0.55 0.27 0.33 0.23 0.48 0.29 0.38 0.33 0.44 0.23 0.34 0.17 0.61 0.22 0.26 0.37 0.41 0.22 0.36
0.15 0.29 0.45 0.26 0.37 0.45 0.21 0.47 0.32 0.40 0.30 0.28 0.57 0.15 0.21
0 0 20 0.48 0.32 0.40 0.08 0.67 0.25 0.27 0.14 0.58 0.28 0.33 0.27 0.58 0.15 0.21 0.13 0.73 0.14 0.16 0.10 0.75 0.15 0.17 0.26 0.47 0.27 0.36 0.16 0.58 0.26 0.31 0.32 0.44 0.24 0.35
of Jp 0.30 total.
from those of normal fracture, which is to
be expected since the component of fracture
is relatively small (see Table 2). The
shape clearly corresponds to a mixture of
fracture plus the cores and fragments
produced by chipping-abrasion. An estimate
117
a:: w tW :::!! <{ a:: ~
...J
~ 0::: IJJ I-;z
IJJ N Cl)
Cl. 0 I-
;z
~ 0
I-~
1000------.------,,------.------.------.------.------,
50
-":--~ \ 'fI \ \ \ 1jI \\
\ ~ \ \ \ 'n \ \\FR~SH FEED \ \ SI:: 0.14 min- I
\ \
\ '31 FAST=0.42 min- I
o EXPERIMENTAL
SIMULATED
IOL-____ -L ______ ~ ____ ~ ______ ~ ______ ~ ____ ~ ____ ~
o 5 10 15 20 25 35 GRINDING TIME, min
FIGURE 9. Determination of combined rate of breakage-chipping for 63 X 53 mm fresh feed (D = 0.6 m, J = 0.2, <Pc = 70070 of critical speed, quartz, no accumulation of fines)
1.0 rr----r---,.-.,.--r-r-r"T""l"T"'l
'I'-PARAMETER
\ ""&-_IIfI./ /0-_
1.0[70 /
SFAST Y /
of the size distribution of abrasion-
chipping fragments was made by rotating the
mill at a low fraction of critical speed
(457.) to give a flat angle and, hence, to
reduce the impact forces of the tumbling.
This gave the result shown in Figure 12 as
self-abrasion.
w 0.1
~OS"EAN
"ILL~ It was also found that in a mixture of
lump sizes, the presence of larger lumps
increased the breakage rates of smaller
lumps while the presence of smaller lumps
decreased the breakage rates of larger
lumps. No quantitative relation for this
effect has yet been deduced.
::r I-
u.. o
/1 /SSLaN
/ 2 345678910
MEAN DENSITY OF THE MILL LOAD, metric ton 1m2
The non first-order nature of the self
breakage as indicated in Figures 8 and 9
was found in all tests and complicates the
analysis. The equivalent results for the
copper ore were expressed as mean specific
rates of breakage(14) defined by
S(S) = 1/(1-1jJ + L) [19] FIGURE 10. Variation of mill power and specific rates of self
breakage with density of the mill road: 53 X 45 mm quartz in 0.6 m diameter mill; 45 mm steel balls; J = 0.30
SA SB
On this basis, the value of c was taken to s
be 1.3 and us =l. The value of ST was
118 METALLURGY: MODELLING

CD ~
a: w I-W ~ « a: « a. w (!) 0.1 « ~ « w a: CD
w > I-« ..J ::> ~ 0.01 ::> u
0.001
• o
0.0/
FEED SIZE, mm
45 x 38
53 x 45
63 x 53
0.1
RELATIVE PARTICLE SIZE, Xl/Xj
FIGURE 11. B values from fully-autogenous batch grinding tests in 0.6 m mills; J = 0.30, U = o. </>c = 0.7
0.10
0.01
t-I rI
0.001 0.010
• o 11
0.100
RELATIVE SIZE, Xl/Xj
<Pc J 0.49 0.4
0.7 0.2
0.7 0.2
u o o 0.3
1.000
FIGURE 12. Cumulative primary breakage distribution values for 53 x 45 mm copper ore. Dry batch autogenous grinding in a 0,6 m diameter mill
A GENERAL MODEL FOR SAG AND FAG MILLING 119
determined by back-calculation(B) from
steady-state continuous pilot-scale data to -3 -1 be 0.7 x 10 min for a test mill
diameter of 1.B m and L/D=0.3, at J T=0.2,
~ =0.77 and approximately 40 volume % of c
solid in slurry leaving the mill.
Mass transport relations and grate classification
The continuous pilot-scale tests were
also used to estimate the value of F in vo Eq. [6]. This gave a value of A k at
f =0.25 of 0.37 min- 1mO. 5 . On ~h: other so
hand, the mass transport relation given for
overflow ball mills(10) gives k A =0.5 h-1 m g
mO. 5 for a solid filling level
corresponding to approximately U=l at
J=0.3B, which is about the same slurry
filling. Thus, the SAG mill can pass large
quantities of slurry without overfilling
with slurry, by comparison with an overflow
ball mill.
The comparison of size distributions
within the pilot-scale to those leaving the
mill gave a grate classification function
of the form
A c
i = 1/[1+(x
50/x
i) g] [20]
For the 12 mm (half inch) grate opening,
the values of the characteristic parameters
were x50=1.11 mm and Ag=1.3. However, it
must be understood that this action may be
different in a full-scale mill where the
grates are kept freely open by an adequate
discharge mechanism. In this case, the
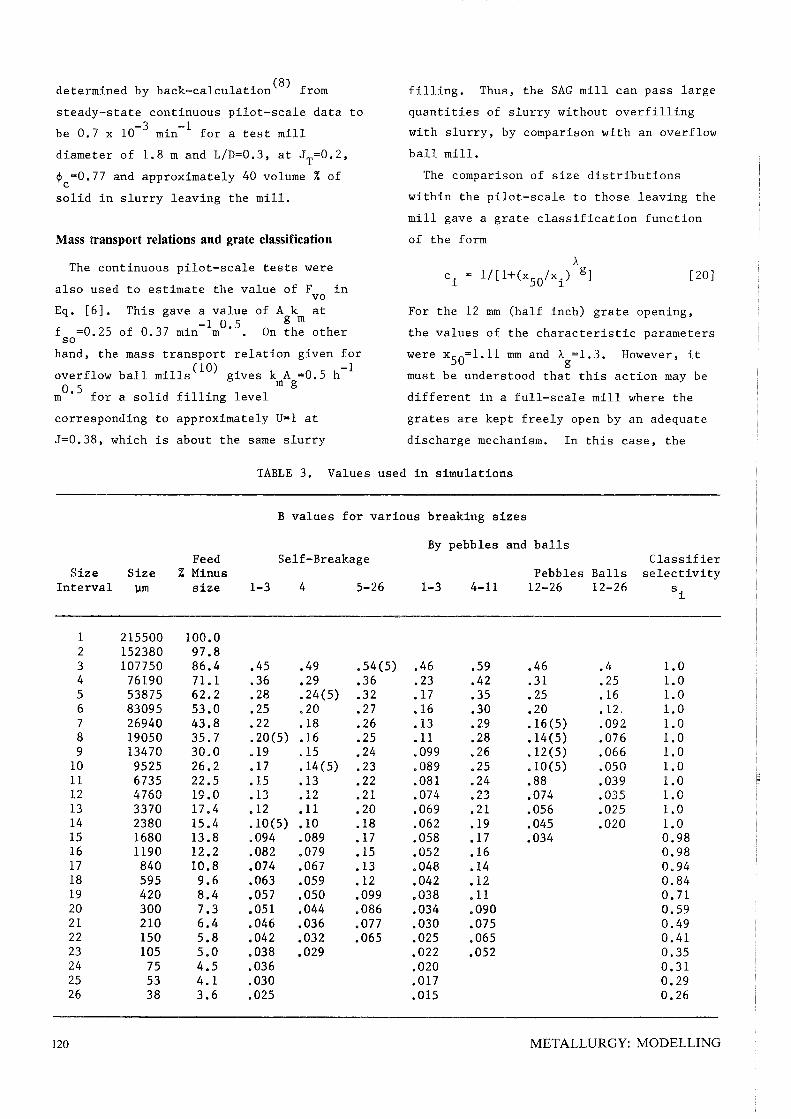
TABLE 3. Values used in simulations
B values for various breaking sizes
By pebbles and balls Feed Self-Breakage Classifier
Size Size % Minus Pebbles Balls selectivity Interval llm size 1-3 4 5-26 1-3 4-11 12-26 12-26 s.
l
1 215500 100.0 2 152380 97.8 3 107750 86.4 .45 .49 .54(5) .46 .59 .46 .4 1.0 4 76190 71.1 .36 .29 .36 .23 .42 .31 .25 1.0 5 53875 62.2 .28 .24(5) .32 .17 .35 .25 .16 1.0 6 83095 53.0 .25 .20 .27 .16 .30 .20 .12. 1.0 7 26940 43.8 .22 .18 .26 .13 .29 .16(5) .092 1.0 8 19050 35.7 .20(5) .16 .25 .11 .28 .14(5) .076 1.0 9 13470 30.0 .19 .15 .24 .099 .26 .12(5) .066 1.0
10 9525 26.2 .17 .14(5) .23 .089 .25 .10(5) .050 1.0 11 6735 22.5 .15 .13 .22 .081 .24 .88 .039 1.0 12 4760 19.0 .13 .12 .21 .074 .23 .074 .035 1.0 13 3370 17.4 .12 .11 .20 .069 .21 .056 .025 1.0 14 2380 15.4 .10(5) .10 .18 .062 .19 .045 .020 1.0 15 1680 13.8 .094 .089 .17 .058 .17 .034 0.98 16 1190 12.2 .082 .079 .15 .052 .16 0.98 17 840 10.8 .074 .067 .l3 .048 .14 0.94 18 595 9.6 .063 .059 .12 .042 .12 0.84 19 420 8.4 .057 .050 .099 .038 .11 0.71 20 300 7.3 .051 .044 .086 .034 .090 0.59 21 210 6.4 .046 .036 .077 .030 .075 0.49 22 150 5.8 .042 .032 .065 .025 .065 0.41 23 105 5.0 .038 .029 .022 .052 0.35 24 75 4.5 .036 .020 0.31 25 53 4.1 .030 .017 0.29 26 38 3.6 .025 .015 0.26
120 METALLURGY: MODELLING

action of the grates can be considered as
close to ideal classification, which can be
closely approximated by x50=grate size and
A =4. g
Full scale simulation SAG mill: LID = 0.5
The mill simulated was a nominal 28 feet
by 14 feet mill, giving D=8.2 m, L/D=0.5
and an effective volume of 230 m3. The
feed and overflow trunnion diameters
represented a filling level of 29% to the
level of overflow, and the design criteria
was 25% that is, J=0.25, and 76% of
critical speed. The cumulative primary
breakage values estimated from laboratory
batch tests are given in Table 3, and were
entered as matrices into the program. The
simulator was supplied with the feed size
distribution also shown in Table 3, and
simulations were performed for nominal
fractional hold-up(JT) in the mill covering
the range 0.2 to 0.4, using a ball charge
TABLE
Circulation Capactiy J Ratio Q, tph
10.2 2.1 l35 15.0 2.3 195 19.8 2.5 255 25.0 2.7 305 30.1 2.9 340 35.4 3.2 365
4 14.7 2.3 220 18.8 2.5 305 22.6 2.7 370 27.6 2.9 425 32.8 3.1 455 38.1 3.4 465
8 18.8 2.0 280 23.0 2.3 365 26.9 2.6 435 31.2 2.8 490 36.6 3.0 520
12 22.9 1.7 305 27.0 2.1 415 31.0 2.4 475 35.0 2.7 525
4.
of 50% of 76 mm (3 inch) and 50% of 100 mm
(4 inch) diameter balls. The mill was
closed with the external classifier
selectivity values given in Table 3.
The variation of mill capacity with
hold-up and ball charge is shown in Table
4, and Figure 13. The charge load of 0.25
volume fraction was taken as optimum since
it gave a region where the capacity is not
sensitive to ball load in the region J B=4%
to 87.. The power equation used was that . b A . (16) g1.ven y ust1.n
m = p
3 5 0 .1~ K(D • )(L/D)(J)(1-1.03J)(~c-29_10;c)Pc
,kW [21]
where P is the overall density of the c
charge, including balls and slurry. This
was calculated using the bed porosity
obtained from the use of the Weymont
voidage factors, as described by Austin.
The value of K was taken as 10.6 for
dimensions in meters and Pc in metric 3 tons/m , to produce the mill power quoted
Results of SAG mill simulations
Hold-up Product size W distribution % <
tons 35 mesh 400 mesh kWh/t
39 90.0 31.5 12.0 56 91.0 32.1 10.9 72 92.0 32.7 10.5 88 92.8 33.3 10.3
105 93.7 34.2 10.3 121 94.5 35.2 10.4
39 91.8 32.5 11.8 56 90.9 31.9 10.0 72 90.2 31.5 9.1 88 89.8 31.4 8.9
105 89.1 31.1 9.1 121 88.3 30.8 9.2
39 92.9 33.2 l3.3 56 91.4 32.1 10.9 72 90.3 31.5 9.7 88 89.7 31.3 9.1
105 88.9 31.0 9.2
39 93.8 34.0 14.4 56 92.1 32.5 11.7 72 90.7 31.7 10.3 88 89.8 31.4 9.6
A GENERAL MODEL FOR SAG AND FAG MILLING 121

700
600
:I: 500 a.. I-
>- 400 I-U « a.. « u
.J
.J
::!i
100
0 10 40
PERCENT MILL FILLING, J
FIGURE 13: Variation of predicted mill capacity with filling and ball load for nominal 28 feet diameter by 14 feet long SAG mill
by Tanaka and Tanaka. (15)
The values of specific grinding energy in
kWh/ton are also given in Table 4, and
Figure 14 shows that the minimum occurs at
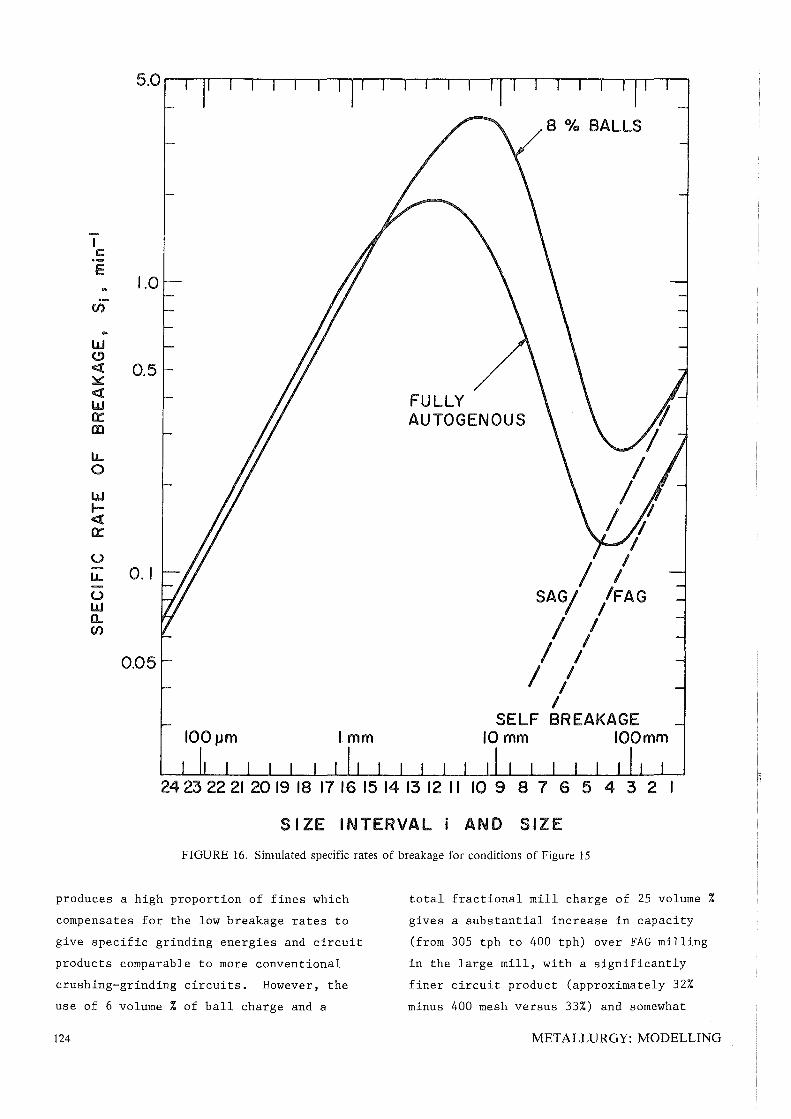
about 6% ball load. Figure 15 shows the
size distributions predicted by the model
for operation at 8% ball load and for
fully-autogenous operation. Figure 16
shows that the effect of the balls is to
increase the specific rates of breakage of
the larger sizes, while Figure 15 shows
that the consequence is that the fraction
'--.---.--,---,--r'--'---'--"--r-I II , &.
:it .>S.
10 >-:I: (!) a.. a::
I- w 9 z
w >- (!) I- Z u 8 0 « z a..
a:: « (!) u
7 u Li: u w a.. Cl)
4 8 12
PERCENT BALL LOAD
FIGURE 14. Optimum of capacity and specific grinding energy with ball load at total filling of 250/0 mill volume (see Fig. 13)
122
of mill charge in the size region of 20 mm
to 60 mm is thus reduced.
FAG mill: LID = 2.0
It was decided to compare the result with
two equivalent FAG mills each pulling half
of the SAG mill power, as predicted by the
Bond equation for ball mills,
O.lep m =7.33D
3•3
(L/D)(J)(1-0.937J)(ep 9-1~ep )Pb p c 2 c
,kW [22]
where Pb
is normally the ball density but
in this case was the ore density of 2.77
tons/m3
• L/D was assumed to be 2.0,
ep =0.85, and the value of J was taken as c
0.3. With these assumptions, the mill
diameter is D = 5.6 m to give a mill shaft
power of 2000 kW.
The simulation was performed with the
same breakage parameters used for the SAG
milling, the same grate openings to retain
large material and the same external
classifier function. The feed to the 5.6 m
internal diameter FAG mill was taken as the
same as that to the SAG mill.
No information was available for the
expected mass transport relation, but the
comparison of the values for the SAG mill
with those for overflow mills suggests that
the long L/D mills fill up with slurry to a
greater extent than the SAG mill,
presumably due to the resistance to mass
flow through the long length of tumbling
charge. Thus, the value of f in Eq. [4] so
was increased arbitrarily by a factor of 3.
Table 5 gives the results. The specific
grinding energy is substantially less, but
this result is sensitive to the mass
transport factor so it is not possible to
assert this with a high degree of
confidence. In addition, it may not be
valid to use the Bond power equation for a
pebble mill, since it predicts a much lower
mill power than equation 21.
METALLURGY: MODELLING

V'" 50 ~..:s
~O <?
w N
Cl)
Z « :J: I-
Cl) Cl) 10 w ...J
I-Z W u 5 0:: w FEED Cl..
100J..lm Imm 10mm 100mm
25 2423 22 21 20 19 18 1716 15 14 13 12 11 10 9 8 7 6 5 4 3 2
SIZE INTERVAL AND SIZE
FIGURE 15. Simulated size distributions for SAG mill (see Fig. 13) with 8070 ball load and 0% ball load
TABLE 5. Results of simulations of 5.6 m diameter FAG mill (LID = 2.0)
Nominal fractional hold-up % minus 35 mesh in circuit i. minus 400 mesh in circuit
product Output Q, tph Circulation ratio C Mill hold-up, t Mill power, kW Specific grinding energy,
kWh/t
0.3 89
31 270
3.7 140
2000
7.4
A GENERAL MODEL FOR SAG AND FAG MILLING
Discussion of results
It is clear that the ore studied was a
coherent ore which would be suitable for
FAG grinding since it leads to a mill
charge with sufficient large rounded
pebbles to be equivalent to a ball mill
(with lower density of media, of course).
Although the specific rates of breakage of
these large lumps are relatively low,
requiring larger mill volume as compared to
ball milling, the chipping-abrasion process
123
I c:
E 1.0
Cl)
w (!)
-et 0.5 ~ -et FULLY w a::: AUTOGENOUS CD
IJ.. 0
W ..... -et a:::
u IJ.. 0.1 -u SAG/ w a.. / Cl)
0.05 / /
100~m Imm
242322212019 18 17 16 15 14 13 12 11 10 9 8 7 6 5 4 3 2 I
SIZE INTERVAL i AND SIZE
FIGURE 16. Simulated specific rates of breakage for conditions of Figure 15
produces a high proportion of fines which
compensates for the low breakage rates to
give specific grinding energies and circuit
products comparable to more conventional
crushing-grinding circuits. However, the
use of 6 volume % of ball charge and a
124
total fractional mill charge of 25 volume i.
gives a substantial increase in capacity
(from 305 tph to 400 tph) over FAG milling
in the large mill, with a significantly
finer circuit product (approximately 327-
minus 400 mesh versus 33%) and somewhat
METALLURGY: MODELLING

lower circulating load.
The long LID FAG mills gave similar
circuit product size distributions, but
required two mills of 5.6 m diameter to
perform the same duty as the one 8.2 m
diameter SAG mill. Clearly, for this type
of ore, the choice of system depends on the
comparative economic calculations of
capital and interest cost and steel
consumption.
There remains substantial work to be done
to improve the model to a level of accuracy
sufficient for utility. The use of average
specific rates of self-breakage is not as
satisfactory as the use of equations
representing a fast-slow breakage process.
The current method of entry of B values is
not satisfactory. The lack of precise
relations to describe the variation of S
and B values with mill conditions prevents
the development of simple laboratory tests
to predict the values from a small amount
of laboratory work. The results are
sensitive to the level of slurry in the
mill, but the calculation of this level by
mass transport relations is based on
entirely inadequate information. The model
at the moment does not include the effect
of ball diameter on self-breakage.
It will be interesting to program the
model for removal of material from the mill
contents by pebble ports, followed by
crushing of these sizes, in the size range
of 38 mm (1.5 inches) to 75 mm (3 inches).
At the moment, it is not possible to
demonstrate the effect of using a less
coherent ore because the associated
variation of the self-breakage B values is
not known: the rapid breakage of a weak
ore is expected to give B values with a
smaller fraction of fines.
Acknowledgements The work was performed under NSF Grant
ePE 8303154.
A GENERAL MODEL FOR SAG AND FAG MILLING
References 1. AUSTIN, L.G., KLIMPEL, R.R. and LUCKIE,
P.T. Process Engineering of Size
Reduction: Ball Milling. New York,
N.Y., Society of Mining Engineers of
A.I.M.E., 1984, pp. 1-561.
2. STANLEY, G.G. Mechanisms in the
autogenous mill and their mathematical
representation. J. So. Afr. Inst. Min.
Metal., Vol. 75, 4, Nov. 1974, pp.
77-98.
3. GAULT, G.A. Modelling and control of
autogenous grinding circuits. Ph.D.
Thesis, University of Queensland,
Australia, 1974.
4. VANDERBEEK, J.L., HERBST, J.A.,
P~JAMANI, K. and HALES, L. Online
estimation of particle size
distribution and volumetric filling in
a SAG mill with a view to automatic
control. Presentation, Society of
Mining Engineers of A.I.M.E. meeting in
Alburquerque, N.M., Oct. 1985.
5. AUSTIN, L.G., WEYMONT, N.P., PRISBEY,
K.A. and HOOVER, M. Preliminary
results on the modeling of autogenous
grinding. Proc. 14th Int. APCOM
Conference. Ramani, R.V., The
Pennsylvania State University, P.A.,
1976, pp. 207-226.
6. AUSTIN, L.G., WEYMONT, N.P., BARAHONA,
CoAo and SURAYANARAYAN, K. An improved
simulation model for semi-autogenous
grinding. Powder Technology, Vol. 47,
3, 1986, pp. 265-283.
7. AUSTIN, L.G., BARAHONA, C.A. and
MENACHO, J.M. Fast and slow chipping
fracture and abrasion in autogenous
grinding. Powder Technology, Vol. 46,
1,1986, pp. 81-87.
8. AUSTIN, LoG., BARAHONA, C.A. and
MENACHO, J.M. Investigations of
autogenous and semi-autogenous grinding
in tumbling mills. Proc. 1st. World
125
Congress Particle Technology.
Leschonski, K., Nuremberg, Federal
Republic of Germany, April 1986.
9. HOYER, D.I. and AUSTIN, L.G. A
simulation model for autogenous pebble
mills, Society of Mining Engineers of
A.I.M.E. meeting in Alburquerque, N.M.,
Oct. 1985.
10. ROGERS, R.S.C. and AUSTIN, L.G.
Residence tim~ distributions in ball
mills. Particulate Science and
Technology, Vol. 2,2, 1984. pp.
193-204. 'V
11. AUSTIN, L.G. and CONCHA, F.A. Diseno
simulacion de circuitos de molienda.
To be published.
12. MENACHO, J.M. Some solutions for the
kinetics of combined fracture and
abrasion breakage, Powder Technology,
Vol. 49,1, 1986, pp. 87-95.
13. WEYMONT, N.P. The analysis and
simulation of autogenous grinding
126
systems, Ph.D. Thesis, The Pennsylvania
State University, P.A., 1979.
14. AUSTIN, L.G., TRlMARCHI, T.J. and
WEYMONT, N.P. An Analysis of some
cases of non-first order breakage
rates. Powder Technology, Vol. 17,1,
1977, pp. 109-113.
15. TANAKA, T. and TANAKA, K. Design
features of a semi-autogenous grinding
mill and a comparison of test mill data
with actual operation data. Santiago, I
Chile, Centro de Investigaci n Mineva y
Metalurgica, Primer Taller Nacional de
Molienda Autogena de Minerales.
Preprint No. 6, Sept. 1983, pp. 1-26.
16. AUSTIN, L.G. Chapter 14,
Semi-autogenous (SAG) and fully
autogenous grinding. Short course
notes: Process Engineering of Size
Reduction in Tumbling Mills, The
Pennsylvania State University, P.A.,
September 1987, pp. 14.1-14.55.
METALLURGY: MODELLING
Related Documents