The International Congress for global Science and Technology ICGST International Journal on Artificial Intelligence and Machine Learning (AIML) Volume (8), Special Issue on Computational Methods for the Tourism Industry, www.icgst.com © ICGST, 2008

Welcome message from author
This document is posted to help you gain knowledge. Please leave a comment to let me know what you think about it! Share it to your friends and learn new things together.
Transcript

The International Congress for global Science and Technology
ICGST International Journal on Artificial Intelligence
and Machine Learning (AIML)
Volume (8), Special Issue on Computational Methods for the Tourism Industry,
www.icgst.com
© ICGST, 2008

AIML Journal ISSN Print 1687-4846 ISSN Online 1687-4854 ISSN CD-ROM 1687-4862 © ICGST 2008

Table of Contents
Papers Pages P1120806020 Nesreen Kamel and Amir F. Atiya and Neamat El Gayar and Hisham El-Shishiny Tourism Demand Foreacsting Using Machine Learning Methods
1--7
P1120806021 Nedaa Agami and Mohamed Saleh and Ahmed Omran and Hisham El-Shishiny A Futures Studies Tool to Anticipate the Impacts of Wildcards on the Future of the Tourism Industry in Egypt
9--14
P1120806022 Athanasius Zakhary and Neamat El Gayar and Amir F. Atiya A Comparative Study of the Pickup Method and its Variations Using a Simulated Hotel Reservation Data
15--21
P1120806023 Neamat El Gayar and Abdeltawab M.A. Hendawi and Athanasius Zakhary and Hisham El-Shishiny A Proposed Decision Support Model for Hotel Revenue Management
23--28
P1120806024 Hossam Said Shehata and Hanan S. Kattara and Mohamed Farid El-Sahn Revenue Management System between Awareness and Implementation A Case Study on Egyptian HotelsGrammar
29-38

ICGST International Journal on Artificial Intelligence and Machine Learning (AIML)
A publication of the International Congress for global Science and Technology - (ICGST)
ICGST Editor in Chief: Ashraf Aboshosha
www.icgst.com. [email protected]
Guest editors: Neamat El Gayar and Hisham El Shishiny
International Session Program Committee
• Amir Atiya, Egypt • Ali Hadi, Egypt/USA • Guenther Palm, Germany • Mohamed Kamel, Canada • Omar El Gayar, USA • Rong-Chang Chen, Taiwan
Tourism Demand Foreacsting Using Machine Learning MethodsNesreen Kamel
Faculty of Computers and InformationCairo University, Giza, Egypt
[email protected] F. Atiya
Dept Computer EngineeringCairo University, Giza, Egypt
[email protected] El Gayar
Faculty of Computers and InformationCairo University, Giza, Egypt
[email protected] El-Shishiny
IBM Center for Advanced Studies in CairoIBM Cairo Technology Development Center
Giza, [email protected]
Abstract
Tourism demand forecasting has attracted the attention ofresearchers in the last decade. However, most of researchfocused on traditional quantitative forecasting techniques,such as ARIMA, exponential smoothing, etc. Althoughthese traditional methods have achieved certain levelsof success in the tourism research, it would be usefulto study the performance of alternative models such asmachine learning methods. This is the topic consideredin this paper. The goal is to investigate how differentmachine learning models can be applied in the tourismprediction problem and to assess the performance of sevenwell known machine learning methods. Furthermore,we investigate the effect of including the time index asan input variable. Specifically, we consider the tourismdemand time series for Hong Kong inbound travel.
Keywords: Tourism Forecasting, Machine Learning.
1 Introduction
Tourism as an industry is of particular importance to manycountries, being both a very significant source of foreignexchange as well as a provider of direct and indirect em-ployment. The need for accurate tourism forecasting isthus particularly important due to the industry’s significantcontribution to the economy [1]. In the tourism industryplanning is particularly important because of the rapid eco-
nomic and political changes, the perishable nature of thetourism industry’s products and services (e.g. unoccupiedairline seats, and unused hotel rooms cannot be stockpiledfor future use), and the sensitive nature of the industry tonatural and human made disasters [2]. To a large extent,planning relies heavily on accurate forecasts in order to re-duce the risk in the decision making process. That is toreduce the chances a decision will fail to achieve the de-sired objectives. The need of accurate forecasting is there-fore important to government and managers. For example,government bodies use demand forecasts to set market-ing goals, and explore potential markets. Managers usedemand forecasts to determine operational requirementssuch as staffing and capacity, and study project feasibilitysuch as the financial viability to build a new hotel. Thereexists a significant literature highlighting tourism demandforecasting, but most of it concentrates on traditional timeseries methods. For example, Lim and McAleer [3] useBox-Jenkins’ Autoregressive Integrated Moving Average(ARIMA) model to forecast tourist arrivals to Australiafrom Hong Kong, Malaysia and Singapore. Goh and Law[4] present the use of Seasonal Autoregressive IntegratedMoving Average (SARIMA) and Multivariate Autoregres-sive Integrated Moving Average (MARIMA) time seriesmodels with interventions in forecasting tourism demandusing ten arrival series for Hong Kong. However, to ourknowledge, there no attempts have been made to investi-gate the performance of machine learning models in fore-casting tourism demand except for neural network models.
ICGST-AIML Journal, Volume 8, Special Issue on Computational Methods for the Tourism Industry
1
Neural networks were first applied to forecast tourism de-mand by Law ad Au [5] to forecast Japanese demand fortravel to Honk Kong. Experimental results show that neu-ral network model forecasts outperforms multiple regres-sion, moving average, and exponential smoothing. Lawand Au [6] extend the applicability of neural networksin tourism demand forecasting by applying the multilayerperceptron to tourism demand data. This paper investi-gates how seven different machine learning models canbe applied to the tourism prediction problem. The mod-els we consider are: multi-layer perceptron, radial ba-sis functions, generalized regression neural networks (alsocalled kernel regression), K-nearest neighbor regression,support vector regression, CART classification and regres-sion trees, and Gaussian processes. The rest of the paperis organized as follows. Section (2) presents a brief de-scription of the compared models. Section (3) describesthe details of the experimental setup. Section (4) presentsthe analysis of the results, and finally concluding remarksare provided in Section (5).
2 Models
For each considered machine learning model, there areseveral variations proposed in the literature, hence it wouldbe difficult to consider all such variations. Therefore, wefocus our action only on the basic versions of the models.Below is a brief description of the models considered.
2.1 Multilayer Perceptron Neural Network(MLP)
The multilayer perceptron (often simply called neural net-work) is perhaps the most popular network architecture inuse today both for classification and regression. The net-work has a simple interpretation as a form of input-outputmodel, with the weights and biases being the free param-eters of the model. Such network can model functions ofarbitrary complexity, with the number of hidden nodes de-termining the network complexity. As is typically the casein practice, we consider a network with one hidden layer.Different training algorithms can be used to set the weightsand biases so as to minimize the error of the neural net-work, the most well-known of which is the backpropaga-tion algorithm. A second order optimization method calledLevenberg Marquardt is generally known to be more effi-cient than the basic backpropagation algorithm, and this isthe one we use in our implementation (we use the Matlabfunction trainlm).
2.2 Radial Basis Function Neural Network(RBF)
The radial basis function network is similar in architec-ture to the multilayer network except that the nodes have alocalized activation function (Powell [7], and Moody andDarken [8]). Most commonly, node functions are cho-
sen as Gaussian functions, with the width of the Gaussianfunction controlling the smoothness of the fitted function.The outputs of the nodes are combined linearly to give thefinal network output. Because of the localized nature of thenode functions, other simpler algorithms have been devel-oped for training radial basis networks. The algorithm weuse is the Matlab function newrb. It is based on startingwith a blank network, and sequentially adding nodes untilan acceptable error in the training set is achieved. Specif-ically, we add a node centered around the training patterngiving the maximum error. Then we recompute all the out-put layer weights using the least squares formula. We con-tinue this way until the error limit is reached or the numberof nodes reaches a maximum predetermined value. We se-lect the maximum number to be 25 percent of the trainingset.
2.3 Generalized Regression Neural Network(GRNN)
GRNN is commonly called the Nadaraya-Watson estima-tor or the kernel regression estimator (Nadaraya [9] andWatson [10]). In the machine learning community thename generalized regression neural network is typicallyused. The GRNN model is a nonparametric model wherethe prediction for a given data point x is given by the av-erage of the target outputs of the training data points inthe vicinity of the given point x [11]. The local average isconstructed by weighting the points according to their dis-tance from x, using some kernel function (we have used aGaussian kernel). The estimation is just the weighted sumof the observed responses (or target outputs) given by
y =∑M
m=1 K(x−xm
h )ym∑Mm=1 K(x−xm
h ), (1)
where ym is the target output for training data point xm,and K is the kernel function. The parameter h, called thebandwidth, is an important parameter as it determines thedegree of smoothness of the fit. The algorithm we use isthe Matlab function newgrnn.
2.4 K Nearest Neighbor Regression (KNN)
The K nearest neighbor regression (KNN) method is a non-parametric method that bases its prediction on the targetoutputs of the K nearest neighbors of the given query point.Specifically, given a data point we compute the Euclideandistance between that point and all points in the trainingset. We then pick the closest K training data points andset the prediction as the average of the target output valuesfor these K points. Naturally K is a key parameter in thismethod, and has to be selected with care. A large K willlead to a smoother fit, and therefore a lower variance, ofcourse at the expense of a higher bias, and vice versa fora small K. We built our own KNN procedure using MAT-LAB.
ICGST-AIML Journal, Volume 8, Special Issue on Computational Methods for the Tourism Industry
2
2.5 Classification and Regression Trees(CART)
CART is a model that is based on a hierarchical tree-likepartition of the input space [12]. Specifically, the inputspace is divided into local regions identified in a sequenceof recursive splits. The tree consists of internal decisionnodes and terminal leaves. Given a test data point, a se-quence of tests along the decision nodes starting from theroot node will determine the path along the tree until reach-ing a leaf node. At the leaf node a prediction is made ac-cording to the local model associated with that node. Toimplement CART, we used the Matlab function treefit.
2.6 Support Vector Regression (SVR)
Support vector regression (Scholkopf and Smola [13],[14]) is a successful method based on using a high-dimensional feature space (formed by transforming orig-inal variables), and penalizing the ensuing complexity us-ing a penalty term added to the error function. Considerfirst, for illustration a linear model. Then, the prediction isgiven by
f(x) = wT x + b, (2)
where w is the weight vector, b is the bias and x is theinput vector. Let xm and ym denote respectively the mth
training input vector and target output, m = 1, . . . ,M .The error function is given by
J =12‖w‖2 + C
M∑
m=1
|ym − f(xm)|ε. (3)
The first term in the error function is a term that penalizesthe model complexity. The second term is the ε-insensitiveloss function, defined as
|ym − f(xm)|ε = max{0, |ym − f(xm)| − ε} (4)
It does not penalize errors below ε, allowing it some wig-gle room for the parameters to move to reduce model com-plexity. It can be shown that the solution that minimizesthe error function is given by
f(x) =M∑
m=1
(α∗m − αm)xT
mx + b, (5)
where αm and α∗m are Lagrange multipliers. The training
vectors giving non-zero Lagrange multipliers are calledsupport vectors, and this is a key concept in SVR theory.Non-support vectors do not contribute directly to the solu-tion. This model is extended to the nonlinear case throughthe concept of kernel K, giving a solution:
f(x) =M∑
m=1
(α∗m − αm)K(xT
mx) + b. (6)
A common kernel is the Gaussian kernel. Assume its widthis σK (the standard deviation of the Gaussian function). Inour simulations we used the toolbox provided by Canu etal. [15].
2.7 Gaussian Processes (GP)
Gaussian process regression is based on modeling the ob-served responses of the different training data points (func-tion values) as a multivariate Gaussian random variable.For these function values an a priori distribution is as-sumed that guarantees smoothness properties of the func-tion. Specifically, the correlation between two functionvalues is high if the corresponding input vectors are close(in the Euclidean distance sense) and decays as they gofarther from each other. The posterior distribution of a to-be-predicted function value can then be obtained using theassumed prior distribution using simple probability ma-nipulations. Let V (X,X) denote the covariance matrixbetween the function values, where X is the matrix of in-put vectors of the training set. Let the (i, j)th element ofV (X,X) be V (xi, xj), where xi denotes the ith traininginput vector. A typical covariance matrix is the following:
V (xi, xj) = σ2fe−
‖xi−xj‖2
2α2 . (7)
where σf is the data standard deviation and α is the lengthscale of the covariance function. In addition, some inde-pendent zero-mean noise having standard deviation σn isassumed to be added to the function values to produce theobserved responses (target values). Then, for a given inputvector x∗, the prediction y∗ is derived as
y∗ = E(y∗|X, y, x∗
)= V (x∗,X)T
[V (X,X)+σ2
nI]−1
y,(8)
where y is the vector of target outputs (response values)for the training set. In our simulations we used the toolboxprovided by Rasmussen at al [16].
3 Methodology
3.1 Data and Variables
In this study we use data published in the study made byLaw and Pine to forecast inbound travel demand for HongKong [2]. In their study, Law and Pine aimed to modelyearly demand for travel to Hong Kong in the time spanfrom 1970 to 1999, from the following key tourist originat-ing countries: China, Japan, United States, United King-dom, and Taiwan. Law and Pine assert that demand fortravel to Hong Kong from a particular country can be rep-resented by the following function
Qit = f(t, INCi, RPi,HR,FERi, POPi,MKT ),(9)
where Qit, the dependent variable, represents origin i′s de-mand for travel to Hong Kong at time t, INCi representsincome of origin i at time t, RPi represents prices in HongKong relative to origin i at time t, HR represents averagehotel rate in Hong Kong at time t, FERi represents for-eign exchange rate measured as units of Hong Kong’s cur-rency per unit of origin i′s currency at time t, POPi repre-sents population in origin i at time t, and MKT represents
ICGST-AIML Journal, Volume 8, Special Issue on Computational Methods for the Tourism Industry
3
marketing expenditures to promote Hong Kong tourism in-dustry at time t. Following the mainstream of tourism fore-casting, demand for travel is measured by the total num-ber of visitor arrivals to Hong Kong. Income of an origincountry is represented by the country’s per capita income.Relative price is defined as the ratio of CPI of Hong Kongto that of the origin country. In addition, average hotel rateis used as a proxy variable for the tourists’ costs of livingin Hong Kong. For marketing expenses the budget of theHong Kong Tourist Association is used.
3.2 Data Preprocessing
Data preprocessing can have a siginficant impact on thesubsequent forecasting performance. Data have a varietyof features such as a trend (linear or nonlinear) that canaffect modeling of the data. Based on some experiments,we selected the following preprocessing in the followingorder:
1. Detrending
2. Scaling
The step for detrending is made only for the number oftourist arrivals by simply fitting a linear model and thensubtract it from the the original data to remove the trend.Scaling is widely known as an essential step to have thedata in a suitable range. Particularly for the neural networkmodels to prevent node saturation by high input values. Wehave used linear scaling to have every input and the ourputbetween −1 and 1. Once we calculated the forecasts, wedo the reverse transformation.
3.3 Parameter Determination
For every selected method, there are a number of keyparameters that determine the complexity of the model.Those parameters need to be determined carefully. For ex-ample, the number of hidden nodes for the MLP, the widthsof radial bases for RBF, the number of neighbors for KNN,the widths of the kernels for GRNN, and other parame-ters for SVR and GP that are explained below. We haveused the K-Fold-Validation method for parameter determi-nation. In this method, training set is divided into K equalparts (called folds), the model is trained using the K − 1folds and validated using the Kth fold. Then we rotate thevalidation fold and repeat the whole process for K times.We compute the sum of validation errors for the K times.Then we select the parameter value that gives the minimumvalidation error. Due to the small number of training pointswe have, we use 5-fold-validation. For every model, weconsider a suitable range for the parameter as follows. Forthe number of hidden nodes in the MLP model the range is[0, 3, 5, 7, 9, 11, 13, 15], where 0 nodes means essentially alinear model. For the RBF, the width of the radial bases isselected from the values [2.5, 5, 7.5, 10, 12.5, 15, 17.5, 20].For the GRNN model the kernel width is selected in therange [0.02, 0.05, 0.09, 0.1, 0.3, 0.5, 0.7, 0.9, 1.5]. For the
number of neighbors in the KNN model the candidate val-ues are [2, 4, 6, 8]. For the case of SVM the key parametersthat control the complexity of the model are ε, C, and σK .We have fixed C as ymax as typically done in practice,and we allowed ε and σK to be set using 5-fold valida-tion. We consider a two-dimensional grid of ε and σK us-ing the values σy[0.05, 0.1, 0.25, 0.5, 0.75, 1, 1.25, 1.5] ×σ0[0.05, 0.1, 0.25, 0.5, 0.75, 1, 2, 4]. The term σy is the es-timated noise level in the time series, and it is estimated asthe standard deviation of the output. The term σ2
0 gives ameasure of the spread of the input variables, and is mea-sured as the sum of the variances of the individual inputs.For Gaussian processes there are three key parameters: σf ,σn, and α. We opted for the model selection algorithm pro-posed by Rasmussen and Williams [17]. It is an algorithmthat maximizes the marginal likelihood function. Concern-ing the other less key parameters and model details, weselected them as follows. For MLP, we have used the sig-moidal activation functions for the hidden layer, and a lin-ear output layer. Training is performed for 1000 epochs,using a momentum term 0.2, an adaptive learning rate withinitial value 0.2, an increase step of 1.05 and a decreasestep of 0.7. For RBF’s the maximum number of radialbases is selected as 25% of the size of the training set. ForGRNN and SVR, we used the commonly used Gaussiankernel.
4 Analysis and Results
This study builds seven different machine learning tech-niques to model the recent demand for the key tourist gen-erating countries/regions to Hong Kong. It extends thecomparison conducted by Law and Pine to include dif-ferent machine learning models other than backpropaga-tion neural networks. We include also the time index asan input variable in order to investigate the effect of thetime. Among the available data points for each time se-ries, the first two-thirds (11 for China, and 20 for otherorigins) were selected for model establishment (calibra-tion or training) and the remaining entries were used formodel testing (out of sample set). It should be noted thatthere was a drastic decrease in total tourist arrivals in HongKong since 1997 due to the Asian financial crisis. This por-tion of the time series is part of the test set, so we have astringent test for each model whether it can hold up in thisperiod of drastic structural change. The forecasting qualitywas measured in terms of mean absolute percentage error(MAPE) measured by the following equation
MAPE =1M
M∑
m=1
|ym − ym|ym
, (10)
where ym is the target output and ym is the prediction. Inorder to even out the fluctuations due to the random initialweights for the MLP and the parameter determination us-ing the K-fold-valiation approach, we repeated the wholeprocess 20 times. In each run, we shuffle the training setrandomly, then estimate the parameter values, train the
ICGST-AIML Journal, Volume 8, Special Issue on Computational Methods for the Tourism Industry
4
models, and finaly make the out of sample prediction. Forthe MLP, we select the best of five trained models basedon the training error.
Table (1) shows the average MAPE for the 20 runs forevery considered method and for every originating coun-try. Table (1) represents the results when time index isincluded as an input variable. The last two columns in thetable represent the weighted average error MAPE and theaverage standard deviation for every considered method onall the datasets (for all originating country). We use theweighted average instead of average because the size ofChina test set is smaller than those of the other datasets.From these results, it is clear that machine learning meth-ods differ siginficantly in performance. There is no domi-nant method which performed the best for all the datasets.Results are quite acceptable considering the small size ofthe datasets. Most machine learning models require largedatasets for model training. Another issue that has to beconsidered is the Asian crisis that happened in mid 1997. Itis known that such catastrophic events perturb the tourismindustry with respect to historical trends. This can ofcourse complicate the forecasting problem and affect theperformance. Including the time index as an input can beused to account for the trend existing in the data. Althoughwe make detrending as a preprocessing step, time indexcan help for the nonlinear trend which can not be removedby simply subtracting the linear trend. On average, GRNNperformed the best for the five datasets, followed by KNN,GP. Then comes RBF and SVR, which were very closeto each other and finally MLP and CART. The relativelybad performance of the MLP compared to other methodsis perhaps because of the small size of the training set rel-ative to the higher number of inputs. The highly nonlinearnature of the data requires more training data points for theMLP to be able to model such nonlinearity. However, theMLP results are numerically consistent with the findingsin Law and Pine’s study. Of course, because of the smallsize of the data, the obtained ranking should not indicategeneral ranking of the different methods for general fore-casting problems, and implies only ranking of the methodsw.r.t. the considered data only. The standard deviations forMLP, RBF and CART represent the highest standard devi-ations among all the methods. This is because those meth-ods are highly diverse models in which small changes ob-tained by shuffling the data at each run, will produce differ-ent trained models. However, GRNN, KNN,SVR, and GPare considered more stable methods, so their standard de-viations across the 20 runs are very low. Frechtling consid-ers forecasts with MAPE values of less than 10% as highlyaccurate forecasting, between 10% and 20% as good fore-casting, between 20% and 50% as reasonable forecasting,and larger than 50% as inaccurate forecasting [1]. Fromthese results, GRNN was the only method that achievedthree highly accuarte foreacsting, one good forecasting,and only one reasonable forecasting. KNN, MLP, GP, andRBF did not attain any inaccurate forecasting. However,SVR and CART got only one inaccurate forecasting re-garding Taiwan dataset.
5 Conclusion
We investigated how different machine learning modelscan be applied in the tourism prediction problem to makepredictions for tourism demand to Hong Kong. We fo-cused on seven commonly used machine learning tech-niques. Additionaly, we investigated the effect of the timeindex when it has been included as an input variable. Al-though this study is limited both in the number of originat-ing countries, time span, and sample sizes, the findingsshould be of use to tourism practioners and researcherswho are interested in forecasting using machine learningmethods. Machine learning models were not widely usedin tourism demand forecasting except for multi-layer per-ceptron models. Our findings reflect that machine learningmodels other than MLP models can give a more satisfac-tory performance in particular when the available data arevery small. There is no method that can be considered thebest one for all the datasets.
Acknowledgement
This work is part of the Data Mining for ImprovingTourism Revenue in Egypt research project within theEgyptian Data Mining and Computer Modeling Center ofExcellence.
References
[1] D. C. Frechtling, Forecasting Tourism Demand:Methods and Strategies, Oxford: Butterworth-Heinemann, 2001.
[2] R. Law and R. Pine, Tourism Demand Forecasting forthe Tourism Industry: A Neural Network Approach,In Neural Networks in Business Forecasting G. P.Zhang ED., Idea group Inc., 2004.
[3] C. Lim and M. McAleer, Time series forecasts ofinternational travel demand for Australia, TourismManagement, 23, 389–396, 2002.
[4] C. Goh and R. Law, Modeling and forecastingtourism demand for arrivals with stochastic nonsta-tionary seasonality and intervention, Tourism Man-agement, 23, 499–510, 2002.
[5] R. Law and N. Au, A neural network model toforecast Japanese demand for travel to Hong Kong,Tourism Management, 20, 89–97, 1999.
[6] R. Law and N. Au, Back-propagation learning inimproving the accuracy of neural network-basedtourism demand forecasting, Tourism Management,21, 331–340, 2000.
[7] M. J. D. Powell, Radial basis functions for multivari-able interpolation: A review In Algorithms for Ap-proximation, J. C. Mason and M. G. Cox, Eds., Ox-ford: Clarendon, 143–168, 1987.
ICGST-AIML Journal, Volume 8, Special Issue on Computational Methods for the Tourism Industry
5
[8] J. E. Moody and C. Darken, Fast learning in net-works of locally-tuned processing units, Neural Com-putation 1, 281–294, 1989.
[9] E. A. Nadaraya, On estimating regression, Theory ofProbability and its Applications 10, 186–190, 1964.
[10] G. S. Watson, Smooth regression analysis, Sankhy,Series A 26, 359–372, 1964.
[11] W. Hardle, Applied Nonparametric Regression,Econometric Society Monographs, 19, CambridgeUniversity Press, 1990.
[12] L. Breiman, Classification and Regression Trees,Chapman & Hall, Boca Raton, 1993.
[13] B. Scholkopf and A. J. Smola, Learning with Ker-nels: Support Vector Machines, Regularization, Op-timization, and Beyond, MIT Press, 2001.
[14] A. J. Smola, and B. Scholkopf, A Tutorial on Sup-port Vector Regression, NeuroCOLT Technical Re-port, TR-98-030, 2003.
[15] S. Canu, Y. Grandvalet, V. Guigue, and A. Rako-tomamonjy, SVM and Kernel Methods Matlab Tool-box, Perception Systèmes et Information, INSA deRouen, Rouen, France, 2005.
[16] C. E. Rasmussen, and C. K. L. Williams, Gaus-sian Process Regression & Classification Package,http://www.GaussianProcess.org/gpml/code , 2006.
[17] C. E. Rasmussen, and C. K. L. Williams, GaussianProcesses for Machine Learning, MIT Press, 2006.
ICGST-AIML Journal, Volume 8, Special Issue on Computational Methods for the Tourism Industry
6
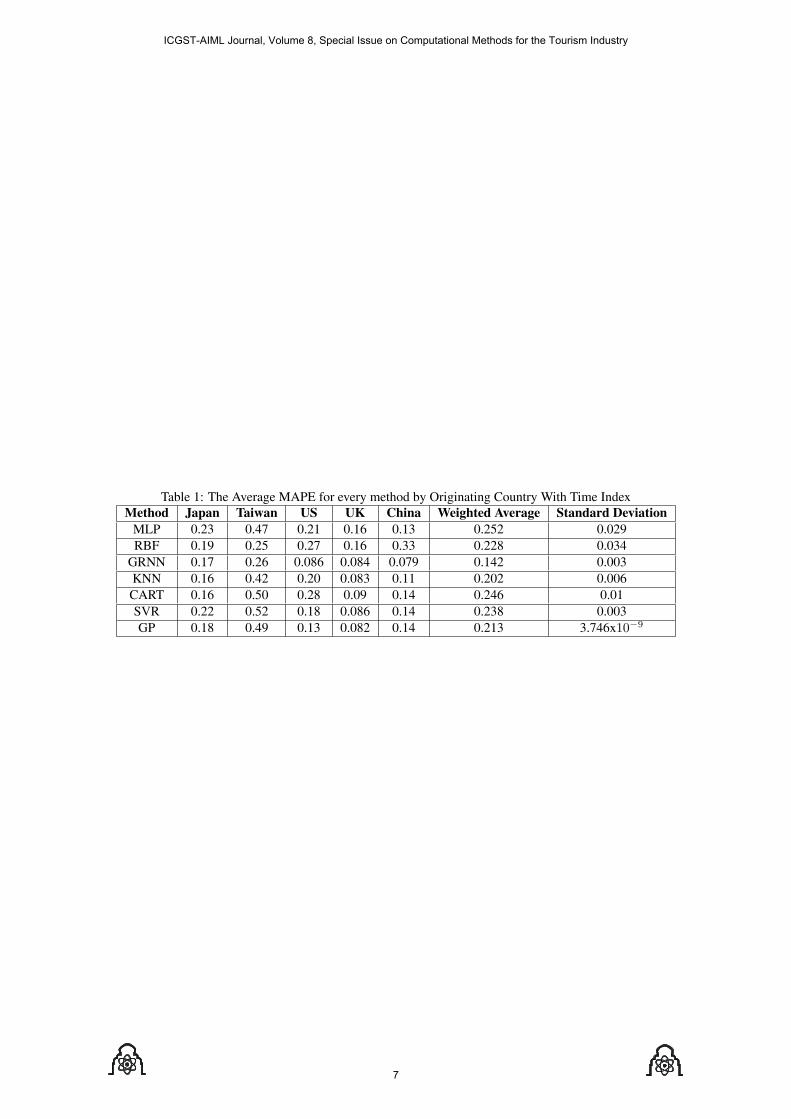
Table 1: The Average MAPE for every method by Originating Country With Time IndexMethod Japan Taiwan US UK China Weighted Average Standard DeviationMLP 0.23 0.47 0.21 0.16 0.13 0.252 0.029RBF 0.19 0.25 0.27 0.16 0.33 0.228 0.034
GRNN 0.17 0.26 0.086 0.084 0.079 0.142 0.003KNN 0.16 0.42 0.20 0.083 0.11 0.202 0.006CART 0.16 0.50 0.28 0.09 0.14 0.246 0.01SVR 0.22 0.52 0.18 0.086 0.14 0.238 0.003GP 0.18 0.49 0.13 0.082 0.14 0.213 3.746x10⁻⁹
ICGST-AIML Journal, Volume 8, Special Issue on Computational Methods for the Tourism Industry
7

ICGST-AIML Journal, Volume 8, Special Issue on Computational Methods for the Tourism Industry
8
A Futures Studies Tool to Anticipate the Impacts of Wildcards on the Future of
the Tourism Industry in Egypt
Nedaa Agami and Mohamed Saleh Decision Support Department, Cairo University
[email protected] and [email protected] http://www.fci.cu.edu.eg
Ahmed Omran
The Central Lab for Agriculture Expert Systems Department of Knowledge Engineering and Expert System Building Tools
http://www.claes.sci.eg
Hisham El-Shishiny Advanced Technology and Center for Advanced Studies
IBM Cairo Technology Development Center [email protected]
http://www.ibm.com/ibm/cas Abstract An 'exploratory futures studies' activity attempts to draw a holistic or systemic map of the future, in a certain domain. Such a map is based on insights developed by examining trends, mega-trends (i.e. trends that extend over many generations), potential trends (i.e. trends that can emerge in future), early warning indicators, possible future events, wildcards (i.e. low probability but high impact events; e.g. 11 Sept.), limits & saturation effects, emerging forces and actors, and various dynamic factors that can lead to various scenarios (i.e. alternative possible futures). As an 'exploratory futures studies' activity is a more comprehensive activity than a forecast (which merely predicts a single state or timeline) it has to integrate both quantitative and qualitative methods. This paper is a concept paper about a web-based futures studies tool that specifically focuses on assessing the impacts of wildcards on the future revenues of the tourism industry, in Egypt. This tool complements the forecasting module of the ongoing project of "Data Mining for improving the tourism industry revenue in Egypt" (funded by the Data Mining and Computer Modeling Center of Excellence, Ministry of Communications and Information Technology) in two distinct aspects. First, the tool adds a qualitative aspect by utilizing an advanced qualitative futures studies method, called Real-Time Delphi Survey, in order to estimate probabilities and impacts associated with wildcards based on experts' opinions. In this project,
experts are weighted according to various attributes. Second, the tool generates various scenarios (not just a single forecast) by modifying the extrapolation of historical trends in view of expectations about future wildcards. This is done by utilizing an advanced quantitative futures studies method, called trend impact analysis. Keywords: Futures Studies, Tourism, Trend Impact Analysis, Real-Time Delphi, and Wildcards. 1. Introduction People have always wanted to get a preview, an early glimpse of what the future holds. All of us, individuals, organizations, corporations, authorities or ministries make plans and anticipate the future in our daily lives. All of our experience is in the past but all of our decisions are about the future. Many people have assumed that their past experience is a fairly reliable guide to the future. However, the pace of change now makes it clear to thoughtful people that continuity can no longer be taken for granted because we are confronted by true uncertainties. There is no one preordained future that is fated to occur, and can be predicted. Rather, the rational way of thinking is to explore many different possible alternative futures (i.e. scenarios). That is the basic idea futures studies paradigm is based on, and what makes it different than traditional forecasting techniques which are purely quantitative, and predict a single future.
ICGST-AIML Journal, Volume 8, Special Issue on Computational Methods for the Tourism Industry
9
In fact, the futures studies paradigm is drastically different than forecasting. Futures studies paradigm is a multi-disciplinary research of change, trends, mega trends, driving forces, emerging counter forces and uncertainties in all major areas of life to find the interacting dynamics that are creating the future by conducting not only quantitative but also qualitative analysis which adds value and power to the results. As Glenn and Gordon -- the founders of the Millennium project -- put it: "As historians are supposed to tell us what happened and journalists tell us what is happening, futurists tell us what could happen and help us to think about what we might want to become. Futurists do not know what will happen. They do not claim prophesy. But they do claim to know more about a range of possible and desirable futures and how these futures might evolve. Methods of futures research do not produce completely accurate or complete descriptions of the future, but they do help show what is possible, illuminate policy choices, identify and evaluate alternative actions, and, at least to some degree, avoid pitfalls and grasp the opportunities of the future"[7]. The purpose of future studies is to systematically explore, create, and test both possible and desirable futures to improve plans. It includes analysis of how those conditions might change as a result of the implementation of policies and actions, and the consequences of these policies and actions. Based on the literature survey that we made [2,7,8,10,15,16], we postulate the following 7 basic philosophical assumptions as the hard core of futures studies paradigm.
1. You cannot know the future, but a range of possible futures can be known.
2. The likelihood of a future event or condition can be changed by policy, and policy consequences can be forecasted.
3. Gradations of foreknowledge and probabilities can be made; we can be more certain about the sunrise than about the rise of the stock market.
4. Humans will have more influence on the future than they did before.
5. Forecasts will be inaccurate and incomplete. As Herman Khan – the founder of the scenario method – puts it: "The most surprising future is one which contains no surprises" [7].
6. No single method should be trusted; hence, cross referencing methods improves foresight.
7. Anticipation and planning must be dynamic and able to respond to new information and insights.
These hard core assumptions can be associated with Lakatos’ theory of science; Lakatos called the set of basic assumptions of any programme, the hard core of the programme. He defined the hard core of a programme as the defining characteristic of a programme. According to Lakatos, “the hard core of a programme is rendered unfalsifiable by the methodological decision of it protagonists” [1]. The rest of this paper is organized as follows: In section 2, we briefly explain the problem addressed. In section 3, we outline the solution proposed. Finally, in section 4, we conclude.
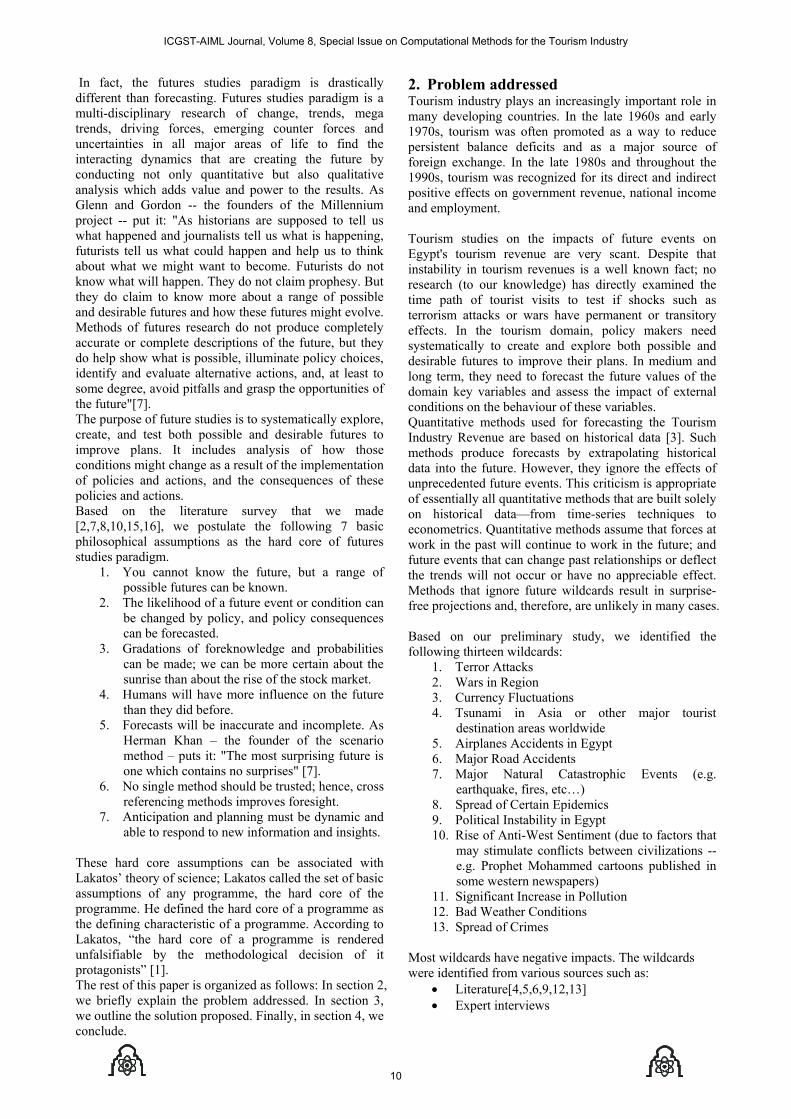
2. Problem addressed Tourism industry plays an increasingly important role in many developing countries. In the late 1960s and early 1970s, tourism was often promoted as a way to reduce persistent balance deficits and as a major source of foreign exchange. In the late 1980s and throughout the 1990s, tourism was recognized for its direct and indirect positive effects on government revenue, national income and employment. Tourism studies on the impacts of future events on Egypt's tourism revenue are very scant. Despite that instability in tourism revenues is a well known fact; no research (to our knowledge) has directly examined the time path of tourist visits to test if shocks such as terrorism attacks or wars have permanent or transitory effects. In the tourism domain, policy makers need systematically to create and explore both possible and desirable futures to improve their plans. In medium and long term, they need to forecast the future values of the domain key variables and assess the impact of external conditions on the behaviour of these variables. Quantitative methods used for forecasting the Tourism Industry Revenue are based on historical data [3]. Such methods produce forecasts by extrapolating historical data into the future. However, they ignore the effects of unprecedented future events. This criticism is appropriate of essentially all quantitative methods that are built solely on historical data—from time-series techniques to econometrics. Quantitative methods assume that forces at work in the past will continue to work in the future; and future events that can change past relationships or deflect the trends will not occur or have no appreciable effect. Methods that ignore future wildcards result in surprise-free projections and, therefore, are unlikely in many cases. Based on our preliminary study, we identified the following thirteen wildcards:
1. Terror Attacks 2. Wars in Region 3. Currency Fluctuations 4. Tsunami in Asia or other major tourist
destination areas worldwide 5. Airplanes Accidents in Egypt 6. Major Road Accidents 7. Major Natural Catastrophic Events (e.g.
earthquake, fires, etc…) 8. Spread of Certain Epidemics 9. Political Instability in Egypt 10. Rise of Anti-West Sentiment (due to factors that
may stimulate conflicts between civilizations -- e.g. Prophet Mohammed cartoons published in some western newspapers)
11. Significant Increase in Pollution 12. Bad Weather Conditions 13. Spread of Crimes
Most wildcards have negative impacts. The wildcards were identified from various sources such as:
• Literature[4,5,6,9,12,13] • Expert interviews
ICGST-AIML Journal, Volume 8, Special Issue on Computational Methods for the Tourism Industry
10
• Articles from local newspapers (e.g. articles published, each Sunday, in the tourism dedicated page in Al-Masry Al-Youm newspaper).
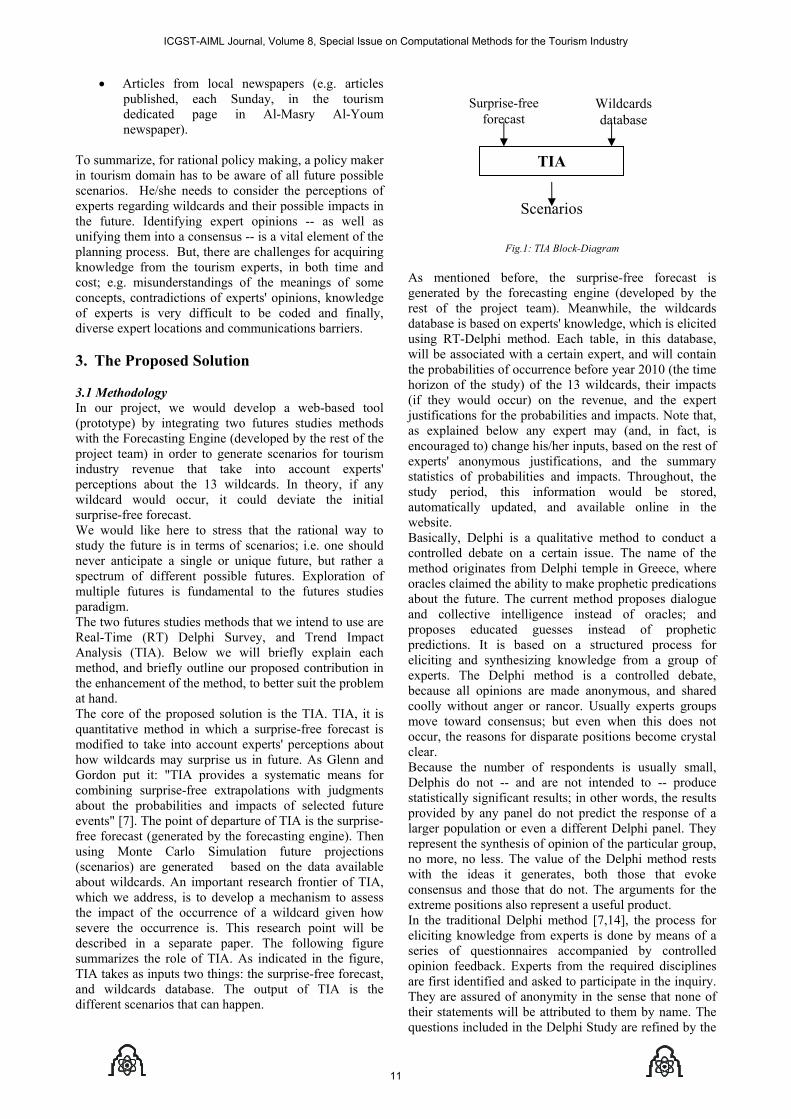
To summarize, for rational policy making, a policy maker in tourism domain has to be aware of all future possible scenarios. He/she needs to consider the perceptions of experts regarding wildcards and their possible impacts in the future. Identifying expert opinions -- as well as unifying them into a consensus -- is a vital element of the planning process. But, there are challenges for acquiring knowledge from the tourism experts, in both time and cost; e.g. misunderstandings of the meanings of some concepts, contradictions of experts' opinions, knowledge of experts is very difficult to be coded and finally, diverse expert locations and communications barriers. 3. The Proposed Solution 3.1 Methodology In our project, we would develop a web-based tool (prototype) by integrating two futures studies methods with the Forecasting Engine (developed by the rest of the project team) in order to generate scenarios for tourism industry revenue that take into account experts' perceptions about the 13 wildcards. In theory, if any wildcard would occur, it could deviate the initial surprise-free forecast. We would like here to stress that the rational way to study the future is in terms of scenarios; i.e. one should never anticipate a single or unique future, but rather a spectrum of different possible futures. Exploration of multiple futures is fundamental to the futures studies paradigm. The two futures studies methods that we intend to use are Real-Time (RT) Delphi Survey, and Trend Impact Analysis (TIA). Below we will briefly explain each method, and briefly outline our proposed contribution in the enhancement of the method, to better suit the problem at hand. The core of the proposed solution is the TIA. TIA, it is quantitative method in which a surprise-free forecast is modified to take into account experts' perceptions about how wildcards may surprise us in future. As Glenn and Gordon put it: "TIA provides a systematic means for combining surprise-free extrapolations with judgments about the probabilities and impacts of selected future events" [7]. The point of departure of TIA is the surprise-free forecast (generated by the forecasting engine). Then using Monte Carlo Simulation future projections (scenarios) are generated based on the data available about wildcards. An important research frontier of TIA, which we address, is to develop a mechanism to assess the impact of the occurrence of a wildcard given how severe the occurrence is. This research point will be described in a separate paper. The following figure summarizes the role of TIA. As indicated in the figure, TIA takes as inputs two things: the surprise-free forecast, and wildcards database. The output of TIA is the different scenarios that can happen.
Fig.1: TIA Block-Diagram
As mentioned before, the surprise-free forecast is generated by the forecasting engine (developed by the rest of the project team). Meanwhile, the wildcards database is based on experts' knowledge, which is elicited using RT-Delphi method. Each table, in this database, will be associated with a certain expert, and will contain the probabilities of occurrence before year 2010 (the time horizon of the study) of the 13 wildcards, their impacts (if they would occur) on the revenue, and the expert justifications for the probabilities and impacts. Note that, as explained below any expert may (and, in fact, is encouraged to) change his/her inputs, based on the rest of experts' anonymous justifications, and the summary statistics of probabilities and impacts. Throughout, the study period, this information would be stored, automatically updated, and available online in the website. Basically, Delphi is a qualitative method to conduct a controlled debate on a certain issue. The name of the method originates from Delphi temple in Greece, where oracles claimed the ability to make prophetic predications about the future. The current method proposes dialogue and collective intelligence instead of oracles; and proposes educated guesses instead of prophetic predictions. It is based on a structured process for eliciting and synthesizing knowledge from a group of experts. The Delphi method is a controlled debate, because all opinions are made anonymous, and shared coolly without anger or rancor. Usually experts groups move toward consensus; but even when this does not occur, the reasons for disparate positions become crystal clear. Because the number of respondents is usually small, Delphis do not -- and are not intended to -- produce statistically significant results; in other words, the results provided by any panel do not predict the response of a larger population or even a different Delphi panel. They represent the synthesis of opinion of the particular group, no more, no less. The value of the Delphi method rests with the ideas it generates, both those that evoke consensus and those that do not. The arguments for the extreme positions also represent a useful product. In the traditional Delphi method [7,14], the process for eliciting knowledge from experts is done by means of a series of questionnaires accompanied by controlled opinion feedback. Experts from the required disciplines are first identified and asked to participate in the inquiry. They are assured of anonymity in the sense that none of their statements will be attributed to them by name. The questions included in the Delphi Study are refined by the
TIA
Surprise-free forecast
Wildcards database
Scenarios
ICGST-AIML Journal, Volume 8, Special Issue on Computational Methods for the Tourism Industry
11
researchers, and pursued through a number of sequential rounds of questionnaires. After the first round of questionnaire, the analysis would identify the range of opinions about each specific question. In a second questionnaire, the range would be presented to the group, and persons holding opinions at the extremes of the range would be asked to reassess their opinions in view of the group's range and provide reasons for their positions. These reasons would be synthesized by the researchers at the end of round two; the synthesized reasons would form the basis for the third questionnaire. In this third questionnaire, the new group judgment would be presented to the participants, along with reasons for the extreme opinions. Each member of the group would be asked to reassess his or her position in view of the reasons presented. They might also be asked to refute, if appropriate, the extreme reasons with any facts at their disposal. In a fourth and final round, these arguments would be presented, along with the evolving group consensus, and a reassessment requested. The new approach, in Delphis (which we adopted in this project), is the RT-Delphi. Basically, it is a round-less Delphi conducted online on the internet [11]. In RT-Delphis, each time, an expert visits the website, he/she views his/her own earlier responses, and can modify the responses, based on the new averages, medians, distributions, and reasons given by other experts for their positions. The information on the website is automatically updated whenever any new input is entered from any participant. A RT- Delphi has the following 5 advantages (in comparison to traditional Delphis): 1. Significantly saves time and cost; as it eliminates the
huge manual effort needed to send questionnaires, collect responses, and assemble data, in each round of the study.
2. Experts can reassess their positions as frequent as they want.
3. Experts can be selected from any place in the world, and can have instantaneous access to the website.
4. Flexibility in the number of participants (no matter how many).
5. It can be easily applied to problems formulated in a matrix design (like our case, where wildcards can be considered as rows and the components of revenues as columns).
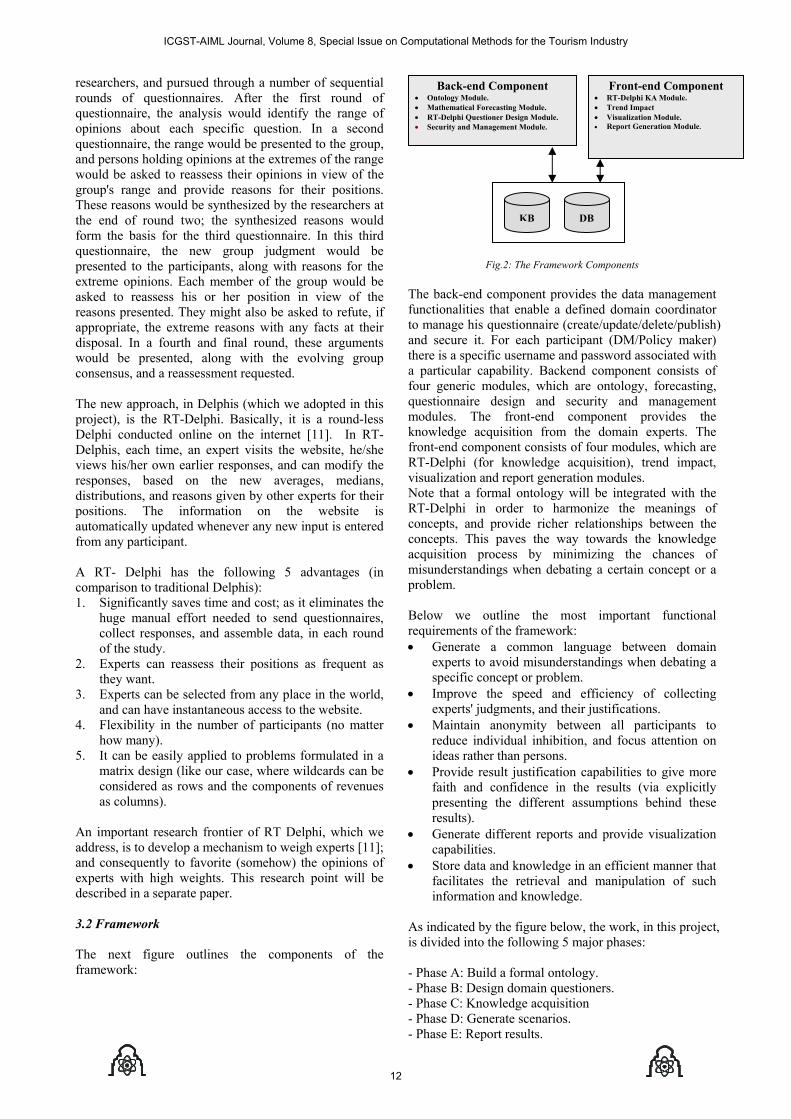
An important research frontier of RT Delphi, which we address, is to develop a mechanism to weigh experts [11]; and consequently to favorite (somehow) the opinions of experts with high weights. This research point will be described in a separate paper. 3.2 Framework The next figure outlines the components of the framework:
Fig.2: The Framework Components The back-end component provides the data management functionalities that enable a defined domain coordinator to manage his questionnaire (create/update/delete/publish) and secure it. For each participant (DM/Policy maker) there is a specific username and password associated with a particular capability. Backend component consists of four generic modules, which are ontology, forecasting, questionnaire design and security and management modules. The front-end component provides the knowledge acquisition from the domain experts. The front-end component consists of four modules, which are RT-Delphi (for knowledge acquisition), trend impact, visualization and report generation modules. Note that a formal ontology will be integrated with the RT-Delphi in order to harmonize the meanings of concepts, and provide richer relationships between the concepts. This paves the way towards the knowledge acquisition process by minimizing the chances of misunderstandings when debating a certain concept or a problem. Below we outline the most important functional requirements of the framework: • Generate a common language between domain
experts to avoid misunderstandings when debating a specific concept or problem.
• Improve the speed and efficiency of collecting experts' judgments, and their justifications.
• Maintain anonymity between all participants to reduce individual inhibition, and focus attention on ideas rather than persons.
• Provide result justification capabilities to give more faith and confidence in the results (via explicitly presenting the different assumptions behind these results).
• Generate different reports and provide visualization capabilities.
• Store data and knowledge in an efficient manner that facilitates the retrieval and manipulation of such information and knowledge.
As indicated by the figure below, the work, in this project, is divided into the following 5 major phases: - Phase A: Build a formal ontology. - Phase B: Design domain questioners. - Phase C: Knowledge acquisition - Phase D: Generate scenarios. - Phase E: Report results.
Front-end Component • RT-Delphi KA Module. • Trend Impact • Visualization Module. • Report Generation Module.
Back-end Component • Ontology Module. • Mathematical Forecasting Module. • RT-Delphi Questioner Design Module. • Security and Management Module.
DB KB
ICGST-AIML Journal, Volume 8, Special Issue on Computational Methods for the Tourism Industry
12
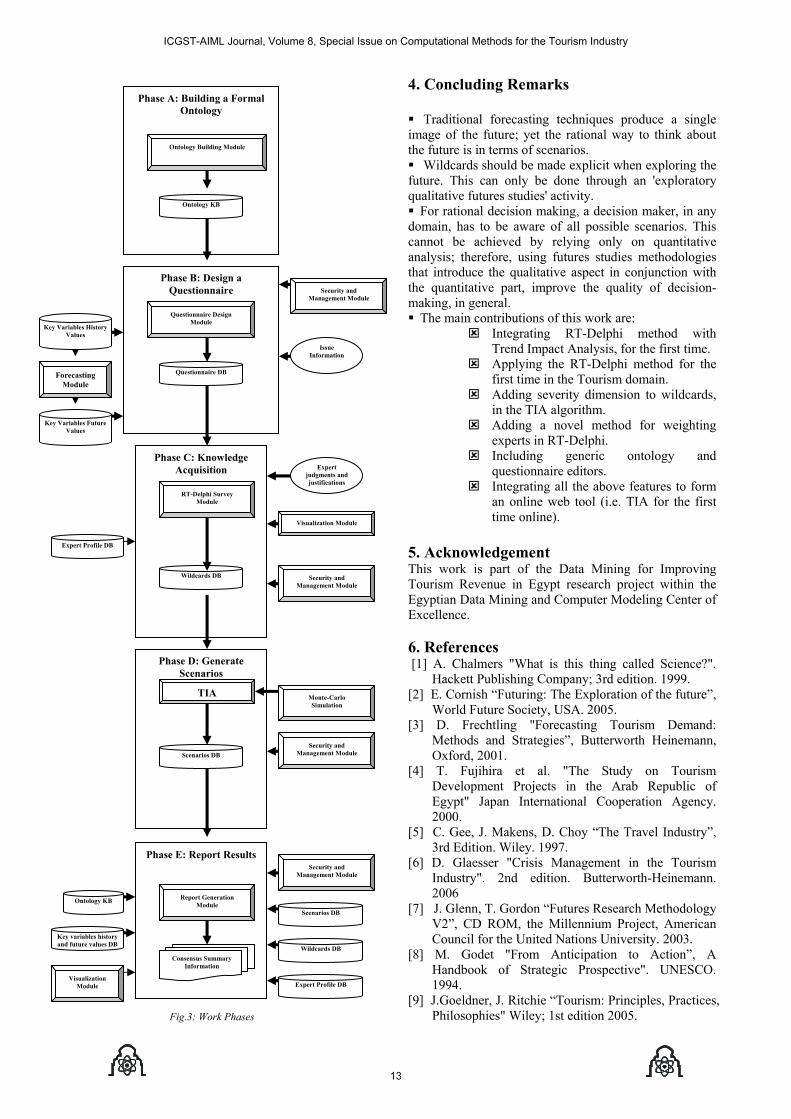
Fig.3: Work Phases
4. Concluding Remarks Traditional forecasting techniques produce a single
image of the future; yet the rational way to think about the future is in terms of scenarios. Wildcards should be made explicit when exploring the
future. This can only be done through an 'exploratory qualitative futures studies' activity. For rational decision making, a decision maker, in any
domain, has to be aware of all possible scenarios. This cannot be achieved by relying only on quantitative analysis; therefore, using futures studies methodologies that introduce the qualitative aspect in conjunction with the quantitative part, improve the quality of decision-making, in general. The main contributions of this work are:
Integrating RT-Delphi method with Trend Impact Analysis, for the first time.
Applying the RT-Delphi method for the first time in the Tourism domain.
Adding severity dimension to wildcards, in the TIA algorithm.
Adding a novel method for weighting experts in RT-Delphi.
Including generic ontology and questionnaire editors.
Integrating all the above features to form an online web tool (i.e. TIA for the first time online).
5. Acknowledgement This work is part of the Data Mining for Improving Tourism Revenue in Egypt research project within the Egyptian Data Mining and Computer Modeling Center of Excellence. 6. References [1] A. Chalmers "What is this thing called Science?".
Hackett Publishing Company; 3rd edition. 1999. [2] E. Cornish “Futuring: The Exploration of the future”,
World Future Society, USA. 2005. [3] D. Frechtling "Forecasting Tourism Demand:
Methods and Strategies”, Butterworth Heinemann, Oxford, 2001.
[4] T. Fujihira et al. "The Study on Tourism Development Projects in the Arab Republic of Egypt" Japan International Cooperation Agency. 2000.
[5] C. Gee, J. Makens, D. Choy “The Travel Industry”, 3rd Edition. Wiley. 1997.
[6] D. Glaesser "Crisis Management in the Tourism Industry". 2nd edition. Butterworth-Heinemann. 2006
[7] J. Glenn, T. Gordon “Futures Research Methodology V2”, CD ROM, the Millennium Project, American Council for the United Nations University. 2003.
[8] M. Godet "From Anticipation to Action”, A Handbook of Strategic Prospective". UNESCO. 1994.
[9] J.Goeldner, J. Ritchie “Tourism: Principles, Practices, Philosophies" Wiley; 1st edition 2005.
Visualization Module
Wildcards DB
TIA
Scenarios DB
Report Generation Module
Consensus Summary Information
Phase A: Building a Formal Ontology
Phase B: Design a Questionnaire
Key Variables History Values
Forecasting Module
Key Variables Future Values
Questionnaire Design Module
Issue Information
Security and Management Module
Questionnaire DB
Phase C: Knowledge Acquisition
RT-Delphi Survey Module
Expert judgments and justifications
Security and Management Module
Phase D: Generate Scenarios
Security and Management Module
Monte-Carlo Simulation
Phase E: Report Results Security and
Management Module
Scenarios DB
Wildcards DB
Key variables history and future values DB
Expert Profile DB
Ontology KB
Ontology Building Module
Ontology KB
Visualization Module
Expert Profile DB
ICGST-AIML Journal, Volume 8, Special Issue on Computational Methods for the Tourism Industry
13
[10] T. Gordon, J. Glenn, A. Jakil “Frontiers of futures research: What’s next? ”, Technological Forecasting and Social Change, Volume 72, Issue 9, Pages 1064-1069. 2005.
[11] T. Gordon and A. Pease “RT Delphi: An Efficient, “Round-less” Almost Real Time Delphi Method”. Technological Forecasting and Social Change, Volume 73, Issue 4, Pages 321-333. 2006.
[12] G. Hassanen "International Tourists Demand and Tourism Development in Egypt". [in Arabic]. Alexandria University. 1994.
[13] N. Kamel “Impact of Catastrophic Events on Tourism Demand in Egypt”, [to be published], 2007.
[14] H. Linstone, M. Turoff, “The Delphi Method Techniques and Applications", Addison-Wesley. 1975.
[15] J. Ramos “Action research and futures studies” Futures, Volume 38, Issue 6, Pages 639-641. 2006
[16] P. Schwartz "The Art of the Long View: Planning for the Future in an Uncertain World". Currency. 1996.
ICGST-AIML Journal, Volume 8, Special Issue on Computational Methods for the Tourism Industry
14
A Comparative Study of the Pickup Method and its VariationsUsing a Simulated Hotel Reservation Data
Athanasius Zakhary, Neamat El GayarFaculty of Computers and Information
Cairo University, Giza, [email protected], [email protected],
Amir F. AtiyaDept Computer EngineeringCairo University, Giza, Egypt
AbstractDetailed forecasts are major inputs to modern Hotel Rev-enue Management Systems. Accurate forecasts are cru-cial to improve rate and availability recommendations forrooms. The data used for hotel demand forecasting arebased on current booking activities (Reservations), his-torical information regarding daily arrivals or rooms sold.Bookings are recent data that if used adequately can makethe forecasting process more responsive to demand shifts.Very little work has been done on forecasting techniquesusing reservation data. In this paper, we examine in moredetails a popular forecasting model that uses reservationdata, referred to in the literature as the “pickup” method.In particular, we present a new framework for the pickuptechnique with 8 different variations and compare the re-sults of these variations using a variety of simulated hotelreservations data.
Keywords: Pickup, Reservation-based Forecasting.
1 IntroductionHotel Revenue Management (RM) is commonly practicedin the hotel industry to help hotels decide on room ratesand allocation. Detailed and accurate forecasts are crucialto good RM [1]. Inaccurate predictions lead to suboptimaldecisions about the rate and availability recommendationsproduced by the RM system, that in turn have a negativeeffect on hotel revenue [2]. Accurate forecasting can alsohelp hotels in better staffing, purchasing and budgeting de-cisions [3].
RM forecasting methods fall into one of three types:historical booking models, advanced booking models andcombined models. Historical booking models consideronly the final number of rooms or arrivals on a particu-lar stay night. Advanced booking models include only
the buildup of reservations over time for a particularstay night. Combined models use either regression or aweighted average of historical models and advanced book-ing models to develop forecasts [1].
Bookings in hotels occur over an extended period oftime. Hotels may take reservations for rooms days, weeksor even months in advance. This so called partial bookingdata, while incomplete, can be very useful in forecasting[4]. Particularly, partial booking data are recent data thatcan reflect demand shifts [5].
The Pickup forecasting model is a popular advancedbooking model which exploits the unique characteristicsof reservation data instead of relying only on complete ar-rival histories to make better forecasts. The main idea ofusing the pickup method is to estimate the increments ofbookings (to come) and then aggregate these incrementsto obtain a forecast of total demand to come [4]. Pickupis defined as the number of reservations picked up froma given point of time to a different point of time over thebooking process [1].
In spite of the fact that the pickup technique is widelyapplied in many Revenue Management applications, verylittle work has been found to discuss the pickup method indetails. Besides, no detailed comparisons on hotel reser-vations data were reported using different variations of thepickup method. This work presents a new framework forthe pickup technique with its different variations and com-pares the results of these variations using a variety of sim-ulated hotel reservations data.
The main goal of using the pickup method in this paperis to forecast the final number of arrivals for every day inthe future within a given horizon. This future may meanthe next month, or any certain period of time.
This paper is organized as follows: In Section (2), thedifferent variations of the pickup method are described.Section (3) presents the data used, experiments conducted
ICGST-AIML Journal, Volume 8, Special Issue on Computational Methods for the Tourism Industry
15
and the error measures used. In Section (4) results are sum-marized and discussed. Finally, concluding remarks aregiven in Section (5).
2 Variations of the Pickup MethodIn this section we present our view of how different pickupmethod variations can be implemented. Variations can beclassified into three distinct groups that identify how datais preprocessed, what portion of the reservation data isused and finally what technique to use for forecasting theincrements. Accordingly, we can group pickup methodinto: Additive or Multiplicative, Classical or Advancedand using Simple Average or Weighted Average forecast-ing techniques. A single choice is to be selected from eachof the above mentioned categories. Each group and its dif-ferent alternatives are discussed in more details in the fol-lowing subsections.
Table (1) shows a typical Cumulative Booking Matrixthat was captured during the May 5th. Question markswere placed in the cells of the bookings to come. Eachrow in this matrix represents the buildup of bookings forthe corresponding arrival date.
2.1 Additive vs. Multiplicative Pickup Vari-ation
Additive pickup techniques assume the number of reserva-tions on hand at a particular day before arrival is indepen-dent of the number of rooms sold and hence add the currentbookings to average pickup to arrive at final bookings [6].On the other hand, the multiplicative pickup techniques as-sume future bookings are proportional to current bookingsand therefore to get the final forecast, current bookings aremultiplied by the average pickup ratio [4].We outline thedifference between the additive and multiplicative Pickuptechniques in more details below.
2.1.1 The Additive Technique
To implement the additive pickup technique, the cumula-tive reservation data (Table (1)) is processed as follows.Each column is subtracted from the column to the left. Theresult is called the incremental or net additive booking ta-ble CAdd
CAddi,j = Ci,j − Ci,j+1, j = 0, 1, ..., h. (1)
where: Ci,j : the number in a cell in row i (arrival date) andcolumn j (days before) in the Cumulative Booking Matrix.Ci,h+1 is implicitly assumed to be 0. Table (2). shows theresulting incremental additive booking table CAdd. Thefinal number of arrivals in a certain day in the future canthen be calculated by summing up the values of the corre-sponding row.
Ai =
h∑
j=0
CAddi,j . (2)
where:
• Ai: the final number of arrivals in day i.
• CAddi,j : the number in the cell in row i and column j
of the net additive booking table.
• h: the length of the booking horizon.
2.1.2 The Multiplicative Technique
For the multiplicative pickup technique, each column inthe cumulative reservation data (Table (1)) is divided bythe column to the right to obtain the incremental or netmultiplicative booking table CMult as shown in Table (3).
Again this procedure can be described mathematicallyas follows:
CMulti,j = Ci,j/Ci,j+1, j = 0, 1, ..., h. (3)
where: Ci,j : the number in a cell in row i (arrival date)and column j (days before) in the Cumulative BookingMatrix. Ci,h+1 is implicitly assumed to be 1.
The obvious limitation of the multiplicative formula(3) is that it can not be used if one or more Ci,j=0. Thisevent is not uncommon.
The final number of arrivals in a certain day in the fu-ture can be calculated by multiplying the values of the cor-responding row.
Ai =
h∏
j=0
CMulti,j . (4)
where:
• Ai: the final number of arrivals in day i.
• CMulti,j : the number in the cell in row i and column
j of the net multiplicative booking table.
• h: the length of the booking horizon.
2.2 Classical vs. Advanced Pickup MethodIn the classical pickup method, only the booking data forcompleted booking curves are used in the forecasting pro-cess [1]. In the above tables, only booking data of days un-til day 4 is used in the forecasting phase. Incomplete book-ing data of days from May 5th and later will not be used inthe forecasting phase. The Classical pickup method henceignores available information of incomplete arrival datesthat might be useful[6].
The Advanced pickup method, on the other hand, usesall the available complete and incomplete booking data [1]in the forecasting phase and hence uses reservation data of“arrival dates” that still did not occur.
2.3 Simple Average vs. Weighted AveragePickup Method
The goal of the pickup method is to ultimately estimatethe increments of the bookings for all the days to come in
ICGST-AIML Journal, Volume 8, Special Issue on Computational Methods for the Tourism Industry
16
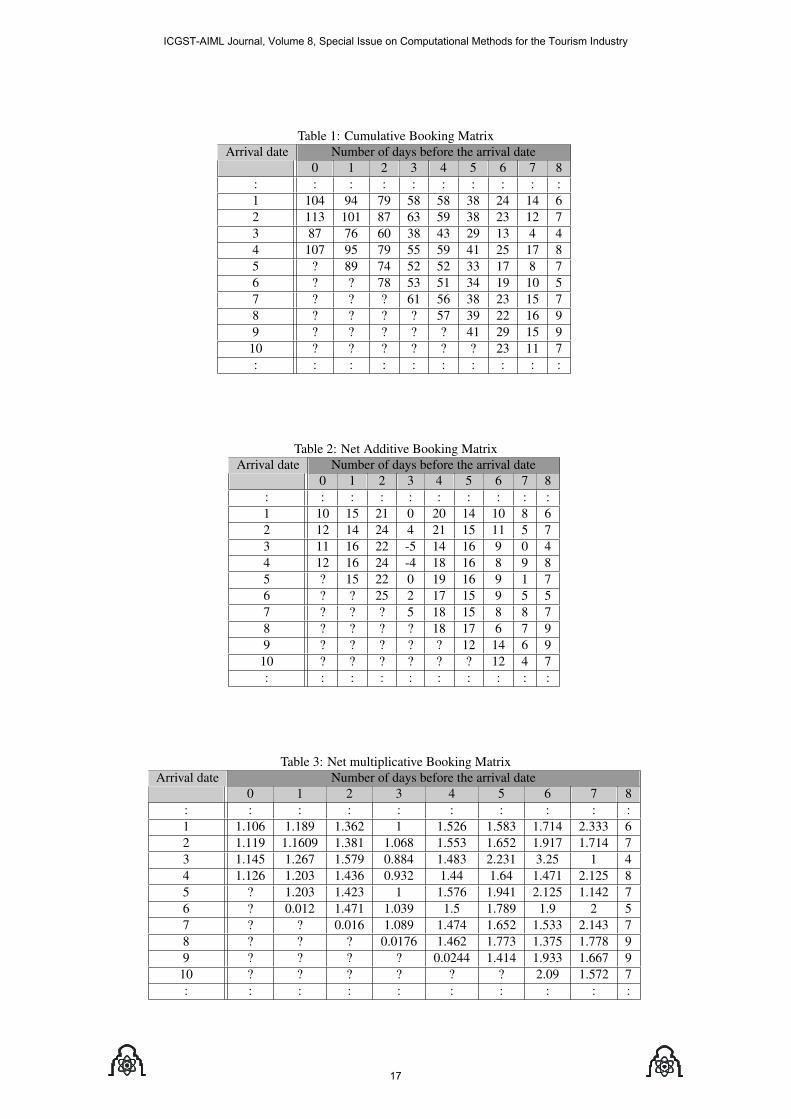
Table 1: Cumulative Booking MatrixArrival date Number of days before the arrival date
0 1 2 3 4 5 6 7 8: : : : : : : : : :1 104 94 79 58 58 38 24 14 62 113 101 87 63 59 38 23 12 73 87 76 60 38 43 29 13 4 44 107 95 79 55 59 41 25 17 85 ? 89 74 52 52 33 17 8 76 ? ? 78 53 51 34 19 10 57 ? ? ? 61 56 38 23 15 78 ? ? ? ? 57 39 22 16 99 ? ? ? ? ? 41 29 15 9
10 ? ? ? ? ? ? 23 11 7: : : : : : : : : :
Table 2: Net Additive Booking MatrixArrival date Number of days before the arrival date
0 1 2 3 4 5 6 7 8: : : : : : : : : :1 10 15 21 0 20 14 10 8 62 12 14 24 4 21 15 11 5 73 11 16 22 -5 14 16 9 0 44 12 16 24 -4 18 16 8 9 85 ? 15 22 0 19 16 9 1 76 ? ? 25 2 17 15 9 5 57 ? ? ? 5 18 15 8 8 78 ? ? ? ? 18 17 6 7 99 ? ? ? ? ? 12 14 6 9
10 ? ? ? ? ? ? 12 4 7: : : : : : : : : :
Table 3: Net multiplicative Booking MatrixArrival date Number of days before the arrival date
0 1 2 3 4 5 6 7 8: : : : : : : : : :1 1.106 1.189 1.362 1 1.526 1.583 1.714 2.333 62 1.119 1.1609 1.381 1.068 1.553 1.652 1.917 1.714 73 1.145 1.267 1.579 0.884 1.483 2.231 3.25 1 44 1.126 1.203 1.436 0.932 1.44 1.64 1.471 2.125 85 ? 1.203 1.423 1 1.576 1.941 2.125 1.142 76 ? 0.012 1.471 1.039 1.5 1.789 1.9 2 57 ? ? 0.016 1.089 1.474 1.652 1.533 2.143 78 ? ? ? 0.0176 1.462 1.773 1.375 1.778 99 ? ? ? ? 0.0244 1.414 1.933 1.667 910 ? ? ? ? ? ? 2.09 1.572 7: : : : : : : : : :
ICGST-AIML Journal, Volume 8, Special Issue on Computational Methods for the Tourism Industry
17
order to estimate the total arrivals in the future [4]. Thiscorresponds to forecasting all the unknown values (indi-cated by question marks) in Table (1) for all the days inthe forecasting period.
The forecasting phase proceeds column by column ac-cording to the following equation:
fj =
e∑
i=s
ωijCij , j = 0, 1, ..., h. (5)
where:
• s: is the index of the start value in the column to beused. It represents the date of the first day we havereservation data for.
• e: is the index of the end value. In the classicalpickup, e is constant and it represents the index ofthe most recent completed arrival date. For the ad-vanced pickup, e represents the index of the lastknown value in the current column.
• Cij : a value in a cell in Table (2) or Table (3) thatcorresponds to row (arrival date) i and column (daysbefore) j.
• ωij : is the weight that represents the degree of influ-ence of Cij on the forecast. If the weights of all theelements Cij are set to be equal; then the forecastingtechnique would correspond to the simple averagemethod.
• fj : the forecasted value used to estimate the un-known values in column j.
It is only possible to fill the first unknown value, thenuse it with the previously known cells above it to forecastthe next cell underneath it and so on. This will make nodifference if the simple averaging is used.
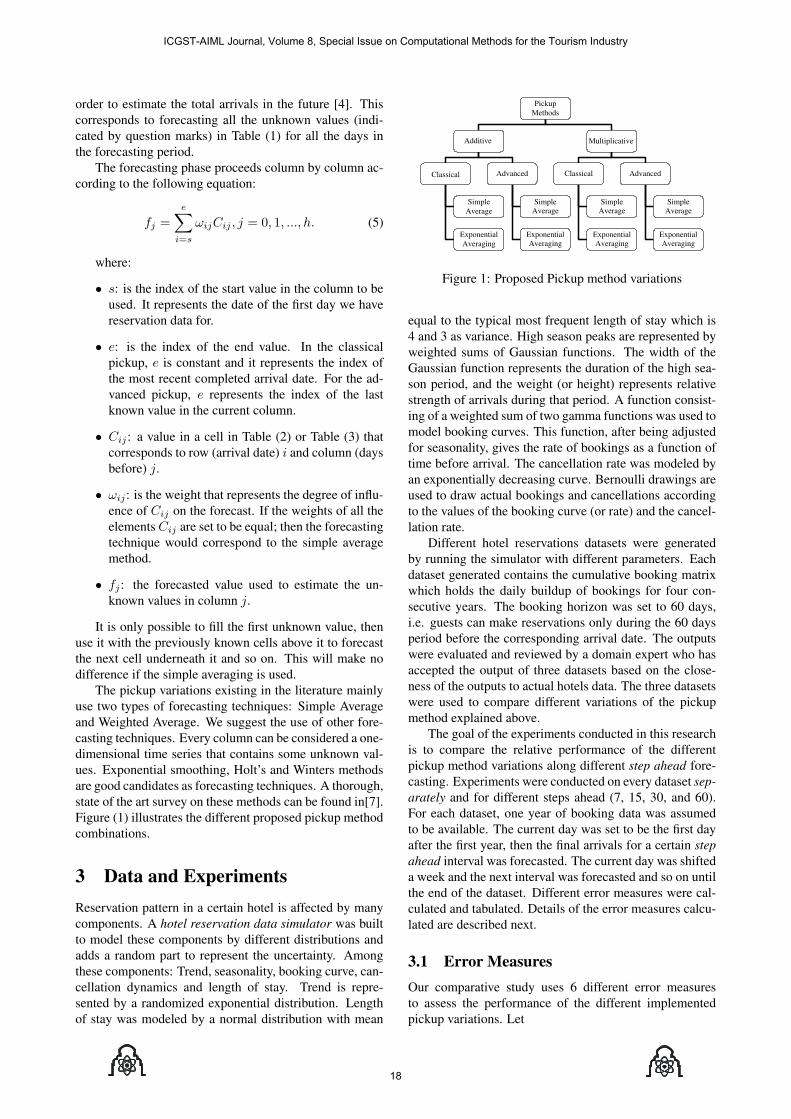
The pickup variations existing in the literature mainlyuse two types of forecasting techniques: Simple Averageand Weighted Average. We suggest the use of other fore-casting techniques. Every column can be considered a one-dimensional time series that contains some unknown val-ues. Exponential smoothing, Holt’s and Winters methodsare good candidates as forecasting techniques. A thorough,state of the art survey on these methods can be found in[7].Figure (1) illustrates the different proposed pickup methodcombinations.
3 Data and ExperimentsReservation pattern in a certain hotel is affected by manycomponents. A hotel reservation data simulator was builtto model these components by different distributions andadds a random part to represent the uncertainty. Amongthese components: Trend, seasonality, booking curve, can-cellation dynamics and length of stay. Trend is repre-sented by a randomized exponential distribution. Lengthof stay was modeled by a normal distribution with mean
Pickup Methods
Additive
Multiplicative
Classical
Advanced
Classical
Advanced
Simple Average
Exponential Averaging
Simple Average
Exponential Averaging
Simple Average
Exponential Averaging
Simple Average
Exponential Averaging
Figure 1: Proposed Pickup method variations
equal to the typical most frequent length of stay which is4 and 3 as variance. High season peaks are represented byweighted sums of Gaussian functions. The width of theGaussian function represents the duration of the high sea-son period, and the weight (or height) represents relativestrength of arrivals during that period. A function consist-ing of a weighted sum of two gamma functions was used tomodel booking curves. This function, after being adjustedfor seasonality, gives the rate of bookings as a function oftime before arrival. The cancellation rate was modeled byan exponentially decreasing curve. Bernoulli drawings areused to draw actual bookings and cancellations accordingto the values of the booking curve (or rate) and the cancel-lation rate.
Different hotel reservations datasets were generatedby running the simulator with different parameters. Eachdataset generated contains the cumulative booking matrixwhich holds the daily buildup of bookings for four con-secutive years. The booking horizon was set to 60 days,i.e. guests can make reservations only during the 60 daysperiod before the corresponding arrival date. The outputswere evaluated and reviewed by a domain expert who hasaccepted the output of three datasets based on the close-ness of the outputs to actual hotels data. The three datasetswere used to compare different variations of the pickupmethod explained above.
The goal of the experiments conducted in this researchis to compare the relative performance of the differentpickup method variations along different step ahead fore-casting. Experiments were conducted on every dataset sep-arately and for different steps ahead (7, 15, 30, and 60).For each dataset, one year of booking data was assumedto be available. The current day was set to be the first dayafter the first year, then the final arrivals for a certain stepahead interval was forecasted. The current day was shifteda week and the next interval was forecasted and so on untilthe end of the dataset. Different error measures were cal-culated and tabulated. Details of the error measures calcu-lated are described next.
3.1 Error MeasuresOur comparative study uses 6 different error measuresto assess the performance of the different implementedpickup variations. Let
ICGST-AIML Journal, Volume 8, Special Issue on Computational Methods for the Tourism Industry
18
1. At : The actual value in the time series at time t.
2. Ft : The forecasted value in the time series at time t.
3. n : The length of the time series.
The following error measures are calculated:
• Mean Absolute Error (MAE): Measures averageabsolute deviation of forecast from the actual.
MAE =1
n
n∑
t=1
|At − Ft| . (6)
• Mean Absolute Percentage Error (MAPE): Theaverage absolute percentage of errors to the actualvalues. Accuracy is expressed as a percentage.
MAPE =1
n
n∑
t=1
∣∣∣∣At − Ft
At
∣∣∣∣ . (7)
• Mean Square Error (MSE): The average of thesquare of the difference between the actual and theforecast.
MSE =1
n
n∑
t=1
(At − Ft)2. (8)
• Root Mean Square Error (RMSE): Expresses thevariance plus the bias of the estimator StandardSquared Error:
RMSE =√
V + B2 (9)
where
B =1
n
n∑
t=1
(At − Ft) (10)
V =1
n − 1
[n∑
t=1
|At − Ft|2− nB2
]. (11)
• Minimum Absolute Error Ratio (MAE Ratio):Calculates the number of times each variation hadthe lowest absolute error, along all the forecasteddays, divided by the number of the whole forecastedarrival points. In case of a tie, the counters of allthe variations with the minimum absolute error areincremented by one.
• Root Mean Square Error Ratio (RMSE Ratio):This is a customized error measure. It is calculatedas follows:
1. For every variation, generate a RMSE bufferwith a length equals the current step ahead.
2. Fill the first cell in that buffer with RMSE forthe first numbers in all the forecasted stepsahead calculated in the current dataset.
3. Repeat until all the cells of the buffer are full.
4 Results and DiscussionAs mentioned before, we conducted our experiments onthree datasets (Dataset1, Dataset2, Dataset3). For everydataset we calculated 6 different error measures for 8 dif-ferent combination of the pickup method. We repeated theexperiments for the different steps ahead (7, 15, 30, 60).Tables (4–7) list the results for Dataset1. Table (8), sum-marize the results obtained for all datasets. In this tablewe ordered the best 3 variations grouped by the Datasetand the step ahead. Choosing the best 3 variations wasbased on the corresponding values of the different errormeasures.
Studying Table (8), we can conclude the follow-ing: Multiplicative variations seem to outperform Addi-tive variations in taking the first place; while additivevariations generally appeared to be more robust. Clas-sical pickup variations outperform advanced variations.Advanced variations failed to appear at all in this tableand have shown poor performance. Although exponen-tial smoothing variations are mostly taking the lead andappear much more than simple average variations, errormeasures of simple average variations are apparently com-parable with the exponential variations.
5 Conclusions and Future WorkIn this paper, we have presented 8 variations of the pickupmethod. Experiments were conducted on 3 simulateddatasets for hotel reservations data. Each variation wasevaluated with 6 different error measures and for differ-ent steps ahead forecasts. Our study shows that classicalpickup variations have outperformed the advanced pickupmethods. On the other hand the “Multiplicative, classi-cal, ExponentialSmoothing” variation has been identifiedas the best technique.
In the future, we intend to use other forecasting tech-niques like Winters and Holt’s method. We also plan toinvestigate other reservation based forecasting models andcompare their performance to the pickup method. Com-bining the results of different pickup variations is to beinvestigated. It would also be valuable to compare theperformance of the pickup method to models that rely onhistorical data only, not taking the reservation informationinto account. Above all, we intend to verify the pickupmethod variations with real data obtained from real reser-vations.
AcknowledgementsThis work is part of the Data Mining for ImprovingTourism Revenue in Egypt research project within theEgyptian Data Mining and Computer Modeling Center ofExcellence. We also would like to acknowledge the usefuldiscussions with Dr Hisham El-Shishiny ( IBM Center forAdvanced Studies in Cairo) and the continuous effort andsuggestions of Professor Ali Hadi (American University of
ICGST-AIML Journal, Volume 8, Special Issue on Computational Methods for the Tourism Industry
19
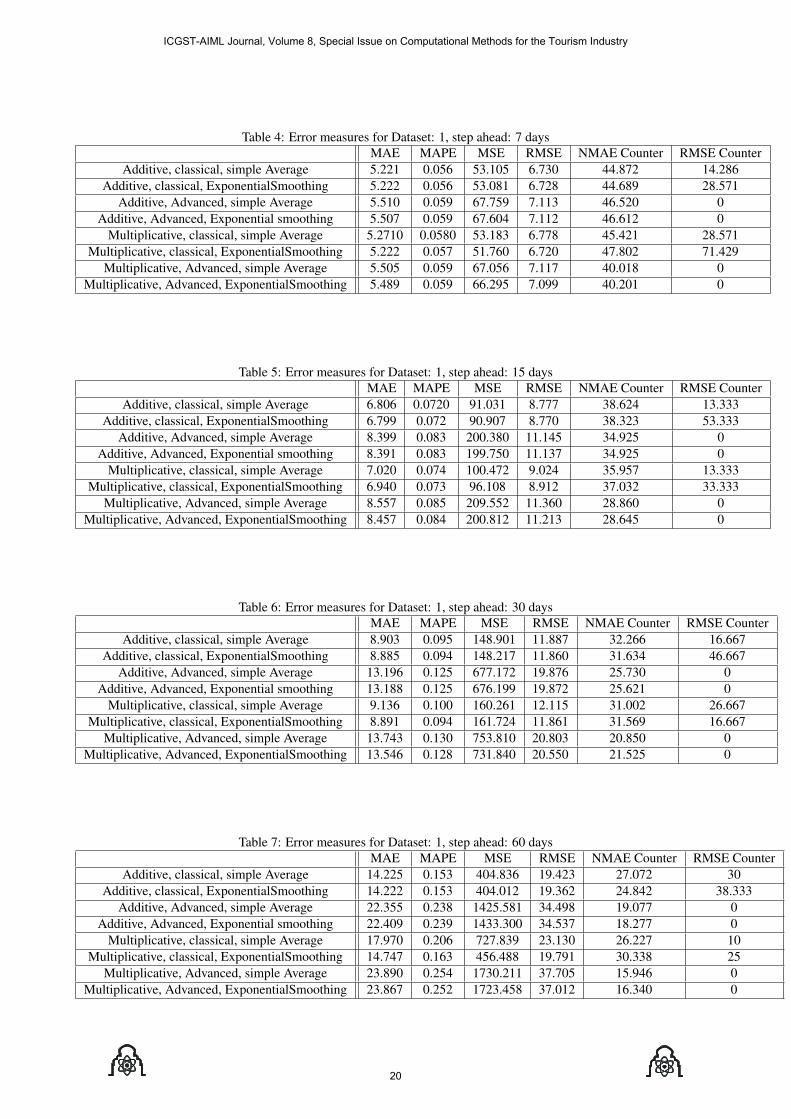
Table 4: Error measures for Dataset: 1, step ahead: 7 daysMAE MAPE MSE RMSE NMAE Counter RMSE Counter
Additive, classical, simple Average 5.221 0.056 53.105 6.730 44.872 14.286Additive, classical, ExponentialSmoothing 5.222 0.056 53.081 6.728 44.689 28.571
Additive, Advanced, simple Average 5.510 0.059 67.759 7.113 46.520 0Additive, Advanced, Exponential smoothing 5.507 0.059 67.604 7.112 46.612 0
Multiplicative, classical, simple Average 5.2710 0.0580 53.183 6.778 45.421 28.571Multiplicative, classical, ExponentialSmoothing 5.222 0.057 51.760 6.720 47.802 71.429
Multiplicative, Advanced, simple Average 5.505 0.059 67.056 7.117 40.018 0Multiplicative, Advanced, ExponentialSmoothing 5.489 0.059 66.295 7.099 40.201 0
Table 5: Error measures for Dataset: 1, step ahead: 15 daysMAE MAPE MSE RMSE NMAE Counter RMSE Counter
Additive, classical, simple Average 6.806 0.0720 91.031 8.777 38.624 13.333Additive, classical, ExponentialSmoothing 6.799 0.072 90.907 8.770 38.323 53.333
Additive, Advanced, simple Average 8.399 0.083 200.380 11.145 34.925 0Additive, Advanced, Exponential smoothing 8.391 0.083 199.750 11.137 34.925 0
Multiplicative, classical, simple Average 7.020 0.074 100.472 9.024 35.957 13.333Multiplicative, classical, ExponentialSmoothing 6.940 0.073 96.108 8.912 37.032 33.333
Multiplicative, Advanced, simple Average 8.557 0.085 209.552 11.360 28.860 0Multiplicative, Advanced, ExponentialSmoothing 8.457 0.084 200.812 11.213 28.645 0
Table 6: Error measures for Dataset: 1, step ahead: 30 daysMAE MAPE MSE RMSE NMAE Counter RMSE Counter
Additive, classical, simple Average 8.903 0.095 148.901 11.887 32.266 16.667Additive, classical, ExponentialSmoothing 8.885 0.094 148.217 11.860 31.634 46.667
Additive, Advanced, simple Average 13.196 0.125 677.172 19.876 25.730 0Additive, Advanced, Exponential smoothing 13.188 0.125 676.199 19.872 25.621 0
Multiplicative, classical, simple Average 9.136 0.100 160.261 12.115 31.002 26.667Multiplicative, classical, ExponentialSmoothing 8.891 0.094 161.724 11.861 31.569 16.667
Multiplicative, Advanced, simple Average 13.743 0.130 753.810 20.803 20.850 0Multiplicative, Advanced, ExponentialSmoothing 13.546 0.128 731.840 20.550 21.525 0
Table 7: Error measures for Dataset: 1, step ahead: 60 daysMAE MAPE MSE RMSE NMAE Counter RMSE Counter
Additive, classical, simple Average 14.225 0.153 404.836 19.423 27.072 30Additive, classical, ExponentialSmoothing 14.222 0.153 404.012 19.362 24.842 38.333
Additive, Advanced, simple Average 22.355 0.238 1425.581 34.498 19.077 0Additive, Advanced, Exponential smoothing 22.409 0.239 1433.300 34.537 18.277 0
Multiplicative, classical, simple Average 17.970 0.206 727.839 23.130 26.227 10Multiplicative, classical, ExponentialSmoothing 14.747 0.163 456.488 19.791 30.338 25
Multiplicative, Advanced, simple Average 23.890 0.254 1730.211 37.705 15.946 0Multiplicative, Advanced, ExponentialSmoothing 23.867 0.252 1723.458 37.012 16.340 0
ICGST-AIML Journal, Volume 8, Special Issue on Computational Methods for the Tourism Industry
20
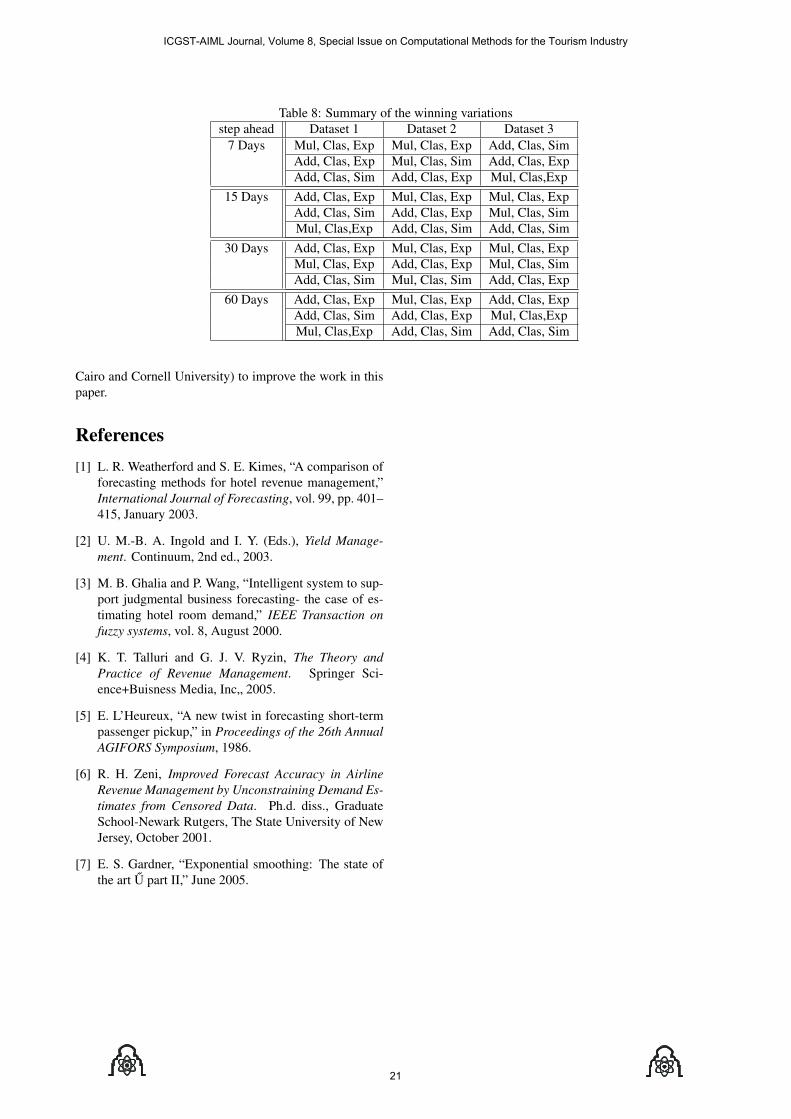
Table 8: Summary of the winning variationsstep ahead Dataset 1 Dataset 2 Dataset 3
7 Days Mul, Clas, Exp Mul, Clas, Exp Add, Clas, SimAdd, Clas, Exp Mul, Clas, Sim Add, Clas, ExpAdd, Clas, Sim Add, Clas, Exp Mul, Clas,Exp
15 Days Add, Clas, Exp Mul, Clas, Exp Mul, Clas, ExpAdd, Clas, Sim Add, Clas, Exp Mul, Clas, SimMul, Clas,Exp Add, Clas, Sim Add, Clas, Sim
30 Days Add, Clas, Exp Mul, Clas, Exp Mul, Clas, ExpMul, Clas, Exp Add, Clas, Exp Mul, Clas, SimAdd, Clas, Sim Mul, Clas, Sim Add, Clas, Exp
60 Days Add, Clas, Exp Mul, Clas, Exp Add, Clas, ExpAdd, Clas, Sim Add, Clas, Exp Mul, Clas,ExpMul, Clas,Exp Add, Clas, Sim Add, Clas, Sim
Cairo and Cornell University) to improve the work in thispaper.
References[1] L. R. Weatherford and S. E. Kimes, “A comparison of
forecasting methods for hotel revenue management,”International Journal of Forecasting, vol. 99, pp. 401–415, January 2003.
[2] U. M.-B. A. Ingold and I. Y. (Eds.), Yield Manage-ment. Continuum, 2nd ed., 2003.
[3] M. B. Ghalia and P. Wang, “Intelligent system to sup-port judgmental business forecasting- the case of es-timating hotel room demand,” IEEE Transaction onfuzzy systems, vol. 8, August 2000.
[4] K. T. Talluri and G. J. V. Ryzin, The Theory andPractice of Revenue Management. Springer Sci-ence+Buisness Media, Inc„ 2005.
[5] E. L’Heureux, “A new twist in forecasting short-termpassenger pickup,” in Proceedings of the 26th AnnualAGIFORS Symposium, 1986.
[6] R. H. Zeni, Improved Forecast Accuracy in AirlineRevenue Management by Unconstraining Demand Es-timates from Censored Data. Ph.d. diss., GraduateSchool-Newark Rutgers, The State University of NewJersey, October 2001.
[7] E. S. Gardner, “Exponential smoothing: The state ofthe art U part II,” June 2005.
ICGST-AIML Journal, Volume 8, Special Issue on Computational Methods for the Tourism Industry
21

ICGST-AIML Journal, Volume 8, Special Issue on Computational Methods for the Tourism Industry
22
A Proposed Decision Support Model for Hotel Revenue ManagementNeamat El Gayar, Abdeltawab M.A. Hendawi, Athanasius Zakhary
Faculty of Computers and Information, Cairo University,Giza, Egypt,
[email protected], [email protected], [email protected],http://www.fci.cu.edu.eg
Hisham El-ShishinyIBM Center for Advanced Studies in Cairo,
IBM Cairo Technology Development Center,[email protected].
Abstract
Revenue Management (RM) is a technique that applieseconomic principles to system variables in order to max-imize revenue. The focus of hotel RM, as perceived bymost hospitality practitioners and researchers, is room rev-enue maximization. Available software products do notuse any high level information and do not use sophisti-cated prediction models. In this paper we propose a con-ceptual RM model that relies on an accurate room demandforecast model and a dynamic room pricing and alloca-tion model. The system also attempts to combine expertknowledge with statistical models to provide a flexible andeffective decision support tool for revenue maximization.
1 Introduction
Revenue Management (RM) is commonly practiced in thehotel industry to help hotels decide on room rate and allo-cation. Hotel revenue management is perceived as a man-agerial tool for room revenue maximization, i.e. for at-tempting to sell each room to the customer who is willingto pay the highest price so as to achieve the highest rev-enue.
With the integration of sophisticated information tech-nology approaches and their effective combination withstatistics, probability, organizational theory and businessexperience and knowledge; new models of Hotel RevenueManagement Systems can be developed and used to pro-vide hotel managers with effective means to achieve anoptimal level of revenue by selling hotel rooms at variousprice levels to different categories of customers [1].
The use of hotel revenue management systems is re-ported to substantially increase revenue of hotels [2]. Inthe same time, existing RM software products do not useany high level information and do not use sophisticated
prediction models. Further development and enhance-ments in hotel RM models is needed and is expected tohave significant impact on the tourism industry.
In this paper we propose a conceptual RM model toprovide hotel managers with an intelligent decision sup-port tool for revenue maximization. The system relieson an accurate room demand forecast model and a dy-namic room pricing and allocation model. The systemalso attempts to combine expert domain knowledge aboutrevenue management with statistical models to provide aflexible and effective decision support system for revenuemanagement.
The paper is organized as follows: Section (2) reviewsthe basic concepts and principles of hotel revenue man-agement. Section (3) introduces the proposed model andoutlines the function of the basic components. Section (4),briefly outlines the system design and requirement process.Finally the paper concludes with Section (5).
2 Background and Motivation
A revenue management system executes two main func-tions: Forecasting and Optimization. The forecasting sys-tem attempts to derive future demand using historical dataand current reservation activities. The optimization func-tion determines rates and allocations according to demand.
The goal of Revenue Management Systems (RMS), bytheir traditional definition, is to generate maximum rev-enue from existing capacity through using different fore-casting techniques, and optimization protocols. As followswe review some of the important principles and researcheffort related to hotel revenue management. We also sum-marize the role of human judgment in the hotel revenueproblem.
ICGST-AIML Journal, Volume 8, Special Issue on Computational Methods for the Tourism Industry
23
2.1 Forecasting Room DemandGenerally speaking, forecasting is an instrumental tool forstrategic decision making in any business activity. Goodforecasts can reduce the uncertainty about the future and,hence, help managers make better decisions.
Detailed and accurate forecasts are crucial to revenuemanagement. Inaccurate predictions lead to suboptimaldecisions about the rate and availability recommendationsproduced by the revenue management system that in turnhave a negative effect on hotel revenue. In addition, ac-curate forecasting can also help hotels in better staffing,purchasing and budgeting decisions [3, 4].
Revenue management forecasting methods fall intoone of three types. Historical booking models, advancedbooking models and combined models. Historical bookingmodels only consider the final number of rooms or arrivalson a particular stay night. Advanced booking models onlyinclude the build up of reservations over time for a partic-ular stay night. Combined models use either regression ora weighted average of historical data and advanced book-ing models to develop forecasts. A review of forecastingmethods for all three types is found in [3, 5].
Weatherford and Kimes in [3] discuss some importantissues that must be addressed other than the choice of theforecasting methods to be used. Among such issues arethe choice of the type of the forecast (arrivals or roomnights), the level of aggregation (total, by rate category, bylength of stay, or some combination), the type of data (con-strained or unconstrained), the amount of data, the treat-ment of outliers and the measurement of accuracy.
In [3] advanced booking models and combination fore-casting methods were used to develop forecast for four ho-tels operated by Choice Hotels. On the other hand, histor-ical booking models, advanced booking models and com-bination forecasting methods were used to develop fore-casts for two hotels operated by the Marriott. This studyidentified exponential smoothing, pickup, moving average,Holt’s method and linear regression methods as the mostrobust.
In [5] a comprehensive survey on available tourismforecasting techniques is presented. Both quantitativeand qualitative forecasting methods are outlined in details.Also in [5] it is suggested how to systematically investi-gate the best forecasting method and model for the givendata and offers some insight on sound data collection andpreprocessing.
Generally, very little work was published on room de-mand forecasting. Research on revenue management fore-casting is mainly based on the airline industry. Most pub-lished work on hotel revenue management systems dealwith room pricing and allocation problem which will beoutlined next.
2.2 Optimal Room Allocation ModelsThe focus of RM, as perceived by most hospitality prac-titioners and researchers, is room revenue maximization.Hotels offer the same rooms to different types of guests.
While hotel managers would like to fill their hotels withhighly profitable guests as much as possible, it is generallynecessary to allow for less profitable guests in order to pre-vent rooms from remaining vacant. An important decisionto be made is whether to accept a booking request and gen-erate revenue now or to reject it in anticipation of a moreprofitable booking request in the future [6]. Finding theright combination of guests in the hotel such that revenuesare maximized is the core topic of revenue management.
Several room inventory allocation models have beenproposed and are being used by hotels as the key compo-nent of their RM systems. The focus of those models is tokeep each room available for the guest who is likely to paythe most for it, while at the same time selling every roomfor the rate above the marginal sales cost.
Revenue management is therefore defined in the hotelindustry as the process of selectively accepting or reject-ing customers by rate, length of stay and arrival date tomaximize revenue [7]; by optimally matching demand toavailable supply (rooms) to accommodate most profitablemix of customers.
Methods for optimal capacity utilization range fromsimple rule-based heuristics to sophisticated mathemati-cal programs with hundreds of decision variables [8]. In[8] a subset of mathematical programming approaches andmarginal revenue approaches are briefly reviewed.
In [9] a comprehensive treatment is provided for theclassic exact and heuristic approaches to single resourcecapacity control. Single resource capacity control dealswith optimally allocating capacity of a hotel room for agiven date at different rate classes. On the other hand, theproblem of managing room capacity on consecutive dayswhen customers stay multiple nights is referred to as thenetwork control capacity problem. This deals with a mixof customers having different lengths of stay and share thecapacity on any given day. The network capacity con-trol problem is significantly more complex than the single-resource problem and therefore its solutions rely mainlyon approximations. In [9] some network capacity controlmethods are discussed in details.
Among the common mathematical programming ap-proaches to determine optimal pricing is deterministic lin-ear programming, probabilistic linear programming andstochastic dynamic programming [10, 11, 12, 13]. Othercommonly used methods for room pricing and allocationthat have also received much attention in the hospitality in-dustry and academia are threshold pricing [9] and expertsystems. However, expert systems are at their best in staticenvironments and few would argue that the hotel environ-ment is static.
The task of optimal room pricing and allocation iscomplicated by the fact that it must be solved repeatedly.Because of this, any solution method must be fast, fairlyaccurate, and not too expensive [8].
ICGST-AIML Journal, Volume 8, Special Issue on Computational Methods for the Tourism Industry
24
2.3 The Role of Human Judgment in RM
One way to improve the accuracy of occupancy forecast-ing models is to consider human judgments. Forecastingscholars and researchers confirm that more accurate pre-dictions can be obtained when quantitative models and ex-pert judgments are combined. This is the case because hu-man judgment supplies additional relevant information andit functions as an independent source [14].
Ghalia and Wang in [10] investigate the role of humanjudgment in business forecasting and take the problem ofestimating future hotel room demand as a practical exam-ple. They mention that all statistical techniques used forforecasting require a series of historical data that can beused in computing the forecast. These techniques dependon the continuity of historical data and may not predict adiscontinuous change in the business environment; for ex-ample, forecasting the room demand for a period that co-incides with the opening of a new competitor in the samearea. In such situations, while historical data might not re-flect the impact of the new competitor on room demand,the hotel manager can come up with a forecast based onsubjective judgments.
Many researchers and practitioners agree that judg-ment should play an important role in forecasting [15].However, there is still a debate about how this role shouldbe played and to what extent [16].
Some researchers suggest that statistical approachesought to be used as tools to provide a first approximationof forecasts using historical data. The role of judgment isto “massage” these forecasts to take into account influenc-ing factors not included in the historical data. Another wayof combining the two approaches is to give more weight toformal quantitative methods when there are no changes inthe environment and more weight to judgmental methodswhen changes do occur [17]. The published work revealsthat there are still problems in deciding how the combi-nation of statistical and judgmental approaches should beachieved. In particular, the role of judgment in the com-bined forecasting has not been made clear and issues ofimplementation have not been carefully addressed [5].
3 Proposed RM ModelIn this section we summarize the main features of the con-ceptual model proposed for a decision support system forhotel revenue management. We also present a preliminarybrief description of the system design and requirement.The system we perceive performs the following functions:
1. Scans historical booking, occupancy patterns andreservations and fits a quantitative forecastingmodel
2. Fitted model arrives to predictions
3. Predictions are used as inputs to an optimizationmodule to make rate and allocation decisions
4. Human judgment and Expert Knowledge are usedto adjust and refine forecasting results and revenuemanagement decisions.
A diagram of the different modules and their interac-tions is depicted in Figure (1).
The proposed system for decision support for revenuemanagement is mainly composed of a forecast module, anoptimization module and a human interaction module thatuses human judgment and expert knowledge.
In the following, we describe the functionality of eachmodule, its input and output variables, the data needed toimplement it and which evaluation method we intend touse in conjunction with the proposed model.
3.1 Demand Forecasting ModuleThe function of this module is to derive future demand us-ing historical data and current reservation activities. Themodel proposed is based on statistical techniques and isdescribed as follows.
Input data used for hotel forecasting has mainly twodimensions: booking information and historical informa-tion on the daily number of arrivals or rooms sold. We useboth data separately and in combination for our forecast.The output from this model is a forecast of the number ofguests arriving on a particular night to the hotel. We gen-erate a detailed forecast based on rate category, length ofstay and possibly room types.
A detailed forecast is essential because research onforecast disaggregation for hotels has shown that detaileddisaggregate forecast outperforms more general aggre-gates forecasts that are further broken down to disaggre-gated level by any reasonable scheme (for example proba-bility distribution).
In general our model is described as follows:
At,i(Cj , Lm, Rk) =α1 ∗ Ht,i,p(Cj , Lm, Rk)
+α2 ∗ Bt,i(Cj , Lm, Rk) (1)+α3 ∗ BCt,i,p(Cj , Lm, Rk)
∀1 ≤ j ≤ S,
1 ≤ m ≤ M,
1 ≤ k ≤ N.
Where:
• α1, α2, α3 are the forecast combination weights,
• C1, C2, ...CS represent the different customer seg-ments considered,
• L1, L2, ...LM represent the different length of stays,
• R1, R2, ...RN represent room types available,
• At,i(Cj , Lm, Rk) is the number of guests from cus-tomer segment Cj expected to arrive at day i for alength of stay Lm and ask for a room type Rk ob-served t days before day i.
ICGST-AIML Journal, Volume 8, Special Issue on Computational Methods for the Tourism Industry
25
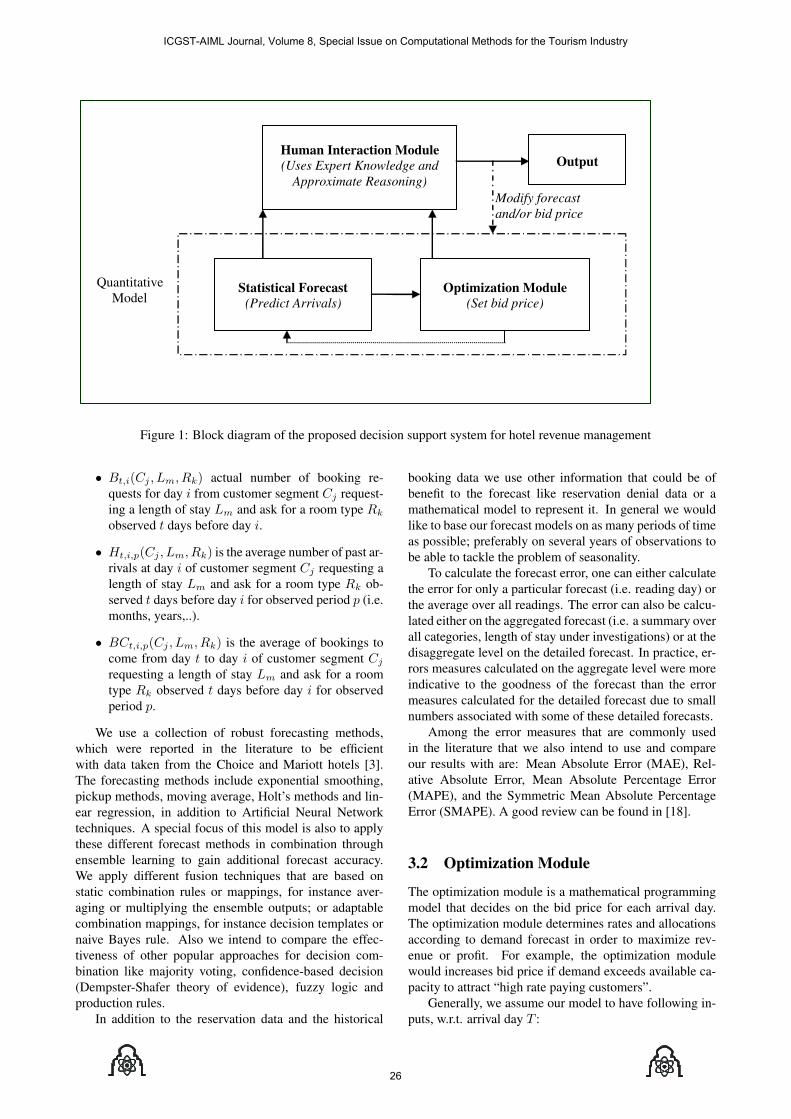
Human Interaction Module (Uses Expert Knowledge and
Approximate Reasoning)
Statistical Forecast
(Predict Arrivals)
Optimization Module
(Set bid price)
Quantitative Model
Modify forecast and /or bid price
Output
Figure 1: Block diagram of the proposed decision support system for hotel revenue management
• Bt,i(Cj , Lm, Rk) actual number of booking re-quests for day i from customer segment Cj request-ing a length of stay Lm and ask for a room type Rk
observed t days before day i.
• Ht,i,p(Cj , Lm, Rk) is the average number of past ar-rivals at day i of customer segment Cj requesting alength of stay Lm and ask for a room type Rk ob-served t days before day i for observed period p (i.e.months, years,..).
• BCt,i,p(Cj , Lm, Rk) is the average of bookings tocome from day t to day i of customer segment Cj
requesting a length of stay Lm and ask for a roomtype Rk observed t days before day i for observedperiod p.
We use a collection of robust forecasting methods,which were reported in the literature to be efficientwith data taken from the Choice and Mariott hotels [3].The forecasting methods include exponential smoothing,pickup methods, moving average, Holt’s methods and lin-ear regression, in addition to Artificial Neural Networktechniques. A special focus of this model is also to applythese different forecast methods in combination throughensemble learning to gain additional forecast accuracy.We apply different fusion techniques that are based onstatic combination rules or mappings, for instance aver-aging or multiplying the ensemble outputs; or adaptablecombination mappings, for instance decision templates ornaive Bayes rule. Also we intend to compare the effec-tiveness of other popular approaches for decision com-bination like majority voting, confidence-based decision(Dempster-Shafer theory of evidence), fuzzy logic andproduction rules.
In addition to the reservation data and the historical
booking data we use other information that could be ofbenefit to the forecast like reservation denial data or amathematical model to represent it. In general we wouldlike to base our forecast models on as many periods of timeas possible; preferably on several years of observations tobe able to tackle the problem of seasonality.
To calculate the forecast error, one can either calculatethe error for only a particular forecast (i.e. reading day) orthe average over all readings. The error can also be calcu-lated either on the aggregated forecast (i.e. a summary overall categories, length of stay under investigations) or at thedisaggregate level on the detailed forecast. In practice, er-rors measures calculated on the aggregate level were moreindicative to the goodness of the forecast than the errormeasures calculated for the detailed forecast due to smallnumbers associated with some of these detailed forecasts.
Among the error measures that are commonly usedin the literature that we also intend to use and compareour results with are: Mean Absolute Error (MAE), Rel-ative Absolute Error, Mean Absolute Percentage Error(MAPE), and the Symmetric Mean Absolute PercentageError (SMAPE). A good review can be found in [18].
3.2 Optimization Module
The optimization module is a mathematical programmingmodel that decides on the bid price for each arrival day.The optimization module determines rates and allocationsaccording to demand forecast in order to maximize rev-enue or profit. For example, the optimization modulewould increases bid price if demand exceeds available ca-pacity to attract “high rate paying customers”.
Generally, we assume our model to have following in-puts, w.r.t. arrival day T :
ICGST-AIML Journal, Volume 8, Special Issue on Computational Methods for the Tourism Industry
26
• No. of arrivals from customer segmentC1, C2, ...CS , with length of stay L1, L2, ...LM
and request room type R1, R2, ...RN (Arrival_noT (Cj , Lm, Rk), for 1 ≤ j ≤ S,1 ≤ m ≤ M , 1 ≤ k ≤ N )
• Number of available rooms of type R1, R2, ...RN attime T , i.e. capacity available.
• Threshold of room price for each market segmentj for a specific room type k, Thj,k , where the bidprice cannot exceed this threshold for this marketsegment for a given room type.
The model will then attempt to give a bid price for eachcustomer segment, length of stay and room type: i.e findBid_price(Cj , Lm, Rk) for 1 ≤ j ≤ S, 1 ≤ m ≤ M ,1 ≤ k ≤ N )
So as to maximize the total revenue at time T :
Totalrev =
S∑
j=1
M∑
m=1
N∑
k=1
Rev(Cj , Lm, Rk) (2)
S.t. Bid_price(Cj , Lm, Rk) ≤ Thj,k
Where Rev(Cj , Lm, Rk) is the revenue generatedfrom customer segment Cj staying Lm nights and request-ing room type Rk.
3.3 Human Judgment and Expert Knowl-edge Module
The role of this module is to encode expert knowledge andjudgment that cannot be taken into account through statis-tical techniques.
This module encapsulates knowledge of hotel man-agers to describe different factors affecting revenue man-agement and forecast based on their experience and ontheir judgment on what their effect is expected to be.Among such factors are seasonality, global economy, spe-cial events occurring, promotions, external competitorsand others.
This component represents an interaction with the ar-rival forecast and price setting system components to assistthe human decision making process.
For the design of this system we intend to collect opin-ions of industrial experts from the hotel industry such asSales Directors, Front office managers, and financial con-trollers and also hotel managers on factors and variables tothe optimal decision making for optimizing revenue man-agement and in which way they can alter the forecast andthe decision of the overall system.
Among factors /variables that can affect the demand ona hotel at time T :
• Booking_level(T ), percentage of rooms bookedfor time T .
• Competitor_BL(T ), is the average booking activ-ities of all competing hotels at time T .
• Event_attractiveness(T ), is an estimate of exis-tence of an event on or around time T .
• Promotional_stategy(T ), is the strength withwhich the hotel management imposes further pro-motions on the normal price at time T .
• Competitor_Promotional_stategy(T ), is thestrength with which the competitors imposepromotions on the normal price at time T .
• Seanonality(T ), identifies whether it is high, reg-ular or low season at time T .
• Price(T ), identifies average price set for rooms attime T .
• Weather_forcast(T ), identifies weather condi-tions at time T .
• Advertizing_actions(T ), identifies whether thehotel adopts any advertising strategies around timeT .
• QoS(T ), quality of service provided by the hotel attime T .
• Buisness_growth(T ), measures the level of busi-ness activities, i.e meetings, interviews for job ap-plicants,... etc. at time T .
4 Comments on System Require-ments and Implementation
The main function of the system is to support day-to- dayand long term decisions concerning revenue managementin hotels.
Preliminary data and functional requirements for thesystem were set as a result of information gathering ef-forts. Information gathering includes interviewing domainexperts, reviewing relevant literature and surveying exist-ing revenue management software.
In the data requirements process, data are identifiedthat will be necessary for the functions required of the sys-tem. Functional requirements, on the other hand, deter-mine the functions and operations that are performed bythe system. An example of such functions are :
• Exploring historical data of reservations and arrivals
• Determining optimal room price and capacity
• Generating reports on occupancy, cancellations, rev-enue, market mix analysis, ..etc
• Conducting sensitivity analysis to parameter anddata variation.
• Interaction with expert to modify system output andexperiment with different scenarios
• Fine tune and modify model
ICGST-AIML Journal, Volume 8, Special Issue on Computational Methods for the Tourism Industry
27
5 Concluding RemarksIn this work we have presented a new RM model that aimsat providing hotel managers with an intelligent decisionsupport tool for hotel room revenue maximization. TheRM model is composed of an advanced room demand fore-cast model, incorporating several statistical and machinelearning forecasting tools and a dynamic room pricing andallocation model. The system also attempts to combine ex-pert domain knowledge about revenue management withstatistical models to provide a flexible and effective deci-sion support system for revenue management. The modelis general purpose; in the context that it needs to be adaptedto suit the hotel environment and the market conditions itwill be applied in. Currently we are working to implementand test the proposed model and verify its usefulness inpractical application.
AcknowledgementsThis work is part of the Data Mining for ImprovingTourism Revenue in Egypt research project within theEgyptian Data Mining and Computer Modeling Center ofExcellence. We would like to express our thanks to Mr.Hossam Shehata for supporting us with the necessary do-main knowledge in the hotel industry to conduct this re-search
References[1] T. Choi and V. Cho, “Towards a knowledge discovery
framework for yield management in hong kong hotelindustry,” Hospitality Management, vol. 19, pp. 17–31, 2000.
[2] H. S. Shehata, “Measuring the concept and prac-tices of revenue management system in egyptian ho-tels,” Master’s thesis, Alexandria University, Facultyof Tourism and Hotels, 2005.
[3] L. R. Weatherford and S. E. Kimes, “A comparisonof forecasting methods for hotel revenue manage-ment,” International Journal of Forecasting, vol. 99,pp. 401–415, January 2003.
[4] K. Brannas, J. Hellstrom, and Nordstrom, “A newapproach to modeling and forecasting monthly guestnights in hotels,” International Journal of Forecast-ing, vol. 18, pp. 19–30, January 2002.
[5] D. Frechtling, Forecasting Tourism Demand: Meth-ods and Strategies. Butterworth Heinemann, Oxford,2001.
[6] P. Goldman, R. Freling, K. Pak, and N. Piersma,“Models and techniques for hotel revenue manage-ment using a rolling horizon,” Tech. Rep. EU 2001-46, Econometric Institute, Erasmus University Rot-terdam, Netherlands, December 2001.
[7] B. Vinod, “Unlocking the value of revenue manage-ment in the hotel industry,” Journal of Revenue andPricing Management, vol. 3, no. 2, pp. 178–190,2004.
[8] U. M.-B. A. Ingold and I. Y. (Eds.), Yield Manage-ment. Continuum, 2nd ed., 2003.
[9] K. T. Talluri and G. J. V. Ryzin, The Theory andPractice of Revenue Management. Springer Sci-ence+Buisness Media, Inc„ 2005.
[10] M. B. Ghalia and P. Wang, “Intelligent system to sup-port judgmental business forecasting- the case of es-timating hotel room demand,” IEEE Transaction onfuzzy systems, vol. 8, August 2000.
[11] G. Gallego and G. Ryzin, “Optimal dynamic pric-ing of inventories with stochastic demand over finitehorizons,” Management Sci, vol. 40, pp. 999–1020,1994.
[12] G. Gallego and G. Ryzin, “A multiproduct dynamicpricing problem and its applications to network yieldmanagement,” Operations Res, vol. 45, no. 1, pp. 24–41, 1997.
[13] L. Weatherford and S. Bodily, “A taxonomy and re-search overview of perishable asset revenue manage-ment,” Operations Res, vol. 40, pp. 831–844, 1992.
[14] Z. Schwartz and E. Cohen, “Hotel revenue-management forecasting,” Cornell Hotel and Restau-rant Administration Quarterly, vol. 45, pp. 85–98,2004.
[15] L. D. Phillips, Judgmental Forecasting, ch. On theadequacy of judgmental forecasts, pp. 11–30. NewYork: Wiley, 1987.
[16] J. C.-S. L. R. Beach and V. Barnes, Judgmental Fore-casting, ch. Assessing human judgment: Has it beendone, can it be done, should it be done?, pp. 49–62.New York: Wiley, 1987.
[17] S. C. W. S. Makridakis and V. E. McGhee, Forecast-ing: Methods and Applications. New York: Wiley,1983.
[18] R. J. H. a and A. B. Koehler, “Another look at mea-sures of forecast accuracy,” International Journal ofForecasting, vol. 22, pp. 679–688, 2006.
ICGST-AIML Journal, Volume 8, Special Issue on Computational Methods for the Tourism Industry
28
Revenue Management System between Awareness and Implementation
A Case Study on Egyptian Hotels
Hossam Said Shehata and Hanan S. Kattara Dept. of Hotel Management
Faculty of Tourism and Hotels, Alexandria University Alexandria, Egypt.
[email protected] and [email protected] http://www.alextourism.net
Mohamed Farid El-Sahn
Dept. of Business Administration Faculty of Commerce, Alexandria University
Alexandria, Egypt. Abstract Nowadays, the challenge facing the hotel managers is how to maximize revenue while at the same time offering a competitively priced service or product that satisfies the customer’s desire to get value for money. This paper aims to determine the degree of success of 5-star hotels in Egypt in implementing Revenue Management System (RMS), the level of hotel managers’ awareness of the importance of applying it and how this awareness may affect the implementation of such a system. An in depth–interview has been conducted with a sample of five star hotels in Egypt. Results proved the existence of an appropriate level of implementation. The level of awareness among mangers proved a need for much effort. Keywords: Revenue Management, Yield Management, Revenue Enhancement, Revenue Management System, Hotels, Egypt. 1. Introduction and background The hospitality industry as an essential component of tourism plays a substantial role in providing income. Thus hotels must be viewed as profit centers where both the property and the customer can exchange their assets; valuable services and money respectively. This money represents revenue, which is considered the main objective leading the whole property, especially in the private sector. The importance of revenue management (RM) and/or yield management (YM) has been argued continuously by researchers. Many studies have been conducted to highlight the effect of applying revenue enhancement strategies on profitability.
Cross [1] confirmed that RM systems can generate annual return on investment reaching 200%. However, the average gross annual return on investment from other information technology systems is only 81%. The concept of YM was only originated with the deregulation of US airline industry in the late 1970s [2]-[7]. In the hotel industry, the concept appeared in the late 1980s [8]-[9]. However, the first attempt for applying such a system is credited to J.W. Bill Marriott, who is considered the pioneer of using RM in hotels [10]-[11]. The RM has been scope of many authors’ research. Gu and Caneen [12] have studied the definitions and the concept of RM, while other authors have analyzed the conditions necessary for the success of the system, namely; the fixed capacity; high fixed costs; low variable costs; perishable inventory; time-varied demand; and similarity of inventory units [13]-[23]. On the other hand, Schwartz [24] criticized all these conditions and mentioned that only one single precondition is required; the perishable nature of inventory units. Kimes [25]-[26] succeeded to determine a group of fundamental ingredients or elements that are prerequisites that include the ability to segment the market according to customer’s payment behavior, having information on historical demand and booking patterns, good knowledge of setting pricing policy, and a well-developed policy concerning overbooking practices, as well as a reliable information system. While Dunn and Brooks [27] criticized the RM system and found that it is only successful in short-term period, however, in the long-term pricing decisions it must be based on profit analysis. Also, Donaghy and others [28] argued that RM would
ICGST-AIML Journal, Volume 8, Special Issue on Computational Methods for the Tourism Industry
29
move from being a revenue maximization tool to a profit generating instrument, if a hotel couples the costs incurred in providing service with an awareness of customer spending behaviors throughout the premises. Furthermore, myths that are commonly related to RM were listed by Lieberman [29] and Quain and others [30] explained ten misconceptions that are commonly associated with revenue enhancement that should be overridden as being the first step in realizing a greater profit. Definitely, airline industry represents the comprehensive example for implementing RMS. The implementation of RM concepts and system had been adopted by many of the major international hotel chains, in the late 1980s and early 1990s. Among chains that use a RMS are Marriott, Hilton Corporation, Hyatt, Holiday Inn, Radisson, Sheraton, and Sonesta [31]-[37]. It is important to mention the work of Jarvis and others [38] who investigated the hotels applying YM in the UK. They found that about 61.3% of the hotels had really adopted YM system. While most of the literature concerning YM concentrated on the application of such system to large hotels and international chains, the way of applying the system to small and medium-sized hotels are also important, since most of this type of business is managed through an independent view of operation and it needs to survive among the market that is unstable and highly competitive [39]. Due to the intense value of RMS in the literature and in the industry, the purpose of this paper was to determine the degree of success of 5-star hotels in Egypt in implementing RMS, the level of hotel managers’ awareness of the importance of applying it and how this awareness may affect the implementation of such a system. Moreover, it was attempted that the actual study’s results might help in providing hospitality industry practitioners with recommendations that could improve the efficiency and effectiveness of performance, and offer academic researchers with guiding for future research. 2. Hypotheses of the study The study tried to testify four main hypotheses, illustrated as follows:
♦ H1: RMS is not a widespread system among hotels in Egypt. • H1a: Chain hotels are more likely to adopt
RMS in comparison to non-chain hotels. • H1b: The implementation of RMS is limited
to rooms’ division inventory only. • H1c: RMS is still a new one in Egyptian 5-
star hotels. ♦ H2: There are some deficiencies in the
implementation of RMS. ♦ H3: There is a misconception toward RMS
among those in charge of the system.
♦ H4: The misconception of RMS affects negatively the implementation of a successful system.
3. Methodology This study is a descriptive-analytical one. A questionnaire and an interview guide have been developed based on a through review of literature and previous empirical studies, in order to test the hypotheses and attain the study objectives. The population of the study included only the 5-star hotels in Egypt that has been defined based on the Egyptian Hotel Guide [40]. The study’s population was limited to this category as it represents the niche of hotels and it is considered to be more capable to adopt such a relatively new trend. Apparently, if 5-star hotels did not apply Revenue Management Systems, the lower categories, undoubtedly, would not. In addition to the fact that this category of hotels is often managed by world-wide chains that usually have the experience and the funds necessary to implement such systems. The field survey was conducted on two stages. In the first stage phone calls were conducted to all 5-star hotels (103 hotels) with the revenue manager, the director of rooms, the reservation manager, the front office manager or the sales and marketing manager. The aim was to determine which hotels are adopting the RMS. During the second stage, the researchers identified five main tourist areas based on the Egyptian Hotel Guide (2004-2005) as subgroups in the population. From each of these areas hotels were randomly selected. Each area was represented in the sample, to a great extent, in accordance with their proportional existence in the population. The stratified random sampling technique was employed. The sample consisted of 67% of the total population (103 hotels). The response rate was 72.5% resulting in 50 hotels that participated in the study. The required information was gathered through conducting self-administrated questionnaires either through face-to-face interviews or over-phone conversations. Questionnaires were e-mailed before making phone conversations with interviewees in order to give them the chance to be prepared for the interview questions. 4. Results and discussion 4.1. Profile of respondents Various types of hotels participated in the study; 26 hotels were beach resorts distributed among RMS-adoption categories as; 13 adopters, 4 semi-adopters, and 9 non-adopters. Likewise, 17 hotels were city center or business hotels, among them 8 hotels have adopted RMS, 6 hotels were considered as semi-adopters, and only 3 were non-adopters. Hotels that described themselves as conference hotels were 5 hotels, whereas only 4 hotels were airport hotels. City resorts were only 6 hotels. Regarding the type of hotel management, all RMS adopters (25 hotels) and semi-adopters (12 hotels)
ICGST-AIML Journal, Volume 8, Special Issue on Computational Methods for the Tourism Industry
30
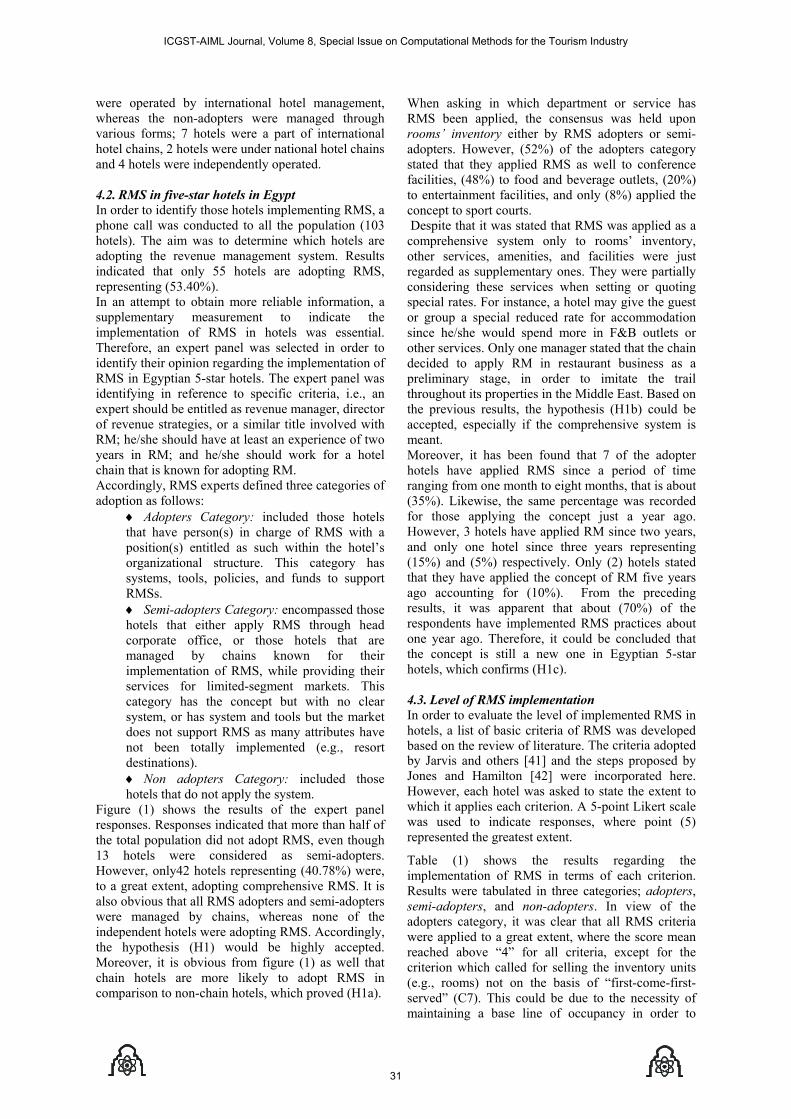
were operated by international hotel management, whereas the non-adopters were managed through various forms; 7 hotels were a part of international hotel chains, 2 hotels were under national hotel chains and 4 hotels were independently operated. 4.2. RMS in five-star hotels in Egypt In order to identify those hotels implementing RMS, a phone call was conducted to all the population (103 hotels). The aim was to determine which hotels are adopting the revenue management system. Results indicated that only 55 hotels are adopting RMS, representing (53.40%). In an attempt to obtain more reliable information, a supplementary measurement to indicate the implementation of RMS in hotels was essential. Therefore, an expert panel was selected in order to identify their opinion regarding the implementation of RMS in Egyptian 5-star hotels. The expert panel was identifying in reference to specific criteria, i.e., an expert should be entitled as revenue manager, director of revenue strategies, or a similar title involved with RM; he/she should have at least an experience of two years in RM; and he/she should work for a hotel chain that is known for adopting RM. Accordingly, RMS experts defined three categories of adoption as follows:
♦ Adopters Category: included those hotels that have person(s) in charge of RMS with a position(s) entitled as such within the hotel’s organizational structure. This category has systems, tools, policies, and funds to support RMSs. ♦ Semi-adopters Category: encompassed those hotels that either apply RMS through head corporate office, or those hotels that are managed by chains known for their implementation of RMS, while providing their services for limited-segment markets. This category has the concept but with no clear system, or has system and tools but the market does not support RMS as many attributes have not been totally implemented (e.g., resort destinations). ♦ Non adopters Category: included those hotels that do not apply the system.
Figure (1) shows the results of the expert panel responses. Responses indicated that more than half of the total population did not adopt RMS, even though 13 hotels were considered as semi-adopters. However, only42 hotels representing (40.78%) were, to a great extent, adopting comprehensive RMS. It is also obvious that all RMS adopters and semi-adopters were managed by chains, whereas none of the independent hotels were adopting RMS. Accordingly, the hypothesis (H1) would be highly accepted. Moreover, it is obvious from figure (1) as well that chain hotels are more likely to adopt RMS in comparison to non-chain hotels, which proved (H1a).
When asking in which department or service has RMS been applied, the consensus was held upon rooms’ inventory either by RMS adopters or semi-adopters. However, (52%) of the adopters category stated that they applied RMS as well to conference facilities, (48%) to food and beverage outlets, (20%) to entertainment facilities, and only (8%) applied the concept to sport courts. Despite that it was stated that RMS was applied as a comprehensive system only to rooms’ inventory, other services, amenities, and facilities were just regarded as supplementary ones. They were partially considering these services when setting or quoting special rates. For instance, a hotel may give the guest or group a special reduced rate for accommodation since he/she would spend more in F&B outlets or other services. Only one manager stated that the chain decided to apply RM in restaurant business as a preliminary stage, in order to imitate the trail throughout its properties in the Middle East. Based on the previous results, the hypothesis (H1b) could be accepted, especially if the comprehensive system is meant. Moreover, it has been found that 7 of the adopter hotels have applied RMS since a period of time ranging from one month to eight months, that is about (35%). Likewise, the same percentage was recorded for those applying the concept just a year ago. However, 3 hotels have applied RM since two years, and only one hotel since three years representing (15%) and (5%) respectively. Only (2) hotels stated that they have applied the concept of RM five years ago accounting for (10%). From the preceding results, it was apparent that about (70%) of the respondents have implemented RMS practices about one year ago. Therefore, it could be concluded that the concept is still a new one in Egyptian 5-star hotels, which confirms (H1c). 4.3. Level of RMS implementation In order to evaluate the level of implemented RMS in hotels, a list of basic criteria of RMS was developed based on the review of literature. The criteria adopted by Jarvis and others [41] and the steps proposed by Jones and Hamilton [42] were incorporated here. However, each hotel was asked to state the extent to which it applies each criterion. A 5-point Likert scale was used to indicate responses, where point (5) represented the greatest extent.
Table (1) shows the results regarding the implementation of RMS in terms of each criterion. Results were tabulated in three categories; adopters, semi-adopters, and non-adopters. In view of the adopters category, it was clear that all RMS criteria were applied to a great extent, where the score mean reached above “4” for all criteria, except for the criterion which called for selling the inventory units (e.g., rooms) not on the basis of “first-come-first-served” (C7). This could be due to the necessity of maintaining a base line of occupancy in order to
ICGST-AIML Journal, Volume 8, Special Issue on Computational Methods for the Tourism Industry
31
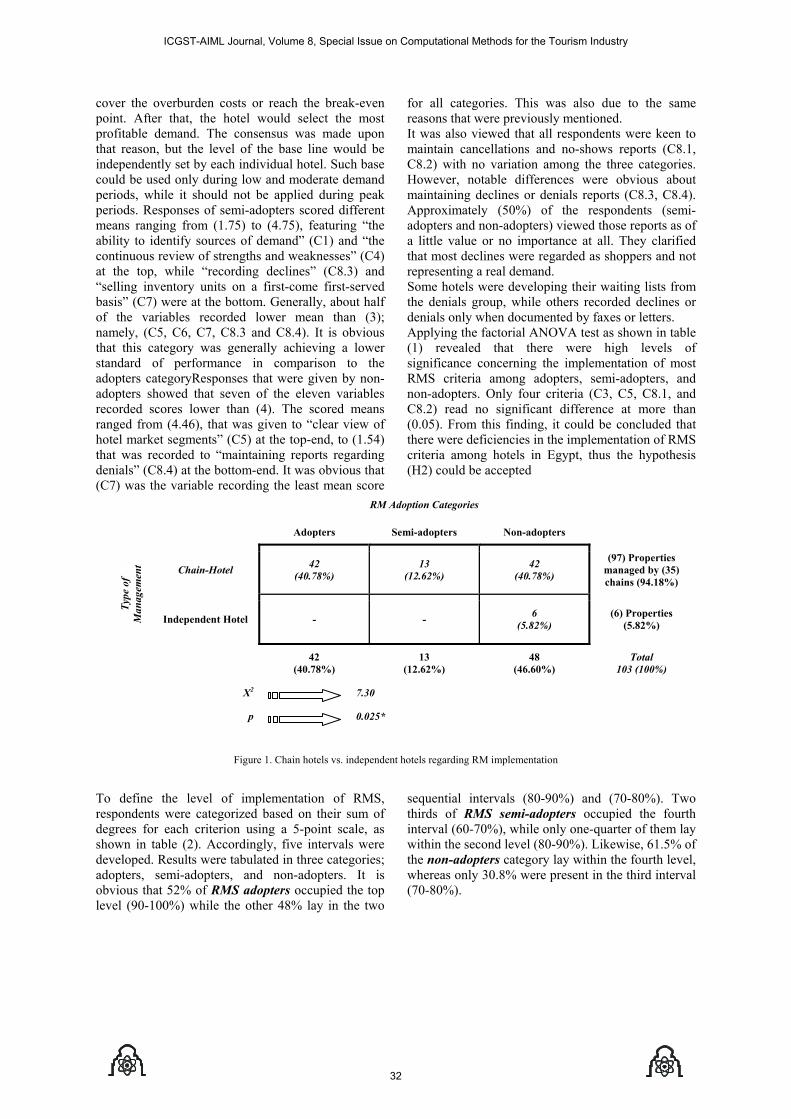
cover the overburden costs or reach the break-even point. After that, the hotel would select the most profitable demand. The consensus was made upon that reason, but the level of the base line would be independently set by each individual hotel. Such base could be used only during low and moderate demand periods, while it should not be applied during peak periods. Responses of semi-adopters scored different means ranging from (1.75) to (4.75), featuring “the ability to identify sources of demand” (C1) and “the continuous review of strengths and weaknesses” (C4) at the top, while “recording declines” (C8.3) and “selling inventory units on a first-come first-served basis” (C7) were at the bottom. Generally, about half of the variables recorded lower mean than (3); namely, (C5, C6, C7, C8.3 and C8.4). It is obvious that this category was generally achieving a lower standard of performance in comparison to the adopters categoryResponses that were given by non-adopters showed that seven of the eleven variables recorded scores lower than (4). The scored means ranged from (4.46), that was given to “clear view of hotel market segments” (C5) at the top-end, to (1.54) that was recorded to “maintaining reports regarding denials” (C8.4) at the bottom-end. It was obvious that (C7) was the variable recording the least mean score
for all categories. This was also due to the same reasons that were previously mentioned. It was also viewed that all respondents were keen to maintain cancellations and no-shows reports (C8.1, C8.2) with no variation among the three categories. However, notable differences were obvious about maintaining declines or denials reports (C8.3, C8.4). Approximately (50%) of the respondents (semi-adopters and non-adopters) viewed those reports as of a little value or no importance at all. They clarified that most declines were regarded as shoppers and not representing a real demand. Some hotels were developing their waiting lists from the denials group, while others recorded declines or denials only when documented by faxes or letters. Applying the factorial ANOVA test as shown in table (1) revealed that there were high levels of significance concerning the implementation of most RMS criteria among adopters, semi-adopters, and non-adopters. Only four criteria (C3, C5, C8.1, and C8.2) read no significant difference at more than (0.05). From this finding, it could be concluded that there were deficiencies in the implementation of RMS criteria among hotels in Egypt, thus the hypothesis (H2) could be accepted
RM Adoption Categories
Adopters Semi-adopters Non-adopters
Chain-Hotel 42 (40.78%)
13 (12.62%)
42 (40.78%)
(97) Properties managed by (35) chains (94.18%)
Type
of
Man
agem
ent
Independent Hotel
- - 6
(5.82%) (6) Properties
(5.82%)
42 (40.78%)
13 (12.62%)
48 (46.60%)
Total 103 (100%)
X2 7.30
p 0.025*
Figure 1. Chain hotels vs. independent hotels regarding RM implementation
To define the level of implementation of RMS, respondents were categorized based on their sum of degrees for each criterion using a 5-point scale, as shown in table (2). Accordingly, five intervals were developed. Results were tabulated in three categories; adopters, semi-adopters, and non-adopters. It is obvious that 52% of RMS adopters occupied the top level (90-100%) while the other 48% lay in the two
sequential intervals (80-90%) and (70-80%). Two thirds of RMS semi-adopters occupied the fourth interval (60-70%), while only one-quarter of them lay within the second level (80-90%). Likewise, 61.5% of the non-adopters category lay within the fourth level, whereas only 30.8% were present in the third interval (70-80%).
ICGST-AIML Journal, Volume 8, Special Issue on Computational Methods for the Tourism Industry
32
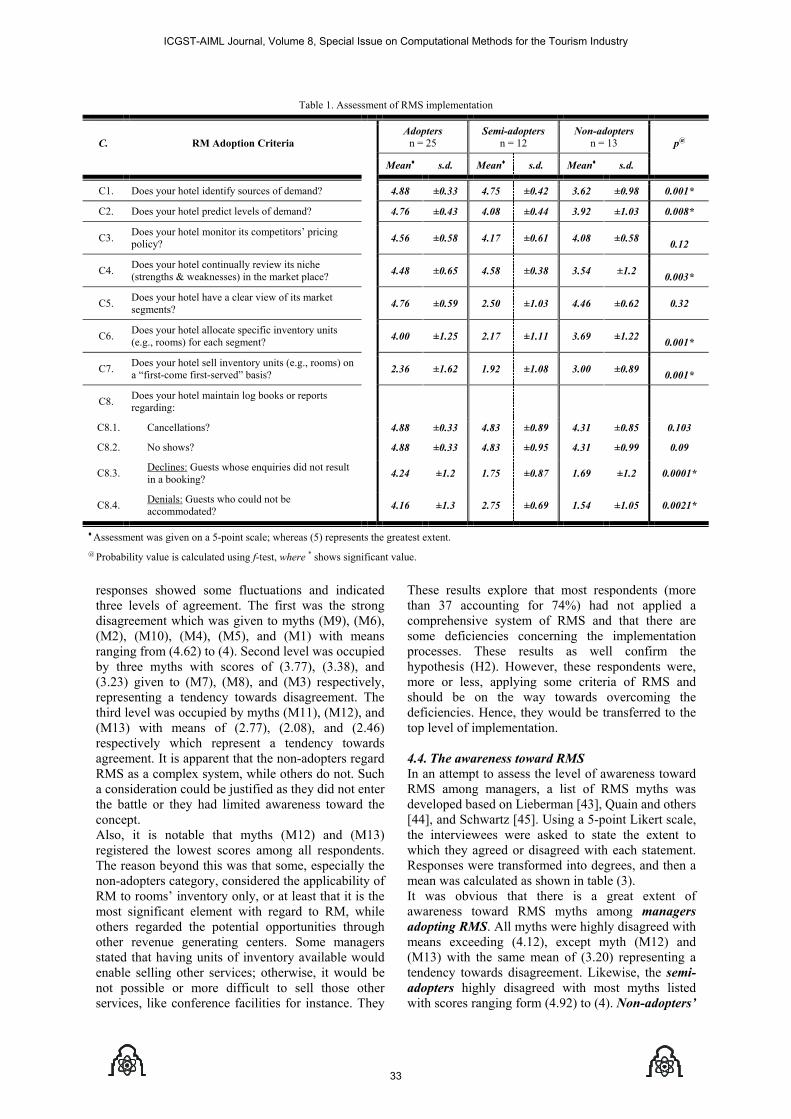
Table 1. Assessment of RMS implementation
Adopters n = 25
Semi-adopters n = 12
Non-adopters n = 13 C. RM Adoption Criteria
Mean♦ s.d. Mean♦ s.d. Mean♦ s.d.
p@
C1. Does your hotel identify sources of demand? 4.88 ±0.33 4.75 ±0.42 3.62 ±0.98 0.001*
C2. Does your hotel predict levels of demand? 4.76 ±0.43 4.08 ±0.44 3.92 ±1.03 0.008*
C3. Does your hotel monitor its competitors’ pricing policy? 4.56 ±0.58 4.17 ±0.61 4.08 ±0.58
0.12
C4. Does your hotel continually review its niche (strengths & weaknesses) in the market place? 4.48 ±0.65 4.58 ±0.38 3.54 ±1.2
0.003*
C5. Does your hotel have a clear view of its market segments? 4.76 ±0.59 2.50 ±1.03 4.46 ±0.62 0.32
C6. Does your hotel allocate specific inventory units (e.g., rooms) for each segment? 4.00 ±1.25 2.17 ±1.11 3.69 ±1.22
0.001*
C7. Does your hotel sell inventory units (e.g., rooms) on a “first-come first-served” basis? 2.36 ±1.62 1.92 ±1.08 3.00 ±0.89
0.001*
C8. Does your hotel maintain log books or reports regarding:
C8.1. Cancellations? 4.88 ±0.33 4.83 ±0.89 4.31 ±0.85 0.103
C8.2. No shows? 4.88 ±0.33 4.83 ±0.95 4.31 ±0.99 0.09
C8.3. Declines: Guests whose enquiries did not result in a booking? 4.24 ±1.2 1.75 ±0.87 1.69 ±1.2 0.0001*
C8.4. Denials: Guests who could not be accommodated? 4.16 ±1.3 2.75 ±0.69 1.54 ±1.05 0.0021*
♦ Assessment was given on a 5-point scale; whereas (5) represents the greatest extent. @ Probability value is calculated using f-test, where * shows significant value.
These results explore that most respondents (more than 37 accounting for 74%) had not applied a comprehensive system of RMS and that there are some deficiencies concerning the implementation processes. These results as well confirm the hypothesis (H2). However, these respondents were, more or less, applying some criteria of RMS and should be on the way towards overcoming the deficiencies. Hence, they would be transferred to the top level of implementation. 4.4. The awareness toward RMS In an attempt to assess the level of awareness toward RMS among managers, a list of RMS myths was developed based on Lieberman [43], Quain and others [44], and Schwartz [45]. Using a 5-point Likert scale, the interviewees were asked to state the extent to which they agreed or disagreed with each statement. Responses were transformed into degrees, and then a mean was calculated as shown in table (3). It was obvious that there is a great extent of awareness toward RMS myths among managers adopting RMS. All myths were highly disagreed with means exceeding (4.12), except myth (M12) and (M13) with the same mean of (3.20) representing a tendency towards disagreement. Likewise, the semi-adopters highly disagreed with most myths listed with scores ranging form (4.92) to (4). Non-adopters’
responses showed some fluctuations and indicated three levels of agreement. The first was the strong disagreement which was given to myths (M9), (M6), (M2), (M10), (M4), (M5), and (M1) with means ranging from (4.62) to (4). Second level was occupied by three myths with scores of (3.77), (3.38), and (3.23) given to (M7), (M8), and (M3) respectively, representing a tendency towards disagreement. The third level was occupied by myths (M11), (M12), and (M13) with means of (2.77), (2.08), and (2.46) respectively which represent a tendency towards agreement. It is apparent that the non-adopters regard RMS as a complex system, while others do not. Such a consideration could be justified as they did not enter the battle or they had limited awareness toward the concept. Also, it is notable that myths (M12) and (M13) registered the lowest scores among all respondents. The reason beyond this was that some, especially the non-adopters category, considered the applicability of RM to rooms’ inventory only, or at least that it is the most significant element with regard to RM, while others regarded the potential opportunities through other revenue generating centers. Some managers stated that having units of inventory available would enable selling other services; otherwise, it would be not possible or more difficult to sell those other services, like conference facilities for instance. They
ICGST-AIML Journal, Volume 8, Special Issue on Computational Methods for the Tourism Industry
33
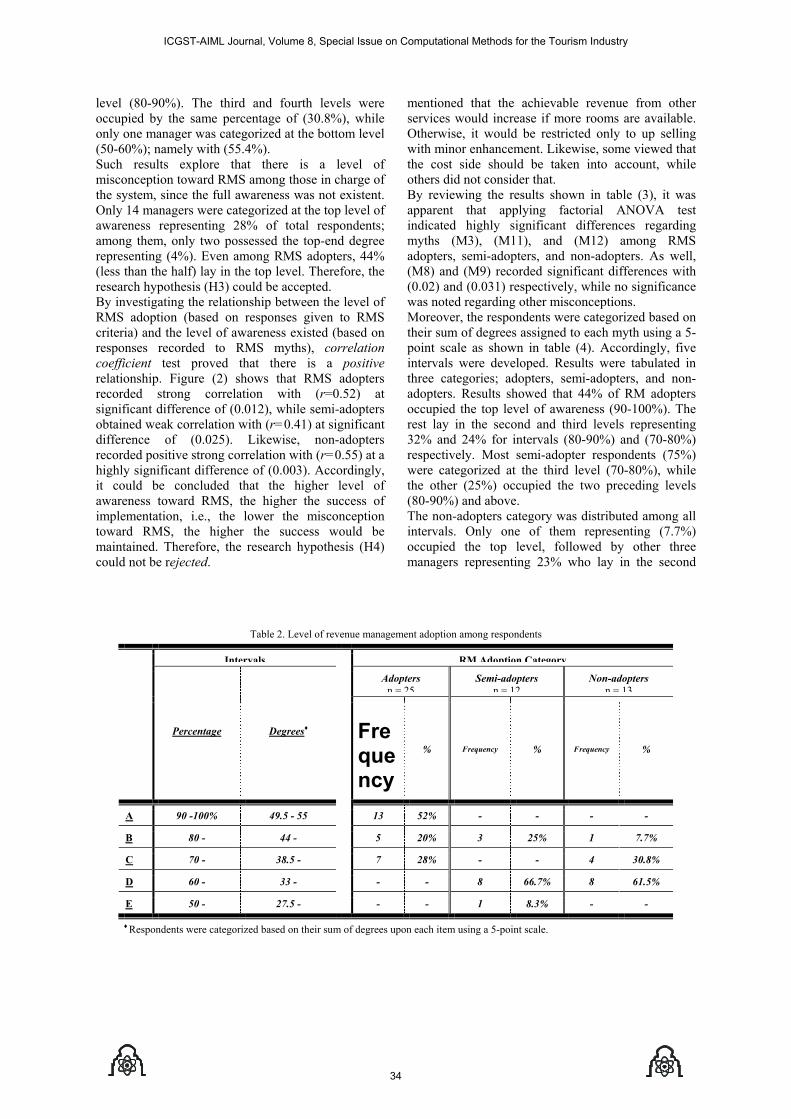
mentioned that the achievable revenue from other services would increase if more rooms are available. Otherwise, it would be restricted only to up selling with minor enhancement. Likewise, some viewed that the cost side should be taken into account, while others did not consider that. By reviewing the results shown in table (3), it was apparent that applying factorial ANOVA test indicated highly significant differences regarding myths (M3), (M11), and (M12) among RMS adopters, semi-adopters, and non-adopters. As well, (M8) and (M9) recorded significant differences with (0.02) and (0.031) respectively, while no significance was noted regarding other misconceptions. Moreover, the respondents were categorized based on their sum of degrees assigned to each myth using a 5-point scale as shown in table (4). Accordingly, five intervals were developed. Results were tabulated in three categories; adopters, semi-adopters, and non-adopters. Results showed that 44% of RM adopters occupied the top level of awareness (90-100%). The rest lay in the second and third levels representing 32% and 24% for intervals (80-90%) and (70-80%) respectively. Most semi-adopter respondents (75%) were categorized at the third level (70-80%), while the other (25%) occupied the two preceding levels (80-90%) and above. The non-adopters category was distributed among all intervals. Only one of them representing (7.7%) occupied the top level, followed by other three managers representing 23% who lay in the second
level (80-90%). The third and fourth levels were occupied by the same percentage of (30.8%), while only one manager was categorized at the bottom level (50-60%); namely with (55.4%). Such results explore that there is a level of misconception toward RMS among those in charge of the system, since the full awareness was not existent. Only 14 managers were categorized at the top level of awareness representing 28% of total respondents; among them, only two possessed the top-end degree representing (4%). Even among RMS adopters, 44% (less than the half) lay in the top level. Therefore, the research hypothesis (H3) could be accepted. By investigating the relationship between the level of RMS adoption (based on responses given to RMS criteria) and the level of awareness existed (based on responses recorded to RMS myths), correlation coefficient test proved that there is a positive relationship. Figure (2) shows that RMS adopters recorded strong correlation with (r=0.52) at significant difference of (0.012), while semi-adopters obtained weak correlation with (r=0.41) at significant difference of (0.025). Likewise, non-adopters recorded positive strong correlation with (r=0.55) at a highly significant difference of (0.003). Accordingly, it could be concluded that the higher level of awareness toward RMS, the higher the success of implementation, i.e., the lower the misconception toward RMS, the higher the success would be maintained. Therefore, the research hypothesis (H4) could not be rejected.
Table 2. Level of revenue management adoption among respondents
Intervals RM Adoption Category
Adopters n = 25
Semi-adopters n = 12
Non-adopters n = 13
Percentage Degrees♦ Fre
quency
% Frequency % Frequency %
A 90 -100% 49.5 - 55 13 52% - - - -
B 80 - 44 - 5 20% 3 25% 1 7.7%
C 70 - 38.5 - 7 28% - - 4 30.8%
D 60 - 33 - - - 8 66.7% 8 61.5%
E 50 - 27.5 -
- - 1 8.3% - -
♦ Respondents were categorized based on their sum of degrees upon each item using a 5-point scale.
ICGST-AIML Journal, Volume 8, Special Issue on Computational Methods for the Tourism Industry
34
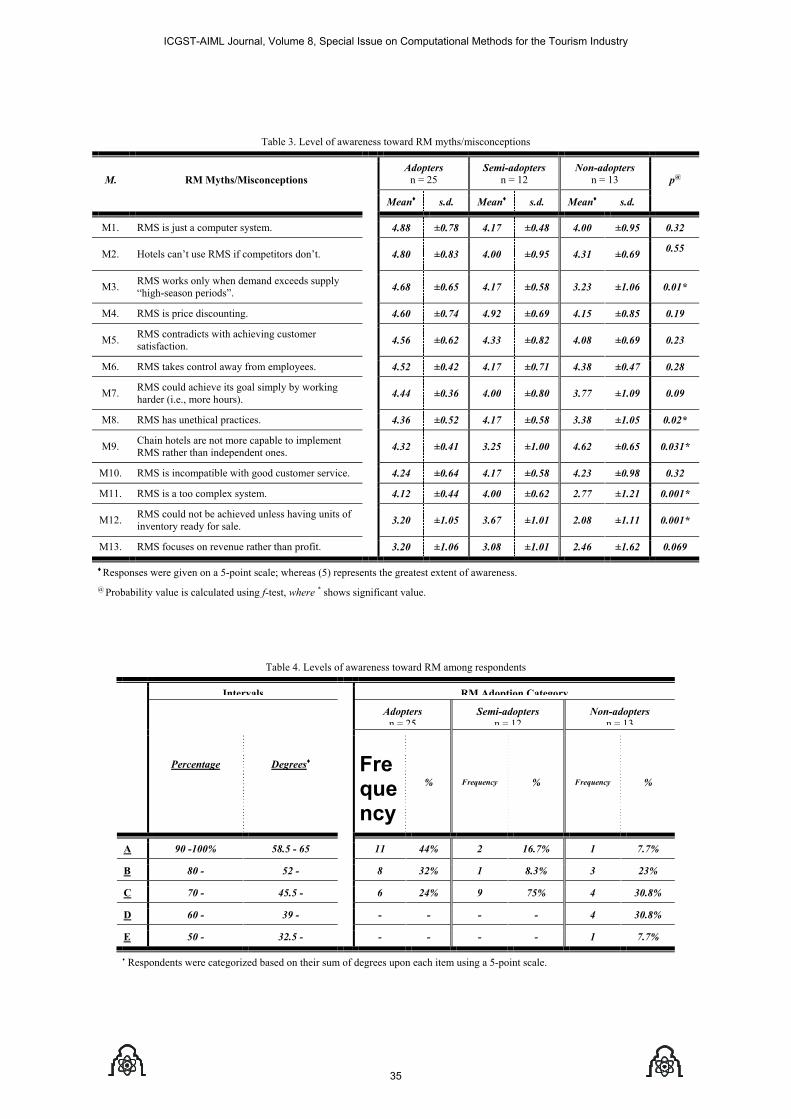
Table 3. Level of awareness toward RM myths/misconceptions
Adopters n = 25
Semi-adopters n = 12
Non-adopters n = 13 M. RM Myths/Misconceptions
Mean♦ s.d. Mean♦ s.d. Mean♦ s.d.
p@
M1. RMS is just a computer system. 4.88 ±0.78 4.17 ±0.48 4.00 ±0.95 0.32
M2. Hotels can’t use RMS if competitors don’t. 4.80 ±0.83 4.00 ±0.95 4.31 ±0.69 0.55
M3. RMS works only when demand exceeds supply “high-season periods”. 4.68 ±0.65 4.17 ±0.58 3.23 ±1.06 0.01*
M4. RMS is price discounting. 4.60 ±0.74 4.92 ±0.69 4.15 ±0.85 0.19
M5. RMS contradicts with achieving customer satisfaction. 4.56 ±0.62 4.33 ±0.82 4.08 ±0.69 0.23
M6. RMS takes control away from employees. 4.52 ±0.42 4.17 ±0.71 4.38 ±0.47 0.28
M7. RMS could achieve its goal simply by working harder (i.e., more hours). 4.44 ±0.36 4.00 ±0.80 3.77 ±1.09 0.09
M8. RMS has unethical practices. 4.36 ±0.52 4.17 ±0.58 3.38 ±1.05 0.02*
M9. Chain hotels are not more capable to implement RMS rather than independent ones. 4.32 ±0.41 3.25 ±1.00 4.62 ±0.65 0.031*
M10. RMS is incompatible with good customer service. 4.24 ±0.64 4.17 ±0.58 4.23 ±0.98 0.32
M11. RMS is a too complex system. 4.12 ±0.44 4.00 ±0.62 2.77 ±1.21 0.001*
M12. RMS could not be achieved unless having units of inventory ready for sale. 3.20 ±1.05 3.67 ±1.01 2.08 ±1.11 0.001*
M13. RMS focuses on revenue rather than profit. 3.20 ±1.06 3.08 ±1.01 2.46 ±1.62 0.069
♦ Responses were given on a 5-point scale; whereas (5) represents the greatest extent of awareness. @ Probability value is calculated using f-test, where * shows significant value.
Table 4. Levels of awareness toward RM among respondents
Intervals RM Adoption Category
Adopters n = 25
Semi-adopters n = 12
Non-adopters n = 13
Percentage Degrees♦ Fre
quency
% Frequency % Frequency %
A 90 -100% 58.5 - 65 11 44% 2 16.7% 1 7.7%
B 80 - 52 - 8 32% 1 8.3% 3 23%
C 70 - 45.5 - 6 24% 9 75% 4 30.8%
D 60 - 39 - - - - - 4 30.8%
E 50 - 32.5 -
- - - - 1 7.7%
Respondents were categorized based on their sum of degrees upon each item using a 5-point scale.
ICGST-AIML Journal, Volume 8, Special Issue on Computational Methods for the Tourism Industry
35
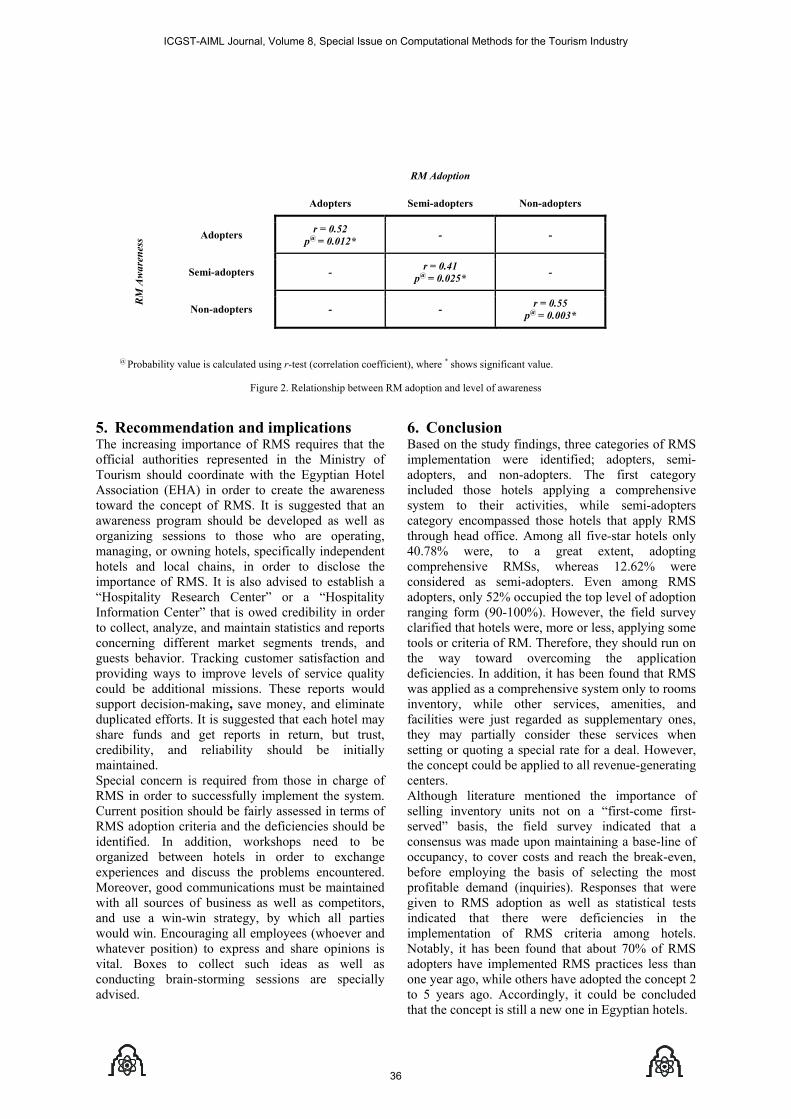
RM Adoption
Adopters Semi-adopters Non-adopters
Adopters r = 0.52 p@ = 0.012* - -
Semi-adopters - r = 0.41 p@ = 0.025* -
RM
Aw
aren
ess
Non-adopters - - r = 0.55 p@ = 0.003*
@ Probability value is calculated using r-test (correlation coefficient), where * shows significant value.
Figure 2. Relationship between RM adoption and level of awareness
5. Recommendation and implications The increasing importance of RMS requires that the official authorities represented in the Ministry of Tourism should coordinate with the Egyptian Hotel Association (EHA) in order to create the awareness toward the concept of RMS. It is suggested that an awareness program should be developed as well as organizing sessions to those who are operating, managing, or owning hotels, specifically independent hotels and local chains, in order to disclose the importance of RMS. It is also advised to establish a “Hospitality Research Center” or a “Hospitality Information Center” that is owed credibility in order to collect, analyze, and maintain statistics and reports concerning different market segments trends, and guests behavior. Tracking customer satisfaction and providing ways to improve levels of service quality could be additional missions. These reports would support decision-making, save money, and eliminate duplicated efforts. It is suggested that each hotel may share funds and get reports in return, but trust, credibility, and reliability should be initially maintained. Special concern is required from those in charge of RMS in order to successfully implement the system. Current position should be fairly assessed in terms of RMS adoption criteria and the deficiencies should be identified. In addition, workshops need to be organized between hotels in order to exchange experiences and discuss the problems encountered. Moreover, good communications must be maintained with all sources of business as well as competitors, and use a win-win strategy, by which all parties would win. Encouraging all employees (whoever and whatever position) to express and share opinions is vital. Boxes to collect such ideas as well as conducting brain-storming sessions are specially advised.
6. Conclusion Based on the study findings, three categories of RMS implementation were identified; adopters, semi-adopters, and non-adopters. The first category included those hotels applying a comprehensive system to their activities, while semi-adopters category encompassed those hotels that apply RMS through head office. Among all five-star hotels only 40.78% were, to a great extent, adopting comprehensive RMSs, whereas 12.62% were considered as semi-adopters. Even among RMS adopters, only 52% occupied the top level of adoption ranging form (90-100%). However, the field survey clarified that hotels were, more or less, applying some tools or criteria of RM. Therefore, they should run on the way toward overcoming the application deficiencies. In addition, it has been found that RMS was applied as a comprehensive system only to rooms inventory, while other services, amenities, and facilities were just regarded as supplementary ones, they may partially consider these services when setting or quoting a special rate for a deal. However, the concept could be applied to all revenue-generating centers. Although literature mentioned the importance of selling inventory units not on a “first-come first- served” basis, the field survey indicated that a consensus was made upon maintaining a base-line of occupancy, to cover costs and reach the break-even, before employing the basis of selecting the most profitable demand (inquiries). Responses that were given to RMS adoption as well as statistical tests indicated that there were deficiencies in the implementation of RMS criteria among hotels. Notably, it has been found that about 70% of RMS adopters have implemented RMS practices less than one year ago, while others have adopted the concept 2 to 5 years ago. Accordingly, it could be concluded that the concept is still a new one in Egyptian hotels.
ICGST-AIML Journal, Volume 8, Special Issue on Computational Methods for the Tourism Industry
36
Responses given to myths of RMS clarified that there is a level of misconception toward RM among those in charge of the system, since the full awareness was not existent. It was also proved that there was a positive correlation between the level of awareness and the success in implementing RM system. That is the higher level of awareness toward RM, the higher the success of implementation. In other words, the lower the misconception toward RM, the higher the success would be maintained. Owing to the research scope, there is a need for further research on a larger scale encompassing all hotels classes, in order to get a more comprehensive image about RMS implementation in Egypt and in other countries. The legal aspects that could affect RM practices and may contradict with its goals could be investigated in order to avoid any formal complaint that may be litigated by guests. The extent to which customers would accept RMS practices should be investigated, and tools for maintaining customer satisfaction while implementing RMSs should be found. Since forecasting is a vital dimension for RMS, there is a need to module a reliable forecasting model that could be employed within hotel industry. The existing software could be reviewed, assessed, and analyzed in order to develop an integrated computerized RMS. Moreover, investigating whether RMS could be applied to restaurants sector by conducting a field experiment on specific restaurant, either independent from hotel or as a part of hotel. Such studies require hotels to release data, records, policies, and results, which is considered a huge challenge, in order to enable exact measurement of RM effectiveness. 7. References [1] R. Cross. Revenue Management: Hard-Core Tactics
for Market Domination. Broadway Books, 1998. [2] M. Kasavana and R. Brooks. Managing Front
Office Operations. Educational Institute of the American Hotel & Motel Association, 1995.
[3] K. Donaghy, U. McMahon, and D.McDowell. Yield Management: an overview. International Journal of Hospitality Management, 14(2):139-150, 1995.
[4] J. Bardi. Hotel Front Office Management. (2nd ed.) Van Nostrand Reinhold, 1996.
[5] S. Kimes. Yield Management: An Overview. chapter In I. Yeoman and A. Ingold (Eds.) Yield Management: Strategies for the Service Industries. Cassell, 1997.
[6] Ref. [1]. [7] I. Yeoman, U. McMahon-Beattie, and R.
Sutherland. Leisure revenue management. Journal of Leisure Property, 1(4):306-317, 2001.
[8] Ref. [4]. [9] Z. Gu and J. Caneen. Quadratic Models for Yield
management in Hotel Rooms Operation. Progress in Tourism and Hospitality Research, 4(3):245-253, 1998.
[10] Ref. [1]. [11] W. Quain, M. Sansbury, and D. Quinn. Revenue
Enhancement–Part 3: Picking Low-hanging Fruit –A Simple Approach to Yield Management. Cornell
Hotel and Restaurant Administration Quarterly, 40(2):76-83, 1999.
[12] Ref. [9]. [13] B. Brotherton and S. Mooney. Yield Management:
progress and prospects. International Journal of Hospitality Management, 11(1):23-32, 1992.
[14] R. Hanks, R. Cross, and R. Noland. Discounting in the Hotel Industry: A New Approach. Cornell Hotel and Restaurant Administration Quarterly, 33(1):15-23, 1992.
[15] R. Hanks, R. Cross, and R. Noland. Discounting in the Hotel Industry: A New Approach. chapter In D. Rutherford (Ed.) Hotel Management and Operations. (2nd ed.) Van Nostrand Reinhold, 1995.
[16] R. Hanks, R. Cross, and R. Noland. Discounting in the Hotel Industry: A New Approach. Cornell Hotel and Restaurant Administration Quarterly, 43(4):94-103, 2002.
[17] Ref. [5]. [18] S. Kimes. A Strategic Approach to Yield
Management. chapter In A. Ingold, U. McMahon-Beattie, and I. Yeoman (Eds.) Yield Management: Strategies for the Service Industries. (2nd ed.) Continuum Press, 2003.
[19] K. Donaghy, U. McMahon-Beattie, I. Yeoman, and A. Ingold. The Realism of Yield Management. Progress in Tourism and Hospitality Research, 4(3):187-195, 1998.
[20] R. Upchurch, T. Ellis, and J. Seo. Revenue management underpinnings: an exploratory review. International Journal of Hospitality Management, 21, 67-83, 2002.
[21] D. Edgar. Economic Theory of Pricing for the Hospitality and Tourism Industry. chapter In A. Ingold, U. McMahon-Beattie, and I. Yeoman (Eds.) Yield Management: Strategies for the Service Industries. (2nd ed.) Continuum Press, 2003.
[22] R. Raeside and D. Windle. Quantitative Aspects of Yield Management. chapter In A. Ingold, U. McMahon-Beattie, and I. Yeoman (Eds.) Yield Management: Strategies for the Service Industries. (2nd ed.) Continuum Press, 2003.
[23] U. McMahon-Beattie and K. Donaghy. Yield Management Practices. chapter In A. Ingold, U. McMahon-Beattie, and I. Yeoman (Eds.) Yield Management: Strategies for the Service Industries. (2nd ed.) Continuum Press, 2003.
[24] Z. Schwartz. The Confusing Side of Yield Management: Myths, Errors, and Misconceptions. Journal of Hospitality & Tourism Research, 22(4): 413-430, 1998.
[25] Ref. [5]. [26] Ref. [18]. [27] K. Dunn and D. Brooks. Profit Analysis: Beyond
Yield Management. Cornell Hotel and Restaurant Administration Quarterly, 31(3): 80-90, 1990.
[28] Ref. [3]. [29] W. Lieberman. Debunking the Myths of Yield
Management. Cornell Hotel and Restaurant Administration Quarterly, 34(1):34-41, 1993.
[30] B. Quain, M. Sansbury, and S. LeBruto. Revenue Enhancement–Part 1: A Straightforward Approach for Making More Money. Cornell Hotel and Restaurant Administration Quarterly, 39(5):41-48, 1998.
[31] Ref. [14]. [32] Ref. [15].
ICGST-AIML Journal, Volume 8, Special Issue on Computational Methods for the Tourism Industry
37

[33] Ref. [16]. [34] E. Orkin. Boosting Your Bottom Line with Yield
Management. chapter In D. Rutherford (Ed.) Hotel Management and Operations. (2nd ed.) New York: Van Nostrand Reinhold, 1995.
[35] Ref. [24]. [36] Ref. [23]. [37] J. Huyton and S. Thomas. Application of Yield
Management to the Hotel Industry. chapter In A. Ingold, U. McMahon-Beattie, and I. Yeoman (Eds.) Yield Management: Strategies for the Service Industries. (2nd ed.) Continuum Press, 2003.
[38] N. Jarvis, A. Lindh, and P. Jones. An Investigation of the Key Criteria Affecting the Adoption of Yield management in UK Hotels. Progress in Tourism and Hospitality Research, 4, 207-216, 1998.
[39] D. Lee-Ross and N. Johns. Yield management in hospitality SMEs. International Journal of Contemporary Hospitality Management, 9(2): 66-69, 1997.
[40] The Egyptian Hotel Guide (25th ed.) Egyptian Hotel Association (EHA), 2004-2005.
[41] Ref. [38]. [42] P. Jones and D. Hamilton. Yield Management:
Putting People in the Big Picture. Cornell Hotel and Restaurant Administration Quarterly, 33(1):89-95, 1992.
[43] Ref. [29]. [44] Ref. [30]. [45] Ref. [24].
ICGST-AIML Journal, Volume 8, Special Issue on Computational Methods for the Tourism Industry
38
Related Documents