The Pennsylvania State University The Graduate School College of Engineering A FUNDAMENTAL STUDY OF THE ANATOMY, AERODYNAMICS, AND TRANSPORT PHENOMENA OF CANINE OLFACTION A Dissertation in Mechanical Engineering by Brent A. Craven © 2008 Brent A. Craven Submitted in Partial Fulfillment of the Requirements for the Degree of Doctor of Philosophy August 2008

Welcome message from author
This document is posted to help you gain knowledge. Please leave a comment to let me know what you think about it! Share it to your friends and learn new things together.
Transcript

The Pennsylvania State University
The Graduate School
College of Engineering
A FUNDAMENTAL STUDY OF THE ANATOMY, AERODYNAMICS, AND
TRANSPORT PHENOMENA OF CANINE OLFACTION
A Dissertation in
Mechanical Engineering
by
Brent A. Craven
© 2008 Brent A. Craven
Submitted in Partial Fulfillment of the Requirements
for the Degree of
Doctor of Philosophy
August 2008

The dissertation of Brent A. Craven was reviewed and approved* by the following:
Gary S. Settles
Distinguished Professor of Mechanical Engineering
Dissertation Adviser, Co-Chair of Committee
Eric G. Paterson
Associate Professor of Mechanical Engineering
Co-Chair of Committee
Thomas C. Baker
Professor of Entomology
Kendra V. Sharp
Associate Professor of Mechanical Engineering
Savash Yavuzkurt
Professor of Mechanical Engineering
Karen A. Thole
Head of Mechanical and Nuclear Engineering
*Signatures are on file in the Graduate School.

Abstract
Though olfaction has been studied in humans, rodents, amphibians, and other animals for
centuries, the sense of smell remains the least understood of the physiological senses.
Traditional measures of olfactory acuity, such as sensory organ size, neuronal density,
and the number of functional olfactory receptor genes, overlook odorant transport from
the external environment to receptor sites in the olfactory epithelium. However, the
deposition of odorant molecules in the olfactory part of the nose is the first step, albeit a
critical one, in chemical trace detection. Few of the previous studies of olfaction have
considered the internal nasal aerodynamics and odorant transport. Moreover, a proper
study of the fluid dynamics and olfactory transport phenomena of nature’s best sniffer,
the canine, has never been done.
The objective of this study is to acquire a fundamental understanding of the anatomy
and physics of canine olfaction. Due to the lack of detailed anatomical data on the canine
nasal airway, high-resolution magnetic resonance imaging (MRI) scans of the nasal
cavity of a large dog are first acquired. A complete description of the airway anatomy is
given that includes representative cross-sections and morphometric data. An
anatomically-correct three-dimensional surface model of the nasal cavity is reconstructed
from the MRI data, yielding a computerized model of the dog’s nose.
Experimental data on canine sniffing are acquired for seven dogs, ranging over nearly
an order of magnitude in body mass (6.8 – 52.9 kg). These unique data are used both to
characterize canine sniffing and to provide physiologically-realistic computational
boundary conditions.
A high-fidelity computational fluid dynamics (CFD) model is developed from the
reconstructed nasal cavity, and simulation results of the external and internal
aerodynamics of canine olfaction are presented. The physics of olfactory mass transport
are finally considered, and for this purpose a reduced-order numerical model is developed

iv
and used to characterize multiphase odorant transport in the olfactory region of the
canine.
The results of this study reveal an impressively-complex canine nasal airway labyrinth,
remarkably well-organized for efficient olfaction. The small size and intricate scrollwork
of the ethmoturbinates in the olfactory part of the nose promote low-Reynolds-number
(Re ~ 100) laminar airflow and provide a large surface area (210 cm2) for odorant
deposition, while the overall location and configuration of the sensory region is shown to
be critical to odorant transport. Specifically, the relegation of olfaction to an “olfactory
recess,” in the rear of the nasal cavity and off the main respiratory passage, produces a
unique olfactory airflow pattern during sniffing. The CFD model reveals that the internal
aerodynamics involves unidirectional flow through the olfactory recess during
inspiration, but this flow ceases during the expiratory phase of sniffing. Further
numerical calculations of vapor transport in the mucus-lined olfactory region demonstrate
that this novel olfactory airflow pattern provides a crucial residence time for the
deposition of moderately-soluble and volatile odorants. It also promotes spatiotemporal
fractionation of odorant mixtures along the olfactory epithelium, leading to a unique,
chemically-dependent molecular flux signature at olfactory receptor sites.
Thus, the aerodynamics and transport phenomena of canine olfaction are shown to be
highly optimized for odorant reception and olfactory discrimination. The olfactory acuity
of the dog appears to depend inherently upon this nasal airway architecture and the
manner in which odorants are transported within the nasal cavity.
The improved understanding of canine olfactory aerodynamics and transport
phenomena obtained here conveys several important biomimetic design principles for
developers of synthetic olfaction devices meant to sample and sense chemical traces in
the air.
Table of Contents
List of Figures................................................................................................................. viii List of Tables .................................................................................................................. xiv Acknowledgements ......................................................................................................... xv Chapter 1: Introduction and Literature Review........................................................... 1 1.1 Introduction.................................................................................................................1 1.2 Literature Review........................................................................................................2
1.2.1 Anatomy of the Canine Nasal Airway ........................................................... 2 1.2.2 Histology........................................................................................................ 4 1.2.3 Olfactory Mucosa........................................................................................... 7 1.2.4 Airway Morphometry .................................................................................... 9 1.2.5 Three-Dimensional Anatomical Reconstruction.......................................... 10 1.2.6 Computational Studies of Nasal Airflow..................................................... 10 1.2.7 Modeling Olfactory Mass Transport Phenomena ........................................ 13
1.3 Objectives .................................................................................................................16 Chapter 2: Reconstruction and Morphometric Analysis of the Canine Nasal Airway and Implications Regarding Olfactory Airflow...................... 17 2.1 Materials and Methods..............................................................................................17
2.1.1 Specimen...................................................................................................... 17 2.1.2 Magnetic Resonance Imaging...................................................................... 19 2.1.3 Surface Reconstruction ................................................................................ 21 2.1.4 Airway Morphometry .................................................................................. 25 2.1.5 Functional Implications ............................................................................... 27
2.2 Results.......................................................................................................................29 2.2.1 Nasal Airway Anatomy................................................................................ 29 2.2.2 Surface Reconstruction ................................................................................ 33 2.2.3 Airway Morphometry .................................................................................. 35 2.2.4 Functional Implications ............................................................................... 40
2.3 Discussion.................................................................................................................43 Chapter 3: Experimental Measurements..................................................................... 46 3.1 Experimental Methodology ......................................................................................46 3.2 Results.......................................................................................................................49 3.3 Discussion.................................................................................................................53

vi
Chapter 4: Development and Verification of a High-Fidelity Computational Fluid Dynamics Model of Canine Nasal Airflow............................... 55 4.1 Computational Methodology ....................................................................................55
4.1.1 Assumptions................................................................................................. 56 4.1.2 Boundary Conditions ................................................................................... 61 4.1.3 Grid Generation ........................................................................................... 63 4.1.4 Parallel Computing ...................................................................................... 70
4.2 Results.......................................................................................................................70 4.2.1 Grid Dependence Study ............................................................................... 70 4.2.2 Time Step Study........................................................................................... 80
Chapter 5: The Aerodynamics of Canine Olfaction ................................................... 83 5.1 External Aerodynamics.............................................................................................86 5.2 Internal Aerodynamics..............................................................................................88 5.3 Discussion.................................................................................................................91 Chapter 6: Modeling Olfactory Mass Transport Phenomena ................................... 93 6.1 Physical Model..........................................................................................................93 6.2 Mathematical Model .................................................................................................97
6.2.1 Governing Equations ................................................................................... 98 6.2.2 Boundary Conditions ................................................................................... 99
6.3 Dimensional Analysis .............................................................................................103 6.4 Numerical Model ....................................................................................................107 6.5 Verification .............................................................................................................110
6.5.1 Air-Phase Transport: Conservation of Mass............................................. 111 6.5.2 Air-Phase Transport: Conservation of Momentum................................... 112 6.5.3 Air-Phase Transport: Steady Convective Mass Transfer.......................... 113 6.5.4 Air-Phase Transport: Transient Convective Mass Transfer...................... 114 6.5.5 Mucus-Phase Transport: Steady Diffusion ............................................... 116 6.5.6 Mucus-Phase Transport: Transient Diffusion........................................... 117 6.5.7 Air-Mucus Interface: Flux-Matching Boundary Condition...................... 118
6.6 Results.....................................................................................................................120 6.6.1 Steady Inspiration ...................................................................................... 122 6.6.2 Sniffing – Oscillatory Flow ....................................................................... 124 6.6.3 Sniffing – No Expiratory Flow .................................................................. 130
Chapter 7: Summary, Conclusions, and Future Work ............................................ 135 7.1 Summary .................................................................................................................135 7.2 Conclusions.............................................................................................................136
7.2.1 Reconstruction, Morphometric Analysis, and Functional Implications ............................................................................. 136 7.2.2 Experimental Measurements...................................................................... 137 7.2.3 Development and Verification of a High-Fidelity CFD Model................. 138 7.2.4 The Aerodynamics of Canine Olfaction .................................................... 139

vii
7.2.5 Modeling Olfactory Mass Transport Phenomena ...................................... 140 7.3 Future Work ............................................................................................................141
7.3.1 Experimental Measurements...................................................................... 141 7.3.2 Computational Fluid Dynamics ................................................................. 141 7.3.2 Modeling Olfactory Mass Transport Phenomena ...................................... 141
Bibliography .................................................................................................................. 142
List of Figures
1.1 Schematic illustration of the olfactory mucosa. For clarity, a limited number of cilia are depicted. In reality, an average of 17 cilia extend from each mammalian olfactory knob [30, 35]............................................................................8
2.1 Three-dimensional surface reconstruction methodology..........................................22 2.2 Comparison of a raw (left) and processed MRI slice (right) (axial location:
41.6 mm from the tip of the naris). Images are proton density weighted. Glass beads appear as dark circles in the raw slice...................................................23
2.3 Transverse airway cross sections at various axial locations. a, naris; b, mid-
lateral slit; c, alar fold; d, dorsal meatus; e, dorsal concha; f, middle meatus; g, ventral concha (maxilloturbinate); h, common meatus; i, ventral meatus; j, nasopharyngeal meatus; k, maxillary recess; l, ethmoidal conchae (ethmoturbinates). .....................................................................................................31
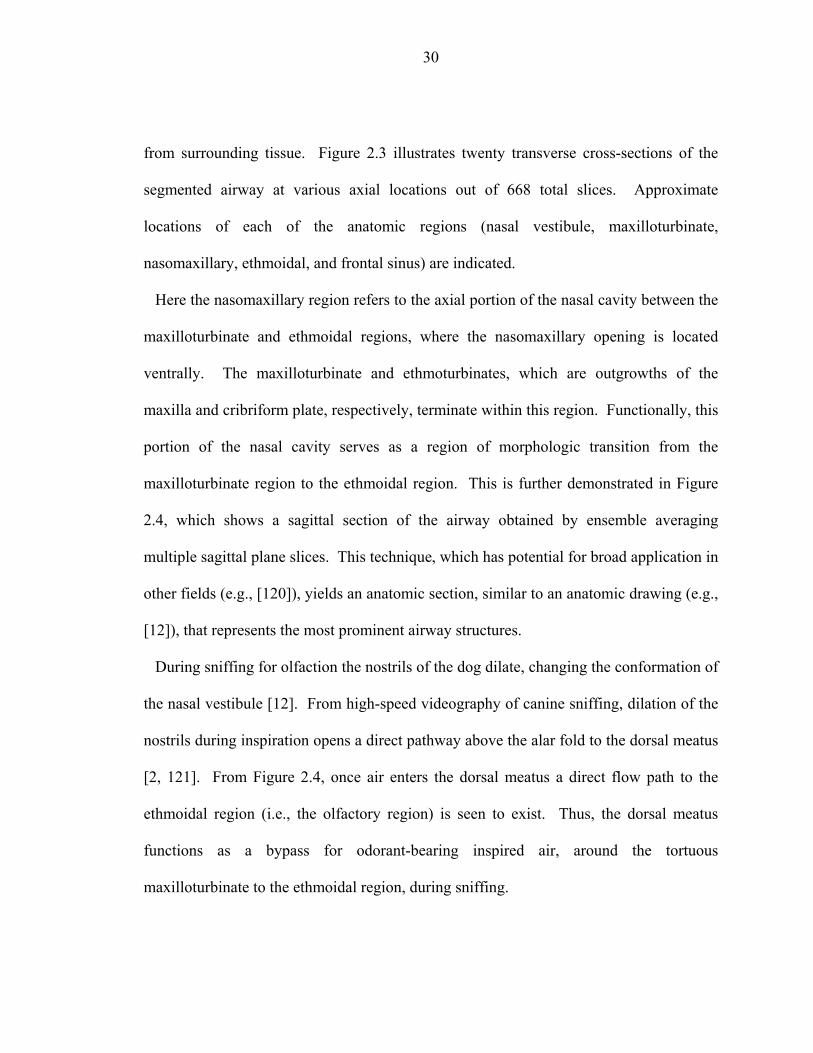
2.4 Sagittal section of the canine nasal airway. a, naris; b, middle meatus; c,
dorsal meatus; d, dorsal concha; e, ventral concha (maxilloturbinate); f, frontal sinus; g, ethmoidal conchae (ethmoturbinates); h, vomer; i, nasopharyngeal meatus; j, nasomaxillary opening; k, ventral meatus; l, alar fold .............................32
2.5 Three-dimensional surface model of the left canine nasal airway appropriately
oriented relative to the external cranial anatomy. (External anatomy reconstructed from Computed Tomography (CT) data, courtesy T.S. Denney, Jr.) .............................................................................................................................33
2.6 Three-dimensional surface model of the left canine nasal airway. (a) Rostral-
lateral view; (b) Lateral view; (c) Caudal-medial view; (d) Medial view ................34 2.7 Distribution of perimeter, P, and cross-sectional area, Ac, with axial
coordinate in the canine nasal airway .......................................................................35 2.8 Distribution of hydraulic diameter, Dh, with axial coordinate in the canine
nasal airway ..............................................................................................................36 2.9 Distribution of cumulative surface area, As, with axial coordinate in the canine
nasal airway ..............................................................................................................38

ix
2.10 Mean fractal dimension of the maxilloturbinate and ethmoidal airways..................40 2.11 Reynolds number distribution in the canine nasal airway at peak inspiratory
flow rate during sniffing ...........................................................................................41 2.12 Distribution of Womersley number in the canine nasal airway during sniffing
(sniff frequency = 5 Hz)............................................................................................42 2.13 Nature of olfactory airflow in the canine nasal airway.............................................43 2.14 Comparison of the nasal airway morphometry of a mixed-breed Labrador
retriever (present study) and a beagle [43]. (a) Perimeter; (b) Cross-sectional area............................................................................................................................44
3.1 Special-purpose muzzle equipped with a hot-film probe, used for airflow
measurements of canine sniffing. (a) side-view (b) close-up of hot-film probe.....47 3.2 Schematic illustration of experimental sniffing measurements ................................48 3.3 Experimental measurements of airflow rate during canine sniffing. (a) Short
sniffing bouts ranged from a few sniffs to a full “burst” of sniffs lasting up to two seconds that consisted of a weak initial sniff, a gradual increase in inspiratory flow rate with each successive sniff until the largest sniff was observed, followed by a decrescendo in sniff flow rate. Here, data from a short sniffing bout for three dogs of widely different body size show a single burst of sniffs for each animal sniffing at largely different flow rates. (b) Long sniffing bouts reveal multiple bursts of sniffs that occur every 0.5 to 2 seconds......................................................................................................................51
3.4 Scaling of the olfactory airflow variables of canine sniffing. (a) The
frequency, fsniff, of canine sniffing is independent of body size. (b) Peak inspiratory flow rate, , and (c) inspiratory tidal volume, Max
Insp.Q Insp.V , of a sniff scale in proportion to a dog’s body mass. Error bars represent ± 1% (fsniff) and ± 10% ( and Max
Insp.Q Insp.V ) experimental uncertainty.. .................................................52 3.5 Scaling of olfactory airflow variables for all species with available data. (a)
Peak inspiratory airflow rate of a sniff is directly proportional to body mass in macrosmatic animals, while humans appear to sniff at a lower flow rate, for their size. (b) Inspiratory tidal volume of a sniff scales allometrically with body mass for macrosmatic animals... ......................................................................54
x
4.1 Axial distribution of the Womersley number in the canine nasal cavity during sniffing (f = 5 Hz). For reference, the background shows an appropriately-scaled sagittal section of the canine nasal airway from [134] and Chapter 2.... .......57
4.2 Nature of canine nasal airflow during sniffing.... .....................................................59 4.3 Computational domain..............................................................................................62 4.4 Regional division of the internal nasal airway surfaces for variable CFD grid
refinement. Regions include the nasal vestibule (1), dorsal meatus (2), maxilloturbinate region (3), maxillary sinus (4), ethmoturbinate region (5-7), frontal sinus (8), and nasopharynx (9).... ..................................................................65
4.5 Overall grid size versus assigned surface cell size, Δx, in the main canine
airway regions. Grids shown by open symbols were generated to develop the power-law regression..... ...........................................................................................67
4.6 Required computer memory for grid generation versus overall grid size. Grids
shown by open symbols were generated to develop the linear regression..... ..........67 4.7 External grid summary of the “fine” CFD model..... ................................................68 4.8 Comparison of the internal spatial resolution of the (1) coarse, (2) medium, (3)
fine, and (4) finest CFD grids in the maxilloturbinate region (MR). Comparable grid resolution is found in the nasal vestibule (NV) and ethmoidal region (ER)................................................................................................................69
4.9 Qualitative comparison of the velocity distribution in the nasal vestibule (NV)
for the coarse (1), medium (2), fine (3), and finest (4) grid solutions of inspiratory airflow for an overall pressure drop of 2000 Pa..... ................................72
4.10 Airflow “impedance” curves, a quantitative measure of grid dependence for
CFD calculations of (a) inspiratory and (b) expiratory airflow in the canine nasal airway..... .........................................................................................................73
4.11 Monotonic convergence of airflow rate, Q, through the canine nasal cavity
from CFD calculations at various pressure drops..... ................................................74

xi
4.12 Grid dependence of the regional airflow distribution in the canine nasal cavity. The fraction of the overall airflow passing through the dorsal meatus during steady (a) inspiration and (b) expiration from coarse, medium, and fine grid solutions is plotted at various axial locations. For reference, the background contains a sagittal section of the nasal airway and three transverse cross-sections are shown at correct axial locations to illustrate the relative size and location of the dorsal meatus..... ...............................................................................77
4.13 Transient calculations of canine sniffing at 5 Hz. (a) Time history of airflow
rate at the nasopharynx for all calculated sniffs, with decreasing time step size. (b) Comparison of the calculated flow rate for the finest time step size and experimental measurements. The experimental data, originally measured on a smaller canine, was allometrically-scaled to 29.5 kg, the body mass of the cadaver from which the CFD model was reconstructed..... ......................................82
5.1 The olfactory epithelium is confined to an “olfactory recess” in the canine
nasal airway. (a) Three-dimensional surface model of the left canine nasal airway in situ. (b) The olfactory recess is located in the rear of the nasal cavity and contains ethmoidal scrolls, which are lined with olfactory epithelium and provide large surface area for odorant transfer. (c) A sagittal section of the canine nasal airway clearly reveals a peripherally-located “olfactory recess” excluded from the respiratory part of the nose by a bony horizontal shelf, the lamina transversa. This anatomical feature is characteristic of keen-scented (macrosmatic) animals and may influence olfactory airflow patterns and odorant transport to olfactory receptors..... ..............85
5.2 The external aerodynamics of canine sniffing. (a) An isosurface of velocity
magnitude (10% of maximum inspiratory velocity) at peak inspiration. (b) An isosurface of velocity magnitude (10% of maximum expiratory velocity), colored by vorticity, at peak expiration..... ...............................................................87
5.3 The internal aerodynamics of canine olfaction. (a) Unsteady pathlines
released from the naris at equally-spaced time intervals during inspiration. (b) The pathlines of (a), colored by velocity magnitude. (c) Pathlines released from the nasopharynx at equally-spaced time intervals during expiration..... ..........89
6.1 Schematic illustration of olfactory transport phenomena at the air-mucus
interface in the olfactory epithelium. (a) overall view and (b) close-up of the mucus layer..... ..........................................................................................................94
6.2 Schematic illustration of diffusion-limited binding at receptor sites on
olfactory cilia..... .......................................................................................................96 6.3 Air-mucus interfacial mass transport boundary conditions..... ...............................101

xii
6.4 Schematic illustration of the olfactory region of the canine nasal cavity,
approximated as a one-dimensional series of channels. (a) A cross-section of the canine olfactory region. (b) One-dimensional channel array with equivalent morphometric statistics..... ....................................................................108
6.5 Verification of conservation of mass..... .................................................................111 6.6 Verification of conservation of momentum..... .......................................................112 6.7 Verification of steady convective mass transfer..... ................................................113 6.8 Verification of transient convective mass transfer..................................................115 6.9 Verification of steady diffusion mass transfer in the mucus layer..........................116 6.10 Verification of transient diffusion mass transfer in the mucus layer..... .................118 6.11 Verification of the flux-matching boundary condition across the air-mucus
interface...................................................................................................................119 6.12 Odorant molecular flux at the “receptor layer” for steady inspiration. (a) Low-β and (b) high-β odorants..... ....................................................................123 6.13 Oscillatory flow induced in the two-dimensional channel array by a time-
dependent sinusoidal pressure gradient..... .............................................................124 6.14 Relative locations of discrete, evenly-spaced receptor “sites.” For reference,
the color code of each site corresponds to the colormap of subsequent plots..... ...125 6.15 Time-history of molecular flux for cyclohexanone at discrete receptor sites
(numbered in the legend) for oscillatory olfactory airflow.....................................126 6.16 Time-history of molecular flux for amyl acetate at discrete receptor sites for
oscillatory olfactory airflow....................................................................................127 6.17 Time-history of molecular flux for limonene at discrete receptor sites for
oscillatory olfactory airflow....................................................................................128 6.18 Odorant molecular flux at the “receptor layer” for oscillatory olfactory airflow
at an elapsed time of 0.9 seconds............................................................................129 6.19 Physiologically-realistic olfactory airflow rate during sniffing, now including
a quiescent expiratory phase..... ..............................................................................130

xiii
6.20 Time-history of molecular flux for amyl acetate at discrete receptor sites for
physiologically-realistic sniffing..... .......................................................................132 6.21 Time-history of molecular flux for limonene at discrete receptor sites for
physiologically-realistic sniffing..... .......................................................................133 6.22 Odorant molecular flux at the “receptor layer” for physiologically-realistic
sniffing at an elapsed time of 0.9 seconds..... .........................................................134
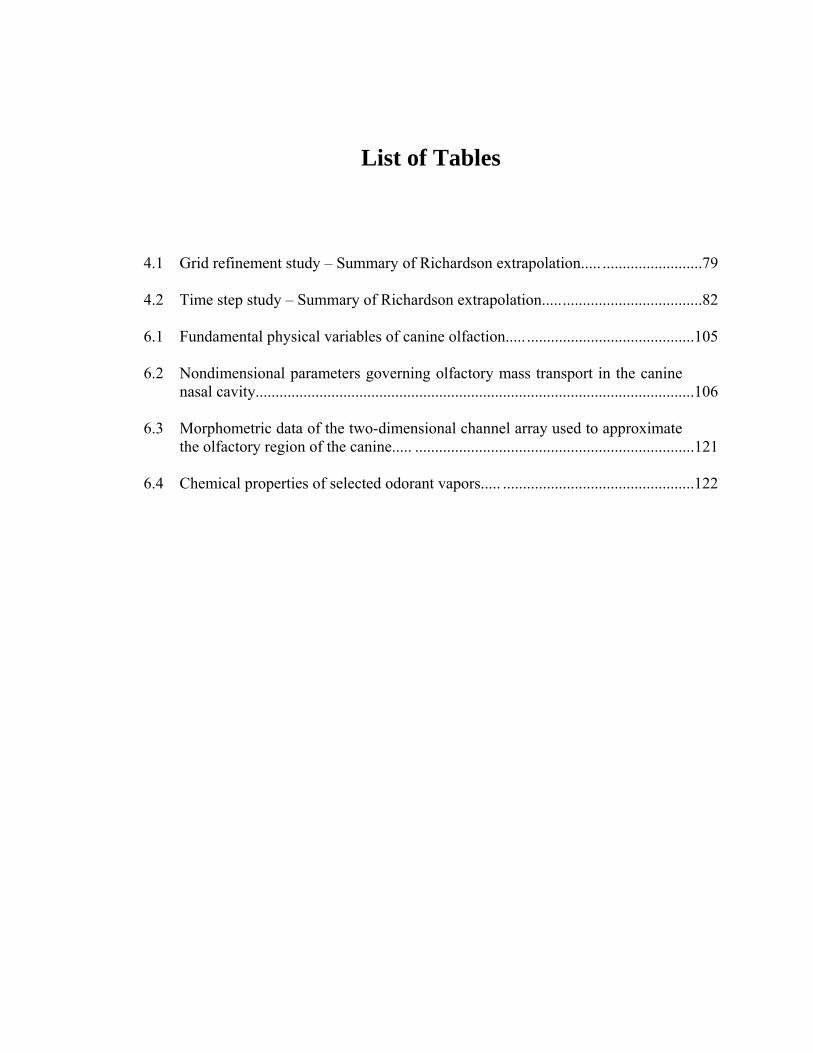
List of Tables
4.1 Grid refinement study – Summary of Richardson extrapolation..... .........................79 4.2 Time step study – Summary of Richardson extrapolation........................................82 6.1 Fundamental physical variables of canine olfaction..... ..........................................105 6.2 Nondimensional parameters governing olfactory mass transport in the canine
nasal cavity..............................................................................................................106 6.3 Morphometric data of the two-dimensional channel array used to approximate
the olfactory region of the canine..... ......................................................................121 6.4 Chemical properties of selected odorant vapors..... ................................................122

Acknowledgements
This study was conducted at the Gas Dynamics Laboratory and the Applied Research
Laboratory at The Pennsylvania State University. Financial support for this work was
provided by the Office of Naval Research (Grant N00014-05-1-0844). Any opinions,
findings, and conclusions or recommendations expressed in this material are those of the
author and do not necessarily reflect the views of the Office of Naval Research.
I would like to thank my advisor, Dr. Gary Settles, for giving me this opportunity and
for his guidance and direction throughout my graduate education. I especially appreciate
the freedom he gave me while pursuing this and other research and his support of
creativity. His passion for research has been a motivation and an inspiration to pursue an
academic research career.
I likewise thank my co-advisor, Dr. Eric Paterson, for his guidance and direction. I
appreciate his encouragement to think critically and his eagerness to roll up his sleeves
and help me find the elusive “devil in the details.” His enthusiasm for fundamental
research is contagious. It has been an honor and privilege to study under both Drs.
Settles and Paterson. I am grateful for this unique and rewarding experience.
I thank J.D. Miller and L.J. Dodson of the Gas Dynamics Lab for their daily assistance
over the past 5 years. Thanks for all your help. I also appreciate the insightful advice of
Dr. John Mahaffy of the Applied Research Lab in the development of my reduced-order
model. Additionally, I would like acknowledge Chuck Ritter of the Applied Research
Lab for technical support and his assistance with the storage and retrieval of terabytes of
computational data.
A special thanks to Sam Bumbarger, Diane Albright, Dr. Gary Settles and Carrie
Williams, Alex Spangler, James and Gail Lawson, and Mike and Marta Kinzel for
enlisting and training Teddy, Kirby, Nikita and Sullivan, Gus, Indy, and Ranger, the
animal subjects used in this study.

xvi
To all the friends and colleagues I have made at Penn State, especially the many
students of the Gas Dynamics Lab and the Applied Research Lab, thanks for the
encouragement, assistance, and all of the memories. M.J. Hargather and M.J. Lawson, I
am looking forward to working with you in the near future.
I especially thank my family for their patience and encouragement over the years. My
parents, Gene and Teddi, taught me the value of hard work and perseverance, qualities
that sustained me through nine years of higher education. Thanks, mom and dad, for
your love and support. Thanks also to my uncle, Tom, for his friendship and advice.
Finally, thanks to my wife, Emily. Her daily encouragement has been a large source of
strength for me. I appreciate her continued patience and understanding. I could not have
done this without your loving support, Emily. I am truly blessed to have you as my best
friend and wife.

Chapter 1
Introduction and Literature Review
1.1 Introduction
The sense of smell, or olfaction, is the least understood of the physiological senses [1].
The science of olfaction encompasses numerous disciplines, including anatomy,
physiology, biophysics, biochemistry, neuroscience, genetics, and many others. The
subject has been studied for centuries [2], yet despite a recent Nobel Prize, a complete
theory of olfaction is lacking.
Few studies have considered the aerodynamics and transport phenomena of olfaction.
Much of the work in olfaction assumes free access of receptors to odorant molecules and
completely neglects upstream transport events. However, the deposition of odorants in
the olfactory part of the nose is the first step in chemical detection. Given the complexity
of the mammalian nasal cavity, particularly in keen-scented (macrosmatic) species one
suspects that, the aerodynamics and mass transport phenomena are highly optimized for
olfactory discrimination of dilute scent-bearing air mixtures.
Here, canine olfaction is considered. The olfactory acuity of the dog, who can detect
odorant concentration levels at 1–2 parts per trillion (ppt), is roughly 10 to 100 thousand
times that of the human [3, 4]. Though olfactory organ size [5, 6], neuronal density [7],
2
and the number of functional vs. pseudo olfactory receptor genes [8-10] certainly
contribute to this disparity, these measures nonetheless fail to consider the anatomical
structure of the nasal cavity and odorant transport from the external environment, by
sniffing, to receptors on the cilia of the olfactory epithelium.
Beginning with a review of the literature, this thesis explores canine olfaction from a
fluid dynamics and mass transport perspective. The anatomy of the dog’s nose is
considered and the functional implications regarding olfaction are examined in Chapter 2.
Unique experimental data on canine sniffing are presented in Chapter 3. In Chapter 4,
the development of a high-fidelity computational model of the canine nose is
demonstrated that includes verified CFD solutions of canine nasal airflow. A summary
of the aerodynamics of canine olfaction is given in Chapter 5. Finally, Chapter 6 presents
a novel physical model of olfactory mass transport phenomena and the development of a
numerical model that is used to capture the essential physics of odorant species transport.
Though this is a fundamental study of canine olfaction, the material presented herein
has direct relevance to biomimetic sniffer design, chemical trace detector development,
intranasal drug delivery, and inhalation toxicology.
1.2 Literature Review
1.2.1 Anatomy of the Canine Nasal Airway
The domestic dog (Canis familiaris) displays the largest variation in body size of all
terrestrial vertebrates [11], while its skull comes in more shapes and sizes than any other

3
mammal [12]. Generally, the canine skull is classified according to its shape, which can
be long and narrow (dolichocephalic), short and wide (brachycephalic), or of medium
proportions (mesaticephalic) [12]. Representative examples of these types include the
Collie, Labrador retriever, and Boston terrier, respectively.
The canine nasal cavity is divided by the nasal septum into two bilaterally-symmetric
airways, each comprised of three main anatomical regions: nasal vestibule, respiratory,
and olfactory. The vestibule is the most rostral part of the nasal fossa. Moving caudally,
the respiratory region consists of the dorsal and ventral nasal conchae, the later of which
ramifies caudally. The ventral nasal concha, or maxilloturbinate, of the dog is of the
branching type [13] and is attached to the medial surface of the maxilla [12]. When
viewed from a lateral perspective, this highly three-dimensional structure has an
“accordion-like” appearance (see [13]; Figure 105).
The vestibule and respiratory airways are responsible for warming or cooling,
humidifying, and filtering inspired air prior to its entering the lower respiratory tract.
Considering the sparse vasculature within the vestibule, little air conditioning is achieved
in this region [13]; however, filtering may be achieved. Thus, the nasal vestibule is
primarily responsible for distributing inspired air within the nasal cavity and for directing
the expired air stream.
Functionally, it is predominantly the complicated structure of the maxilloturbinate that
provides a large surface area for the transfer of heat and moisture. According to Negus
[13], of the four types of maxilloturbinates found in mammals (single-scroll, double-
scroll, folded, and branching), the branched maxilloturbinate provides the greatest
4
possible surface area. Further, the tortuous path through the branches of the
maxilloturbinate cleans inspired air by particle impaction.
Caudal to the respiratory region is the olfactory portion of the nose, where the
ethmoidal conchae, or ethmoturbinates, provide a large surface area for odorant transfer.
These outgrowths of the cribriform plate are structurally distinct from the branched
maxilloturbinate. The ethmoturbinates are bony scrolls, having a “rolled-up” appearance
[12].
Finally, the frontal sinuses are large recesses located dorsocaudal to the ethmoidal
region. Rostrally, a few of the most dorsal ethmoturbinates extend into the sinuses.
Otherwise, the sinuses are empty cavities with no outlet.
1.2.2 Histology
Histologically, the tissue lining the nasal cavity consists of four main types of epithelium.
The relative distribution of each epithelial type is rather similar in most mammals [14].
Moving posteriorly, the nasal vestibule, maxilloturbinate, and ethmoturbinates are
primarily covered with squamous, respiratory, and olfactory epithelium, respectively [see
[15] and [16] for micrographs of each type]. The fourth epithelial type, transitional
epithelium, is found in the posterior nasal vestibule and extends into the anterior
maxilloturbinate region. In essence, it serves as a region of histological transition from
simple squamous nasal lining to the pseudostratified columnar respiratory type [15]. The
shift from respiratory to olfactory epithelium in the anterior ethmoidal region is not well-
defined and has been characterized as having an irregular appearance [17], where clusters

5
of olfactory cells are found among non-sensory cells. Lastly, the frontal sinuses of the
dog are covered with respiratory epithelium, except where ethmoturbinates extend into
these cavities [14]. Here, olfactory epithelium is found.
Respiratory epithelium has motile cilia projecting from its surface [15]. Plentiful
vasculature, capable of considerable constriction or dilation, is found in the lamina
propria beneath the respiratory epithelium [13]. Further, Negus describes a protuberance,
which is most prominent in macrosmatic (keen-scented) species, on the ventral part of the
nasal septum in the maxilloturbinate region, formed by vascular spaces beneath the
epithelium [13]. He exclusively refers to this structure as the “swell body”, while many
other authors use the term more liberally for erectile tissue structures of the nasal cavity
in general. Consequently, the more descriptive term “septal swell body” is adopted,
which is used to describe a similar structure in the human (e.g., [18]).
Functionally, in macrosmatic species, distention of the septal swell body depends on a
number of environmental conditions [19]. Depending on the state (extended or
collapsed) of the septal swell body, respiratory airflow is regulated. When the swell body
is extended, flow in much of the ventral meatus is blocked, forcing inspiratory flow
through the maxilloturbinate airways. Conversely, when the septal swell body is
collapsed, inspiratory airflow passes freely below the maxilloturbinate to the
nasopharynx [13]. Such changes in respiratory airway architecture have been observed in
the cat [13] and rat [19].
Olfactory epithelium, which in the dog is brownish in color [12], has a pseudostratified
columnar organization [20] and is remarkably similar in most vertebrate species [17].
6
Unlike the case of respiratory epithelium, the lamina propria below the olfactory
epithelium does not contain a rich vascular network. Consequently, the thickness of
olfactory mucosa does not change appreciably due to vascular constriction or dilation
[13].
Olfactory receptor cells, which are bipolar neurons, are contained within the olfactory
epithelium and project dendritic processes to the epithelial surface. The dendrites
terminate in expanded vesicles, olfactory knobs, from which many (10–60) sensory cilia
extend forming a dense ciliary blanket over the epithelial surface [20]. Olfactory cilia,
which are non-motile [13], are the site of initial sensory transduction, which occurs when
neuronal protein receptors embedded within the plasma membrane are activated by an
odorant [21, 22].
In general, with the exception of the anterior nasal vestibule, airway secretions cover
the mucosa of the nasal cavity. The secretions augment heat transfer, humidify inspired
air, dehumidify expired air, provide an effective barrier between inhaled noxious
chemicals and underlying tissue, absorb odorant molecules, and aid in the removal of
inspired particles via mucociliary transport. Moreover, without a fluid bath, cilia will die
[23]. The thickness of the airway secretion layer has been reported to be in the 5–30 μm
range [14, 24, 25]. Though often reported as a homogeneous “mucus” layer, much data
support a heterogeneous layer consisting of at least two phases [23, 25-27]. Further, the
layers covering the olfactory and respiratory epithelia differ in chemical composition [26,
28]. For instance, odorant binding proteins, which are thought to be responsible for
7
transporting and/or deactivating odorant molecules, have been found in the airway
secretions lining the olfactory epithelium, but not in the respiratory region [29].
1.2.3 Olfactory Mucosa
The olfactory mucosa, which comprises olfactory epithelium and a thin “mucus” lining,
covers the ethmoidal conchae (see Figure 1.1). Though the thickness of the mucus layer
varies depending on the location, in mammals it is characteristically in the 5-10 μm range
[25, 30]. In rats, cats, and dogs, Andres [31] observed that the regional variation of
mucus height in the olfactory region of an animal was greater than the interspecies
variability (cited in [26]). Microstructurally, the “mucus” layer is heterogeneous [32],
consisting of multiple phases that at least include a superficial watery layer and a deeper
viscous gel-like layer [26, 33, 34].
The ethmoidal region of the canine contains an estimated 2.8 x 10⁸ olfactory sensory
neurons (OSNs) [36]. On average, 17 olfactory cilia arise from the olfactory knob of
each OSN, each having a mean diameter of 0.2 – 0.3 μm [30, 35, 37]. In contrast to
respiratory cilia, mammalian olfactory cilia lack the dynein arms between structural
microtubules required for motility in the form of cilial “beating” [38, 39]. The
cytoskeletal structure of these modified cilia exists solely to support a specialized plasma
membrane that is important in olfactory reception [32].

8
Figure 1.1: Schematic illustration of the olfactory mucosa. For clarity, a limited number
of cilia are depicted. In reality, an average of 17 cilia extend from each mammalian
olfactory knob [30, 35].
Lacking the cytoskeletal framework to support their own weight, olfactory cilia lie limp
on the epithelial surface, intertwined with the tips of the microvilli that emanate from the
olfactory supporting cells [32], Figure 1.1. Considering that mammalian cilia can reach
over 50 μm in length [17], a ciliary “blanket” covers the surface of the epithelium [20] in
a largely parallel arrangement [32], beneath the olfactory mucus layer.
9
Olfactory signal transduction begins when odorant molecules are bound by G protein-
coupled receptors embedded within the plasma membrane of the cilia, where the release
of chemical energy due to binding is converted into a neural signal [21, 22]. Though
earlier studies claim localization of olfactory receptors to proximal [24] or distal [40, 41]
ciliary segments, more recent high-resolution fluorescence imaging studies (e.g., [42]) of
transient Ca2+ signaling in OSNs of individual cilia have shown that receptors exist along
the entire ciliary shaft.
1.2.4 Airway Morphometry
Due to the small size and intricate detail of the canine nasal conchae, in particular the
maxilloturbinate and ethmoturbinates, high-resolution imaging is required to resolve the
complicated branches and scrollwork therein. The resultant data may be useful for
general anatomical reference (as in [12, 16, 43-45]), morphometric analysis, and three-
dimensional surface reconstruction.
Morphometric analysis yields a quantitative look at the geometric structure of the nasal
airway. Such data provide detailed morphological information not available from gross
dissection. Further, basic functional considerations may be addressed via dimensional
analysis and allometric scaling (see [46] and [47], respectively). In particular,
morphometric data may be incorporated in theoretical models of olfaction (e.g., [48]),
inhalation toxicology, respiratory physiology, and intranasal drug delivery.
Other studies have examined the airway morphometry of various mammalia including
the mouse [49], rat [43, 49-51], guinea pig [52], beagle dog [43], monkey [43, 53-55],

10
and human [53, 56, 57] from serial sections of fixed nasal tissue, sections of solid airway
casts, or three-dimensional scans (computed tomography, CT, or magnetic resonance
imaging, MRI). However, few have used high-resolution imaging and none have
reported detailed regional morphometric data. Moreover, only one study [43] considered
the morphometry of the canine nasal airway.
1.2.5 Three-Dimensional Anatomical Reconstruction
Reconstruction of anatomical images is currently a rapidly-growing technique that finds
application in fields such as gross anatomy and computational and experimental biology.
The ability to view complex anatomic structures three-dimensionally is important in
acquiring a visiospatial understanding of gross anatomy [58]. Computationally, surface
models are required for simulating biological physics such as structural stress-strain
analysis (e.g., [59, 60]) and fluid motion. Specifically, computational fluid dynamics
(CFD) simulations of respiratory physiology [61], olfaction [62, 63], and inhalation
toxicology [51, 54, 57, 64-67] using reconstructed airway models have been performed.
Likewise, detailed experimental models of complex biological structures may be created
from reconstructed data using current rapid-prototyping technology (e.g., [68, 69]).
1.2.6 Computational Studies of Nasal Airflow
Due to the geometric complexity of the nasal airway labyrinth, experimental investigation
of the internal nasal aerodynamics is difficult. Flow visualization experiments have been
reported for the human [70-75], baboon [76], monkey [77, 78], rat [77, 78], rabbit [79],

11
cat [79], and dog [79, 80]. In all cases, the results must be carefully interpreted given the
experimental methodology. For instance, Dawes [79] used cigarette smoke to visualize
inspiratory and expiratory airflow patterns in simplified two-dimensional sagittal sections
of the (highly three-dimensional) canine nasal airway. Other visualization techniques
[80] infer nasal airflow patterns from the deposition of aerosols and particles, which are
not neutrally-buoyant and tend to impact, rather than follow the flow through convoluted
airways. Water-dye flow visualization methods (e.g., [73, 77, 78]) have been most
successful at demonstrating nasal airflow patterns.
Quantitative experimental measurements of internal nasal airflow have apparently only
been made in the human [68, 73, 81, 82] and baboon [76]. The more convoluted nasal
passages of most keen-scented (macrosmatic) animals have prevented detailed
experimental airflow measurements using traditional techniques (e.g., thermal
anemometry, particle image velocimetry, etc.). Though newer magnetic resonance
imaging (MRI) flow measurement techniques [83-88] show some promise, presently
computational fluid dynamics (CFD) is the preferred method of obtaining regional
distributions of velocity and temperature or mass concentration in the nasal airways of
various species.
By numerically solving the governing Navier-Stokes equations on a computational grid
representing the nasal airway geometry, airflow patterns in the human, monkey, and rat
nose have been reported in studies of respiratory air conditioning [61, 89, 90], inhalation
toxicology [51, 54, 57, 64, 65, 67], and olfaction [62, 63, 91-94]. Computing airflow
solutions in the human nose becomes difficult at high physiological flow rates, when the

12
physics of turbulence must be modeled. Alternatively, laminar-flow solutions in the
more convoluted nose of the rat require the generation of a very elaborate computational
grid. Nevertheless, the turbinate scrolls of the rat are much simpler than the branched
maxilloturbinate of most carnivores (see [13]), making grid generation for nasal airflow
simulations in these animals even more challenging. To date, a proper study of the
airflow in the complex nasal cavity of a macrosmatic carnivore has never been done.
Consequently, the internal aerodynamics of the nose and the implications for respiratory
air conditioning and olfaction in these species is not well understood.
In any CFD calculation, the fidelity of the solution depends on both the numerical
method and the computational grid employed. The inherent numerical error of a
particular CFD discretization scheme is given by its formal order of accuracy. Given
practical levels of grid resolution, first-order numerical methods often yield smooth,
convergent CFD solutions that are typically erroneous and corrupted by artificial
dissipation. Higher-order methods of at least second-order accuracy are more acceptable,
and are generally required in order to obtain a physically-realistic numerical solution.
Unfortunately, few CFD studies of nasal airflows have reported the formal order of
accuracy of their numerical methods.
Grid resolution and quality also contribute to numerical accuracy. High grid densities
are required to resolve near-wall gradients, secondary flows, and other small-but-
important solution features. Analogously, in transient calculations the temporal accuracy
is a function of the time step size. Grid quality metrics such as cell skewness, aspect

13
ratio, and smoothness affect numerical accuracy, albeit to a lesser degree since grid
quality may be optimized during grid generation.
For highly-convoluted geometries like nasal airways, geometric preservation during
grid generation introduces another potential source of error. Excessively-coarse
computational grids fail to capture intricate geometric features, such as curvature,
resulting in highly-faceted surface grids that poorly represent the original geometry. As
the grid resolution increases, the original geometry is more faithfully captured and is
exactly recovered in the limit when the surface grid resolution equals the geometric
resolution of the original reconstructed surface model.
Overall, since the aforementioned errors are not independent, the cumulative numerical
error must be assessed by a grid convergence study (and a time step study, for transient
calculations) based on the generalized theory of Richardson Extrapolation [95]. Using a
previously-verified and validated code does not guarantee an accurate solution when
applied to a new problem; new calculations must be verified by performing grid
convergence tests to band the numerical error of the solution [95]. Thus far, no CFD
studies of flow in the upper airways of any animal have included such an analysis [67],
raising the question: how accurate are these computed results?
1.2.7 Modeling Olfactory Mass Transport Phenomena
Olfactory mass transport phenomena include a combination of convective mass transfer,
vapor deposition, and molecular diffusion. Odorant molecules are first inspired through
the naris and advected with the flow to the olfactory part of the nose, i.e. the ethmoidal

14
region of the canine. As odorant-laden air flows through the airways of the olfactory
region, vapor molecules are absorbed by the mucus phase at the air-mucus interface.
Molecular diffusion then transports the molecules through the mucus layer to olfactory
receptor sites on olfactory cilia. Here, G protein-coupled receptors bind the odorant
molecules, thereby initiating neural signal transduction to the olfactory part of the brain,
where olfactory perception occurs.
The physics of steady olfactory mass transport was first modeled by Hahn et al. [48] for
one-dimensional flow through the human nasal cavity. More recently, steady-state mass
transport phenomena have been modeled for three-dimensional olfactory airflow in the
human and rat (e.g., [63, 91-93]). Each of these models includes the latter odorant
transport stages of vapor deposition and diffusion in the mucus layer by incorporating a
modified surface boundary condition at the airway walls for the air-phase species
transport equation. The modified boundary condition is derived a priori from the steady-
state solution of the diffusion equation in the mucus layer, providing a homogeneous
Robbins boundary condition [63] on the air-phase odorant concentration and the normal
flux at the surface.
In principle, the foregoing methodology works for steady-state olfactory mass
transport, but is invalid when diffusion in the mucus layer is inherently unsteady. For
example, consider a mucus layer of thickness Hm ~ 10 μm and an odorant with a
diffusion coefficient in mucus Dom ~ 1x10⁻⁹ m2/s, both realistic values [24, 96]. The time
required for diffusion in the mucus layer to reach steady-state may be approximated from
Equation 1.1: ~ 0.1 seconds. Thus, the steady-state assumption is valid only when the

15
time scale of olfactory airflow (i.e., of a sniff) is greater than roughly 0.1 seconds,
regardless of whether or not the flow is “quasi-steady”.
2~ /m ot H D m
(1.1)
In general, humans sniff at a frequency of 0.3 – 0.7 Hz [97], whereas most other species
(e.g., rats, rabbits, dogs) sniff much faster, in the 4 – 7 Hz range [98-101]. Thus, the time
scale for human olfaction permits a steady-state diffusion assumption, but olfactory mass
transport for the other species is an inherently unsteady phenomenon, invalidating the
above-described methodology. For these animals a fully-transient model of olfaction is
required, which to date has yet to be considered.
For steady olfaction, previous studies (e.g., [48, 63, 92, 93, 102-106]) have shown that
odorant deposition is mainly a function of two variables, the odorant partition coefficient
and the airflow rate. Depending on the partition coefficient, which is a measure of the
solubility of a vapor into the mucus phase, differential odorant absorption along the
olfactory flow path results in a chromatographic1-like separation of various odorant
vapors. Varying the airflow rate changes the differential separation pattern of each
odorant. The combination of this phenomenon with the inherent spatial distribution of
olfactory receptors within the olfactory region of the nasal cavity aids olfactory
discrimination [33, 107].
Finally, though the influence of a few nondimensional parameters on steady olfaction
has been considered (e.g., [63]), a proper dimensional analysis and parametric study has
1 In gas chromatography, different gas species separate from a mixture as a function of distance along a long, specially-coated tube.

16
not been performed. Dimensional scaling of unsteady olfactory transport phenomena has
been completely neglected. Consequently, the physics of vertebrate olfaction is not fully
understood.
1.3 Objectives
The objective of this study is to acquire a fundamental understanding of the anatomy and
physics of canine olfaction. High-resolution magnetic resonance imaging (MRI) scans of
a cadaver specimen are used to obtain a complete anatomic model of the dog’s nose and
associated morphometric statistics. Unique experimental data of canine sniffing are
acquired and are used to characterize canine olfactory airflow. A high-fidelity CFD
model is developed, and results of the external and internal aerodynamics of canine
olfaction are presented. The physics of olfactory mass transfer are then considered and a
numerical model is developed and used to characterize odorant transport in the olfactory
region of the canine. The results of this study may be used to suggest key design
elements for biomimetic sniffers for chemical trace detection.
Chapter 2
Reconstruction and Morphometric Analysis of the
Canine Nasal Airway and Implications Regarding
Olfactory Airflow
2.1 Materials and Methods
The Materials and Methods include a brief description of the cadaver specimen and high-
resolution Magnetic Resonance Imaging (MRI) of the canine nasal cavity. A
methodology for reconstructing a surface model from MRI scans is described, followed
by the development of a technique for extracting detailed morphometric airway data.
Finally, relevant nondimensional parameters for characterizing olfactory airflow are
defined.
2.1.1 Specimen
A female Labrador retriever mixed-breed canine cadaver, weighing approximately 29.5
kgf (65 lb), was obtained from Sargeant’s Wholesale Biologicals (4900 Lisa Marie Court,
Bakersfield, CA 93313). The animal was euthanatized with a standard, intravenously
delivered euthanasia solution (primary active ingredient: sodium pentobarbital). After
death was certain, the animal’s common carotid arteries were cannulated in both the

18
proximal and distal directions and the external jugular vein was transected to allow free
flow of blood. No pre-fixative flushing solution was used. Following perfusion with
fixative (7 % formaldehyde, 3.5 % glycerin, 3.5 % ethylene glycol, 3.5 % phenol, and 3.5
% methanol), injections of natural rubber latex containing blue dye were made into the
cannulated arteries, external jugular veins, a femoral vein, and a cephalic vein. A volume
of approximately 350 ml of latex was introduced until back pressure was detected from
the syringe. The head was removed and the tissues forming the nasal cavity were
dissected from the rest of the head. The facial index (see [12]) of the specimen was
measured to be approximately 110, indicating a mesaticephalic skull type.
The nasal cavity specimen consisted of the skeletal muzzle, the most rostral boundary
of the braincase, the hard palate, and the nasopharynx. The skeletal muzzle included the
incisive, vomer, and maxilla bones and the nasal bones and their attached nasal cartilages.
External skin, muscle, and other tissues were removed from the external surface of the
skeletal muzzle. Mucosa, septa, and conchae of the nasal cavity were undisturbed. The
most rostral boundary of the braincase formed the caudal skeletal boundary of the nasal
cavity specimen and consisted mainly of the ethmoid bone and its ethmoturbinates, small
pieces of the frontal, lacrimal, and zygomatic bones attached to it, and the skeletal muzzle
bones. The hard palate consisted of the incisive, maxilla, and palatine bones and their
mucosal coverings. Finally, the presphenoid, palatine, pterygoid, and basisphenoid bones,
their mucosal coverings, and the attached soft palate comprised the nasopharynx.
Compared to the normal physiologic state, shrinkage of soft tissue by fixatives has been
reported to be typically less than 10 % [108]. However, given that the soft tissues of
19
present interest (respiratory and olfactory epithelia) line a rigid bony cavity, tissue
shrinkage is not expected to significantly affect the airway dimensions. Indeed, Menache
et al. [56] were unable to measure size or shape changes in nasal tissue due to fixation.
They concluded that “size changes reported for soft tissues may not be as extensive in the
nasal cavity because more rigid tissues such as the bone surround the nasal cavity.”
Furthermore, in the present specimen, the latex-filled blood vessels (down to larger
arterioles and venules) probably offsets tissue volume lost to fixative-induced shrinkage.
However, this was not confirmed by measurements comparing fresh, unfixed specimens
and fixed, uninjected specimens with the fixed, injected specimen used in this study.
2.1.2 Magnetic Resonance Imaging
Compared with early histological sectioning techniques (e.g., [51, 64, 65]), modern
imaging modalities provide a more complete anatomic description in a digital format
desirable for computational analysis and three-dimensional reconstruction [66, 67].
Furthermore, because of the present need for high-resolution data of not only the bony
structures in the nasal cavity but also the soft tissue, MRI is the preferred modality. As
noted by De Rycke et al. [45], who compared CT and MRI scans of the nasal cavities and
paranasal sinuses in normal mesaticephalic dogs, MRI is superior to CT at resolving soft-
tissue structures.
A large-breed canine specimen was chosen for the size of its nasal cavity, compared to
that of smaller breeds (e.g., English beagle). Imaging the airway structure of the larger
breed leads to higher inherent spatial resolution for a given acquisition time.

20
Specifically, for a given field-of-view and slice thickness, each of the physical structures
in the nasal cavity of a large specimen is represented by a greater number of volume
elements (voxels), compared to the case of a smaller specimen. Alternatively, imaging a
smaller specimen using a smaller field-of-view results in a data matrix of voxels each
containing fewer protons per voxel. Consequently, a longer acquisition time is required
to recover the same signal-to-noise ratio obtained in the previous case.
For scanning, the cadaver specimen was placed in a plastic cylinder (17 cm length, 9.5
cm inner diameter) with an inlet and outlet pipe. Glass beads (6.0 to 10.0 mm diameter)
were placed in the cylinder, surrounding the sample, and degassed water was added to fill
the cylinder. Trapped air was removed from the specimen by applying partial vacuum to
the cylinder inlet, since small air bubbles not only result in signal voids, but also in
distortion of the MRI scans due to magnetic susceptibility effects. The glass beads were
required for mechanical stability of the specimen during scanning, since the rapid
switching of the magnetic field gradients can otherwise cause vibration. Additionally, the
glass beads were used to limit the total volume of water surrounding the specimen, which
otherwise could lead to complications with the MR receiver dynamic range and
inhomogeneities in the RF field within the specimen.
All scans were performed using a Varian 7-Tesla magnet operated by a VNMRS
console. The gradients (Magnex, SGRAD 305/210/HD/S) had an inner diameter of 21
cm, with maximum gradient strength of 200 mT/m, and a linear region (± 6 %) of 12.0
cm. The RF coil was a quadrature birdcage design with an inner diameter of 14.0 cm.
Since the length of the present specimen (approximately 14 cm) was longer than the
21
linear region of the magnetic field gradients and the homogeneous region of the detector
coil, sets of composite scans were acquired with the sample placed in three different
overlapping axial positions. The slice thickness obtained here was 200 μm, with an in-
plane spatial resolution of 180 x 180 μm (75.6 x 75.6 mm field-of-view, 420 x 420 data
matrix). The first and the third data sets (of the rostral and caudal regions of the nose,
respectively) contained 250 slices each, while the second data set (of the intermediate
region) consisted of 450 slices. Data acquisition for each section was performed in five
(data sets 1 and 3) or nine (data set 2) interleaved subsets of 50 slices each (the gap
between slices of a subset was 800 μm) to avoid saturation effects due to imperfect slice
excitation profiles. The minimum value of the repetition time (TR) of the spin echo
sequence was limited by the duty cycle of the gradients and was set to 6 s for the smaller
and 10 s for the larger data sets. All scans had the same echo time (TE) of 12.5 ms. The
data acquisition time for the entire data set was 75 hours.
2.1.3 Surface Reconstruction
The process of converting the raw MRI slices to a three-dimensional surface model is
illustrated in Figure 2.1. First, image processing of the raw MRI data was required to
obtain optimal image quality for image segmentation. Image segmentation, or
partitioning an image into its elemental regions or components, of complicated images
such as airways is an extremely difficult task [109]. Here, segmentation of a high-
contrast image is desirable, with a sharp distinction between airway and tissue. Hence,

22
the raw MRI slices were masked and filtered, and then the airway/tissue contrast was
maximized based on a histogram analysis of gray level intensities.
Figure 2.1: Three-dimensional surface reconstruction methodology
The region-of-interest was first restricted to only the nasal airway by applying a mask
to the raw images. Next, a 3 x 3 median filter was applied. The nonlinear nature of this
filter permits effective removal of noise while preserving edges in an image, making it
ideal for filtering airway data. The image contrast was then enhanced by applying a
linear contrast stretch to each slice. Though much improved, remaining random noise in
some of the images prevented optimal image contrast and, more importantly, uniform
contrast between consecutive images. Thus, based on a histogram analysis of the gray
level intensities in various slices, a “controlled” saturation was used, where a small

23
fraction of the brightest pixels in each slice were saturated, yielding a uniform, high-
contrast data set. Figure 2.2 shows a comparison of a raw and processed MRI slice.
Figure 2.2: Comparison of a raw (left) and processed MRI slice (right) (axial location:
41.6 mm from the tip of the naris). Images are proton density weighted. Glass beads
appear as dark circles in the raw slice.
Next, because the data were acquired as three partially-overlapping sets, image
registration (i.e., dataset alignment) was required. This consisted of digitally rotating and
translating datasets 1 and 3, relative to dataset 2, by an optimal angle and number of
pixels, respectively. Optimal values were obtained by maximizing the correlation
24
coefficient between the overlapping images of datasets 1 and 2 and 2 and 3 (see [109]).
This resulted in complete alignment of all three datasets.
Image segmentation consisted of partitioning only the nasal airways of the left nasal
cavity, assuming bilateral symmetry. Due to preliminary image processing, segmentation
of large airways was trivial and was mostly accomplished via algorithmic schemes that
included region growing, thresholding, contour extraction via edge detection, and contour
interpolation and extrapolation in the axial direction. However, for small airways near
the resolution threshold, which have only 5 to 6 voxels across their width, the air/tissue
interface becomes less distinct. In these regions segmentation was highly interactive,
ranging from manual correction of errors incurred by the algorithmic schemes to fully-
manual segmentation. The uncertainty in manual segmentation of the smallest airways in
the conchae is estimated to be ± 1–2 voxels.
Finally, a three-dimensional surface model was generated from the segmentation results
via a modified form of the Marching Cubes algorithm [110]. The surface is represented
as a triangulated mesh, where each triangle is defined by a normal, outward-facing vector
and three vertices. Slight subsequent surface smoothing was then performed to reduce
“staircasing”.
In general, several surface smoothing algorithms exist, some of which can significantly
corrupt the three-dimensional model (for instance, by not preserving the internal volume).
The particular algorithm used here smoothes a triangulated surface by shifting its vertices
[111]. The quality of the smoothed surface is controlled by two parameters: a smoothing
“factor” (i.e., a coefficient that restricts the degree of vertex shift) and the number of

25
smoothing iterations. In smoothing the reconstructed surface of the canine nasal airway,
these parameters were chosen such that the internal volume of the original model was
preserved. A comparison between the original and smoothed models shows a 0.05 %
difference in internal volume.
2.1.4 Airway Morphometry
Morphometric analysis of the canine nasal airway was performed using a custom image
processing program developed and thoroughly validated in-house. Airway perimeter (P)
and cross-sectional area (Ac) were obtained directly from the segmented slices. The total
airway perimeter in each two-dimensional slice was determined by first extracting the
airway boundary (see [109]). Given the in-plane spatial resolution of the data, the
perimeter was then calculated by considering the connectivity of the resultant boundary
pixels. The cross-sectional area, on the other hand, was calculated as the product of the
total number of segmented airway pixels and the square of the in-plane spatial resolution.
Additional parameters, the hydraulic diameter (Dh), cumulative surface area (As),
cumulative internal volume (V), and fractal dimension of the perimeter (D), were
calculated as functions of axial location from Equations 2.1─2.4 given below,
respectively, where z is the axial coordinate.
The hydraulic diameter applies to any pipe or duct, including airways, and is commonly
used in fluid dynamics to characterize flow in noncircular channels [46]. Physically, the
hydraulic diameter represents the characteristic airway diameter/width.
26
P
AhD c4
= (2.1)
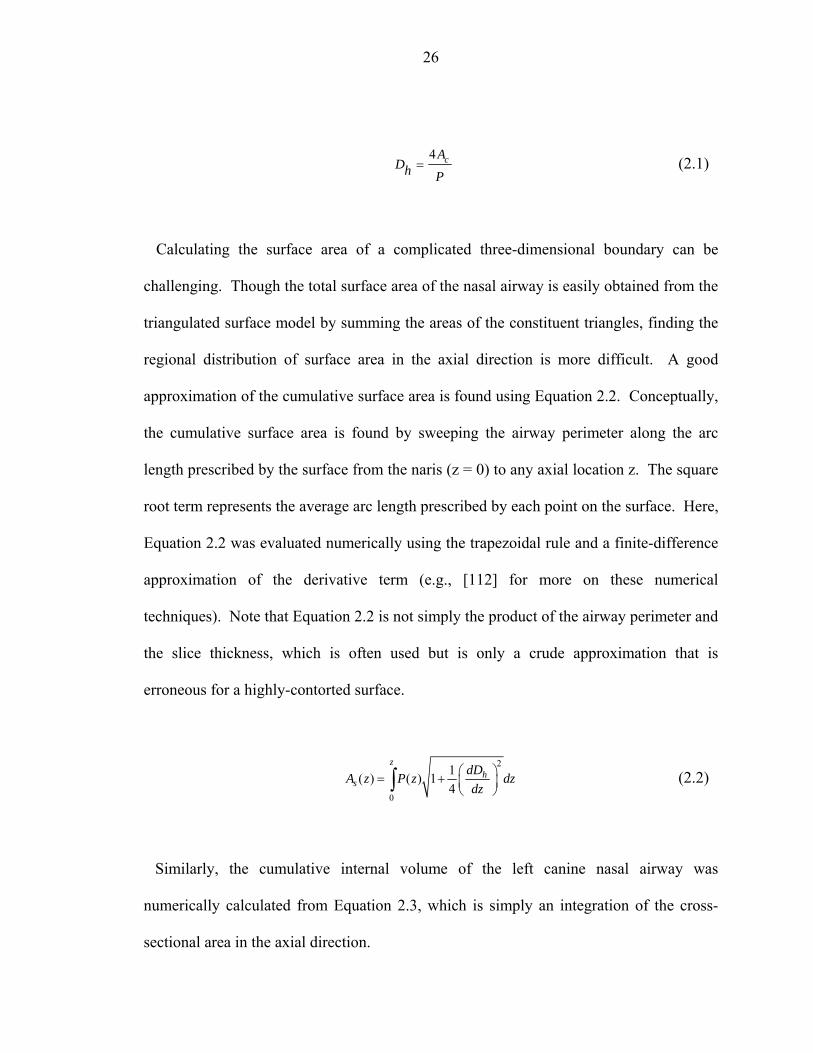
Calculating the surface area of a complicated three-dimensional boundary can be
challenging. Though the total surface area of the nasal airway is easily obtained from the
triangulated surface model by summing the areas of the constituent triangles, finding the
regional distribution of surface area in the axial direction is more difficult. A good
approximation of the cumulative surface area is found using Equation 2.2. Conceptually,
the cumulative surface area is found by sweeping the airway perimeter along the arc
length prescribed by the surface from the naris (z = 0) to any axial location z. The square
root term represents the average arc length prescribed by each point on the surface. Here,
Equation 2.2 was evaluated numerically using the trapezoidal rule and a finite-difference
approximation of the derivative term (e.g., [112] for more on these numerical
techniques). Note that Equation 2.2 is not simply the product of the airway perimeter and
the slice thickness, which is often used but is only a crude approximation that is
erroneous for a highly-contorted surface.
2
0
1( ) ( ) 14
zh
sdDA z P z ddz
⎛ ⎞= + ⎜ ⎟⎝ ⎠∫ z (2.2)
Similarly, the cumulative internal volume of the left canine nasal airway was
numerically calculated from Equation 2.3, which is simply an integration of the cross-
sectional area in the axial direction.

27
(2.3) 0
( ) ( )z
cV z A z dz= ∫
The fractal dimension of the airway perimeter, D, was calculated from the area-
perimeter relation of Mandelbrot [113], Equation 2.4. Physically, D characterizes the
degree of geometric complexity or contortion of the airway boundary [114].
~D
cP A (2.4)
An uncertainty analysis was carried out. The error associated with operator uncertainty
in segmentation of the smallest airways is estimated to be ~5 % for cross-sectional area,
hydraulic diameter, cumulative surface area, cumulative internal volume, and fractal
dimension, whereas the airway perimeter is rather insensitive to operator uncertainty (0.3
% error).
Lastly, an extensive validation of the custom image processing program was conducted
by comparing the morphometric statistics of various three-dimensional surfaces (cube,
sphere, cylinder, and cone) to known geometric formulas. Comparison of the output with
theory resulted in negligible error for all morphometric data.
2.1.5 Functional Implications
The functional implications of the anatomy and morphology of the canine nasal airway
regarding olfaction make use of the dimensionless Reynolds (Re) and Womersley (Wo)

28
numbers, Equations 2.5 and 2.6, respectively. Here, Vave is the cross-sectional average
velocity, ν is the kinematic viscosity of air, and f is the sniff frequency in units of Hz
(sniffs per second). For canine sniffing the peak Vave at the naris on inspiration has been
measured to be roughly 20 m/s, while f was shown to be approximately 5 Hz (see
Chapter 3).
Re ave hDh
V Dυ
= (2.5)
22Dh
D fhWo πυ
= (2.6)
Physically, the Reynolds number is the ratio of inertial to viscous forces in the nasal
airflow. For steady or quasi-steady flow, low Reynolds numbers (ReDh < 2000) generally
indicate laminar flow, while high-Reynolds-number flow is typically turbulent.
Similarly, the magnitude of the Womersley number is an indicator of the degree of
unsteadiness in the flow [115]. In general, when Wo < 1, the flow may be approximated
as quasi-steady, meaning the time-dependent solution is simply a superposition of steady-
state solutions. However, as the Womersley number grows larger than unity, the flow
increasingly deviates from quasi-steady behavior, tending toward fully-transient flow.
29
2.2 Results
From the MRI scans, the present cadaver specimen represents a credible example of a
large mesaticephalic canine nasal cavity per comparison with [12, 16, 43-45]. The
following results represent the most detailed anatomic data and measurements yet made
of a canine nasal specimen.
As reported by Dodd and Squirrel [116] (cited in [117]), a range of anatomic
measurements is found in various dog breeds. In mammals the nasal airway dimensions
depend on the size and age of the animal [43, 49, 50]. Further, due to the nasal cycle (see
[19, 118]), in vivo airway measurements will vary for the same subject, depending on the
degree of nasal turbinate engorgement [119]. Nonetheless, given slight intraspecies
variability, the morphometric characteristics (e.g., the regional distribution of surface
area) of the nasal airway of other macrosmatic animals have been shown to be
remarkably uniform [49, 50].
Studying a range of canine specimens at this level of detail is not presently practical
and is well beyond the present scope. Instead, a detailed comparison of various anatomic
regions within a typical mesaticephalic canine nasal cavity is given. Following the
results presented here, a discussion and comparison with limited data from the
mesaticephalic beagle is given in the subsequent section.
2.2.1 Nasal Airway Anatomy
The product of the segmentation consists of a binary data set where 1’s represent airway
and 0’s tissue/exterior. Consequently, the left airway structure is clearly distinguished
30
from surrounding tissue. Figure 2.3 illustrates twenty transverse cross-sections of the
segmented airway at various axial locations out of 668 total slices. Approximate
locations of each of the anatomic regions (nasal vestibule, maxilloturbinate,
nasomaxillary, ethmoidal, and frontal sinus) are indicated.
Here the nasomaxillary region refers to the axial portion of the nasal cavity between the
maxilloturbinate and ethmoidal regions, where the nasomaxillary opening is located
ventrally. The maxilloturbinate and ethmoturbinates, which are outgrowths of the
maxilla and cribriform plate, respectively, terminate within this region. Functionally, this
portion of the nasal cavity serves as a region of morphologic transition from the
maxilloturbinate region to the ethmoidal region. This is further demonstrated in Figure
2.4, which shows a sagittal section of the airway obtained by ensemble averaging
multiple sagittal plane slices. This technique, which has potential for broad application in
other fields (e.g., [120]), yields an anatomic section, similar to an anatomic drawing (e.g.,
[12]), that represents the most prominent airway structures.
During sniffing for olfaction the nostrils of the dog dilate, changing the conformation of
the nasal vestibule [12]. From high-speed videography of canine sniffing, dilation of the
nostrils during inspiration opens a direct pathway above the alar fold to the dorsal meatus
[2, 121]. From Figure 2.4, once air enters the dorsal meatus a direct flow path to the
ethmoidal region (i.e., the olfactory region) is seen to exist. Thus, the dorsal meatus
functions as a bypass for odorant-bearing inspired air, around the tortuous
maxilloturbinate to the ethmoidal region, during sniffing.

31
Figure 2.3: Transverse airway cross sections at various axial locations. a, naris; b, mid-lateral slit; c, alar fold; d, dorsal
meatus; e, dorsal concha; f, middle meatus; g, ventral concha (maxilloturbinate); h, common meatus; i, ventral meatus; j,
nasopharyngeal meatus; k, maxillary recess; l, ethmoidal conchae (ethmoturbinates)
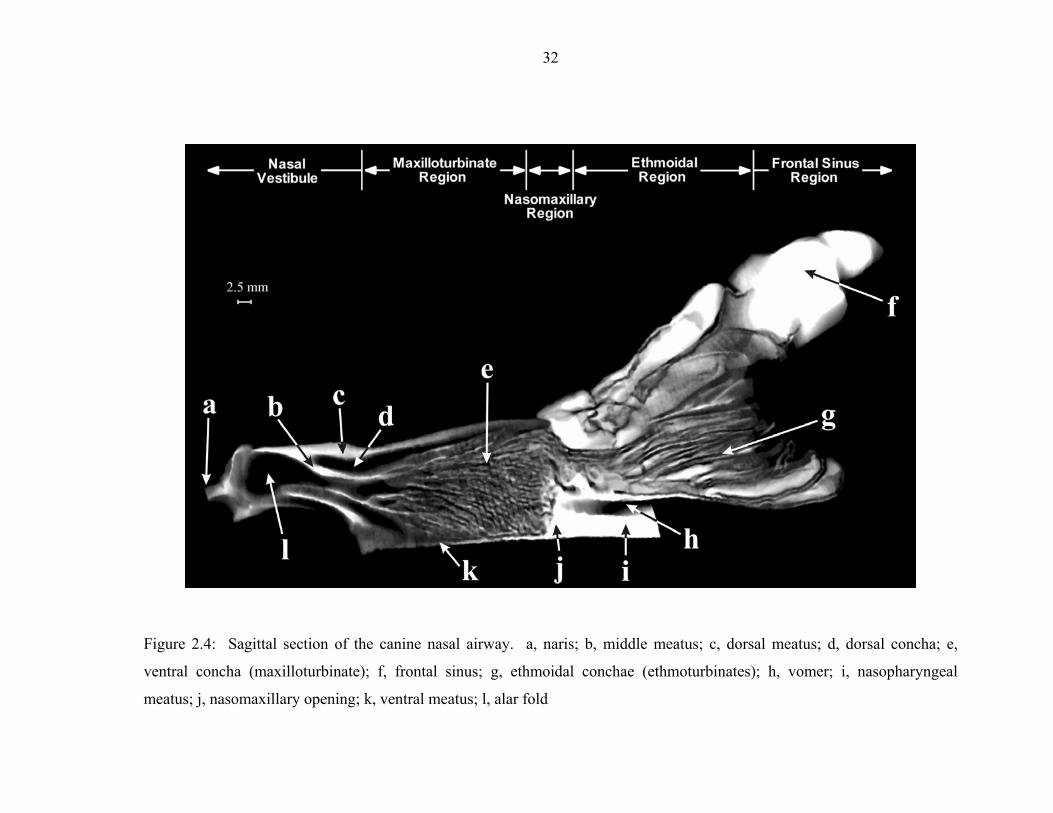
32
Figure 2.4: Sagittal section of the canine nasal airway. a, naris; b, middle meatus; c, dorsal meatus; d, dorsal concha; e,
ventral concha (maxilloturbinate); f, frontal sinus; g, ethmoidal conchae (ethmoturbinates); h, vomer; i, nasopharyngeal
meatus; j, nasomaxillary opening; k, ventral meatus; l, alar fold

33
2.2.2 Surface Reconstruction
The three-dimensional surface reconstruction, described earlier, resulted in a triangulated
surface model containing nearly 10 million total elements. For reference, Figure 2.5
illustrates the orientation of the three-dimensional model, relative to the external cranial
anatomy. Figure 2.6 shows several three-dimensional views of the airway model
following slight surface smoothing.
Figure 2.5: Three-dimensional surface model of the left canine nasal airway
appropriately oriented relative to the external cranial anatomy. (External anatomy
reconstructed from Computed Tomography (CT) data, courtesy T.S. Denney, Jr.)
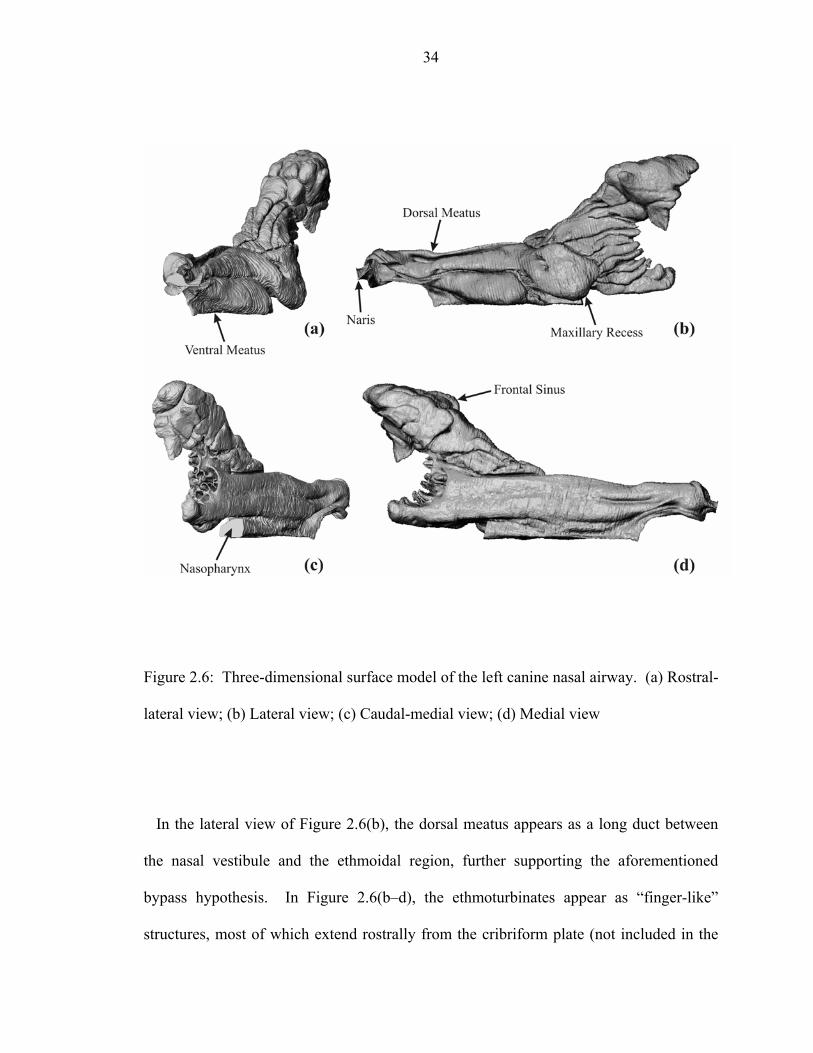
34
Figure 2.6: Three-dimensional surface model of the left canine nasal airway. (a) Rostral-
lateral view; (b) Lateral view; (c) Caudal-medial view; (d) Medial view
In the lateral view of Figure 2.6(b), the dorsal meatus appears as a long duct between
the nasal vestibule and the ethmoidal region, further supporting the aforementioned
bypass hypothesis. In Figure 2.6(b–d), the ethmoturbinates appear as “finger-like”
structures, most of which extend rostrally from the cribriform plate (not included in the
35
airway model), while a few of the dorsal-most ethmoturbinates appear to become
confluent with the frontal sinus caudally.
2.2.3 Airway Morphometry
Morphometric analysis of the canine nasal airway was conducted by examining
distributions of perimeter, cross-sectional area, hydraulic diameter, and surface area.
Additionally, the fractal dimensions of the maxilloturbinate and ethmoidal airways are
considered. Figure 2.7 contains plots of perimeter and cross-sectional area versus axial
location. The locations of the various anatomic regions are shown for reference.
Figure 2.7: Distribution of perimeter, P, and cross-sectional area, Ac, with axial
coordinate in the canine nasal airway
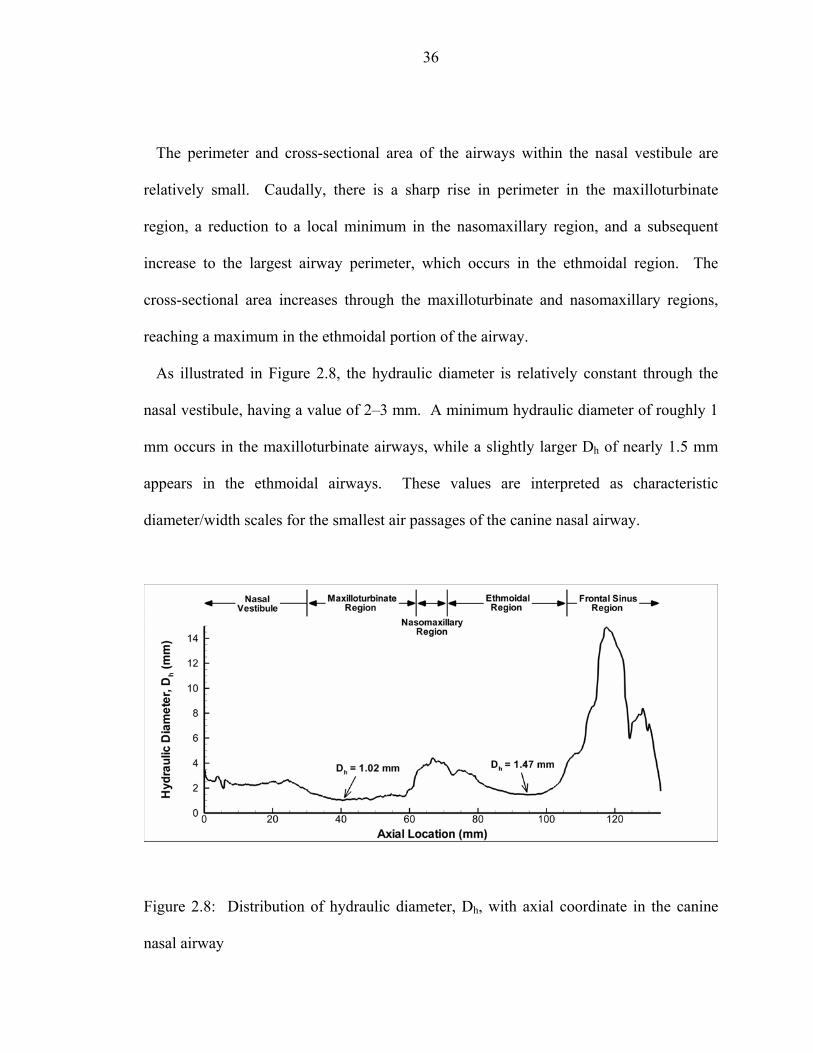
36
The perimeter and cross-sectional area of the airways within the nasal vestibule are
relatively small. Caudally, there is a sharp rise in perimeter in the maxilloturbinate
region, a reduction to a local minimum in the nasomaxillary region, and a subsequent
increase to the largest airway perimeter, which occurs in the ethmoidal region. The
cross-sectional area increases through the maxilloturbinate and nasomaxillary regions,
reaching a maximum in the ethmoidal portion of the airway.
As illustrated in Figure 2.8, the hydraulic diameter is relatively constant through the
nasal vestibule, having a value of 2–3 mm. A minimum hydraulic diameter of roughly 1
mm occurs in the maxilloturbinate airways, while a slightly larger Dh of nearly 1.5 mm
appears in the ethmoidal airways. These values are interpreted as characteristic
diameter/width scales for the smallest air passages of the canine nasal airway.
Figure 2.8: Distribution of hydraulic diameter, Dh, with axial coordinate in the canine
nasal airway

37
Figure 2.9 shows the distribution of cumulative surface area through the nasal cavity.
The total surface area of the left nasal airway is 411 cm2. Surface areas associated with
the nasal vestibule, nasomaxillary region, and frontal sinus are small compared to that of
the maxilloturbinate and ethmoidal airways, roughly 120 cm2 and 210 cm2, respectively.
Clearly, the contortions and scrollwork of the nasal conchae dramatically increase the
surface area. Physically, this facilitates heat and mass transfer in the nasal cavity. That
is, the large surface area of the maxilloturbinates warms and humidifies inspired air,
while the even-larger surface area of the ethmoturbinates collects odorant molecules
efficiently.
The total surface area contained within the ethmoidal region is nearly twice that of the
maxilloturbinate region. Although heat and mass transfer occur by analogous physical
mechanisms [122], a substantially larger portion of the total nasal internal surface area is
devoted to olfactory mass transfer than to heat transfer.
Two functional explanations for the disparity in regional surface area apply here. First,
the epithelium covering the ethmoturbinates has regional selectivity [123]. That is, not
all odorant receptors are expressed in all parts of the olfactory epithelium; there is a
certain areal distribution for each receptor type. This is not true for the respiratory
epithelium, which covers the maxilloturbinates and does not serve in odorant
discrimination. Consequently, the surface area of the ethmoidal region represents what is
required for selective olfactory mass transfer, while the non-selective transfer of heat and
moisture in the maxilloturbinates requires less surface area.
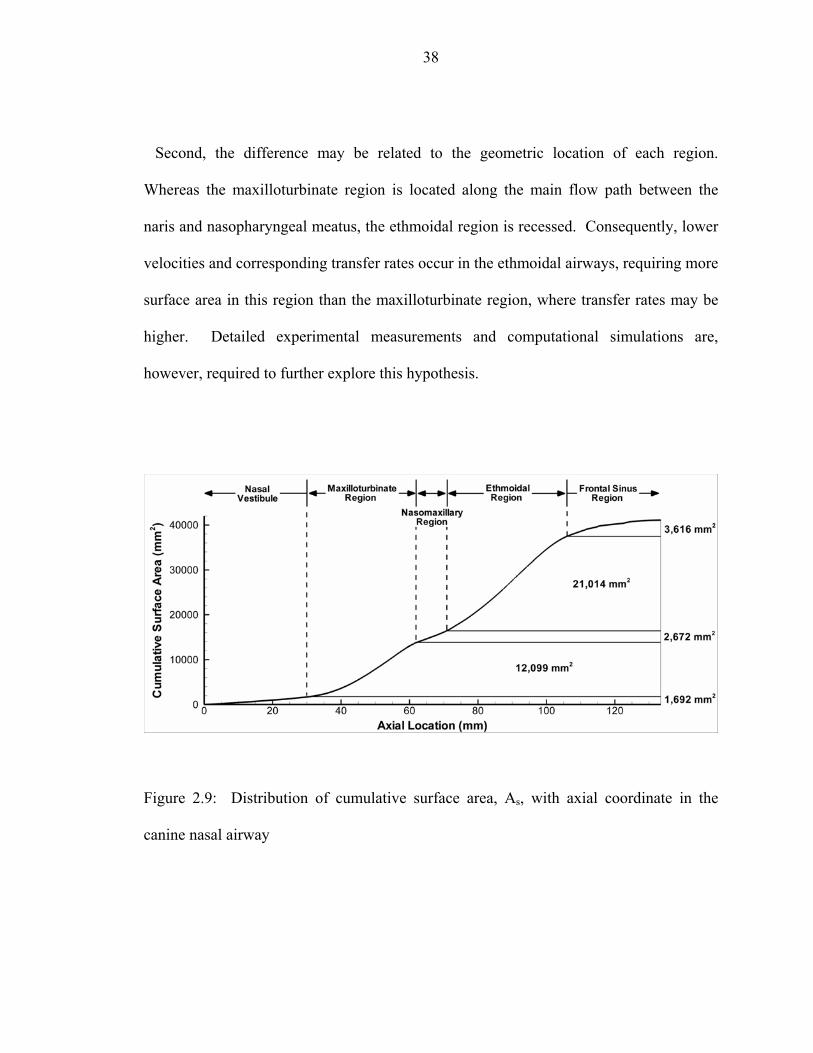
38
Second, the difference may be related to the geometric location of each region.
Whereas the maxilloturbinate region is located along the main flow path between the
naris and nasopharyngeal meatus, the ethmoidal region is recessed. Consequently, lower
velocities and corresponding transfer rates occur in the ethmoidal airways, requiring more
surface area in this region than the maxilloturbinate region, where transfer rates may be
higher. Detailed experimental measurements and computational simulations are,
however, required to further explore this hypothesis.
Figure 2.9: Distribution of cumulative surface area, As, with axial coordinate in the
canine nasal airway

39
The cumulative internal volume of the left nasal cavity was calculated. The largest
volumes occur in the ethmoidal and frontal sinus regions, 10.9 cm3 and 5.9 cm3,
respectively. The total internal volume of the nasal cavity is 24.4 cm3.
Lastly, the geometric complexity of the maxilloturbinate and ethmoidal airway
structures, in terms of the fractal dimension of the perimeter, is examined. Figure 2.10 is
a plot of the area-perimeter relation (Equation 2.4) well within each region. The mean
fractal dimension (calculated from the slope of the log Ac - log P curve) of the
maxilloturbinate airways is 1.73 (R2 = 0.98), while D of the ethmoidal airways is 1.11 (R2
= 0.93). Thus, the boundary of the maxilloturbinate airways is more complex than the
boundary of the ethmoidal airways. This quantitatively confirms the observation of
Schreider and Raabe [43] that the maxilloturbinates of the dog appear more complex than
the ethmoturbinates.
This structural difference is a result of the developmental nature of the nasal conchae
and how each structure ramifies within the nasal cavity. Functionally, the structural
difference may occur in part from the need for plentiful vasculature in the
maxilloturbinates (but not in the ethmoturbinates) in order to drive heat transfer.
Nonetheless, the “accordion-like” branched maxilloturbinate and the “rolled-up”
ethmoturbinates are both qualitatively and quantitatively distinct structures. Further
study of the functional significance of differences in geometric complexity of these
turbinate structures would be interesting.

40
Figure 2.10: Mean fractal dimension of the maxilloturbinate and ethmoidal airways
2.2.4 Functional Implications
Assuming incompressible airflow, conservation of mass was used to estimate the peak
Reynolds number of the flow on inspiration (Equation 2.5) between the naris and
nasopharynx. Figure 2.11 shows the results. Reynolds numbers well into the ethmoidal
and frontal sinus regions are not shown since the velocity distribution in this recessed
region is not presently known. Nonetheless, during sniffing, the majority of the canine

41
nasal cavity is seen to contain low-Reynolds-number flow, with the minimum Reynolds
number being of order 100.
Axial Location (mm)
Re D
h(p
eak)
0 20 40 60 80 100 1200
1000
2000
3000
4000
5000
Nasopharynx
ReDh = 175
NasalVestibule
NasomaxillaryRegion
MaxilloturbinateRegion
EthmoidalRegion
Frontal SinusRegion
Figure 2.11: Reynolds number distribution in the canine nasal airway at peak inspiratory
flow rate during sniffing
The distribution of the Womersley number in the nasal cavity during sniffing is plotted
in Figure 2.12. For a sniff frequency of 5 Hz, the smallest airways within the
maxilloturbinate and ethmoidal regions are characterized by Wo ~ 1, whereas Wo for the
rest of the nasal cavity exceeds unity. Thus, the overall airflow in the canine nasal airway
during sniffing is likely to be unsteady. Consequently, as opposed to the case of human
olfaction [62, 63], a quasi-steady approximation is not justified for canine olfactory
airflow.
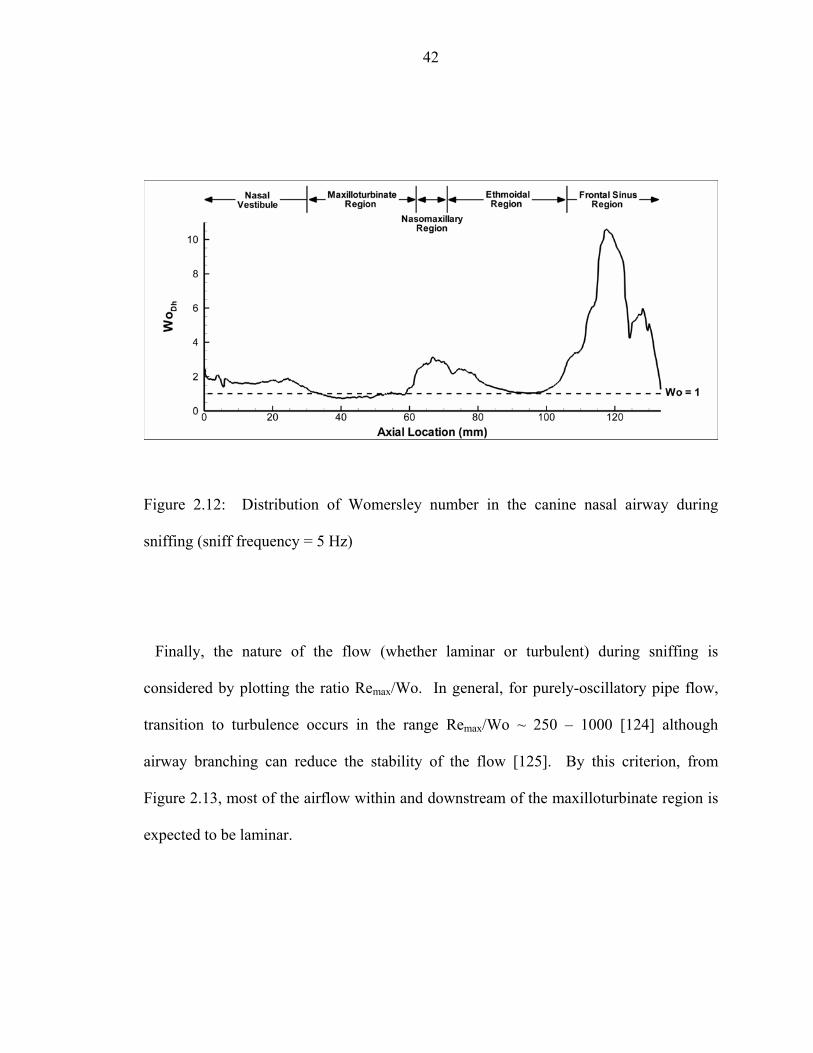
42
Figure 2.12: Distribution of Womersley number in the canine nasal airway during
sniffing (sniff frequency = 5 Hz)
Finally, the nature of the flow (whether laminar or turbulent) during sniffing is
considered by plotting the ratio Remax/Wo. In general, for purely-oscillatory pipe flow,
transition to turbulence occurs in the range Remax/Wo ~ 250 – 1000 [124] although
airway branching can reduce the stability of the flow [125]. By this criterion, from
Figure 2.13, most of the airflow within and downstream of the maxilloturbinate region is
expected to be laminar.

43
Axial Location (mm)
Re D
h(p
eak)
/W
o Dh
0 20 40 60 80 100 1200
500
1000
1500
2000
2500
Nasopharynx
Transitional
Turbulent
Laminar
NasalVestibule
NasomaxillaryRegion
MaxilloturbinateRegion
EthmoidalRegion
Frontal SinusRegion
Figure 2.13: Nature of olfactory airflow in the canine nasal airway
2.3 Discussion
These results from a single canine cadaver are believed to represent the morphometry and
functional implications of mesaticephalic canines in general. To demonstrate this, the
present results are compared in Figure 2.14 to those of the mesaticephalic beagle dog
(weight = 10 kgf) of Schreider and Raabe [43]. In constructing Figures 2.14(a) and (b)
the abscissae have been normalized by the axial location of the choana – the opening of
the nasopharyngeal meatus into the nasopharynx – which was easily identified in each
dataset.

44
Figure 2.14: Comparison of the nasal airway morphometry of a mixed-breed Labrador
retriever (present study) and a beagle [43]. (a) Perimeter; (b) Cross-sectional area
The data of Schreider and Raabe [43] were obtained from tracings of a nasal cast at
approximately every 5 mm in axial location. The airway cast was evidently not complete
in certain regions and did not include the entire frontal sinus region. Nonetheless, the

45
ider and Raabe
[4
morphometric characteristics of the two datasets compare well overall. Apart from
differences in magnitude related to body size, the most obvious discrepancy occurs in the
ethmoidal region. Schreider and Raabe [43] reported difficulty in distinguishing between
parts of the frontal sinuses, which were not cast, and the ethmoturbinates.
In general, this structural similarity agrees with the other results of Schre
3], who considered intraspecies nasal airway structure via a comparison with [126-
128]. They concluded that, despite differences based on size, the airway architecture was
nearly identical for individuals of the same species. Other quantitative studies have
reported similar intraspecies morphometric results for the mouse and rat [49, 50].
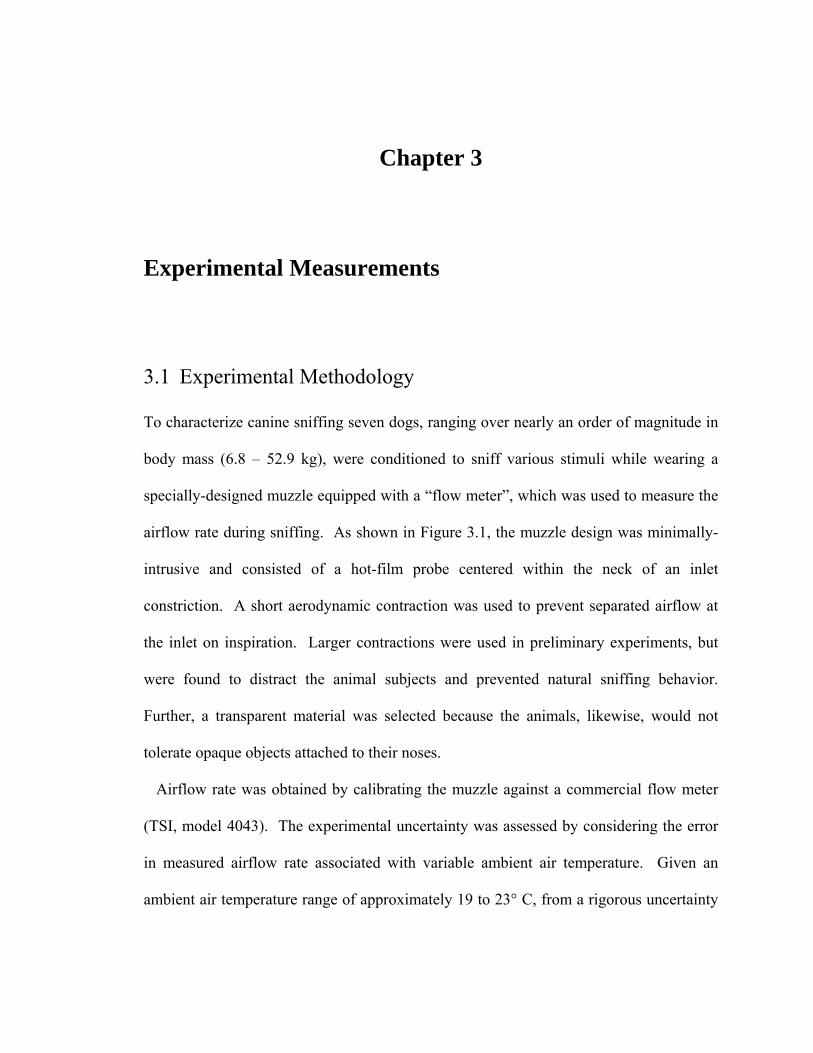
Chapter 3
Experimental Measurements
3.1 Experimental Methodology
To characterize canine sniffing seven dogs, ranging over nearly an order of magnitude in
body mass (6.8 – 52.9 kg), were conditioned to sniff various stimuli while wearing a
specially-designed muzzle equipped with a “flow meter”, which was used to measure the
airflow rate during sniffing. As shown in Figure 3.1, the muzzle design was minimally-
intrusive and consisted of a hot-film probe centered within the neck of an inlet
constriction. A short aerodynamic contraction was used to prevent separated airflow at
the inlet on inspiration. Larger contractions were used in preliminary experiments, but
were found to distract the animal subjects and prevented natural sniffing behavior.
Further, a transparent material was selected because the animals, likewise, would not
tolerate opaque objects attached to their noses.
Airflow rate was obtained by calibrating the muzzle against a commercial flow meter
(TSI, model 4043). The experimental uncertainty was assessed by considering the error
in measured airflow rate associated with variable ambient air temperature. Given an
ambient air temperature range of approximately 19 to 23° C, from a rigorous uncertainty

47
analysis the overall error in these measurements was shown to be well-bounded by ± 10%
experimental uncertainty.
Figure 3.1: Special-purpose muzzle equipped with a hot-film probe, used for airflow
measurements of canine sniffing. (a) side-view (b) close-up of hot-film probe
Using a behavioral conditioning paradigm, each of the animal subjects was trained to
sniff various odor stimuli during continuous presentation, with “treats” as a reward
(Figure 3.2). Odor stimuli consisted of an assortment of food (e.g., peanut butter, fresh
fruit, meat, cheese) and neutral objects. In this study, long series of sniffs were desired,
hence odors were presented continuously. In contrast, animals trained to sniff for odorant
discrimination or localization tasks via operant conditioning sniff only once or twice in a
given experimental trial (e.g., [98, 99]).

48
Figure 3.2: Schematic illustration of experimental sniffing measurements
This particular technique permitted accurate measurement of inspiratory airflow rate
during long bouts of sniffing, but limited the accuracy of expiratory flow rate
measurements due to highly non-uniform airflow in the neck of the constriction
associated with the ventral-laterally directed turbulent expired air jet (see Chapter 5). As
a result, expiratory measurement results are not presented, though the qualitative
characteristics are discussed. Nonetheless, compared with sniffing measurements made
using a pneumotachometer (e.g., [98]), the present technique has minimal flow resistance
and less of an influence on natural sniffing behavior.
In general, inspiratory and expiratory phases of a sniff were easily distinguishable by
the degree of unsteadiness in the measurement. Inspiratory measurements were smooth

49
with little unsteadiness owing to the potential flow inlet, whereas expiratory airflow rates
exhibited much unsteadiness due to the turbulent exhaled air jet. The sniff frequency was
determined via a Fast Fourier Transform (FFT) of the time-dependent flow rate data.
Consequently, the overall uncertainty in the reported sniff frequencies is low; a
conservative estimate is ±1 %.
Forty-five trials involving over three hundred sniffs were recorded, where for each
animal multiple scent stimuli were tested to measure the natural range in sniff modulation
associated with different odorants and concentrations. Though we did not explicitly
correlate sniff statistics with stimulus or odorant concentration, the animals were
observed to sniff somewhat more or less vigorously, depending on the odorant stimulus.
This resulted in some variability in the quantitative measurements, much like that
described in an abstract reporting the only other canine sniffing airflow measurements
made to date [129]. It has also been observed in the rat when sniffing multiple odorants
and different concentrations of the same odorant [98].
3.2 Results
In general, sniffing consisted of an alternating series of inspirations and expirations, in a
roughly sinusoidal pattern, lasting from a fraction of a second for a few sniff cycles to
several seconds for a long train of sniffs. Each trial typically contained a single bout of
sniffs, while two distinct bouts rarely occurred and three were never observed. A bout
characteristically began with a relatively weak sniff followed by a crescendo toward the
largest sniff, judged by its airflow rate. Though a similar phenomenon has been observed

50
in the rat [98], our data that include longer bouts reveal a subsequent reduction in sniff
flow rate (Figure 3.3a). Further, long bouts lasting more than two seconds reveal
multiple maxima in flow rate occurring at a relatively low frequency, in the 0.5 – 1.5 Hz
range (Figure 3.3b). Thus, during continuous stimulus presentation natural sniffing
behavior appeared to be organized as “bursts” of sniffs, where each burst consisted of a
crescendo and decrescendo in flow rate and lasted anywhere from 0.5 to 2 seconds. Short
sniffing bouts appeared as a single burst, whereas long bouts frequently contained
multiple bursts.
The frequency of sniffing was remarkably uniform for all seven animals, regardless of
stimulus. For all trials, each of the dogs sniffed within a frequency band ranging from 4
to 7 Hz (Figure 3.4a), that also encompasses the limited canine sniff frequency data
reported elsewhere [129, 130]. Thus, in contrast to respiratory frequency which scales
allometrically with body mass [131, 132], sniff frequency of the canine is apparently
independent of body size.
Peak inspiratory airflow rate and inspiratory tidal volume were strong functions of body
size; both scale approximately linearly with mass, Figure 3.4(b,c). Variability in the data
is attributable to the observed rhythmic modulation of sniff flow rate within a bout of
sniffs and to the systematic modification of sniff intensity in response to multiple stimuli
and variable odor concentration.
Lastly, though we have not correlated expiration data due to the large uncertainty in
measurement of the ventral-laterally directed turbulent exhaled air jet, expiratory flow
rate measurements were consistently less than or equal to inspiratory measurements,

51
indicating an apparent accumulation of air in the lungs of the dog while sniffing. This
behavior, which has been reported in a brief abstract [129], also occurs in the rat [98].
Figure 3.3: Experimental measurements of airflow rate during canine sniffing. (a) Short
sniffing bouts ranged from a few sniffs to a full “burst” of sniffs lasting up to two
seconds that consisted of a weak initial sniff, a gradual increase in inspiratory flow rate
with each successive sniff until the largest sniff was observed, followed by a decrescendo
in sniff flow rate. Here, data from a short sniffing bout for three dogs of widely different
body size show a single burst of sniffs for each animal sniffing at largely different flow
rates. (b) Long sniffing bouts reveal multiple bursts of sniffs that occur every 0.5 to 2
seconds.

52
Figure 3.4: Scaling of the olfactory airflow variables of canine sniffing. (a) The
frequency, fsniff, of canine sniffing is independent of body size. (b) Peak inspiratory flow
rate, , and (c) inspiratory tidal volume, MaxInsp.Q Insp.V , of a sniff scale in proportion to a dog’s
body mass. Error bars represent ± 1% (fsniff) and ± 10% ( and MaxInsp.Q Insp.V ) experimental
uncertainty.
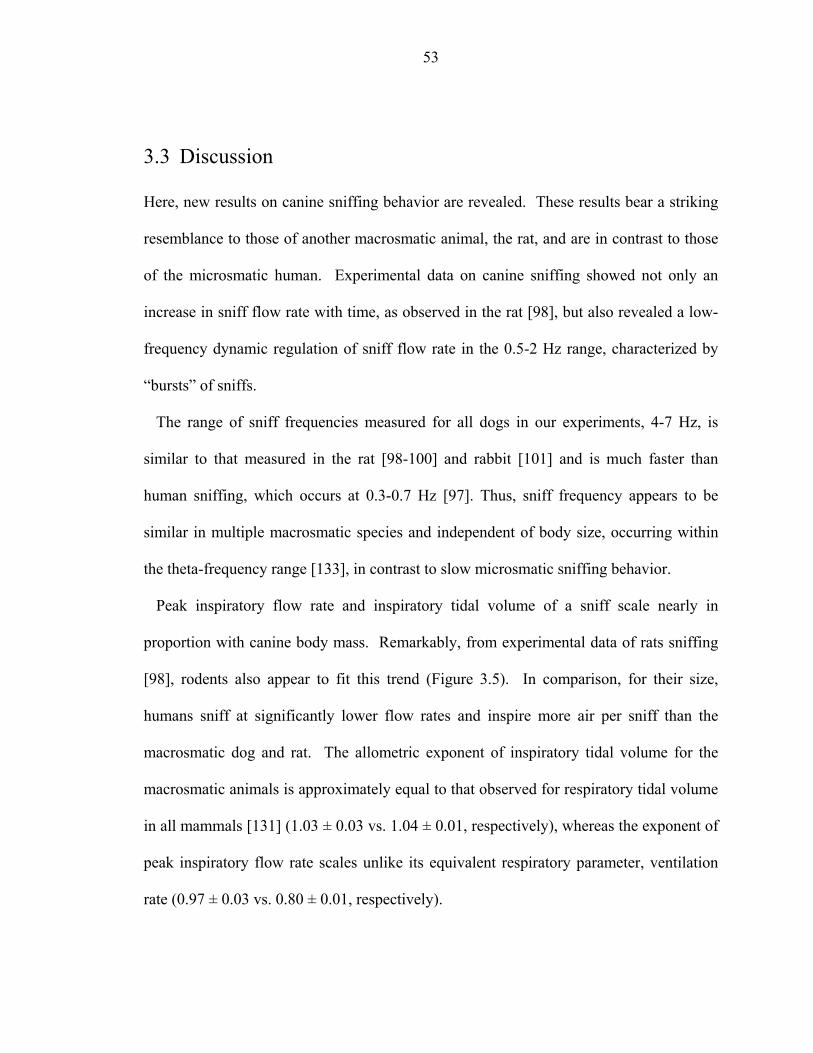
53
3.3 Discussion
Here, new results on canine sniffing behavior are revealed. These results bear a striking
resemblance to those of another macrosmatic animal, the rat, and are in contrast to those
of the microsmatic human. Experimental data on canine sniffing showed not only an
increase in sniff flow rate with time, as observed in the rat [98], but also revealed a low-
frequency dynamic regulation of sniff flow rate in the 0.5-2 Hz range, characterized by
“bursts” of sniffs.
The range of sniff frequencies measured for all dogs in our experiments, 4-7 Hz, is
similar to that measured in the rat [98-100] and rabbit [101] and is much faster than
human sniffing, which occurs at 0.3-0.7 Hz [97]. Thus, sniff frequency appears to be
similar in multiple macrosmatic species and independent of body size, occurring within
the theta-frequency range [133], in contrast to slow microsmatic sniffing behavior.
Peak inspiratory flow rate and inspiratory tidal volume of a sniff scale nearly in
proportion with canine body mass. Remarkably, from experimental data of rats sniffing
[98], rodents also appear to fit this trend (Figure 3.5). In comparison, for their size,
humans sniff at significantly lower flow rates and inspire more air per sniff than the
macrosmatic dog and rat. The allometric exponent of inspiratory tidal volume for the
macrosmatic animals is approximately equal to that observed for respiratory tidal volume
in all mammals [131] (1.03 ± 0.03 vs. 1.04 ± 0.01, respectively), whereas the exponent of
peak inspiratory flow rate scales unlike its equivalent respiratory parameter, ventilation
rate (0.97 ± 0.03 vs. 0.80 ± 0.01, respectively).
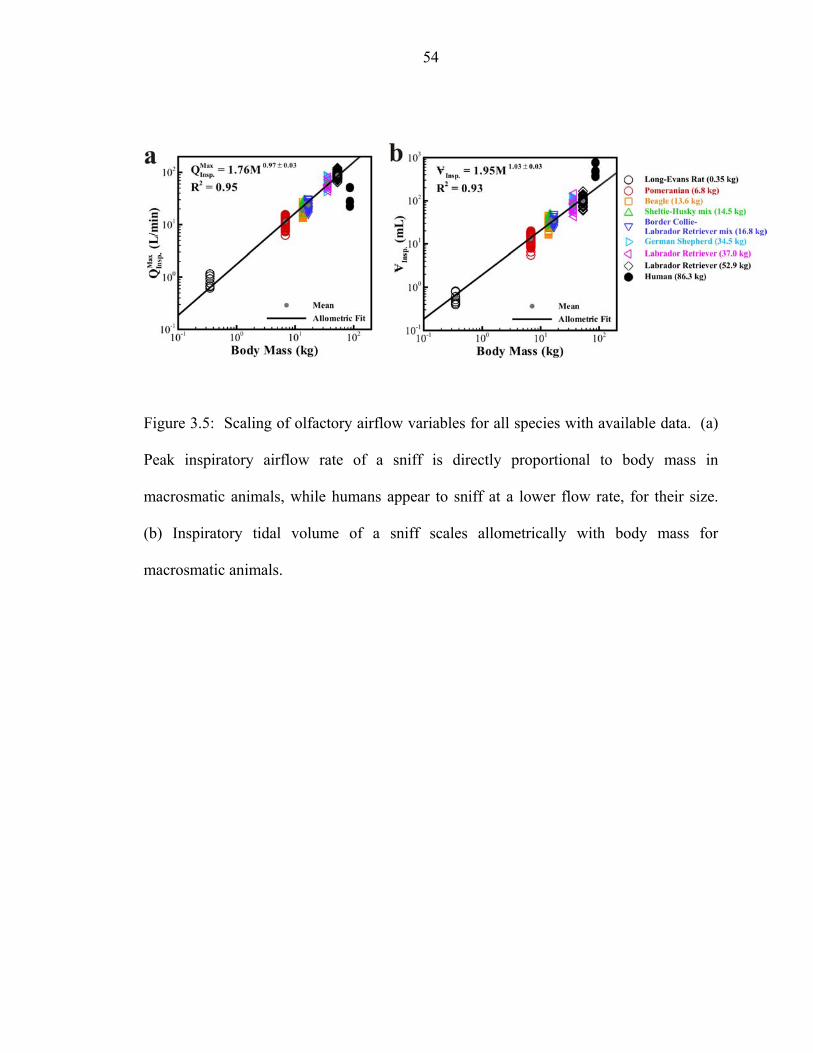
54
Figure 3.5: Scaling of olfactory airflow variables for all species with available data. (a)
Peak inspiratory airflow rate of a sniff is directly proportional to body mass in
macrosmatic animals, while humans appear to sniff at a lower flow rate, for their size.
(b) Inspiratory tidal volume of a sniff scales allometrically with body mass for
macrosmatic animals.

Chapter 4
Development and Verification of a High-Fidelity
Computational Fluid Dynamics Model of Canine Nasal
Airflow
4.1 Computational Methodology
The present study began with an anatomically-correct, three-dimensional surface model
of the left nasal airway of a 29.5 kg female Labrador retriever mixed-breed canine
cadaver, which was reconstructed from high-resolution magnetic resonance imaging
(MRI) scans ([134], Chapter 2). Notably, preliminary reduced-order models of the
canine nasal cavity failed to capture essential anatomical features of the highly three-
dimensional airway labyrinth (see [134]). Lumped-parameter single-path models require
knowledge of the airflow path, which was not obvious in the canine nasal cavity,
particularly within the recessed ethmoidal region. Likewise, two-dimensional models of
simplified sagittal sections of the nose failed to preserve the inherent three-dimensional
connectivity of critical nasal airway regions.
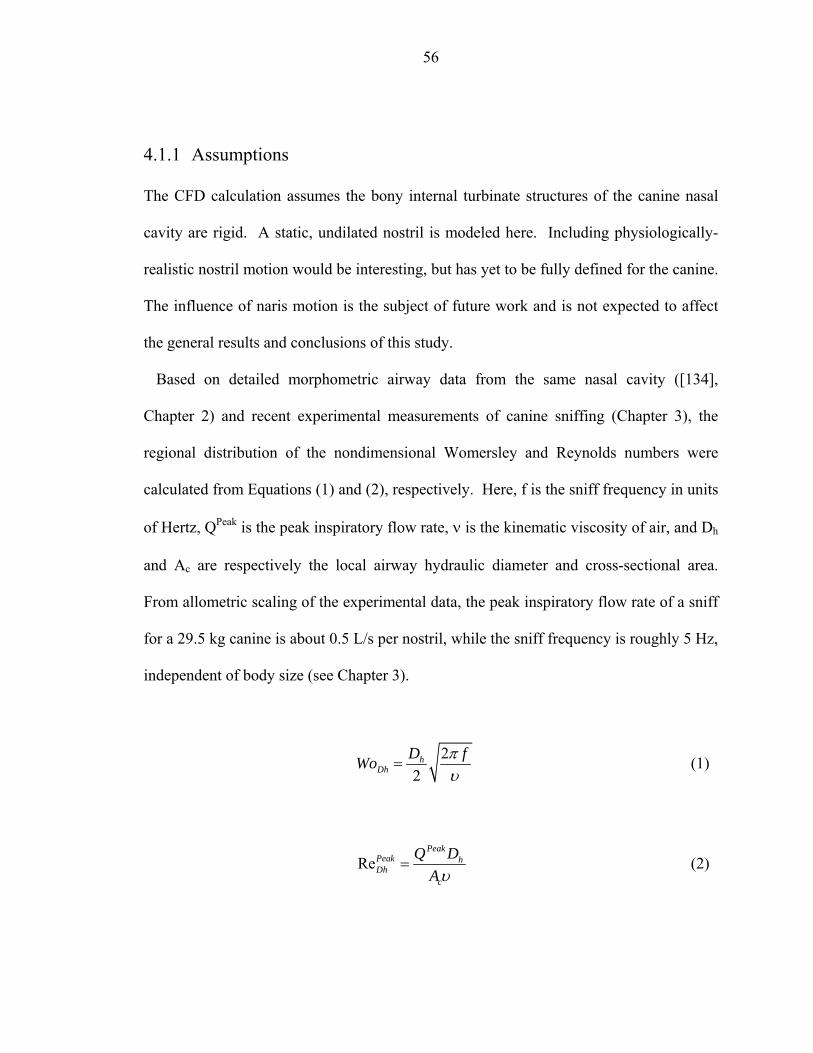
56
4.1.1 Assumptions
The CFD calculation assumes the bony internal turbinate structures of the canine nasal
cavity are rigid. A static, undilated nostril is modeled here. Including physiologically-
realistic nostril motion would be interesting, but has yet to be fully defined for the canine.
The influence of naris motion is the subject of future work and is not expected to affect
the general results and conclusions of this study.
Based on detailed morphometric airway data from the same nasal cavity ([134],
Chapter 2) and recent experimental measurements of canine sniffing (Chapter 3), the
regional distribution of the nondimensional Womersley and Reynolds numbers were
calculated from Equations (1) and (2), respectively. Here, f is the sniff frequency in units
of Hertz, QPeak is the peak inspiratory flow rate, ν is the kinematic viscosity of air, and Dh
and Ac are respectively the local airway hydraulic diameter and cross-sectional area.
From allometric scaling of the experimental data, the peak inspiratory flow rate of a sniff
for a 29.5 kg canine is about 0.5 L/s per nostril, while the sniff frequency is roughly 5 Hz,
independent of body size (see Chapter 3).
22
hDh
DWo fπυ
= (1)
RePeak
Peak hDh
c
Q DAυ
= (2)

57
Figure 4.1 shows the axial distribution of the Womersley number in the reconstructed
model of the canine nasal cavity. Physically, the magnitude of the Womersley number is
an indicator of the degree of unsteadiness in the flow [115]. In general, when Wo < 1,
the flow may be approximated as quasi-steady, permitting steady-state solution of the
governing Navier-Stokes equations. However, as the Womersley number grows larger
than unity, the flow increasingly deviates from quasi-steady behavior, eventually leading
to fully-unsteady flow phenomena such the formation of Stokes layers on the airway
walls [135]. From Figure 4.1, the canine nasal cavity contains both regions of high- and
low-Womersley number flow, indicating that the overall unsteadiness of canine nasal
airflow during sniffing is unknown a priori. Consequently, in contrast to humans,
monkeys, and rats, canine sniffing must be modeled as fully-transient in the present CFD
study.
Figure 4.1: Axial distribution of the Womersley number in the canine nasal cavity during
sniffing (f = 5 Hz). For reference, the background shows an appropriately-scaled sagittal
section of the canine nasal airway from [134] and Chapter 2.

58
Phenomenologically, the nature of the flow (whether laminar or turbulent) depends on
the existence of either quasi-steady or unsteady flow phenomena. For quasi-steady
laminar pipe flow, the well-known parabolic velocity profile becomes unstable and
transition to turbulence occurs in the 2000 – 4000 Reynolds number range [46, 136].
Fully unsteady flow may be characterized by the ratio of the peak oscillatory Reynolds
number to the Womersley number, Re /PeakDh WoDh . If Wo > 1, then transition to turbulence
in oscillatory pipe flow occurs when this ratio is between approximately 250 and 1000
[124]. Although airway curvature and branching affect the stability of the flow [125],
these nondimensional parameters provide at least a rough indication of the nature of
canine nasal airflow during sniffing.
Based on this, Figure 4.2 shows a map of the anticipated flow regimes within the nasal
cavity at peak inspiration. Depending on the magnitude of the Womersley number, the
axial distribution of the appropriate nondimensional parameter ( Re /PeakDh WoDh or RePeak
Dh )
is plotted from the naris to the nasopharynx. Estimates beyond the nasopharynx are not
shown due to insufficient a priori knowledge of the velocity distribution in the recessed
ethmoidal and frontal sinus regions. In the nasal vestibule, where Wo > 1, the ratio of the
peak Reynolds number to the Womersley number indicates that the airflow is turbulent
there at peak inspiration. Downstream of the nasal vestibule, where Wo < 1,
relaminarization is expected to occur and low-Reynolds-number quasi-steady laminar
flow is expected.
59
Figure 4.2: Nature of canine nasal airflow during sniffing
To simultaneously calculate laminar, transitional, and turbulent flow in the canine nasal
cavity would necessitate direct numerical simulation (DNS). Spatial and temporal
resolution requirements for DNS of this complicated flowfield may be approximated
from turbulence theory (see [137-139]). For inhomogeneous turbulent internal flow, two
length scales must be resolved: the near-wall viscous length scale and the Kolmogorov
length scale in the “outer” turbulent layer.
The thickness of the near-wall viscous sublayer for low-Reynolds-number turbulent
flow in the nasal vestibule at peak inspiration is: δν ~ 1x10⁻²(Dh/2) ~ 5 μm (see [139],
Figure 7.13). Estimates of the length and time scales of the smallest turbulent eddies in
the “outer” layer may be obtained from Kolmogorov theory, Equations (3) and (4),

60
respectively. Though Kolmogorov theory implicitly assumes statistically-stationary
turbulent flows, since the time scale of the mean flow due to sniffing (~ 100 ms) is more
than three orders of magnitude larger than the slowest turbulence time scale of large eddy
motion (~ 100 μs), the turbulence quickly adjusts as the mean flow oscillates in time
comparatively slowly. Thus, turbulent motion in the nasal vestibule is approximately
quasi-stationary.
In Equations (3) and (4), for high-Reynolds-number turbulence, the exponents p and q
equal 3/4 and 3/2, respectively. At lower turbulent Reynolds numbers, p and q decrease
due to the growth of the Kolmogorov eddies. Consequently, a conservative estimate of
the finest DNS grid and time step resolution required to capture the smallest turbulent
eddies is found from Kolmogorov theory for high-Reynolds-number turbulence, with p =
3/4 and q = 3/2. The estimates are: η = 5 μm and τη = 1 μs. Given the internal volume of
the canine nasal cavity, 24.4 cm3 ([134], Chapter 2), this gives overall DNS grid sizes on
the order of 10 to 100 billion computational cells. For comparison, the largest DNS
calculations to date (e.g., [140, 141]) used 40963 (roughly 70 billion) grid points.
Since transitional and turbulent flow is confined to the nasal vestibule and does not
exist throughout the entire sniff cycle, at lower instantaneous sniff flow rates, the
difficulty of performing DNS is not presently warranted. Furthermore, the current work
is primarily focused on laminar airflow in the maxilloturbinate and ethmoidal regions.
Thus, here the effect of turbulence in the vestibule is neglected and laminar airflow is
calculated through the entire nasal cavity. The error incurred by the laminar flow
assumption is examined later.
61
~Re
hpDh
Dη , p ≤ 3/4 (3)
2 1~
Reh
qDh
Dητ
υ⎛ ⎞⎜ ⎟⎝ ⎠
, q ≤ 3/2 (4)
Lastly, this study assumes that the airway secretions that cover most of the nasal
airways (see [134] and Chapter 2 for discussion) may be neglected. According to Proctor
[23], the flow of mucus along the airway epithelial surface is quite slow, on the order of 1
cm/min, and is primarily due to mucociliary transport. Due to the small relative thickness
of the aqueous “mucus” layer (~ 10 μm [14, 24, 25]), compared to the dimensions of the
smallest airways (~ 1 mm), and its liquid composition, airway secretions have a
negligible influence on the internal aerodynamics.
4.1.2 Boundary Conditions
Due to bilateral symmetry and complete separation of the left and right canine nasal
cavities, only flow in the left nasal airway is computed here. As shown in Figure 4.3, the
computational domain consists of the reconstructed left nasal airway and the entire
external nose, merged with a separate reconstructed surface model of the external cranial
anatomy (see [134] and Chapter 2) and placed in a large rectangular “box”, where farfield
atmospheric pressure boundary conditions are specified. Preliminary two-dimensional
computations were used to optimize the size of the farfield computational boundary to
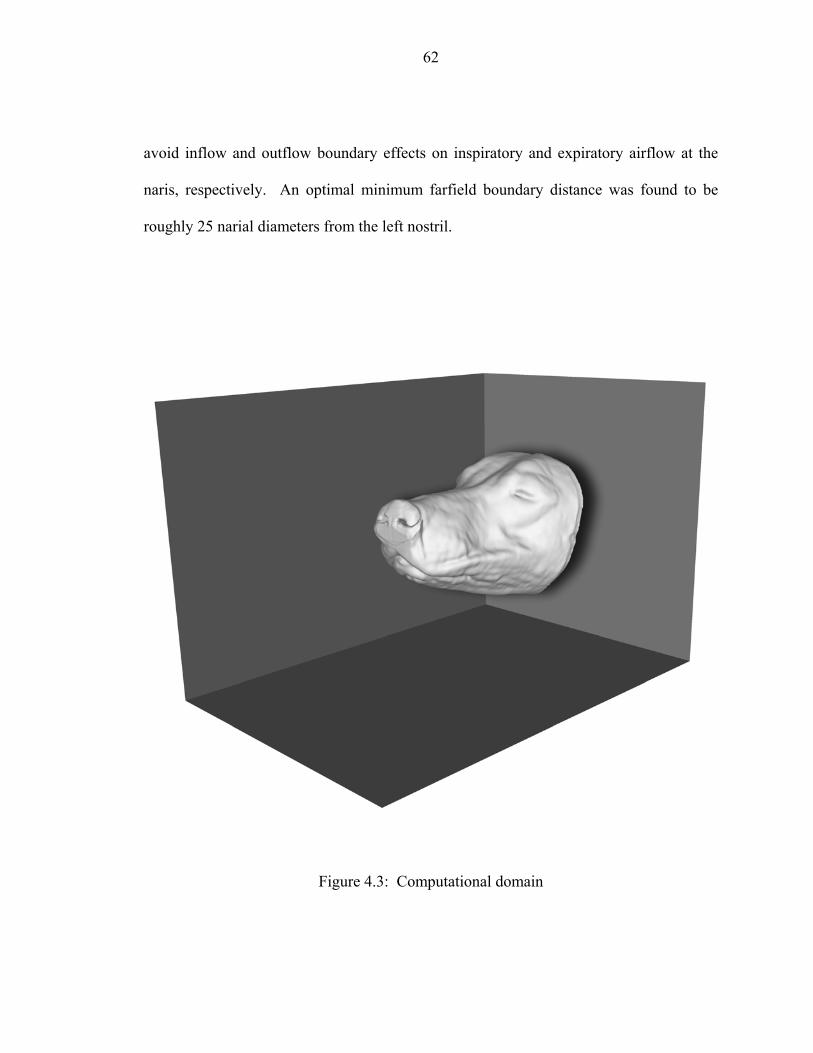
62
avoid inflow and outflow boundary effects on inspiratory and expiratory airflow at the
naris, respectively. An optimal minimum farfield boundary distance was found to be
roughly 25 narial diameters from the left nostril.
Figure 4.3: Computational domain
63
Consequent of the neglect of the nasal mucus layer and its influence on the internal
aerodynamics, no-slip boundary conditions were applied on all solid surfaces of the
canine nose and head. Nasopharynx pressure outlet and inlet boundary conditions were
specified such that inspiratory and expiratory airflow rates and sniff frequency roughly
matched experimental values (Chapter 3). Computations of steady inspiration and
expiration used a constant nasopharyngeal pressure, whereas transient simulations of
sniffing used a 5 Hz sinusoidal nasopharyngeal pressure boundary condition.
4.1.3 Grid Generation
The complicated geometry of the canine nasal cavity required an unstructured grid
generation scheme. A semi-automated octree-based method [142] was used to generate
hexahedral-dominant unstructured grids by assigning separate surface cell sizes to
different geometric parts and an overall grid expansion ratio. Grid quality was optimized
as a post-processing step via a skewness-based smoothing algorithm [142], where
maximum grid skewness was improved by smoothing cells exceeding a target skewness
value of approximately 0.9. Multiple smoothing iterations were performed to best
improve grid quality.
Generally, hexahedral grids are desirable, due to their orthogonality and higher inherent
numerical accuracy compared to pure tetrahedral grids. Here, in a preliminary
comparison on the present geometry, hex-dominant grids were shown to yield the same
effective spatial resolution as a tetrahedral grid, with substantially fewer computational

64
cells. For a given surface cell size, tetrahedral grids contained roughly three times the
number of computational cells than an equivalent hex-dominant grid.
A critical preliminary step for grid generation was the splitting up of the external
geometry and nasal airway into multiple surface parts, which permitted regional
specification of grid resolution. Since a coarse grid density may be used in the farfield
and gradually refined in the vicinity of the head and nose, the farfield boundary and the
external head and nose were all separately defined. As shown in Figure 4.4, multiple
internal surfaces were defined, permitting variable nasal airway grid refinement.
Particularly, fine grid resolution is required in the main airway regions (e.g., nasal
vestibule, maxilloturbinate, and ethmoidal regions), whereas a relatively coarser grid may
be used in the frontal and maxillary sinuses, where low-velocity or stagnant airflow not
actively involved in sniffing is anticipated.
Four separate grids were generated and used for a rigorous grid refinement study. Even
with variable grid refinement, in order to capture the gross geometry of the small airways
in the maxilloturbinate and ethmoidal regions, the coarsest permissible grid contained
nearly 14 million computational cells. Coarser grid resolutions failed even to capture the
smallest airways; these airways were effectively filtered out by the octree method when
the assigned surface cell size was roughly equivalent to the smallest airway diameter.

65
Figure 4.4: Regional division of the internal nasal airway surfaces for variable CFD grid
refinement. Regions include the nasal vestibule (1), dorsal meatus (2), maxilloturbinate
region (3), maxillary sinus (4), ethmoturbinate region (5-7), frontal sinus (8), and
nasopharynx (9)
Finer CFD grids were obtained by judiciously assigning a surface cell size to achieve
an overall grid doubling, resulting in medium and fine grids having approximately 28 and
55 million computational cells, respectively. As shown in Figure 4.5, a power law
relationship between the total number of cells and the specified surface cell size was
found. The difference from theoretical isometric scaling is attributable to nonuniform
66
refinement in the external domain and, internally, in the frontal and maxillary sinuses.
Isometric scaling refers to geometric similarity, and is used here to describe the ideal
relationship (N ~ Δx-3) between the number of computational cells, N, in a uniform-grid
domain and the constituent cell size, Δx. Clearly, the approach of splitting up the
computational model for regional grid refinement produced smaller overall grids than
otherwise obtained via a uniform refinement approach.
The finest grid resolution was limited by practical computational requirements for grid
generation and numerical solution. From Figure 4.6, the largest CFD grid contained
roughly 77 million computational cells and required over 20 gigabytes of memory to
generate. Even so, the specified surface cell size in the main airways was 65 μm, far too
coarse to resolve transitional and turbulent flow in the nasal vestibule.
A summary of the external grid is shown in Figure 4.7 for the fine-grid CFD model.
The resolution is fairly coarse, except within a hemispherical refinement region
encompassing the external naris, where sufficient grid density is required to resolve the
expiratory air jet. Overall, the external domain contained roughly 2 to 3% of the total
number of computational cells in each grid.

67
Figure 4.5: Overall grid size versus assigned surface cell size, Δx, in the main canine
airway regions. Grids shown by open symbols were generated to develop the power-law
regression.
Figure 4.6: Required computer memory for grid generation versus overall grid size.
Grids shown by open symbols were generated to develop the linear regression.
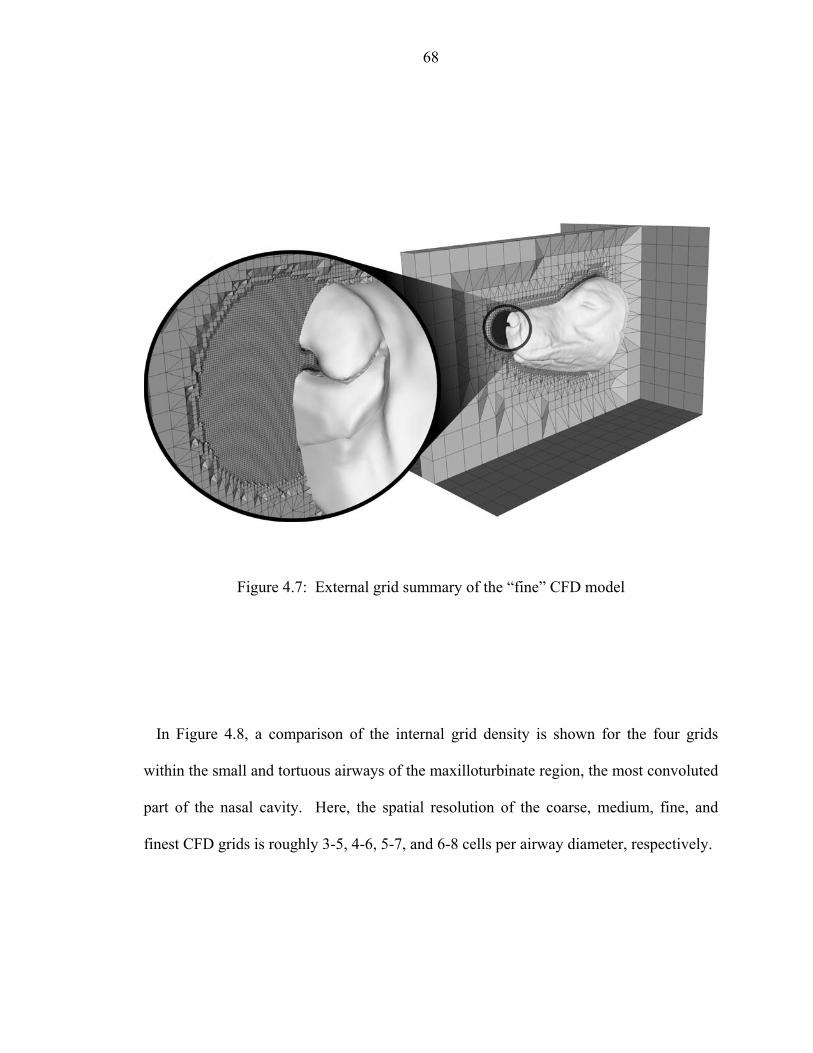
68
Figure 4.7: External grid summary of the “fine” CFD model
In Figure 4.8, a comparison of the internal grid density is shown for the four grids
within the small and tortuous airways of the maxilloturbinate region, the most convoluted
part of the nasal cavity. Here, the spatial resolution of the coarse, medium, fine, and
finest CFD grids is roughly 3-5, 4-6, 5-7, and 6-8 cells per airway diameter, respectively.

69
Figure 4.8: Comparison of the internal spatial resolution of the (1) coarse, (2) medium,
(3) fine, and (4) finest CFD grids in the maxilloturbinate region (MR). Comparable grid
resolution is found in the nasal vestibule (NV) and ethmoidal region (ER).
70
4.1.4 Parallel Computing
A second-order-accurate Galerkin Least-Squares (GLS) finite element method [143-146]
was used to numerically solve the incompressible Navier-Stokes equations via a variant
of the Generalized Minimal Residual (GMRES) linear solution algorithm. Depending on
the grid size, the calculations were performed on 80 to 120 processors of a 256-CPU
parallel computer cluster.
4.2 Results
4.2.1 Grid Dependence Study
The qualitative features of the CFD solutions for all of the grids are remarkably
consistent. For a given pressure drop, similar velocity distributions, pressure contours,
and overall flow patterns were obtained, regardless of grid resolution. Figure 4.9
illustrates the qualitative comparison of the velocity distribution in the nasal vestibule for
the various grid solutions. Here, the highest computed velocities occur in comparable
locations and similar gross secondary flow features are observed in each case. Similar
qualitative comparisons apply throughout the nasal cavity. Thus, the overall kinematics
of canine nasal airflow is reasonably well-captured, even in the coarse grid solution.
A subtle qualitative difference between solutions from different grids is the size of the
smallest observed flow structures. Smaller scales of motion are resolved by finer grids,
especially for high-Reynolds-number flow in the nasal vestibule, Figure 4.9.
Theoretically, for turbulent flow in the vestibule further grid refinement would resolve
71
smaller and smaller flow scales, until the smallest Kolmogorov eddies are captured by
direct numerical simulation. Nonetheless, the largest scales of motion, which are
resolved, contain most of the kinetic energy and determine the bulk fluid motion and
overall kinematics of airflow in the vestibule. Conversely, downstream low-Reynolds-
number laminar mixing occurs exclusively on a length scale of order Dh, resulting in
fewer unresolved small-scale qualitative differences in the solutions from the different
grids.
Quantitatively, airflow “impedance” curves of overall pressure drop versus flow rate
were used to examine grid dependency. Such curves are typically used to characterize
resistive systems of fluid flow driven by fans or blowers. This particular measure is
appropriate because it quantifies the sum of frictional pressure drop and “minor” losses
due to flow separation and mixing (see [136]), which are both significant in the present
geometry. Moreover, it is directly comparable to experimental data.
In all, 48 steady-state solutions were calculated in order to develop these inspiratory
and expiratory airflow impedance curves, Figures 4.10(a) and 4.10(b), respectively. In
general, a nonlinear trend in pressure drop is observed. This is characteristic of internal
flows with mixing and secondary motions known as “minor” losses, which increase
nonlinearly with flow rate.

72
Figure 4.9: Qualitative comparison of the velocity distribution in the nasal vestibule
(NV) for the coarse (1), medium (2), fine (3), and finest (4) grid solutions of inspiratory
airflow for an overall pressure drop of 2000 Pa

73
Figure 4.10: Airflow “impedance” curves, a quantitative measure of grid dependence for
CFD calculations of (a) inspiratory and (b) expiratory airflow in the canine nasal airway
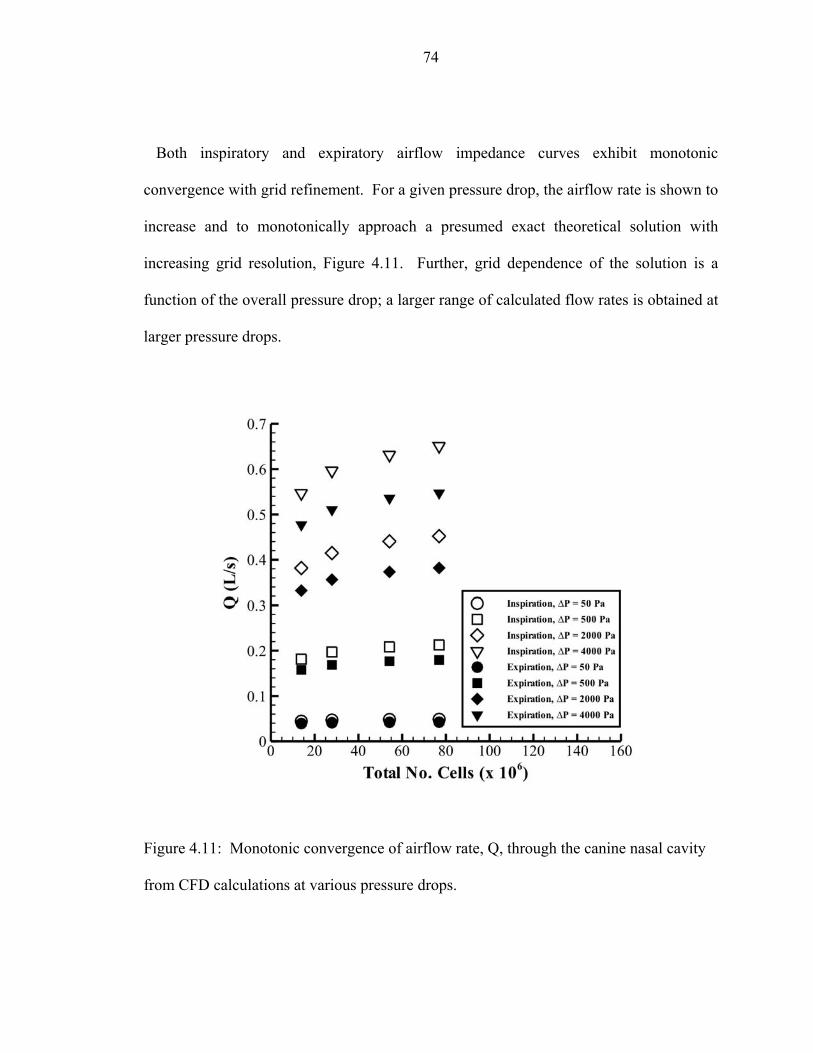
74
Both inspiratory and expiratory airflow impedance curves exhibit monotonic
convergence with grid refinement. For a given pressure drop, the airflow rate is shown to
increase and to monotonically approach a presumed exact theoretical solution with
increasing grid resolution, Figure 4.11. Further, grid dependence of the solution is a
function of the overall pressure drop; a larger range of calculated flow rates is obtained at
larger pressure drops.
Figure 4.11: Monotonic convergence of airflow rate, Q, through the canine nasal cavity
from CFD calculations at various pressure drops.

75
To investigate the observed increase in overall flow rate with grid refinement at a
constant pressure drop, the regional distribution of airflow in the nasal cavity was
considered. Specifically, the fraction of the overall airflow passing through the large
dorsal meatus was extracted from each of the grid solutions and compared at various
axial locations for an overall pressure drop of 4000 Pa. The results for inspiration and
expiration are shown in Figures 4.12(a) and 4.12(b), respectively. Results from the
“finest” grid solutions are omitted since they are virtually identical to the distributions
shown for the “fine” grid.
During inspiration, most of the pressure losses in the rostral part of the nasal cavity are
due to “minor” losses associated with mixing and the formation of secondary flows as air
at a comparatively-high velocity flows through the nasal vestibule and enters the
branched airways of the maxilloturbinate region. The dorsal meatus, however, is an
effective bypass around this complicated airway region. In the CFD calculations, with
grid refinement smaller-scale flow structures and mixing are increasingly resolved in this
region, leading to an increase in flow resistance for air entering the maxilloturbinate
airways. Consequently, proportionally more airflow takes the path of less resistance via
the dorsal meatus, around the rostral part of the maxilloturbinate region of the nasal
cavity (see Figure 4.12(a)).
Downstream, however, the opposite effect of grid resolution on airflow in the dorsal
meatus is shown in Figure 4.12(a). Here, low-Reynolds-number (~ 100) airflow exists in
the maxilloturbinate airways, which appears to be fully-resolved by even the coarse grid.
Thus, increasing the grid resolution has little effect on the airflow resistance in these

76
airways. However, the dorsal meatus contains higher-velocity airflow and grid
refinement results in increased resolution of shear stress and frictional losses in this
airway. Thus, as grid resolution increases, proportionally more airflow leaves the dorsal
meatus due to increased frictional resistance and enters the maxilloturbinate airways.
The same effect is observed on expiration, Figure 4.12(b).
Taken together, the dynamic allocation of airflow with grid refinement in the nasal
cavity results in an increase in the overall flow rate through the nose for a given pressure
drop. The effect is most dramatic at high pressure drops and for inspiration, rather than
expiration. For small pressure drops the influence of grid resolution is relatively
negligible.
Richardson extrapolation is the standard method for estimating numerical error in the
verification of CFD calculations. The generalized theory of Richardson extrapolation
requires a “consistent” numerical method and calculated solutions within the asymptotic
range of convergence [95]. For unstructured grids, verification of global or integrated
quantities is typically performed, since direct comparison of nodal values requires
interpolating the solutions to a common grid, introducing an additional source of error.
Here, Richardson extrapolation is performed on the calculated flow rate through the nasal
cavity at four pressure drops (ΔP = 50, 500, 2000, and 4000 Pa) for steady inspiration and
expiration.

77
Figure 4.12: Grid dependence of the regional airflow distribution in the canine nasal
cavity. The fraction of the overall airflow passing through the dorsal meatus during
steady (a) inspiration and (b) expiration from coarse, medium, and fine grid solutions is
plotted at various axial locations. For reference, the background contains a sagittal
section of the nasal airway and three transverse cross-sections are shown at correct axial
locations to illustrate the relative size and location of the dorsal meatus.

78
Equations 5-7 summarize the theory of Richardson extrapolation. For a “consistent”
numerical method the calculated solutions, ( )if Δ , better approximate the exact solution,
exactf , as the numerical error, piCΔ , decreases with grid refinement. Here, C is a function
defined in the continuum that is independent of the particular discretization, Δ is the grid
spacing, and p is the observed order of convergence [95]. Multiple CFD solutions on fine
(f1), medium (f2), and coarse (f3) grids are required to evaluate p from Equation (6), for
a constant grid refinement ratio r, Equation (7). Evaluating p for variable refinement
ratios is more involved (see [95] for details). In this study, a constant r of 1.25 was used
for the coarse, medium, and fine grids, while r = 1.12 for the finest grid. A summary of
the analysis is provided in Table 4.1, where Efine and GCIfine are the estimated percent
error and Grid Convergence Index of the fine grid solution, respectively. The Grid
Convergence Index (GCI), originally proposed by Roache [147], is a measure of the
percent error that has a high probability of bounding the actual error of the numerical
solution [95].
( ) pi exact if f CΔ = + Δ (5)
( )
3 2
2 1
ln
ln
f ff f
pr
⎛ ⎞−⎜ ⎟−⎝= ⎠ (6)

79
1/ 31/ 3
1 2
2 3
N NrN N
⎛ ⎞⎛ ⎞≈ ≈ ⎜ ⎟⎜ ⎟
⎝ ⎠ ⎝ ⎠ (7)
Table 4.1: Grid refinement study – Summary of Richardson extrapolation
Inspiration Expiration
Q (L/s) @: p Efine GCIfine p Efine GCIfine
ΔP = 50 Pa 2.8 -3.2% 4.0% 2.6 -3.0% 3.7%
ΔP = 500 Pa 1.5 -13.5% 16.9% 1.5 -11.7% 14.7%
ΔP = 2000 Pa 1.1 -21.1% 26.4% 1.5 -11.2% 14.0%
ΔP = 4000 Pa 1.6 -13.0% 16.2% 1.3 -14.7% 18.4%
At the lowest pressure drop, rapid grid convergence is demonstrated by high values of p
for inspiration and expiration. As a result, the fine-grid solution is quite accurate at these
low Reynolds numbers, yielding GCI values of 4.0% and 3.7% for inspiration and
expiration, respectively. However, as the flow rate and Reynolds number increase with
larger pressure drops, the order of convergence decreases and the numerical error
increases, with GCI values in the 15–25% range. Notably, the observed order of
convergence for all cases was greater than unity.
Richardson extrapolation with solutions from the finest grid yielded meaningless
results. This was due to the small grid refinement ratio (r = 1.12) between the fine and
finest grids. Roache [95] recommends a minimum refinement ratio of 1.1 to overcome
random sources of error in the computed results (e.g., “noise” from incomplete iterative

80
convergence). For the complicated geometry of the canine nasal airway, using an
unstructured grid, a larger value was required; an overall doubling of the grid size,
yielding worked well. 1.25r ≈
Given the moderate numerical error in quantitative data from the high-flow-rate
solutions, Richardson extrapolation theory was used to provide an estimate of the grid
resolution required for higher accuracy (see [95] for details). To obtain a GCI of 5%, an
estimate of anywhere from 5×10⁸ to 5×10⁹ computational cells are required, depending
on the pressure drop. In reality, this number could probably be reduced by selective
regional grid refinement. Nonetheless, from Figure 4.5, such levels of refinement
approach the spatial resolution required for DNS, which is presently impractical.
4.2.2 Time Step Study
Lastly, transient calculations of canine sniffing were performed. Using the “fine” grid, a
time step study was conducted for sniffing at 5 Hz at physiologically-realistic airflow
rates. A sinusoidal nasopharynx pressure boundary condition, varying about atmospheric
pressure, of amplitude 2500 Pa was used to mimic a sniff.
Four time step sizes were used, ranging from 20 to 160 time steps per sniff period, with
a constant refinement ratio of 2. To hasten convergence, all transient calculations but the
first were restarted from the previous, coarser time-step solution. The initial condition
for the first unsteady calculation was taken from the steady state solution for inspiration
at an overall pressure difference of 2500 Pa.
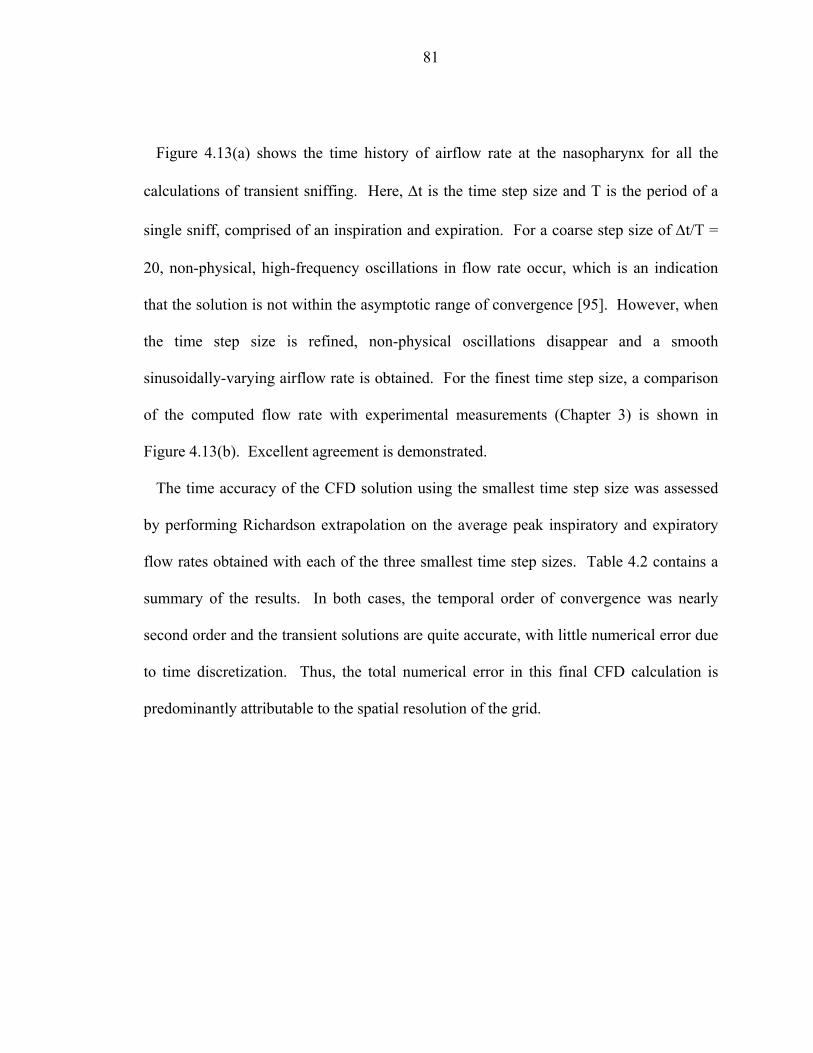
81
Figure 4.13(a) shows the time history of airflow rate at the nasopharynx for all the
calculations of transient sniffing. Here, Δt is the time step size and T is the period of a
single sniff, comprised of an inspiration and expiration. For a coarse step size of Δt/T =
20, non-physical, high-frequency oscillations in flow rate occur, which is an indication
that the solution is not within the asymptotic range of convergence [95]. However, when
the time step size is refined, non-physical oscillations disappear and a smooth
sinusoidally-varying airflow rate is obtained. For the finest time step size, a comparison
of the computed flow rate with experimental measurements (Chapter 3) is shown in
Figure 4.13(b). Excellent agreement is demonstrated.
The time accuracy of the CFD solution using the smallest time step size was assessed
by performing Richardson extrapolation on the average peak inspiratory and expiratory
flow rates obtained with each of the three smallest time step sizes. Table 4.2 contains a
summary of the results. In both cases, the temporal order of convergence was nearly
second order and the transient solutions are quite accurate, with little numerical error due
to time discretization. Thus, the total numerical error in this final CFD calculation is
predominantly attributable to the spatial resolution of the grid.

82
Figure 4.13: Transient calculations of canine sniffing at 5 Hz. (a) Time history of
airflow rate at the nasopharynx for all calculated sniffs, with decreasing time step size.
(b) Comparison of the calculated flow rate for the finest time step size and experimental
measurements. The experimental data, originally measured on a smaller canine, was
allometrically-scaled to 29.5 kg, the body mass of the cadaver from which the CFD
model was reconstructed.
Table 4.2: Time step study – Summary of Richardson extrapolation
Inspiration Expiration
p Efinest GCIfinest p Efinest GCIfinest
1.7 0.5% 0.6% 1.9 0.9% 1.1%

Chapter 5
The Aerodynamics of Canine Olfaction
Most keen-scented (macrosmatic) animals possess a common nasal architecture that is
absent in feeble-scented (microsmatic) species. In particular, the olfactory mucosa of the
dog [12, 134], cat [13], rabbit [148], and rat [43] is relegated to an “olfactory recess”,
located in the rear of the nasal cavity and excluded from the main respiratory airflow path
by a sub-ethmoidal shelf or Lamina transversa (see Figure 5.1). The olfactory recess “is
seen at its height of perfection in the Dog [13]”, but is absent in microsmatic primates,
specifically the haplorhine order [6] (e.g., human [149], rhesus monkey [43], marmoset
[6]). In a comparison of many species, such traits led Negus [13] to conclude that “it is
possible to reach a fairly accurate conclusion of an animal’s powers of scent by
observation of the anatomical structure,” suggesting that certain architectural features of
the nasal airway in some animals and the associated internal aerodynamics may
contribute to olfactory acuity.
The aerodynamics of odorant transport includes odorant collection via active sniffing
[2] (external aerodynamics) and transport of inspired scent within the nasal cavity
(internal aerodynamics), phenomena that provide a “stereoscopic map” of the odor
environment for some animals [97, 150, 151] and determine the eventual fate of inspired

84
odorant molecules, respectively. Airflow patterns within the nasal airway labyrinth
control whether or not scent-bearing air reaches odorant receptors in the olfactory
airways, where detection occurs.
However, little is known about the aerodynamics of olfaction except in rodents [51, 93,
94] and humans [62, 63, 81, 91, 92]. How odorant molecules reach olfactory airways
during a sniff without significant upstream filtering by respiratory airways is not well
understood, especially in macrosmatic animals [10]. Given the complexity of the nasal
airways in most keen-scented species, particularly the canine [134] (Figure 5.1), such
aerodynamic transport phenomena must be highly optimized for olfactory discrimination
of dilute scent-bearing air mixtures. Here, the aerodynamics of canine sniffing are
investigated to elucidate the role of olfactory airflow in the delivery of odorants to the
sensory part of the nose and how the overall architectural design of the nasal cavity,
especially the relegation of olfactory mucosa to an olfactory recess, may contribute to
olfactory acuity.
Given the verified computational fluid dynamics (CFD) calculations of Chapter 4, high-
fidelity solutions of canine sniffing are shown that reveal the aerodynamics of olfaction
in the dog. Physiologically-realistic values of sniff frequency (5 Hz) and peak airflow
rate (0.5 L/s, per naris) were modeled. The following is a summary of the external and
internal aerodynamics of canine olfaction.
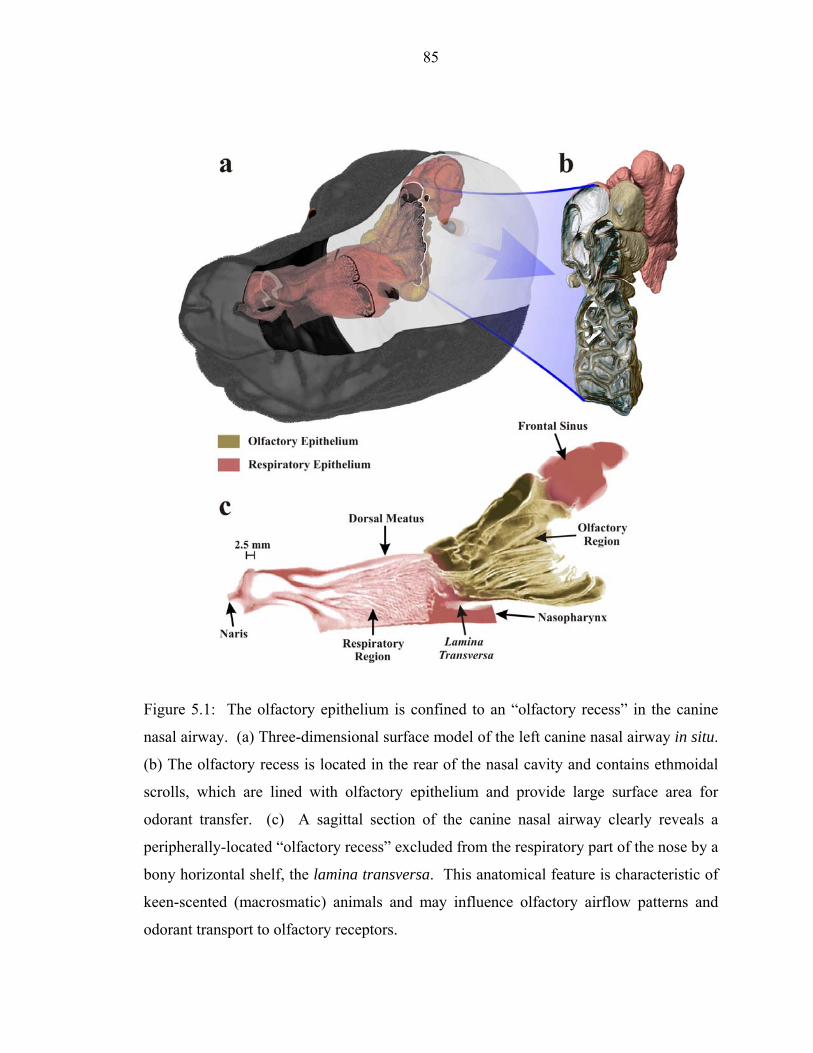
85
Figure 5.1: The olfactory epithelium is confined to an “olfactory recess” in the canine
nasal airway. (a) Three-dimensional surface model of the left canine nasal airway in situ.
(b) The olfactory recess is located in the rear of the nasal cavity and contains ethmoidal
scrolls, which are lined with olfactory epithelium and provide large surface area for
odorant transfer. (c) A sagittal section of the canine nasal airway clearly reveals a
peripherally-located “olfactory recess” excluded from the respiratory part of the nose by a
bony horizontal shelf, the lamina transversa. This anatomical feature is characteristic of
keen-scented (macrosmatic) animals and may influence olfactory airflow patterns and
odorant transport to olfactory receptors.
86
5.1 External Aerodynamics
During inspiration air in the immediate vicinity of the nostril is drawn toward the naris,
inducing inspiratory airflow within a small hemispherical region encompassing the naris,
the spatial extent of which is known as the “reach” of the nostril. At peak inspiration a
nostril reach of approximately 1 cm is induced (see Figure 5.2a), which corresponds to
the distance within which dogs have been observed to hold their noses from the ground
during scent tracking [130]. Further, the reach of a nostril is smaller than the internostril
separation, indicating that each nostril samples air from spatially separate regions,
making the dog’s nose a natural bilateral sampler. Thus, the inspiratory external
aerodynamics of canine sniffing yields a bilateral odor sample that may be exploited by
bilateral neuronal pathways [150] and spatially receptive neurons in the piriform cortex
[151, 152] in order to give the dog a stereoscopic sense of smell.
On expiration, due to the internal shape of the nasal vestibule of the dog (see ref.
[134]), a ventral-laterally directed air jet is ejected from the nose (Figure 5.2b). When
sniffing a surface, such as the ground, the direction of the vectored expired airstream is
such that it promotes disturbance and mixing of ambient odorants that may be
subsequently inspired, while minimizing sample “blowoff” nearest the nostril. This has
been observed in high-speed flow visualization experiments of canine sniffing [2, 121].
Further, having been warmed by the respiratory airways, the expired jet may volatilize
latent odorant traces on the surface [2]. Two large co-rotating vortices exist within the
expired air jet with a rotation such that, when sniffing a surface, laterally-located odorant
signal is drawn towards the dog’s nose for sampling. Together, the vortical jets of both

87
nostrils localize odorant traces toward a centerline behind the nose, likely motivating the
observed front-to-back scanning behavior of dogs while sniffing a scent source on the
ground [2, 121]. The combination of these aerodynamic features of canine expiration
increases the effective reach of the nose, enabling inspiration of otherwise inaccessible
odors.
Figure 5.2: The external aerodynamics of canine sniffing. (a) An isosurface of velocity
magnitude (10% of maximum inspiratory velocity) at peak inspiration. (b) An isosurface
of velocity magnitude (10% of maximum expiratory velocity), colored by vorticity, at
peak expiration

88
5.2 Internal Aerodynamics
The internal aerodynamics of olfaction in the dog is complicated by the compact,
multipurpose design of the nasal cavity, where chemical sensing and respiratory air
conditioning both occur. Our solutions of inspiratory airflow during sniffing show that,
although combined within the same organ, olfactory and respiratory airflows are
fundamentally separate phenomena, each with a distinct flow path through the nasal
cavity (Figure 5.3a). During inspiration, one airway (the dorsal meatus; see Figure 5.1c)
transports odorant-laden air to the olfactory region of the nose, while respiratory airways
direct the remaining airflow away from the olfactory recess, toward the nasopharynx,
where it exits the nasal cavity. For the case described here of a relaxed, undilated nostril,
the splitting of olfactory and respiratory airflow is such that roughly 15% of inspired air
reaches chemosensory airways in the olfactory recess. Including physiologically-realistic
nostril motion during sniffing, which has yet to be fully defined for the canine, would
likely increase this percentage as shown in CFD solutions of steady inspiration in the rat
[51], where an artificial repositioning of the nasal vestibule to account for nostril shape
changes during sniffing resulted in an increase (2-3 %) in the fraction of inspired airflow
reaching the olfactory region and no change in the overall internal flow pattern (see
section 5.3 for a comparison of olfaction in the dog and rat).

89
Figure 5.3: The internal aerodynamics of canine olfaction. (a) Unsteady pathlines
released from the naris at equally-spaced time intervals during inspiration. (b) The
pathlines of (a), colored by velocity magnitude. (c) Pathlines released from the
nasopharynx at equally-spaced time intervals during expiration

90
Upon entering the nasal cavity, inspiratory airflow is well-mixed within the nasal
vestibule by turbulence, prior to splitting into olfactory and respiratory flow paths, thus
ensuring delivery of a representative odor sample to the dorsal meatus ([134],Chapter 2).
High-velocity olfactory airflow in the dorsal meatus quickly advects odorant to the rear
of the olfactory recess. Here, the airflow turns 180° and slowly filters through the
olfactory airway labyrinth in a forward-lateral direction, permitting efficient odorant
deposition. Finally, olfactory airflow either exits the nasal cavity via the nasopharynx or
continues to flow forward into the dorsal-most ethmoturbinate extensions of the olfactory
recess, where it remains at the conclusion of inspiration.
During expiration, due to the architecture of the nasal cavity, no appreciable airflow
enters or exits the olfactory recess (Figure 5.3c); throughout this phase of the sniff air in
the olfactory region is essentially quiescent. Expiratory airflow proceeds from the
nasopharynx, through the respiratory region, and exits the nasal cavity at the naris.
Taken together, the internal aerodynamics of canine inspiration and expiration force
unidirectional flow through olfactory airways, which is optimal for “chromatographic”
separation of odor mixtures and subsequent odorant discrimination [102, 103, 107, 153].
Further, the quiescent phase in the olfactory recess during expiration provides an
additional odorant residence time for the absorption of volatile chemicals (see Chapter 6).
In contrast, if fresh air from the nasopharynx was induced to flow through the olfactory
region in the reverse direction (from back-to-front) during the expiratory phase, volatile
odorants would not reach most of the receptor sites on the olfactory epithelium (Chapter
6). The cleansing action of expiration would purge the olfactory recess before volatile

91
chemicals reached most olfactory receptor sites, thus thwarting olfactory discrimination.
Consequently, the residence time afforded by the quiescent expiratory phase of a sniff is
an essential aerodynamic feature of canine olfaction.
5.3 Discussion
In this study, the first description of the aerodynamics of olfaction in the dog is revealed.
These results bear a striking resemblance to those of another macrosmatic animal, the rat,
and are in contrast to those of the microsmatic human.
The external aerodynamics of canine sniffing was shown to provide bilateral odor
samples, which may be used for stereoscopic olfaction, as it is in the rat [150, 151]. The
solutions of the internal aerodynamics reveal a novel flow pattern in the nasal cavity of
the dog during a sniff, where odorant-laden inspired air bypasses the tortuous respiratory
airways via the dorsal meatus along which it is quickly transported to the olfactory
recess, where it slowly filters back through large-surface-area olfactory airways in an
anterior-lateral direction. Airflow bypasses the olfactory recess during expiration, which:
(a) forces unidirectional flow within olfactory airways and (b) prevents premature
purging of odorant from the olfactory region. This is in stark contrast to olfactory airflow
patterns in the human, which can vary dramatically between nasal cavities even for the
same subject, and can even contain separated flow within the olfactory region [73, 91], a
fluid-dynamic phenomenon that is undesirable for olfactory mass transport.
These overall aerodynamic features of canine olfaction, however, are not entirely
unique; similar airflow patterns have been revealed in the rat [51, 94], most recently for
92
expiration (ref. [94]). In fact, considering the gross nasal airway anatomy, all
macrosmatic species (e.g., carnivores [134, 154], rodents [43], ungulates [13], marsupials
[13]) characteristically possess the traits required for such olfactory airflow phenomena.
In particular, these animals all have a dorsal meatus bypassing respiratory airways of
variable complexity (see ref. [13]), leading to an olfactory recess. This particular nasal
airway architecture likely leads to similar olfactory airflow patterns and odorant transport
phenomena, which appear to be indicative of high olfactory acuity. Further, these
anatomical differences and the resulting internal aerodynamics may explain differences in
sniffing behavior between macro- and microsmatic animals, shown here (Chapter 3).
Thus, an animal’s power of olfaction and it’s classification as macro- or microsmatic may
inherently depend on the nasal airway architecture and how odorants are transported
through the nasal cavity.
Chapter 6
Modeling Olfactory Mass Transport Phenomena
Given the olfactory airflow patterns in the canine nasal cavity during sniffing, based on
three-dimensional computational fluid dynamics (CFD) calculations (Chapter 5), this
chapter focuses on the detailed physics of odorant species transport. A novel physical
model of olfactory mass transport phenomena is given, followed by a complete
description of the governing equations and boundary conditions. The governing
nondimensional parameters of olfactory mass transfer are then derived using dimensional
analysis. Next, the development and verification of a reduced-order numerical model is
described, which captures the essential physics of air- and mucus-phase species transport.
Finally, numerical results of odorant transport in the canine nasal cavity are presented.
6.1 Physical Model
Computational fluid dynamics (CFD) solutions of the internal aerodynamics of canine
olfaction revealed separate flow paths for olfactory and respiratory airflow in the nasal
cavity of the dog during sniffing (Chapter 5). During inspiration, the dorsal meatus
conveys odorant-laden airflow to the olfactory region of the nose, where it slowly filters
through the narrow ethmoidal airways, which are lined with a thin mucus layer. As the

94
air-vapor mixture flows through these mucus-lined airways, odorant “uptake” by the
mucus layer occurs, whereby odorant molecules enter the liquid mucus phase, Figure 6.1.
Figure 6.1: Schematic illustration of olfactory transport phenomena at the air-mucus
interface in the olfactory epithelium. (a) overall view and (b) close-up of the mucus layer
Due to the relative thickness of the mucus layer (~ 5-10 μm) compared to the
dimensions of the ethmoidal airways (~ 1 mm) and its liquid composition, mucus
advection is presumed negligible. The primary mode of odorant transport through the
thin mucus lining is via transverse molecular diffusion. Thus, once in the mucus phase,

95
odorant molecules diffuse toward the epithelial surface, which is blanketed by olfactory
cilia.
At the depth of the olfactory ciliary blanket, G protein-coupled receptors embedded in
the cilia membrane bind odorant molecules, thereby initiating neural signal transduction,
Figure 6.2. Following molecular reception, odorant molecules are quickly consumed,
presumably by odorant-degrading enzymes [155] and/or odorant-binding proteins [29,
156].
The total dwell-time of an odorant molecule on a receptor is thus very short, on the
order of 1 ms [157], much shorter than the time required for the molecule to reach the
receptor via molecular diffusion. Consequently, from the perspective of a diffusing
molecule, odorants are instantaneously bound and consumed as soon as they reach
receptor sites. This scenario, known as diffusion-limited binding [158, 159], has two
significant implications. First, the mucus-phase odorant concentration is effectively zero
at receptor sites on olfactory cilia. Second, the odorant binding rate, which is diffusion-
limited, equals the diffusive flux of molecules to olfactory receptors, illustrated as JReceptor
in Figure 6.2.
Odorant reception initiates a complex cascade of biochemical reactions, eventually
leading to an odorant-induced current in the OSN [160], iOSN in Figure 6.2. The response
of each OSN is related to the total number of stimulated receptors on all cilia and the
diffusion-limited odorant binding rate. In general, the response is highly nonlinear due to
complicated biochemical interactions that lead to signal amplification, adaptation, and
oscillation [157, 161], requiring a complete biochemical kinetics treatment of the

96
transduction cascade. Although a few chemical kinetics models (e.g., [161]) have
successfully reproduced certain features of olfactory signaling, ambiguous model
constants and ad hoc reaction mechanisms are required. A general biophysical model of
olfactory signal transduction is therefore lacking, but is an area of active current research
(see [162]).
Figure 6.2: Schematic illustration of diffusion-limited binding at receptor sites on
olfactory cilia

97
In this work, results are given in terms of molecular or molar flux at a “receptor layer”,
which is taken as the plane containing the dense ciliary blanket that covers the surface of
the olfactory epithelium (Figure 6.1). Molar flux refers to the bulk odorant transport rate
per unit area, in units of μmol/m2-s. Molecular flux is used here as a more meaningful
quantity and is defined as follows. Given the molar flux at the receptor layer (JReceptor),
Avogadro’s number (NA = 6.022 × 10²³ mol-1), and the areal density of OSNs reported by
Menco [30] in the olfactory epithelium of the canine (ρOSN = 6.1 × 106 cm-2), the effective
molecular transport rate to each neuron, in units of molecules per second, may be defined
as:
Re* -10Receptor 1x10 ceptor A
OSN
J NJ
ρ⎛ ⎞
= ⎜⎝ ⎠
⎟ (6.1)
6.2 Mathematical Model
A complete mathematical statement of the physical model is now required that includes
the appropriate governing equations and boundary conditions describing the transport of
odor molecules in and between the air and mucus phases.

98
6.2.1 Governing Equations
Assuming incompressible flow, Equations 6.2 and 6.3 are respectively the Cartesian
tensor form of the continuity and Navier-Stokes equations governing olfactory airflow.
Here, υ is the kinematic viscosity of air.
0i
i
ux
∂=
∂ (6.2)
21i ij
i
j i j
u u P uut x x x
υρ
∂ ∂ ∂ ∂+ = − +
∂ ∂ ∂ ∂ ∂ jx (6.3)
Assuming the odorant is a dilute vapor, Equation 6.4 governs the transport of a passive
scalar, in this case odorant molecules, by the airflow. The subscripts ‘o’ and ‘a’ refer to
odorant and air, respectively, Ca is the air-phase odorant concentration, and Doa is the
binary diffusion coefficient of the odorant in air.
2a a
i oai i
C C Cu Dt x x
∂ ∂ ∂+ = a
ix∂ ∂ ∂ ∂ (6.4)
Equation 6.5 describes the diffusion of odorant molecules through the liquid mucus
phase. The subscript ‘m’ refers to mucus and Dom is the binary diffusion coefficient of
the odorant in mucus.

99
2
mom
i i
C CDt x
∂ ∂= m
x∂ ∂ ∂ (6.5)
6.2.2 Boundary Conditions
To complete the mathematical description of the problem, appropriate boundary
conditions must be formulated. Due to the elliptic nature of the governing equations,
“well-posed” boundary conditions must be specified on all surfaces of the problem
domain.
Here, for air-phase advection, the following inlet and outlet boundary conditions for
velocity, pressure, and odorant concentration apply:
• Inlet Boundary Conditions: Specified pressure and odorant concentration at the
inlet
• Outlet Boundary Conditions: Specified outlet pressure and an “outflow”
boundary condition on velocity and odorant concentration. Physically, for
internal flows the outflow condition assumes a constant axial gradient of the
dependent variable crossing the outflow boundary, Equation 6.6, where ‘x’
denotes the axial coordinate direction.
2
2 0xφ∂
=∂
,iu Cφ = (6.6)

100
Assuming a thin mucus layer, odorant transport via streamwise molecular diffusion (see
Figure 6.1) is negligible compared to transverse diffusive transport. This is
mathematically illustrated in Equation 6.7, a scaling of the physical order of magnitude of
the axial and transverse diffusion terms of Equation 6.5. Here, Hm is the thickness of the
mucus layer, L is the axial length scale, and ‘O’ refers to the order of magnitude of each
term (see [163] for a more rigorous definition of ‘O’). The first term in the brackets is
the scaling of axial diffusion, whereas the second term is the scaled magnitude of
transverse diffusion. Thus, when L >> Hm, axial diffusion in the mucus phase is
negligible and no boundary conditions are required in the axial direction.
2 2
21mm
i i m
C Cx x H
L⎡ ⎤⎛∂= Ο +
⎞⎢ ⎥⎜∂ ∂ ⎝ ⎠
⎟⎣ ⎦
(6.7)
Beneath the mucus layer lies the receptor layer, where diffusion-limited odorant
binding occurs (see section 6.1). At this location, diffusion-limited kinetics requires a
zero-concentration boundary condition in the mucus phase, at the receptor layer surface.
At the air-mucus interface, boundary conditions are required on velocity of the air-
vapor mixture and odorant concentration in both phases. Assuming negligible mucus
advection, a no-slip boundary condition is appropriate for velocity. Species transport
across the air-mucus interface is somewhat more involved.
Figure 6.3 illustrates the multi-phase mass transport phenomena occurring at the air-
mucus interface. Generally, two boundary conditions apply. First, because the interface

101
is infinitesimally thin, it cannot store mass. Thus, from conservation of mass, the normal
flux of odorant on either side of the interface, Jia and Jim in Figure 6.3, must be equal.
Figure 6.3: Air-mucus interfacial mass transport boundary conditions
The second boundary condition applies to the odorant species concentration on either
side of the interface in the air and mucus phases, Cia and Cim, respectively. Unlike
thermal energy transport, where temperature is continuous across a gas-liquid interface,
species concentration may be discontinuous, as shown in Figure 6.3. Chemical
interactions occurring at the interface determine Cia and Cim.

102
At the microscopic scale, the gas-liquid interface is a thin, yet finite region of transition
from one phase to the next over a distance of several molecular diameters [164]. Kinetic
interactions occurring at the interface result in the accumulation (adsorption) and
vaporization (desorption) of odorant molecules to and from the surface. Once at the
surface, odorant molecules may then enter the bulk liquid phase, a process known as
solvation [165, 166]. The overall uptake of air-phase molecules by the liquid mucus
phase is commonly referred to as vapor deposition, mass accommodation, or gas
absorption.
The kinetics of this mass accommodation process may be described by Equation 6.8,
where G and L represent gas- and liquid-phase odorant species in air and mucus,
respectively, and k is the corresponding rate coefficient. The odorant concentration on
either side of the air-mucus interface is described by the corresponding first-order rate
equation, Equation 6.9. In general, mass accommodation occurs at a much faster rate
than either air-phase advection or diffusion in the mucus layer, permitting an equilibrium
approximation, Equation 6.10. The ensuant equilibrium constant is defined in Equation
6.11, derived from Equations 6.9 and 6.10.
g
g
k
kG L⎯⎯→←⎯⎯ (6.8)
im iag ia g im
dC dC k C k Cdt dt
= − = − (6.9)

103
0im iadC dCdt dt
= − ≈ (6.10)
g ia
g im
k Ck C
β = = (6.11)
The important result contained in Equation 6.11, which provides the final interfacial
mass transport boundary condition, is referred to as the “dimensionless Henry’s law
constant” or more generally as the “equilibrium partition coefficient.” This
nondimensional number is a measure of the solubility of a given molecule in a specific
liquid solution and is tabulated for many different chemicals, mostly in aqueous
solutions. From the definition, smaller values of β indicate increased solubility, whereas
volatile chemicals have a larger β.
6.3 Dimensional Analysis
In general, there are two methods for finding the nondimensional parameters of a
problem. If the governing equations and boundary conditions are known and are
relatively tractable, they can be nondimensionalized by the characteristic problem scales
(spatial, temporal, etc.) to directly give the various nondimensional parameters.
Otherwise, a dimensional analysis of the relevant variables may be used [163].
Here, given the complexity of the multiphase problem and the number of governing
equations and boundary conditions, dimensional analysis is the preferred approach.

104
Specifically, the method of repeating variables and the Buckingham Pi theorem are
utilized to extract the universal nondimensional parameters governing olfactory mass
transport phenomena. Briefly, the method consists of listing the important physical
variables of the problem (both dependent and independent), choosing a subset of
“repeating variables”, and generating the nondimensional groups known as Pi’s (i.e., Π’s)
by nondimensionalizing each non-repeating variable with the chosen set of repeating
variables (see refs. [46, 136] for further details).
For canine olfaction, the dependent variable of interest or, the term to be solved for is
the odorant flux at the receptor layer, JReceptor, which equals the diffusion-limited binding
rate of odorant to olfactory receptors. The important independent variables were chosen
by considering the physical model described in section 6.1, classifying each variable or
parameter by its role in olfaction. Table 6.1 lists the fundamental physical variables of
odorant transport in the olfactory region of the canine and Equation 6.12 summarizes
their functional relationship.
Given the number of physical variables (12) and the number of primary dimensions (3),
from the Buckingham Pi Theorem [46], at least nine nondimensional parameters are
expected. Choosing the “global parameters” (Table 6.1) as the “repeating variables”, and
following some rearrangement, Table 6.2 presents the definitions and physical
significance of the nondimensional parameters governing odorant transport in the canine
nasal cavity. Equation 6.13 contains the corresponding functional relationship.

105
Table 6.1: Fundamental physical variables of canine olfaction
Variable Symbol Units Classification
Receptor flux JReceptor μmol/m2-s Dependent variable
Inlet odorant concentration CInlet μmol/m3 Global parameter
Sniff frequency nSniff s-1 Global parameter
Mean velocity U m/s Global parameter
Airway hydraulic diameter Dh m Airway length scale
Length of olfactory region Lolf m Airway length scale
Kinematic viscosity of air ν m2/s Air-phase fluid property
Binary diffusivity of odorant in air Doa m2/s Air-phase fluid property
Mucus thickness Hm m Mucus length scale
Binary diffusivity of odorant in mucus Dom m2/s Mucus-phase fluid property
Convective mass transfer coefficient hm m/s Interfacial condition
Equilibrium partition coefficient β – Interfacial condition
( )Receptor Inlet Sniff h olf oa m om mJ C ,n ,U,D ,L , ,D ,H ,D ,h ,f υ β= (6.12)

106
Table 6.2: Nondimensional parameters governing olfactory mass transport in the canine
nasal cavity
Nondimensional Parameter Symbol Definition Physical Significance
Nondimensional receptor flux JReceptor/JInlet JReceptor/UCInlet
Ratio of receptor flux to inlet flux
Reynolds number ReDh UDh/ν Characterizes the nature of quasi-steady internal airflow
Womersley number WoDh hD /2 n/υ Characterizes the nature of unsteady flow
Nondimensional olfactory time scale τolf nSniffLolf/U Ratio of axial advection time
scale to sniff time scale
Schmidt number Sc ν/Doa Ratio of viscous to
mass diffusivity
Normalized mucus diffusion time scale γm 2
m Sniff omH n /D Ratio of mucus diffusive time scale to sniff time scale
Mass transfer Biot number Bim hmHm/Dom
Ratio of mucus diffusive resistance to interfacial mass
transport rate
Mass transfer Stanton number Stm hm/U
Ratio of interfacial mass transport rate to
advective transport rate
Partition coefficient β Cia/Cim Odorant solubility
( )Receptor InletJ / J Re , , , , , , ,Dh Dh olf m m mf Wo Sc Bi Stτ γ= β (6.13)

107
6.4 Numerical Model
In the absence of a complete analytic solution for the mathematical model of section 6.2,
the general physics of unsteady olfactory mass transport was considered via a reduced-
order numerical model, consisting of one-dimensional advective transport in liquid-lined
olfactory airways. As illustrated in Figure 6.4, the canine olfactory region is well-
approximated by a one-dimensional series of channels of equivalent morphometric
statistics (see chapter 2).
One-dimensional forms of the governing equations for air-phase odorant advection are
shown in Equations 6.14 – 6.16, in conservative form. Additionally, the one-dimensional
diffusion equation for transverse mucus-phase odorant transport is given in Equation
6.17. Here, dAs and represent differential elements of the local surface area and
airway volume, respectively.
d∀
Due to the one-dimensional constraint, the diffusion terms of the momentum and
species transport equations cannot be solved for explicitly. Consequently, one-
dimensional forms of these terms are used that include the friction factor, f, and the
convective mass transfer coefficient, hm. An additional minor loss coefficient, Km, is
included in the momentum equation to account for potential pressure losses due to local
geometry changes (bends, contractions, expansions, etc.).

108
Figure 6.4: Schematic illustration of the olfactory region of the canine nasal cavity,
approximated as a one-dimensional series of channels. (a) A cross-section of the canine
olfactory region. (b) One-dimensional channel array with equivalent morphometric
statistics.
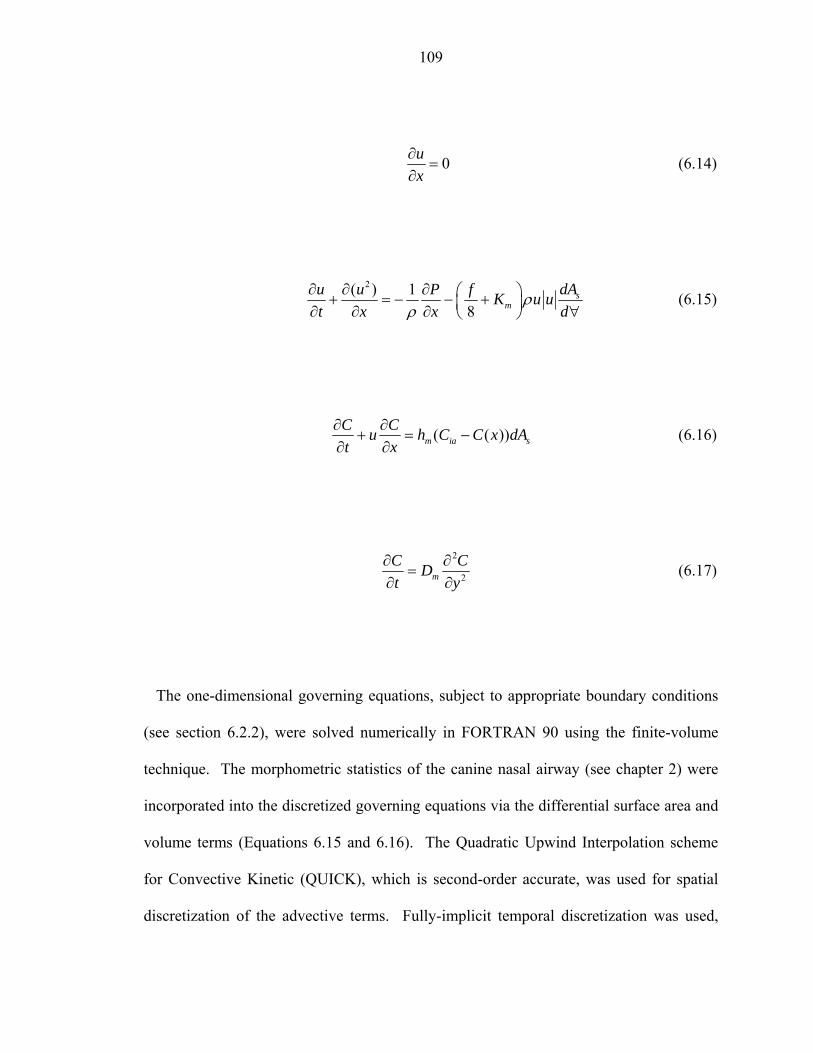
109
0ux
∂=
∂ (6.14)
2( ) 1
8s
mu u P f dAK u ut x x d
ρρ
∂ ∂ ∂ ⎛ ⎞+ = − − +⎜ ⎟∂ ∂ ∂ ⎝ ⎠ ∀ (6.15)
( ( ))m ia sC Cu h C C x dt x
A∂ ∂+ = −
∂ ∂ (6.16)
2
2mC Dt
Cy
∂ ∂=
∂ ∂ (6.17)
The one-dimensional governing equations, subject to appropriate boundary conditions
(see section 6.2.2), were solved numerically in FORTRAN 90 using the finite-volume
technique. The morphometric statistics of the canine nasal airway (see chapter 2) were
incorporated into the discretized governing equations via the differential surface area and
volume terms (Equations 6.15 and 6.16). The Quadratic Upwind Interpolation scheme
for Convective Kinetic (QUICK), which is second-order accurate, was used for spatial
discretization of the advective terms. Fully-implicit temporal discretization was used,
110
requiring the implementation of a custom Newton-Raphson nonlinear solver. Finally, a
second-order-accurate flux-matching boundary condition was implemented at the air-
mucus interface.
6.5 Verification
For verification purposes, the numerical code was developed with an option permitting
the uncoupled solution of either the advection and diffusion problems. By specifying
either a channel-wall surface concentration or molar flux, fully-developed one-
dimensional airflow and convective mass transfer were calculated for various “ideal”
cases and compared with available analytic solutions. Likewise, the uncoupled diffusion
problem was solved for either a prescribed convective surface boundary condition or a
constant surface molar flux, and was compared with theory. The convective boundary
condition was implemented by specifying a surface mass transfer coefficient and an air-
phase vapor concentration.
In both cases, a thorough verification of all governing equations and each of the
included terms was performed. For advection in the air-phase, this included verifying
conservation of mass and momentum, and both steady and unsteady convective mass
transfer. For uncoupled diffusion in the mucus layer, solutions of steady and unsteady
mass transfer were verified. Lastly, the interfacial flux-matching boundary condition,
which couples advective mass transfer in the airways and diffusive mass transfer in the
mucus layer, was verified.

111
6.5.1 Air-Phase Transport: Conservation of Mass
To confirm that the numerical code conserves mass, the inlet and outlet volumetric flow
rate are plotted in Figure 6.5 for a transient startup due to an impulsively-applied pressure
difference (ΔP = 20 Pa). The comparison is excellent, indicating the numerical solution
of this incompressible flow field is mass-conservative.
t (s)
Q(L
/s)
0 0.1 0.2 0.3 0.4 0.50
0.1
0.2
0.3
0.4
0.5
0.6
0.7
InletOutlet
Figure 6.5: Verification of conservation of mass

112
6.5.2 Air-Phase Transport: Conservation of Momentum
To verify accurate solution of the momentum equation, the computed steady state
momentum balance, Figure 6.6, was compared to theory, Equation 6.18. Here, U is the
mean velocity, μ is the dynamic viscosity of air, and h is the channel half-height. The
computed momentum balance was nearly exact, within a fraction of a percent difference
(~ 0.1%). Thus, the numerical code also conserves momentum.
2
3dP Udx h
μ= − (6.18)
x (m)
P(P
a)
0 0.005 0.01 0.015 0.02 0.025 0.03101305
101310
101315
101320
101325
dP/dx = -3μU / h2
Figure 6.6: Verification of conservation of momentum

113
6.5.3 Air-Phase Transport: Steady Convective Mass Transfer
Accurate solution of the convective terms of the species transport equation was verified
by comparing the computed steady state axial concentration distribution with the analytic
solution, Equation 6.19. Here, the channel-wall surface concentration, CSurface, the
convective mass transfer coefficient, hm, and a concentration inlet boundary condition,
CInlet, were specified. An excellent comparison of the computed and analytic solutions is
shown in Figure 6.7.
( ( ) ) /( ) exp mSurface Inlet Surface
h xC x C C CUh
−⎛ ⎞− − = ⎜⎝ ⎠
⎟ (6.19)
x (m)
(C(x
)-C
Sur
face
)/(C
Inle
t-C
Sur
face
)
0 0.005 0.01 0.015 0.02 0.025 0.030
0.2
0.4
0.6
0.8
1
AnalyticCFD
Figure 6.7: Verification of steady convective mass transfer
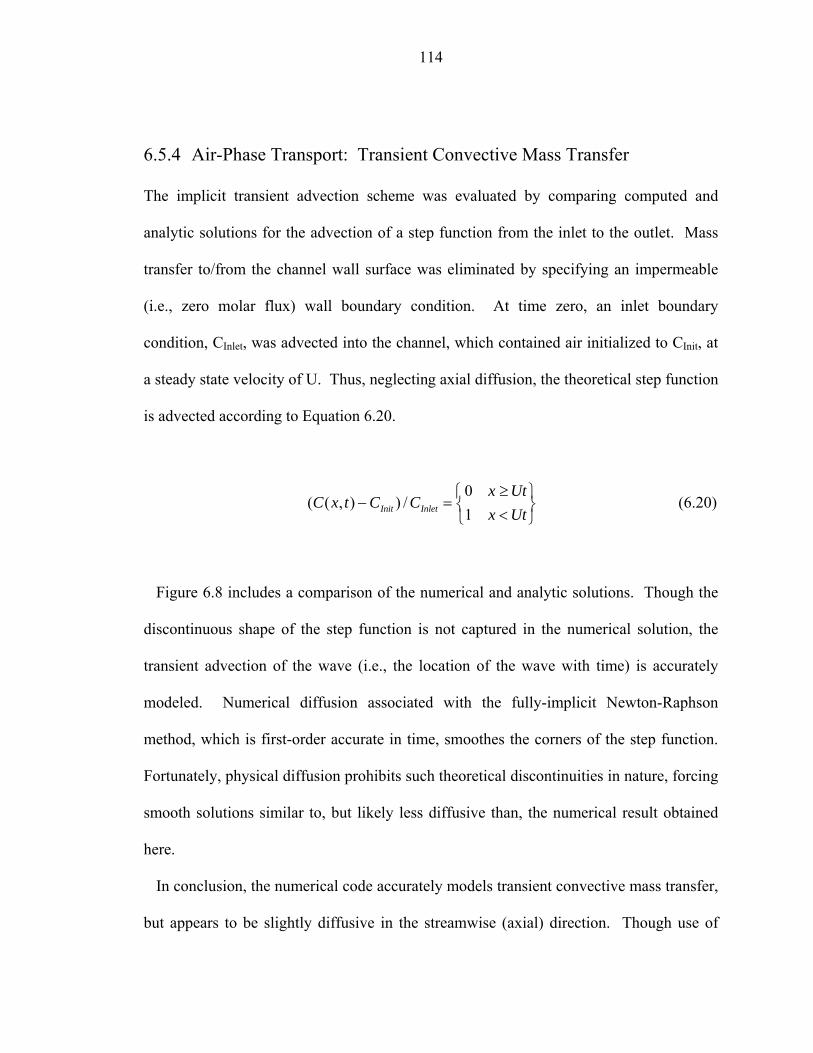
114
6.5.4 Air-Phase Transport: Transient Convective Mass Transfer
The implicit transient advection scheme was evaluated by comparing computed and
analytic solutions for the advection of a step function from the inlet to the outlet. Mass
transfer to/from the channel wall surface was eliminated by specifying an impermeable
(i.e., zero molar flux) wall boundary condition. At time zero, an inlet boundary
condition, CInlet, was advected into the channel, which contained air initialized to CInit, at
a steady state velocity of U. Thus, neglecting axial diffusion, the theoretical step function
is advected according to Equation 6.20.
0( ( , ) ) /
1Init Inlet
x UtC x t C C
x Ut≥⎧ ⎫
− = ⎨ ⎬<⎩ ⎭ (6.20)
Figure 6.8 includes a comparison of the numerical and analytic solutions. Though the
discontinuous shape of the step function is not captured in the numerical solution, the
transient advection of the wave (i.e., the location of the wave with time) is accurately
modeled. Numerical diffusion associated with the fully-implicit Newton-Raphson
method, which is first-order accurate in time, smoothes the corners of the step function.
Fortunately, physical diffusion prohibits such theoretical discontinuities in nature, forcing
smooth solutions similar to, but likely less diffusive than, the numerical result obtained
here.
In conclusion, the numerical code accurately models transient convective mass transfer,
but appears to be slightly diffusive in the streamwise (axial) direction. Though use of

115
higher-order explicit time-integration schemes may result in less numerical diffusion,
these methods require extremely small time step sizes to maintain numerical stability.
Such additional computational expense is not presently warranted for modeling one-
dimensional airflow. Thus, the level of numerical diffusion shown in Figure 6.8 is
deemed acceptable for present purposes.
(C(x
,t)-C
Init)
/CIn
let
0
0.2
0.4
0.6
0.8
1
t = 0.008 s
(C(x
,t)-C
Init)
/CIn
let
0
0.2
0.4
0.6
0.8
1
AnalyticCFD
t = 0.0035 s
x(m)
(C(x
,t)-C
Init)
/CIn
let
0 0.005 0.01 0.015 0.02 0.025 0.030
0.2
0.4
0.6
0.8
1
t = 0.0125 s
Figure 6.8: Verification of transient convective mass transfer

116
6.5.5 Mucus-Phase Transport: Steady Diffusion
A steady-state solution of uncoupled diffusion in the mucus layer was used to verify the
spatial accuracy of the transport terms in the mucus-phase diffusion equation via a
comparison with the analytic solution, Equation 6.21. Here, a zero-concentration
boundary condition was applied at the epithelium surface and the ambient air-phase vapor
concentration, CAir, and convective mass transfer coefficient, hm, were specified at the
air-mucus interface. As shown in Figure 6.9, a linear steady state concentration
distribution was calculated in the mucus layer, which is indistinguishable from the exact
solution.
1( ) /
( / )Airom m m m
yC y CD h H Hβ
⎡ ⎤= ⎢ +⎣ ⎦
⎥ (6.21)
(C(y) / CAir) * (Dom/hmHm + β)
y/H
m
0 0.2 0.4 0.6 0.8 10
0.2
0.4
0.6
0.8
1
AnalyticCFD
Figure 6.9: Verification of steady diffusion mass transfer in the mucus layer
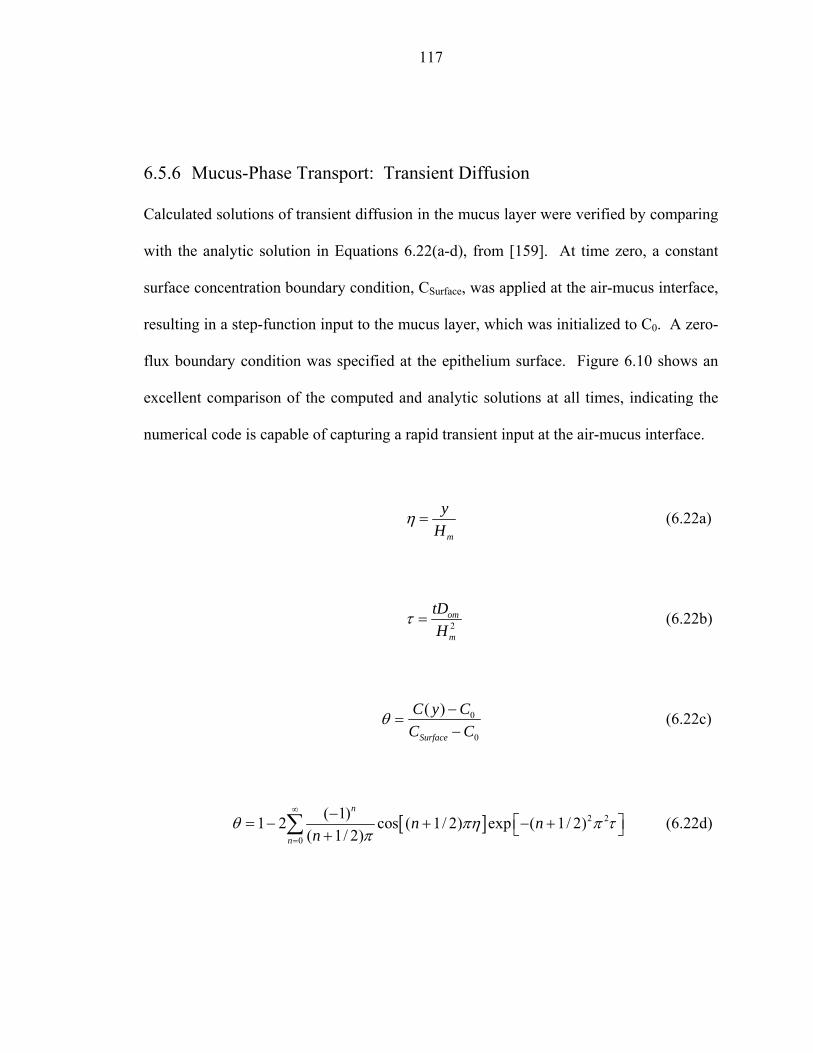
117
6.5.6 Mucus-Phase Transport: Transient Diffusion
Calculated solutions of transient diffusion in the mucus layer were verified by comparing
with the analytic solution in Equations 6.22(a-d), from [159]. At time zero, a constant
surface concentration boundary condition, CSurface, was applied at the air-mucus interface,
resulting in a step-function input to the mucus layer, which was initialized to C0. A zero-
flux boundary condition was specified at the epithelium surface. Figure 6.10 shows an
excellent comparison of the computed and analytic solutions at all times, indicating the
numerical code is capable of capturing a rapid transient input at the air-mucus interface.
m
yH
η = (6.22a)
2om
m
tDH
τ = (6.22b)
0
0
( )
Surface
C y CC
θC
−=
− (6.22c)
[ ] 2 2
0
( 1)1 2 cos ( 1/ 2) exp ( 1/ 2)( 1/ 2)
n
n
n nn
θ πη π τπ
∞
=
− ⎡ ⎤= − + − +⎣ ⎦+∑ (6.22d)
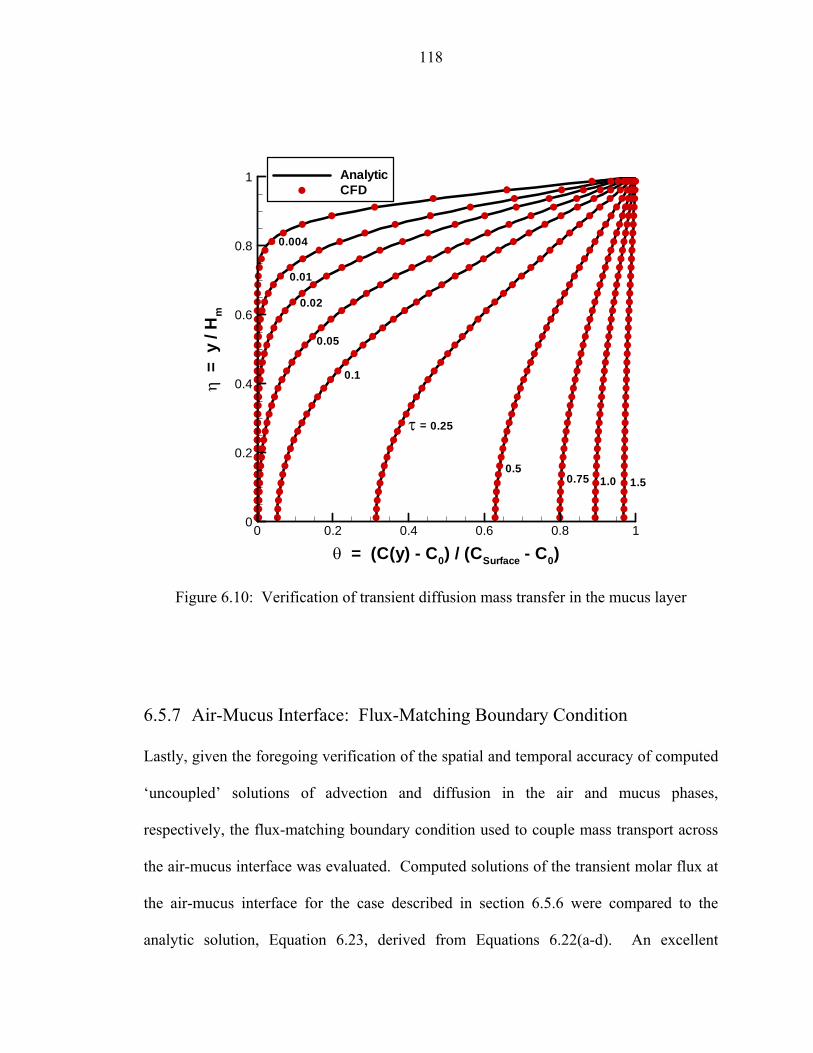
118
θ = (C(y) - C0) / (CSurface - C0)
η=
y/H
m
0 0.2 0.4 0.6 0.8 10
0.2
0.4
0.6
0.8
1 AnalyticCFD
0.004
0.01
0.02
0.05
0.1
0.25
0.50.75 1.0 1.5
τ =
Figure 6.10: Verification of transient diffusion mass transfer in the mucus layer
6.5.7 Air-Mucus Interface: Flux-Matching Boundary Condition
Lastly, given the foregoing verification of the spatial and temporal accuracy of computed
‘uncoupled’ solutions of advection and diffusion in the air and mucus phases,
respectively, the flux-matching boundary condition used to couple mass transport across
the air-mucus interface was evaluated. Computed solutions of the transient molar flux at
the air-mucus interface for the case described in section 6.5.6 were compared to the
analytic solution, Equation 6.23, derived from Equations 6.22(a-d). An excellent

119
comparison is shown in Figure 6.11, thus verifying the interfacial flux-matching
boundary condition.
[ ] 2 20
0
2 ( ) ( 1) sin ( 1/ 2) exp ( 1/ 2)nomSurface Surface
nm
DJ C C n nH
π π τ∞
=
⎛ ⎞⎡ ⎤= − − + − +⎜ ⎟ ⎣ ⎦
⎝ ⎠∑ (6.23)
τ = t Dom / Hm2
J Sur
face
Hm
/Dom
(CS
urfa
ce-C
0)
10-2 10-1 100
10-2
10-1
100
101
AnalyticCFD
Figure 6.11: Verification of the flux-matching boundary condition across the air-mucus
interface

120
6.6 Results
To investigate olfactory mass transport in the canine nasal airway, one-dimensional
mucus-lined channels were used to approximate the olfactory region of the nasal cavity.
Specifically, one-dimensional forms of the governing equations (Equations 6.14 - 6.17)
require distributions of surface area and internal volume and values for the friction factor,
f, and convective mass transfer coefficient, hm. Here, the surface area and volume were
based on characteristic morphometric airway data in the olfactory region (see Chapter 2),
Table 6.3. As shown in Figure 6.4, the canine olfactory region consists of many small
channels. Thus, values of f and hm for laminar channel flow were used.
Realistic olfactory airflow rates and sniff frequencies were used to study odorant
transport associated with steady inspiration and sniffing. Based on the three-dimensional
CFD model (Chapter 5), at peak inspiration ~15% of the inspired air flows through the
olfactory region of the nose, which corresponds to an olfactory airflow rate of roughly
0.075 L/s for the particular dog studied here. However, considering the potential
influence of nostril modulation on the regional allocation of airflow in the nasal cavity
(still to be determined), the value may be higher (see Chapter 5 for further discussion).
Thus, the influence of airflow rate on odorant transport is held for future investigation.

121
Table 6.3: Morphometric data of the two-dimensional channel array used to approximate
the olfactory region of the canine
Length, Lolf Perimeter, P Cross-Sectional Area, Ac
Hydraulic Diameter, Dh
Surface Area, As
Internal Volume, V
32.24 mm 651.77 mm 287.63 mm2 1.77 mm 210.13 cm2 9.27 cm3
The transport of five different odorant vapors was considered: amyl acetate,
cyclohexanone, dinitrotoluelene (DNT), limonene, and methyl benzoate. Table 6.4 lists
the molecular formula and relevant properties of each chemical. These particular
chemicals were selected based on their partition coefficients, β, which collectively span
more than six orders of magnitude.
Calculations of steady inspiration and of unsteady sniffing were carried out for a
standard inlet odorant concentration of 1μM and a nominal mucus thickness of 10 μm,
assuming a laminar, quasi-steady convective mass transfer coefficient. The influence of
the convective mass transfer coefficient is the topic of future work.

122
Table 6.4: Chemical properties of selected odorant vapors
Amyl Acetate Cyclohexanone DNT Limonene Methyl
Benzoate Molecular Formula C7H14O2 C6H10O C7H6N2O4 C10H16 C8H8O2
Doa (m2/s) 6.7E-6 8.1E-6 6.5E-6 6.3E-6 7.1E-6
Dom (m2/s) 7.8E-10 9.1E-10 7.3E-10 7.0E-10 7.5E-10
β 1.59E-2 3.68E-4 2.21E-6 1.05 1.32E-3
6.6.1 Steady Inspiration
Steady olfactory mass transport was considered for the five chemicals listed in Table 6.4.
Figure 6.12 is a summary of the results. Here, the odorant molecular flux at the “receptor
layer” is plotted as a function of axial location in units of molecules/second per OSN (see
section 6.1). Figure 6.12(a) shows results for the more soluble chemicals (low β),
whereas the less soluble vapors (high β) are plotted in Figure 6.12(b).
Clearly, there is a strong variation of the deposition pattern along the receptor layer for
the various chemical vapors. In general, the highly-soluble vapor molecules are
deposited (i.e., bound and consumed) at the upstream receptor sites, whereas less-soluble
chemicals are more evenly deposited along the length of the receptor layer. This
demonstrates the chromatographic-like separation, or fractionation, of odorant vapors
based the magnitude of the partition coefficient. The combination of such odorant
fractionation and the inherent spatial distribution of olfactory receptors in the nasal cavity
is thought to aid olfactory discrimination [33, 107]. That is, for optimal odorant
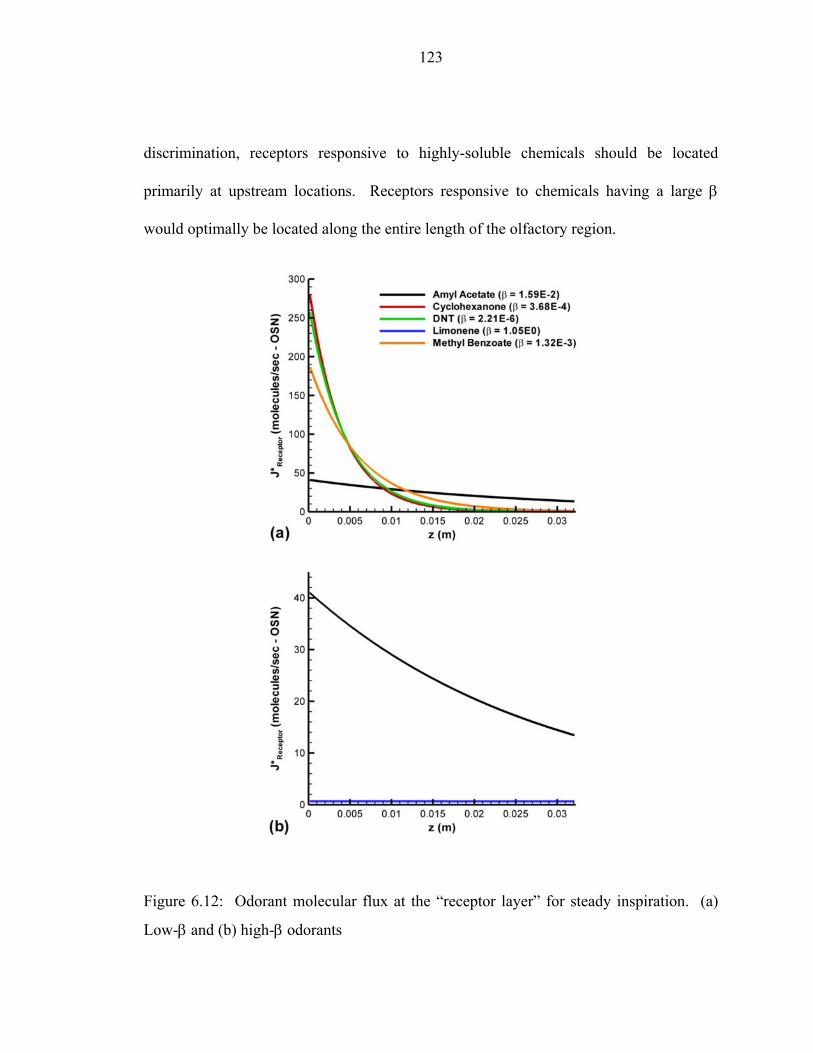
123
discrimination, receptors responsive to highly-soluble chemicals should be located
primarily at upstream locations. Receptors responsive to chemicals having a large β
would optimally be located along the entire length of the olfactory region.
Figure 6.12: Odorant molecular flux at the “receptor layer” for steady inspiration. (a)
Low-β and (b) high-β odorants
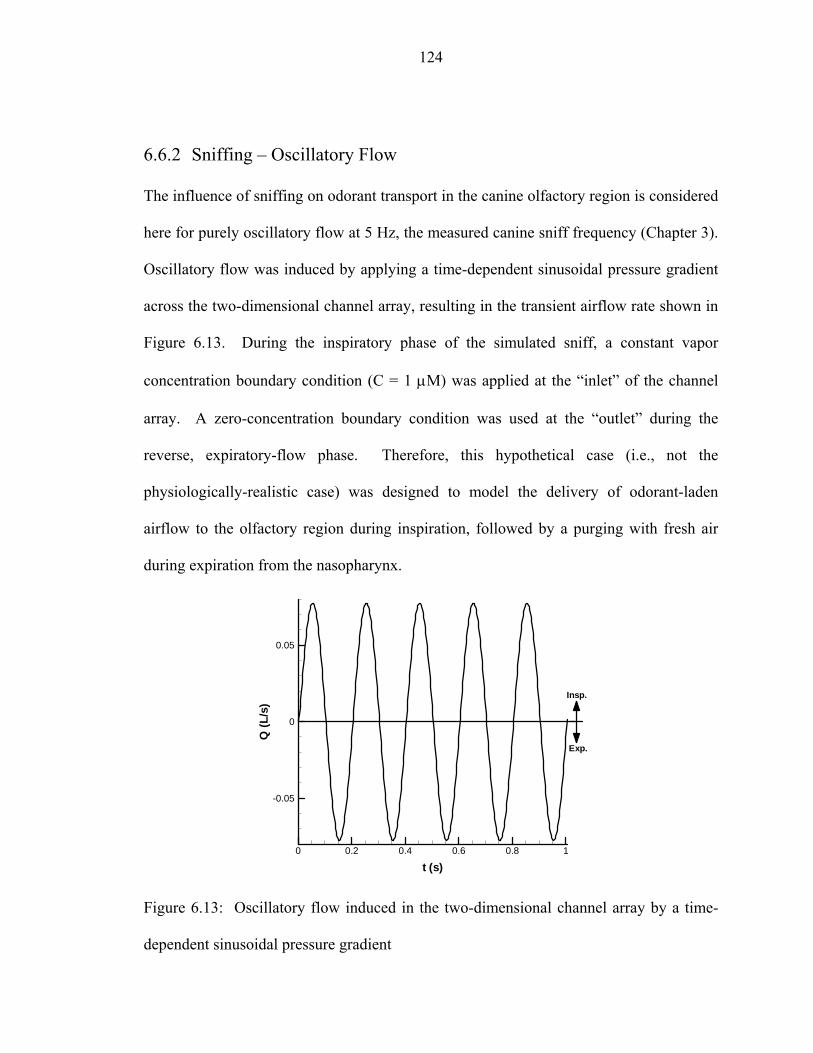
124
6.6.2 Sniffing – Oscillatory Flow
The influence of sniffing on odorant transport in the canine olfactory region is considered
here for purely oscillatory flow at 5 Hz, the measured canine sniff frequency (Chapter 3).
Oscillatory flow was induced by applying a time-dependent sinusoidal pressure gradient
across the two-dimensional channel array, resulting in the transient airflow rate shown in
Figure 6.13. During the inspiratory phase of the simulated sniff, a constant vapor
concentration boundary condition (C = 1 μM) was applied at the “inlet” of the channel
array. A zero-concentration boundary condition was used at the “outlet” during the
reverse, expiratory-flow phase. Therefore, this hypothetical case (i.e., not the
physiologically-realistic case) was designed to model the delivery of odorant-laden
airflow to the olfactory region during inspiration, followed by a purging with fresh air
during expiration from the nasopharynx.
t (s)
Q(L
/s)
0 0.2 0.4 0.6 0.8 1
-0.05
0
0.05
Exp.
Insp.
Figure 6.13: Oscillatory flow induced in the two-dimensional channel array by a time-
dependent sinusoidal pressure gradient
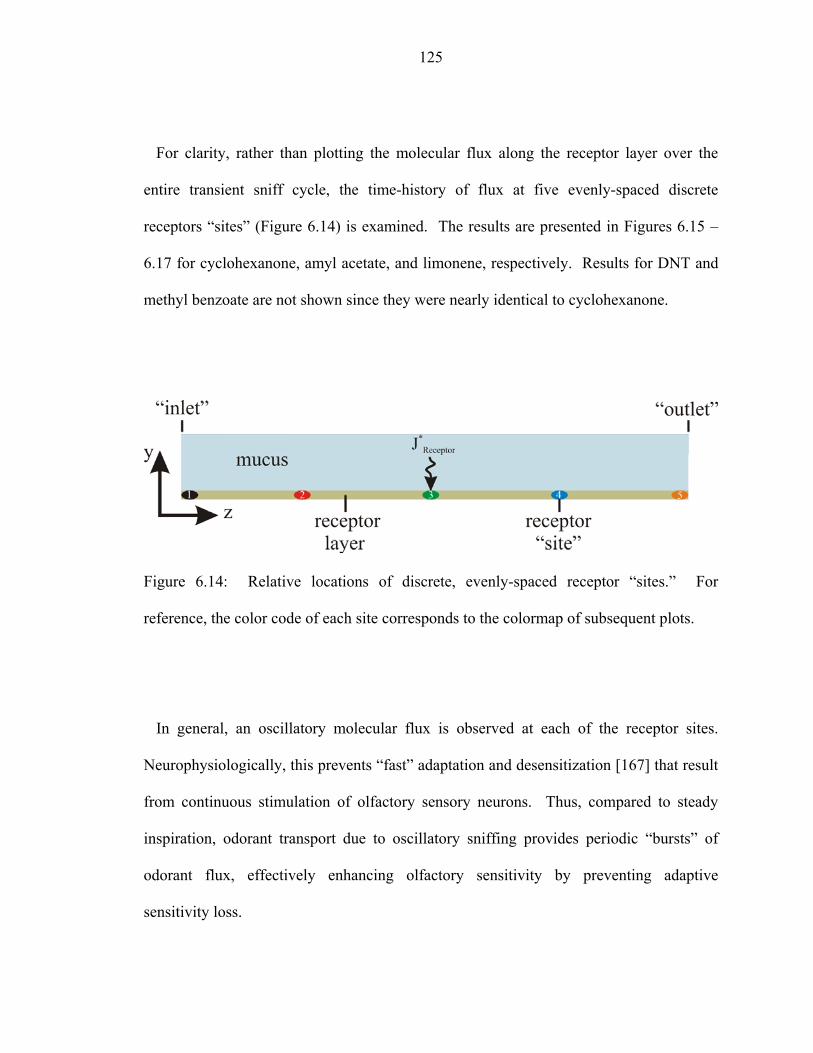
125
For clarity, rather than plotting the molecular flux along the receptor layer over the
entire transient sniff cycle, the time-history of flux at five evenly-spaced discrete
receptors “sites” (Figure 6.14) is examined. The results are presented in Figures 6.15 –
6.17 for cyclohexanone, amyl acetate, and limonene, respectively. Results for DNT and
methyl benzoate are not shown since they were nearly identical to cyclohexanone.
Figure 6.14: Relative locations of discrete, evenly-spaced receptor “sites.” For
reference, the color code of each site corresponds to the colormap of subsequent plots.
In general, an oscillatory molecular flux is observed at each of the receptor sites.
Neurophysiologically, this prevents “fast” adaptation and desensitization [167] that result
from continuous stimulation of olfactory sensory neurons. Thus, compared to steady
inspiration, odorant transport due to oscillatory sniffing provides periodic “bursts” of
odorant flux, effectively enhancing olfactory sensitivity by preventing adaptive
sensitivity loss.

126
As in the case of steady inspiratory flow, the highest flux of cyclohexanone occurred at
upstream locations (Figure 6.15); the flux is effectively zero beyond receptor site 2. The
same trend was observed for the other highly-soluble chemicals, DNT and methyl
benzoate. Conversely, the flux pattern observed for amyl acetate (Figure 6.16) and
limonene (Figure 6.17) during oscillatory sniffing was markedly different than the pattern
shown for steady inspiration. In both cases, no odorant molecules reached the
downstream receptor sites 4 and 5.
t (s)
J*R
ecep
tor(m
olec
ules
/sec
-OS
N)
0 0.2 0.4 0.6 0.8 10
50
100
150
200
250
300 12345
Figure 6.15: Time-history of molecular flux for cyclohexanone at discrete receptor sites
(numbered in the legend) for oscillatory olfactory airflow.

127
t (s)
J*R
ecep
tor(m
olec
ules
/sec
-OS
N)
0 0.2 0.4 0.6 0.8 10
10
20
30
40
50 12345
Figure 6.16: Time-history of molecular flux for amyl acetate at discrete receptor sites for
oscillatory olfactory airflow
To better illustrate the influence of oscillatory flow on odorant transport, Figure 6.18
shows the distribution of odorant flux along the receptor layer at an elapsed time of 0.9
seconds, roughly corresponding to the phase of peak molecular flux for each of the
chemicals. Based on a comparison of Figures 6.12(a) and 6.18(a), the flux distribution of
the highly-soluble chemicals is nearly identical for steady inspiration and for oscillatory
sniffing. From Figure 6.18(b), chemicals with a larger β (amyl acetate and limonene) are
deposited in the same upstream region. The flux distribution for these chemicals is not

128
uniformly distributed along the length of the receptor layer, as it is during steady
inspiration, Figure 6.12(b). Accordingly, half of the receptor layer is effectively void of
odorant flux during oscillatory sniffing due to the cleansing action of fresh air from the
nasopharynx during expiration.
t (s)
J*R
ecep
tor(m
olec
ules
/sec
-OS
N)
0 0.2 0.4 0.6 0.8 10
0.1
0.2
0.3
0.4
0.5
0.6
0.7
0.8
0.9
1 12345
Figure 6.17: Time-history of molecular flux for limonene at discrete receptor sites for
oscillatory olfactory airflow

129
Figure 6.18: Odorant molecular flux at the “receptor layer” for oscillatory olfactory
airflow at an elapsed time of 0.9 seconds
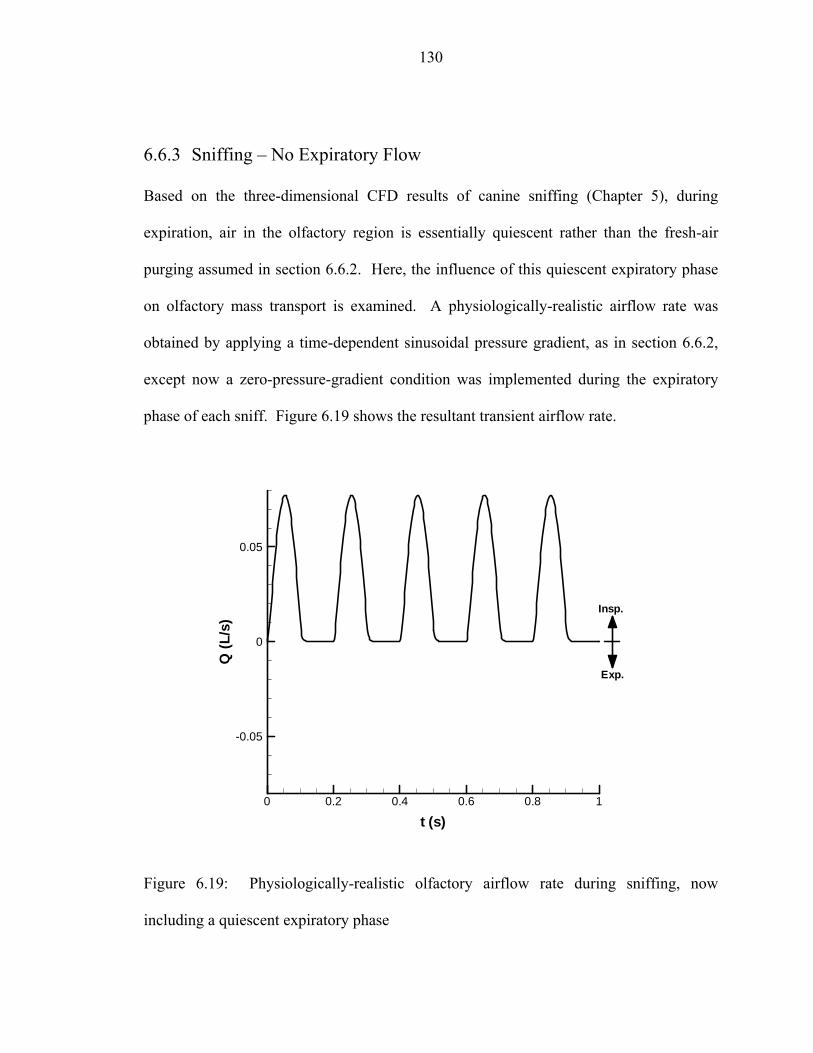
130
6.6.3 Sniffing – No Expiratory Flow
Based on the three-dimensional CFD results of canine sniffing (Chapter 5), during
expiration, air in the olfactory region is essentially quiescent rather than the fresh-air
purging assumed in section 6.6.2. Here, the influence of this quiescent expiratory phase
on olfactory mass transport is examined. A physiologically-realistic airflow rate was
obtained by applying a time-dependent sinusoidal pressure gradient, as in section 6.6.2,
except now a zero-pressure-gradient condition was implemented during the expiratory
phase of each sniff. Figure 6.19 shows the resultant transient airflow rate.
t (s)
Q(L
/s)
0 0.2 0.4 0.6 0.8 1
-0.05
0
0.05
Exp.
Insp.
Figure 6.19: Physiologically-realistic olfactory airflow rate during sniffing, now
including a quiescent expiratory phase

131
Notably, plots for the highly-soluble chemicals (cyclohexanone, DNT, and methyl
benzoate) are not shown since the results were indistinguishable from the oscillatory-flow
case, where odorant deposition was confined to the upstream region of the receptor layer.
Figures 6.20 and 6.21 show the time-history of odorant flux at the five evenly-spaced
receptor “sites” for amyl acetate and limonene, respectively.
Here, deposition patterns for amyl acetate and limonene were remarkably different than
the patterns resulting from purely oscillatory airflow. In both cases, there is an
accumulation of odorant in the mucus layer over the first few sniff cycles, resulting in
odorant deposition over the entire receptor layer. This “accumulator” effect is a direct
consequence of the quiescent expiratory phase of each sniff, which yields an additional
odorant residence time for insoluble odorant deposition.
Comparing Figures 6.20 and 6.21, each of these low-solubility chemicals has a unique
spatiotemporal flux signature on the receptor layer. That is, the time rate of accumulation
of odorant species in the mucus layer during the first few sniffs for each of these fairly
insoluble chemicals is unique and results in a distinct deposition pattern. Thus, the novel
flow pattern established in the olfactory region of the dog during sniffing, which includes
a quiescent expiratory phase, permits accumulation of small signals and spatiotemporal
fractionation of moderately-soluble and insoluble odorants. Highly-soluble chemicals are
deposited at upstream locations on the receptor layer, regardless of the olfactory flow
pattern.
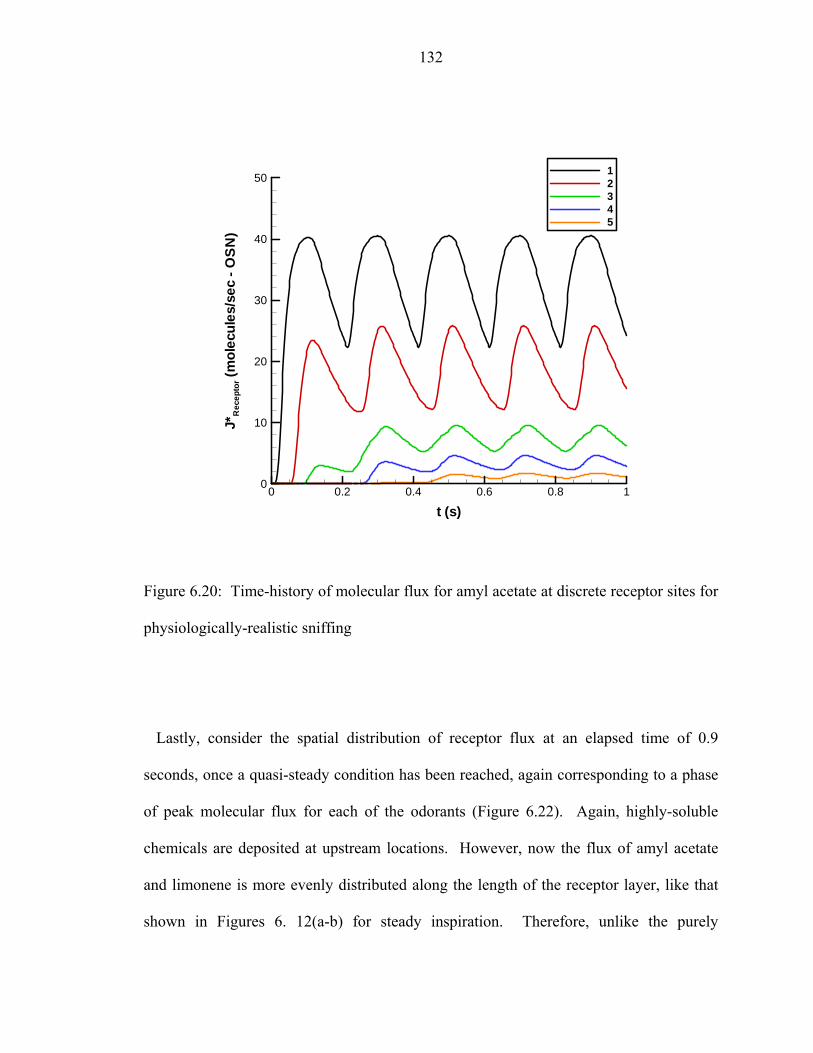
132
t (s)
J*R
ecep
tor(m
olec
ules
/sec
-OS
N)
0 0.2 0.4 0.6 0.8 10
10
20
30
40
50 12345
Figure 6.20: Time-history of molecular flux for amyl acetate at discrete receptor sites for
physiologically-realistic sniffing
Lastly, consider the spatial distribution of receptor flux at an elapsed time of 0.9
seconds, once a quasi-steady condition has been reached, again corresponding to a phase
of peak molecular flux for each of the odorants (Figure 6.22). Again, highly-soluble
chemicals are deposited at upstream locations. However, now the flux of amyl acetate
and limonene is more evenly distributed along the length of the receptor layer, like that
shown in Figures 6. 12(a-b) for steady inspiration. Therefore, unlike the purely

133
oscillatory-flow case, the entire receptor layer is being utilized and spatial fractionation
of moderately-soluble and insoluble odorants is re-established by the “accumulator”
effect associated with quiescent flow in the canine olfactory region during expiration.
t (s)
J*R
ecep
tor(m
olec
ules
/sec
-OS
N)
0 0.2 0.4 0.6 0.8 10
0.1
0.2
0.3
0.4
0.5
0.6
0.7
0.8
0.9
1 12345
Figure 6.21: Time-history of molecular flux for limonene at discrete receptor sites for
physiologically-realistic sniffing

134
Figure 6.22: Odorant molecular flux at the “receptor layer” for physiologically-realistic
sniffing at an elapsed time of 0.9 seconds

Chapter 7
Summary, Conclusions, and Future Work
7.1 Summary
This dissertation has investigated the anatomy and fundamental physics of canine
olfaction. High-resolution magnetic resonance imaging (MRI) scans of the nasal cavity
of a cadaver specimen were used to obtain an anatomically-correct model of the dog’s
nose and the associated morphometric statistics. Unique experimental data of canine
sniffing was acquired for seven dogs, ranging over nearly an order of magnitude in body
mass (6.8 – 52.9 kg). A high-fidelity three-dimensional CFD model of the canine nasal
cavity was developed, and results of the external and internal aerodynamics of canine
olfaction were presented. A novel physical model of olfactory mass transport phenomena
was described and dimensional analysis was used to characterize the physics of vertebrate
olfaction. Finally, a reduced-order numerical model was developed and used to capture
the essential physics of air-and mucus-phase odorant species transport in the olfactory
region of the canine nasal cavity.

136
7.2 Conclusions
For convenience, the conclusions of this work are presented in list form for each of the
general topics considered.
7.2.1 Reconstruction, Morphometric Analysis, and Functional Implications:
1. Based on high-resolution magnetic resonance imaging (MRI) data, the first
detailed rendering of the maxilloturbinate (respiratory) and ethmoidal (olfactory)
regions of the canine nasal cavity was shown.
2. The respiratory and olfactory airways of the dog are qualitatively and
quantitatively distinct structures. The respiratory airways are more highly
contorted than the olfactory airways.
3. The surface areas of the respiratory and olfactory regions (120 and 210 cm2,
respectively) are much different, despite having analogous physiological
functions.
4. The dorsal meatus of the canine nasal airway appears to function as a bypass for
odorant-bearing inspired air around the complicated respiratory region during
sniffing.
5. Based on nondimensional analysis, airflow within both the respiratory and
olfactory regions must be laminar.

137
7.2.2 Experimental Measurements:
1. New results of canine sniffing behavior were shown.
2. Canine sniffing consists of alternating series of inspirations and expirations, in a
roughly sinusoidal pattern.
3. During continuous odor sampling, natural canine sniffing behavior appears to be
organized as “bursts” of sniffs, where each burst consists of a crescendo and
decrescendo in flow rate, lasting anywhere from 0.5 to 2 seconds. Short sniffing
bouts appear as a single burst of sniffs, whereas long bouts frequently contain
multiple bursts.
4. The frequency of canine sniffing was shown to be independent of body mass. All
animals tested sniffed within a frequency band ranging from 4 to 7 Hz.
5. The peak inspiratory airflow rate and inspiratory tidal volume of a sniff are strong
functions of canine body size; both values scale approximately linearly with body
mass.
6. Based on a comparison the canine sniff frequency measured here with available
data in the literature, all macrosmatic animals appear to sniff within the same
frequency band. In contrast, microsmatic species sniff at a much slower rate.
7. Based on a comparison of the olfactory airflow results obtained here for the
canine (peak inspiratory airflow rate and inspiratory tidal volume) with available
data in the literature, macrosmatic sniffing behavior appears to scale
allometrically with body mass. Microsmatic animals do not fit this trend.
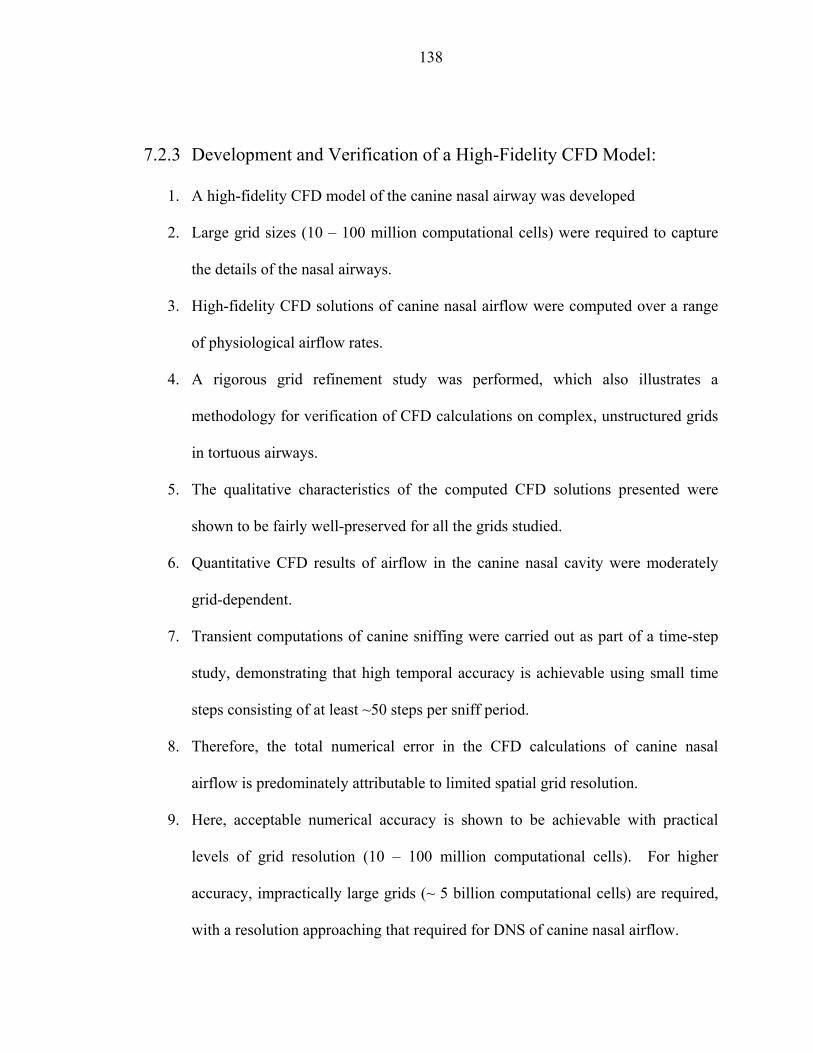
138
7.2.3 Development and Verification of a High-Fidelity CFD Model:
1. A high-fidelity CFD model of the canine nasal airway was developed
2. Large grid sizes (10 – 100 million computational cells) were required to capture
the details of the nasal airways.
3. High-fidelity CFD solutions of canine nasal airflow were computed over a range
of physiological airflow rates.
4. A rigorous grid refinement study was performed, which also illustrates a
methodology for verification of CFD calculations on complex, unstructured grids
in tortuous airways.
5. The qualitative characteristics of the computed CFD solutions presented were
shown to be fairly well-preserved for all the grids studied.
6. Quantitative CFD results of airflow in the canine nasal cavity were moderately
grid-dependent.
7. Transient computations of canine sniffing were carried out as part of a time-step
study, demonstrating that high temporal accuracy is achievable using small time
steps consisting of at least ~50 steps per sniff period.
8. Therefore, the total numerical error in the CFD calculations of canine nasal
airflow is predominately attributable to limited spatial grid resolution.
9. Here, acceptable numerical accuracy is shown to be achievable with practical
levels of grid resolution (10 – 100 million computational cells). For higher
accuracy, impractically large grids (~ 5 billion computational cells) are required,
with a resolution approaching that required for DNS of canine nasal airflow.

139
10. Given the ubiquity of CFD in studies of flow in the upper airways of animals and
humans, based on this work a grid dependence study and the reporting of
numerical error are recommended when presenting CFD results in these
complicated airways.
7.2.4 The Aerodynamics of Canine Olfaction:
1. The vestibule of the canine nasal airway functions as a turbulent-flow mixer for
odorant-laden inspired air. Upon entering the nasal cavity, inspiratory airflow is
well-mixed within the nasal vestibule by turbulence, prior to splitting into
olfactory and respiratory flow paths, thus ensuring delivery of a representative
odor sample to the olfactory region.
2. The overall location and configuration of the canine olfactory region is shown to
be critical to odorant transport.
3. The relegation of olfaction to an “olfactory recess,” in the rear of the nasal cavity
and off the main respiratory passage, produces a unique olfactory airflow pattern
during sniffing.
4. The results presented here reveal that the internal aerodynamics of canine
olfaction involves unidirectional flow through the olfactory recess during
inspiration and quiescent airflow in this region during the expiratory phase of
sniffing.

140
5. The inspiratory external aerodynamics of canine sniffing was shown to yield a
bilateral odor sample that may be exploited by the canine for stereoscopic
olfaction.
7.2.5 Modeling Olfactory Mass Transport Phenomena:
1. Given the olfactory airflow pattern in the canine nasal cavity during sniffing from
the three-dimensional CFD calculations, a reduced-order numerical model of air-
and mucus-phase odorant transport was used to characterize steady and unsteady
olfactory mass transport phenomena in the canine olfactory region.
2. A steady chromatographic-like separation, or fractionation, of odorant vapors was
shown to occur in the olfactory region of the dog.
3. Unsteady calculations of physiologically-realistic sniffing were used to shown
that the novel flow pattern established in the olfactory region of the dog during
sniffing, which includes a quiescent expiratory phase, permits accumulation of
odorant molecules in the mucus layer and spatiotemporal fractionation of
moderately-soluble and volatile odorants. This phenomenon yields a unique,
chemically-dependent molecular flux signature for each chemical at olfactory
receptor sites.

141
7.3 Future Work
The following list summarizes the recommended direction of future work related to
canine olfaction:
7.3.1 Experimental Measurements:
1. Experimental validation of the overall CFD results presented here via ventilator
and canine cadaver measurements.
2. Validation of the detailed CFD results shown here via magnetic resonance
imaging (MRI) velocimetry.
7.3.2 Computational Fluid Dynamics:
1. Incorporate nostril motion
2. Development of a three-dimensional odorant deposition model, based on the
reduced-order numerical model presented here (Chapter 6)
3. Consider particle deposition and its role in olfaction
7.3.3 Modeling Olfactory Mass Transport Phenomena:
1. Consider the heterogeneous nature of olfactory mucus
2. Correlate the “imposed” molecular flux signature along the “receptor layer” for
various chemicals and the “inherent” OSN receptor-type distribution in the
olfactory region of the canine nasal cavity.
142
Bibliography
[1] Keller, A. and Vosshall, L. B., 2004, "Human Olfactory Psychophysics," Current Biology, 14(20), pp. R875-R878.
[2] Settles, G. S., 2005, "Sniffers: Fluid-Dynamic Sampling for Olfactory Trace Detection in Nature and Homeland Security - the 2004 Freeman Scholar Lecture," J. Fluid. Eng. T. ASME, 127(2), pp. 189-218.
[3] Walker, D. B., Walker, J. C., Cavnar, P. J., Taylor, J. L., Pickel, D. H., Hall, S. B., and Suarez, J. C., 2006, "Naturalistic Quantification of Canine Olfactory Sensitivity," Applied Animal Behaviour Science, 97(2-4), pp. 241-254.
[4] Walker, J. C., Hall, S. B., Walker, D. B., Kendal-Reed, M. S., Hood, A. F., and Niu, X. F., 2003, "Human Odor Detectability: New Methodology Used to Determine Threshold and Variation," Chem. Senses, 28(9), pp. 817-826.
[5] Pihstrom, H., Fortelius, M., Hemila, S., Forsman, R., and Reuter, T., 2005, "Scaling of Mammalian Ethmoid Bones Can Predict Olfactory Organ Size and Performance," Proceedings of the Royal Society B-Biological Sciences, 272(1566), pp. 957-962.
[6] Smith, T. D., Bhatnagar, K. P., Tuladhar, P., and Burrows, A. M., 2004, "Distribution of Olfactory Epithelium in the Primate Nasal Cavity: Are Microsmia and Macrosmia Valid Morphological Concepts?," Anatomical Record Part A-Discoveries in Molecular Cellular and Evolutionary Biology, 281A(1), pp. 1173-1181.
[7] Quignon, P., Kirkness, E., Cadieu, E., Touleimat, N., Guyon, R., Renier, C., Hitte, C., Andre, C., Fraser, C., and Galibert, F., 2003, "Comparison of the Canine and Human Olfactory Receptor Gene Repertoires," Genome Biology, 4(12)
[8] Rouquier, S., Taviaux, S., Trask, B. J., Brand-Arpon, V., van den Engh, G., Demaille, J., and Giorgi, D., 1998, "Distribution of Olfactory Receptor Genes in the Human Genome," Nature Genetics, 18(3), pp. 243-250.

143
[9] Rouquier, S. and Giorgi, D., 2007, "Olfactory Receptor Gene Repertoires in Mammals," Mutation Research-Fundamental and Molecular Mechanisms of Mutagenesis, 616(1-2), pp. 95-102.
[10] Shepherd, G. M., 2004, "The Human Sense of Smell: Are We Better Than We Think?," PLoS Biol., 2(5), pp. 572-575.
[11] Sutter, N. B., Bustamante, C. D., Chase, K., Gray, M. M., Zhao, K. Y., Zhu, L., Padhukasahasram, B., Karlins, E., Davis, S., Jones, P. G., Quignon, P., Johnson, G. S., Parker, H. G., Fretwell, N., Mosher, D. S., Lawler, D. F., Satyaraj, E., Nordborg, M., Lark, K. G., Wayne, R. K., and Ostrander, E. A., 2007, "A Single IGF1 Allele Is a Major Determinant of Small Size in Dogs," Science, 316(5821), pp. 112-115.
[12] Evans, H. E., 1993, Miller's anatomy of the dog, Saunders, Philadelphia.
[13] Negus, V. E., 1958, The Comparative Anatomy and Physiology of the Nose and Paranasal Sinuses, Livingstone, London.
[14] Reznik, G. K., 1990, "Comparative Anatomy, Physiology, and Function of the Upper Respiratory-Tract," Environmental Health Perspectives, 85, pp. 171-176.
[15] Mygind, N., Pedersen, M., and Nielsen, M. H., 1982, "Morphology of the upper airway epithelium," in The Nose: upper airway physiology and the atmospheric environment, Chap. 4, pp. 71-97.
[16] Anderson, W., Anderson, B. G., and Smith, B. J., 1994, Atlas of canine anatomy, Lea & Febiger, Philadelphia.
[17] Morrison, E. E. and Costanzo, R. M., 1992, "Morphology of Olfactory Epithelium in Humans and Other Vertebrates," Microscopy Research and Technique, 23(1), pp. 49-61.
[18] Wexler, D., Braverman, I., and Amar, M., 2006, "Histology of the Nasal Septal Swell Body (Septal Turbinate)," Otolaryngology-Head and Neck Surgery, 134(4), pp. 596-600.
144
[19] Bojsen-Møller, F. and Fahrenkrug, J., 1971, "Nasal Swell-Bodies and Cyclic Changes in the Air Passage of the Rat and Rabbit Nose," J. Anat., 110(1), pp. 25-37.
[20] Morrison, E. E. and Costanzo, R. M., 1992, "Morphology and Plasticity of the Vertebrate Olfactory Epithelium," in Science of Olfaction, Chap. 2, pp. 31-50.
[21] Firestein, S., 2001, "How the Olfactory System Makes Sense of Scents," Nature, 413(6852), pp. 211-218.
[22] Pernollet, J. C., Sanz, G., and Briand, L., 2006, "Olfactory Receptors and Odour Coding," Comptes Rendus Biologies, 329(9), pp. 679-690.
[23] Proctor, D. F., 1982, "The mucociliary system," in The Nose: Upper Airway Physiology and the Atmospheric Environment, Chap. 10, pp. 245-278.
[24] Getchell, T. V., Heck, G. L., Desimone, J. A., and Price, S., 1980, "Location of Olfactory Receptor-Sites - Inferences From Latency Measurements," Biophysical Journal, 29(3), pp. 397-411.
[25] Menco, B. P. M. and Farbman, A. I., 1992, "Ultrastructural Evidence for Multiple Mucous Domains in Frog Olfactory Epithelium," Cell and Tissue Research, 270(1), pp. 47-56.
[26] Getchell, M. L. and Getchell, T. V., 1992, "Fine-Structural Aspects of Secretion and Extrinsic Innervation in the Olfactory Mucosa," Microscopy Research and Technique, 23(2), pp. 111-127.
[27] Geiser, M., Hof, V. I., Siegenthaler, W., Grunder, R., and Gehr, P., 1997, "Ultrastructure of the Aqueous Lining Layer in Hamster Airways: Is There a Two-Phase System?," Microscopy Research and Technique, 36(5), pp. 428-437.
[28] Debat, H., Eloit, C., Blon, F., Sarazin, B., Henry, C., Huet, J. C., Trotier, D., and Pernollet, J. C., 2007, "Identification of Human Olfactory Cleft Mucus Proteins Using Proteomic Analysis," J. Proteome Res., 6(5), pp. 1985-1996.
145
[29] Briand, L., Eloit, C., Nespoulous, C., Bezirard, V., Huet, J. C., Henry, C., Blon, F., Trotier, D., and Pernollet, J. C., 2002, "Evidence of an Odorant-Binding Protein in the Human Olfactory Mucus: Location, Structural Characterization, and Odorant-Binding Properties," Biochemistry, 41(23), pp. 7241-7252.
[30] Menco, B. P. M., 1980, "Qualitative and Quantitative Freeze-Fracture Studies on Olfactory and Nasal Respiratory Structures of Frog, Ox, Rat, and Dog .1. A General Survey," Cell and Tissue Research, 207(2), pp. 183-209.
[31] Andres, K. H., 1966, "Der Feinbau Der Regio Olfactoria Von Makrosmatikern," Zeitschrift fur Zellforschung und Mikroskopische Anatomie, 69(Jan), pp. 140ff.
[32] Menco, B. P. M., 1997, "Ultrastructural Aspects of Olfactory Signaling," Chem. Senses, 22(3), pp. 295-311.
[33] Getchell, T. V., Margolis, F. L., and Getchell, M. L., 1984, "Perireceptor and Receptor Events in Vertebrate Olfaction," Progress in Neurobiology, 23(4), pp. 317-&.
[34] Getchell, T. V., Su, Z. Y., and Getchell, M. L., 1993, "Mucous Domains - Microchemical Heterogeneity in the Mucociliary Complex of the Olfactory Epithelium," Ciba Foundation Symposia, 179, pp. 27-50.
[35] Menco, B. P. M., Leunissen, J. L. M., Bannister, L. H., and Dodd, G. H., 1978, "Bovine Olfactory and Nasal Respiratory Epithelium Surfaces - High-Voltage and Scanning Electron-Microscopy, and Cryo-Ultramicrotomy," Cell and Tissue Research, 193(3), pp. 503-524.
[36] Moulton, D. G., 1967, "Olfaction in Mammals," Am. Zool., 7, pp. 421-429.
[37] Leinders-Zufall, T., Greer, C. A., Shepherd, G. M., and Zufall, F., 1998, "Imaging Odor-Induced Calcium Transients in Single Olfactory Cilia: Specificity of Activation and Role in Transduction," Journal of Neuroscience, 18(15), pp. 5630-5639.
[38] Kerjaschki, D., 1976, "Central Tubuli in Distal Segments of Olfactory Cilia Lack Dynein Arms," Experientia, 32(11), pp. 1459-1460.

146
[39] Menco, B. P. M. and Morrison, E. E., 2003, "Morphology of the Mammalian Olfactory Epithelium: Form, Fine Structure, Function, and Pathology," in Handbook of Olfaction and Gustation, edition 2, Chap. 2, pp. 32-96.
[40] Menco, B. P. M., Bruch, R. C., Dau, B., and Danho, W., 1992, "Ultrastructural-Localization of Olfactory Transduction Components - the G-Protein Subunit Golf-Alpha and Type-Iii Adenylyl Cyclase," Neuron, 8(3), pp. 441-453.
[41] Menco, B. P. M., 1994, "Ultrastructural Aspects of Olfactory Transduction and Perireceptor Events," Seminars in Cell Biology, 5(1), pp. 11-24.
[42] Leinders-Zufall, T., Rand, M. N., Shepherd, G. M., Greer, C. A., and Zufall, F., 1997, "Calcium Entry Through Cyclic Nucleotide-Gated Channels in Individual Cilia of Olfactory Receptor Cells: Spatiotemporal Dynamics," Journal of Neuroscience, 17(11), pp. 4136-4148.
[43] Schreider, J. P. and Raabe, O. G., 1981, "Anatomy of the Nasal-Pharyngeal Airway of Experimental Animals," Anat. Rec., 200, pp. 195-205.
[44] Burk, R. L., 1992, "Computed Tomographic Anatomy of the Canine Nasal Passages," Veterinary Radiology & Ultrasound, 33(3), pp. 170-176.
[45] De Rycke, L. M., Saunders, J. H., Gielen, I. M., van Bree, H. J., and Simoens, P. J., 2003, "Magnetic Resonance Imaging, Computed Tomography, and Cross-Sectional Views of the Anatomy of Normal Nasal Cavities and Paranasal Sinuses in Mesaticephalic Dogs," American Journal of Veterinary Research, 64(9), pp. 1093-1098.
[46] White, F. M., 2003, Fluid Mechanics, McGraw-Hill, Inc., New York.
[47] Schmidt-Nielsen, K., 1997, Animal Physiology: Adaptation and Environment, Cambridge University Press, New York.
[48] Hahn, I., Scherer, P. W., and Mozell, M. M., 1994, "A Mass Transport Model of Olfaction," J. Theor. Biol., 167(2), pp. 115-128.

147
[49] Gross, E. A., Swenberg, J. A., Fields, S., and Popp, J. A., 1982, "Comparative Morphometry of the Nasal Cavity in Rats and Mice," J. Anat., 135(AUG), pp. 83-88.
[50] Patra, A. L., Menache, M. G., Shaka, N. B., and Gooya, A., 1987, "A Morphometric Study of Nasal-Pharyngeal Growth for Particle Deposition in the Rat," American Industrial Hygiene Association Journal, 48(6), pp. 556-562.
[51] Kimbell, J. S., Godo, M. N., Gross, E. A., Joyner, D. R., Richardson, R. B., and Morgan, K. T., 1997, "Computer Simulation of Inspiratory Airflow in All Regions of the F344 Rat Nasal Passages," Toxicol. Appl. Pharmacol., 145(2), pp. 388-398.
[52] Schreider, J. P., 1983, "Nasal airway anatomy and inhalation deposition in experimental animals and people," in Nasal tumors in animals and man, pp. 1-36.
[53] Yeh, H. C., Brinker, R. M., Harkema, J. R., and Muggenburg, B. A., 1997, "A Comparative Analysis of Primate Nasal Airways Using Magnetic Resonance Imaging and Nasal Casts," Journal of Aerosol Medicine-Deposition Clearance and Effects in the Lung, 10(4), pp. 319-329.
[54] Kepler, G. M., Richardson, R. B., Morgan, K. T., and Kimbell, J. S., 1998, "Computer Simulation of Inspiratory Nasal Airflow and Inhaled Gas Uptake in a Rhesus Monkey," Toxicol. Appl. Pharmacol., 150(1), pp. 1-11.
[55] Harris, A. J., Squires, S. M., Hockings, P. D., Campbell, S. P., Greenhill, R. W., Mould, A., and Reid, D. G., 2003, "Determination of Surface Areas, Volumes, and Lengths of Cynomolgus Monkey Nasal Cavities by Ex Vivo Magnetic Resonance Imaging," Journal of Aerosol Medicine-Deposition Clearance and Effects in the Lung, 16(2), pp. 99-105.
[56] Menache, M. G., Hanna, L. M., Gross, E. A., Lou, S. R., Zinreich, S. J., Leopold, D. A., Jarabek, A. M., and Miller, F. J., 1997, "Upper Respiratory Tract Surface Areas and Volumes of Laboratory Animals and Humans: Considerations for Dosimetry Models," Journal of Toxicology and Environmental Health, 50(5), pp. 475-506.

148
[57] Subramaniam, R. P., Richardson, R. B., Morgan, K. T., Kimbell, J. S., and Guilmette, R. A., 1998, "Computational Fluid Dynamics Simulations of Inspiratory Airflow in the Human Nose and Nasopharynx," Inhal. Toxicol., 10(5), pp. 473-502.
[58] Uhl, J. F., Park, J. S., Chung, M. S., and Delmas, V., 2006, "Three-Dimensional Reconstruction of Urogenital Tract From Visible Korean Human," Anatomical Record Part A, 288A(8), pp. 893-899.
[59] Richmond, B. G., Wright, B. W., Grosse, I., Dechow, P. C., Ross, C. F., Spencer, M. A., and Strait, D. S., 2005, "Finite Element Analysis in Functional Morphology," Anatomical Record Part A, 283A(2), pp. 259-274.
[60] Ryan, T. M. and van Rietbergen, B., 2006, "Mechanical Significance of Femoral Head Trabecular Bone Structure in Loris and Galago Evaluated Using Micromechanical Finite Element Models," Am. J. Phys. Anthropol., 126, pp. 82-96.
[61] Lindemann, J., Keck, T., Wiesmiller, K., Sander, L., Brambs, H. J., Rettinger, G., and Pless, D., 2004, "A Numerical Simulation of Intranasal Air Temperature During Inspiration," Laryngoscope, 114(6), pp. 1037-1041.
[62] Keyhani, K., Scherer, P. W., and Mozell, M. M., 1995, "Numerical Simulation of Airflow in the Human Nasal Cavity," Journal of Biomechanical Engineering-Transactions of the Asme, 117(4), pp. 429-441.
[63] Keyhani, K., Scherer, P. W., and Mozell, M. M., 1997, "A Numerical Model of Nasal Odorant Transport for the Analysis of Human Olfaction," J. Theor. Biol., 186(3), pp. 279-301.
[64] Kimbell, J. S., Gross, E. A., Joyner, D. R., Godo, M. N., and Morgan, K. T., 1993, "Application of Computational Fluid Dynamics to Regional Dosimetery of Inhaled Chemicals in the Upper Respiratory Tract of the Rat," Toxicol. Appl. Pharmacol., 121(2), pp. 253-263.

149
[65] Kimbell, J. S., Subramaniam, R. P., Gross, E. A., Schlosser, P. M., and Morgan, K. T., 2001, "Dosimetry Modeling of Inhaled Formaldehyde: Comparisons of Local Flux Predictions in the Rat, Monkey, and Human Nasal Passages," Toxicological Sciences, 64(1), pp. 100-110.
[66] Timchalk, C., Trease, H. E., Trease, L. L., Minard, K. R., and Corley, R. A., 2001, "Potential Technology for Studying Dosimetry and Response to Airborne Chemical and Biological Pollutants," Toxicology and Industrial Health, 17(5-10), pp. 270-276.
[67] Minard, K. R., Einstein, D. R., Jacob, R. E., Kabilan, S., Kuprat, A. P., Timchalk, C. A., Trease, L. L., and Corley, R. A., 2006, "Application of Magnetic Resonance (MR) Imaging for the Development and Validation of Computational Fluid Dynamic (CFD) Models of the Rat Respiratory System," Inhal. Toxicol., 18(10), pp. 787-794.
[68] Hopkins, L. M., Kelly, J. T., Wexler, A. S., and Prasad, A. K., 2000, "Particle Image Velocimetry Measurements in Complex Geometries," Experiments in Fluids, 29(1), pp. 91-95.
[69] Stitzel, S. E., Stein, D. R., and Walt, D. R., 2003, "Enhancing Vapor Sensor Discrimination by Mimicking a Canine Nasal Cavity Flow Environment," Journal of the American Chemical Society, 125(13), pp. 3684-3685.
[70] Paulsen, E., 1882, "Experimentelle Untersuchungen Über Die Strömungen Der Luft in Der Nasenhöhle," Sitzungsberichte der kaiserliche Academie der Wissenschaften, III Abteilung, 85, pp. 348.
[71] Proetz, A. W., 1951, "Air Currents in the Upper Respiratory Tract and Their Clinical Importance," Annals of Otology Rhinology and Laryngology, 60(2), pp. 439-467.
[72] Proetz, A. W., 1953, Applied Physiology of the Nose, Annals Publishing Co., St. Louis.
[73] Swift, D. L. and Proctor, D. F., 1977, "Access of Air to the Respiratory Tract," in Respiratory Defense Mechanisms, Chap. 3,

150
[74] Hornung, D. E., Leopold, D. A., Youngentob, S. L., Sheehe, P. R., Gagne, G. M., Thomas, F. D., and Mozell, M. M., 1987, "Airflow Patterns in a Human Nasal Model," Arch. Otolaryngol. Head Neck Surg., 113(2), pp. 169-172.
[75] Simmen, D., Scherrer, J. L., Moe, K., and Heinz, B., 1999, "A Dynamic and Direct Visualization Model for the Study of Nasal Airflow," Arch. Otolaryngol. Head Neck Surg., 125(9), pp. 1015-1021.
[76] Patra, A. L., Gooya, A., and Morgan, K. T., 1986, "Air-Flow Characteristics in A Baboon Nasal Passage Cast," J. Appl. Physiol., 61(5), pp. 1959-1966.
[77] Morgan, K. T. and Monticello, T. M., 1990, "Air-Flow, Gas Deposition, and Lesion Distribution in the Nasal Passages," Environmental Health Perspectives, 85, pp. 209-218.
[78] Morgan, K. T., Kimbell, J. S., Monticello, T. M., Patra, A. L., and Fleishman, A., 1991, "Studies of Inspiratory Air-Flow Patterns in the Nasal Passages of the F344 Rat and Rhesus-Monkey Using Nasal Molds - Relevance to Formaldehyde Toxicity," Toxicol. Appl. Pharmacol., 110(2), pp. 223-240.
[79] Dawes, J. D. K., 1952, "The Course of the Nasal Airstreams," J. Laryngol. Otol., 66(12), pp. 583-593.
[80] Becker, R. F. and King, J. E., 1957, "Delineation of the Nasal Air Streams in the Living Dog," AMA Arch. Otolaryngol., 65(5), pp. 428-436.
[81] Hahn, I., Scherer, P. W., and Mozell, M. M., 1993, "Velocity Profiles Measured for Airflow Through a Large-Scale Model of the Human Nasal Cavity," J. Appl. Physiol., 75(5), pp. 2273-2287.
[82] Kelly, J. T., Prasad, A. K., and Wexler, A. S., 2000, "Detailed Flow Patterns in the Nasal Cavity," J. Appl. Physiol., 89(1), pp. 323-337.
[83] Elkins, C. J., Markl, M., Pelc, N., and Eaton, J. K., 2003, "4D Magnetic Resonance Velocimetry for Mean Velocity Measurements in Complex Turbulent Flows," Experiments in Fluids, 34(4), pp. 494-503.
151
[84] Taylor, C. A. and Draney, M. T., 2004, "Experimental and Computational Methods in Cardiovascular Fluid Mechanics," Annu. Rev. Fluid Mech., 36, pp. 197-231.
[85] Marshall, I., Zhao, S. Z., Papathanasopoulou, P., Hoskins, P., and Xu, X. Y., 2004, "MRI and CFD Studies of Pulsatile Flow in Healthy and Stenosed Carotid Bifurcation Models," Journal of Biomechanics, 37(5), pp. 679-687.
[86] Elkins, C. J. and Alley, M. T., 2007, "Magnetic Resonance Velocimetry: Applications of Magnetic Resonance Imaging in the Measurement of Fluid Motion," Experiments in Fluids, 43(6), pp. 823-858.
[87] Vennemann, P., Lindken, R., and Westerweel, J., 2007, "In Vivo Whole-Field Blood Velocity Measurement Techniques," Experiments in Fluids, 42(4), pp. 495-511.
[88] Bonn, D., Rodts, S., Groenink, M., Rafai, S., Shahidzadeh-Bonn, N., and Coussot, P., 2008, "Some Applications of Magnetic Resonance Imaging in Fluid Mechanics: Complex Flows and Complex Fluids," Annu. Rev. Fluid Mech., 40, pp. 209-233.
[89] Pless, D., Keck, T., Wiesmiller, K., Rettinger, G., Aschoff, A. J., Fleiter, T. R., and Lindemann, J., 2004, "Numerical Simulation of Air Temperature and Airflow Patterns in the Human Nose During Expiration," Clinical Otolaryngology, 29(6), pp. 642-647.
[90] Lindemann, J., Keck, T., Wiesmiller, K., Sander, B., Brambs, H. J., Rettinger, G., and Pless, D., 2006, "Nasal Air Temperature and Airflow During Respiration in Numerical Simulation Based on Multislice Computed Tomography Scan," American Journal of Rhinology, 20(2), pp. 219-223.
[91] Zhao, K., Scherer, P. W., Hajiloo, S. A., and Dalton, P., 2004, "Effect of Anatomy on Human Nasal Air Flow and Odorant Transport Patterns: Implications for Olfaction," Chem. Senses, 29(5), pp. 365-379.
[92] Zhao, K., Dalton, P., Yang, G. C., and Scherer, P. W., 2006, "Numerical Modeling of Turbulent and Laminar Airflow and Odorant Transport During Sniffing in the Human and Rat Nose," Chem. Senses, 31(2), pp. 107-118.

152
[93] Yang, G. C., Scherer, P. W., Zhao, K., and Mozell, M. M., 2007, "Numerical Modeling of Odorant Uptake in the Rat Nasal Cavity," Chem. Senses, 32(3), pp. 273-284.
[94] Yang, G. C., Scherer, P. W., and Mozell, M. M., 2007, "Modeling Inspiratory and Expiratory Steady-State Velocity Fields in the Sprague-Dawley Rat Nasal Cavity," Chem. Senses, 32(3), pp. 215-223.
[95] Roache, P. J., 1998, Verification and Validation in Computational Science and Engineering, Hermosa Publishers, Albuquerque, New Mexico.
[96] Kurtz, D. B., Zhao, K., Hornung, D. E., and Scherer, P., 2004, "Experimental and Numerical Determination of Odorant Solubility in Nasal and Olfactory Mucosa," Chem. Senses, 29(9), pp. 763-773.
[97] Porter, J., Craven, B., Khan, R. M., Chang, S. J., Kang, I., Judkewicz, B., Volpe, J., Settles, G., and Sobel, N., 2007, "Mechanisms of Scent-Tracking in Humans," Nature Neuroscience, 10(1), pp. 27-29.
[98] Youngentob, S. L., Mozell, M. M., Sheehe, P. R., and Hornung, D. E., 1987, "A Quantitative-Analysis of Sniffing Strategies in Rats Performing Odor Detection Tasks," Physiology & Behavior, 41(1), pp. 59-69.
[99] Uchida, N. and Mainen, Z. F., 2003, "Speed and Accuracy of Olfactory Discrimination in the Rat," Nature Neuroscience, 6(11), pp. 1224-1229.
[100] Kepecs, A., Uchida, N., and Mainen, Z. F., 2007, "Rapid and Precise Control of Sniffing During Olfactory Discrimination in Rats," Journal of Neurophysiology, 98(1), pp. 205-213.
[101] Glebovskii, V. D. and Marevskaya, A. P., 1968, "Participation of Muscles of the Nostrils in Olfactory Analysis and Respiration in Rabbits," Fiziol. Zh. SSSR, 54(11), pp. 1278-1286.
[102] Mozell, M. M., 1964, "Evidence for Sorption As Mechanism of Olfactory Analysis of Vapours," Nature, 203(495), pp. 1181-&.

153
[103] Mozell, M. M., 1970, "Evidence for A Chromatographic Model of Olfaction," Journal of General Physiology, 56(1), pp. 46-&.
[104] Mozell, M. M. and Jagodowi, M., 1973, "Chromatographic Separation of Odorants by Nose - Retention Times Measured Across In-Vivo Olfactory Mucosa," Science, 181(4106), pp. 1247-1249.
[105] Mozell, M. M., Sheehe, P. R., Hornung, D. E., Kent, P. F., Youngentob, S. L., and Murphy, S. J., 1987, "Imposed and Inherent Mucosal Activity Patterns - Their Composite Representation of Olfactory Stimuli," Journal of General Physiology, 90(5), pp. 625-650.
[106] Kent, P. F., Mozell, M. M., Murphy, S. J., and Hornung, D. E., 1996, "The Interaction of Imposed and Inherent Olfactory Mucosal Activity Patterns and Their Composite Representation in a Mammalian Species Using Voltage-Sensitive Dyes," Journal of Neuroscience, 16(1), pp. 345-353.
[107] Schoenfeld, T. A. and Cleland, T. A., 2005, "The Anatomical Logic of Smell," Trends in Neurosciences, 28(11), pp. 620-627.
[108] Jonmarker, S., Valdman, A., Lindberg, A., Hellstrom, M., and Egevad, L., 2006, "Tissue Shrinkage After Fixation With Formalin Injection of Prostatectomy Specimens," Virchows Archiv, 449(3), pp. 297-301.
[109] Gonzalez, R. C. and Woods, R. E., 2002, Digital Image Processing, Prentice-Hall, Inc., Upper Saddle River, New Jersey.
[110] Lorensen, W. E. and Cline, H. E., 1987, "Marching Cubes: A High Resolution 3D Surface Construction Algorithm," Computer Graphics, 21(4), pp. 163-169.
[111] Mercury Computer Systems, I., 2006, "Amira 4.1 Reference Guide,".
[112] Chapra, S. C. and Canale, R. P., 2002, Numerical Methods for Engineers, McGraw-Hill, Inc., New York.

154
[113] Mandelbrot, B. B., 1977, Fractals: Form, Chance, and Dimension, W. H. Freeman and Company, San Francisco.
[114] Lovejoy, S., 1982, "Area-Perimeter Relation for Rain and Cloud Areas," Science, 216(4542), pp. 185-187.
[115] Loudon, C. and Tordesillas, A., 1998, "The Use of the Dimensionless Womersley Number to Characterize the Unsteady Nature of Internal Flow," J. Theor. Biol., 191(1), pp. 63-78.
[116] Dodd, G. H. and Squirrel, D. J., 1980, "Structure and Mechanism in the Mammalian Olfactory System," Symposia of the Zoological Society of London, 45, pp. 35-36.
[117] Thorne, C., 1995, "Feeding behavior of domestic dogs and the role of experience," in The Domestic Dog: Its Evolution, Behavior, and Interactions with People, Chap. 7, pp. 103-114.
[118] Webber, R. L., Jeffcoat, M. K., Harman, J. T., and Ruttimann, U. E., 1987, "MR Demonstration of the Nasal Cycle in the Beagle Dog," Journal of Computer Assisted Tomography, 11(5), pp. 869-871.
[119] Guilmette, R. A., Wicks, J. D., and Wolff, R. K., 1989, "Morphometry of Human Nasal Airways in Vivo Using Magnetic Resonance Imaging," J. Aerosol Med., 2, pp. 365-377.
[120] Mery, S., Gross, E. A., Joyner, D. R., Godo, M., and Morgan, K. T., 1994, "Nasal Diagrams - A Tool for Recording the Distribution of Nasal Lesions in Rats and Mice," Toxicologic Pathology, 22(4), pp. 353-372.
[121] Settles, G. S., Kester, D. A., and Dodson-Dreibelbis, L. J., 2003, "The external aerodynamics of canine olfaction," in Sensors and Sensing in Biology and Engineering, pp. 323-355.
[122] Incropera, F. P. and DeWitt, D. P., 2002, Fundamentals of Heat and Mass Transfer, John Wiley and Sons, Inc., New York.

155
[123] Buck, L. B., 2004, "Olfactory Receptors and Odor Coding in Mammals," Nutrition Reviews, 62(11), pp. S184-S188.
[124] Peacock, J., Jones, T., Tock, C., and Lutz, R., 1998, "The Onset of Turbulence in Physiological Pulsatile Flow in a Straight Tube," Experiments in Fluids, 24(1), pp. 1-9.
[125] Peacock, J., Jones, T., Tock, C., and Lutz, R., 1997, "An in Vitro Study on the Effect of Branch Points on the Stability of Coronary Artery Flow," Medical Engineering and Physics, 19(2), pp. 101-108.
[126] Granito, S., 1971, "Calculated Retention of Aerosol Particles in the Rat Lung," M.S. thesis, University of Chicago.
[127] Schreider, J. P., 1977, "Lung Anatomy and Characteristics of Aerosol Retention of the Guinea Pig," Ph.D. thesis, University of Chicago.
[128] Schreider, J. P. and Hutchens, J. O., 1980, "Morphology of the Guinea-Pig Respiratory-Tract," Anat. Rec., 196(3), pp. 313-321.
[129] Marshall, D. A. and Moulton, D. G., 1977, "Quantification of Nasal Air Flow Patterns in Dogs Performing an Odor Detection Task," Olfaction and Taste VI,LeMagnen, J. and MacLeod, P., ed.,pp. 197.
[130] Thesen, A., Steen, J. B., and Doving, K. B., 1993, "Behaviour of Dogs During Olfactory Tracking," J. Exp. Biol., 180, pp. 247-251.
[131] Stahl, W. R., 1967, "Scaling of Respiratory Variables in Mammals," J. Appl. Physiol., 22(3), pp. 453-&.
[132] Schmidt-Nielsen, K., 1984, Scaling: Why is Animal Size so Important?, Cambridge University Press, New York.
[133] Mainland, J. and Sobel, N., 2006, "The Sniff Is Part of the Olfactory Percept," Chem. Senses, 31(2), pp. 181-196.
156
[134] Craven, B. A., Neuberger, T., Paterson, E. G., Webb, A. G., Josephson, E. M., Morrison, E. E., and Settles, G. S., 2007, "Reconstruction and Morphometric Analysis of the Nasal Airway of the Dog (Canis Familiaris) and Implications Regarding Olfactory Airflow," The Anatomical Record, 290(11), pp. 1325-1340.
[135] Telionis, D. P., 1981, Unsteady Viscous Flows, Springer-Verlag, Inc., New York.
[136] Cimbala, J. M. and Cengel, Y. A., 2008, Essentials of Fluid Mechanics: Fundamentals and Applications, McGraw-Hill, Inc., New York.
[137] Tennekes, H. and Lumley, J. L., 1972, A First Course in Turbulence, MIT Press, Cambridge, MA.
[138] Mathieu, J. and Scott, J., 2000, An Introduction to Turbulent Flow, Cambridge University Press, New York.
[139] Pope, S. B., 2000, Turbulent Flows, Cambridge University Press, New York.
[140] Ishihara, T., Kaneda, Y., Yokokawa, M., Itakura, K., and Uno, A., 2007, "Small-Scale Statistics in High-Resolution Direct Numerical Simulation of Turbulence: Reynolds Number Dependence of One-Point Velocity Gradient Statistics," Journal of Fluid Mechanics, 592, pp. 335-366.
[141] Kaneda, Y. and Ishihara, T., 2006, "High-Resolution Direct Numerical Simulation of Turbulence," Journal of Turbulence, 7(20), pp. 1-17.
[142] Sharc Ltd., 2007, "Harpoon 2.5 User Guide,".
[143] Shakib, F., 1989, "Finite Element Analysis of the Compressible Euler and Navier-Stokes Equations," Ph.D. thesis, Stanford University.
[144] Hughes, T. J. R., Franca, L. P., and Hulbert, G. M., 1989, "A New Finite-Element Formulation for Computational Fluid-Dynamics .8. the Galerkin Least-Squares Method for Advective-Diffusive Equations," Computer Methods in Applied Mechanics and Engineering, 73(2), pp. 173-189.

157
[145] ACUSIM Software, I., 2007, "AcuSolve 1.7 Reference Manual,".
[146] Lyons, D.C., Peltier, L.J., Zajaczkowski, F.J., and Paterson, E.G., "Assessment of DES Models for Separated Flow From a Hump in a Turbulent Boundary Layer," to be published in ASME J. Fluids Eng.
[147] Roache, P. J., 1994, "Perspective - A Method for Uniform Reporting of Grid Refinement Studies," ASME J. Fluids Eng., 116(3), pp. 405-413.
[148] Kuramoto, K., Nishida, T., and Mochizuki, K., 1985, "Morphological-Study on the Nasal Turbinates (Conchae) of the Pika (Ochotona-Rufescens-Rufescens) and the Valcano Rabbit (Romerolagus-Diazi)," Zentralblatt fur Veterinarmedizin Reihe C-Journal of Veterinary Medicine Series C-Anatomia Histologia Embryologia, 14(4), pp. 332-341.
[149] Gray, H., 1995, Anatomy: Descriptive and Surgical, Barnes and Noble, Inc., New York.
[150] Rajan, R., Clement, J. P., and Bhalla, U. S., 2006, "Rats Smell in Stereo," Science, 311(5761), pp. 666-670.
[151] Wilson, D. A. and Sullivan, R. M., 1999, "Respiratory Airflow Pattern at the Rat's Snout and an Hypothesis Regarding Its Role in Olfaction," Physiology & Behavior, 66(1), pp. 41-44.
[152] Wilson, D. A., 1997, "Binaral Interactions in the Rat Piriform Cortex," Journal of Neurophysiology, 78(1), pp. 160-169.
[153] Schoenfeld, T. A. and Cleland, T. A., 2006, "Anatomical Contributions to Odorant Sampling and Representation in Rodents: Zoning in on Sniffing Behavior," Chem. Senses, 31(2), pp. 131-144.
[154] Van Valkenburgh, B., Theodor, J., Friscia, A., Pollack, A., and Rowe, T., 2004, "Respiratory Turbinates of Canids and Felids: a Quantitative Comparison," Journal of Zoology, 264, pp. 281-293.
158
[155] Pelosi, P., 1996, "Perireceptor Events in Olfaction," Journal of Neurobiology, 30(1), pp. 3-19.
[156] Steinbrecht, R. A., 1998, Odorant-binding proteins: Expression and function, pp. 323-332.
[157] Bhandawat, V., Reisert, J., and Yau, K. W., 2005, "Elementary Response of Olfactory Receptor Neurons to Odorants," Science, 308(5730), pp. 1931-1934.
[158] Lauffenburger, D. A. and Linderman, J. J., 1993, Receptors: Models for Binding, Trafficking, and Signaling, Oxford University Press, New York.
[159] Truskey, G. A., Yuan, F., and Katz, D. F., 2004, Transport Phenomena in Biological Systems, Pearson Education, Inc., Upper Saddle River, New Jersey.
[160] Schild, D. and Restrepo, D., 1998, "Transduction Mechanisms in Vertebrate Olfactory Receptor Cells," Physiological Reviews, 78(2), pp. 429-466.
[161] Dougherty, D. P., Wright, G. A., and Yew, A. C., 2005, "Computational Model of the CAMP-Mediated Sensory Response and Calcium-Dependent Adaptation in Vertebrate Olfactory Receptor Neurons," Proceedings of the National Academy of Sciences of the United States of America, 102(30), pp. 10415-10420.
[162] de Souza, F. M. S. and Antunes, G., 2007, "Biophysics of Olfaction," Reports on Progress in Physics, 70(3), pp. 451-491.
[163] Kundu, P. K. and Cohen, I. M., 2002, Fluid Mechanics, Academic Press, New York.
[164] Davidovits, P., Jayne, J. T., Duan, S. X., Worsnop, D. R., Zahniser, M. S., and Kolb, C. E., 1991, "Uptake of Gas Molecules by Liquids - A Model," Journal of Physical Chemistry, 95(16), pp. 6337-6340.
[165] Davidovits, P., Hu, J. H., Worsnop, D. R., Zahniser, M. S., and Kolb, C. E., 1995, "Entry of Gas Molecules into Liquids," Faraday Discussions, pp. 65-81.

159
[166] Davidovits, P., Kolb, C. E., Williams, L. R., Jayne, J. T., and Worsnop, D. R., 2006, "Mass Accommodation and Chemical Reactions at Gas-Liquid Interfaces," Chemical Reviews, 106(4), pp. 1323-1354.
[167] Lancet, D., 1986, "Vertebrate Olfactory Reception," Annu. Rev. Neurosci., 9, pp. 329-355.
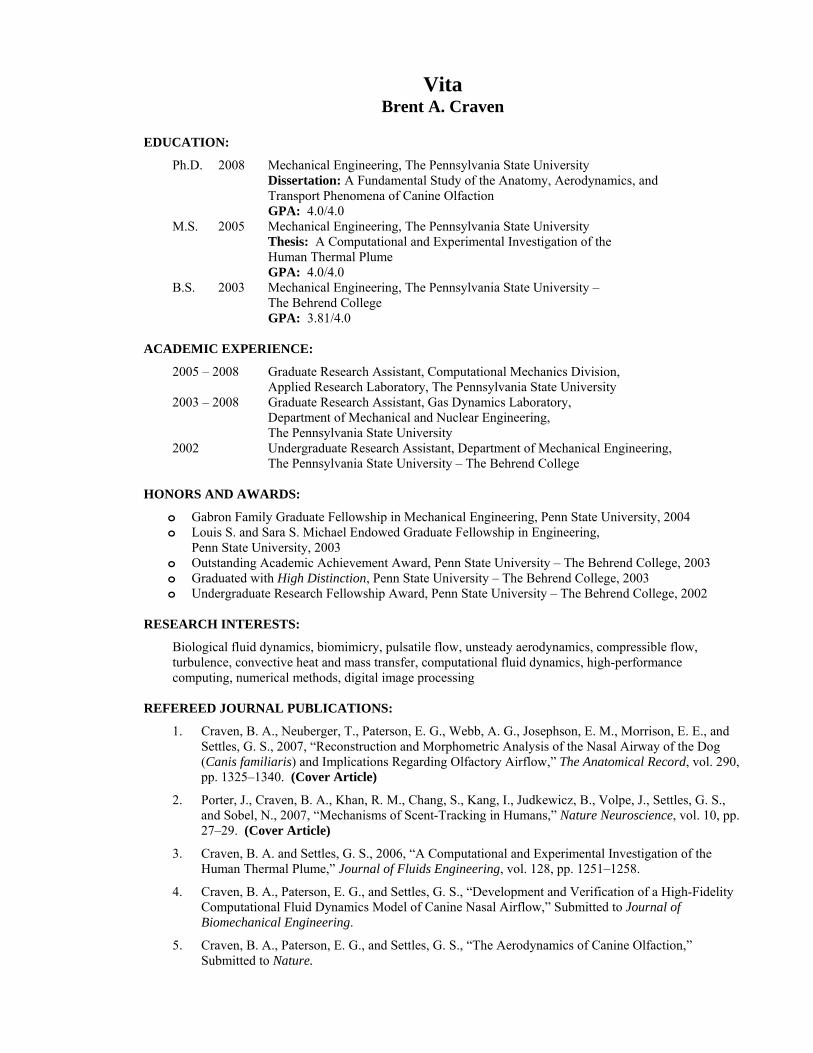
Vita Brent A. Craven
EDUCATION:
Ph.D. 2008 Mechanical Engineering, The Pennsylvania State University Dissertation: A Fundamental Study of the Anatomy, Aerodynamics, and Transport Phenomena of Canine Olfaction
GPA: 4.0/4.0 M.S. 2005 Mechanical Engineering, The Pennsylvania State University Thesis: A Computational and Experimental Investigation of the Human Thermal Plume GPA: 4.0/4.0 B.S. 2003 Mechanical Engineering, The Pennsylvania State University –
The Behrend College GPA: 3.81/4.0
A
CADEMIC EXPERIENCE:
2005 – 2008 Graduate Research Assistant, Computational Mechanics Division, Applied Research Laboratory, The Pennsylvania State University
2003 – 2008 Graduate Research Assistant, Gas Dynamics Laboratory, Department of Mechanical and Nuclear Engineering, The Pennsylvania State University
2002 Undergraduate Research Assistant, Department of Mechanical Engineering, The Pennsylvania State University – The Behrend College
H
ONORS AND AWARDS:
o Gabron Family Graduate Fellowship in Mechanical Engineering, Penn State University, 2004 o Louis S. and Sara S. Michael Endowed Graduate Fellowship in Engineering,
Penn State University, 2003 o Outstanding Academic Achievement Award, Penn State University – The Behrend College, 2003 o Graduated with High Distinction, Penn State University – The Behrend College, 2003 o Undergraduate Research Fellowship Award, Penn State University – The Behrend College, 2002
R
ESEARCH INTERESTS:
Biological fluid dynamics, biomimicry, pulsatile flow, unsteady aerodynamics, compressible flow, turbulence, convective heat and mass transfer, computational fluid dynamics, high-performance computing, numerical methods, digital image processing
R
EFEREED JOURNAL PUBLICATIONS:
1. Craven, B. A., Neuberger, T., Paterson, E. G., Webb, A. G., Josephson, E. M., Morrison, E. E., and Settles, G. S., 2007, “Reconstruction and Morphometric Analysis of the Nasal Airway of the Dog (Canis familiaris) and Implications Regarding Olfactory Airflow,” The Anatomical Record, vol. 290, pp. 1325–1340. (Cover Article)
2. Porter, J., Craven, B. A., Khan, R. M., Chang, S., Kang, I., Judkewicz, B., Volpe, J., Settles, G. S.,
and Sobel, N., 2007, “Mechanisms of Scent-Tracking in Humans,” Nature Neuroscience, vol. 10, pp. 27–29. (Cover Article)
3. Craven, B. A. and Settles, G. S., 2006, “A Computational and Experimental Investigation of the
Human Thermal Plume,” Journal of Fluids Engineering, vol. 128, pp. 1251–1258.
4. Craven, B. A., Paterson, E. G., and Settles, G. S., “Development and Verification of a High-Fidelity Computational Fluid Dynamics Model of Canine Nasal Airflow,” Submitted to Journal of Biomechanical Engineering.
5. Craven, B. A., Paterson, E. G., and Settles, G. S., “The Aerodynamics of Canine Olfaction,”
Submitted to Nature.
Related Documents