This paper should be cited as: Quim, J. R. 2013. A freshwater aquaculture demonstrations and training cetre in Chokwe, Mozambique: A buisness plan. United Nations University Fisheries Training Programme, Iceland [final project]. http://www.unuftp.is/static/fellows/document/quim12prf.pdf unuftp.is Final Project 2012 A FRESHWATER AQUACULTURE DEMONSTRATIONS AND TRAINING CENTRE IN CHOKWE, MOZAMBIQUE: A BUSINESS PLAN Juvêncio Rosário Quim National Institute for Aquaculture Development (INAQUA) Consiglieri Pedroso Road N o 347 - Maputo, Mozambique [email protected] Supervisors: Mr. Helgi Gestsson University of Akureyri [email protected] Dr. Ogmundur Knútsson (Professor, University of Akureyri) [email protected] ABSTRACT The aim of this study was to write a business plan for the operations for a Freshwater Aqua- culture Demonstration and Training Centre that will be built in the Chokwe district in Mozambique. This will provide managers of the centre, donor organisations and possible investors with a tool to determine the profitability of the investment, its operational feasibility and to monitor the centre’s performance. The study anticipates the operational needs of the centre, the basic operating requirements, its marketing possibilities and the possibility of fur- ther cooperation with donor organizations. Only the feasibility of the aquaculture operations is considered in the study but neither the training courses nor the research lab operations. The data used was based on values and estimates from Mozambique or deduced from information from similar operations in other countries. In order to achieve the study objectives a profita- bility model was built to analyse the data. Two scenarios were considered, model A where the profitability of the operations was assessed over 10 years of operations, and model B, where the operations were assessed over the same period but a three year donor financed sub- sidy of fingerlings was assumed. The result obtained from the profitability assessment of the business models shows thatit is possible to make the operations of the centre economically sustainable, reduce inadequate return on the investment and can help the leading institutions better assess the viability of future aquaculture projects.

Welcome message from author
This document is posted to help you gain knowledge. Please leave a comment to let me know what you think about it! Share it to your friends and learn new things together.
Transcript
This paper should be cited as: Quim, J. R. 2013. A freshwater aquaculture demonstrations and training cetre in Chokwe, Mozambique: A buisness plan. United Nations University Fisheries Training Programme, Iceland [final project]. http://www.unuftp.is/static/fellows/document/quim12prf.pdf
unuftp.is Final Project 2012
A FRESHWATER AQUACULTURE DEMONSTRATIONS
AND TRAINING CENTRE IN CHOKWE, MOZAMBIQUE:
A BUSINESS PLAN
Juvêncio Rosário Quim
National Institute for Aquaculture Development (INAQUA)
Consiglieri Pedroso Road No 347 - Maputo, Mozambique
Supervisors:
Mr. Helgi Gestsson
University of Akureyri
Dr. Ogmundur Knútsson
(Professor, University of Akureyri)
ABSTRACT
The aim of this study was to write a business plan for the operations for a Freshwater Aqua-
culture Demonstration and Training Centre that will be built in the Chokwe district in
Mozambique. This will provide managers of the centre, donor organisations and possible
investors with a tool to determine the profitability of the investment, its operational feasibility
and to monitor the centre’s performance. The study anticipates the operational needs of the
centre, the basic operating requirements, its marketing possibilities and the possibility of fur-
ther cooperation with donor organizations. Only the feasibility of the aquaculture operations
is considered in the study but neither the training courses nor the research lab operations. The
data used was based on values and estimates from Mozambique or deduced from information
from similar operations in other countries. In order to achieve the study objectives a profita-
bility model was built to analyse the data. Two scenarios were considered, model A where
the profitability of the operations was assessed over 10 years of operations, and model B,
where the operations were assessed over the same period but a three year donor financed sub-
sidy of fingerlings was assumed. The result obtained from the profitability assessment of the
business models shows thatit is possible to make the operations of the centre economically
sustainable, reduce inadequate return on the investment and can help the leading institutions
better assess the viability of future aquaculture projects.
Quim
2
UNU-Fisheries Training Programme
TABLE OF CONTENTS
LIST OF FIGURES .............................................................................................................................. 3
LIST OF TABLES ................................................................................................................................ 4
1 INTRODUCTION ......................................................................................................................... 5
2 MOZAMBICAN AQUACULTURE ............................................................................................ 8 2.1 HISTORY OF FISH FARMING IN MOZAMBIQUE .......................................................................... 8
2.2 ECONOMICS AND SUSTAINABILITY OF AQUACULTURE IN MOZAMBIQUE ................................ 9
3 METHODOLOGY ...................................................................................................................... 10
4 BUSINESS PLAN AND OPERATIONS ANALYSIS .............................................................. 12 4.1 THE BUSINESS MODELS .......................................................................................................... 12
4.2 ASSUMPTIONS AND ANALYSIS COMMON FOR BOTH BUSINESS MODELS ................................ 13
4.2.1 Customers and potential markets for fingerlings ............................................................ 13
4.2.2 Key Factors for competitive success ............................................................................... 15
4.3 PRODUCTION PLANNING MODEL ............................................................................................. 16
4.3.1 36 ponds model ............................................................................................................... 16
4.4 PROFITABILITY MODEL ASSUMPTIONS AND ANALYSIS ........................................................... 17
4.4.1 Investment cost ................................................................................................................ 17
4.4.2 Operating costs ............................................................................................................... 18
4.5 CONTRIBUTION MARGIN ......................................................................................................... 18
4.6 MODEL A ................................................................................................................................ 20
1.1.1 ACCUMULATIVE NET PRESENT VALUE (NPV) ....................................................................... 21
1.1.2 INTERNAL RATE OF RETURN ................................................................................................. 21
4.6.1 Net Current Ratio ............................................................................................................ 21
WHEN THE NET CURRENT RATIO IS HIGHER THAN LIQUIDITY CURRENT RATIO OR LIABILITIES, ITS
MEAN THERE IS A PROBLEM IN THE FIRM, WHICH IS NOT THE CASE OF THE PRESENT STUDY. .......... 22
4.6.2 Sensitivity Analysis .......................................................................................................... 22
4.7 MODEL B ................................................................................................................................ 22
4.7.1 Cash flow projection for Model B ................................................................................... 23
4.7.2 Accumulative Net Present value model B ....................................................................... 23
4.7.3 Internal Rate of Return model B ..................................................................................... 24
4.7.4 Net Current Ratio model B .............................................................................................. 24
1.1.3 SENSITIVITY ANALYSIS FOR MODEL B .................................................................................... 24
5 DISCUSSION ............................................................................................................................... 25
6 CONCLUSION ............................................................................................................................ 26
ACKNOWLEDGEMENTS ............................................................................................................... 27
LIST OF REFERENCES ................................................................................................................... 28
APPENDICES ..................................................................................................................................... 31
Quim
3
UNU-Fisheries Training Programme
LIST OF FIGURES
Figure 1: Map of Mozambique (Resource: Imagine Africa, n.d.) ............................................. 5
Figure 2: Profitability model and its components .................................................................... 11
Figure 3: Process chart of Business Models ............................................................................ 12
Figure 4: Total cash Flow & capital and Net cash flow and equity ......................................... 20
Figure 5: Accumulative Net Present value .............................................................................. 21
Figure 6: Internal rate of return ................................................................................................ 21
Figure 7: Net Current ratio ....................................................................................................... 22
Figure 8: Sensitivity Analysis .................................................................................................. 22
Figure 9: Cash flow projection for model B ............................................................................ 23
Figure 10: Accumulative Net Present value model B .............................................................. 23
Figure 11: Internal rate of return model B ............................................................................... 24
Figure 12: Net current Ratio model B...................................................................................... 24
Figure 13: Sensitivity analysis for model B ............................................................................. 24

Quim
4
UNU-Fisheries Training Programme
LIST OF TABLES
Table 1: An estimated capacity of fingerlings in Mozambican ponds..................................... 15
Table 2: Production Characteristics & main assumptions of tilapia and carp (Engle & Neira,
2005) ........................................................................................................................................ 16
Table 3: Breakdown of investment cost................................................................................... 18
Table 4: Breakdown of Operation Costs .................................................................................. 19
Table 5: Table: Production data of cultured Tilapia and Carp on density of 2 & 5 Fingerlings
.................................................................................................................................................. 20
Table 6: Contribution margin................................................................................................... 20
Quim
5
UNU-Fisheries Training Programme
1 INTRODUCTION
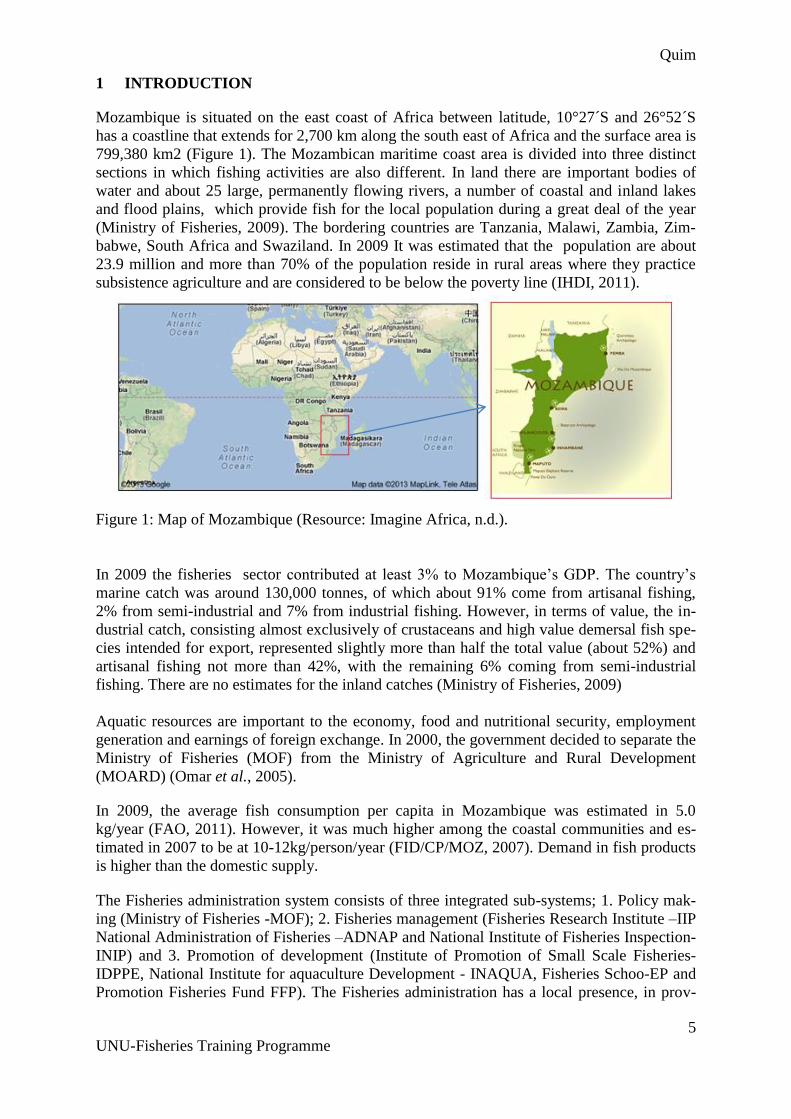
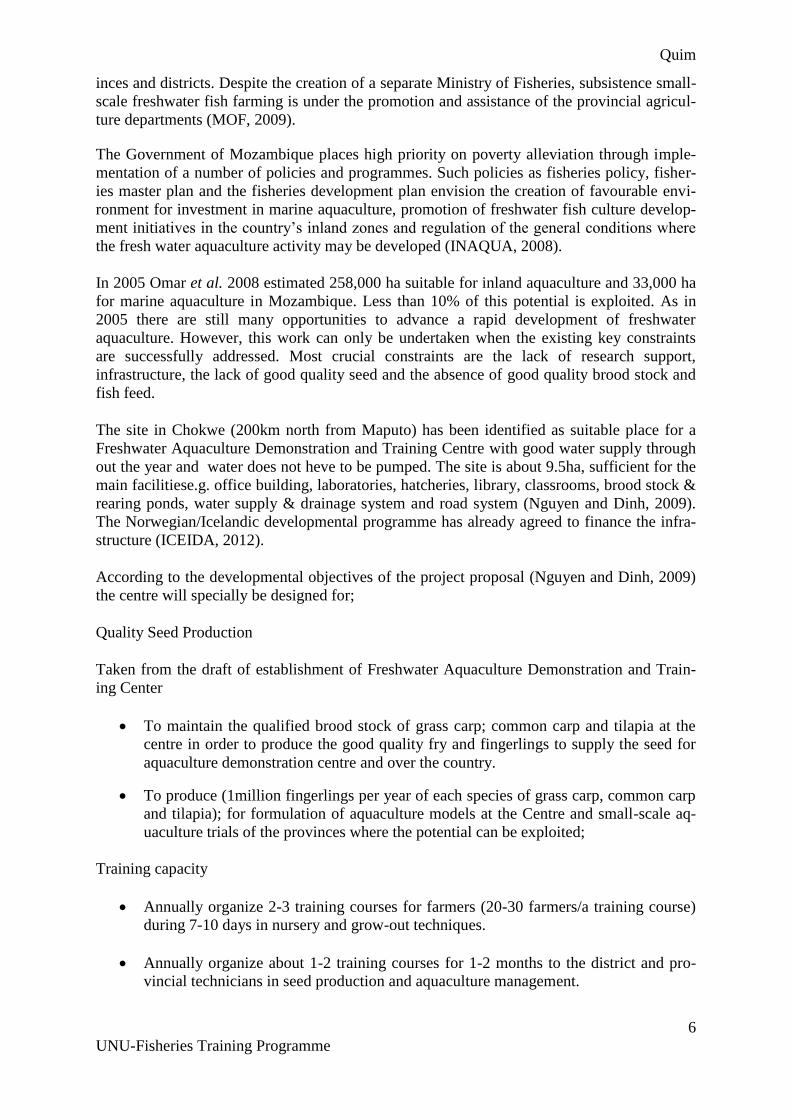
Mozambique is situated on the east coast of Africa between latitude, 10°27´S and 26°52´S
has a coastline that extends for 2,700 km along the south east of Africa and the surface area is
799,380 km2 (Figure 1). The Mozambican maritime coast area is divided into three distinct
sections in which fishing activities are also different. In land there are important bodies of
water and about 25 large, permanently flowing rivers, a number of coastal and inland lakes
and flood plains, which provide fish for the local population during a great deal of the year
(Ministry of Fisheries, 2009). The bordering countries are Tanzania, Malawi, Zambia, Zim-
babwe, South Africa and Swaziland. In 2009 It was estimated that the population are about
23.9 million and more than 70% of the population reside in rural areas where they practice
subsistence agriculture and are considered to be below the poverty line (IHDI, 2011).
Figure 1: Map of Mozambique (Resource: Imagine Africa, n.d.).
In 2009 the fisheries sector contributed at least 3% to Mozambique’s GDP. The country’s
marine catch was around 130,000 tonnes, of which about 91% come from artisanal fishing,
2% from semi-industrial and 7% from industrial fishing. However, in terms of value, the in-
dustrial catch, consisting almost exclusively of crustaceans and high value demersal fish spe-
cies intended for export, represented slightly more than half the total value (about 52%) and
artisanal fishing not more than 42%, with the remaining 6% coming from semi-industrial
fishing. There are no estimates for the inland catches (Ministry of Fisheries, 2009)
Aquatic resources are important to the economy, food and nutritional security, employment
generation and earnings of foreign exchange. In 2000, the government decided to separate the
Ministry of Fisheries (MOF) from the Ministry of Agriculture and Rural Development
(MOARD) (Omar et al., 2005).
In 2009, the average fish consumption per capita in Mozambique was estimated in 5.0
kg/year (FAO, 2011). However, it was much higher among the coastal communities and es-
timated in 2007 to be at 10-12kg/person/year (FID/CP/MOZ, 2007). Demand in fish products
is higher than the domestic supply.
The Fisheries administration system consists of three integrated sub-systems; 1. Policy mak-
ing (Ministry of Fisheries -MOF); 2. Fisheries management (Fisheries Research Institute –IIP
National Administration of Fisheries –ADNAP and National Institute of Fisheries Inspection-
INIP) and 3. Promotion of development (Institute of Promotion of Small Scale Fisheries-
IDPPE, National Institute for aquaculture Development - INAQUA, Fisheries Schoo-EP and
Promotion Fisheries Fund FFP). The Fisheries administration has a local presence, in prov-
Quim
6
UNU-Fisheries Training Programme
inces and districts. Despite the creation of a separate Ministry of Fisheries, subsistence small-
scale freshwater fish farming is under the promotion and assistance of the provincial agricul-
ture departments (MOF, 2009).
The Government of Mozambique places high priority on poverty alleviation through imple-
mentation of a number of policies and programmes. Such policies as fisheries policy, fisher-
ies master plan and the fisheries development plan envision the creation of favourable envi-
ronment for investment in marine aquaculture, promotion of freshwater fish culture develop-
ment initiatives in the country’s inland zones and regulation of the general conditions where
the fresh water aquaculture activity may be developed (INAQUA, 2008).
In 2005 Omar et al. 2008 estimated 258,000 ha suitable for inland aquaculture and 33,000 ha
for marine aquaculture in Mozambique. Less than 10% of this potential is exploited. As in
2005 there are still many opportunities to advance a rapid development of freshwater
aquaculture. However, this work can only be undertaken when the existing key constraints
are successfully addressed. Most crucial constraints are the lack of research support,
infrastructure, the lack of good quality seed and the absence of good quality brood stock and
fish feed.
The site in Chokwe (200km north from Maputo) has been identified as suitable place for a
Freshwater Aquaculture Demonstration and Training Centre with good water supply through
out the year and water does not heve to be pumped. The site is about 9.5ha, sufficient for the
main facilitiese.g. office building, laboratories, hatcheries, library, classrooms, brood stock &
rearing ponds, water supply & drainage system and road system (Nguyen and Dinh, 2009).
The Norwegian/Icelandic developmental programme has already agreed to finance the infra-
structure (ICEIDA, 2012).
According to the developmental objectives of the project proposal (Nguyen and Dinh, 2009)
the centre will specially be designed for;
Quality Seed Production
Taken from the draft of establishment of Freshwater Aquaculture Demonstration and Train-
ing Center
To maintain the qualified brood stock of grass carp; common carp and tilapia at the
centre in order to produce the good quality fry and fingerlings to supply the seed for
aquaculture demonstration centre and over the country.
To produce (1million fingerlings per year of each species of grass carp, common carp
and tilapia); for formulation of aquaculture models at the Centre and small-scale aq-
uaculture trials of the provinces where the potential can be exploited;
Training capacity
Annually organize 2-3 training courses for farmers (20-30 farmers/a training course)
during 7-10 days in nursery and grow-out techniques.
Annually organize about 1-2 training courses for 1-2 months to the district and pro-
vincial technicians in seed production and aquaculture management.
Quim
7
UNU-Fisheries Training Programme
Develop the research and training capacity to organize the vocational training pro-
grams in the near future.
Research capacity
To implement the National programs on genetic improvement for important fish spe-
cies;
To carry out the collaborative research program with other institutions in the country
and oversees countries in the aquaculture field;
To organize the international conference for technological and informative exchange
To develop the suitable aquaculture technologies applied for the country through the
pilots and farming demonstration.
Strategic development for aquaculture
To help the Government to formulate the strategic plan and policies for aquaculture
development;
To control the seed quality for seed supply network through over the country;
To provide the technical support and education in aquaculture field for country;
To formulate the collaborative training program in aquaculture science for southern
African Region.
The Centre will in that way fulfil all the needs regarding the developing requirements for
activities in aquaculture in Mozambique.
For a quality seed production a high quality brood stock of grass carp, common carp and
tilapia has to be maintained at the centre to supply the seed for both the aquaculture
demonstration centre and farmers all over the country.
A business plan will be developed for the operations of the Centre. Starting activities without
a business plan can result in mistakes, which could have been anticipated and solved at the
planning stage. A written business plan exposes thoughts, assumptions and findings, and
evaluates rationality. It gives answers to questions like: Can it really work? What resources
are needed now or in the future? Such answers can minimize the risks involved. Moreover,
without a business plan, financial resources will only be inverted by those few who have an
unquestioning faith in the project. Investors, public or private, will insist on evaluating
exactly why they should support the investment (Dan and Stewart, 1992).
The overall goal of this study is to design a business model that can help to ensure the eco-
nomically sustainable operations of the centre by producing fry and fingerlings to sell to fish
farmers in Mozambique and for growing Carp and Tilapia at the centre for marketing in the
local markets. The profits generated from the fingerling and fish production are supposed to
create sustainable operations for the centre so that it can then offer training programs and
research counselling.

Quim
8
UNU-Fisheries Training Programme
Main tasks of the study were to:
design two alternative business plans for fry, fingerling and fish farming of the
Freshwater Aquaculture Demonstration and Training Centre of Chokwe in
Mozambique;
analyse the cost and revenues of fry, fingerling and fish production at the centre
using a profitability model;
open up the possibility of further cooperation with donor organisations, regarding the
start-up of the fry and fingerling production of the Centre
The design of the business plans was guided by the above tasks in order to ensure that the
overall objectives are achieved. Assumptions regarding marketing data and operating data are
made from aquaculture studies, information given in in interviews with specialists from the
National Institute of Aquaculture and the intuition of the author. The reliability of the data
used needs to be assessed further before a final decision is taken based on the output of the
profitability model used.
2 MOZAMBICAN AQUACULTURE
The development of aquaculture can become an important contribution to household food
security and general welfare by supplying food and providing income.
2.1 History of fish farming in Mozambique
In general, aquaculture in Mozambique is still a relatively new activity even if the culture of
artisanal production of freshwater tilapia (Tilapia.spp) has existed since the 1950s. The Ma-
rine aquaculture emerged in 2003 and consisted then of commercial farm producing marine
shrimp (Penaeus. spp) and seaweed (Kappaphycus. spp) (FAO, 2006).
At the beginning of the 1960s, the governor of Mozambique built hatcheries and demonstra-
tion farms in Umbeluzi (0,5ha), Sussundenga (2ha) and Chokwe (1,6ha). In 1978-1979 the
government expressed renewed interest on freshwater aquaculture particularly as a means of
supplying fish in the rural communities, which were undersupplied in animal protein (FAO,
2006).
Until the 1990s, aquaculture was limited to inland waters, associated with agricultural activi-
ties. This situation changed in the 1990s, with the emergence of the first commercial under-
takings. The Aquaculture Program for Local Communities project (ALCOM) funded by
SIDA and executed by FAO, assisted Mozambique in developing freshwater fish farming and
extension methods and approximately 230 fish ponds were constructed (FAO, 2006).
Mozambique has both, native and exotic species with potential for aquaculture development
such as Mozambique tilapia (Oreochromis mossambicus), Nile tilapia (Oreochromis nilot-
icus), red breasted tilapia (Tilapia rendalli) and common carp (Cyprinus carpio). In addition,
other candidates for aquaculture available in the country include the African catfish (Clarias
gariepinus), grass carp (Cterophryngodon idella), silver carp (Hypophthalmichthys molitrix)
and bighead carp (Aristichthys nobilis) (MOF, 2005).
Quim
9
UNU-Fisheries Training Programme
The main cultured species is tilapia in a mixed-sex culture, which is done all over the coun-
try. It is raised in earthen ponds, ranging in size from small backyard ponds (200-400 m2) to
larger ponds (1.5 ha). Pond culture of freshwater fish is done by poorly technique in Mozam-
bique. The culture system is extensive. Seeds are either collected from the wild or from other
farmers' ponds and stocking density is 2-5 fish/m2. Fish are fed on agriculture by-products
such as rice, maize, millet and sorghum bran and cassava leaves. As a fertilizer farmers use
cow-, goat-, chicken- and other livestock manure depending on availability. The fish grow to
maximum of 150g over a period of six months. Yields are relatively low, estimated at 0.8
tonnes/ha/year. Cropping time is from six months to a year, depending on the feeding regime
(FAO, 2006).
A cage culture operation in the Manica province began commercial production in 2004 and
produced 1 tonne of Nile tilapia (150g) per month. Production was sold on site. The facilities
included raceways for both fingerling production and on- growing. Cages were constructed of
the cheapest locally available construction materials using empty oil barrels as float devices
(FAO, 2006).
In 2006 FAO (2006) observed that the seed supply for cage culture depended on the farm
production. Feed was produced on the farm from locally available ingredients. The cage farm
and other farms faced problems such as lack of inputs, fish seed, feed technology, feed for-
mulation and feeding management, and lack of capital to operate the harvest and increase
productivity. The situation is mostly the same today.
The marine aquaculture in 2005 was represented by an industry that produced on average
1,000 tonnes a year of marine prawns. It was exploiting 2,500 ha of land in a semi-intensive
system and was providing direct employment to about 2,000 workers (INAQUA, 2008).
That year the Government of Mozambique adopted an aquaculture strategy which aims was
to set up the sustainable development of aquaculture; to increase the current production levels
of marine prawns and aquatic species intended for export and local consumption and estab-
lish a legal, normative and institutional framework for appropriate and effective management
of aquaculture (INAQUA, 2008).
The freshwater aquaculture development is still under consideration by Government of
Mozambique as a top priority, for the reason of its vast potential of water resources, land and
the native species suitable for aquaculture practices (INFOSA, 2009).
In 2008, the government of Mozambique established the National Institute for Aquaculture
Development (INAQUA) by Cabinet decree No. 29 of June 2008. INAQUA is responsible
for the promotion, extension, administration, and coordination and monitoring for the
aquaculture development. It is also responsible for experimental research and provision of
incentives to promote aquaculture in Mozambique (INFOSA, 2009)
2.2 Economics and sustainability of aquaculture in Mozambique
At the global level aquaculture development has been viewed as a measure of improving food
security and as a means of supplementing income for rural families. In Africa, economic
analysis in aquaculture is a relatively recent practice and not much work has been reported on
its social and economic impacts. In Mozambique, aquaculture was just before the turn of the
century almost entirely for subsistence, with little surplus production being sold in the rural
market (Egna & Boyd, 1997) and still is.
Quim
10
UNU-Fisheries Training Programme
Economic considerations in the selection of an appropriate aquaculture production system
include its potential for economic returns, its economic efficiency and, ultimately, the
farmer’s access to operating capital (Hebicha, Gamal, & Green, 1994). There are not many
reports on the economic evaluation of aquaculture production systems in Mozambique, other
than the few case studies on Economic Analysis of Small Scale tilapia production (Salia,
2008).
It is against this background that the present study was undertaken to assess the business plan
for the operations for Freshwater aquaculture Demonstration and Training Centre of Chokwe
in Mozambique. Carp and tilapia fingerlings and fish production is used as a case study to
provide managers of the Centre and investors with a tool to use in determining the invest-
ment, feasibility and monitoring performances of both the operations and the managers.
3 METHODOLOGY
The study focuses on the development of business models and a plan for the operations of the
Freshwater Aquaculture Demonstration and Training Centre that will be built in Chokwe
district in Mozambique as a part of a Norwegian/Icelandic developmental donor Programme.
It will contain analyses of anticipated operations of the centre, include further possible
cooperation with donor organizations, describe the Centres marketing possibilities and its
basic operating requirements. Then a possible business model will be evaluated based on
financial analysis using a profitability model.
Literature was reviewed from Internet and library sources in order to gather baseline data.
Particular attention is paid to business plan data resources, hatchery operations and
economical basis for Fingerlings production and fish farming.
As benchmarking idea for the Centre´s financial structure information was gathered on the
split of earnings from sales of products and the running of the, Marine Laboratory and fish
farm in Grindavik that is a part of the Marine Research Institute.
The profitability of the two different business models will be evaluated assigning data and
running an Excel profitability assessment model designed by Professor Pall Jensen. A de-
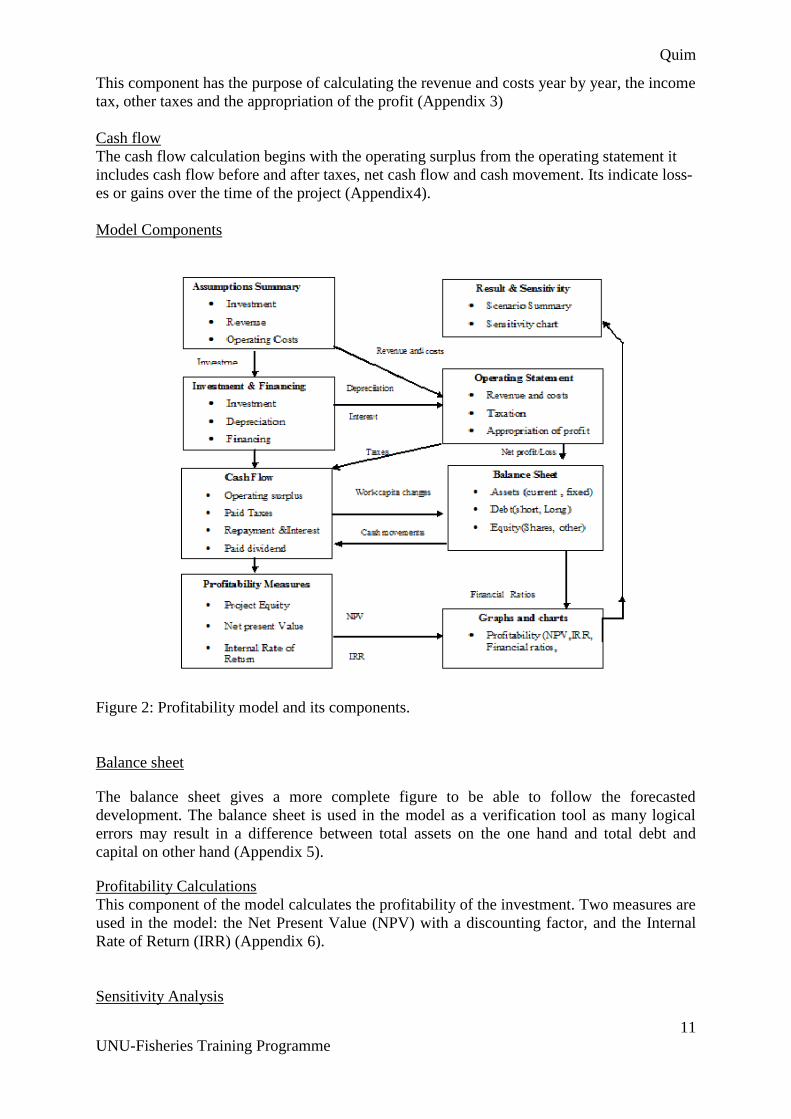
scription of the elements of the model is shown in a flow chart in Figure 2.
Below a short explanation of both the flow and each of the elements is given:
Assumptions summary
In the assumptions summary the start-up investment costs are presented along with financing
information regarding equity and loans, sales price and sales quantity, variable and fixed
costs and all the inputs (Appendix 1) Information from the summary is then used in the other
elements.
Investment and Financing
The investment cost shows in details how the costs related to the project will be covered. It
shows the book value and the depreciation of equipment (Appendix 2).
Operating Statement
Quim
11
UNU-Fisheries Training Programme
This component has the purpose of calculating the revenue and costs year by year, the income
tax, other taxes and the appropriation of the profit (Appendix 3)
Cash flow
The cash flow calculation begins with the operating surplus from the operating statement it
includes cash flow before and after taxes, net cash flow and cash movement. Its indicate loss-
es or gains over the time of the project (Appendix4).
Model Components
Figure 2: Profitability model and its components.
Balance sheet
The balance sheet gives a more complete figure to be able to follow the forecasted
development. The balance sheet is used in the model as a verification tool as many logical
errors may result in a difference between total assets on the one hand and total debt and
capital on other hand (Appendix 5).
Profitability Calculations
This component of the model calculates the profitability of the investment. Two measures are
used in the model: the Net Present Value (NPV) with a discounting factor, and the Internal
Rate of Return (IRR) (Appendix 6).
Sensitivity Analysis
Quim
12
UNU-Fisheries Training Programme
Sensitivity analysis for exploring and understanding the effects of uncertainties and can be
done in many different ways. Impact analysis deals with only one uncertain item at the time,
for example sales price, sales quantity, or cost of brood stock. Scenario analysis deal with
simultaneous changes in more than one uncertain item used.
The flow chart describes that by using the assumptions for investment, revenues and both
variable and fixed operating costs, an investment and financing table is built. This will then
be used, along with information from the assumtions part , for building the operating and
balance sheet part of the profitability model. Information then flows to the cash flow part and
to the profitability measurement part. From that graphs and charts are made and the sensitivi-
ty of the internal rate of return of the equity of the proect is assessed by changing the main
financial factors one by one.
4 BUSINESS PLAN AND OPERATIONS ANALYSIS
Two different business models, A and B, will be described. Both will then be assessed using
the profitability model.
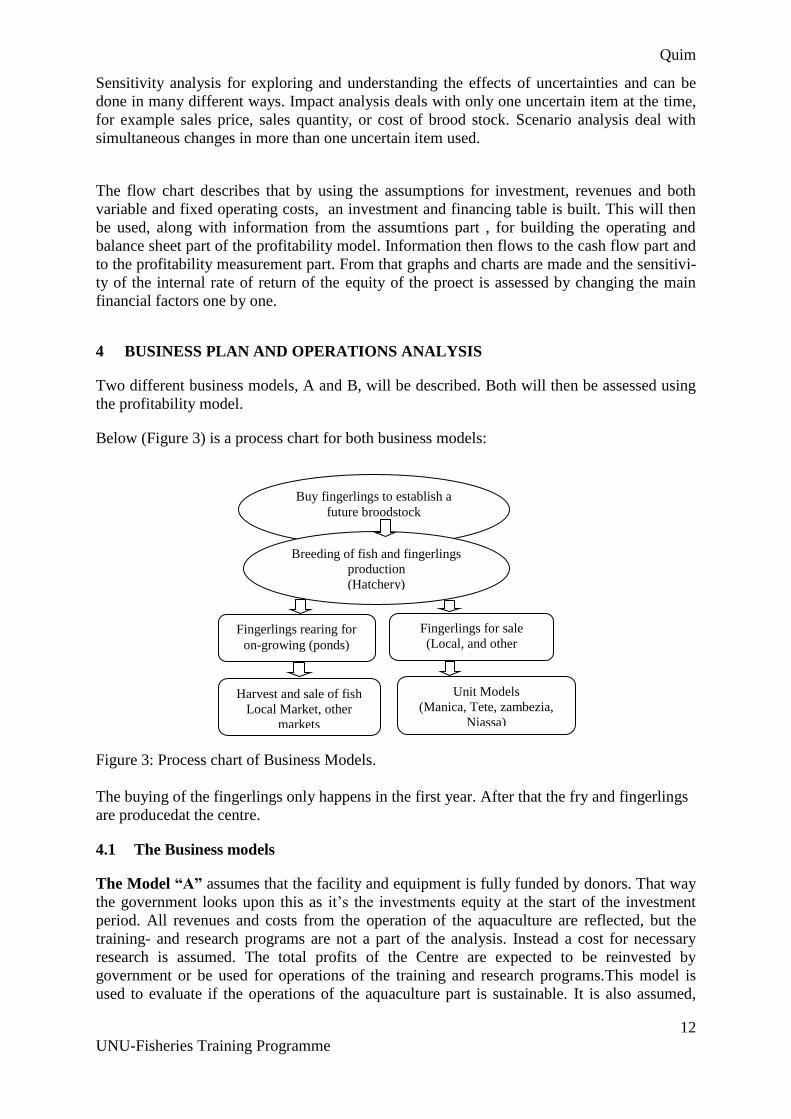
Below (Figure 3) is a process chart for both business models:
Figure 3: Process chart of Business Models.
The buying of the fingerlings only happens in the first year. After that the fry and fingerlings
are producedat the centre.
4.1 The Business models
The Model “A” assumes that the facility and equipment is fully funded by donors. That way
the government looks upon this as it’s the investments equity at the start of the investment
period. All revenues and costs from the operation of the aquaculture are reflected, but the
training- and research programs are not a part of the analysis. Instead a cost for necessary
research is assumed. The total profits of the Centre are expected to be reinvested by
government or be used for operations of the training and research programs.This model is
used to evaluate if the operations of the aquaculture part is sustainable. It is also assumed,
Buy fingerlings to establish a
future broodstock
Breeding of fish and fingerlings
production
(Hatchery)
Fingerlings rearing for
on-growing (ponds)
Fingerlings for sale
(Local, and other
markets)
Harvest and sale of fish
Local Market, other
markets
Unit Models
(Manica, Tete, zambezia,
Niassa)
Quim
13
UNU-Fisheries Training Programme
although unrealistic, that the acquisition and installation of equipment purchased has already
been finished before the first year of operations in 2015.
In this first year, the activity will focus on the acquisition, selection and rearing of fingerlings
for the establishment of a future brood stock and tuning the operation up for an efficient
fingerling production. The fish growing will in the first year be secondary to this. In this
model, the production of fingerlings is in progress since the fish have already reached
sufficient maturity for reproduction as early as after the first six months. Both activities will
happen simultaneously, production of fingerlings and on-growing. Some fingerlings will be
used for raising fish in the ponds of the Centre but mostly fingerlings will be sold directly
from the Centre. Fingerlings will also be sent to aquaculture units’ already created by the
INAQUA in the provinces of Manica, Tete, Zambezia and Niassa, were then will be sold on
credit to fish farmers.
The whole fish is sold at the average size of 500 gr. at three different marketing locations;
through middlemen in the Capital city, also through middlemen local markets in the province
and directly to customers at the centre. The price to both the middlemen and local customers
is estimated at $ 6.4. That gives the middlemen a 25% margin on cost of sales if the end price
is $8 and the local customers bying directly from the centre can afford the sales price.
The Model “B” is based on the same assumptions as Business model “A” but adding an
assumptions of a temporary three-year financial assistance from donors for the operations of
fingerling production and subsidising the price for small scale farmers.
4.2 Assumptions and analysis common for both Business Models
Needs of the customers and their ability to purchase is the first step that must be analysed by
the managers in order to determine key success factor of the business (Ssebisubi, 2010). This
assessment will build up knowledge, can provide good relations with customers and strength-
en the Centres bargaining power.
In this study it is imperative to know what is required for the Freshwater Aquaculture Demon-
stration and Training Centre of Chokwe to survive during the operation time of the investment
period. This is a combination of how and what will have to be the Strategy in order to satisfy
and to capture a growing number of customers of fingerlings (Grant, 2005).
4.2.1 Customers and potential markets for fingerlings
For the Freshwater Aquaculture Demonstration and Training Centre three customer groups
were identified:
1. Aquaculture for self-consumption ("family" based);
2. Small Aquaculture Associations ;
3. Aquaculture, producing for the market at a small-scale.
The most aquaculture operations in Mozambique fall into the first category. Fish farming is a
marginal activity, poorly integrated into the rest of their farming activities undertaken it in
earthen ponds. this kind of culture system has overall had negative results. For the fish farm-
ers, the satisfaction gained from small-scale fish farming is not sufficiently attractive to out-
weigh the effort and degree of technical expertise required. For the future, it is suggested that
aid to this kind of aquaculture should concentrate on support to those farmers who show signs
and capabilities of adopting more intensive methods. (Harrison, 1996).

Quim
14
UNU-Fisheries Training Programme
Farmers Associations who make aquaculture as an alternative source of income to finance
other livelihood activities characterize the second group of customers of aquaculture in
Mozambique. They sell a big part of production at agricultural fairs and asmall portion is then
divided between the members. For this type of Aquaculture it is easy to provide technical
assistance and credit and thus increase the quantity and quality of their production.
The last group are Small-scale market-oriented aquaculture farmers: According to Harrison,
(1996) only a few hundred people in Africa. Belong to this group. In Mozambique, they are
very few and generally have a good knowledge of fish farming. For them, fish farming is not
their only activity, but it may be a main or significant part of their business operations. In the
rural setting, this form of aquaculture tends to be integrated with other agricultural activities,
and is an important extra source of income.
With improvement in seed quality, feed formulation and distribution, can be expected the
creation of small, medium and large-scale companies for aquaculture production can be ex-
pected.
A potential problem is that fish farmers only purchase a small numbers of fingerlings and
thus the hatchery must hold the fingerlings for long periods. This is not recommendable. In
this respect, the timing and marketing of fish production must be well established before in-
vestment in a hatchery (Guttmann, 2000).
In Business plan A a full average unit price of $0.78 is estimated for the sale of 3,760,000
fingerlings each year. As the characteristics above point to the majority of the potential cus-
tomers of fingerlings, both those that use aquaculture for self-consumption (family based),
and the associations, can hardly be expected to pay full price for fingerlings at least in the
first three years of operations. Thus a Business plan B is designed where donor organizations
are assumed to subsidise the price of fingerlings. An offer of fingerlings at zero cost (giving)
could be a way to encourage laziness in the fish farmers. For this not to happen, the fry will
be sold at half price $0.04 for identified fish farmers and the quantity for each group will be:
3/5 of total fingerlings for association of aquaculture, 1/5 for self-consumption and 1/5 for
market oriented.
Since there are no absolute statistics on the potential market for such a large number of fin-
gerlings that will be produced in the Centre of Chokwe, other ways are used to try to estimate
the market size of both of fingerlings and fish. Omar, et al., estimated that in 2005 there were
about 3,500 ponds altogether of the size 400-500m2 in Manica, Niassa, Sofala, Zambezia and
Tete provinces. In 2007 this number of ponds had increased to 7.170 ponds of 100-400m2
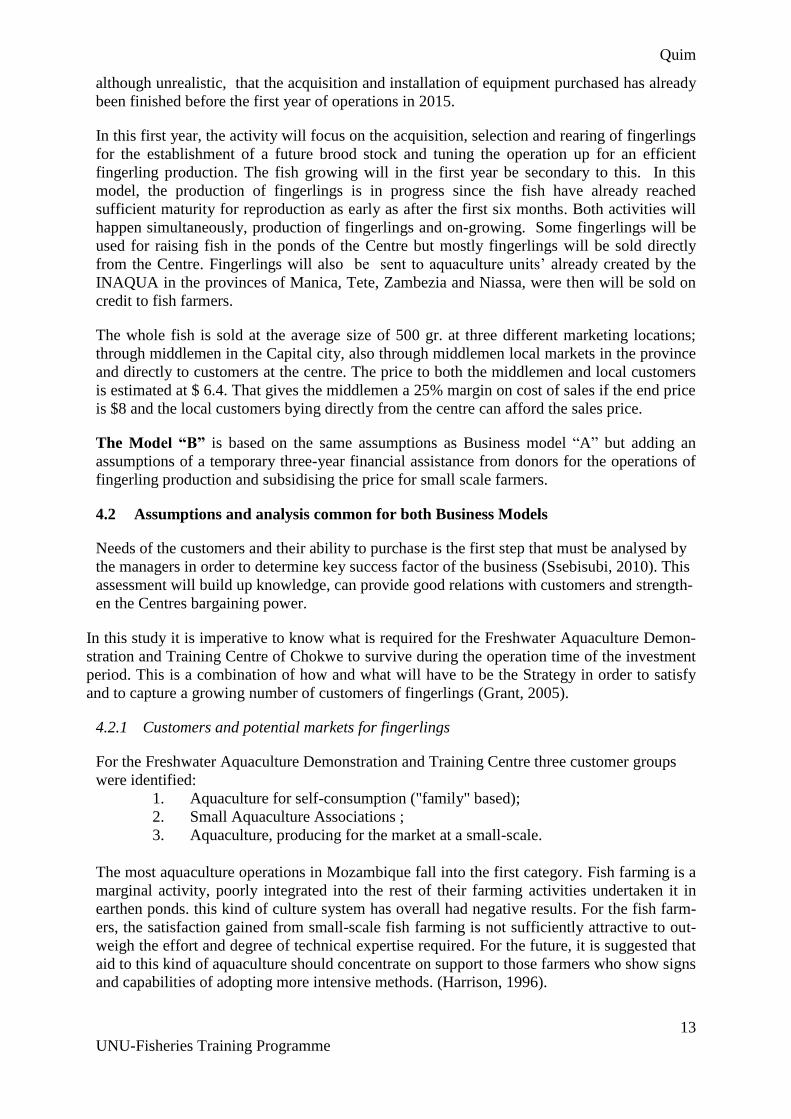
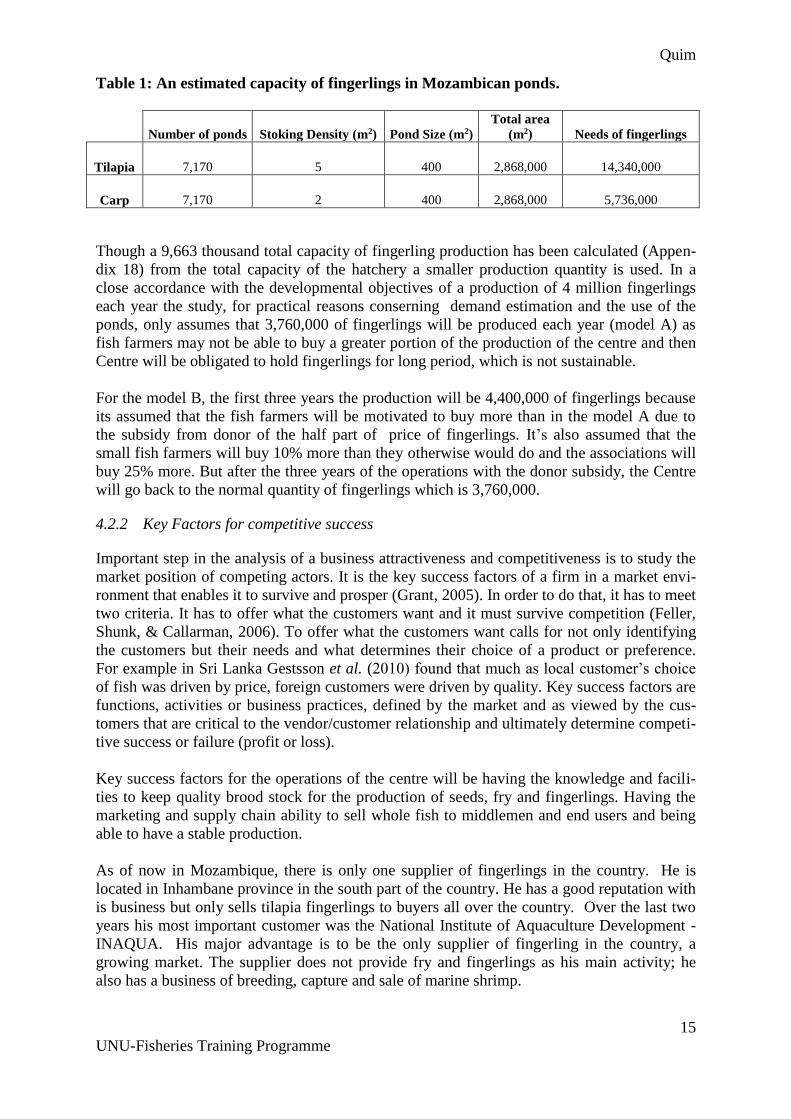
where around 2000 families where involved (INFOSA, 2009).
To estimate the total capacity for Tilapia the local artea of the ponds was stimated and multi-
plied by the stoking density of 5 fingerlings per m2 (Table 1). That estimates the total needs
of fingerlings for the country around 14.340.000 or less if carp is partly used for farming (2
fingerlings pr. m2). The estimation is shown in table below.
Quim
15
UNU-Fisheries Training Programme
Table 1: An estimated capacity of fingerlings in Mozambican ponds.
Number of ponds Stoking Density (m2) Pond Size (m2)
Total area
(m2) Needs of fingerlings
Tilapia 7,170 5 400 2,868,000 14,340,000
Carp 7,170 2 400 2,868,000 5,736,000
Though a 9,663 thousand total capacity of fingerling production has been calculated (Appen-
dix 18) from the total capacity of the hatchery a smaller production quantity is used. In a
close accordance with the developmental objectives of a production of 4 million fingerlings
each year the study, for practical reasons conserning demand estimation and the use of the
ponds, only assumes that 3,760,000 of fingerlings will be produced each year (model A) as
fish farmers may not be able to buy a greater portion of the production of the centre and then
Centre will be obligated to hold fingerlings for long period, which is not sustainable.
For the model B, the first three years the production will be 4,400,000 of fingerlings because
its assumed that the fish farmers will be motivated to buy more than in the model A due to
the subsidy from donor of the half part of price of fingerlings. It’s also assumed that the
small fish farmers will buy 10% more than they otherwise would do and the associations will
buy 25% more. But after the three years of the operations with the donor subsidy, the Centre
will go back to the normal quantity of fingerlings which is 3,760,000.
4.2.2 Key Factors for competitive success
Important step in the analysis of a business attractiveness and competitiveness is to study the
market position of competing actors. It is the key success factors of a firm in a market envi-
ronment that enables it to survive and prosper (Grant, 2005). In order to do that, it has to meet
two criteria. It has to offer what the customers want and it must survive competition (Feller,
Shunk, & Callarman, 2006). To offer what the customers want calls for not only identifying
the customers but their needs and what determines their choice of a product or preference.
For example in Sri Lanka Gestsson et al. (2010) found that much as local customer’s choice
of fish was driven by price, foreign customers were driven by quality. Key success factors are
functions, activities or business practices, defined by the market and as viewed by the cus-
tomers that are critical to the vendor/customer relationship and ultimately determine competi-
tive success or failure (profit or loss).
Key success factors for the operations of the centre will be having the knowledge and facili-
ties to keep quality brood stock for the production of seeds, fry and fingerlings. Having the
marketing and supply chain ability to sell whole fish to middlemen and end users and being
able to have a stable production.
As of now in Mozambique, there is only one supplier of fingerlings in the country. He is
located in Inhambane province in the south part of the country. He has a good reputation with
is business but only sells tilapia fingerlings to buyers all over the country. Over the last two
years his most important customer was the National Institute of Aquaculture Development -
INAQUA. His major advantage is to be the only supplier of fingerling in the country, a
growing market. The supplier does not provide fry and fingerlings as his main activity; he
also has a business of breeding, capture and sale of marine shrimp.

Quim
16
UNU-Fisheries Training Programme
Being a governmental institution specialized in aquaculture and quality seed production,
training fish farmers and offering products (by way of subsidy or not) the Freshwater Aqua-
culture Demonstration and Training Centre surely could have an advantage in cultivating its
customers.
4.3 Production planning model
Below is a short description of the production planning model for the Centre as used for the
profitability model.
4.3.1 36 ponds model
The 5.1 ha farm comprised 36 ponds each measuring in average 1430m2. Twenty-two ponds
were simultaneously stocked with Nile and Mozambican tilapia, eleven ponds with grass and
common carp fingerlings and 3 ponds reserved for brood stock. After the first nine months of
operations all the thirty-six ponds were stocked. In the ninth month all stoked ponds were due
for harvesting (Table 2).
Table 2: Production Characteristics & main assumptions of tilapia and carp (Engle & Neira,
2005).
Production Characteristic Assumed Values
Unit Tilapia Carp
Average pond area m2 1,430 1,430
Total area used first year m2 31,460 15730
Stoking density fish/m2 5 2
Initial number of fish individual 157,300 31,460
Initial weight of fish stocked g 10.00 10
Initial biomass kg 1,573, 314,6
Cost of fingerlings $/individual 0.09 0.7
Survival rate % 90 70
Cycle length Days 270 270
Year yr 365 365
Selling price of fish $/Kg 6.4 6.4
Selling price of fingerlings Per fingerling 0.08 0.08
FCR ratio 3.46 3.46
Pelleted diet $/Kg 1 1
Growth rate g/day 1.85 1.85
Final number of fish individual 141,570 22,022
Individual harvest weight G 500 500
Yield-live Kg/ha 70785 11011
Total amount of feed per batch kg 27327 7,340
Equipment I depreciation % 14%
Equipment II depreciation % 20%
Equipment III depreciation % 50%
Income Tax % 12%
Dividend % 100%
Depreciation on Building % 2%
Depreciation on other costs % 2%
Loan management % 20%

Quim
17
UNU-Fisheries Training Programme
The first year of the operations of the Freshwater Aquaculture Demonstration and Training
Centre of Chokwe will be focused on buying fingerlings that will be selected for future
breeders and growing up.
The expected number of staff for the first year will be 12, namely: one Coordinator, two
Administrative and financial staff, two research technicians, two foreign aquaculture
specialists, two Aquaculture technicians, one driver, one Administrative assistant, one watch.
Some people will be hired for casual labour during the harvesting time and for other extra
work.
The operations will start in January 2015 after all the start-up investment work has been
completed in 2014. The first activity will be to buy the number of fingerlings for the
production ponds. For that, it was assumed that for tilapia five fingerlings/m2 will be used
and, two fingerlings/m2 for carp (FAO, 2006).
The total number of the ponds is forty-two ponds with different following sizes: four ponds
with 30x40m, twenty-four pounds with 30x50m, and eight ponds with 30x60m and four
ponds with 30x70m. The ponds will be distributed in a quarter of the total number of the
ponds for carp and the rest for tilapia, because the tilapia is most sold species in the local
market and has the lower price for fingerlings than carp. The average area of the ponds is
1,430m2 and the total area of the ponds is about 60,060m2.
In the first year of the operations, 33 ponds will be used for production of fish, divided in 11
for carp, 22 for tilapia, 3 ponds will be for selected fingerlings for future brood stock and 6
ponds will be in maintenance. The stoking density will be 5/m2 for tilapia and 2/m2 for carp.
The number of fingerlings will be 157,300 for tilapia 31,460 for carp, 1,270 carp fingerlings
selected for brood stock and 2,200 for tilapia.
The selected fingerlings will be divided by 520 grass carp, 650 common carp, 1,100 Nile
tilapia and 1,100 of tilapia Mozambican. The survival rate of 70% of both grass and common
carp and 90% of both Nile and Mozambican tilapia is used.
The estimated batch cycle of the production to reach 400-500g for tilapia and carp, ideal
weight for selling will be 9 months for all species.
After the selection of brood stock and considered survival rate of 70% for carp and 90% for
tilapia, the total number of fish to the end of the cycle will be 22,022 for carp and 141,570 for
tilapia. This quantity in kg will be 11,011kg for carp and 70,785kg for tilapia and the total
quantity of fish will be 81,796kg.
According to Salia, (2008) the average price of each kg of fish in Mozambique was then $3.6.
Currently the market price to end users for tilapia is estimated around $ 8 per kilo according
to a conversation with Gelane Ussene from the INAQUA).
4.4 Profitability model assumptions and analysis
As was shown in the flow chart of the profitability model (Figure 2), underlying assumtions
are used in various parts of the model.
4.4.1 Investment cost
As mentioned previously the lack of reliable data means that a number of assumptions had to
be made. Below, the assumptions are shown in italic (Table 3).
Quim
18
UNU-Fisheries Training Programme
Table 3: Breakdown of investment cost.
Breakdown of Investment costs
Equipment USD
Hatchery in house 16,810
Hatchery Outside 52,730
Hatchery - Electricity system in & out side 100,100
Harvesting 4,000
2 Vehicles pick Up (buy) 100,000
Equipment total 273,640
Other Investment 50,000
Total investment cost 323,640
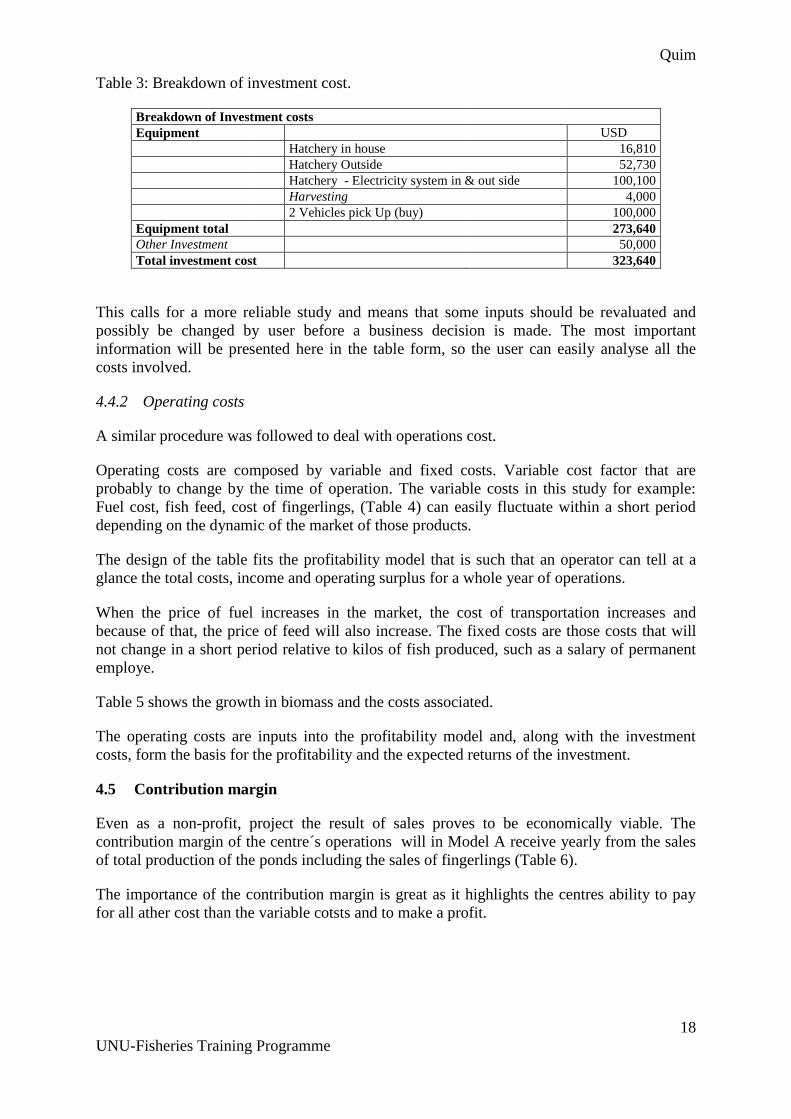
This calls for a more reliable study and means that some inputs should be revaluated and
possibly be changed by user before a business decision is made. The most important
information will be presented here in the table form, so the user can easily analyse all the
costs involved.
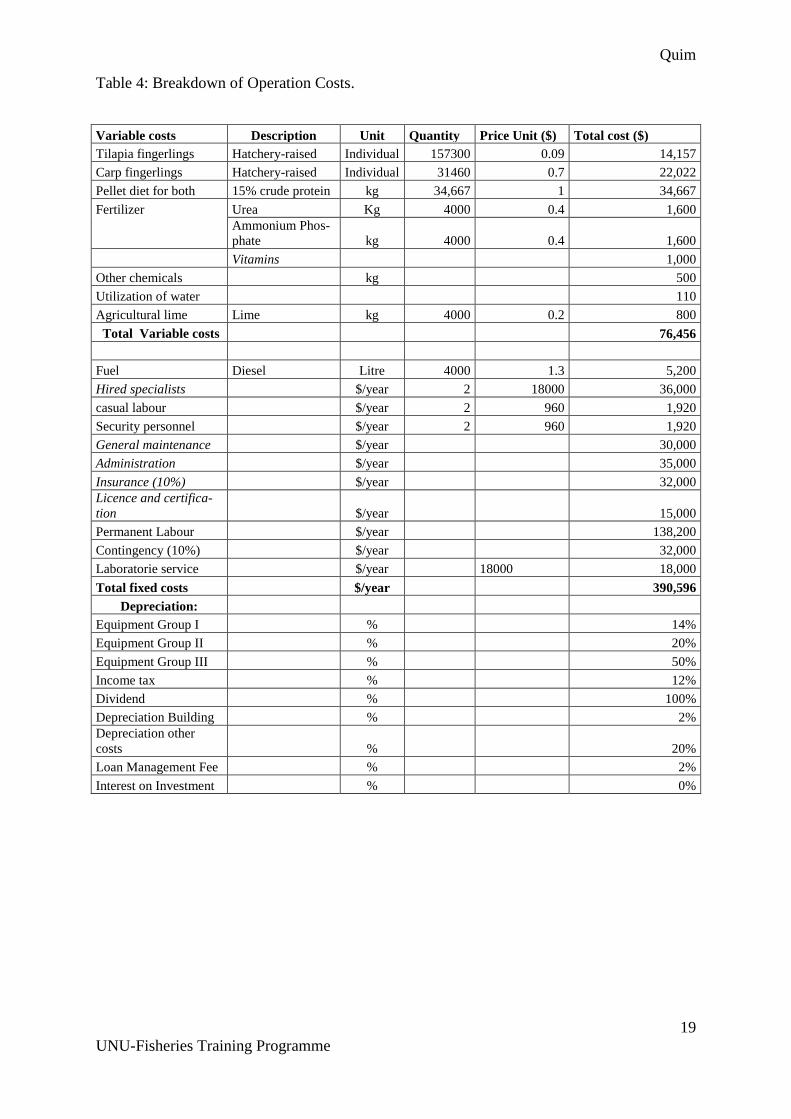
4.4.2 Operating costs
A similar procedure was followed to deal with operations cost.
Operating costs are composed by variable and fixed costs. Variable cost factor that are
probably to change by the time of operation. The variable costs in this study for example:
Fuel cost, fish feed, cost of fingerlings, (Table 4) can easily fluctuate within a short period
depending on the dynamic of the market of those products.
The design of the table fits the profitability model that is such that an operator can tell at a
glance the total costs, income and operating surplus for a whole year of operations.
When the price of fuel increases in the market, the cost of transportation increases and
because of that, the price of feed will also increase. The fixed costs are those costs that will
not change in a short period relative to kilos of fish produced, such as a salary of permanent
employe.
Table 5 shows the growth in biomass and the costs associated.
The operating costs are inputs into the profitability model and, along with the investment
costs, form the basis for the profitability and the expected returns of the investment.
4.5 Contribution margin
Even as a non-profit, project the result of sales proves to be economically viable. The
contribution margin of the centre´s operations will in Model A receive yearly from the sales
of total production of the ponds including the sales of fingerlings (Table 6).
The importance of the contribution margin is great as it highlights the centres ability to pay
for all ather cost than the variable cotsts and to make a profit.
Quim
19
UNU-Fisheries Training Programme
Table 4: Breakdown of Operation Costs.
Variable costs Description Unit Quantity Price Unit ($) Total cost ($)
Tilapia fingerlings Hatchery-raised Individual 157300 0.09 14,157
Carp fingerlings Hatchery-raised Individual 31460 0.7 22,022
Pellet diet for both 15% crude protein kg 34,667 1 34,667
Fertilizer Urea Kg 4000 0.4 1,600
Ammonium Phos-
phate kg 4000 0.4 1,600
Vitamins 1,000
Other chemicals kg 500
Utilization of water 110
Agricultural lime Lime kg 4000 0.2 800
Total Variable costs 76,456
Fuel Diesel Litre 4000 1.3 5,200
Hired specialists $/year 2 18000 36,000
casual labour $/year 2 960 1,920
Security personnel $/year 2 960 1,920
General maintenance $/year 30,000
Administration $/year 35,000
Insurance (10%) $/year 32,000
Licence and certifica-
tion $/year 15,000
Permanent Labour $/year 138,200
Contingency (10%) $/year 32,000
Laboratorie service $/year 18000 18,000
Total fixed costs $/year 390,596
Depreciation:
Equipment Group I % 14%
Equipment Group II % 20%
Equipment Group III % 50%
Income tax % 12%
Dividend % 100%
Depreciation Building % 2%
Depreciation other
costs % 20%
Loan Management Fee % 2%
Interest on Investment % 0%
Quim
20
UNU-Fisheries Training Programme
Table 5: Table: Production data of cultured Tilapia and Carp on density of 2 & 5 Fingerlings.
Mo
nth
Survival rate
%
No. of fish Mean
body
weight
Biomass
in Kg
Feeding
rate
%/bioma
ss/day
quantity
Feed/ 33
pond/Cy
cle Kg
Cost of
feed/mon
th/ cycle
$
Ferti-
lizing
cost/cyc
le ($) Car
p
Tilap-
ia
Carp Tilapia
0 100 100 31,460.0 157,300 10 188.8 15% 28.32 127.4 1600
1 95 98 30,830.8 154,154 55.5 10266.7 10% 1,026.67 3.080.0 1600
2 90 96 28,314.0 151,008 111 19904.7 6% 1,194.28 2149.7 1600
3 85 95 26,741.0 149,435 166.5 29,333.3 5% 1,466.67 2,200.0 1600
4 80 93 25,168.0 146,289 222 38,063.4 4% 1,522.54 1,827.0 1600
5 75 92 23,595.0 144,716 277.5 46,706.5 3% 1,401.20 1,261.1 1600
6 73 91 22,965.8 143,143 333 55,914.2 2% 1,118.28 671.0 1600
7 72 90 22,651.2 141,570 388.5 63,799.9 1.5% 1,276.00 574.2 1600
8 70 90 22,022.0 141,570 444.0 72,634.8 1.5% 1,452.70 635.7 1600
9 70 90 22,022.0 141,570 500.0 81,796.0 1.5% 1,635.92 736.2 1600
34,667 34,667 1,600
Table 6: Contribution margin.
Gross revenues
Item Description Unit Quantity Price in $ Total cost in $
Tilapia Live kg 70,785 6.4 453,024
Carp Live kg 11,011 6.4 70,470
Tilapia & Carp fingerlings. Live 1 3,760,000 0.08 300,800
Total gross revenues 824,294
Cost of fingerlings/cycle 36,179
Cost of feeding / cycle 34,667
Cost with fertilizer 1,600
Cost of limestone 800
Diverse 3,210
Contribution margin 747,838
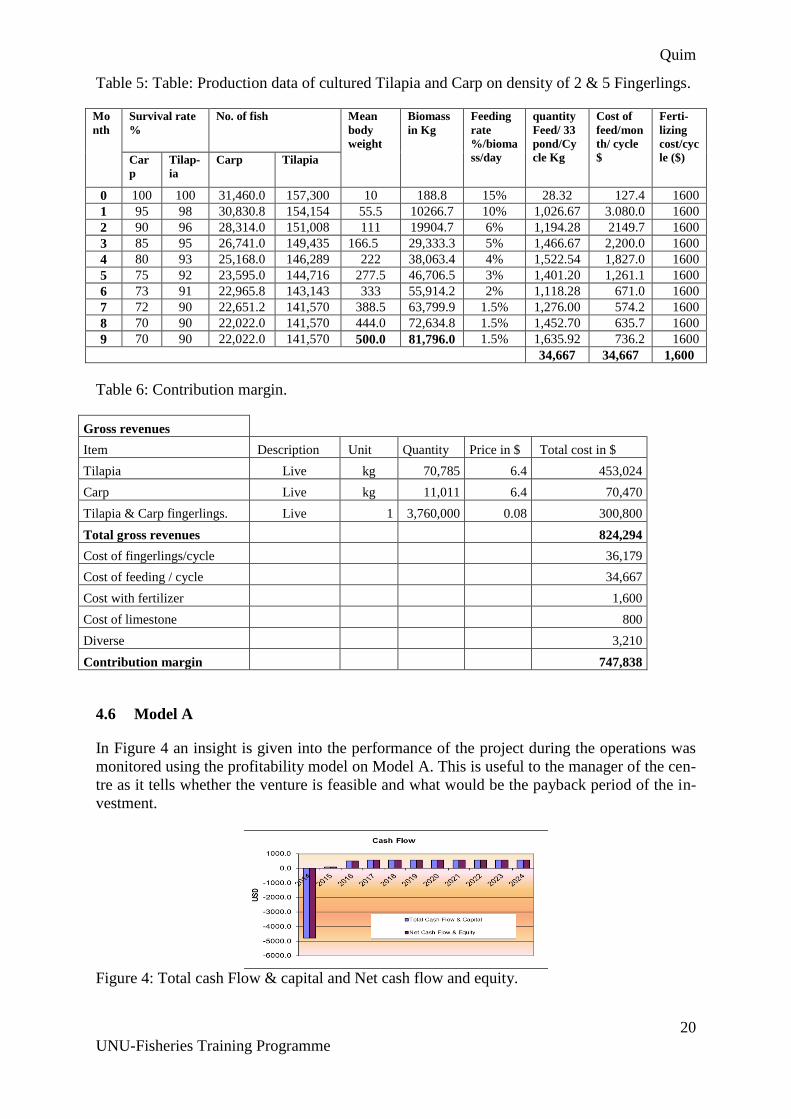
4.6 Model A
In Figure 4 an insight is given into the performance of the project during the operations was
monitored using the profitability model on Model A. This is useful to the manager of the cen-
tre as it tells whether the venture is feasible and what would be the payback period of the in-
vestment.
Figure 4: Total cash Flow & capital and Net cash flow and equity.
Quim
21
UNU-Fisheries Training Programme
For the present study, the total cash flow and capital and the Net cash flow and equity is neg-
ative in the first year and its beginning to be positive on the second and increasing year by
year. The cash flow is negative for the first year due to the capital outlet of the start-up.
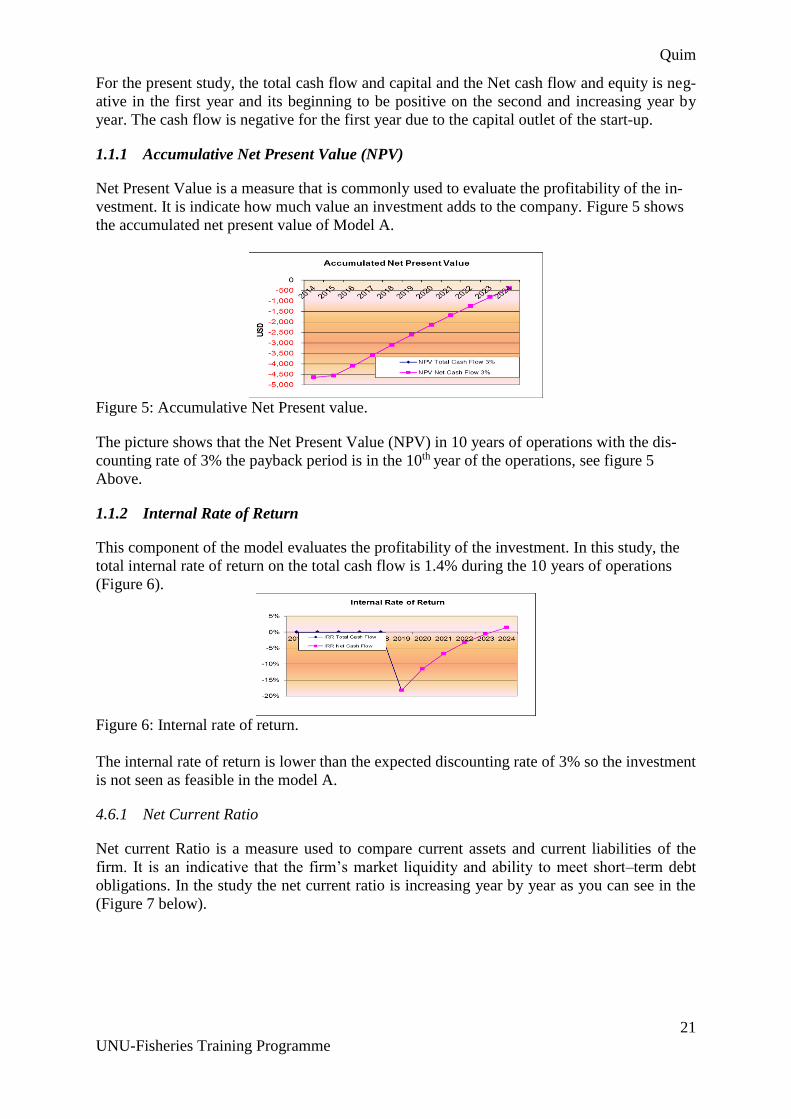
1.1.1 Accumulative Net Present Value (NPV)
Net Present Value is a measure that is commonly used to evaluate the profitability of the in-
vestment. It is indicate how much value an investment adds to the company. Figure 5 shows
the accumulated net present value of Model A.
Figure 5: Accumulative Net Present value.
The picture shows that the Net Present Value (NPV) in 10 years of operations with the dis-
counting rate of 3% the payback period is in the 10th year of the operations, see figure 5
Above.
1.1.2 Internal Rate of Return
This component of the model evaluates the profitability of the investment. In this study, the
total internal rate of return on the total cash flow is 1.4% during the 10 years of operations
(Figure 6).
Figure 6: Internal rate of return.
The internal rate of return is lower than the expected discounting rate of 3% so the investment
is not seen as feasible in the model A.
4.6.1 Net Current Ratio
Net current Ratio is a measure used to compare current assets and current liabilities of the
firm. It is an indicative that the firm’s market liquidity and ability to meet short–term debt
obligations. In the study the net current ratio is increasing year by year as you can see in the
(Figure 7 below).
Quim
22
UNU-Fisheries Training Programme
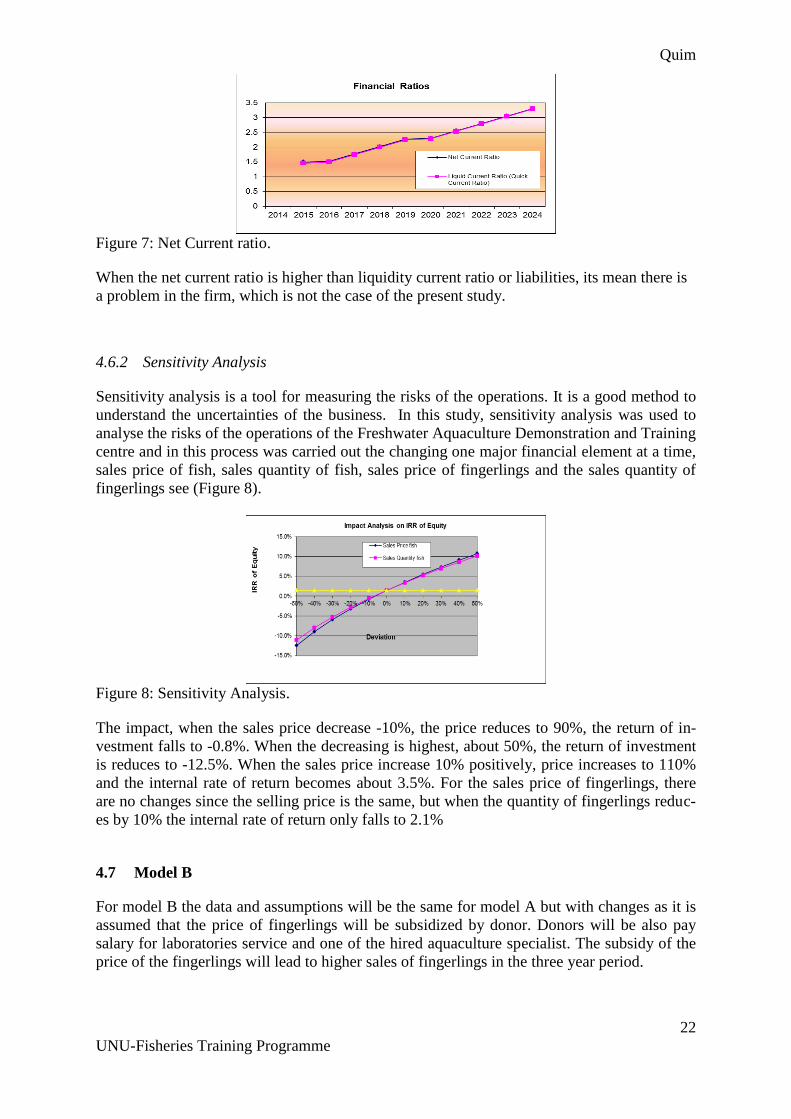
Figure 7: Net Current ratio.
When the net current ratio is higher than liquidity current ratio or liabilities, its mean there is
a problem in the firm, which is not the case of the present study.
4.6.2 Sensitivity Analysis
Sensitivity analysis is a tool for measuring the risks of the operations. It is a good method to
understand the uncertainties of the business. In this study, sensitivity analysis was used to
analyse the risks of the operations of the Freshwater Aquaculture Demonstration and Training
centre and in this process was carried out the changing one major financial element at a time,
sales price of fish, sales quantity of fish, sales price of fingerlings and the sales quantity of
fingerlings see (Figure 8).
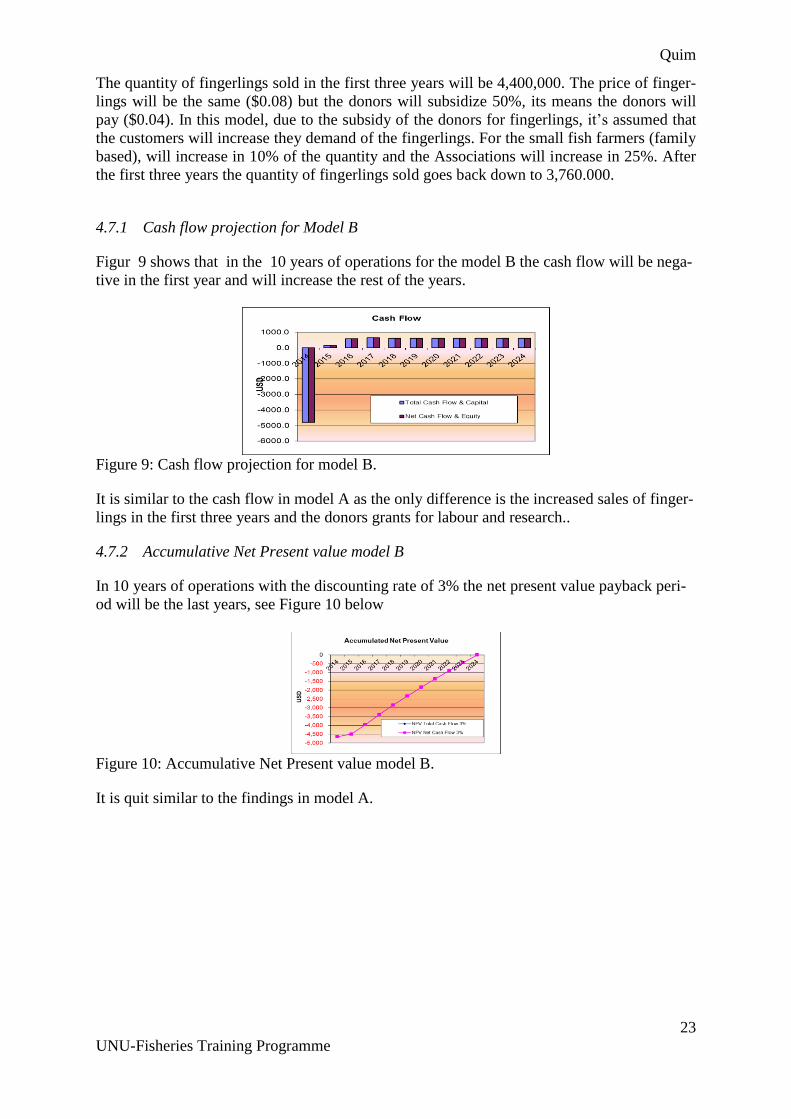
Figure 8: Sensitivity Analysis.
The impact, when the sales price decrease -10%, the price reduces to 90%, the return of in-
vestment falls to -0.8%. When the decreasing is highest, about 50%, the return of investment
is reduces to -12.5%. When the sales price increase 10% positively, price increases to 110%
and the internal rate of return becomes about 3.5%. For the sales price of fingerlings, there
are no changes since the selling price is the same, but when the quantity of fingerlings reduc-
es by 10% the internal rate of return only falls to 2.1%
4.7 Model B
For model B the data and assumptions will be the same for model A but with changes as it is
assumed that the price of fingerlings will be subsidized by donor. Donors will be also pay
salary for laboratories service and one of the hired aquaculture specialist. The subsidy of the
price of the fingerlings will lead to higher sales of fingerlings in the three year period.
Quim
23
UNU-Fisheries Training Programme
The quantity of fingerlings sold in the first three years will be 4,400,000. The price of finger-
lings will be the same ($0.08) but the donors will subsidize 50%, its means the donors will
pay ($0.04). In this model, due to the subsidy of the donors for fingerlings, it’s assumed that
the customers will increase they demand of the fingerlings. For the small fish farmers (family
based), will increase in 10% of the quantity and the Associations will increase in 25%. After
the first three years the quantity of fingerlings sold goes back down to 3,760.000.
4.7.1 Cash flow projection for Model B
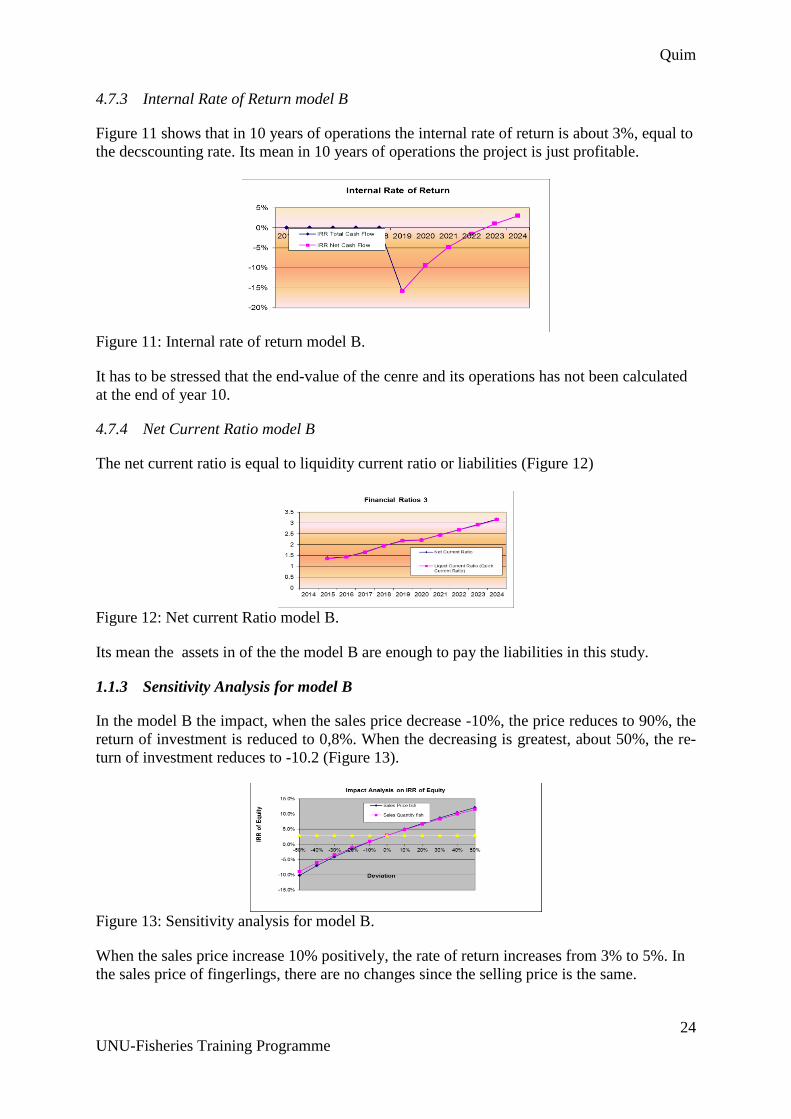
Figur 9 shows that in the 10 years of operations for the model B the cash flow will be nega-
tive in the first year and will increase the rest of the years.
Figure 9: Cash flow projection for model B.
It is similar to the cash flow in model A as the only difference is the increased sales of finger-
lings in the first three years and the donors grants for labour and research..
4.7.2 Accumulative Net Present value model B
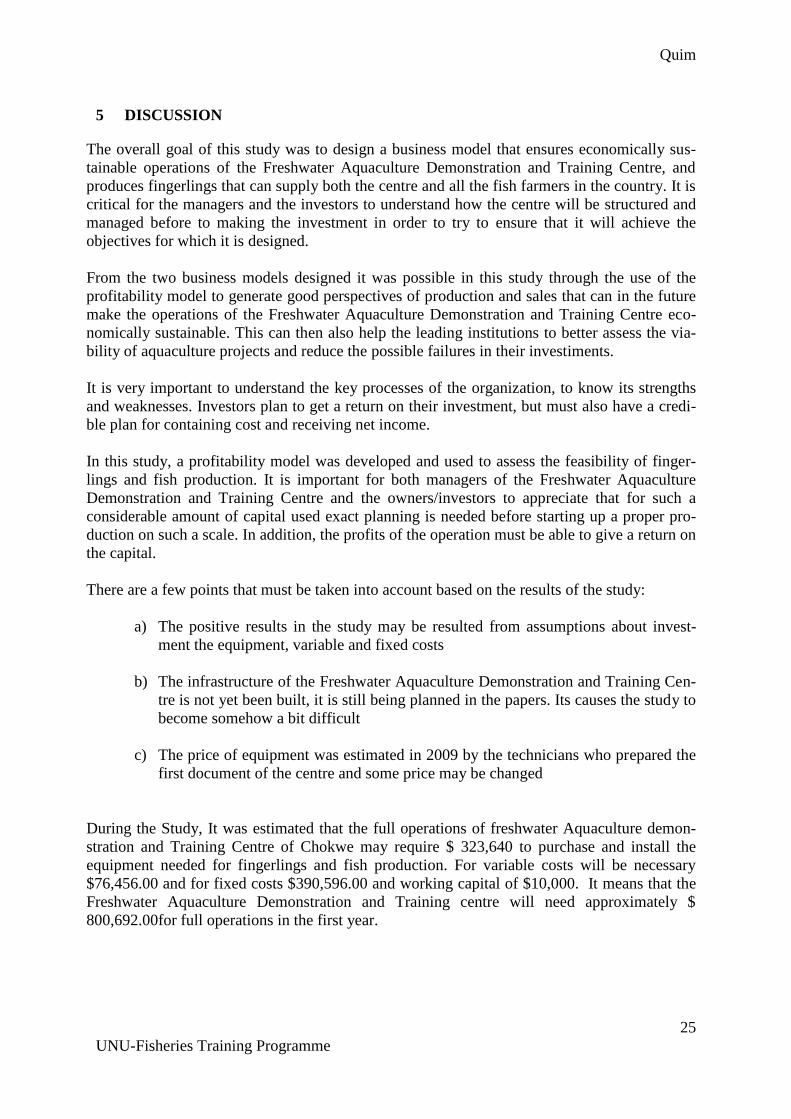
In 10 years of operations with the discounting rate of 3% the net present value payback peri-
od will be the last years, see Figure 10 below
Figure 10: Accumulative Net Present value model B.
It is quit similar to the findings in model A.
Quim
24
UNU-Fisheries Training Programme
4.7.3 Internal Rate of Return model B
Figure 11 shows that in 10 years of operations the internal rate of return is about 3%, equal to
the decscounting rate. Its mean in 10 years of operations the project is just profitable.
Figure 11: Internal rate of return model B.
It has to be stressed that the end-value of the cenre and its operations has not been calculated
at the end of year 10.
4.7.4 Net Current Ratio model B
The net current ratio is equal to liquidity current ratio or liabilities (Figure 12)
Figure 12: Net current Ratio model B.
Its mean the assets in of the the model B are enough to pay the liabilities in this study.
1.1.3 Sensitivity Analysis for model B
In the model B the impact, when the sales price decrease -10%, the price reduces to 90%, the
return of investment is reduced to 0,8%. When the decreasing is greatest, about 50%, the re-
turn of investment reduces to -10.2 (Figure 13).
Figure 13: Sensitivity analysis for model B.
When the sales price increase 10% positively, the rate of return increases from 3% to 5%. In
the sales price of fingerlings, there are no changes since the selling price is the same.
Quim
25
UNU-Fisheries Training Programme
5 DISCUSSION
The overall goal of this study was to design a business model that ensures economically sus-
tainable operations of the Freshwater Aquaculture Demonstration and Training Centre, and
produces fingerlings that can supply both the centre and all the fish farmers in the country. It is
critical for the managers and the investors to understand how the centre will be structured and
managed before to making the investment in order to try to ensure that it will achieve the
objectives for which it is designed.
From the two business models designed it was possible in this study through the use of the
profitability model to generate good perspectives of production and sales that can in the future
make the operations of the Freshwater Aquaculture Demonstration and Training Centre eco-
nomically sustainable. This can then also help the leading institutions to better assess the via-
bility of aquaculture projects and reduce the possible failures in their investiments.
It is very important to understand the key processes of the organization, to know its strengths
and weaknesses. Investors plan to get a return on their investment, but must also have a credi-
ble plan for containing cost and receiving net income.
In this study, a profitability model was developed and used to assess the feasibility of finger-
lings and fish production. It is important for both managers of the Freshwater Aquaculture
Demonstration and Training Centre and the owners/investors to appreciate that for such a
considerable amount of capital used exact planning is needed before starting up a proper pro-
duction on such a scale. In addition, the profits of the operation must be able to give a return on
the capital.
There are a few points that must be taken into account based on the results of the study:
a) The positive results in the study may be resulted from assumptions about invest-
ment the equipment, variable and fixed costs
b) The infrastructure of the Freshwater Aquaculture Demonstration and Training Cen-
tre is not yet been built, it is still being planned in the papers. Its causes the study to
become somehow a bit difficult
c) The price of equipment was estimated in 2009 by the technicians who prepared the
first document of the centre and some price may be changed
During the Study, It was estimated that the full operations of freshwater Aquaculture demon-
stration and Training Centre of Chokwe may require $ 323,640 to purchase and install the
equipment needed for fingerlings and fish production. For variable costs will be necessary
$76,456.00 and for fixed costs $390,596.00 and working capital of $10,000. It means that the
Freshwater Aquaculture Demonstration and Training centre will need approximately $
800,692.00for full operations in the first year.
Quim
26
UNU-Fisheries Training Programme
6 CONCLUSION
Even as non-profit project the result of operations proves to be almost economically viable as
can be seen through the positive net revenues, the net present value and the Internal Rate of
Return. The returns consists of the earning that the centre will receive from the sales of total
production of the ponds including the sales of fingerlings, without those being subsidized in
plan A but subsidized for fish farmers in business plan B.
With the subsidy of half price of fingerlings in the business model B, fish farmers will be
attracted to practice aquaculture. The earnings from the sales of fish and fingerlings will be
used to organize courses for fish farmers, extensionists and other stakeholders.
Based on the assumptions and analysis of the profitability model, both, fingerlings and fish
farming in the Freshwater Aquaculture Demonstration and Training centre appears Sustaina-
ble minly in the business model B. However, for a sustainable development of fish farming in
general, managers are challenged with the responsibility of planning conducting aquaculture
in a sustainable way.
The comparison between business model A and B, it was found that the business model B is
the most viable than A due to the reduction of some expenses supported by donors as the
Payments for one of the specialist in aquaculture, expenses on the laboratories service and
subsidy of the half price of fingerlings for fisher farmers, that will increase the motivation for
the widespread activity in fish farming in Mozambique. Due to the lack of funds to initiate
the project, the donors are encouraged to consider cooperation in accordance with Business
plan B.
Quim
27
UNU-Fisheries Training Programme
ACKNOWLEDGEMENTS
I would like to pay my gratitude to the board of Directors of UNU-FTP and those who invisi-
bly contributed to the success of the training.
To be able to succeed in a course like this I required a great team work consisting of my su-
pervisors Mr. Helgi Gestsson & Dr. Ogmundur Knutsson, assisted by Bjarni Eriksson who I
extend my special thanks for the excellent guidance, comments, and support in all stage of
the specialist course and project.
My deepest appreciations goes to Dr. Tumi Tomasson, programme Director, Mr. Thor As-
geirsson, Deputy programme Director, to have selected me for the great opportunity to build
my professional capacity that will enable me to become a better specialist in the near future.
To Ms. Sigridur Ingvarsdottir, programme officer and Mary Frances Davidson, my warm
thanks and admiration for the professionalism and organization, but also for their special at-
tention that paid to each of us.
My deepest gratitude goes also to Ms. Isabel Omar my National Director at the National In-
stitute for Aquaculture Development, even knowing my limitations and weaknesses; she nev-
er stopped giving me opportunities.
I thank Catarina my wife; Henry and Larissa, my sons; for their patience and love during the
six months.
To the fellows of 2012 my hugs.
Quim
28
UNU-Fisheries Training Programme
LIST OF REFERENCES
Casaca, J. R. and Tomazelli, J. (2001). Planilha para o calculo de custo de producao de
Peixe. Florianopolis: EPAGRI.
Dan, B. and Stewart, M. (1992). Business Planing for Aquaculture – Is it Feasible?
Dortmund: Northeastern Region Aquaculture Centre: University of Massachusettes
Druker, P.F. (1999). The Five Most Important Questions you will ever ask about your
Organization . San Francisco: Jossey - Bass.
Egna, H. E. and Boyd, C.E. (1997). Dynamics of ponds Aquaculture. FL, USA: CRC Press.
Engle, C.R. and Neira, I. (2005). Tilapia Farm Business Management & Economics, Training
Manual. Arkansas: Aquaculture Center: University of Arkansas at Pine bluff.
Food and Agricultural Organization of the United Nations (2004). Cultured Aquatic Species
Information Programme. Cyprinus carpio. In: FAO Fisheries and Aquaculture Department
[February 2013] <http://www.fao.org/fishery/culturedspecies/Cyprinus_carpio/en>
Food and Agricultural Organization of the United Nations (2006). Cultured Species
Information Program - Orechromis Niloticus. Fisheries and Aquaculture Department.
Fisheries and Aquaculture Fact Sheets. In: FAO Fisheries and Aquaculture Department
Rome: FAO.
Food and Agricultural Organization of the United Nations (2006). National Aquaculture
Sector Overview. Mozambique. National Aquaculture Sector Overview fact sheet. [February
2013] <http://www.fao.org/fishery/countrysector/naso_mozambique/en>
Food and Agricultural Organization of the United Nations (2011). World Percapita
consuptin. Fus.
Food and Agricultural Organization of the United Nations FAO Home - Fisheries &
Aquaculture. FAO fisheries and aquaculture yipophthalmichthys molitrix [February 2013]
<http://www.fao.org/fishery/culturedspecies/Hypophthalmichthys_molitrix/en>
Food and Agricultural Organization of the United Nations FAO National Aquaculture
Overview (NASO). [February 2013]
<http://www.fao.org/fishery/countrysector/naso_mozambique/en.>
Feller, A., Shunk, D., and Callarman, T. (2006). Value Chain versus Supply Chain. [January
2013] <http://forums.leadersnet.co.il/go/leadh/forums_files/7093946158.pdf>
Fermin, A.C. (1998) Brood stock Management Seed Production of Tilapia and Carp.
[January 2013] <http://hdl.handle.net/10862/132>
FID/CP/MOZ, (2007) Mozambique Fishery Country Profile. FAO. [January 2013]
<http://worldfish.org/GCI/gci_assets_moz/Mozambique%20Fishery%20Overview%20-
%20FAO.pdf>
Quim
29
UNU-Fisheries Training Programme
Gameiro & Cardozo (2001). Custos na Piscicultura. [December 2012] <http://cepea.esalq.
usp.br/zip/Analise_custo.pdf >
Gestsson, H., Knutsson, O., and Gunnar, T. (2010). The Value Chain of Yelowfin Tuna in
Srilanka. In T. Charles, ed. The value Chain of Yelowfin tuna in Srilanka. Montpellier-
France: International Institute for Fisheries Economics and Trade (IIFET).
Grant, R.M. (2005). Contemporary strategy analysis 5th ed. Oxford: Wiley-Blackwell.
Guttmann, H. (2000). Provincial Aquaculture Development Project (LAO/97/007) Small-
scale Hatcheries For LAO PDR.
Harrisson, E. (1996). Options for Small-scale Aquaculture development, Report of Expert
Consultation on Small-scale Rural Aquaculture. Rome: FAO.
Hebicha, H.A., Gamal, A.R. and Green, B.W. (1994). Economic Analysis of Different Tilapia
Pond culture in Egypt. 12th Annual Technical Report. Oregon State University, USA: PD/A.
Office of International Research and Development.
Heizer, J. and Render, B. (2011). Operations Management. New Jersey: Pearson Education.
IHDI (2011). International Human Development Indicators (IHDI), National Human
Development Report for Mozambique: country Profile.
Imagine Africa (n.d). Map of Mozambique [February 2013]
<http://www.imagineafrica.co.uk/Mozambique/Mozambique_Map>
INAQUA (2008). Institutional Capacity development for Sustainable Aquaculture in
Mozambique, Ninstituto Naciona de desenvolvimento da aquacultura (INAQUA) & Icelandic
International Development agency (ICEIDA). ICEIDA. [January 2013]
<http://www.iceida.is/media/verkefnagagnabanki/Mozambique-Institutional-Capacity-
Building-Aquaculture-II-project-Document-2008-2012.pdf>
INFOSA (2009) Small-scale Aquaculture Development Plan for Mozambique. Maputo:
INAQUA.
Ministry of Fisheries (2005). Aquaculture Development Strategy. Maputo.
Ministry of Fisheries (2009). Assistance to the Fisheries Sector in Mozambique. Maputo;
MOF.
Nguyen, V.E and Dinh, V.T ( 2009). Stablisment of Freswater Aquaculture Demonstration
and Trainig Center. Maputo: INAQUA.
Omar, M.I.V., Modadugu, V.G., Jamu, D.M., Elsy, R., and Ribeiro, F.L. ( 2005). Proposed
Policies for Development of Aquaculture in Mozambique. London: Commonwealth
Secretariat.
Omondi, J.G., Gichuri, W.M. and Veverica, K. (2001). Apartial Economic Analysis for Nile
Tilapia Orechromis Niloticus L.& Sharptoothed Cat Fish Clarias Gariepinus (Burchell 1882)
Policulture in Central Kenya. aquaculture research.
Quim
30
UNU-Fisheries Training Programme
Phil aquaculture (2010) Intensive Culture of Tilapia in tank II [January 2013]
<http://philaquaculture.blogspot.com/2010/05/intensive-culture-of-tilapia-in-tanks.html.>
Pickering, T. and Nandlal, S. (2004). Tilapia Hatchery Operations Volume 1, Marine studies
Program. University of the South Pacific.
Salia, A. (2008). Economic analysis of Small-scale Tilapia Aquaculture in Mozambique.
Reykjavik: UNU-FTP.
Soto, Y.A. (2006). Profitability Analysis of the Investment in Beam Trawlers for Cuban
Shrimp Fisheries, Do stock Prices Fully Reflect information in Accruals and Cash Flows
about Future Earnings? The accounting Review 71: 289-315.
Ssebisubi, M. (2010). The Value Chain of Farmed African Catfish in Uganda, in Lynch,
(2006) Corporate Strategy 4Th Ed. England: prentice Hall.
Quim
31
UNU-Fisheries Training Programme
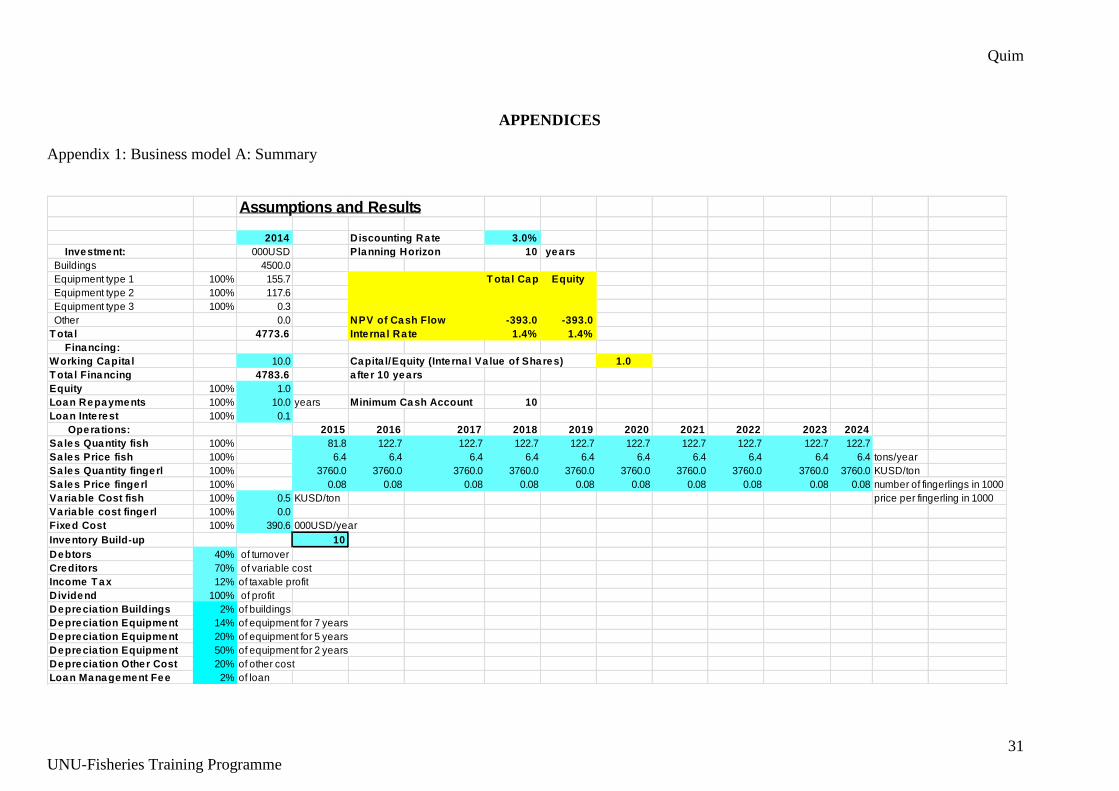
APPENDICES
Appendix 1: Business model A: Summary
Assumptions and Results
2014 Discounting Rate 3.0%
Investment: 000USD Planning Horizon 10 years
Buildings 4500.0
Equipment type 1 100% 155.7 T ota l Cap. Equity
Equipment type 2 100% 117.6
Equipment type 3 100% 0.3
Other 0.0 NPV of Cash Flow -393.0 -393.0
T ota l 4773.6 Inte rna l Ra te 1.4% 1.4%
Financing:
Working Capita l 10.0 Capita l/Equity (Inte rna l Va lue of Shares) 1.0
T ota l Financing 4783.6 a fte r 10 years
Equity 100% 1.0
Loan Repayments 100% 10.0 years Minimum Cash Account 10
Loan Inte rest 100% 0.1
Opera tions: 2015 2016 2017 2018 2019 2020 2021 2022 2023 2024
Sa les Quantity fish 100% 81.8 122.7 122.7 122.7 122.7 122.7 122.7 122.7 122.7 122.7
Sa les Price fish 100% 6.4 6.4 6.4 6.4 6.4 6.4 6.4 6.4 6.4 6.4 tons/year
Sa les Quantity fingerl 100% 3760.0 3760.0 3760.0 3760.0 3760.0 3760.0 3760.0 3760.0 3760.0 3760.0 KUSD/ton
Sa les Price fingerl 100% 0.08 0.08 0.08 0.08 0.08 0.08 0.08 0.08 0.08 0.08 number of fingerlings in 1000
Variable Cost fish 100% 0.5 KUSD/ton price per fingerling in 1000
Variable cost fingerl 100% 0.0
Fixed Cost 100% 390.6 000USD/year
Inventory Build-up 10
Debtors 40% of turnover
Creditors 70% of variable cost
Income T ax 12% of taxable profit
Dividend 100% of profit
Deprecia tion Buildings 2% of buildings
Deprecia tion Equipment 14% of equipment for 7 years
Deprecia tion Equipment 20% of equipment for 5 years
Deprecia tion Equipment 50% of equipment for 2 years
Deprecia tion Other Cost 20% of other cost
Loan Management Fee 2% of loan
Quim
32
UNU-Fisheries Training Programme
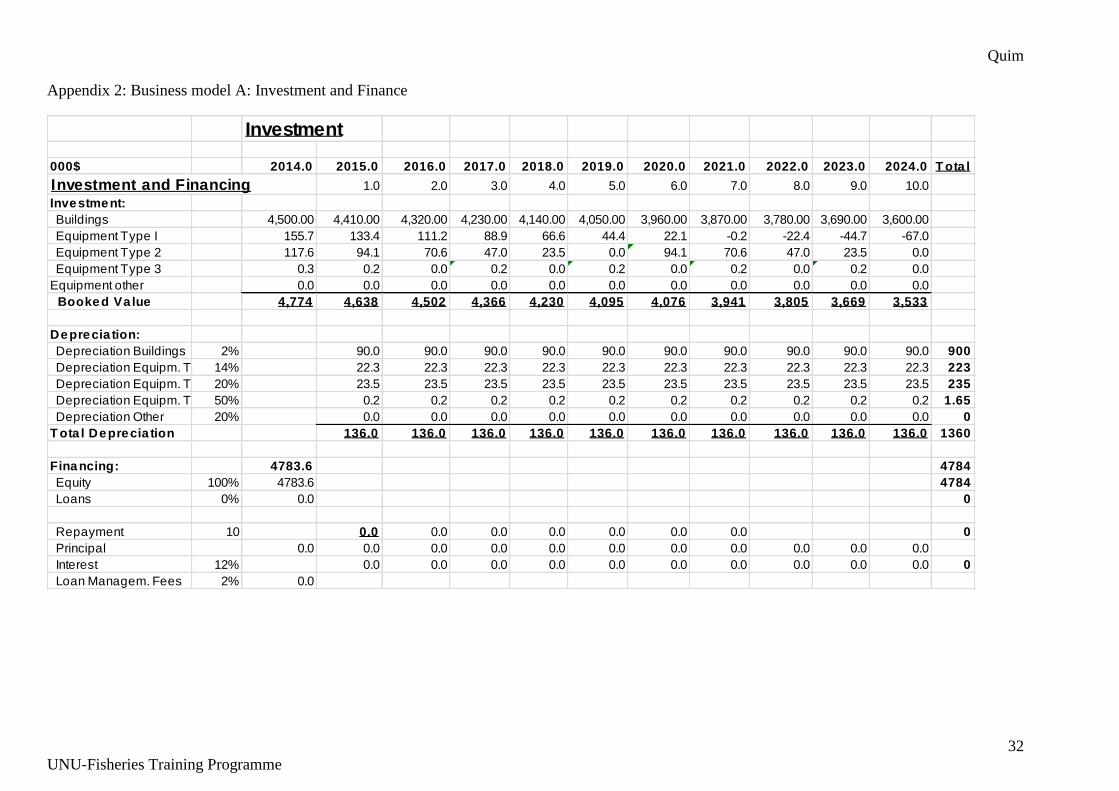
Appendix 2: Business model A: Investment and Finance
Investment
000$ 2014.0 2015.0 2016.0 2017.0 2018.0 2019.0 2020.0 2021.0 2022.0 2023.0 2024.0 T ota l
Investment and Financing 1.0 2.0 3.0 4.0 5.0 6.0 7.0 8.0 9.0 10.0
Investment:
Buildings 4,500.00 4,410.00 4,320.00 4,230.00 4,140.00 4,050.00 3,960.00 3,870.00 3,780.00 3,690.00 3,600.00
Equipment Type I 155.7 133.4 111.2 88.9 66.6 44.4 22.1 -0.2 -22.4 -44.7 -67.0
Equipment Type 2 117.6 94.1 70.6 47.0 23.5 0.0 94.1 70.6 47.0 23.5 0.0
Equipment Type 3 0.3 0.2 0.0 0.2 0.0 0.2 0.0 0.2 0.0 0.2 0.0
Equipment other 0.0 0.0 0.0 0.0 0.0 0.0 0.0 0.0 0.0 0.0 0.0
Booked Va lue 4,774 4,638 4,502 4,366 4,230 4,095 4,076 3,941 3,805 3,669 3,533
Deprecia tion:
Depreciation Buildings 2% 90.0 90.0 90.0 90.0 90.0 90.0 90.0 90.0 90.0 90.0 900
Depreciation Equipm. T1 14% 22.3 22.3 22.3 22.3 22.3 22.3 22.3 22.3 22.3 22.3 223
Depreciation Equipm. T2 20% 23.5 23.5 23.5 23.5 23.5 23.5 23.5 23.5 23.5 23.5 235
Depreciation Equipm. T2 50% 0.2 0.2 0.2 0.2 0.2 0.2 0.2 0.2 0.2 0.2 1.65
Depreciation Other 20% 0.0 0.0 0.0 0.0 0.0 0.0 0.0 0.0 0.0 0.0 0
T ota l Deprecia tion 136.0 136.0 136.0 136.0 136.0 136.0 136.0 136.0 136.0 136.0 1360
Financing: 4783.6 4784
Equity 100% 4783.6 4784
Loans 0% 0.0 0
Repayment 10 0.0 0.0 0.0 0.0 0.0 0.0 0.0 0
Principal 0.0 0.0 0.0 0.0 0.0 0.0 0.0 0.0 0.0 0.0 0.0
Interest 12% 0.0 0.0 0.0 0.0 0.0 0.0 0.0 0.0 0.0 0.0 0
Loan Managem. Fees 2% 0.0
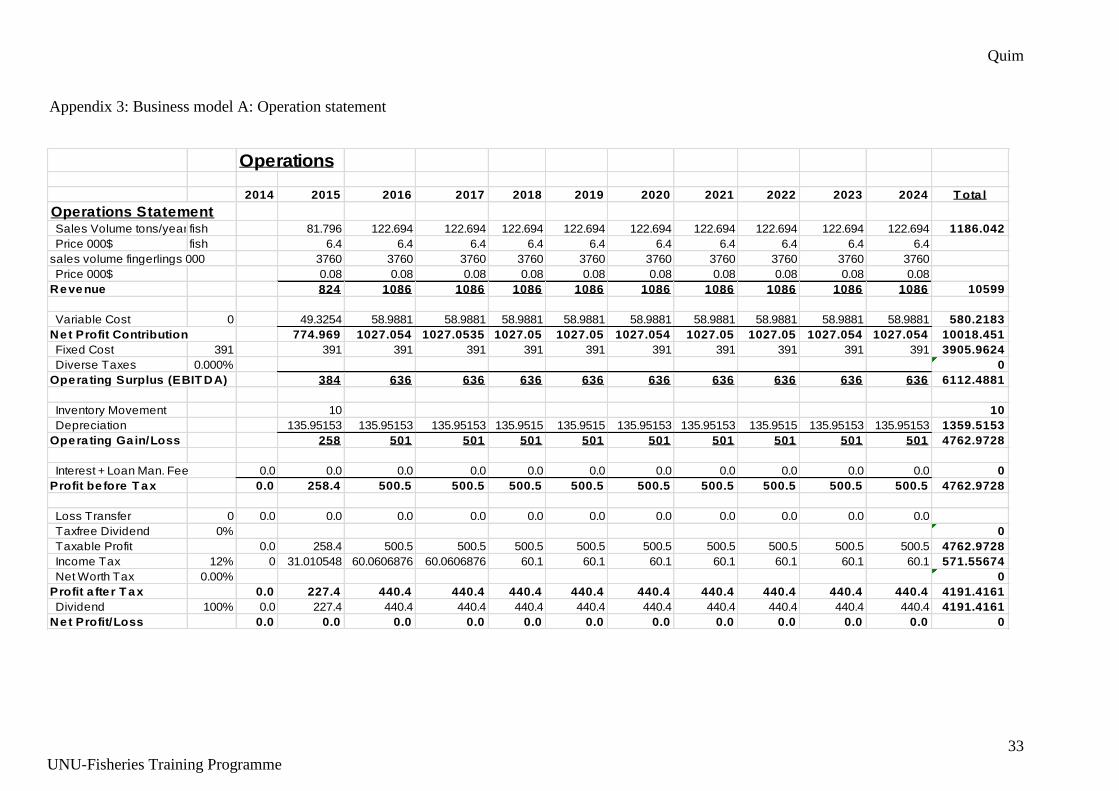
Quim
33
UNU-Fisheries Training Programme
Appendix 3: Business model A: Operation statement
Operations
2014 2015 2016 2017 2018 2019 2020 2021 2022 2023 2024 T ota l
Operations Statement Sales Volume tons/year fish 81.796 122.694 122.694 122.694 122.694 122.694 122.694 122.694 122.694 122.694 1186.042
Price 000$ fish 6.4 6.4 6.4 6.4 6.4 6.4 6.4 6.4 6.4 6.4
sales volume fingerlings 000 3760 3760 3760 3760 3760 3760 3760 3760 3760 3760
Price 000$ 0.08 0.08 0.08 0.08 0.08 0.08 0.08 0.08 0.08 0.08
Revenue 824 1086 1086 1086 1086 1086 1086 1086 1086 1086 10599
Variable Cost 0 49.3254 58.9881 58.9881 58.9881 58.9881 58.9881 58.9881 58.9881 58.9881 58.9881 580.2183
Net Profit Contribution 774.969 1027.054 1027.0535 1027.05 1027.05 1027.054 1027.05 1027.05 1027.054 1027.054 10018.451
Fixed Cost 391 391 391 391 391 391 391 391 391 391 391 3905.9624
Diverse Taxes 0.000% 0
Opera ting Surplus (EBIT DA) 384 636 636 636 636 636 636 636 636 636 6112.4881
Inventory Movement 10 10
Depreciation 135.95153 135.95153 135.95153 135.9515 135.9515 135.95153 135.95153 135.9515 135.95153 135.95153 1359.5153
Opera ting Ga in/Loss 258 501 501 501 501 501 501 501 501 501 4762.9728
Interest + Loan Man. Fee 0.0 0.0 0.0 0.0 0.0 0.0 0.0 0.0 0.0 0.0 0.0 0
Profit be fore T ax 0.0 258.4 500.5 500.5 500.5 500.5 500.5 500.5 500.5 500.5 500.5 4762.9728
Loss Transfer 0 0.0 0.0 0.0 0.0 0.0 0.0 0.0 0.0 0.0 0.0 0.0
Taxfree Dividend 0% 0
Taxable Profit 0.0 258.4 500.5 500.5 500.5 500.5 500.5 500.5 500.5 500.5 500.5 4762.9728
Income Tax 12% 0 31.010548 60.0606876 60.0606876 60.1 60.1 60.1 60.1 60.1 60.1 60.1 571.55674
Net Worth Tax 0.00% 0
Profit a fte r T ax 0.0 227.4 440.4 440.4 440.4 440.4 440.4 440.4 440.4 440.4 440.4 4191.4161
Dividend 100% 0.0 227.4 440.4 440.4 440.4 440.4 440.4 440.4 440.4 440.4 440.4 4191.4161
Net Profit/Loss 0.0 0.0 0.0 0.0 0.0 0.0 0.0 0.0 0.0 0.0 0.0 0
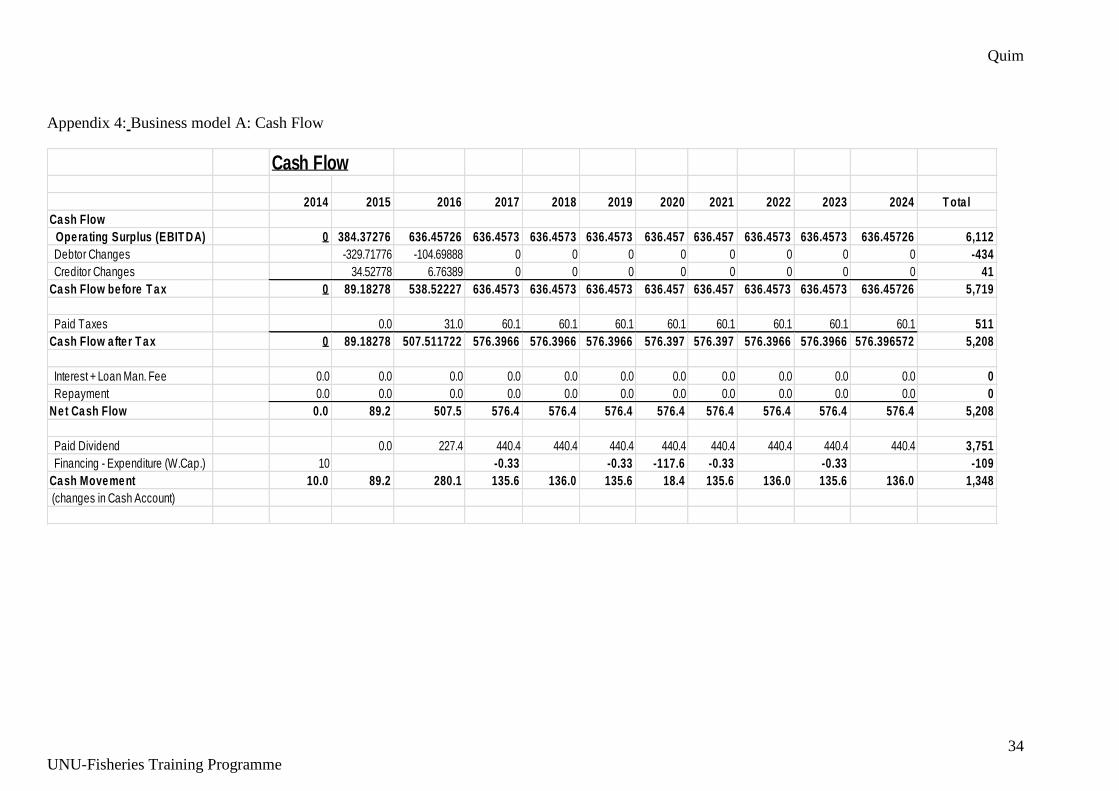
Quim
34
UNU-Fisheries Training Programme
Appendix 4: Business model A: Cash Flow
Cash Flow
2014 2015 2016 2017 2018 2019 2020 2021 2022 2023 2024 T ota l
Cash Flow
Opera ting Surplus (EBIT DA) 0 384.37276 636.45726 636.4573 636.4573 636.4573 636.457 636.457 636.4573 636.4573 636.45726 6,112
Debtor Changes -329.71776 -104.69888 0 0 0 0 0 0 0 0 -434
Creditor Changes 34.52778 6.76389 0 0 0 0 0 0 0 0 41
Cash Flow be fore T ax 0 89.18278 538.52227 636.4573 636.4573 636.4573 636.457 636.457 636.4573 636.4573 636.45726 5,719
Paid Taxes 0.0 31.0 60.1 60.1 60.1 60.1 60.1 60.1 60.1 60.1 511
Cash Flow a fte r T ax 0 89.18278 507.511722 576.3966 576.3966 576.3966 576.397 576.397 576.3966 576.3966 576.396572 5,208
Interest + Loan Man. Fee 0.0 0.0 0.0 0.0 0.0 0.0 0.0 0.0 0.0 0.0 0.0 0
Repayment 0.0 0.0 0.0 0.0 0.0 0.0 0.0 0.0 0.0 0.0 0.0 0
Net Cash Flow 0.0 89.2 507.5 576.4 576.4 576.4 576.4 576.4 576.4 576.4 576.4 5,208
Paid Dividend 0.0 227.4 440.4 440.4 440.4 440.4 440.4 440.4 440.4 440.4 3,751
Financing - Expenditure (W.Cap.) 10 -0.33 -0.33 -117.6 -0.33 -0.33 -109
Cash Movement 10.0 89.2 280.1 135.6 136.0 135.6 18.4 135.6 136.0 135.6 136.0 1,348
(changes in Cash Account)
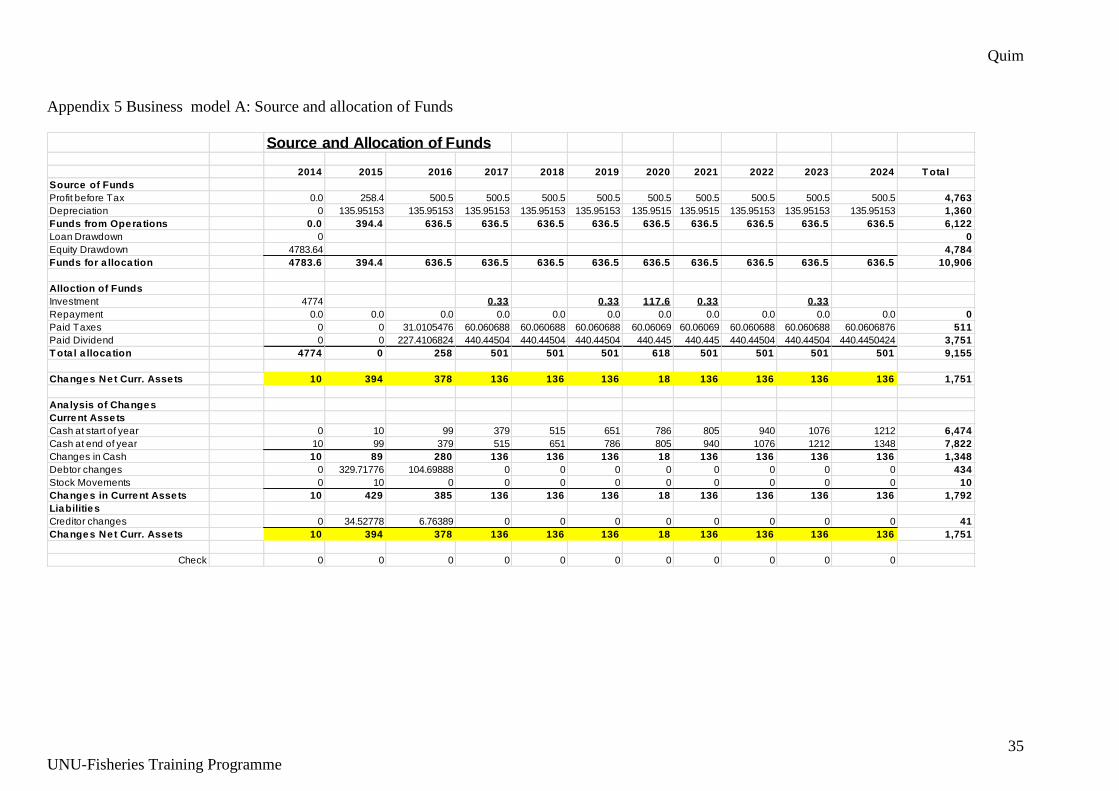
Quim
35
UNU-Fisheries Training Programme
Appendix 5 Business model A: Source and allocation of Funds
Source and Allocation of Funds
2014 2015 2016 2017 2018 2019 2020 2021 2022 2023 2024 T ota l
Source of Funds
Profit before Tax 0.0 258.4 500.5 500.5 500.5 500.5 500.5 500.5 500.5 500.5 500.5 4,763
Depreciation 0 135.95153 135.95153 135.95153 135.95153 135.95153 135.9515 135.9515 135.95153 135.95153 135.95153 1,360
Funds from Opera tions 0.0 394.4 636.5 636.5 636.5 636.5 636.5 636.5 636.5 636.5 636.5 6,122
Loan Drawdown 0 0
Equity Drawdown 4783.64 4,784
Funds for a lloca tion 4783.6 394.4 636.5 636.5 636.5 636.5 636.5 636.5 636.5 636.5 636.5 10,906
Alloction of Funds
Investment 4774 0.33 0.33 117.6 0.33 0.33
Repayment 0.0 0.0 0.0 0.0 0.0 0.0 0.0 0.0 0.0 0.0 0.0 0
Paid Taxes 0 0 31.0105476 60.060688 60.060688 60.060688 60.06069 60.06069 60.060688 60.060688 60.0606876 511
Paid Dividend 0 0 227.4106824 440.44504 440.44504 440.44504 440.445 440.445 440.44504 440.44504 440.4450424 3,751
T ota l a lloca tion 4774 0 258 501 501 501 618 501 501 501 501 9,155
Changes Net Curr. Asse ts 10 394 378 136 136 136 18 136 136 136 136 1,751
Ana lysis of Changes
Current Asse ts
Cash at start of year 0 10 99 379 515 651 786 805 940 1076 1212 6,474
Cash at end of year 10 99 379 515 651 786 805 940 1076 1212 1348 7,822
Changes in Cash 10 89 280 136 136 136 18 136 136 136 136 1,348
Debtor changes 0 329.71776 104.69888 0 0 0 0 0 0 0 0 434
Stock Movements 0 10 0 0 0 0 0 0 0 0 0 10
Changes in Current Asse ts 10 429 385 136 136 136 18 136 136 136 136 1,792
Liabilities
Creditor changes 0 34.52778 6.76389 0 0 0 0 0 0 0 0 41
Changes Net Curr. Asse ts 10 394 378 136 136 136 18 136 136 136 136 1,751
Check 0 0 0 0 0 0 0 0 0 0 0
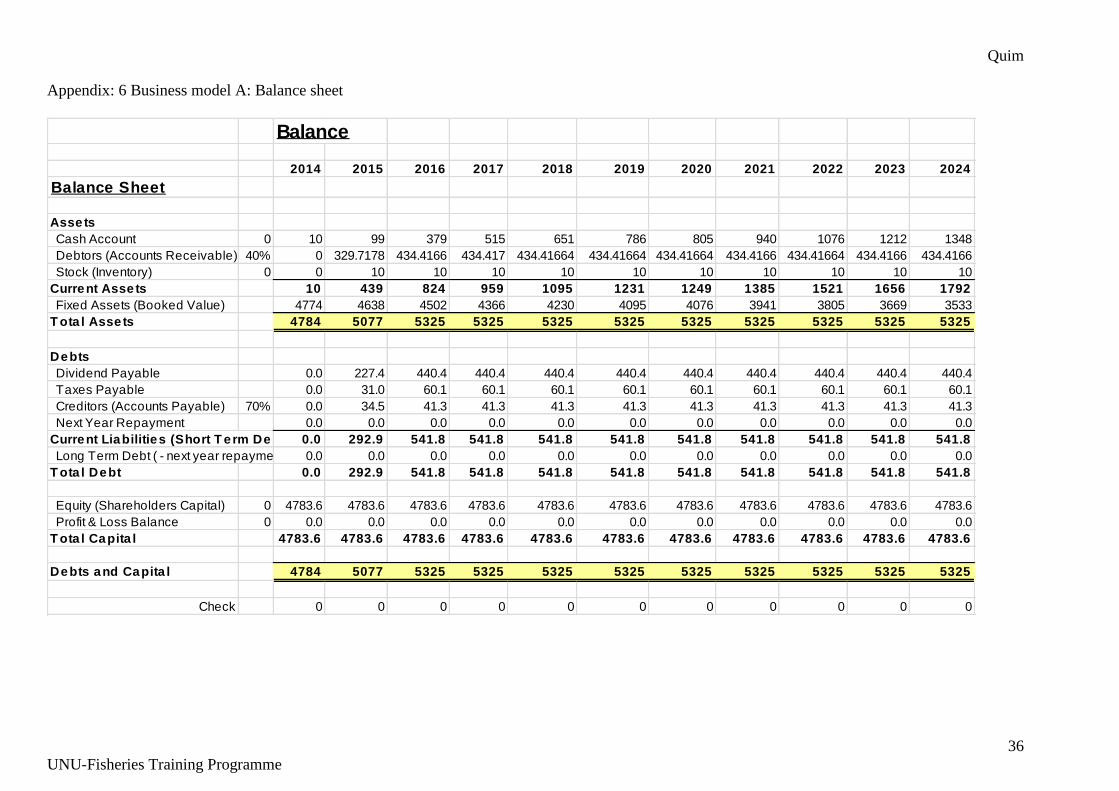
Quim
36
UNU-Fisheries Training Programme
Appendix: 6 Business model A: Balance sheet
Balance
2014 2015 2016 2017 2018 2019 2020 2021 2022 2023 2024
Balance Sheet
Assets
Cash Account 0 10 99 379 515 651 786 805 940 1076 1212 1348
Debtors (Accounts Receivable) 40% 0 329.7178 434.4166 434.417 434.41664 434.41664 434.41664 434.4166 434.41664 434.4166 434.4166
Stock (Inventory) 0 0 10 10 10 10 10 10 10 10 10 10
Current Asse ts 10 439 824 959 1095 1231 1249 1385 1521 1656 1792
Fixed Assets (Booked Value) 4774 4638 4502 4366 4230 4095 4076 3941 3805 3669 3533
T ota l Asse ts 4784 5077 5325 5325 5325 5325 5325 5325 5325 5325 5325
Debts
Dividend Payable 0.0 227.4 440.4 440.4 440.4 440.4 440.4 440.4 440.4 440.4 440.4
Taxes Payable 0.0 31.0 60.1 60.1 60.1 60.1 60.1 60.1 60.1 60.1 60.1
Creditors (Accounts Payable) 70% 0.0 34.5 41.3 41.3 41.3 41.3 41.3 41.3 41.3 41.3 41.3
Next Year Repayment 0.0 0.0 0.0 0.0 0.0 0.0 0.0 0.0 0.0 0.0 0.0
Current Liabilities (Short T erm Debt) 0.0 292.9 541.8 541.8 541.8 541.8 541.8 541.8 541.8 541.8 541.8
Long Term Debt ( - next year repayment) 0.0 0.0 0.0 0.0 0.0 0.0 0.0 0.0 0.0 0.0 0.0
T ota l Debt 0.0 292.9 541.8 541.8 541.8 541.8 541.8 541.8 541.8 541.8 541.8
Equity (Shareholders Capital) 0 4783.6 4783.6 4783.6 4783.6 4783.6 4783.6 4783.6 4783.6 4783.6 4783.6 4783.6
Profit & Loss Balance 0 0.0 0.0 0.0 0.0 0.0 0.0 0.0 0.0 0.0 0.0 0.0
T ota l Capita l 4783.6 4783.6 4783.6 4783.6 4783.6 4783.6 4783.6 4783.6 4783.6 4783.6 4783.6
Debts and Capita l 4784 5077 5325 5325 5325 5325 5325 5325 5325 5325 5325
Check 0 0 0 0 0 0 0 0 0 0 0
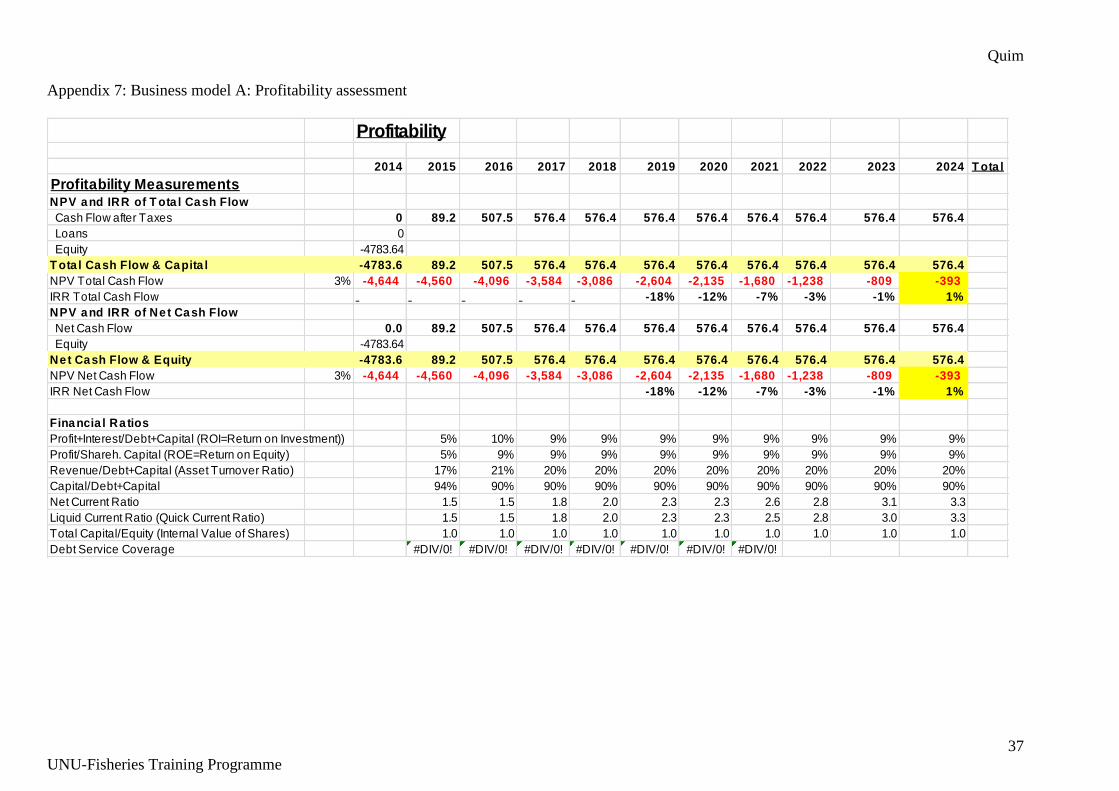
Quim
37
UNU-Fisheries Training Programme
Appendix 7: Business model A: Profitability assessment
Profitability
2014 2015 2016 2017 2018 2019 2020 2021 2022 2023 2024 T ota l
Profitability MeasurementsNPV and IRR of T ota l Cash Flow
Cash Flow after Taxes 0 89.2 507.5 576.4 576.4 576.4 576.4 576.4 576.4 576.4 576.4
Loans 0
Equity -4783.64
T ota l Cash Flow & Capita l -4783.6 89.2 507.5 576.4 576.4 576.4 576.4 576.4 576.4 576.4 576.4
NPV Total Cash Flow 3% -4,644 -4,560 -4,096 -3,584 -3,086 -2,604 -2,135 -1,680 -1,238 -809 -393
IRR Total Cash Flow -18% -12% -7% -3% -1% 1%
NPV and IRR of Ne t Cash Flow
Net Cash Flow 0.0 89.2 507.5 576.4 576.4 576.4 576.4 576.4 576.4 576.4 576.4
Equity -4783.64
Net Cash Flow & Equity -4783.6 89.2 507.5 576.4 576.4 576.4 576.4 576.4 576.4 576.4 576.4
NPV Net Cash Flow 3% -4,644 -4,560 -4,096 -3,584 -3,086 -2,604 -2,135 -1,680 -1,238 -809 -393
IRR Net Cash Flow -18% -12% -7% -3% -1% 1%
Financia l Ra tios
Profit+Interest/Debt+Capital (ROI=Return on Investment)) 5% 10% 9% 9% 9% 9% 9% 9% 9% 9%
Profit/Shareh. Capital (ROE=Return on Equity) 5% 9% 9% 9% 9% 9% 9% 9% 9% 9%
Revenue/Debt+Capital (Asset Turnover Ratio) 17% 21% 20% 20% 20% 20% 20% 20% 20% 20%
Capital/Debt+Capital 94% 90% 90% 90% 90% 90% 90% 90% 90% 90%
Net Current Ratio 1.5 1.5 1.8 2.0 2.3 2.3 2.6 2.8 3.1 3.3
Liquid Current Ratio (Quick Current Ratio) 1.5 1.5 1.8 2.0 2.3 2.3 2.5 2.8 3.0 3.3
Total Capital/Equity (Internal Value of Shares) 1.0 1.0 1.0 1.0 1.0 1.0 1.0 1.0 1.0 1.0
Debt Service Coverage #DIV/0! #DIV/0! #DIV/0! #DIV/0! #DIV/0! #DIV/0! #DIV/0!
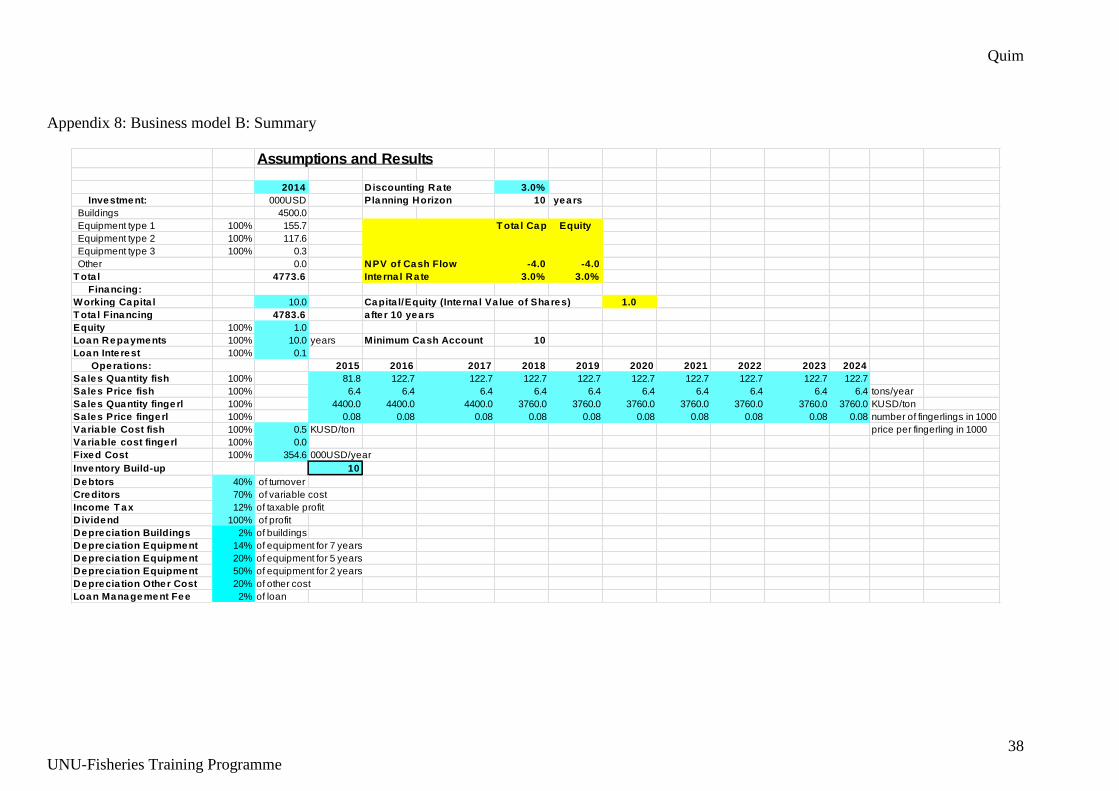
Quim
38
UNU-Fisheries Training Programme
Appendix 8: Business model B: Summary
Assumptions and Results
2014 Discounting Rate 3.0%
Investment: 000USD Planning Horizon 10 years
Buildings 4500.0
Equipment type 1 100% 155.7 T ota l Cap. Equity
Equipment type 2 100% 117.6
Equipment type 3 100% 0.3
Other 0.0 NPV of Cash Flow -4.0 -4.0
T ota l 4773.6 Inte rna l Ra te 3.0% 3.0%
Financing:
Working Capita l 10.0 Capita l/Equity (Inte rna l Va lue of Shares) 1.0
T ota l Financing 4783.6 a fte r 10 years
Equity 100% 1.0
Loan Repayments 100% 10.0 years Minimum Cash Account 10
Loan Inte rest 100% 0.1
Opera tions: 2015 2016 2017 2018 2019 2020 2021 2022 2023 2024
Sa les Quantity fish 100% 81.8 122.7 122.7 122.7 122.7 122.7 122.7 122.7 122.7 122.7
Sa les Price fish 100% 6.4 6.4 6.4 6.4 6.4 6.4 6.4 6.4 6.4 6.4 tons/year
Sa les Quantity fingerl 100% 4400.0 4400.0 4400.0 3760.0 3760.0 3760.0 3760.0 3760.0 3760.0 3760.0 KUSD/ton
Sa les Price fingerl 100% 0.08 0.08 0.08 0.08 0.08 0.08 0.08 0.08 0.08 0.08 number of fingerlings in 1000
Variable Cost fish 100% 0.5 KUSD/ton price per fingerling in 1000
Variable cost fingerl 100% 0.0
Fixed Cost 100% 354.6 000USD/year
Inventory Build-up 10
Debtors 40% of turnover
Creditors 70% of variable cost
Income T ax 12% of taxable profit
Dividend 100% of profit
Deprecia tion Buildings 2% of buildings
Deprecia tion Equipment 14% of equipment for 7 years
Deprecia tion Equipment 20% of equipment for 5 years
Deprecia tion Equipment 50% of equipment for 2 years
Deprecia tion Other Cost 20% of other cost
Loan Management Fee 2% of loan
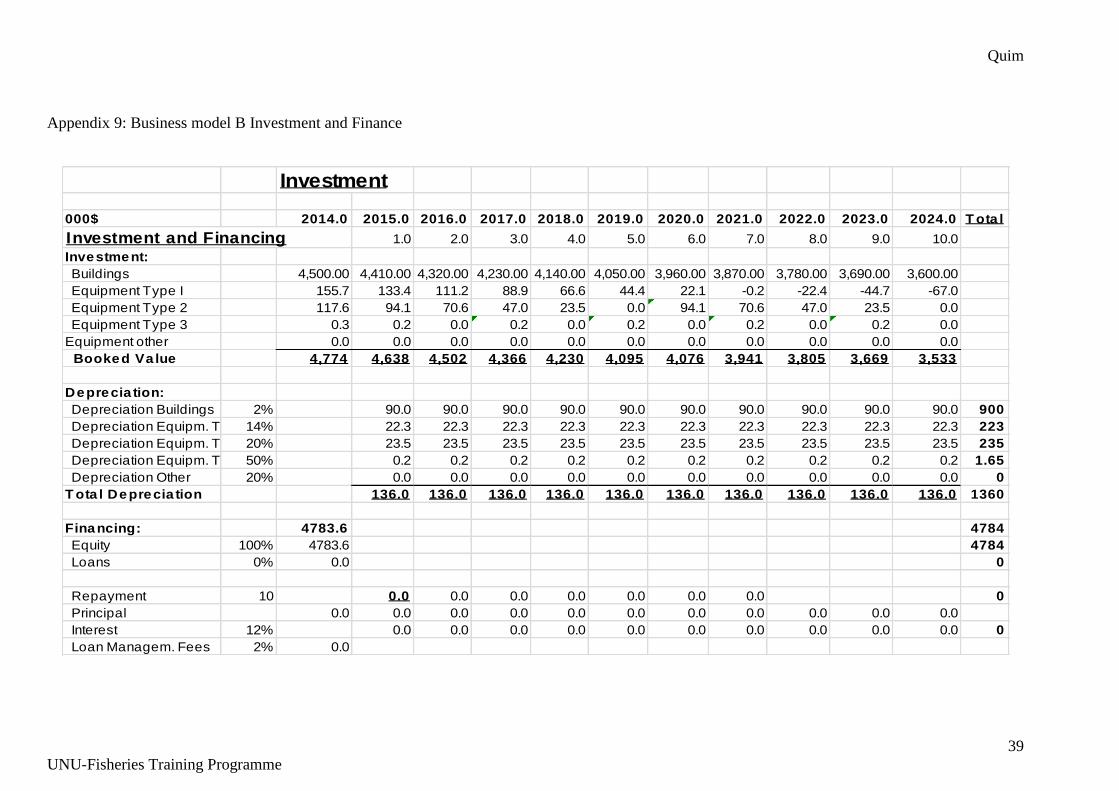
Quim
39
UNU-Fisheries Training Programme
Appendix 9: Business model B Investment and Finance
Investment
000$ 2014.0 2015.0 2016.0 2017.0 2018.0 2019.0 2020.0 2021.0 2022.0 2023.0 2024.0 T ota l
Investment and Financing 1.0 2.0 3.0 4.0 5.0 6.0 7.0 8.0 9.0 10.0
Investment:
Buildings 4,500.00 4,410.00 4,320.00 4,230.00 4,140.00 4,050.00 3,960.00 3,870.00 3,780.00 3,690.00 3,600.00
Equipment Type I 155.7 133.4 111.2 88.9 66.6 44.4 22.1 -0.2 -22.4 -44.7 -67.0
Equipment Type 2 117.6 94.1 70.6 47.0 23.5 0.0 94.1 70.6 47.0 23.5 0.0
Equipment Type 3 0.3 0.2 0.0 0.2 0.0 0.2 0.0 0.2 0.0 0.2 0.0
Equipment other 0.0 0.0 0.0 0.0 0.0 0.0 0.0 0.0 0.0 0.0 0.0
Booked Va lue 4,774 4,638 4,502 4,366 4,230 4,095 4,076 3,941 3,805 3,669 3,533
Deprecia tion:
Depreciation Buildings 2% 90.0 90.0 90.0 90.0 90.0 90.0 90.0 90.0 90.0 90.0 900
Depreciation Equipm. T1 14% 22.3 22.3 22.3 22.3 22.3 22.3 22.3 22.3 22.3 22.3 223
Depreciation Equipm. T2 20% 23.5 23.5 23.5 23.5 23.5 23.5 23.5 23.5 23.5 23.5 235
Depreciation Equipm. T2 50% 0.2 0.2 0.2 0.2 0.2 0.2 0.2 0.2 0.2 0.2 1.65
Depreciation Other 20% 0.0 0.0 0.0 0.0 0.0 0.0 0.0 0.0 0.0 0.0 0
T ota l Deprecia tion 136.0 136.0 136.0 136.0 136.0 136.0 136.0 136.0 136.0 136.0 1360
Financing: 4783.6 4784
Equity 100% 4783.6 4784
Loans 0% 0.0 0
Repayment 10 0.0 0.0 0.0 0.0 0.0 0.0 0.0 0
Principal 0.0 0.0 0.0 0.0 0.0 0.0 0.0 0.0 0.0 0.0 0.0
Interest 12% 0.0 0.0 0.0 0.0 0.0 0.0 0.0 0.0 0.0 0.0 0
Loan Managem. Fees 2% 0.0
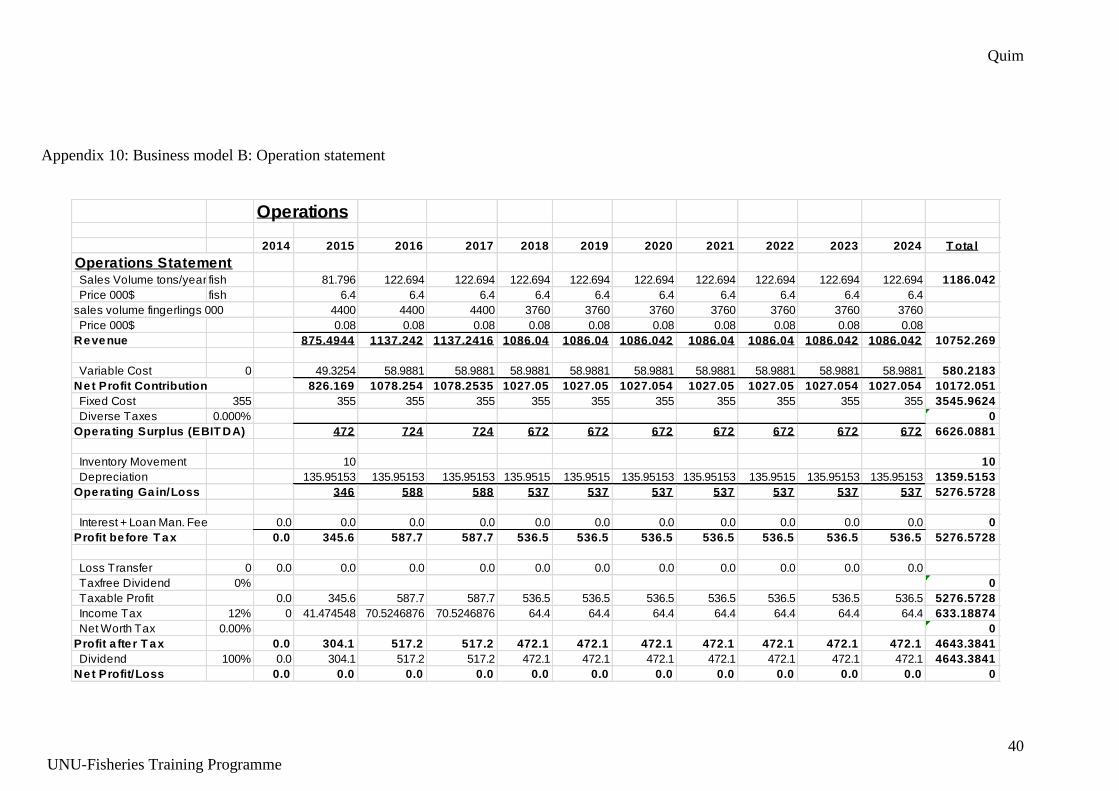
Quim
40
UNU-Fisheries Training Programme
Appendix 10: Business model B: Operation statement
Operations
2014 2015 2016 2017 2018 2019 2020 2021 2022 2023 2024 T ota l
Operations Statement Sales Volume tons/year fish 81.796 122.694 122.694 122.694 122.694 122.694 122.694 122.694 122.694 122.694 1186.042
Price 000$ fish 6.4 6.4 6.4 6.4 6.4 6.4 6.4 6.4 6.4 6.4
sales volume fingerlings 000 4400 4400 4400 3760 3760 3760 3760 3760 3760 3760
Price 000$ 0.08 0.08 0.08 0.08 0.08 0.08 0.08 0.08 0.08 0.08
Revenue 875.4944 1137.242 1137.2416 1086.04 1086.04 1086.042 1086.04 1086.04 1086.042 1086.042 10752.269
Variable Cost 0 49.3254 58.9881 58.9881 58.9881 58.9881 58.9881 58.9881 58.9881 58.9881 58.9881 580.2183
Net Profit Contribution 826.169 1078.254 1078.2535 1027.05 1027.05 1027.054 1027.05 1027.05 1027.054 1027.054 10172.051
Fixed Cost 355 355 355 355 355 355 355 355 355 355 355 3545.9624
Diverse Taxes 0.000% 0
Opera ting Surplus (EBIT DA) 472 724 724 672 672 672 672 672 672 672 6626.0881
Inventory Movement 10 10
Depreciation 135.95153 135.95153 135.95153 135.9515 135.9515 135.95153 135.95153 135.9515 135.95153 135.95153 1359.5153
Opera ting Ga in/Loss 346 588 588 537 537 537 537 537 537 537 5276.5728
Interest + Loan Man. Fee 0.0 0.0 0.0 0.0 0.0 0.0 0.0 0.0 0.0 0.0 0.0 0
Profit be fore T ax 0.0 345.6 587.7 587.7 536.5 536.5 536.5 536.5 536.5 536.5 536.5 5276.5728
Loss Transfer 0 0.0 0.0 0.0 0.0 0.0 0.0 0.0 0.0 0.0 0.0 0.0
Taxfree Dividend 0% 0
Taxable Profit 0.0 345.6 587.7 587.7 536.5 536.5 536.5 536.5 536.5 536.5 536.5 5276.5728
Income Tax 12% 0 41.474548 70.5246876 70.5246876 64.4 64.4 64.4 64.4 64.4 64.4 64.4 633.18874
Net Worth Tax 0.00% 0
Profit a fte r T ax 0.0 304.1 517.2 517.2 472.1 472.1 472.1 472.1 472.1 472.1 472.1 4643.3841
Dividend 100% 0.0 304.1 517.2 517.2 472.1 472.1 472.1 472.1 472.1 472.1 472.1 4643.3841
Net Profit/Loss 0.0 0.0 0.0 0.0 0.0 0.0 0.0 0.0 0.0 0.0 0.0 0
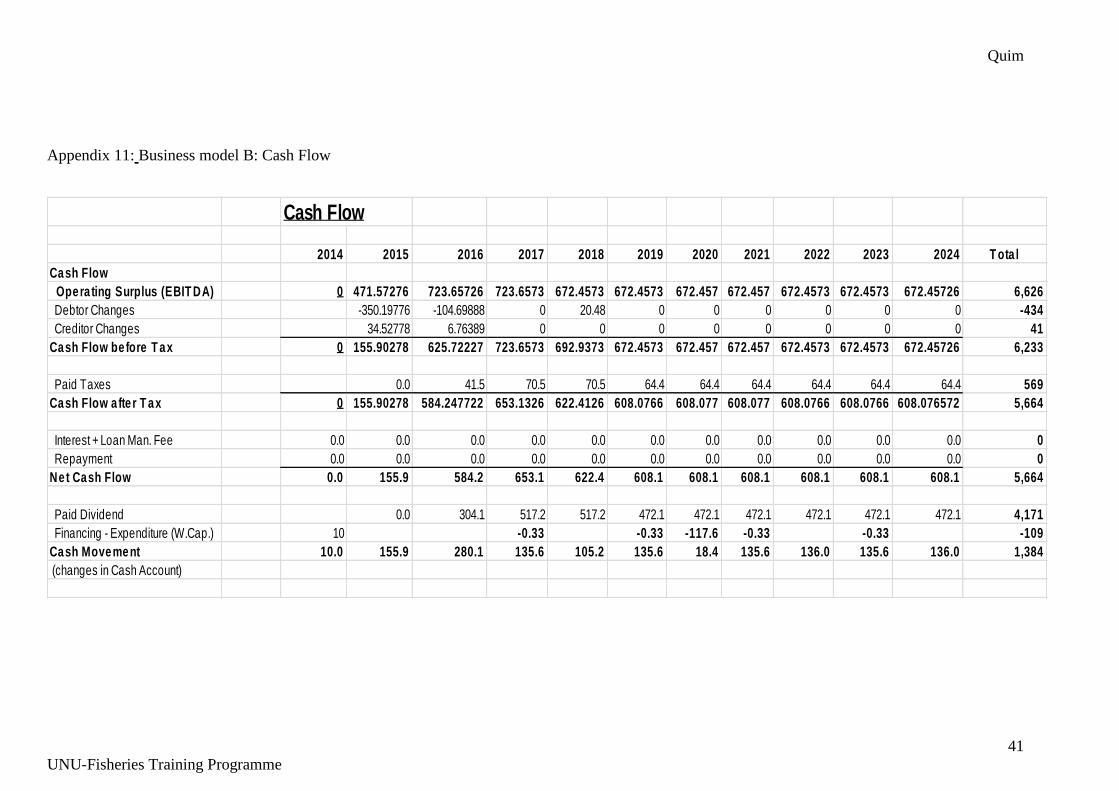
Quim
41
UNU-Fisheries Training Programme
Appendix 11: Business model B: Cash Flow
Cash Flow
2014 2015 2016 2017 2018 2019 2020 2021 2022 2023 2024 T ota l
Cash Flow
Opera ting Surplus (EBIT DA) 0 471.57276 723.65726 723.6573 672.4573 672.4573 672.457 672.457 672.4573 672.4573 672.45726 6,626
Debtor Changes -350.19776 -104.69888 0 20.48 0 0 0 0 0 0 -434
Creditor Changes 34.52778 6.76389 0 0 0 0 0 0 0 0 41
Cash Flow be fore T ax 0 155.90278 625.72227 723.6573 692.9373 672.4573 672.457 672.457 672.4573 672.4573 672.45726 6,233
Paid Taxes 0.0 41.5 70.5 70.5 64.4 64.4 64.4 64.4 64.4 64.4 569
Cash Flow a fte r T ax 0 155.90278 584.247722 653.1326 622.4126 608.0766 608.077 608.077 608.0766 608.0766 608.076572 5,664
Interest + Loan Man. Fee 0.0 0.0 0.0 0.0 0.0 0.0 0.0 0.0 0.0 0.0 0.0 0
Repayment 0.0 0.0 0.0 0.0 0.0 0.0 0.0 0.0 0.0 0.0 0.0 0
Net Cash Flow 0.0 155.9 584.2 653.1 622.4 608.1 608.1 608.1 608.1 608.1 608.1 5,664
Paid Dividend 0.0 304.1 517.2 517.2 472.1 472.1 472.1 472.1 472.1 472.1 4,171
Financing - Expenditure (W.Cap.) 10 -0.33 -0.33 -117.6 -0.33 -0.33 -109
Cash Movement 10.0 155.9 280.1 135.6 105.2 135.6 18.4 135.6 136.0 135.6 136.0 1,384
(changes in Cash Account)
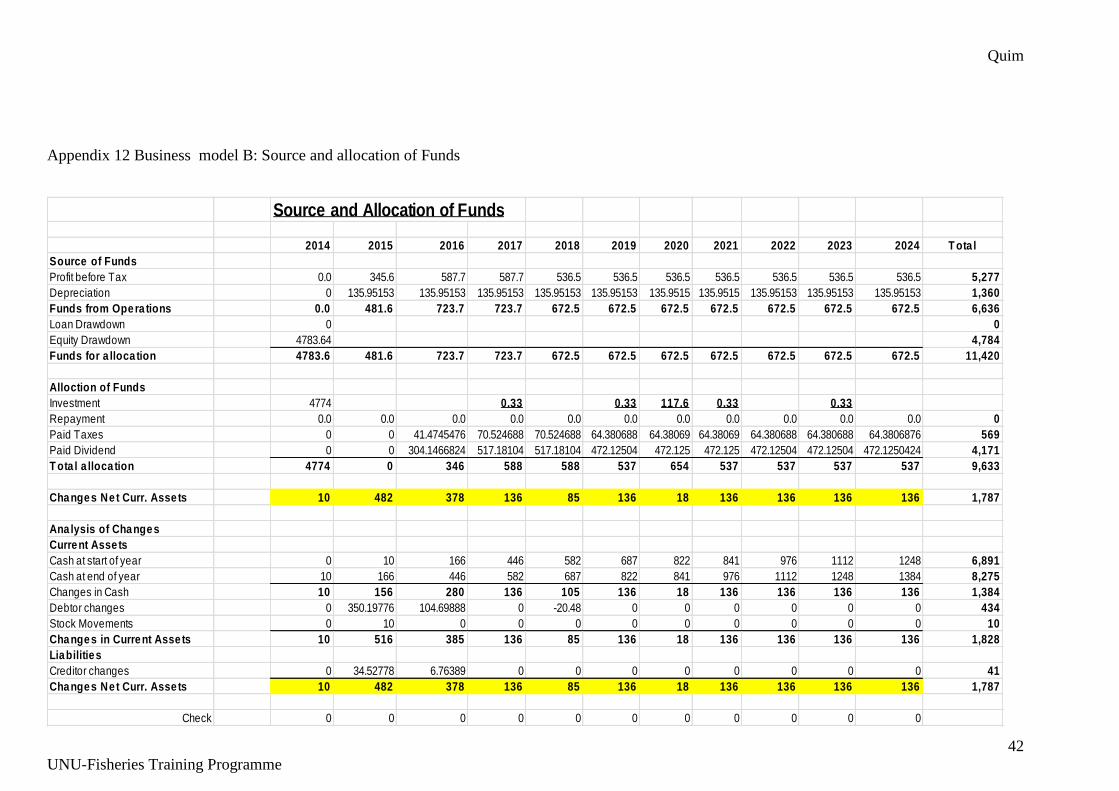
Quim
42
UNU-Fisheries Training Programme
Appendix 12 Business model B: Source and allocation of Funds
Source and Allocation of Funds
2014 2015 2016 2017 2018 2019 2020 2021 2022 2023 2024 T ota l
Source of Funds
Profit before Tax 0.0 345.6 587.7 587.7 536.5 536.5 536.5 536.5 536.5 536.5 536.5 5,277
Depreciation 0 135.95153 135.95153 135.95153 135.95153 135.95153 135.9515 135.9515 135.95153 135.95153 135.95153 1,360
Funds from Opera tions 0.0 481.6 723.7 723.7 672.5 672.5 672.5 672.5 672.5 672.5 672.5 6,636
Loan Drawdown 0 0
Equity Drawdown 4783.64 4,784
Funds for a lloca tion 4783.6 481.6 723.7 723.7 672.5 672.5 672.5 672.5 672.5 672.5 672.5 11,420
Alloction of Funds
Investment 4774 0.33 0.33 117.6 0.33 0.33
Repayment 0.0 0.0 0.0 0.0 0.0 0.0 0.0 0.0 0.0 0.0 0.0 0
Paid Taxes 0 0 41.4745476 70.524688 70.524688 64.380688 64.38069 64.38069 64.380688 64.380688 64.3806876 569
Paid Dividend 0 0 304.1466824 517.18104 517.18104 472.12504 472.125 472.125 472.12504 472.12504 472.1250424 4,171
T ota l a lloca tion 4774 0 346 588 588 537 654 537 537 537 537 9,633
Changes Net Curr. Asse ts 10 482 378 136 85 136 18 136 136 136 136 1,787
Ana lysis of Changes
Current Asse ts
Cash at start of year 0 10 166 446 582 687 822 841 976 1112 1248 6,891
Cash at end of year 10 166 446 582 687 822 841 976 1112 1248 1384 8,275
Changes in Cash 10 156 280 136 105 136 18 136 136 136 136 1,384
Debtor changes 0 350.19776 104.69888 0 -20.48 0 0 0 0 0 0 434
Stock Movements 0 10 0 0 0 0 0 0 0 0 0 10
Changes in Current Asse ts 10 516 385 136 85 136 18 136 136 136 136 1,828
Liabilities
Creditor changes 0 34.52778 6.76389 0 0 0 0 0 0 0 0 41
Changes Net Curr. Asse ts 10 482 378 136 85 136 18 136 136 136 136 1,787
Check 0 0 0 0 0 0 0 0 0 0 0
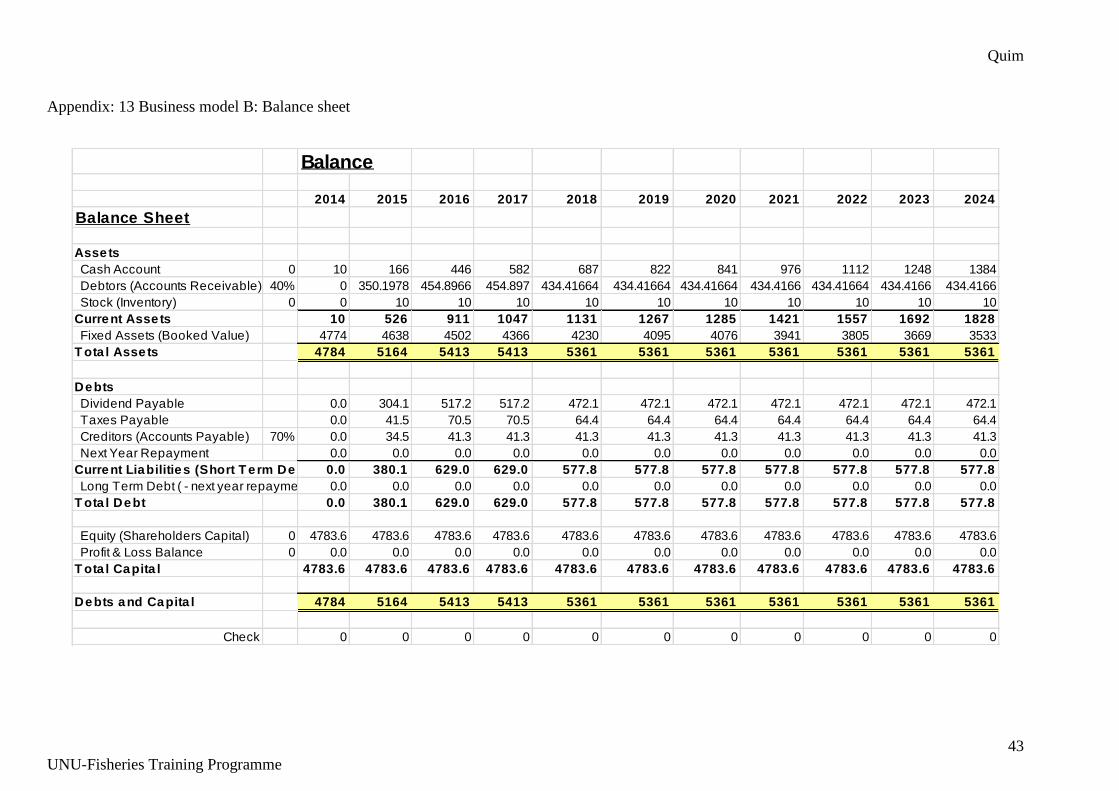
Quim
43
UNU-Fisheries Training Programme
Appendix: 13 Business model B: Balance sheet
Balance
2014 2015 2016 2017 2018 2019 2020 2021 2022 2023 2024
Balance Sheet
Assets
Cash Account 0 10 166 446 582 687 822 841 976 1112 1248 1384
Debtors (Accounts Receivable) 40% 0 350.1978 454.8966 454.897 434.41664 434.41664 434.41664 434.4166 434.41664 434.4166 434.4166
Stock (Inventory) 0 0 10 10 10 10 10 10 10 10 10 10
Current Asse ts 10 526 911 1047 1131 1267 1285 1421 1557 1692 1828
Fixed Assets (Booked Value) 4774 4638 4502 4366 4230 4095 4076 3941 3805 3669 3533
T ota l Asse ts 4784 5164 5413 5413 5361 5361 5361 5361 5361 5361 5361
Debts
Dividend Payable 0.0 304.1 517.2 517.2 472.1 472.1 472.1 472.1 472.1 472.1 472.1
Taxes Payable 0.0 41.5 70.5 70.5 64.4 64.4 64.4 64.4 64.4 64.4 64.4
Creditors (Accounts Payable) 70% 0.0 34.5 41.3 41.3 41.3 41.3 41.3 41.3 41.3 41.3 41.3
Next Year Repayment 0.0 0.0 0.0 0.0 0.0 0.0 0.0 0.0 0.0 0.0 0.0
Current Liabilities (Short T erm Debt) 0.0 380.1 629.0 629.0 577.8 577.8 577.8 577.8 577.8 577.8 577.8
Long Term Debt ( - next year repayment) 0.0 0.0 0.0 0.0 0.0 0.0 0.0 0.0 0.0 0.0 0.0
T ota l Debt 0.0 380.1 629.0 629.0 577.8 577.8 577.8 577.8 577.8 577.8 577.8
Equity (Shareholders Capital) 0 4783.6 4783.6 4783.6 4783.6 4783.6 4783.6 4783.6 4783.6 4783.6 4783.6 4783.6
Profit & Loss Balance 0 0.0 0.0 0.0 0.0 0.0 0.0 0.0 0.0 0.0 0.0 0.0
T ota l Capita l 4783.6 4783.6 4783.6 4783.6 4783.6 4783.6 4783.6 4783.6 4783.6 4783.6 4783.6
Debts and Capita l 4784 5164 5413 5413 5361 5361 5361 5361 5361 5361 5361
Check 0 0 0 0 0 0 0 0 0 0 0
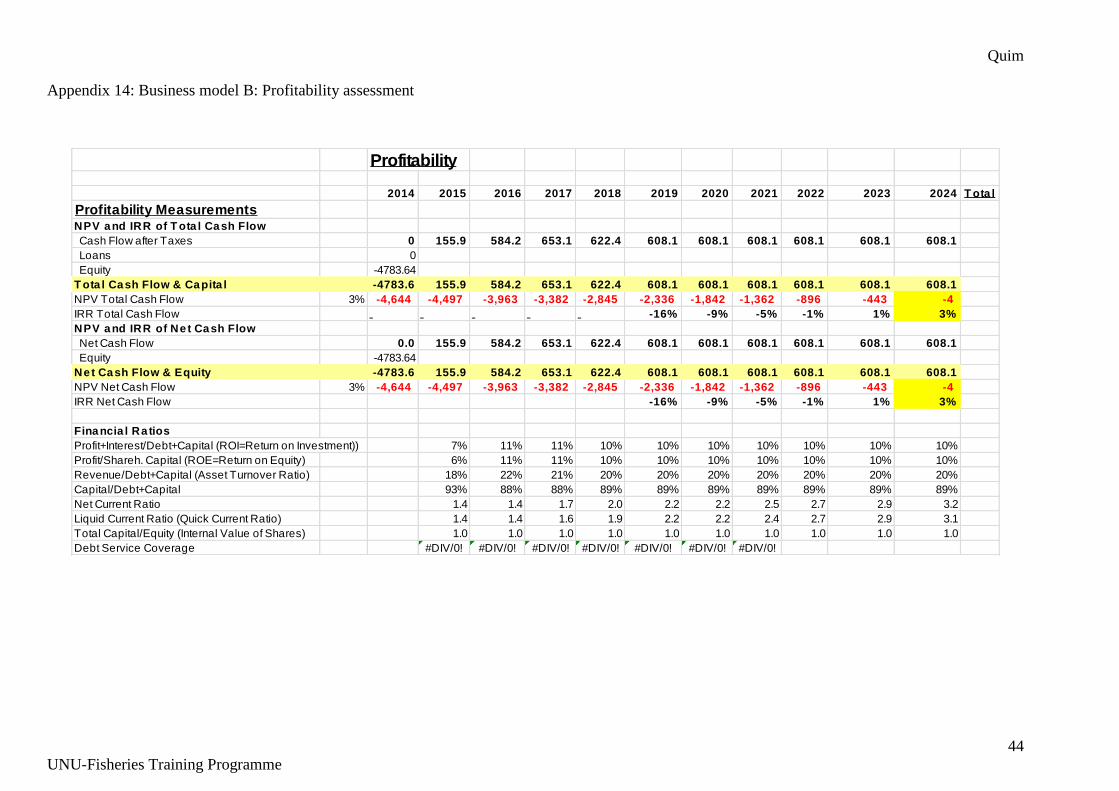
Quim
44
UNU-Fisheries Training Programme
Appendix 14: Business model B: Profitability assessment
Profitability
2014 2015 2016 2017 2018 2019 2020 2021 2022 2023 2024 T ota l
Profitability MeasurementsNPV and IRR of T ota l Cash Flow
Cash Flow after Taxes 0 155.9 584.2 653.1 622.4 608.1 608.1 608.1 608.1 608.1 608.1
Loans 0
Equity -4783.64
T ota l Cash Flow & Capita l -4783.6 155.9 584.2 653.1 622.4 608.1 608.1 608.1 608.1 608.1 608.1
NPV Total Cash Flow 3% -4,644 -4,497 -3,963 -3,382 -2,845 -2,336 -1,842 -1,362 -896 -443 -4
IRR Total Cash Flow -16% -9% -5% -1% 1% 3%
NPV and IRR of Ne t Cash Flow
Net Cash Flow 0.0 155.9 584.2 653.1 622.4 608.1 608.1 608.1 608.1 608.1 608.1
Equity -4783.64
Net Cash Flow & Equity -4783.6 155.9 584.2 653.1 622.4 608.1 608.1 608.1 608.1 608.1 608.1
NPV Net Cash Flow 3% -4,644 -4,497 -3,963 -3,382 -2,845 -2,336 -1,842 -1,362 -896 -443 -4
IRR Net Cash Flow -16% -9% -5% -1% 1% 3%
Financia l Ra tios
Profit+Interest/Debt+Capital (ROI=Return on Investment)) 7% 11% 11% 10% 10% 10% 10% 10% 10% 10%
Profit/Shareh. Capital (ROE=Return on Equity) 6% 11% 11% 10% 10% 10% 10% 10% 10% 10%
Revenue/Debt+Capital (Asset Turnover Ratio) 18% 22% 21% 20% 20% 20% 20% 20% 20% 20%
Capital/Debt+Capital 93% 88% 88% 89% 89% 89% 89% 89% 89% 89%
Net Current Ratio 1.4 1.4 1.7 2.0 2.2 2.2 2.5 2.7 2.9 3.2
Liquid Current Ratio (Quick Current Ratio) 1.4 1.4 1.6 1.9 2.2 2.2 2.4 2.7 2.9 3.1
Total Capital/Equity (Internal Value of Shares) 1.0 1.0 1.0 1.0 1.0 1.0 1.0 1.0 1.0 1.0
Debt Service Coverage #DIV/0! #DIV/0! #DIV/0! #DIV/0! #DIV/0! #DIV/0! #DIV/0!
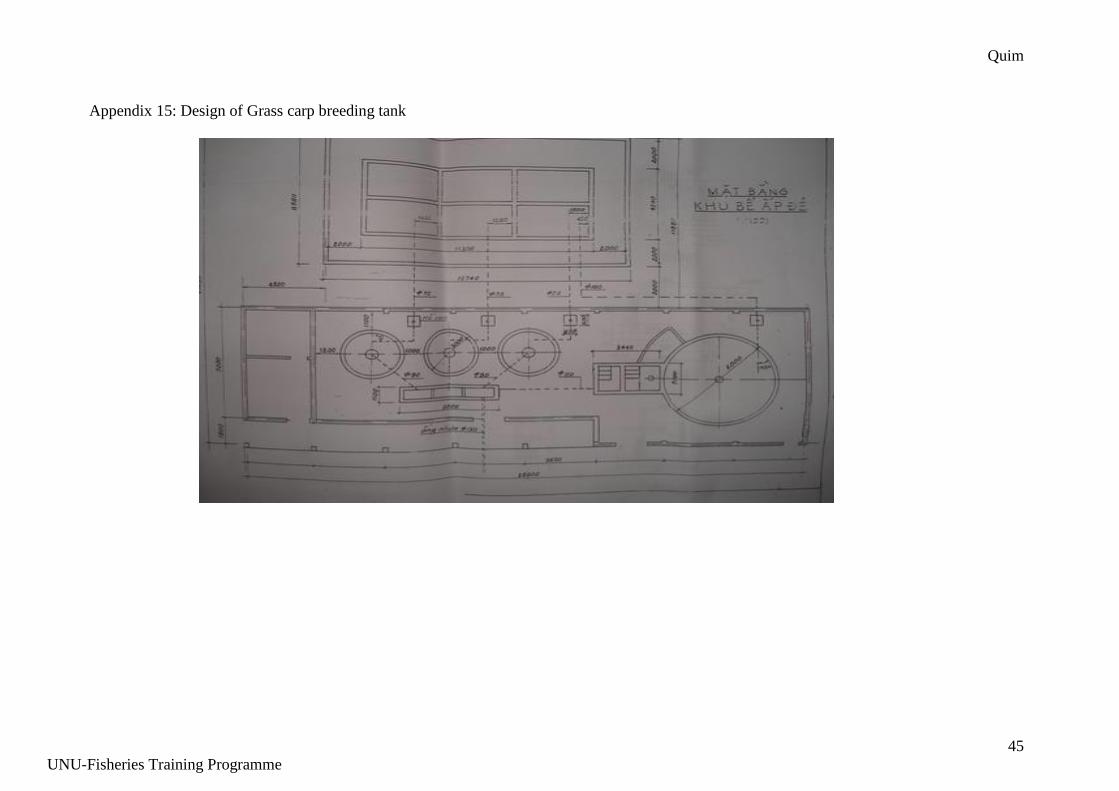
Quim
45
UNU-Fisheries Training Programme
Appendix 15: Design of Grass carp breeding tank

Quim
46
UNU-Fisheries Training Programme
Appendix: 16 Clear circular incubator for Common Carp
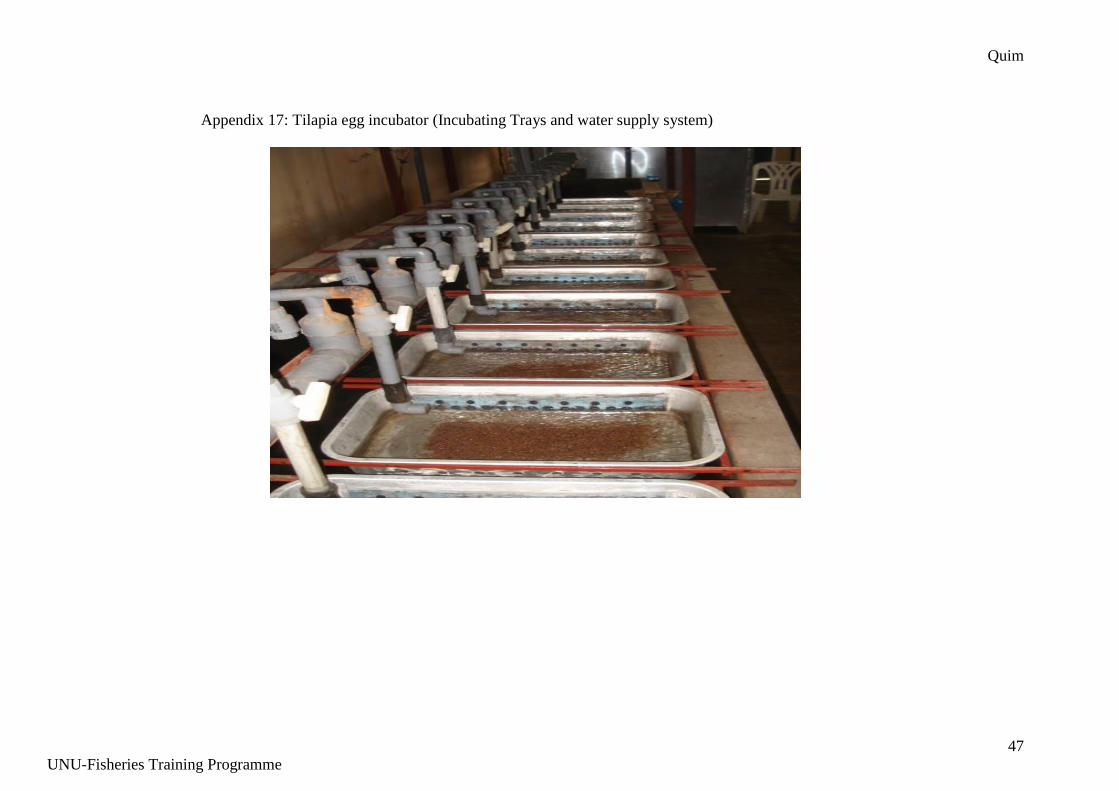
Quim
47
UNU-Fisheries Training Programme
Appendix 17: Tilapia egg incubator (Incubating Trays and water supply system)
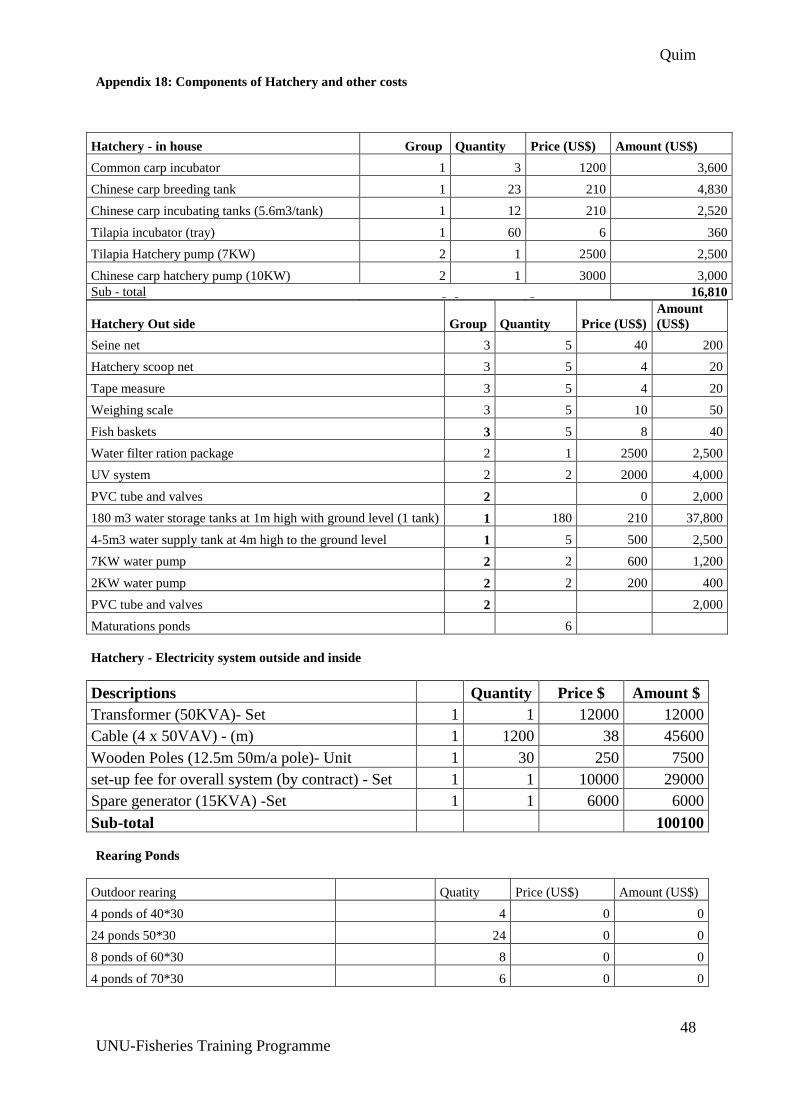
Quim
48
UNU-Fisheries Training Programme
Appendix 18: Components of Hatchery and other costs
Hatchery Out side Group Quantity Price (US$)
Amount
(US$)
Seine net 3 5 40 200
Hatchery scoop net 3 5 4 20
Tape measure 3 5 4 20
Weighing scale 3 5 10 50
Fish baskets 3 5 8 40
Water filter ration package 2 1 2500 2,500
UV system 2 2 2000 4,000
PVC tube and valves 2 0 2,000
180 m3 water storage tanks at 1m high with ground level (1 tank) 1 180 210 37,800
4-5m3 water supply tank at 4m high to the ground level 1 5 500 2,500
7KW water pump 2 2 600 1,200
2KW water pump 2 2 200 400
PVC tube and valves 2 2,000
Maturations ponds 6
Hatchery - Electricity system outside and inside
Descriptions Quantity Price $ Amount $
Transformer (50KVA)- Set 1 1 12000 12000
Cable (4 x 50VAV) - (m) 1 1200 38 45600
Wooden Poles (12.5m 50m/a pole)- Unit 1 30 250 7500
set-up fee for overall system (by contract) - Set 1 1 10000 29000
Spare generator (15KVA) -Set 1 1 6000 6000
Sub-total 100100
Rearing Ponds
Outdoor rearing Quatity Price (US$) Amount (US$)
4 ponds of 40*30 4 0 0
24 ponds 50*30 24 0 0
8 ponds of 60*30 8 0 0
4 ponds of 70*30 6 0 0
Hatchery - in house Group Quantity Price (US$) Amount (US$)
Common carp incubator 1 3 1200 3,600
Chinese carp breeding tank 1 23 210 4,830
Chinese carp incubating tanks (5.6m3/tank) 1 12 210 2,520
Tilapia incubator (tray) 1 60 6 360
Tilapia Hatchery pump (7KW) 2 1 2500 2,500
Chinese carp hatchery pump (10KW) 2 1 3000 3,000
Sub - total 16,810
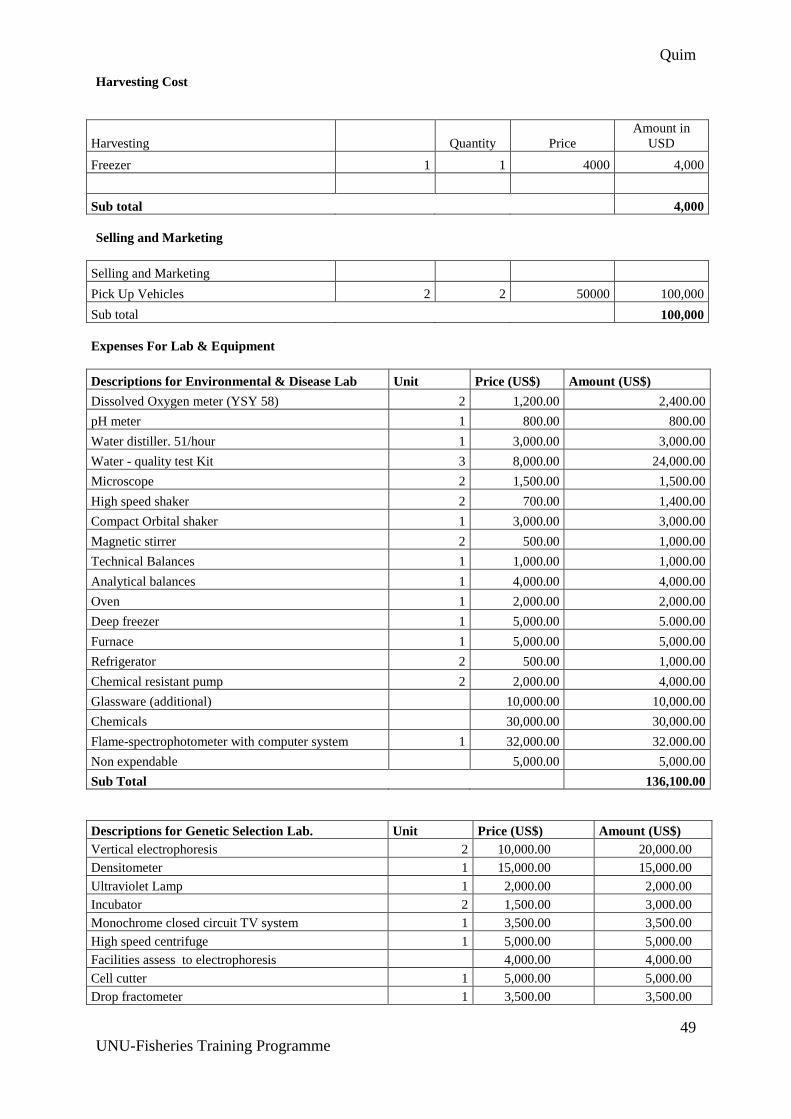
Quim
49
UNU-Fisheries Training Programme
Harvesting Cost
Harvesting Quantity Price
Amount in
USD
Freezer 1 1 4000 4,000
Sub total 4,000
Selling and Marketing
Selling and Marketing
Pick Up Vehicles 2 2 50000 100,000
Sub total 100,000
Expenses For Lab & Equipment
Descriptions for Environmental & Disease Lab Unit Price (US$) Amount (US$)
Dissolved Oxygen meter (YSY 58) 2 1,200.00 2,400.00
pH meter 1 800.00 800.00
Water distiller. 51/hour 1 3,000.00 3,000.00
Water - quality test Kit 3 8,000.00 24,000.00
Microscope 2 1,500.00 1,500.00
High speed shaker 2 700.00 1,400.00
Compact Orbital shaker 1 3,000.00 3,000.00
Magnetic stirrer 2 500.00 1,000.00
Technical Balances 1 1,000.00 1,000.00
Analytical balances 1 4,000.00 4,000.00
Oven 1 2,000.00 2,000.00
Deep freezer 1 5,000.00 5.000.00
Furnace 1 5,000.00 5,000.00
Refrigerator 2 500.00 1,000.00
Chemical resistant pump 2 2,000.00 4,000.00
Glassware (additional) 10,000.00 10,000.00
Chemicals 30,000.00 30,000.00
Flame-spectrophotometer with computer system 1 32,000.00 32.000.00
Non expendable 5,000.00 5,000.00
Sub Total 136,100.00
Descriptions for Genetic Selection Lab. Unit Price (US$) Amount (US$)
Vertical electrophoresis 2 10,000.00 20,000.00
Densitometer 1 15,000.00 15,000.00
Ultraviolet Lamp 1 2,000.00 2,000.00
Incubator 2 1,500.00 3,000.00
Monochrome closed circuit TV system 1 3,500.00 3,500.00
High speed centrifuge 1 5,000.00 5,000.00
Facilities assess to electrophoresis 4,000.00 4,000.00
Cell cutter 1 5,000.00 5,000.00
Drop fractometer 1 3,500.00 3,500.00
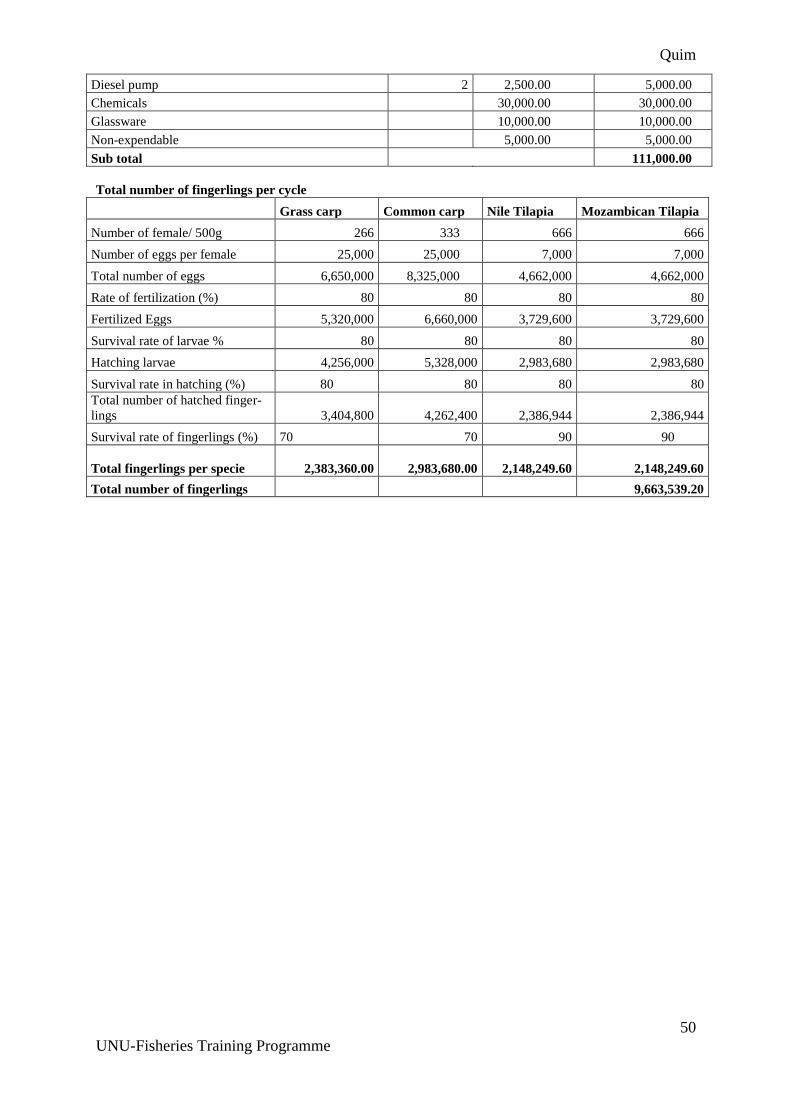
Quim
50
UNU-Fisheries Training Programme
Diesel pump 2 2,500.00 5,000.00
Chemicals 30,000.00 30,000.00
Glassware 10,000.00 10,000.00
Non-expendable 5,000.00 5,000.00
Sub total 111,000.00
Total number of fingerlings per cycle
Grass carp Common carp Nile Tilapia Mozambican Tilapia
Number of female/ 500g 266 333 666 666
Number of eggs per female 25,000 25,000 7,000 7,000
Total number of eggs 6,650,000 8,325,000 4,662,000 4,662,000
Rate of fertilization (%) 80 80 80 80
Fertilized Eggs 5,320,000 6,660,000 3,729,600 3,729,600
Survival rate of larvae % 80 80 80 80
Hatching larvae 4,256,000 5,328,000 2,983,680 2,983,680
Survival rate in hatching (%) 80 80 80 80
Total number of hatched finger-
lings 3,404,800 4,262,400 2,386,944 2,386,944
Survival rate of fingerlings (%) 70 70 90 90
Total fingerlings per specie 2,383,360.00 2,983,680.00
2,148,249.60 2,148,249.60
Total number of fingerlings 9,663,539.20
Related Documents