1 A FORMATIVE EVALUATON OF NUTRITIONAL PROGRAMS IN PUBLIC HEALTH CENTERS IN DEPOK MUNICIPALITY, INDONESIA BY DANARSIWI TRI LASTIWI (ID Number 51209663) September 2011 Paper presented to the Higher Degree Committee of Ritsumeikan Asia Pasific University in partial fulfillment of the requirements for the Degree of Master of Science in International Cooperation Policy

Welcome message from author
This document is posted to help you gain knowledge. Please leave a comment to let me know what you think about it! Share it to your friends and learn new things together.
Transcript

1
A FORMATIVE EVALUATON OF NUTRITIONAL
PROGRAMS IN PUBLIC HEALTH CENTERS IN
DEPOK MUNICIPALITY, INDONESIA
BY
DANARSIWI TRI LASTIWI
(ID Number 51209663)
September 2011
Paper presented to the Higher Degree Committee of
Ritsumeikan Asia Pasific University in partial fulfillment
of the requirements for the Degree of Master of Science in
International Cooperation Policy

ii
ABSTRACT
Depok Municipality Government has launched some policies in order to reduce
children malnutrition prevalence in its area. The policies rely on some nutritional
programs held at the Public Health Center (PHC). The aim of this study is to do a
formative evaluation on nutritional policies, programs and interventions which
improve children’s nutritional status in Depok Municipality. By knowing the
process of formative evaluation on nutritional programs, it would propose some
recommendations to local government, especially Depok local government, in
strengthening the nutritional policies, programs and interventions and it is
expected to contribute to the enrichment of knowledge and models of the
implementation policy for improving children’s nutritional status. This research is
qualitative, employed by in-depth interviews with the implementers of the
nutritional programs, as well as the beneficiaries, observation in Therapeutic
Feeding Center (TFC), where the treatment of malnutrition children is conducted,
also studied the data and documents received from Depok Health Office, PHCs,
and TFCs as well. The research found that the implementation of nutritional
programs in PHCs, from the criteria of appropriateness, the health workers in
charge of TFCs operation are capable human resources and have got the training
to conduct children malnutrition treatment based on the WHO Guideline of
Management of Child Malnutrition. From the criteria of responsiveness, knowing
how to extend a policy to satisfy the need, preference and value of the society, it is
found that the root of the problem of children malnutrition is poverty. It makes the
consequences that the policies, programs and interventions made by the local
government should be comprehensively conducted by considering the condition
of the malnourished children as well as the family. From the beneficiaries point of
view, this research found that the majority of the mothers (81%) felt that their
children got better health and growth after discharge from TFCs. 69% got the
knowledge and practices in preparing better foods for the child and family. The
majority appeared satisfied with TFCs performance.
Keywords: Nutritional programs, children‘s nutritional status, responsiveness,
appropriateness, Therapeutic Feeding Centers‘ performance.

iii
ACKNOWLEDGEMENTS
Alhamdulillah hirobbil ‗alamien, thank for Allah SWT, by His guidance and
mercy the researcher can accomplished this study entitled “A Formative
Evaluation of Nutritional Programs in Public Health Centers in Depok
Municipality, Indonesia”. The following individuals, institutions and
organizations are acknowledged for their various invaluable supports towards both
completion of my studies and construction of this paper; the Indonesian Institutes
of Sciences officials for the trust they invested in me to recommend me for this
important course; the National Development Planning Agency for awarding me
such a generous scholarship to continue my study one year in Indonesia and Japan
respectively; the Depok Municipality local government, Depok Public Health
Centers , and Therapeutic Feeding Centers in Sukmajaya, Cimanggis and
Pancoran Mas for allowing me to collect data; scholars, publishers and
organizations who gave me permission for copyright materials to be quoted or
used in construction of this paper; my husband, Gunawan Witjaksono and my
daughters Fasyara Rahma Abdilla and Tyara Ratriana Putri, my parents, brothers
and sisters for their patience and unwavering moral, social, psychological and
spiritual support; It is to them this paper is dedicated.
A very genuine gratitude is extended to Professor Nader Ghotbi and Professor
Meirmanov Serik for their undying support and excellent guidance; I am deeply
indebted for their guidance and assistance during the course of this research.
Without their support, I would not have been able to accomplish this paper. I will
always be sincerely grateful for all their kindness and understanding. May I also
convey my deep gratitude to my close friends, classmates and colleagues for their
encouragement along the constructing this paper.
I wish to appreciate critics, suggestion and comments in order to get more
qualified research for next study. Thank you.
Danarsiwi Tri Lastiwi

iv
CONTENTS
Title…………………………………………………………………………………… Abstract…………………………………………………………………………….... Acknowledgements…………………………………………………..………….… Contents…………..………….………………………………..…………………..... List of Tables ……..……………....………………………….............………….... List of Figures ………………...……….….………..…………………..…………. List of Abbreviations and Terms………………………………………………… CHAPTER I. INTRODUCTION …...………………..…………..….……………...
1.1. Research Background……………..…………..….….…….…. 1.2. Research Objectives…………………………………….……...
1.3. Research Questions…………………………………………….
CHAPTER II. LITERATURE REVIEW…………...……………….…………….…
2.1. Prior Research……………….……….…………...………...….. 2.2. Applied Theories…………………………………………………
2.2.1. Evaluation………………………………………………… 2.2.2. Policy Cycle………………………………………………. 2.2.3. Public Policy Analysis………………………………..… 2.2.4. Policy Implementation Theories……………………….. 2.2.5. Research Evaluation……………………………………. 2.2.6. Nutritional Programs…………………………………… 2.2.7. Conceptual Framework………………………………….
CHAPTER III. SOCIAL SETTING………………………………………………….
3.1. General Description of Depok Municipality…………………. 3.1.1. Depok Municipality..................................................... 3.1.2. Cimanggis Village……………………………………….. 3.1.3. General Description of Sukmajaya Health Center……
CHAPTER IV. RESEARCH METHOD………………....………...................…..
4.1. Type of research……..…………………………………..……... 4.2. Source of Data…………………..……….…………...…….….. 4.3. Focus of the Research…………………………………………. 4.4. Location………………………………………………………….. 4.5. Data Collecting Process……………………………………….. 4.6. Design of Data Analysis………………………………………..
CHAPTER V. RESEARCH FINDINGS……………………………………………. 5.1. General Description of 2 TFCs…………………..…………….
5.2. Analyses of Research Findings…………………………..…… 5.3. Conclusion and Recommendation……………………………. REFERENCES.................................................................................................. APPENDIX......................................................................................................... Appendix 5.1. Patient Data Year 2008-2011...................................................
i ii iii iv v vi vii
1 1
14 14
15 1527 27 29 31 33 35 36 40
41 41414252
60 60 61 62 63 63 66
69 69 86 88 90 94 94
v
LIST OF TABLES
Tables
1 2 3 4 5 6 7 8 9
10 11 12 13 14 15 16 17 18 19 20 21 22 23 24 25
Title The Number of Malnutrition Sufferers in Depok………………….. The Condition of the Villages……………………………………….. The Authority Area of Cimanggis Health Center…………………. The Age Classification of the Population………………………….. The Number of the Population Based on Sex…………………..… Population Density 2010…………………………………………….. The Number of Vulnerable Population in Cimanggis Health Center 2010………………………………………………………...… The Number of Poor People In Cimanggis Health Center………. Children’s Nutritional Status in Cimanggis Health Center……….. Health Workers in Cimanggis Health Center……………………… Vehicles and Their Condition………………………………………. The Working Area of Sukmajaya Health Center………………….. The Population Based on Age Classification…………………….. The Population Based on Age and Sex Classification…………… Population in Sukmajaya Subdistrict………………………………. Population Density…………………………………………………… The Number of the Population Based on Level of Education….. The Number of Vulnerable Population…………………………….. Health Worker in Sukmajaya Health Center in 2010…………..… Children’s Nutritional Status…………………………….…….……. Data of Children Malnutrition found in PHC……………………… Data of Patients in 2009 in Sukmajaya TFC……………………… Patients Status in Sukmajaya TFC………………………………… Disease Found During Treatment…………………………………..
The Curriculum for Mother in TFC……………………...………
Page
12 43 43 44 45 45
46 47 47 50 51 52 53 54 54 55 55 56 58 69 72 76 77 78 80

vi
LIST OF FIGURES
Figure
1 2 3 4 5 6 7 8 9
10 11 12 13 14 15 16 17
Title
The Direct and Indirect Causes of Malnutrition…………….…… Policy Cycle………………………………………………………..... Public Policy Analysis Model………………………………….…… Top-down, Bottom-up and Hybrid theories………………………. Conceptual Framework…………………………………………….. Depok Municipality Location………………………………………. Cimanggis Area Closer…………………………………………….. Cimanggis Health Center………………………………………...… One of the Vehicle Owned by Cimanggis Health Center……….. The Organizational Structure of Sukmajaya Health Center……. Ambulances Owned by Sukmajaya Health Center……………… Design of Data Analysis……………………………………………. Sukmajaya Therapeutic Feeding Center…………………………. Children Measurement and Playing Props………………………. Mothers Involving…………………………………………………… Cimanggis TFC Situation…………………………………………... The Scheme of Clinical Examination in PHC…………………….
Page
5
30 32 33 40 41 42 49 52 57 59 67 75 75 79 82 85

vii
List of Abbreviations and Terminology
ADM: Administration
AIGRP: Australia Indonesia Governance Research Partnership
ASI: Air Susu Ibu: breast milk
Balita: Bawah Lima Tahun: children under 5 years old
Bayi: Infant
Bulin: Ibu Bersalin: birth mothers
Bumil: Ibu Hamil: pregnant mothers
IFPRI: International Food Policy Research Institute
Kesling: Kesehatan Lingkungan: environmental health
KB: Keluarga Berencana: birth control
KIA: Kesehatan Ibu dan Anak: maternal and child health
KMS: Kartu Menuju Sehat: growth monitoring card
Lila: Lingkar Lengan Atas: upper arm circumference
MDG: Millennium Development Goals
MENKES: Menteri Kesehatan: health minister
NGO: Non Governmental Organization
NRC: Nutrition Rehabilitation Centers
Oedema: the medical term for fluid retention in the body. It occurs when there is a build-up of fluid (mainly water) in the body's tissues, causing swelling to occur in
the affected area.
P2M: Pencegahan Penyakit Menular: disease control
PHC: Public Health Center
PMT: Pemberian Makanan Tambahan: food supplement feeding
Posyandu: Pos Pelayanan Terpadu: integrated health services post

viii
PPG: Panti Pemulihan Gizi: TFC
RW: Rukun Warga: neighborhood village
SD: Sekolah Dasar: elementary school
SD : Standard Deviasi
SMA: Sekolah Menengah Atas: senior high school
SMP: Sekolah Menengah Pertama: junior high school
SPM: Standard Pelayanan Minimal: minimum health care standard
SUSENAS: Survei Sosial Ekonomi Nasional: national social economic survey
TB: Tuberculosis
TFC: Theraupetic Feeding Center
UI: Universitas Indonesia: Unversity of Indonesia
UNESCO: United Nations Educational, Scientific and Cultural Organization
UNICEF: United Nation Children Fund
Usila: Usia Lanjut: elderly people
WHO: World Health Organization

1
CHAPTER I
INTRODUCTION
1.1. Research Background
1.1.1. Malnutrition in General
Malnutrition is a global problem that may always exist with us. An estimated 195
million children are affected by malnutrition worldwide. Malnutrition is the
underlying cause of death for between three and five million children under five
every year (Doctors Without Borders, 2008). The global awareness to overcome
this problem has led to an agreement called Millennium Development Goals (MDGs)
that are a set of internationally agreed goals that countries and institutions have been
committed to reaching by 2015. The first Millennium Development Goal (MDG) is to
eradicate extreme poverty and hunger. The second target of this MDG – halving the
proportion of the population suffering from hunger between 1990 and 2015 – uses
two indicators to measure the progress: the prevalence of underweight among
children under 5 and the proportion of the population below a minimum level of
dietary energy consumption (Gragnolati, 2006). There are 925 million hungry people
in 2010 (World hunger and Poverty facts and Statistics, 2011). The statistic most
frequently cited is that of the United Nations Food and Agriculture Organization,
which measures 'under nutrition'. The most recent estimate, released in October 2010
by FAO, says that 925 million people are undernourished. Nearly all of the
undernourished are in developing countries. Children are the most visible victims of
2
under nutrition. Children who are poorly nourished suffer up to 160 days of illness
each year. Poor nutrition plays a role in at least half of the 10.9 million child deaths
each year. Under nutrition magnifies the effect of every disease. The estimated
proportions of deaths in which under nutrition is an underlying cause are roughly
similar for diarrhea (61%), malaria (57%), pneumonia (52%), and measles (45%).
(Black, Morris, & Bryce, 2003). Malnutrition can also be caused by diseases, such as
the diseases that cause diarrhea, by reducing the body's ability to convert food into
usable nutrients. According to the most recent estimate that Hunger Notes could find,
malnutrition, as measured by stunting, affects 32.5 percent of children in developing
countries--one of three (de Onis 2000).1 Geographically, more than 70 percent of
malnourished children live in Asia, 26 percent in Africa and 4 percent in Latin
America and the Caribbean. In many cases, their plight began even before birth with
a malnourished mother. Under-nutrition among pregnant women in developing
countries leads to 1 out of 6 infants born with low birth weight. This is not only a risk
factor for neonatal deaths, but also causes learning disabilities, mental retardation,
poor health, blindness and premature death.
Further, it could be stated that the two causes of malnutrition are:
1. Direct cause, namely the child's diet and infectious disease that may affect the
children. Incidence of malnutrition is not simply due to lack of food, but also
1 de Onis, Mercedes,Edward A. Frongillo and Monika Blossner. 2000. "Is malnutrition declining? An
analysis of changes in levels of child malnutrition since 1980." Bulletin of the World Health
Organization 2000, : 1222–1233.

3
because of illness; children who get good food but are often attacked by
diarrhea or fever, may eventually suffer from malnutrition, as well as children
whose food is not good enough, and their immunity may be weakened. In
such circumstances, they will be vulnerable to infection by diseases. In fact,
both (food and diseases) together is the cause of malnutrition.
2. Indirect cause, namely food security in families, parenting patterns, as well as
health care and environmental health. Food security in the family is the ability
of families to meet the food needs of all family members in a sufficient
quantity and quality. Patterns of parenting are the ability of families and
communities to provide time, attention and support for children to grow in the
best possible physical, mental and social life. Health care and environmental
health are the availability of clean water and basic health care facilities within
the reach of every family. These three factors are interrelated. These three
indirect factors are related to the level of education, knowledge and skills. The
higher level of education, knowledge and skills, the better the possibility of
family food security level, the better the pattern of childcare and awareness of
families to take advantage of existing health services and vice versa. Family
food security is related to food availability (both from the production itself or
the market or other sources), the price of food and family purchasing power,
and knowledge about nutrition and health. For example, Breast milk is the
major baby food that would otherwise be generated by the family, so it does
not need to be purchased. However, not all families can provide milk of

4
mothers to their babies because of various problems experienced by mothers.
As a result, babies are not breast fed or are given inadequate quantities of
breast milk, and should be given additional supplementary food. If problems
arise due to various reasons, such as lack of knowledge and or ability to
provide supplementary food, they may not meet the requirements. In such
circumstances, it can be said that food security is vulnerable because families
are unable to provide good food for the baby so that risk of suffering from
malnutrition is high. Patterns of parenting attitudes and behaviors of mothers
or other caregivers include proximity to children, to provide food, maintain
hygiene, giving love and so forth. All are related to the state capital in terms
of health (physical and mental), nutrition status, general education, knowledge
and skills of good parenting, role in the family or society, the nature of daily
work, family and community customs. The health service provides access or
affordability of child and family to the efforts of health maintenance and
disease prevention such as immunization, antenatal care, delivery assistance,
child weighing, health education and nutrition, and good health facilities such
as integrated health services post, clinic, practice midwife / doctor, hospital,
clean water supply. Lack of access to health services (due to distance and or
unable to pay) and lack of education and knowledge is the constraints of
society and family in making the best health care available. This can have an
impact also on the nutritional status of children. Various direct and indirect

5
factors in the above are related to the fundamental problems that exist in
society and the root of the national problem.
Figure 1. The Direct and Indirect Causes of Malnutrition
The conceptual framework that UNICEF has built as seen on the above figure
identifies the causes of malnutrition by indicating their depth, which is
divided into immediate, underlying and basis causes. It indicates the action to
reduce the malnutrition problem among under five-children that could be
taken at different levels of causes. The chart diagram confirms that an
intervention system is placed over the underlying causes. An inadequate
health service is related to management aspects rather than technical aspects
of intervention system. Inadequate health services might influence the
knowledge, attitude, and skills of the mothers on nutrition and then will lead

6
to poor caring capability of their child. Lack of child care capability will
directly influence the dietary intake of the child.
1.1.2. Malnutrition in Indonesia (scope of the problem in Indonesia)
Indonesian people are generally more familiar with the term of malnutrition than
Protein Energy Malnutrition. The word of protein and energy may seem more
scientific. The writer chooses the word of malnutrition to comply with the terms used
in reference books. Adequate nutrition plays a vital role in ensuring the health and
well-being of citizens and the economic and social development of society. Even
though there is significant progress, much remains to be done to address nutritional
deficiencies within the Indonesian population and to achieve targets set by the
Indonesian government and the international community.
Indonesia is a signatory to various international human rights conventions that set out
states’ obligations in respect of nutrition. Article 24 of the Convention on the Rights
of the Child states that parties shall take appropriate measures to, amongst other
things, “combat disease, malnutrition, and ensure that all segments of society, in
particular parents and children, are informed, have access to education and are
supported in the use of basic knowledge of child health and nutrition (OHCHR:
1989).2
In 2001, the national government devolved responsibility for managing health-related
issues, including nutrition, to district governments. Decentralization was intended to
2 Office of the United Nations High Commissioner for Human Rights. 1989. Convention on the Right
of the Child

7
allow policy-makers to devise policies and programs that were more responsive to the
needs of local communities. The policies and programs should take advantage of
local resources and expertise as well. The national government provides guidance to
the district governments through the minimum health care standards (SPM bagi
Kesehatan)3 and other standards to ensure, to some degree, consistency between
districts across Indonesia. The SPM sets out benchmarks for district governments to
achieve in relation to a number of health related indicators. The Food National
Action Plan 2005-2009 has set a national target to reduce cases of severe malnutrition
in children, less than 5 years of age, to 5 percent of that population. UNICEF reports
that in the period 2000-2007, 9 percent of Indonesian children, less than 5 years of
age, were severely underweight and in the same period between 23 to 28 percent of
Indonesian children, less than 5 years of age, were moderately or severely
underweight.4 Strengthening public health governance at the district level is seen as a
strategic priority for combating malnutrition. Under the health decentralisation policy
framework in Indonesia district governments have the focal role of managing health
intervention especially in regard to improving the nutritional status of women and
children.
Discussion on knowledge in the topic of nutrition is ripe in the realm of maternal
knowledge. Indeed, maternal knowledge of nutrition is vital, since women have a
vital role in maintaining the household economy and their family health (Sargent,
3 The Health Minister Regulation/Peraturan Menteri Kesehatan No. 741/MENKES/PER/VII/2008. 4 UNICEF, At a Glance: Indonesia <http://www.unicef.org/infobycountry/indonesia_statistics.html>.

8
et.al, 1996).5 Hugh Water et.al using the Indonesia SUSENAS
6 data to measure the
prevalence of underweight children 5 years of age demonstrated how mothers’
education has very strong protective effects (Waters, et.al, 2004: 589-595).7 Skoufias
addressed that the level of education of the mother has a bearing in the overall child
nutritional status. In urban areas, the education level of the head of household has no
significant effect on the health of either boys or girls. In contrast, mothers with a
senior high school (or higher) level of education have healthier boys and girls. Whilst
in rural areas, mothers with the highest level of education also have healthier girls
(Skoufias, 1999: 99-119).8 Skoufias illuminate how the gender based biases are
prevalent in the society. Children expected to take advantage from maternal education
as identified by Reed are those from households of intermediary conditions, between
the poorest and the wealthiest. In these households, formal education would facilitate
the mother in making better decisions about the allocation of limited resources to the
benefit of her children (Reed, 1996: 585).9
Block took a rather different stance by contending that maternal nutrition
knowledge is critical, even more so than formal schooling, in determining child
5 Sargent, C.F., Brettel, C. (ed.). 1996. Gender and Health, an International Perspective. Prentice Hall
Inc, New Jersey. 6 National Social and Economy Survey, the most comprehensive source of household socio-economic
data in Indonesia. 7 Waters, H., et al. 2004. Weight-for-age malnutrition in Indonesian children, 1992–1999.
International Journal of Epidemiology 33: 589–595
8 Skoufias E. 1999. Parental education and child nutrition in Indonesia. Bulletin of Indonesia
Economics Studies 35:99–119. 9 Reed, Barbara A., et al. 1996. The Effects of Maternal Education on Child Nutritional Status Depend
on Socio-Environmental Conditions. International Journal of Epidemiology 25 (3): 585.

9
micronutrient outcomes (Block, 2002).10
Mary J De Silva identifies how knowledge
transfer may be mediated in the social connectedness thus enabling mothers to know
more with regard to child nutritional status (De Silva, 2007: 341-355).11
Indeed
mothers are an excellent target group for nutrition education intervention as they are
the primary decision maker in preparing food in family households (Silk, 2007).12
Dealing with the role of mothers in improving nutritional status of their children, the
programs conducted by the government in intervening children’s nutritional status
should be done in a synergic way. In Indonesia, the authority of maintaining the
public’s health was delivered by the local government in 2004 by the issuing of
minimum health care standards by the Ministry of Health (see Decree – No.
1091/MENKES/SK/X/2004 Petunjuk Teknis Standar Pelayanan Minimal Bidang
Kesehatan di Kabupaten/Kota – Technical Guidance on Minimum Health Care
Standards for Regency/Municipality). It authorizes the local government to create
programs regarding the improvement of nutritional status of children. In Indonesia,
every local government creates the programs to deal with the condition of children
malnutrition. All of the efforts in conducting the programs aim to increase the
children’s nutritional status.
10 Block, S. 2002. Nutrition Knowledge versus Schooling in the Demand for Child Micronutrient
Status. Working Paper No. 93, Harvard University Center for International Development. 11 De Silva, Mary J. 2007. Maternal Social Capital and Child Nutritional Status in Four Developing
Countries, Health & Place 13: 341-355. 12 Silk, Kami J., et.al. 2007. Who has time to cook? How family resources influence food preparation.
http://www.ers.usda.gov/publications/ERR40/err40.pdf. [1/06/2007]

10
The programs, stated by the Health Minister Regulation 741/Menkes/PER/VII/2008
are intended to function as a yardstick for monitoring and evaluation by setting
certain targets. The relevant ones in terms of basic services in health are specified in
article 2, namely among others: coverage of baby visit of 90% in 2010, coverage of
services for children below 5 years of age of 90% in 2010, coverage of additional
food supplementation program /Pemberian Makanan Tambahan (PMT) for
breastfeeding (ASI) for children 6-24 months from poor families in 2010, coverage of
active birth control participants of 70% in the year of 2010, coverage of finding and
managing diseases of 100% in the year of 2010, coverage of basic health services for
the poor of 100%in 2015, and for health promotion and community empowerment,
the coverage of active Alert Village (desa Siaga) of 80% in 2015.
The policy direction of health development in Indonesia, among others, is to improve
the quality of human resources and environment mutually with a healthy paradigm
approach, to improve and maintain the quality of institutions and to serve health
through the empowerment of human resources in a sustainable manner. Government
launched a movement of health oriented development as a general health policy
development to achieve Indonesia Healthy 2010 (Ministry of Health, 2000).
The implementation of health development needs to be supported among others by
developing the resources of health workers from the community and government.
Health manpower development is essential for the process of developing a
multidisciplinary and cross-sectoral, as well as cross-program for equality, and

11
improving the quality of health personnel. One of the principal health development
programs is to improve nutrition and basic program management policies and health
development (Ministry of Health, 2000).
In health development, government is trying to organize health efforts such as disease
prevention, health restoration and health education to the public. Prevention efforts
can be implemented in various ways including through implementation of public
health nutrition at Public Health Care.
All officers involved in these programs both in cities and urban districts should be
guided both in the issues of health knowledge and technical ability. The increased
knowledge and capabilities of the nutrition program implementers are expected to
make the execution of the programs happen properly and correctly.
1.1.3. Malnutrition in the Depok Municipality
The writer would like to analyze the implementation of nutritional programs held by
community health centre in Depok municipality for reducing malnutrition prevalence
in this area.
In strengthening public health governance at the district level, the writer is interested
in the district’s policy on combating malnutrition in Depok municipality by
establishing Feeding Therapeutic Centre (TFC).
The writer will conduct this research in Depok municipality. The vision of Depok
municipality is Menuju Kota Depok yang Melayani dan Mensejahterakan. Under the

12
leadership of Depok City Mayor Nur Mahmudi Ismail, the local government has
made various efforts to improve services and prosperity for its citizens. Like other
countries around the world, both developed countries and developing countries, local
government performance is measured primarily through the provision of basic
services, one of which is health services. However, looking at the data in table 1
below, the city government should pay more attention to their performance,
especially in the field of health. At the policy level, the city government of Depok, in
its mission stated the goal of improving the quality of family, education, health and
welfare of the community based on the religious values. In one of their mission
statements which directly relates to the public service, Depok local government will
provide friendly, fast and transparent services.
Table.1. The number of malnutrition sufferers in Depok
Year
Number of
malnutrition sufferers
Percentage
2002 455 0.45%
2003 602 0.57%
2004 964 1%
2005 1,133 0.99%
2006 935 0.81%
2007 937 0.84%
2009 959 0.82%
2010 439 0.35% Source: http://www.gizi.net/ Monday, 21 April 2008 and Republika/Rabu, 16 Juni 2010.

13
As seen in the table, media reported that in 2009, there are 959 malnutrition sufferers
equal with 0.82%, and this year (2010) the number decreases to 439 or 0.35% from
the whole number of children under 5 years in Depok (170,842).
This condition worsened with the incident of the death of Wahyu Saputra (6 years
old), who lived in Pancoran Mas sub district in 2008, meanwhile Depok was the first
rank in Human Development Index in West Java Province that is 78,22 and the first
RW (neighborhood village ) Alert reached 100% in Indonesia.
Indeed these facts are opposite each other. On the one hand, Depok City has had
policies and programs that were well planned through the efforts of better health
services by providing funds from the local budget for the poor family in cooperation
with 12 private hospitals in Depok and 4 hospitals outside of Depok, and increased
PHC services by providing hospitalization facility, improving family health,
increasing awareness of food and nutrition, managing infectious and non infectious
disease and promoting health with the motto "Healthy and Clean Living Behavior”,
but on the other hand, we still see some cases of malnutrition that at the twinkling of
an eye annihilate all efforts initiated by the Government of Depok. This case seems to
open the eyes of all parties, especially the Depok Municipality Government, that no
matter how good concepts and slogans have been planned, but without
implementation and support of all parties, the concept is not necessarily going to be
realized well. Depok Municipality Government also seeks strength, by performing a
variety of breakthroughs in the efforts to reduce malnutrition rates.

14
1.2. Research Objectives
1. To evaluate the implementation of nutritional programs in Depok
Municipality.
2. To elaborate nutritional policies, programs and interventions in order to
increase children’s nutritional status in Depok Municipality.
3. By knowing the process of formative evaluation of nutritional programs,
hopefully there would be some recommendations given to local government,
especially Depok local government, in strengthening the policies, programs
and interventions in order to improve children nutritional status.
4. It is expected to contribute to the enrichment of knowledge and models of the
implementation policy in the health sector for improving children nutritional
status.
1.3. Research Questions
Based on the background of the study, the writer proposes the research question as
follows:
1. What are the constraints and challenges of the implementation of nutritional
programs in Public Health Care, focused in Therapeutic Feeding Center?
2. How to strengthen the nutritional policies, programs and interventions in order
to increase children nutritional status in Depok Municipality?

15
CHAPTER II
THEORITICAL REVIEW
2.1. Prior Research
In this chapter, the writer would like to refer to several prior researches related to
implementation of nutrition programs. Two researches show the technical aspect
dealing with the children nutritional status. The third research emphasizes on the
sustainability of services in integrated children services in the framework of
improving life expectancy through international aids. The next research discusses
Evidence Based Decision Making to Reform Governance at the District Level : the
Case of Nutritional Policies, Programs and Interventions. The last research is
conducted by IFPRI in designing nutrition and health policies and programs to
accelerate progress in reducing child malnutrition. All the researches below have
been the tool for observing and comparing the methods, as well as the analyses done
in the writer’s research.
Prior Research:
1. Title of Research/Author/Year/Location :
Mulyaningsih, Endah Sriyani/ Hubungan Antara Asupan Energi Protein dan Faktor
Lain dengan Status Gizi Balita ( 12- 59 bulan) di Kec. Cililin Kab. Bandung tahun
2007. (Available in Bahasa).

16
The correlation of dietary energy consumption and other factors with the nutritional
status of children (12 – 59 months) in Cililin Sub district Bandung Regency year 2007
Public Health Program UI 2007/ Indonesia.
Background :
The main health problem that has burdened the state is the high number of
undernourished. The direct causes of undernourished children are insufficiency of
food consumption, infectious diseases, and improper parenting. The indirect causes of
undernourished children are the lack of food in the households, bad sanitation, lack of
fresh water, the lack of health services, low education and basic knowledge of child
health and nutrition. The scope of this research addresses the correlation of children
nutritional status with the child, mother, father and family characteristics, the lack of
food consumption, children health status, and parenting. Sub district Cililin has the
highest undernourished prevalence in Bandung Regency, West Java. The occurrence
of undernourished children increased from 17,31% in 2005 to 21,44% in 2006.
Result :
There is a significant correlation between dietary energy consumption and parenting
(that consists of exclusively breast feeding and colostrum, feeding additional food,
visiting integrated health services, giving immunization and vitamin A also personal
hygiene of mothers) with the children nutritional status.
17
Relevance:
This research is relevant to the research question on how to improve the children’s
nutritional status. However, the research merely discusses the technique of improving
children nutritional status without further discussion in health policy process.
2. Title of Research/Author/Year/Location :
Okviyanti, Rika Tri/ Faktor-faktor yang Berhubungan dengan Status Gizi Anak Usia
6-24 Bulan di Kelurahan Ratu Jaya, Kecamatan Pancoran Mas Kota Depok Jawa
Barat Tahun 2007.
The affecting Factors of 6-24 Months of Children‘s Nutritional Status in Ratujaya
Village, Pancoran Mas Sub District, Depok City Year 2007. Public Health
Department UI/2007/ Indonesia.
Background :
Post-natal period through two years old is a very critical period due to the rapid
growth of infants and the differentiation that occurs in every organ system. Children's
growth will be relatively well until the age of less than six months, but begins to
deteriorate at age 6 months - 2 years old. At the age of 6 months - 2 years old breast
feeding cannot meet the need of the infants then the role will be substituted by the
additional food as a complement to breast feeding. Disturbances that occurre in this
tangled settling will cause disruption of the structure of anatomy, biochemistry and
organ function.

18
This research addresses the prevalence of undernourished and malnutrition in Ratu
Jaya village that reached 1.78% and 13, 5% respectively. This figure is higher than
the prevalence rate of undernourished and malnutrition in Pancoran Mas Sub district,
Depok City, West Java that is equal to 1% and 11.48% respectively.
Result :
There is a significant correlation between dietary energy consumption and parenting
(that consists of exclusively breast feeding and colostrum, feeding additional food,
visiting integrated children services, giving immunization and vitamin A also
personal hygiene of mothers) with the children nutritional status.
Relevance:
This research is relevant to answer the question of what are the factors influencing
children’s nutritional status of 6-24 month. It enhances the writer’s knowledge about
children’s nutritional status.
3. Title of Research/Author/Year/Location :
Nuhamara, Samuel/ Perkembangan dan Kesinambungan Pelayanan Posyandu:
Kaitannya dengan Pelayanan Proyek Kelangsungan Hidup Anak di Kec. Balai dan
Tayan Hilir Kab. Sanggau.

19
The Improvement and Sustainability of Integrated Child Health Services : the
Correlation with the Program of Children Life Expectancy in Balai and Tayan Hilir
Sub Districts, Sanggau Regency/ Public Health Program UI./ 2007/ Indonesia.
Background :
This research aims to study the improvement and sustainability of services in
integrated child health services in correlation with the program of children life
expectancy.
Methodology :
This paper reviewed the project of children life expectancy held in Balai and Tayan
Hilir sub districts, Sanggau regency. The design of this research is cross sectional
with the analysis unit of integrated children health services.
Result :
The result shows the sustainability of the integrated child health services after
finishing of the project of children life expectancy held in Balai and Tayan Hilir sub
districts, Sanggau regency.
Relevance:
This research is relevant with the question on the sustainability of the integrated child
health services after the end of the project or program of children life expectancy.

20
4. Title of Research/Author/Year/Location :
McDonald, Yoganingrum, Purwaningrum, Ariani, Short, Stephanie, D. / Evidence
Based Decision Making to Strengthen Local Government: Nutritional Health
Interventions in Bantul and Gunung Kidul. Policy Brief/AIGRP/2009/ Australia.
Background :
Since 2001, district governments have had the main responsibility for providing
public health care in Indonesia. One of the main public health challenges facing
many district governments is improving nutritional standards, particularly among
poorer segments of the population. Developing effective policies and strategies for
improving nutrition requires a multi-sectoral approach encompassing agricultural
development policy, access to markets, food security (storage) programs, provision of
public health facilities, and promotion of public awareness of nutritional health. This
research was done in the two districts in Indonesia—Bantul and Gunungkidul. It was
clear that local government capacity to generate, obtain and integrate evidence about
local conditions into the policy-making process was still limited. In both districts,
decision-makers tended to rely more on intuition, anecdote, and precedent in
formulating policy. The potential for evidence-based decision making was also
severely constrained by a lack of coordination and communication between agencies
and current arrangements related to central government fiscal transfers, which
compel local governments to allocate funding to centrally determined programs and
priorities.
21
Result :
This research makes several recommendations:
1. Improve coordination with the national government to develop synergies amongst
national, provincial and district programs to reduce overlaps, improve coordination
and result in improved health outcomes. As much as possible national policy making
should be developed in such a way as to be inclusive of the aspirations of district
governments and to support long-term planning. This may include a review of the
implementation of nationally led nutrition and food resilience programs to ensure
they continue to be relevant at the district level and increase flexibility in budget
allocations. Currently low accountability of district governments‘ performance in
achieving the SPMs needs to be addressed.
2. Create integrated data centres to gather valid, accurate and real-time data and
consolidate nutrition/food security data from all local bureaus within districts and
between the districts and national actors. Data should be both quantitative, and
qualitative that is engaging with the experiences and expertise of those who provide
and use relevant services and programs. To enable such a system to work, national,
provincial, district and sub-district bodies need to work together to develop a set of
common indicators that create an accurate picture of local needs and facilitate data-
gathering. Rigorous data evaluation mechanisms should be developed for all

22
programs to ensure that data is accurate, as well as to create new data to feed into a
program of continuous quality improvement to strengthen governance programs.
3. Commitment at the national and district level to increasing the development
of EBDM in public health. Leadership will be required at all levels of governance to
change cultures resistant to integrating research into decision-making processes.
This may require the development of incentives and/or accountabilities to encourage
or require EBDM. Most of all it will require a paradigm shift by all governance
actors to move from short and medium term planning to long-term planning and
implementation of programs in this area. Additionally, researchers must take
responsibility for making research results more accessible to policymakers.
4. District governments should develop measures to improve coordination between
bureaus to address important cross sectoral problems. In Bantul, the use of law to
require coordination to address problems that cross sectoral boundaries is reported
to have been helpful, although incentive schemes can have inherent weaknesses.
Bantul also holds regular coordination meetings between bureaus at policy and
operational levels and with sub-district actors and service providers. Another
approach, suggested in Gunungkidul, is that an existing coordination body, such as
the Food Resilience Board (Dewan Ketahanan Pangan), be given greater authority to
require coordination and prioritize programs.

23
5. Encourage and facilitate increased participation by all stakeholder in planning
processes at the national and district level. This will foster community engagement
with nutrition and public health issues, which is particularly important given the high
dependence upon NGOs, communities and volunteers to deliver services. It will also
facilitate the effective and efficient delivery of such services by increasing decision-
makers‘ awareness of local issues and increasing community awareness of the
broader context within which interventions are developed, funded, implemented and
monitored and how their activities contribute to this broader process.
6. Continue to develop programs to educate the public about the importance of
local-food as a source of nutrition, provide education on how to process local-food to
enhance their nutritional value, and develop campaigns to promote pride in local-
food diversity.
Relevance:
This research is relevant to the question of how to strengthen the health policy in
local government.
5. Title of Research/Author/Year/Location :
Joachim von Braun, Marie Ruel and Ashok Gulati (2008). Accelerating Progress
toward Reducing Child Malnutrition in India. A Concept for Action. Jurnal IFPRI/Jan
2008/USA.

24
Background :
India is home to 40% of the world‘s malnourished children and 35% of the
developing world‘s low-birth-weight infants; every year 2,5 million children die in
India, accounting for one in five deaths in the world. More than half of these deaths
could be prevented if children were well nourished. India‘s progress in reducing
child malnutrition has been slow. The prevalence of child malnutrition in India
deviates further from the expected level at the country‘s per capita income than in
any other large developing country. India lacks a comprehensive nutrition strategy.
Various choices for nutrition strategies can be considered. A review of some of the
more successful country experiences suggests that all of them implemented complex,
multisectoral actions with more or less emphasis on service-oriented nutrition
policies (as in Indonesia), incentive-oriented nutrition policies linked to the
community or household participation and performance (as in Mexico), or
mobilization-oriented nutrition policies (as in Thailand). These choices are not
mutually exclusive. India now has the opportunity to ―leapfrog‖ toward innovative
nutritional improvement based on the experiences of other countries and experiences
within India.
Result :
To accelerate progress in reducing child malnutrition, India should focus on the
following four cross cutting strategic approaches:

25
a. Ensuring that economic growth and poverty reduction policies reach the poor
b. Redesigning nutrition and health policies and programs by drawing on science
and technology for nutritional improvement, strengthening their
implementation and increasing their coverage.
c. Increasing investments and actions in nutrition services for communities with
the highest concentration of poor.
d. Focusing on programs for girls‘ and women‘s health and nutrition.
Relevance:
This research is relevant to the question of how to design nutrition and health policies
and programs to accelerate progress in reducing child malnutrition.
All the prior researches above help the writer in defining the research problem,
identifying the criteria used in evaluating the nutritional programs, and constructing
the solutions in strengthening the nutritional policies, programs and interventions that
should be conducted by local government in order to reduce the number of
undernourished, as well as malnutrition prevalence.
6. Title of Research/Author/Year/Location :
Nutrition Rehabilitation Centers (NRCs)- An Evaluation of Their Performance/
Micheline Beaudry-Darisme and Michael C. Latham/Africa

26
In this paper Cook13
has reviewed the literature to provide data on the prognosis of
malnourished children treated under hospital and non-hospital conditions. In non-
hospital management he included NRC and under-five out-patient clinics, which he
assumed in contrast to hospitals, would provide educational benefits. He concluded
that non-hospital treatment of malnutrition would provide a cure in 30 to 60 % of
cases compared with a cure of 0- 10 % as a result of hospitalization. He suggested a
higher mortality for hospitalized children. The data he presented from the two types
of regimes were not always comparable, and there was the unsupported assumption
that NRC and under-five clinics were having a continuing educational effect on those
mothers who had contact with them. Unfortunately these assumptions have not been
adequately tested. Nevertheless his review is a most important one and his hypotheses
deserve the most careful assessment. A recent publication14
provide details of a
conference held in Bogota in 1969 on NRC. It provides very useful information on the
organization and functioning of NRC and recommendations steps for their
evaluation. It too takes a generally optimistic view of these centers as offering at
relatively low cost a new approach to the combating of protein-calorie malnutrition
in non-industrialized communities.
13 Cook, R. (1971). J. trop. Pediat.,17,15 14 Research Corporation (1970) “ A practical guide to combating malnutrition in the pre-school child”
Meredith Corp., N.Y.

27
2.2. Applied Theories
2.2.1. Evaluation
According to the American Public Health Assessment in the book Glossary Term in
Public Health Administration, evaluation is a process to determine the value of the
amount of business success in achieving a predetermined goal. The process includes
activities to formulate objectives, identification of appropriate criteria to use in
measuring the success of determining and explaining the success and
recommendations for sustainability of the program. Evaluation of public health
programs should focus on measuring the effectiveness of program activities
associated with achieving a goal (WHO in Evaluasi Program Kesehatan (Translation),
1990: 2).
The results of evaluation are divided into:
1. Summative evaluation which has two implications :
a. Summative evaluation is the evaluation of the final result.
b. Summative evaluation is the overall evaluation to determine the final
decisions.
2. Formative evaluation has two implications namely:
a. The result of evaluation will be used for program development.
b. The result is a collection of decisions that is closely related to the program.

28
Formative evaluation is an evaluation conducted when the program is running
(going) with the goal to provide feedback for program managers about the results
achieved and constraints encountered in the implementation.
The purpose of the health evaluation program is to improve the health programs and
services, to deliver the allocation of funds, manpower and services in the programs, in
ongoing and future time. Evaluation should be used constructively and not merely to
look for the mistakes. When the evaluation is complete if there is a deviation, it needs
re-planning based on the decision analysis. Input evaluation shows the structure of
program planning decisions. Process evaluation is used in administration and
supervision (WHO in Evaluasi Program Kesehatan, 1990:33). During the
implementation of the program, the analysis process will identify procedures and
record what happened and the stage until reaching the final stages namely product
evaluation. Product evaluation is focused on output and is used to make new
decisions and give the next reaction. Principally, evaluation is a tool to collect data in
order to improve a program. Waiss, 1972 identified six specific uses of evaluation:
1. To continue / discontinue an program.
2. To improve practices and procedures of a program.
3. To add / provide specific strategies and techniques of a program.
4. To institutionalize the program.

29
5. To allocate resources between the operation and program
6. To reject and accept a program approach / theory
2.2.2 Policy Cycle
Social problems are unavoidable and they are side by side with us all over. Dealing
with the differences, policy makers try to neutralize them by using their policy to
solve the problem. However, creating good policy is not a simple thing.
Policy cycle is the process which depicts the policy process. This cycle starts from the
problem and continues with problem definition until evaluation; there are several
stages which policy makers should pass through. According to Parsons (1995) there
are seven stages for public policy cycle which start from problem – problem
definition – identifying alternative response/solution, until evaluation and continue to
solve the problem. Parsons (1995) depicted the policy cycle with the following figure.

30
Figure. 2.
In sum, the policy cycle contains three main stages. There are formulation,
implementation and assessment. Policy analysis aims to evaluate the policy
implementation and the impact from the policy so that analysis can be used as the
guidance for the next policies or as the problem solution for the impact from the
policy implementation.

31
2.2.3 Public Policy Analysis
In order to assess both public policy making process and public policy
implementation, we need an approach called public policy analysis. Parsons (1996)
argued the kinds of policy analysis as comprising a range of activity on a spectrum of
knowledge in the policy process; knowledge for the policy process; and knowledge
about the policy process. By using policy analysis we can face many perspectives
from the policy. Policy analysis is used to define the problems of the policy,
evaluating the policy is based on the policy goals that refer to some criteria which
have been defined in policy making process. Parson argued that policy analysis is
concerned with improving the methods by which problems are identified and
defined. Goals are specified, alternatives evaluated and performance measured.
Furthermore, by using policy analysis, we can evaluate the impact of the policy
process and implementation as well. D.J. Palumbo (1987) also suggested a public
policy analysis model which can be divided to seven steps, namely: (1) Agenda
setting: defining nature, size, and distribution of problem; (2) Problem definition:
forecasting needs, defining targets; (3) Policy design: decision analysis; (4) Policy
legitimation: opinion polls, survey, etc; (5) Implementation (formative evaluation);
(6) Impact (summative evaluation); (7) Termination (political feasibility analysis).
Dunn (2004) argued that Policy Analysis is a means of synthesizing information
including research results to produce a format for policy decisions (The laying out of
alternative choices) and determination of future needs for policy relevant information.

32
Figure. 3.
Public Policy Analysis Model
Source: Policy Cycle and the Information Cycle by Palumbo.
Based on Palumbo’s theory, the writer would like to analyze the fifth step that is
dealing with the implementation (formative evaluation) program conducted by the
local government especially the operational implementer (Public Health Care) and
use the criteria from William Dunn covers of appropriateness and responsiveness.
According to Dunn (1991: 93) appropriateness criteria ask whether the goal of a kind
of policy, in this case nutritional policy, is fitted for the society. The appropriateness
will be examined from the aspect of input, process and output. Another criteria
namely responsiveness is how to extend a policy to satisfy the need, preference and
value of the society.
Defining nature
size, distribution
of problem
Political
feasibility
analysis
Forecasting needs,
defining target
Decision
Analysis
Opinion polls,
surveys, etc
Formative
Evaluation
Summative
Evaluation
AGENDA
SETTING
PROBLEM
DEFINITION
POLICY
DESIGN
IMPLEMENTATION IMPACT

33
2.2.4. Policy Implementation Theories
Pülzl, Helga & Treib, Oliver (2006) identified three generations of research
implementation which can be subdivided into three distinct theoretical approaches to
the study of implementation of top-down theories, bottom-up theories, and hybrid
theories.
Figure. 4.
Top-down, Bottom-up and Hybrid theories
Top-down, bottom-up and hybrid theories
• Top-down Theories.
It starts from the assumption that policy implementation starts with a decision
made by the central government. DeLeon (2001: 2) described top-down
approaches as a “governing elite phenomenon”. Pressman and Wildavsky’s have
the assumption that policy objectives are set out by central policy makers. In this
view, implementation research was left with the task of analyzing the difficulties

34
in achieving these objectives. They saw implementation as an “interaction between
the setting of goals and actions geared to achieve them” (Pressman and Wildavsky
1973: xv).
• Bottom-up Theories.
It emerged as a critical response to the top-down school. Lipsky (1971, 1980)
argued that policy analysts needed to consider the direct interactions between
social workers and citizens. Besides, Hjern, with Porter and Hull, (Hjern 1982,
Hjern and Porter 1981, Hjern and Hull, 1982) suggested that implementation
analysis should start with the identification of networks of actors from all relevant
agencies collaborating in implementation and then examine the way they try to
solve their problems. According to Sabatier (1986a), this approach offers a useful
tool to describe the ―implementation structures‖ (Hjern and Porter 1981) within
which policy execution takes place. However, he also criticizes the lack of causal
hypotheses on the relationship between legal and economic factors and individual
behavior.
• Hybrid Theories.
It was developed by Elmore (1985), Sabatier (1986a) or Goggin et al. (1990) as
new models by combining elements of both sides in order to avoid the conceptual
weaknesses of top-down and bottom-up approaches. Policy makers should start
with the consideration of policy instruments and available resources for policy

35
change. They should also identify the incentive structure of implementers and
target groups. In a similar position, Wildavsky, together with Majone (Majone and
Wildavsky 1978) argue that implementation is an evolutionary process in which
programs are constantly re-shaped and re-defined. The conception thus started
from policy inputs defined by central policy makers. At the same time, it also
embraced the idea that these inputs will almost inevitably be changed in the
course of their execution.
2.2.5. Research Evaluation
Evaluation is a process that assesses the objectives in the light of a predetermined
standard value with the intent to make an appropriate decision (Panelson, 1967).
According to Julian C. Staanley (1996) evaluation is a process of decision making
where the decision has a major role, while Numez (1992) pointed out that evaluation
is a comparison between the objectives with the results achieved and how that goal is
achieved. Evaluation is a form of research, because the evaluation uses the same
methods with research in general. The difference is only on the goal and the
implementation, as a form of research, evaluation is defined as a study using
scientific methods to describe a phenomenon to determine the relationships among
the various phenomena (Rossi and Williams, 1973). Besides, research evaluation is
also a way to improve the policy (Carol, 1972) and evaluation research also means
determining the effectiveness of the programs (UNESCO, 1976). According to
Wollmann evaluation in the field of public policy may be defined, in general terms, as

36
an analytical tool and procedure meant to do two things. First, evaluation research,
as an analytical tool involves investigating a policy program to obtain all information
pertinent to the assessment of its performance, both process and result; second
evaluation as a phase of the policy cycle more generally refers to the reporting of
such information back to the policy-making process (Wollmann 2003: 1-11)
2.2.6. Nutritional Programs
Public Health Center (PHC) is a leading health care activity to provide health services
including nutrition to people that exist in every areas of the entire country. The efforts
to improve nutritional status through PHC aims to address the problem of nutrition
and improve the nutritional status of the community. At the PHC level, nutrition
improvement is carried out by some kind of power such as the nutritionist expert in
PHC, Assistant Nutritionist, Midwives, Nurses and other health professionals. The
efforts to improve nutrition through the PHC cannot be implemented effectively
because not all PHC has nutritionists, and also there is limited ability for overcoming
nutritional problems (Ministry of Health, 1995).
2.2.7. Integrated Health Services Post
Pos Pelayanan Terpadu (integrated health services post) is one form of power sourced
community health efforts which is managed and operated from, by, for and with
society in the implementation of health development, in order to empower
communities and provide convenience to the public in obtaining basic health services

37
to accelerate the decline in maternal and infants mortality. To enhance the active role
of integrated health services post, in 2001, the Minister of Home Affairs issued a
letter of the general guidelines for the revitalization of integrated health services post,
and subsequently issued regulations No. 54 of 2007 on Guidelines for Establishment
of integrated health services post.
Integrated health services post consist of 4 levels of development, namely:
1. Pratama
Integrated health services post which does not conduct routine monthly activities and
only has a very limited number of cadres15
that is less than 5 people.
2. Madya
Integrated health services post which has to carry out the activities of more than 8
times per year by the average number of cadres as many as five people or more, but
the scope of the five main activity16
at less than 50%.
3. Purnama
Integrated health services post which can perform activities more than 8 times per
year, with the average number of cadres as many as five people or more, coverage of
5 main activities is more than 50%, is able to organize additional programs, and has
obtained financing from the health funds managed by participants limited to society
that is less than 50% of family heads in the working area.
15 Cadre is member of society who voluntary conduct the activities regarding with simple health
practices in integrated health services post. 16 5 main activities of integrated health services post are : promoting mother and children health,
family planning, immunization, nutrition, the preventive of diarrhea.

38
4. Mandiri
Integrated health services post which carries out the activities of more than 8 times
per year by the average number of cadres as many as five people or more, the
coverage of the five main activities are more than 50%, is able to organize additional
programs, and has obtained financing from the health funds managed by community
participants more than 50% of family heads who live in the working area.
Lack of energy and protein in children is still a public health problem for Indonesia.
Based on Basic Health Research (2010), as many as 13% have less weight, of whom
4.9% had very poor weight gain. The same data shows 13.3% of children
underweight, of which 6.0% of children are very thin and 17.1% of children are short.
This situation affected the infant mortality rate which is still high because, according
to the WHO more than 50% of infant and child mortality is linked to malnutrition,
and therefore nutrition problems need to be handled quickly and appropriately.
One way to address the problem of undernourishment is make the treat severe
malnutrition in an attempt to handle each case found. At this time along with the
development of science and technology, treatment of malnutrition show that this case
can be handled by two approaches. Malnutrition with complications (anorexia, severe
pneumonia, severe anemia, severe dehydration, high fever and decreased
consciousness) must be treated in hospital, health center care, Nutrition Recovery
Center (PPG) or Therapeutic Feeding Center (TFC).

39
While severe malnutrition without complications can be performed on an outpatient
basis. Treatment of malnutrition on an outpatient basis and hospitalization is the
answer to the implementation of Minimum Service Standards (MSS) Division of
Nutrition Improvement, in each child’s malnutrition should receive standard
treatment. The basic principle implemented in the handling of this malnutrition is to
increase the reach / coverage of nutritional recovery, the discovery of cases of
malnutrition at an early stage so that treatment can be done early and be
comprehensive, the handling of child malnutrition are tailored to the child's condition
to determine whether the child needs hospitalization or outpatient care. The handling
of child malnutrition is an activity that is integrated with the existing health care
system; the handling of child malnutrition involves the role of inter-related sectors,
NGOs, professional organizations and community leaders. Monitoring the
implementation of child malnutrition needs to be done continuously to ensure service
performance appropriately and effectively.
2.2.7. Conceptual Framework
The conceptual framework on performing this research, can be described in the
following figure.

40
Figure. 5. Conceptual Framework
Source: William Dunn’s theories employed by the writer.
Health Problems :
Children Malnutrition Cases
Local Government Strategic Policy dealing with children
malnutrition
Therapeutic
Feeding Center
Nutritional Program in
Public Health Care
Analyzing the Data
The Result of Analyzing the
Data
Recommendation
Appropriateness
Responsiveness

41
CHAPTER III
SOCIAL SETTING
This research is conducted in Depok Municipality, West Java Province, Indonesia.
This chapter describes Depok Municipality including its the geographical location,
the government, the population and society.
3.1. General Description of Depok Muncipality
3.1.1. Depok Municipality
Depok Municipality is one area in West Java Province, Indonesia on the western
border of Jakarta. Depok municipality is geographically located at 6°23′24″S
106°49′48″E and has an area of 200.29 km2 and 1,374,903 people in 2005, with a
density of 6,865 people/km2. For 2007,the populations were 1,412,772 and in 2010,
the population in Depok becomes 1,751,696. Depok is divided into 6 subdistricts:
Beji, Cimanggis, Limo, Pancoran Mas, Sawangan, and Sukmajaya.
Figure. 6. Depok Municipality Location
Source : www.depok.go.id.
42
The Therapeutic Feeding Center is located in 2 health centers. They are Cimanggis
and Sukmajaya health center.
3.1.2. Cimanggis Village
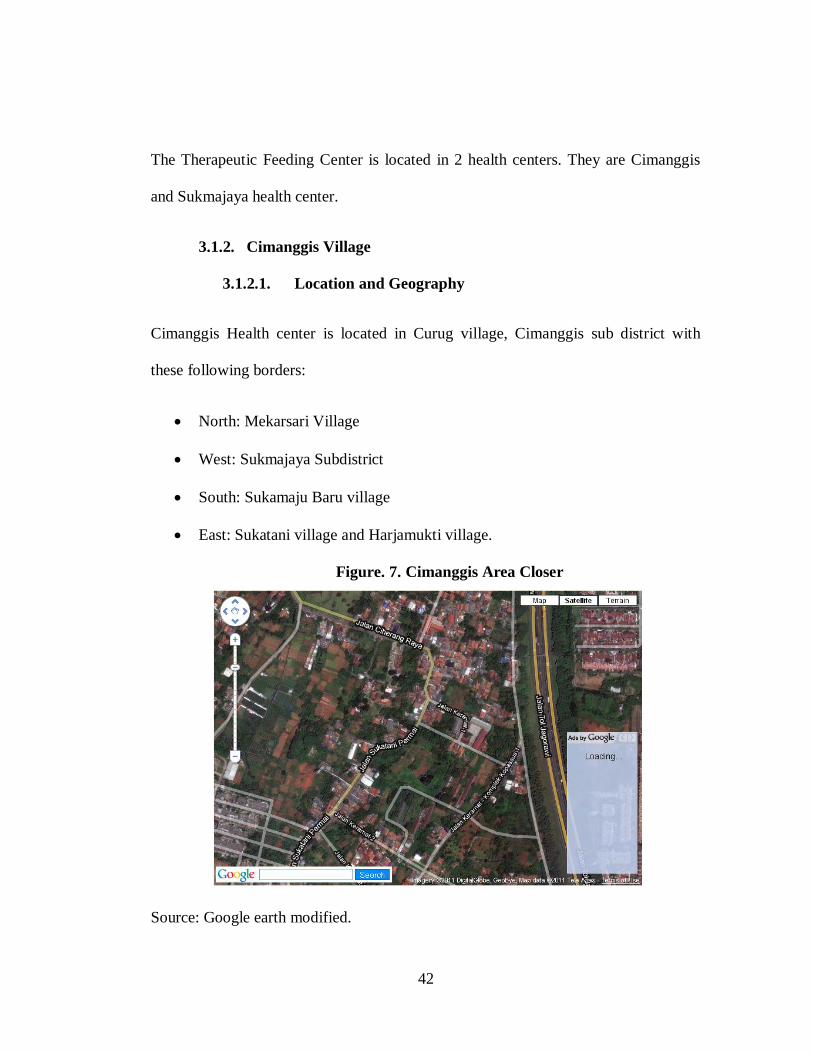
3.1.2.1. Location and Geography
Cimanggis Health center is located in Curug village, Cimanggis sub district with
these following borders:
North: Mekarsari Village
West: Sukmajaya Subdistrict
South: Sukamaju Baru village
East: Sukatani village and Harjamukti village.
Figure. 7. Cimanggis Area Closer
Source: Google earth modified.

43
The area of Cimanggis health center is 350 km². The population is 93/km². The
authority area covers two villages that is, Cisalak Pasar and Curug.
The visit from the village to the health center is done by public transportation. The
condition of the villages can be seen in the table below.
Table 2. The Condition of the Villages
No.
Village
The farther
distance from the
health center
The average
time needed
Level of
dependent
condition
1. Cisalak Pasar 2.5 20 minutes Medium
2. Curug 2 15 minutes Medium
Source : Cimanggis PHC.
Table 3.The Authority Area of Cimanggis Health Center
No.
Village
Neighborhood
Village
Integrated
Health Service
Cadre Area (km2)
1. Cisalak Pasar 9 16 80 165
2. Curug 11 14 87 185
Total 20 30 167 350
Source: Cimanggis PHC.
3.1.2.2. Demography
Based on data from Cimanggis subdistrict 2010 the population of authority area of the
health center is 32,414 persons. Based on sex classification, from the total of 32,414
population, 49% (16,091 person) is male and 51% (16,323 Person) is female.
We can see the age classification of the population from the table below.

44
Table 4. The Age Classification of the Population
Source: Cimanggis PHC.
In 2010, the number of the population based on the age, the most dominant is the age
between 5-14 years old that is 6,774 person or 20% from the whole population.
Further, there are 11, 283 person or 34% population that includes the unproductive
age ( 0-14 year). Productive age (15-64 year) in 2010 is 21,131 person or 65 % from
the total of the population in Cimanggis. It means the number of productive age is
more than a half of the entire population. While the number of old people (>65 year)
in 2010 is 1,047 / 3%. Different from 0-14 year and 15-64 year, the population for 65
year, the ratio of male and female is 98.6% this data is same with data in 2009 which
2.282 2.227
6.774 6.738
3.567
1.047
3.322
5.693
11.76511.329
5.730
3673
0
2.000
4.000
6.000
8.000
10.000
12.000
14.000
0-1 1-4 5-15 15-44 45-64 >65
Po
pu
lati
on
Age Classification
Age classification
2010
2009

45
shows that the number of male is lesser than female in the classification of more than
65 year old. This shows that male’s life expectation is lower than female.
Table 5. The Number of the Population Based on Sex
Source: Cimanggis PHC.
3.1.2.3. Population density and population growing
The highest level of population density is in Cisalak Pasar Village that is 106
person/km2. In Curug village it is 81 person/km
2. As we can see in the table below.
Table 6. Population Density 2010
No. Village Area (km2) The number of
population
The density of
population/km2
1. Cisalak Pasar 165 17,457 106
2. Curug 185 14,957 81
Total 350 32,414 93 Source: Cimanggis PHC.
8.500
7.591
8.957
7.366
0
1.000
2.000
3.000
4.000
5.000
6.000
7.000
8.000
9.000
10.000
Cisalak Pasar Curug
Male
Female
46
3.1.2.4. The Population Based on Education
Based on data in 2010, the population of people 10 year above who do not get
education is 13,096/40%; graduate from elementary education is 4,387 people/20%;
graduate from junior high school is 5,142 people/24%; graduate from senior high
school is 5,492 people/25%; and 4,177 people/19% are university graduates.
It can be concluded that Cimanggis population is low in education, whereas education
level affects people health behavior.
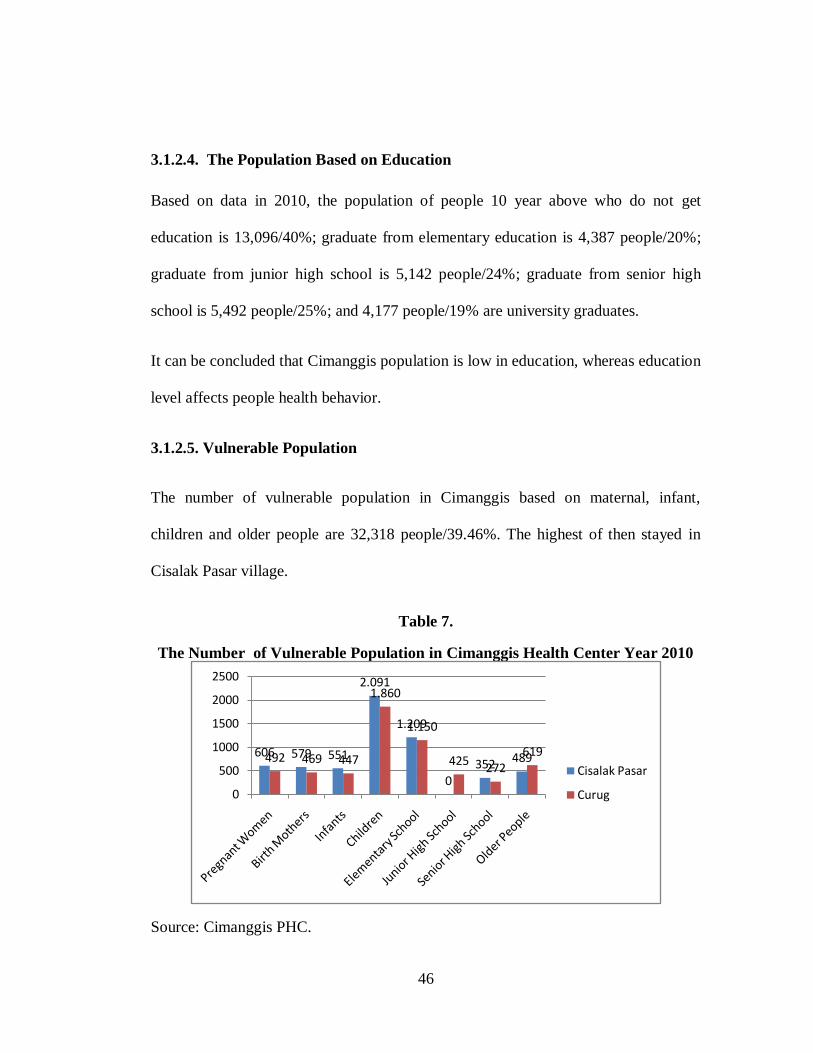
3.1.2.5. Vulnerable Population
The number of vulnerable population in Cimanggis based on maternal, infant,
children and older people are 32,318 people/39.46%. The highest of then stayed in
Cisalak Pasar village.
Table 7.
The Number of Vulnerable Population in Cimanggis Health Center Year 2010
Source: Cimanggis PHC.
606 579 551
2.091
1.209
0352 489492 469 447
1.860
1.150
425272
619
0
500
1000
1500
2000
2500
Cisalak Pasar
Curug

47
3.1.2.6. The Number of Poor People
Although Cimanggis is a prospect area with fast development, it has negative impacts
of poverty. Poor alleviating is a development priority in Depok.
Table 8.
The Number of Poor People
In Cimanggis Health Center in 2010
Village Number of
population
Poor population
Number of poor
people
% Number of poor
families
%
Cisalak
Pasar
17,457 2,594 15 503 8.67
Curug 14,957 3,829 25 318 6.68
Total 32,414 6,423 19 821 7.77
Source: Cimanggis PHC.
Table 9.
Children’s Nutritional Status in Cimanggis Health Center in 2009-2010
Nutritional Status Year 2009 Year 2010
Number % Number %
Malnutrition 12 0.39 20 1
Undernutrition 175 5.63 99 3
Good nutrition Status 2,856 91.95 2.854 93
Over Nutrition Status 63 2.06 90 3
Source: Cimanggis PHC.
Poverty is the root of the problem of children malnutrition, as parents busy with
earning money often neglect their children, in nutritional as well as parenting aspect.

48
3.1.2.7. General Description of Cimanggis Health Center
Cimanggis Health Center was built in 1968, and at that time it was the only health
center in Cimanggis sub district and must serve all of the people from the villages.
Health center building has been renovated for several times. The most prominent
renovation is on 17 April 2002. The health center built an inpatient room equipped
with 15 beds. The last renovation was done in 2007, the beds are added to be: 12 for
general treatment, 8 beds for TFC and 6 beds for maternal care.
The location of Cimanggis Health Center is at a strategic point, namely at Jalan Raya
Jakarta-Bogor km. 33 and traversed by various types of public transport making it
very easy to be reached by needy people. The area covers the three villages i.e.
villages waterfall, Cisalak Market and Mekarsari with the population of 41,512
inhabitants. Fostering 30 Posyandu (Integrated Health Services) spread evenly in each
RW (neighborhood). Since June 2008, the working area is reduced because of
establishing of new health center in Mekarsari village. Cimanggis Health Center is
implementing Quality Management System ISO 9001-2008; it began with the
implementation of ISO in November 2009. It requires a shared commitment to
improve the quality of health services in accordance with service standards.

49
Figure. 8. Cimanggis Health Center
A. Organizational Structure
Until now, the existing structures could perform basic tasks in a good clinic,
but for the future, further development is necessary due to some activities that
have not been accommodated, such as marketing activities and supervision.
B. Health Worker
Table 10 describes health workers in Cimanggis health center based on the level of
education in 2010.

50
No. Level of Education Amount Additional
Information
1. Physicians
- Doctors 5
- Dentists 2 1 Head of Health
Center
2, Nursing
3 year Diploma of Nurse 3
3 year Diploma of Midwives 2
3 year Diploma of Tooth cares 0
Nursing School Graduates 7
One year Diploma midwives 5
Tooth care School Graduates 1
3. Pharmacy
- Pharmacist 0
- SMF / SAA 1
4. Public Health 1
Bachelor of Public Health 1
3-year diploma of Sanitarian 0
One-year school of Nutrionist 1
One year diploma of Sanitarian 1
5. Laboratory Analist 1
3-year Diploma of Fisiotherapi 1
6. Non-medical worker resources
- Non-health bachelor degree 0
- Senior High school 6 5 Non Gov. Officer
- Yunior High School 2 2 Non Gov.Officer
- Elementary school 3 2 Non Gov.Officer
Total 42
Health Workers 31
Non-health Care Workers 11
Source: Sukmajaya PHC.
Most of health workers in Cimanggis health center are from health care background
namely 73%, while non-health care background is only 35%.

51
C. Health Facilities
There are three buildings built in 1968 and have been renovated for
several times. The last renovation was conducted in 2007.
C.1. Main building
It was built in 2007 and consists of: Floor 1, Registration room,
Unit emergency, General clinics, Isolation room, Medicine Room,
Hospitalized room with 9 beds, Nurse room and kitchen. Second
floor consists of Administration room, Head of health center room,
meeting room, children policlinics room, nutrition room,
secretariat room, Isolation room and hall.
C.2. Vehicles
Table 11. Vehicles and Their Condition
No. Kind of Vehicles Condition Additional
Information
1. Ambulance Toyota F.420 F Year
1986
Damaged Propose to be
eliminated
2. Ambulance Toyota Dyna B1268
UQ Year 2003
Damaged
3 Ambulance Siaga Suzuki B 1191
UQ Year 2007
Damaged
Source : Sukmajaya PHC.
No. Kind of Vehicles Condition Additional
Information
1. Motorcycle Yamaha YT 115 F
26884 F Year 1986
Damaged Propose to be
eliminated
2. Motorcycle Yamaha RX K135 B
3862 UQ Year 2006
Damaged
3. Motorcycle Suzuki EN 125 B
3895 UQ Year 2006
Damaged
Source: Sukmajaya PHC.

52
Figure. 9. One of the Vehicle Owned by Cimanggis Health Center
3.1.3. General Description of Sukmajaya Health Center
Sukmajaya health center was built in 1981, with the authority of 55,14 km2 or 27,53%
of Depok area, Sukmajaya subdistrict itself borders with:
North borders with Pondok Cina
South borders with Kalimulya, Ciledug & Sukmajaya
West borders with Kemiri Mutia & Depok
East borders with Abadijaya & Baktijaya
The working area of Sukmajaya hearth center covers 2 villages, namely Mekarjaya &
Tirtajaya.
Table. 12. The Working Area of Sukmajaya Health Center
No. Village Area (km2) The amount of
Neighborhood
The amount of
Integrated
Health Services
1 Mekarjaya 26,60 31 28
2 Tirtajaya 28,54 8 9
Jumlah 55,14 39 37 Source: Sukmajaya PHC.

53
3.1.3.1.The Population Based on Sex and Age
Based on Sukmajaya sub district data, the population of Sukmajaya is 52,858 persons.
It decreased as 0.35% from the previous year. The population based on age
classification can be seen in table 13.
Based on sex, there are 25,400 people/48.05% are male and 27,458/51.95% are
female, as we can see on table 13.
Table 13. The Population Based on Age Classification
Source: Sukmajaya PHC.
The detail number including sex classification can be seen in the following table.
0 – 1 1 – 4 5 – 14 15 – 44 45 – 64 > 65
2008 998 2.894 8.995 26.793 9.564 2.352
2009 1.028 2.971 9.235 27.555 9.834 2.424
2010 1.023 2.969 9.093 27.551 9.845 2.427
0
5000
10000
15000
20000
25000
30000
2008
2009
2010

54
Table 14. The Population Based on Age and Sex Classification
No. Age
Classification
Year 2008 Year 2009 Year 2010
M F Total M F Total M F Total
1 0 – 1 513 485 998 507 521 1,028 507 516 1,023
2 1 – 4 1,486 1,408 2,894 1,468 1,503 2,971 1,456 1,513 2,969
3 5 – 14 4,699 4,296 8,995 4,612 4,623 9,235 4,484 4,559 9,093
4 15 – 44 13,482 13,311 26,793 13,231 14,324 27,555 13,228 14,323 27,551
5 45 – 64 4,713 4,851 9,564 4,614 5,220 9,834 4,624 5,221 9,845
6 > 65 1,120 1,232 2,352 1,094 1,330 2,424 1,101 1,326 2,427
Total 26,013 25,576 51,589 25,526 27,521 53,047 25,400 27,458 52,858
Source: Sukmajaya PHC.
Thera were two villages in Sukamajaya Subdistrict in year 2010
Table. 15. The Population in Sukmajaya Subdistrict
No. Village The number of population
M F Total
1 Mekarjaya 21,720 23,985 45,705
2 Tirtajaya 3,680 3,473 7,153
Sukmajaya Subdistrict 25,400 27,458 52,858
Source: Sukmajaya PHC.
The highest density of Sukmajaya area is Mekarjaya village that is 1,718 people/km2
while Tirtajaya village is 251 people/km2. It means that the population of Sukmajaya
health center working area is 959/km2,

55
Table. 16.
The Population Density
No. Village Area (km2) The number
of population
Population
Density (Km2)
1. Mekarjaya 26.60 45,705 1,718
2. Tirtajaya 28.54 7,153 251
Sukmajaya PHC 55.14 52,858 959
Source : Sukmajaya PHC.
Table. 17. The Number of the Population Based on Level of Education
Source: Sukmajaya PHC.
13,75%
31,80%
21%
15,99%
17,39%
The Number of the Population Based on Level of Education
Univ. Graduate
Senior High School
Junior High School
Elementary Graduate
Not having certificate

56
Table 18. The Number of Vulnerable Population
Source: Sukmajaya PHC.
Bumil Bulin Bayi Balita SD SMP SMA Usila
Mekarjaya 2.098 2.003 1.908 4.556 6.514 1.496 1.615 3.438
Tirtajaya 371 354 337 1.065 1.199 0 0 513
PKM S. Jaya 2.469 2.357 2.245 5.621 7.713 1.496 1.615 3.951
0
1.000
2.000
3.000
4.000
5.000
6.000
7.000
8.000
9.000
The Number of Vulnerable Population
Mekarjaya
Tirtajaya
PKM S. Jaya

57
Figure 10. The Organizational Structure of Sukmajaya Health Center
Source: Sukmajaya PHC.
Head of Health Center
Unit VII
Special Clinic
SUB UNIT
Psychology
SUB UNIT
Eye Health
Unit VI
Supporting Unit
SUB UNIT
LABORATORIUM
SUB UNIT
Pharmacy
SUB UNIT
Planning
Unit V
Nursing
SUB UNIT
Treatment
Unit IV
Env. Health
SUB UNIT
KESLING
SUB UNIT
UKS/UKGMD
SUB UNIT
PHC
Unit III
Oral Health
SUB UNIT
Treatment
SUB UNIT
Oral Health
SUB UNIT
Private Services
Unit II
Maternal&Child health
SUB UNIT
KB
SUB UNIT
Nutrition
SUB UNIT
Elderly
SUB UNIT
PKM
SUB UNIT
KIA
Unit I
P2M
SUB UNIT
P2M
SUB UNIT
IMMUNIZATION
ADM. section
TreasurerADMINISTRATION

58
Table. 19. Health Worker in Sukmajaya Health Center in 2010
No. Level of Education Total %
1 Medis
- Doctors 5 15.15
- Dentists 3 9.09
2 Nursing
3 year-diploma of Nurse 1 3.03
3 year-diploma of Midwife 5 15.15
3 year-diploma of tooth care 1 3.03
School of Nurse 5 15.15
1 year of Midwife 2 6.06
School of tooth care 0 0
3 Pharmacy
- Pharmacist 0 0
- School of Pharmacist 1 3.03
4 Public Health
Bachelor of Public Health 2 6.06
3 year-diploma of Sanitarian 0 0
3 year-diploma of Nutritionist 0 0
1 year-diploma of Sanitarian 0 0
1 year-diploma of Nutritionist 0 0
5 Health Analyst 1 3.03
6 Non-health care educational
background
- Bachelor of Non-health 1 3.03
- Senior High School 5 15.15
- Junior High School 1 3.03
- Elementary school 0 0
Total 33 100
% Health workers 26 78.79
% Non-health care workers 7 21.21
Source: Sukmajaya PHC.

59
Figure 11. Ambulances Owned by Sukmajaya Health Center

60
CHAPTER IV
RESEARCH METHOD
4.1. Type of the Research
Based on the problem statement and research purposes, this research focuses
on analyzing of the implementation of nutritional programs held by Public Health
Care in Depok municipality in reducing of malnutrition prevalence in this area. The
objective of this research is giving a description on the implementation of nutritional
programs, describing the constraints and challenges faced by the implementers and
evaluating the on-going implementation by using appropriateness and responsiveness
criteria of the programs. Accordingly, this research is conducted to describe situations
and events. According to Schwandt (1997) in McNabb (2002) the descriptive
research is a kind of strategy in Qualitative Research. Creswell (1994) in McNabb
(2002) defined Qualitative Research as an inquiry process of understanding a social
or human problem, based on building a complex, holistic picture, formed with words,
reporting detailed views of informants, and conducted in a natural setting.
However, both quantitative and qualitative research strategies are considered
legitimate designs for research in public administration and all other social and
administrative sciences. Researchers in the social and administrative sciences are no
longer required to follow a single design for their investigation. Instead, many
different approaches are possible.
61
4.2. Source of Data
Source of data is one of the most vital aspects in the research. If there is error
in using or understanding the source of data, then the data obtained will also be
missed. Therefore, researchers should be able to understand which sources of data are
used in the research.
According to the research focus and problems, the sources of data in this
research are:
1. Informants
Choosing the informant is based on the subject matter related to the title,
research focus and research problems, person owning some data and ready to
give them to the researcher. The researcher uses interview and observation to
get the data from the informants.
In this case the information was obtained from: local government officers
(Head of Depok Municipality Health Department, Head of Section of Family
Health and Nutrition Depok Municipality, Head of Public Health Care Depok
Municipality, Nutrition Section staff in Health Centers, as well as parents and
relative of malnutrition children.
2. Documents

62
Documents used in this research are local government rules, Mayor Decree of
TFC, other relevant regulation, Health center documents, performance report
of nutritional program, literatures and relevant studies and media publications
related to the issues of malnutrition.
4.3. Focus of Research
Because there are vast problem, then in qualitative research, researchers will
restrict research in one or more variables. Thus, in qualitative research there is so-
called problem definition. Limitation of the problem in qualitative research is called
focus, which contains the principal problems that are still common.
Focus of the research is very important for it limits the study and source of
data. Without the research focus, the researcher will be trapped by abundance of
obtained data. Through the instruction and tuition focus, the researcher may know
what is required to be collected and which irrelevant data need not be entered into the
thesis.
Moleong (1998) argued that research focus plays an important role as a means to
direct research in order to ensure that relevant and useful data/ evidence is collected.
This thesis focuses the research in:
1. The implementation of the Nutritional Programs in Public Health Center.
2. Explaining the constraint and challenges faced by the health workers in
implementing the Nutritional Programs in Public Health Care.

63
3. Explaining the aspect on strengthening the policies, programs and interventions
regarding with reduction of malnutrition prevalence in Depok municipality.
4.4. Location
This research takes place in Depok municipality, considering that Depok has two
Therapeutic Feeding Centers namely in Cimanggis and Sukmajaya health centers as
the leading institution in improving children nutritional status.
4.5. Data Collecting Process
Data collecting process covers the research and question problems. The data
collection can be done with:
a. Interview
Interviews are used as one of data collection techniques, if researchers want to
conduct a preliminary study to find problems which must be investigated, and also,
when researchers want to know things from more in-depth respondents with small
number of respondents17
.
Interviews can be conducted in a structured and unstructured method, and also
can be done face to face or using the phone.
1. Structured Interview
Structured interviews used as data collection techniques, when the
researcher or data collector already know for sure what information will
be obtained. In an interview, besides bringing the interview
17 Sugiyono, Metode Penelitian Kuantitatif, Kualitatif dan R&D. Alfabeta, Bandung, 2008, p. 137.

64
instruments as a guidance, the researcher can also use other tools like a
tape recorder, pictures, brochures and other materials that can assist the
process of interview.
In this research, the interview involves : local government officers (Head of
Depok Municipality Health Department, Head of Section of Family Health and
Nutrition of Depok Municipality, Head of Public Health Care of Depok Municipality,
Nutrition Section staff in Health Centers, as well as parents (16 mothers were asked
several open-ended questions about how the program was received by them) and
relatives of malnutrition children.
2. Unstructured Interview
Unstructured interview is a free interview where the researcher does not
use the interview guidelines that have been arranged in a systematic and
comprehensive data collection. Interview guidance is used only in the
form of broad outline issues to be questioned.
Unstructured interviews or open interviews are often used in
preliminary studies or even for a more in-depth research about the
respondents. In a preliminary study, researchers try to obtain
preliminary information about various issues or problems that exist in
the object, so the researchers can determine exactly what the problem or
variables that must be investigated. To obtain a more complete picture
of the problem, the researchers need to conduct an interview to the
parties that represent different levels in the object.

65
In unstructured interviews, researchers do not know exactly what data
will be obtained, therefore researchers listen more to what the
respondents report.
In this research, the unstructured interview involved community
members (some cadres in integrated health services post).
b. Observation
Observation as data collection techniques has specific characteristics
compared with other techniques, namely interviews and questionnaires. If interviews
and questionnaires deal with people, then the observation is not limited only to people
but also other natural objects.
Sutrisno Hadi (1986) suggested that observation is a complex process, a
process that is composed of various psychological and biological processes. Two of
the most important are the processes of observation and memory.
In terms of the implementation process of data collection, observation can be
identified as non-participant observation and participant observation. Furthermore, in
terms of instrumentation used, the observations could be classified into structured and
unstructured observation.
c. Documentary Method
Documentary method is one method of data collection used in social research
methodology. Documentary method is a method used to browse historical data. Most
of the available data are: letters, diaries, reports, official documents etc. Official

66
documents can be memos, notices, instructions, rules of the institution. Other forms
of data available consist of magazines, newsletters, announcements etc.
The documentary data consists of : Health center data, TFC data, and Annual
reports.
4.6. Design of Data Analysis
The data analysis used in this research is interactive analysis taken from Miles
and Hubberman (1992) that describes the qualitative data analysis in three activities
lines: data collecting, reporting and reducing.

67
Figure. 12. Design of Data Analysis
a. Data Reduction. In qualitative research, data reduction does not necessarily
refer to quantifying nominal data. Qualitative data need to be reduced and
transformed in order to make them more readily accessible, understandable, and
to draw out various themes and patterns.
b. Data Display. The notion of data display is intended to convey the idea that data
are presented as an organized, compressed assembly of information that permits
conclusions to be analytically drawn. These displays assist the researcher in
understanding and observing certain patterns in data or determining what
additional analysis or actions must be taken
.

68
c. Conclusions and Verification. After the data have been collected, reduced, and
displayed, analytic conclusions may begin to emerge and define themselves more
clearly and definitely (Miles and Hubberman, 1992).
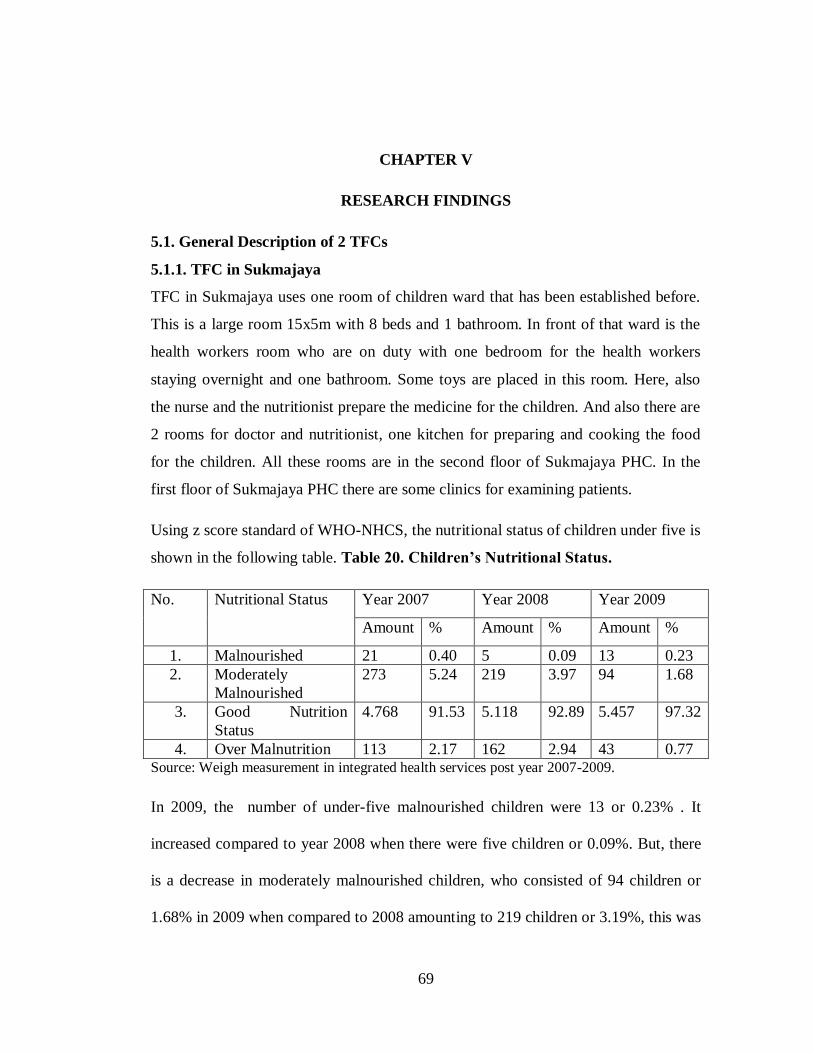
69
CHAPTER V
RESEARCH FINDINGS
5.1. General Description of 2 TFCs
5.1.1. TFC in Sukmajaya
TFC in Sukmajaya uses one room of children ward that has been established before.
This is a large room 15x5m with 8 beds and 1 bathroom. In front of that ward is the
health workers room who are on duty with one bedroom for the health workers
staying overnight and one bathroom. Some toys are placed in this room. Here, also
the nurse and the nutritionist prepare the medicine for the children. And also there are
2 rooms for doctor and nutritionist, one kitchen for preparing and cooking the food
for the children. All these rooms are in the second floor of Sukmajaya PHC. In the
first floor of Sukmajaya PHC there are some clinics for examining patients.
Using z score standard of WHO-NHCS, the nutritional status of children under five is
shown in the following table. Table 20. Children’s Nutritional Status.
No. Nutritional Status Year 2007 Year 2008 Year 2009
Amount % Amount % Amount %
1. Malnourished 21 0.40 5 0.09 13 0.23
2. Moderately
Malnourished
273 5.24 219 3.97 94 1.68
3. Good Nutrition
Status
4.768 91.53 5.118 92.89 5.457 97.32
4. Over Malnutrition 113 2.17 162 2.94 43 0.77 Source: Weigh measurement in integrated health services post year 2007-2009.
In 2009, the number of under-five malnourished children were 13 or 0.23% . It
increased compared to year 2008 when there were five children or 0.09%. But, there
is a decrease in moderately malnourished children, who consisted of 94 children or
1.68% in 2009 when compared to 2008 amounting to 219 children or 3.19%, this was

70
caused by an increase in nutritional status after done diverse intervention. One of
which is Supplementary Feeding recovery and it is expected to be done in the coming
year.
In Sukmajaya Health Center, I met a doctor, who is in charge as TFC coordinator, a
nutritionist who is as a civil servant, a nurse (civil servant) and 6 health workers who
are hired annually, and two chefs who cook the food. In depth interview that I
conducted both with health worker also with the parents of the undernourished
children, I found the constraints faced by the health workers in taking care
undernourished children. From the parents’ view, I found why the cases of not
continuing the treatment happened. It is because the mothers must accompany the
children hospitalized in TFC, while they should work or take care other children they
have, that is why they choose to go home rather than continue the treatment until their
children have good nutritional status. Most of the children who were hospitalized in
this TFC work as housekeeper, construction worker and minivan driver or other
informal labor, who can be categorized as poor people18
. A majority of children
attending the TFC come from families who because of economic constraints, cannot
improve the nutrition and health status of their children. As stated by the TFC
coordinator:
18 According to World Bank poor people are those who live below US$ 1.25 Purchasing Power Parity
(PPP) per day. In Indonesia, the national poverty line is those who earn US$ 1.55 PPP per day (Rp
166,697 person/ month in 2007)

71
“Poverty is another factor that causes children malnutrition, besides parenting, in
average from 2008 when TFC established until now, 85% patients come from poor
family. After discharge from TFC, they usually come back asking for therapeutic
milk. So the main problem is poverty, in these cases a rise in income or an increase in
food supply is necessary if children are to have optimal growth.” (Interview 13 April
2011).
In 2010 the results of examination of malnutrition children found from the clinic
examination is seen in the following table.

72
Table 21. DATA of Children Malnutrition found in PHC PERIODE JANUARI - 4 NOVEMBER 2010
NO Name Age (Months)
W/L-H Z-SCORE
Date of coming Information
1 Dimas Ramadani 17 7.5/73.2 -2.6 SD 1-Feb-10
2 Anisa Salsabila 14 7.3/96 -2.87 SD 6-Feb-10
3 Marlidia 11 5.75/69.3 -2.9 SD 19-Mar-10
4 Bagas 48 9.8/96 -3.65 SD 09 Apr 2010
5 Wardah Husniah 10 5.3/68.3 -3.5 SD 29-Apr-10
6 Aisah 20 7.7/78 -2.7 SD 29-Apr-10
7 Muslimah 13 7.7/78 -2.8 SD 22-May-10
8 Dzakky. Z 19 7.4/76.2 -3.25 SD 24-May-10
9 Anggi Mahdania 17 8.0/81 -3.5 SD 8-Jun-10
10 Zaka Bagus 21 8.1/79 -3.25 SD 18-Jun-10 No identity as Depok citizen
11 Zaura 8 6.0/67.8 -2.8 SD 22-Jun-10
12 Sibly 24 8.1/85 -3.7 SD 26-Jun-10
13 Aisyah 50 9.9/92.5 -3.7 SD 7-Jul-10
14 Nurahman 12 6.0/74.4 -3.7 SD 24-Jul-10
15 M. Rafi 24 8.0/84.4 -4.2 SD 24-Jul-10
16 Dwiki Rizki. A 20 6.9/78.3 -3.8 SD 26-Jul-10
17 Alfin Hafis 54 11.0/91 -2.6 SD 29-Jul-10
18 Rido Alfiansyah 2 3.25/54.3 -3.5 SD 5-Aug-10
19 Yuri 6 4.9/61.5 -2.8 SD 14-Oct-10 First visit tgl5-8-10 Second visit tgl24-8-10
W/L: 3.6/59.3 W/L: 3.9/59.8

73
20 Risma Ramadani 23 8.5/83.0 -3.1 SD 30-Aug-10 First visit tgl6-8-10
21 Khaerunisa 12 6.9/75.0 -3.3 SD 10-Aug-10
22 Fani 16 7.5/77.0 -2.8 SD 13-Aug-10
23 Azizah 11 6.7/69.0 -2.6 SD 16-Aug-10
24 Taufik 20 8.8/80.7 -2.6 SD 20-Aug-10
25 Fahri 24 9.5/85.3 -2.7 SD 20-Aug-10
26 Fikri 18 7.9/77.4 -2.6 SD 15-Sep-10
27 Marvel 22 8.5/79.5 -2.6 SD 16-Sep-10
28 Pandu 24 8.6/82.8 -3 SD 20-Sep-10
29 Elgi 15 7.1/74.0 -3.3 SD 24-Sep-10
30 Fardhan 26 9.9/87.0 -2.6 SD 29-Sep-10 Haven’t had identity card as Depok citizen
31 Muhammad Exsa 9 6.2/70 -3.66 SD 29-Sep-10
32 Nazwa 8 5.3/63.5 -2.8 SD 6-Oct-10 Haven’t had identity card as Depok citizen
33 Gifari 21 8.1/78.5 -2.86 SD 12-Oct-10
34 Fadlan Sabil 11 7.3/74.0 -2.8 SD 25-Oct-10
35 Amelia Lulu. Z 21 7.1/74.8 2.8 SD 25-Oct-10 Will hospitalized in TFC
Tgl 28 Okt'2010
36 Dian Sofi 18 7.6/78.6 -2.8 SD 25-Oct-10 Parents refuse to their child hospitalized
Make a refusing letter
37 Rafli 15 7.2/73.9 -3.1 SD 27-Oct-10
38 M. Akbar. K 10 7.0/73.0 -3.3 SD 4 November -10

74
To explain the results of the implementation of public health care activities at TFC
the writer has compiled the data and information from Sukmajaya and Cimanggis
TFC.
I. According to Guidance of Children Malnutrition Services (2011) , The finding
of children malnutrition through:
1. The routine children weighing in integrated health services
2. The examination of the children in PHC, Hospitals or private doctors or
mid-wives.
3. The society report (mass media, NGO or others)
4. Active screening
It is suitable for what has been done in Sukmajaya TFC as the TFC
coordinator said :
“There are 4 places which send malnourished children to TFC, the first is from the
public health centers in Depok area, the second can be directly from cadres,
neighborhood village, even also happened that a local parliament member took a
malnourished child here, he knew there is TFC, which taking care malnutrition
sufferers, it means it is directly from society, the third is from the examination in our
clinics through Integrated Management of Childhood Illness (IMCI), the fourth is from
hospitals in Depok (dr. Toni Hermawan, Sukmajaya TFC coordinator, interviewed
April 13-2011).”
Based on the results of the year 2007 in Sukmajaya subdistrict, the number of infants
weighing under five categorized as "underweight" was as many as 10.78%, and the
number of malnourished children under five are as many as 70 children.
Sukmajaya has one room of treatment with 8 beds as we can see in the following
picture:

75
Figure. 13. Sukmajaya Therapeutic Feeding Center
The facilities are the infant measurement and playing properties that can be seen in
this photo below :
Figure. 14. Children Measurement and Playing Props
Based on interview with TFC coordinator the writer knows that Therapeutic Feeding
Centre is a nutrition recovery focused on malnourished children by giving them
treatment, intensive and adequate feeding based on their age and condition. The
treatment is carried out in 3 aspects, namely:

76
medical treatment, nutritional treatment and nursing treatment. Medical treatment
covers diagnosis of patients, therapy and daily check-up. Nutritional treatment covers
providing the children diet based on their condition (stabilization, transition, or
rehabilitation phase), training mothers to prepare formula food, preparing menu,
providing food for the mothers, nutrition consultation post-treatment, monitoring and
evaluating patients feeding. Nursing treatment covers observation of general
condition of patients per 24 hours, measure vital symptoms per 24 hours, educate
mothers during the treatment, collaborate with the nutritionist about the nutrition
provided, collaborate with doctors about the medicine during the treatment.
Table 22. Data of Patients in 2009 in Sukmajaya TFC.
Data of patients Amount
Total of patients in 2009 30 children
Patent with TB 22 children
Patient with cardiovascular 1 children
Patients who refer to Depok Hospital 4 children
Patients who suffer only malnutrition 1 children
Patients who left TFC without medical
authorization
4 children
Source: Sukmajaya TFC.
From the data above, the writer concluded that the constraints faced by the health
workers in TFC for most patients is the long time to recover from the disease first, as
commonly known that TB needs at least 6 months for treatment, only one patient who
suffers malnutrition, as the doctor said –in the interview, malnutrition recovery could
be shorter in time (about 3 months) if the patient suffers primary malnutrition. From

77
the interview with the nutritionist and her staff, the researcher finds other constraints
faced by them, based on:
1. Nutritional treatment aspect
The children who do not like milk
Unfinished meal given by the therapist
Impatient mothers making their babies cry who do not want to
continue eating.
Mothers who are reluctant to have the training for making formula
food.
2. Nursing treatment
The case of leaving TFC without medical authorization.
Uneducated parents in the personal and environment hygiene.
Parents’ low knowledge of health education.
Table. 23. Patients Status in Sukmajaya TFC
Table 22. Disease Found During Treatment
0
10
20
30
Ju
mla
h
STATUS GIZI PASIEN SAAT MASUK T.F.C.
2008 7 22 0
2009 14 10 1
Gizi kurang Gizi buruk Kasus khusus
Patients status entering Sukmajaya TFC
Total
Special cases Medium malnourish Malnourished

78
Table 24. Disease found during Sukmajaya TFC Treatment
From the patient data from 2008-2011 (see appendix 5.1), it is clear that most
children under care in TFC had improved their nutritional status between the times
of admission and discharge. Almost all the children have underlying complicating
pathology. It makes the length of the treatment longer than the children who only
suffer from primary malnutrition.
The activities of mothers’ participation can be seen in the following pictures:
1 1 1
0
0.5
1
PENYAKIT YANG DI TEMUKAN SELAMA
PERAWATAN TFC TAHUN 2008
Jumlah Kasus 1 1 1
HIV (+) JANTUNG DOWN
Disease found during Sukmajaya TFC Treatment in
2008
TOTAL
Heart

79
Figure.15. Mothers Involving
When evaluating such a program, it is important not only to evaluate its effectiveness
but also how it is received by the clients. The mothers (16 mothers) were asked
several open-ended questions about this and the responses were analyzed.
To the question : “What did TFC do for your child?”, the majority of the mothers (13
mothers (81%)) in 2 TFCs answered in terms of better health or better growth of the
child. When asked if TFC did anything for them, The majority of the mothers again
responded in terms of their child having better health or receiving foods and
medication. Other 11 mothers said TFC had taught them about better foods for the
child and the family. When asked if TFC was doing what was expected or if there
was something else they wanted to do, the majority appeared satisfied with TFC. The
presence of the mother is a golden opportunity to make her aware of good child
feeding and hygiene practices, and to learn by doing. Mothers of children staying in
TFC are required to assist with the running of TFC. The participation of mothers
would be especially important in providing an active learning experience for them. It

80
would help teach improved child feeding practices using local foods19
, and to instruct
the mothers in other aspects of health and hygiene.
Table 25. The curriculum for Mother in TFC
Material Facilitator Equipment
Knowing the nutritional content of food Nutritionist Food model
Preparing meals Nutritionist Food model
Personal Hygiene Nurse Hygiene kit
Sanitation Nurse Cleaning tools
Hygiene for Kids Nurse Hygiene kit
Child Growth Nurse and
Nutritionist
KMS: Kartu Menuju Sehat:
Growth monitoring card
Children development Nurse and
nutritionist
Check list of growth and
development stimulation
Integrated health services All health
workers
Integrated health services
guidance, cadre guidance
book
Health Issues Nurse and
Nutritionist
Leaflets, posters, flip charts
Nutritious snacks Nutritionist Food model, leaflets
Another factor which may influence the effectiveness of the education process may
be the degree of concern for fathers. Until now the mother has been assumed to be
responsible for child-feeding and caring practices, and it is her whom the program
19 collaborative effort to build more locally based, self-reliant food economies - one in which
sustainable food production, processing, distribution, and consumption is integrated to enhance the
economic, environmental and social health of a particular place. (Freenstra G, 2002)

81
tries to reach. The father may however have an important role to play. He could be a
general supervisor of the behavior of the mother and may be the only one who can
initiate change. In order for the mother to value the teachings of TFC and to be
motivated to change her behavior, it may be necessary to start by motivating the
father or at least by recognizing his role.
5.1.2. TFC in Cimanggis
Health workers working in TFC Cimanggis include 1 doctor, 5 nutritionists and 4
nurses. In the in-depth interviews I did, I focused on the policy and implementation
of nutrition programs conducted at the PHC. According to the head of Cimanggis
health center, Depok city, dr. Sri Suliswati, government policies were in line with
local conditions in Depok. She said that the Mayor of Depok city has high attention to
the prevalence of children malnutrition, as stated in her following remarks :
“The concent of Depok city about children malnutrition is very good, in
Depok we have sub district meeting every month, every Tuesday second week
regularly. In the meeting, all the public health problems are discussed. Even
the Mayor of Depok city direcly ask to the head village, how many
malnutrition children in their area, what their names are. The Mayor really
care about the mother and children health.” (interview with Head of
Cimanggis PHC, 13 April 2009).
As a buffer zone of the capital country, apparently in Depok、 the prevalence of
children malnutrition are still high, In the year 2010, 439 under five malnourished
children were found. Not all under five malnourished children can be handled in the
TFC, the policies adopted in TFC are that the children were treated for recovery,

82
increase body weight with supplementary feeding and formula WHO20
.There is no
medical treatment like intravenous infusions. Child's condition is monitored daily.
Weight loss is monitored to see the development of nutritional status. The picture
describes one of malnutrition child with his mother, and the activity done by health
worker in Cimanggis TFC.
Figure 16. Cimanggis TFC Situation
Field research in Pancoran Mas Health Clinic
In Pancoran Mas, I met the head of Pancoran Mas PHC and 3 health workers. From
them, I learned that the implementation of nutritional recovery centers in the working
area was done by assigning the weekly WHO formula to parents of patients with
malnutrition. They were not hospitalized, they are required to be examined weekly in
order to know the improvement of the patients’ nutritional status. In this PHC, the
20 There are 3 kinds of formula WHO: 75, 100 and 135, consist of milk, sugar, vegetable oil and
electrolytes with different composition.

83
implementation of the reducing malnutrition cases is done in three ways : counseling,
Supplementary feeding food for three months, if it doesn’t work, the malnutrition
children will be referred to TFC. It was stated by the nutritionist (Mrs. Popy Sopiati)
in Pancoran Mas PHC :
“At first, if we find malnutrition children, we would intervene through counseling, if
they are categorized as poor people with difficulty to fulfill the necessities of
nutritious food for their children, they will be given supplementary feeding within 3
months. If it doesn’t work, and doesn’t lift up the children nutritional status, we refer
them to TFC Cimanggis or Sukmajaya. The criterion that the children are still in poor
nutritional status is if W/L or W/H less than -3SD, or less than -2.5 with bad general
clinical assessment.” (interview transcript, August 2, 2010).
Field research in Depok Department of Health, in this office I met 3 informants from
nutrition section to find out the nutrition program implementation in the upper
reaches.
Cases of malnutrition are still found in Indonesia, including in Depok municipality.
This problem is very serious, because if it is not handled quickly and carefully, it will
lead to the death of the sufferer (as has been happened in Depok municipality). In
2002, cases of malnutrition in Depok municipality included 455 children under five
(0.45%); in 2003 as many as 602 children under five (0.57%), and in 2004 rose to 964
children (1%). In 2005, there was an increasing prevalence to 1133 children (0.99%);
in 2006 to 935 children under five (0.81%) and in 2007 to 937 children under five
(0.84%). This indicates an increase in cases of malnutrition from year to year.
Monitoring children’s nutritional status performance is done in August every year.
The children's weight is measured and malnourished children conditions are
84
monitored through a "cohort" every month. All the efforts done by local government
are to reach the agenda namely "Healthy Depok City 2010". This agenda requires the
improvement of the quality of human resources which is healthy, smart, productive
and independent. Improving the nutritional status of the population is the basis for
increasing the quality of human resources. However children malnutrition still
happens in Depok municipality as has been shown by data, therefore Depok
municipality government makes efforts to combat malnutrition, through: routine
counseling on integrated health services and health centers, training of cadres in the
neighborhood of health center, the empowerment of families through the Family
Nutrition Awareness (Kadarzi), Supplementary Feeding food (PMT) for 90 days ,
sending the patient to hospital for further treatment, Clinical Nutrition at the Health
Center, approaches through Positive Deviance (PD), tracking and surveillance.
However, the conditions of the prevalence of malnutrition in Depok municipality
shows the trend is increasing from year to year and there are some places as an
enclave of malnutrition area, that is why Depok Municipal Government has
developed a comprehensive malnourished children care places called the Therapeutic
Feeding Centre (TFC) or Children Recovery Nutrition in Sukmajaya Health Center
and Cimanggis Health Center, managed by health workers and involving community
participation. That two of TFC are a step of intervention in treatment and prevention
of children malnutrition, in which appropriate malnutrition management standards of
treatment and educating parents is done, especially for mothers, about nutrition and
health. The following scheme describes clinical examination in PHC.

85
Figure 17. The schema of clinical examination in PHC
The schema of clinical examination in PHC
Children with one or more
of the following signs:
- It looks very thin,
- Presence of oedema of
the entire body
- Body weight / body
length or weight / height
less than -3 SD
- Upper arm
circumference less than
11.5 cm (for children aged
6 -59 months)
one or more of these signs
of medical complications
following:
- Anorexia
-Severe pneumonia
-Severe anemia
-Severe dehydration
- Very high fever
- Decreased consciousness
Children with
one or more of
the following
signs:
- It looks very
skinny
- Oedema on
both the back
of the hands /
feet
- Weight /
length or
weight / height
less than -3 SD
- Upper arm
circumference
less than 11.5
cm (for
children aged
6-59 months)
and
- Good appetite
- No medical
complications
Children with
one or more of
the following
signs:
- Seen thin
- Weight /
Length or weight
/ height is less
than-3SD
- Upper arm
circumference
less than 11.5
cm (for children
aged 6-59
months) and
- Good appetite
- No medical
complications
- Weight / height
less than -2 SD to -
3 SD
- Upper arm
circumference
between 11.5 to
12.5 (for children
aged 6-59 months)
- No oedema
- Good appetite
- No medical
complications
Malnutrition with
complications
Inpatient hospital /
clinic care / TFC
malnutrition without
complications
outpatient
Moderate malnutrition
supplementary
feeding recovery

86
While from the interview with the Head of Cimanggis Health Center, the writer
knows that on April 2008 training for health personnel, who will manage the TFC is
held. The purpose of the training is to improve knowledge and skills of health
personnel referrals to the Guidelines for Management of Child Malnutrition.
The target of participants of TFC is malnourished children under five in the area of 6
districts in Depok municipality. TFC Activities Funding comes from the budgets of
Depok municipality local government and KDP HDI – Funding Program Competition
Human Development Index in 2008.
In making the explanation clearer, the writer will describe the condition, constraint
and challenges of conducting TFC.
5.2. Analyses of Research Findings
As has been stated in chapter II based on Palumbo’s theory, the writer would like to
analyze the fifth step that is dealing with the implementation (formative evaluation)
of program conducted by the local government especially the operational
implementers (Public Health Care as well as TFC) and using the criteria from
William Dunn covers of appropriateness and responsiveness. Appropriateness criteria
ask the goal of a kind of policy, in this case nutritional policy, fit for the society. The
appropriateness will evaluate the aspect of input, process and output. Another criteria
is responsiveness that is how to extend a policy to satisfy the need, preference and
value of the society.
87
From the aspect of input, focusing in appropriateness criteria, the writer finds that the
health workers in charge of TFC operation are capable human resources and have got
the training to conduct children malnutrition treatment based on the WHO Guideline
of Management of Child Malnutrition. The budget derived from local government
based on Local Government Rule No. 2 Year 2006 about RPJMD (Local
Development Planning in Medium Term) stated that malnutrition handling is one of
the development priority in Depok. Further, Depok City Major appointed Cimanggis
and Sukmajaya Health Center as TFC in Depok Municipality, with Decision Letter of
the Head of Depok Municipality Health Department No. 444/71.1/KPTS-
Umum/2008 the two of Health Centers officially has responsibility as well as
authority in conducting TFC. Based on the interview with the head of health center,
the implementer (Public Health Center) can accept funding from other parties to
improve the activities in TFC.
Planning by the health center begins with the analysis of the situation and has been
arranged through either technical operation or managerial activities. All the planning
is stated in the Annual Plan of Action of the Health Center. To facilitate the activities
to be implemented, health center already has a quite complete Organizational
Structure (figure 10). The action conducted by the head of health center will affect the
whole activities in health center itself. The head of health center is respected by
her/his partners as well as by the society thus the implementation of Nutritional
Program and Management Health Center is trusted and accountable. The head of
88
health center cannot handle the duties alone, she/he needs staff for roles such as a
nutritionist. With sufficient capability, the head of health center is able to manage a
good nutritional program.
From the aspect of responsiveness, a policy can satisfy the need, preference and value
of the society. Although the policies have been planned well, but constraints and
challenges still exist. All the malnutrition children come from poor family. There is
the case of forcedly going home by parents, because most of the mothers must earn
money (most of them are as a housekeeper). Moreover they should take care of other
children they have at home (mothers spend days in TFC during their children
treatment).
5.3. Conclusion and Recommendation
Children malnutrition has not been considered as a disease of Depok society,
therefore the cross sectoral role are badly needed in finding the cases. Although the
children have been diagnosed as malnutrition, it is difficult to obtain a permit, in
many cases from fathers, for the children to get treatment in TFC. It has also
happened that the patients who absconded, left TFC without medical authorization.
There is no child psychologist with a fixed schedule in TFC as well as no tactical
funds for certain conditions (i.e. certain medicine, laboratory check up and X-rays
examination). Supporting devices are limited (are still in proposal step) for example
cabinets, lockers and kitchen equipment, food ordering system is less flexible.

89
With some constraints above, some recommendation could be proposed as follows: It
is necessary to strength coordination among sector in Depok municipality in finding
malnutrition cases and the treatment post-hospitalization. The administrative
apparatus, in this case neighborhood, and integrated health services cadre, should be
tactful in monitoring the malnutrition prevalence. It could be considered to establish
mobile TFC that could reach undernourished children effectively, as well as, to
propose promotion and prevention rather than curative action in the health sector.

90
REFERENCES
Bialek, Ronald. 2000. Building the Science Base for Public Health Practice. J Public
Health Management Practice 6(5): 51–58.
Black RE, Morris SS, Bryce J. 2003. "Where and why are 10 million children dying
every year?" Lancet. p.361.
Block, S. 2002. Nutrition Knowledge versus Schooling in the Demand for Child
Micronutrient Status. Working Paper No. 93, Harvard University Center for
International Development.
Braun, Joachim von, Ruel, Marie, Gulati, Ashok. 2008. Accelerating Progress toward
Reducing Child Malnutrition in India A Concept for Action. IFPRI
(International Food Policy Research Institute).
C, Karoline. 2000. Evaluasi Manajemen Pelaksanaan Program Gizi di Puskesmas
Bogor. FKM UI.
de Onis, Mercedes,Edward A. Frongillo and Monika Blossner. 2000. "Is malnutrition
declining? An analysis of changes in levels of child malnutrition since 1980."
Bulletin of the World Health Organization p. 1222–1233.
Departemen Kesehatan RI, 2000 Pedoman Pelaksanaan Sarasehan Program
Jaringan Pengaman Sosial Bidang Kesehatan (JPS – BK), Tahun ke-2,
Jakarta.

91
De Silva, Mary J. 2007. Maternal Social Capital and Child Nutritional Status in Four
Developing Countries, Health & Place 13: 341-355.
Gragnolati, Michele, et.al. 2006. India's undernourished children : a call for reform
and action. Washington, D.C. : World Bank
Hadi, Sutrisno. Metodologi Research. Jilid 1,2. UGM, 1986.
Hamilton, S., et.al. 1984. Women and Nutrition in Third World Countries. Bergin &
Garvey Publishers, Inc, New York.
http://www.doctorswithoutborders.org/news/article.cfm?id=3270
(accessed Sept 23, 2010).
McNabb. D. E. 2002. Research Methods in Public Administration and Nonprofit
Management. M.E. Sharpe, New York.
Measuring Mortality, Nutritional Status and Food Security in Crisis Situations: THE
SMART PROTOCOL, 2005.
Miles, Mathew B and A. Michael Hubberman. 1992. Qualitative Data Analysis A
Sourcebook of A New Method. Sage Publications, London.
Palumbo, D. J. 1987. Politics and evaluation. Pages 12–46 in. D. J. Palumbo (ed.),
The politics of program evaluation. Sage Publications, Inc., Newbury Park.
Palumbo, D.J., and Calista, D.J. (1990). Opening up the Black Box. Implementation
and the Policy Process. In D.J. Palumbo and D.J. Calista (eds), Implementation

92
and the Policy Process. Opening up the Black Box, pp. 3-18. New York:
Green-wood Press.
Parsons, W. (1995). Public Policy. An Introduction to the Theory and Practice of
Policy Analysis. London: Edward Elgar.
Parsons, Wayne. 2008. Public Policy : Pengantar Teori dan Praktik Analisis
Kebijakan. Kencana : Jakarta.
Pulzl, Helga and Treib, Oliver in Frank Fischer/Gerald J. Miller/Mara S. Sidney
(eds.): Handbook of Public Policy Analysis: Theory, Politics, and Methods.
Boca Raton, FL: CRC Press/ Taylor & Francis, 2006, 89-107.
Reed, Barbara A., et al. 1996. The Effects of Maternal Education on Child Nutritional
Status Depend on Socio-Environmental Conditions. International Journal of
Epidemiology 25 (3): 585.
Sargent, C.F., Brettel, C. (ed.). 1996. Gender and Health, an International
Perspective. Prentice Hall Inc, New Jersey.
Silk, Kami J., et.al. 2007. Who has time to cook? How family resources influence
food preparation. http://www.ers.usda.gov/publications/ERR40/err40.pdf.
[1/06/2007].
Skoufias E. 1999. Parental education and child nutrition in Indonesia. Bulletin of
Indonesia Economics Studies 35:99–119.

93
S. Short et al. Good Doctors, Safer Patients, Improved Access: Strengthening
Medical Workforce Governance in Indonesia (Canberra: Australia Indonesia
Governance Research Partnership, 2008).
Sugiyono, Metode Penelitian Kuantitatif, Kualitatif dan R&D. Alfabeta, Bandung,
2008, p. 137.
UNDP. 2008. Human Development Index 2007-2008.
http://hdr.undp.org/en/statistics/. [12/5/2009].
Waters, H., et al. 2004. Weight-for-age malnutrition in Indonesian children, 1992–
1999. International Journal of Epidemiology 33: 589–595
WHO. 2004. The WHO Manual on Management of Severe Malnutrition.
http://whqlibdoc.who.int/hq/1999/a57361.pdf. [11/11/2009].
WHO. 1990. Evaluasi Program Kesehatan. Translated by Badan Penelitian dan
Pengembangan Kesehatan.
Wollmann, Hellmut. 2003b. Evaluation in Public Sector Reform, Toward a ―third
wave‖ of evaluation. In Hellmut Wollmann, Evaluation in Public Sector
Reform. Chentenham. UK: Edward Elgar.
2011 World hunger and Poverty Facts and Statistics, http://www.worldhunger.org
(accessed Feb.11,2011).

94
APPENDIX 5.1. PATIENT DATA YEAR
2008 - 2011
DATA OF PATIENT
TFC SUKMAJAYA DEPOK CITY
APRIL 2008 - DECEMBER 2008
No. NAME Age
(Months) Date Of
Admission Date Of
Discharge
Admission Discharge Nut St (Adms)
Nut St (Dis)
LENGTH OF
TREAT (DAYS)
Underlying Complicating
Pathology W(kg) L(cm) W(kg) L(cm)
1 Abdul Aziz 18 30-04-2008 21-05-2008
8,2 79,0 8,7 79,0 - 3,1 SD
- 2.5 SD
22 Days TB
2 Tatia Ariani 23 30-04-2008 21-05-2008
7,9 79,0 8,8 79,0 - 2,8 SD
- 1.77 SD
22 Days TB
3 Najwa Haifa 18 30-04-2008 14-05-2008
6,8 71,0 7,0 71,0 - 2.25
SD - 2.0 SD
15 Days TB
4 Rani Julianti 10 30-04-2008 21-05-2008
5,5 68,0 7,0 68,0 - 3.2 SD
- 1.1 SD
22 Days TB
5 Aziz Febrianto 14 13-05-2008 31-05-2008
7,0 72,0 7,3 72,0 - 2.6 SD
- 2.2 SD
19 Days TB
6 Rizki 26 14-05-2008 29-05-2008
8,2 79,0 10,0 79,0 - 3,1 SD
- 0.87 SD
16 Days HIV,TB
7 Nurul Komariah 15 16-05-2008 18-06-2008
5,7 71,0 7,0 71,2 - 3.6 SD
- 2 SD 34 Days TB
8 Amelia Putri 22 10-06-2008 05-07-2008
7,3 79,0 8,7 79,0 - 3,0 SD
- 2 SD 26 Days TB
9 Diyana Ashyla 11 16-06-2008 28-06-2008
6,2 71,5 6,5 71,5 - 3,0 SD
- 2 SD 13 Days -
10 Ahmad Lutfi Sauki
52 19-06-2008 11-07-2008
7,3 80,0 8,1 80,0 - 3,0 SD
- 2 SD 18 Days TB

95
No. NAME Age
(Months) Date Of
Admission Date Of
Discharge
Admission Discharge Nut St (Adms)
Nut St (Dis)
LENGTH OF
TREAT (DAYS)
Underlying Complicating
Pathology W(kg) L(cm) W(kg) L(cm)
11 M. Edi Gunawan 27 01-07-2008 21-07-2008
8,4 84,0 9,9 84,0 - 3,0 SD
- 2 SD 21 Days TB
12 Allya Fairus 40 31-07-2008 31-08-2008
8,9 84,0 10,1 84,0 - 3,0 SD
- 1.4 SD
15 Days TB
13 Nur Aisyah 41 02-08-2008 15-08-2008
8,1 78,0 9,2 78,0 - 3,0 SD
- 1.1 SD
16 Days TB
14 Naila Aulia 19 08-08-2008 21-08-2008
7,1 74,0 7,8 74,0 - 3,0 SD
- 2 SD 13 Days TB
15 Tamara C. 11 27-08-2008 14-09-2008
5,2 67.0 5.8 67.0 - 3,0 SD
- 2.1 SD
15 Days TB
16 Farel 17 08-09-2008 16-09-2008
8,1 78,5 8,2 78,5 - 3,0 SD
- 2 SD 9 Days TB
17 Rizal 22 18-09-2008 15-10-2008
7,5 74,0 8,2 74,0 - 3,0 SD
- 1.75 SD
28 Days TB
18 Rohana Putri 11 15-10-2008 22-10-2008
5,2 66,0 5,7 66,0 - 3,0 SD
- 2 SD 7 Days TB
19 Kumala 12 24-10-2008 07-11-2008
5,4 66,0 6,5 66,0 - 3,0 SD
- 1.0 SD
15 Days -
20 Kikan 17 24-10-2008 07-11-2008
7,2 74, 8,15 74,0 - 3,0 SD
- 1.3 SD
15 Days TB

96
No. NAME Age
(Months) Date Of
Admission Date Of
Discharge
Admission Discharge Nut St (Adms)
Nut St (Dis)
LENGTH OF
TREAT (DAYS)
Underlying Complicating
Pathology W(kg) L(cm) W(kg) L(cm)
21 Muhammad Fathoni
43 25-10-2008 21-11-2008
9,3 87,5 10,7 87,8 - 3,0 SD
- 1.9 SD
28 Days TB
22 Ilham Saputra 17 27-10-2008 12-11-2008
8,6 80,0 9,2 80,0 - 3,0 SD
- 2 SD 27 Days TB
23 M. Rafli 17 30-10-2008 06-12-2008
6,5 74,0 8,0 74,1 - 3,0 SD
- 2 SD 37 Days TB
24 Septian Ramadani
13 10-11-2008 01-12-2008
6,0 69,0 7,2 71,0 - 3,0 SD
- 1.8 SD
21 Days TB
25 Riska Mariani 26 11-11-2008 11/11/2008 8,5 87,3 8,5 87,3 - 3.7 SD
- 3.7 SD
1 Days TB
26 Heny Zahra 21 24-11-2008 12-12-2008
6,5 78,0 6,85 78,0 - 3,0 SD
-3 SD 19 Days TB
27 Fadila Evan 53 27-11-2008 12-12-2008
11,0 92,0 11.5 92,0 - 3,0 SD
- 1.8 SD
15 Days TB
28 Ananda 24 10-12-2008 19-12-2008
7,5 74,0 8,5 74,0 - 3,0 SD
- 1.0 SD
9 Days TB
29 Elsa Setiawan 25-01-2008
11 24-12-2008 14-01-2009
5,2 67,0 8,0 74,1 - 3,0 SD
- 1.5 SD
22 Days TB

97
DATA OF PATIENT
TFC SUKMAJAYA DEPOK CITY
2009
No. NAME Age
(Months) Date Of
Admission Date Of
Discharge
Admission Discharge Nut St (Adms)
Nut St (Dis)
LENGTH OF TREAT
(DAYS)
Underlying Complicating
Pathology W(kg) L(cm) W(kg) L(cm)
1 Alif Iskandar Fauzi 02-07-2002
65 05-01-2009 30-01-2009
11,2 97,0 13.3 71,0 - 3,0 SD
- 2 SD 13 Days TB
2 Rista Apriyanty 19-02-2007
23 12-01-2009 30-01-2009
7,4 74,9 8,0 74,9 -2.4 SD
- 1.8 SD
18 Days TB
3 Fathan 05-01-2006
36 02-02-2009 3/3/2009 8,8 83,0 10.0 83.0 - 4,0 SD
-1.7 SD
Typhoid TB
4 Levi Al asyar Maulana 27-11-2008
20 10-02-2009 06-03-2009
6,6 75,0 8.2 75.0 - 3,0 SD
-2.0 SD
25 Days TB
5 Desca Rianni 10-12-2008
14 12-02-2009 3/3/2009 6,4 70,0 6.6 70.0 - 2,5 SD
-2.25 SD
Pneumonia
TB
6 Aulia Putri Rizkiah
21 13-03-2009 25-03-2009
8 79.5 9.0 79.5 - 2.7 SD
- 1.5 SD
12 Days --
7 Dwi Ramandanti
6 13-03-2009 13-
0302209 4.0 60.5 4.0 60.5
Refer to Hospital
--
8 Alfianti Ramadani 6-9-2008
7 22-04-2009 19-05-2009
4,30 61,6 4.8 62.0 -2.6 SD
- 1.8 Sd
28 Days TB ,
Cardiovascular
9 Muhammad Arif 10-5-2008
11 24-04-2009 23-05-2009
5,2 66,2 5.0 66.2 -3.1 SD
- 3.4 SD
27 Days TB Susp HIV
10 Yurike 24-4-2008
12 25-04-2009 11/5/2009 6,3 69.0 6,6 69.0 - 2.3 SD
'- 1.8 SD
17 Days TB

98
No. NAME Age
(Months) Date Of
Admission Date Of
Discharge
Admission Discharge Nut St (Adms)
Nut St (Dis)
LENGTH OF TREAT
(DAYS)
Underlying Complicating
Pathology W(kg) L(cm) W(kg) L(cm)
11 Erfan Ramadan 10-12-2001
7 30-04-2009
2-05-2009 13,5 110.0 13.6 110.0 -3.25 Sd
-3.25 SD
3 Days (out pt)
--
12 Nuni Indrianti 28-10-2007
18 1-05-2009 9/5/2009 5.5 66.3 5.5 66.3 -2.25 SD
2.25 SD
6 Days (out pp)
TB
13 Raihana Nurgitania 13-5-2008
12 7-05-2009 1/6/2009 5,8 68,3 6.5 68.3 -2.8 SD
0.3 SD 26 Days TB
14 Zahra Dwi Rohimah 4-9-2008
8 16-05-2009
25-5-2009 4.6 63.0 4.2 63.0 - 2.6 SD
-2 0 SD
14 Days TB
15 Hafid Maulana 7-3-2008
14 18-05-2009
1/6/2009 6,5 69,2 7,2 69,2 -2.25 SD
-1.6 SD
15 Days TB
16 Virgiawan 1-8-2006
33 26-05-2009
12/6/2009 8,3 79,5 9,1 79.5 -3.0 SD
-2.0 SD
13 Days --
17 Indra Wahyu 11-4-2005
49 29-05-2009
01-6-2009 10,5 87,5 9.8 87.5 -2.1 SD
- 2.0 SD
Refer to Hospital
(01/06/2009) --
18 Safina 11-4-2007
27 06-07-2009
23/7/2009 9.0 82.6 10.0 82.6 - 2.7 SD
-1.3 SD
17 Days TB
19 Anggraeni Novianti 1-11-2008
8 11/7/2009 29-08-2009
4.8 66.7 6.2 66.7 -3.85 SD
- 1.85 SD
45 Days TB
20 Aldiansyah 9-3-2008
16 14/7/2009 21/10/2009 6.0 74.9 8.3 74.9 -4.75 SD
-0.875 SD
73 Days TB

99
No. NAME Age
(Months) Date Of
Admission Date Of
Discharge
Admission Discharge Nut St (Adms)
Nut St
(Dis)
LENGTH OF TREAT
(DAYS)
Underlying Complicating
Pathology W(kg) L(cm) W(kg) L(cm)
21 M. Andra Aditia 15 21/7/2009 26-7-2009 6.2 71.2 6.7 71.2 -3.71 SD
- 3.0 SD
6 Days (Unfinish
Treatment) --
22 Annisa Fauziah '05-01-2009
7 18-08-2009 4/9/2009 4.3 61.0 4.4 61.0 - 2.6 SD
-2.3 SD
Refer to Hospital
(04/08/2009) TB
23 Adilah 22-11-2006
30 21-08-2009 6/9/2009 7.2 77.0 7.3 77.7 - 3.4 SD
-4 SD
17 Days (Unfinish
Treatment) TB
24 Nabila Safitri 09-06-2009
3 30-09-2009 9/10/2009 3.5 55.0 4.0 55.0 -1.6 SD
-0.6 SD
Refer to Hospital
(09/10/2009) TB
25 Ahmad Ibrohim 16-12-2007
21 2/10/2009 17/10/2009 7.7 76.6 8.6 77.0 -2.8 SD
-1.8 SD
16 Days TB
26 Slamet 23-06-1996
13 thn 22/10/2009 11/11/2009 12.0 101.0 13.9 101.0 -3.2 SD
-1.5 SD
21 Days --
27 M. Raihan 9 22/10/2009 11/11/2009 4.7 62.5 5.6 62.5 -2.3 SD
-1 SD
21 Days TB
28 Nazwa Hanifa 19-04-08
18 24/10/2009 7/11/2009 8.4 80.0 9.1 80.0 .-2.4 SD
-1.6 SD
15 Days TB
29 Norma Maulidia 11/03/2008
20 16/11/2009 26/11/2009 6.7 72.5 7.6 72.0 .2.75 SD
1.6 SD
11 Days --
30 Fairuz Ramadani 18 24/11/2009 9/12/2009 6.8 72.0 8.2 72.0 -2.62 SD
-0.87 SD
16 Days TB

100
DATA OF PATIENT
TFC SUKMAJAYA DEPOK CITY
JANUARY - NOVEMBER 2010
No. NAME Age
(Months) Date Of
Admission Date Of
Discharge
Admission Discharge Nut St (Adms)
Nut St (Dis)
LENGTH OF
TREAT (DAYS)
Underlying Complicating
Pathology W(kg) L(cm)
W(kg)
L(cm)
1 Alfianti Ramadani 06-09-2008
16 11-01-2010 26-03-10 5.7 70.5
6.9 71.5 - 3,3 SD - 2.1 SD 60
Days TB
2 M. Akbar 06-03-2009
10 14-01-2010 29-01-2010 6.4 69 7.1 69 -2.4 SD - 1.5 SD 16
Days TB
3 Adelia 12-08-2006
41 22-01-2010 8/2/2010 10.1 89 11.2 89.0 - 2.3 SD - 1.36 SD 17
Days TB
4 Dea Intan 03-12-2008
14 25-02-2010 22/03/2010 5.5 68.7
6.5 68.7 -3.25 SD
- 2 SD 26
Days TB
5 M.Fitra Rafianto 02-10-2008
17 13-03-10 2/4/2010 7.8 78 9.1 78.0 -3.3 SD -1.7 SD 21
Days TB
6 Aditia Riski 9-1-2009
14 26-03-10 7/5/2010 6.9 73.5
8.0 73.5 -3.42 SD
-1.7 SD 43 Days
Hernia,Hall palato,TB
7 Ariska 31 30-03-10 19/4/2010 8.3
84.0
10.3 84.0 -3.25 SD
-1.5 SD 21
Days TB
21-08-2007
8 Rafiansyah 37 1/4/2010
Refer to 7.7
87.0
8.1 87.0 -4 SD -4 SD 7 Days TB 01-03-2007 Hospital
9 Riska 9 8/4/2010
Refer to 5.5
69.5
5.5 69.5 -3.25 SD
-3.25 SD 1 Days
Hydro -cephalus 17-07-2009 Hospital
10 Nuroktafia 18 6/5/2010 26/5/2010 6.7 70.9 7.1 70.9
-2.4 SD - 1.9 SD 20
Days
TB Paru, hydrocephalu
s Post shunting
10-10-2008

101
No. NAME Age
(Months)
Date Of Admissio
n
Date Of Discharg
e
Admission Discharge Nut St (Adms
)
Nut St (Dis)
LENGTH OF
TREAT (DAYS)
Underlying Complicating
Pathology W(kg)
L(cm) W(kg) L(cm)
11 M. Nabil 16 12/5/2010 5/13/2010 8.0 77.5 8.9 77.6
-3.2 SD
-1.8 SD
19 Days TB
14-03-2008
12 Sutan Zakariah 48 12/5/2010 27/5/2010 10.7 91.0 12.0 91.0
-2.3 SD
- 1.25 SD
16 Days TB 20-12-2005
13 Aisyah Nuraeni 02-06-2008
23 19-05-2010
6/21/2010 6.0 73.4 7.8 73.4 -3.90 SD
-1.6 SD
31 Days TB
14 Indra Wahyu 11-4-2005
49 03-06-2010
6/15/2010 10.1 88.7 11.2 88.7 - 2.6 SD
-1.6 SD
12 Days TB
15 Humairah Fitra H 8-10-2008
22 6/29/2010 7/14/2010 7.3 77.0 8.2 77.0 -2.75 SD
-1.8 SD
16 Days TB
16 Rasya Aulia 13 7/2/2010 7/19/2010 5.5 66.9 5.8 66.9 -3.3 SD
-2.8 SD 17 Days TB
5/16/2009
17 Siti dilla 19 7/14/2010 7/26/2010 7,1 74,4 8,0 74,4
-2,71 SD
15 Days TB
12/25/2008 -1.4 SD
18 Cristal 8 7/31/2010 8/14/2010 5,7 66,2 6.2 66.2
-2,8 SD
-1,6 SD
15 Days TB 11/5/2009
19 Aisyah Nuraeni 02-06-2008
27 22-09-2010
10/7/2010 6,9 76,2 8,5 76,2 -3.70 SD
-1.25 SD
15 Days TB
20 Rahmat Zaini
46 02-10-2010
15-10-2010
11,6 95.0 13.2 95.0 - 2.5 SD
- 0,8 SD
14 Days TB 10/12/2006

102
No. NAME Age
(Months) Date Of
Admission Date Of
Discharge
Admission Discharge Nut St (Adms)
Nut St (Dis)
LENGTH OF
TREAT (DAYS)
Underlying Complicating
Pathology W(kg) L(cm) W(kg) L(cm)
21 Khairul Azam 02-0
12 25-10-2010 04-11-2010
7,1 74,3 8,5 74,3 -3.30 SD
- 1,2 SD
11 Days TB
22 Amelia Lulu 02-06-
18 08-11-010 01-12-2010
7,1 75,5 7,8 75,5 -3.0 SD
- 2,0 SD
24 Days TB
23 M. Akbar 06-03-2009
10 18-11-2010 30-11-2010
7,2 73.0 7,85 73.0 -3.0 SD
- 1,9 SD
13 Days TB
24 Fadlan Sabil 02-06-2008
12 19-11-2010 30-11-2010
6,9 73.9 7,8 73.9 -2.70 SD
- 2,1 SD
12 Days TB

103
DATA OF PATIENT
TFC SUKMAJAYA DEPOK CITY
JANUARY 2011
No. NAME Age
(Months) Date Of
Admission Date Of
Discharge
Admission Discharge Nut St (Adms)
Nut St (Dis)
LENGTH OF
TREAT (DAYS)
Underlying Complicating
Pathology W(kg) L(cm) W(kg) L(cm)
1 Vidi Prayuningtias 31-01-2010
11 10/1/2011 31-01-2011 6,5 72,5 7,3 72,5 - 3,1 SD - 2.0 SD
24 Days TB
2 Azizah Putri 16-09-2009
16 15-01-2011 31-01-2011 7,65 76,0 7,85 76,0 -2,25 SD
-2,0 SD 17 Days TB
3 Puji Astuti 2-08-2009
17 7/2/2011 21-02-2011 4,85 66,5 5,4 66,5 -4,25 SD
-4,0 SD 15 Days TB
4 Andita 11 28-03-2011 5,5 65,0 -3,0 SD
10-Apr-10
5 Novi Diyanti 40 31-03-2011
9,5 88,0 -2,6 SD
Related Documents