A FORAMINIFERAL TESTIMONY FOR THE REDUCED ADVERSE EFFECTS OF MINING IN ZUARI ESTUARY, GOA *Rajani Panchang†, Rajiv Nigam†, Nasreen Baig‡ and G. N. Nayak‡ †Address: Micropalaeontology Lab, Geological Oceanography Division, National Institute of Oceanography Division, Dona Paula 403 004, Goa, India Telephone: 091-832-2450340 / 2450489 Fax: 091-832-2450602 / 2450603 ‡Address: Marine Sciences Department, Goa University, Taliegao Plateau 403 206, Goa, India *Corresponding Author E-mail:[email protected]

Welcome message from author
This document is posted to help you gain knowledge. Please leave a comment to let me know what you think about it! Share it to your friends and learn new things together.
Transcript
A FORAMINIFERAL TESTIMONY FOR THE REDUCED ADVERSE
EFFECTS OF MINING IN ZUARI ESTUARY, GOA
*Rajani Panchang†, Rajiv Nigam†, Nasreen Baig‡ and G. N. Nayak‡
†Address: Micropalaeontology Lab,
Geological Oceanography Division,
National Institute of Oceanography Division,
Dona Paula 403 004, Goa, India
Telephone: 091-832-2450340 / 2450489
Fax: 091-832-2450602 / 2450603
‡Address: Marine Sciences Department,
Goa University,
Taliegao Plateau 403 206,
Goa, India
*Corresponding Author
E-mail:[email protected]
Abstract
The present work demonstrates the potentiality of Foraminifera in detecting
mining pollution. Goa’s Mandovi - Zuari Estuarine Complex is most
vulnerable to deterioration due to the mining industry. The objective of the
present study is to estimate the health of the Zuari through foraminiferal
distribution in its surface sediments. The foraminiferal data generated was
compared with the three-decade-old foraminiferal data collected in 1972 (1)
and Total Suspended Matter (TSM) data over the years. It is interesting to note
that there has been a substantial increase in the maximum Total Foraminiferal
Number (TFN), from 1143 specimens in 1972 to 3057 specimens per gram
sand in 2003. Even the Total Species Number (TSN) has increased from 24 in
1972 to 50 in 2003. This is in compliance with the TSM data collected over
the years, which has considerably decreased. The foraminiferal data, TSM
data and reduction in mining activities in the catchment area of the Zuari
Estuary suggest an improvement in the environmental health of the estuary.
This study also strengthens the view that foraminifera can be used as a tool to
monitor marine pollution.
Keywords
Foraminifera, pollution-indicator, Zuari Estuary, mining, total suspended
matter, reworked foraminifera
Introduction
Pollution due to increased anthropogenic influence has adversely affected
almost every habitat within the oceans, land and atmosphere. However, the
hardest-hit habitats are the estuaries, the most productive coastal areas at the
mouths of the rivers where fresh and seawaters meet. Problems of estuarine
pollution, like the ‘Minamata Disaster’ of Japan, are not unique just to
developed countries. Even the densely populated West Coast of India is
characterized by the presence of many such estuaries threatened by
deterioration due to anthropogenic influence.
The Mandovi-Zuari Estuarine Complex of Goa (Fig. 1a) holds a different
significance because it is not only a storehouse of mineral resources
(international supplier of Iron and Manganese ore) but also a major natural
harbour of India. The estuaries are used as cheap waterways to export the
mineral ores. At the same time huge mining rejects also find their way to the
sea, during the monsoons. With such a scenario the health of the estuaries of
Goa need monitoring. Foraminifers, almost entirely marine protists being
highly sensitive to their surroundings have been reliably used world wide and
in India (2, 3, 4)
for the detection of source and extent of marine pollution. The
Fig. 1
relative sensitivity of tolerance of foraminifera is sharply variable and
dependent upon the nature of the pollutants discharged(5, 6)
.
The literature survey revealed the varied aspects of the Mandovi-Zuari
Estuarine Complex studied in the past (Table I). The first two papers have
been published(1, 7)
on the distribution of foraminifera based on samples
collected in 1972. Recently, workers have followed up the environmental
monitoring of the Mandovi Estuary, reporting a reduction in foraminiferal
abundance(8)
; however no such work has been conducted in the Zuari Estuary
over the past three decades.
With such a background, the Zuari River estuary also needs to be monitored
and if any sign of pollution is noticed, the source needs to be checked. This
concern itself forms the basis of the present research. Schafer et al.(9)
and
Nigam et al.(8, 10)
have proved that foraminiferal studies in surface sediments
collected over a considerable time gap can provide reliable clues for any
change in the environment. We attempt to use foraminifers to make a
beginning in the environmental impact assessment of the Zuari estuary, it
being less studied for the quality of its health. Foraminiferal data in the Zuari
estuary based on samples collected in 1972 already exists(1)
. This gives us an
opportunity to compare our recent foraminiferal data (samples collected in
Table I
2003) with Rao’s data. The present work attempts to identify and estimate
alteration in the environment of the estuary if any, over the past three decades.
Study Area
The entire state of Goa has seven main rivers of which Mandovi and the Zuari
are of great importance. They together have a basin cover of 69% of the state’s
total geographical area. Mandovi and Zuari together with the interconnecting
Cumbarjua Canal form an economically important estuarine complex on the
West Coast of India and are also known as the "Life Lines" of Goa.
The Zuari makes an overbearing presence over the Southern portion of Goa
and is our prime focus in the present study (Fig. 1a). The source of water of
the Zuari River is entirely within Goa. It is fed by the monsoon precipitation
and receives discharge from a catchment area of 550 km3 (11)
. Zuari estuary has
no major tributaries but has a wider mouth. Two important anthropogenic
activities affect the estuarine ecology:
1. The mining activities in the catchment area
2. Transport and handling of ore material and harbour operations within the
estuary
MINING
The estimation of the mineral deposits of Goa conducted by the Geological
Survey of India from 1961-1968, reveals that depending upon the iron
concentration the ore deposits can be broadly divided into three zones; the
Northern, Central and the Southern. From North to South the iron
concentration reduces and in South Goa, the ore is mainly ferruginous
manganese. Exploitation of mines began in South Goa (through which River
Zuari flows) in the 1950’s so as to meet the industrial demands, which
accelerated within a decade(12)
.
During the early days of mining, production was manual and the demand was
for manganese and ferromanganese. Later on the iron ore mining began and
the demand lead to mechanized operations. In 1980 to 1990 mining became a
highly sophisticated, capital-intensive industry where larger quantities of ore
had to be extracted to avail the economies of scale(12)
. Rapid strides in
exploration of mineral resources to cope with the ever-increasing demand
intensified the mining activities in Goa, forming the backbone of the state
economy (Ganihar 1990, Goa Univ. Unpubl. Ph.D. Thesis).
As stated above, South Goa holds the highest grade of Manganese and
Ferromanganese deposits in the state. So mines in South Goa are the best to
satisfy demands for Manganese. With depletion of high-grade ore reserves and
strict ore quality standards demanded by steel mills, processing has also
undergone changes. Thus all major producers have erected washing and
beneficiation plants. Thus exploitation of mineral deposits is the dominant
industry.
Figure 1b illustrates the mining areas of the state of Goa. Until 1980, there
were a total of 129 industries in the Zuari basin and ten large mines, which
generate 1000-4000 tons of reject per day per mine (Qasim et al. 1981, NIO,
Tech. Report,). Directorate of Mines enumerated the general environmental
problems due to the many opencast mines of Goa. In their report, Mining and
Environmental Management they stated that each year some 30 million tonnes
of rejects are generated and stacked in large dumps. Winds and rains erode
these dumps (mainly during monsoons) to the water bodies. Thus, the
tributaries and estuarine waters contain a high concentration of TSM that
mainly comprises iron and manganese due to mining activities (Nayak 1993,
Dept. Environment Tech. Rep.).
MARMUGAO PORT AND HARBOUR OPERATIONS
The Zuari River being perennial and navigable serve as cheap and easy means
of transport of mining ore. During the monsoons when the Mandovi River
faces problems of bar formations, the Cumbarjua Canal provides sheltered
passage to the Marmugao harbour through the Zuari River(13)
. The Marmugao
Port, one of India’s best natural harbours situated on the southern banks of the
Zuari estuary is close to the coastline. 1990, records for the previous decade
for exports through the Marmugao Port show that it handled more than 10
million tons of iron ore for export annually. Ore transport and handling at the
port can also contribute to the suspended load in the estuary.
Materials and Methods
FIELDWORK
The complete sampling route along the Zuari Estuary was divided into 2
stretches: upstream and downstream. Likewise, the pre–monsoon sampling
was conducted in two episodes. First on the 11th
May 2003 seven samples
were collected onboard Coastal Research Vessel, CRV Sagar Sukti. During
the second sampling phase on 4th
June 2003, 12 surface sediment samples
were collected onboard a hired fishing trawler. The collection of a total of 19
surface sediments was done using a Van Veen Grab. Figure 1a shows the
sampling locations and Table II incorporates the sampling details, including
Total Suspended Matter (TSM) and salinity variations recorded during the
fieldwork.
LAB TECHNIQUES
In order to undertake foraminiferal investigations the sediment samples were
initially washed thoroughly through a 63-micron sieve using a slow shower to
Table II
prevent foraminiferal test breakage. The samples were then subjected to 10ml
of 10% sodium hexa-meta-phosphate and kept over night to dissociate
clumped aggregates of sediments if any. Similarly 5ml of 10% hydrogen
peroxide was added to remove any traces of remaining organic matter and kept
overnight. The samples were washed 5-6 times repeatedly till they became
clean. The sand fractions were then collected over Whatman filter papers and
were oven dried at 60oC. Dried sand was spread on a glass plate, coned and
quartered to obtain a representative fraction of each sample. Later, each of the
small fractions was weighed and spread over a gridded picking tray. Total
foraminiferal specimens (a minimum of 300 specimens) were picked using a
moist brush. All the specimens picked were mounted on gridded faunal slides,
identified up to the species level, and finally counted under a stereo binocular
microscope. The Total Foraminiferal Number (TFN) in each sample were
computed and standardized to 1g dry sediment.
Results
Some unusual specimens that look older than the normal foraminifera have
been encountered at three stations, SASU-11, -13 and -14. These foraminifera
have been named as ‘reworked’, counted separately. Of the 19 surface
sediment samples collected in the Zuari Estuary, SASU-12 and GU-3 to GU-
12 did not yield any foraminifers. Remaining 8 samples have yielded recent
benthic foraminifera, both calcareous and agglutinated forms. None of them
Table III
contained any planktonic specimens. The results of the foraminiferal picking
are tabulated as Table III.
RECENT BENTHICS
The total recent benthic foraminifera show a declining trend towards the head
of the Zuari River, leading to complete absence beyond station GU-2. The
TFN is very high in SASU-1 and SASU–2 and relatively lowers at SASU-11,
13 and 14. The stations at and around the confluence of Cumabarjua Canal and
Zuari River show low or no foraminifera at all. Eg. Stations GU-1 and SASU-
13 (low), where as SASU-12 (Nil). Though the TFN falls drastically at GU-1,
still head-wards GU-2 shows TFN prevalence to be high.
REWORKED FORAMINIFERA
Samples collected at SASU-11, 13 and 14 show the presence of specimens
different in appearance than the normal Recent benthics. They are black to
brown in colour. Silica or Fe- or Mn- oxide has replaced the calcareous test.
They have undergone transport, which is evident by their rounding, polishing,
fracturing and at times absence of test with only the sutures resistant to
abrasion standing out. They appear to be older in age and dull in luster than
the recent benthic foraminifera. This suggests that they have been eroded from
an older deposit and have been re-deposited in the present environment and
thus the nomenclature ‘reworked foraminifera’.
Stations SASU-11 and SASU-13 are located on either sides of station SASU-
14 within the Marmugao Bay. At the central station the number of reworked
specimens are high with a decrease in numbers on either locations.
Discussion
Based on the results, the discussion has been divided in to two parts:
RECENT BENTHIC FORAMINIFERA
Depending upon the quantitative distribution of foraminifera the Zuari estuary
can be divided into three parts: the lower reaches of the estuary marked by a
gradual decrease in TFN away from the sea head wards, the middle reaches by
low TFN and the upper reaches characterized by absence of foraminifera.
The declining trend in the TFN from the sea upstream follows the normal
estuarine distribution pattern; just near the mouth the TFN is very high, and it
falls drastically at GU-1. The absolute absence of Foraminifera beyond station
GU-2 indicates the truncation of the estuarine environment within the Zuari
River Basin and weakening of tidal ingress of seawater. The salinity data
collected during sampling shows that the salinity drops below 32 ppm
upstream beyond station GU-3, which is the beginning of hypo-saline
conditions(14)
. The absence of foraminifera beyond station GU-2 can be
attributed to the fall in salinity causing hindrance to their growth in the study
area.
The ‘low to no’ situation of foraminiferal abundance in areas close to the
confluence of Cumbarjua is supported by the high TSM values. SASU-12 at
the confluence of the Zuari and Cumbarjua is the only station where
foraminifers are absent within the favourable zone. The turbulent hydrography
because of the confluence compliments the extremely high local TSM values
(43.80 to 477.40 mg l-1
) leading to increased turbidity and mechanical
abrasion. This explains the absence of foraminifers at this location and low
TFN at SASU-13 and GU1.
The abrupt rise in TFN at GU-2 could be attributed to favourable salinity and
low values of suspended load.
Though the trend of change in TSM values shows a decreasing trend from
upper reaches to lower reaches (Table II), the relatively low TFN in the bay
(stretch between Cumbarjua and the harbour) needs to be explained.
Considering the repeated reports of ore transport to Marmugao harbour from
the Mandovi basin being redirected through the Cumbarjua, relatively high
TSM values obtained in the bay, especially at the Cumbarjua-Zuari
confluence, are also obvious.
Comparison with previous report: environmental impact assessment
Rao(1)
, based on sediment samples collected in 1972, studied the foraminifera
from the two estuaries and reported a total of 23 species in the Zuari Estuary
(Table IV).
Estimating whether the health of the Zuari estuary has deteriorated or
improved over the past, we compared the present data with the pre-existing
data(1)
. The TSM and the TFN data collected over the years at one particular
station in the bay was plotted (Fig.2). Our sampling station SaSu-11 coincided
with the TSM sampling stations; the absolute TFN (337) at this station was
thus used. 2 stations of Rao (11 and 12) fall on either sides of the TSM
sampling station; thus the average TFN of these stations (356/2 = 178) was
used.
Turbidity has been known to affect foraminiferal populations, since light
penetration is inversely proportional to turbidity. High total suspended matter
(TSM), thus high turbidity inhibits photosynthetic activity, reducing nutrient
material. In different parts of the world, anomalous foraminiferal populations
have been attributed to increase in the amount of suspended material in the
Table IV
Fig.2
water(15, 16, 17)
. Reduced benthic foraminiferal populations have been reported
from areas of high suspended matter(18, 19, 20)
. TSM acts as a limiting factor
along coastal zones, particularly where there are river mouths(21)
. Studies have
also shown that the concentration of TSM in bottom waters is always higher
than that of surface waters in the estuarine regions (Nayak 2004, Personal
communication).
Even in the present context, a similar relationship between TSM and TFN is
seen. The TSM data over three decades (Fig.2) shows a gradual reduction in
values. Inversely the TFN shows a significant increase. It is interesting to note
that the maximum TFN recorded by Rao was 1143 while the present study
records a maximum of 3057 specimens within the estuary. There also has been
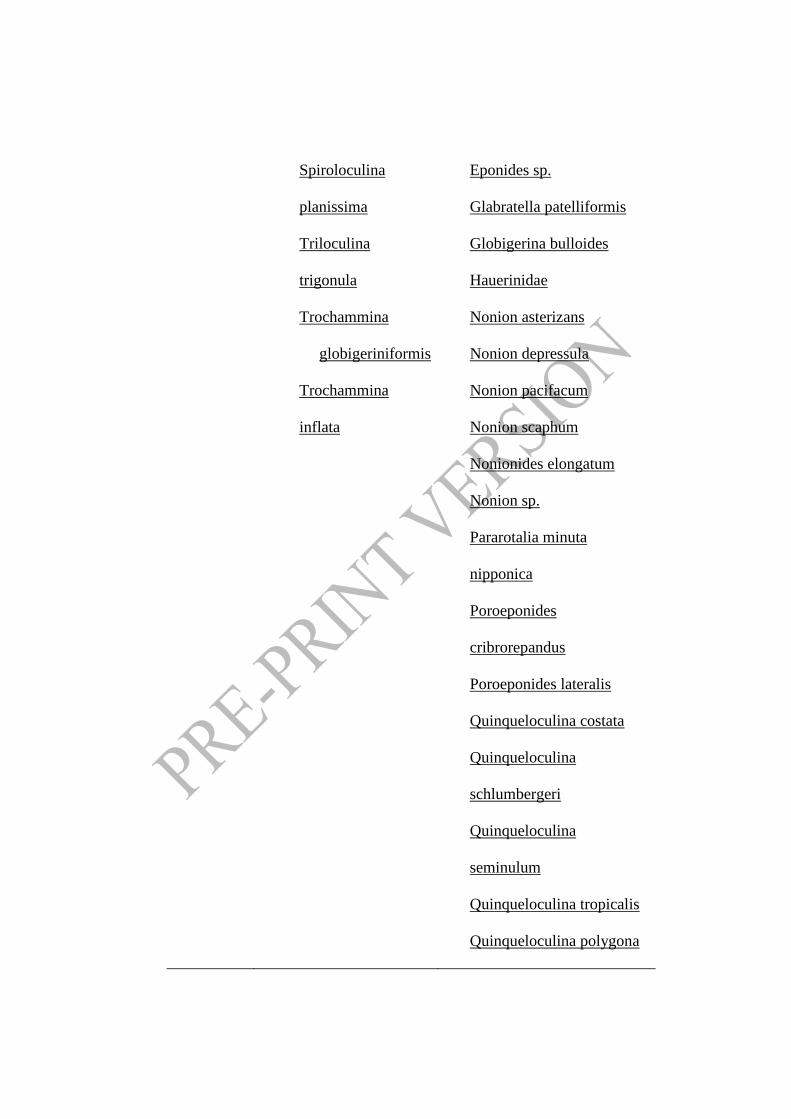
an increase in the Total Species Number (TSN). Rao reported 23 species
whereas the present study records 50 species of foraminifera (Table IV).
This indicates that the health of the estuary has possibly improved. In order to
support the present findings we need to look for the reason responsible for the
improvement in the environment.
As the manganese mining has lost demand, ore handling, barging and
transport of ore within the Zuari basin has apparently come down, thereby
suggesting lowered contribution of its share to TSM in the estuary. Reduction
in TSM over the years seems to have led to decrease in the turbidity thereby
improving the penetration of light in the estuarine waters and creating
favourable conditions for the growth of foraminifers.
Demand for Iron ore has been on a gradual rise since the beginning (Fig.3a).
In the mid 70’s it reached a high and then stabilized to more or less the same.
However Manganese (Fig.3b) and Ferromanganese (Fig.3c) show decreasing
trend in production.
So over the past three decades, the mining in South Goa has lost priority as it
is houses mostly manganese and ferromanganese mines. Out of 581 leases,
which were in force only 211 were reported working during 1980. (Figure 1b
illustrates the mining areas of the state of Goa). To begin with, intense mining
operations were carried out in South Goa (Sanguem and Quepem talukas)
when there was demand for manganese ore, in the early 50’s. Later on with
increasing demand for iron ore since the early 70’s, mining activities shifted to
North Goa (Bicholim taluka). In Sanguem and Quepem talukas the mining has
now been greatly reduced (Table V) and most of the mines have remained
inactive for long(13)
. It should also be noted that approximately half of the
mining areas in Sanguem and Ponda talukas fall under the watershed of
Mandovi Estuary. The reduction in the washing of mining rejects into the
Zuari due to reduction in mining operations in the adjoining areas is evident
Fig. 3
by the reduction in the values of TSM collected over the time and enumerated
in Figure 3.
Comparison between the two Goan Estuaries
Monitoring the Mandovi River estuary, using foraminifera in surface
sediments shows that within 18 years, the TFN came down considerably from
10-139 (1972) to 2-42 (1990) specimens per gram sediments. The Total
Species Number (TSN) also fell, from 18 in 1972 to 5 in 1990. These had
been reported to indicate adverse effects of continued increase in the
suspended load due to mining activities in its catchment area(10)
.
The present study clearly indicates a considerable rise in the numbers as well
as the diversity of foraminifera in the Zuari estuary, exactly in contrast to the
adjoining Mandovi Estuary, in its north. These results corroborate with
progressive fall in the values of TSM and status of mining activities within the
basin.
The major shift in mining area from South to North over the past three decades
seems to explain the simultaneous but opposite situations in two adjoining
estuaries. Thus it can be said that foraminifera can reliably be used as an
Table V
indicator of progressive and retrogressive mining pollution, as demonstrated in
this study.
REWORKED FORAMINIFERA
All the locations of SASU-11, -13 and –14 lie within the bay, with SASU-14
occupying the central location and the other two on either side. The central
location also shows maximum number of reworked specimens (406 g-1
sand).
Occurrences of reworked specimens were reported earlier from the shelf
region of Daman(22)
and also in the vicinity of the Zuari River Estuary (8, 23)
.
Recently based on the distribution of reworked foraminifera in the Mandovi
estuary, Nigam et al.(8)
have postulated the possibility of finding a shelly layer
along the banks of River Mapusa (Fig.1a), deposited during a high sea stand in
the past.
Finding reworked fauna in the Zuari Estuary exhibits the possibility of a
similar situation in the study area. Two shelly layers deposited during a higher
sea-stand in the geological past ~6,000 years ago, have already been reported
(Fig.1a) along the Northern (24)
and Southern(23)
banks of Zuari. These
sampling locations with reworked foraminifers lie within the stretch of the
estuary right between the two shelly layers. Thus, it can be concluded that
reworked foraminifera have been eroded from those shelly layers and are
being re-deposited within the estuary.
Away from the location SASU-14, the number of reworked foraminifers goes
down on account of dilution away from the source.
Conclusions
1. The surface sediments in the middle and lower reaches of Zuari estuary
have yielded a Total Foraminiferal Number (TFN) ranging from 16 to
3057 per gram sediment in the estuary, whereas upper reaches shows
total absence of fauna.
2. There is a normal inverse relationship between the TSM values and the
foraminiferal distribution in the estuary; higher TFN in the areas with
lower TSM and vice-versa.
3. The direct relationship of foraminifera with salinity is also clearly
evident. The foraminifera are absent in lower salinity conditions in the
upper estuary.
4. Samples SASU-11, -13 and -14 collected within the stretch between
Cortalim and Vasco yielded reworked foraminifera. The reworked
foraminifera are being derived from 2 already reported elevated shelly
layers on either banks of the Zuari estuary.
5. A comparison with a previous report (Rao 1974) shows a substantial
increase in the Total Foraminiferal Number (TFN) as well as Total
Species Number (TSN) within the Zuari Estuary over the past three
decades.
6. Increase in TFN and corresponding decrease in TSM values over the
years seems to indicate a possible reduction in the mining activities in
the catchment area of Zuari. This could be suggestive of an
improvement in the environmental health of the Zuari Estuary, which
needs further confirmation.
7. Foraminifera can be used as proxies to indicate mining pollution of
both kinds- progressive and retrogressive.
ACKNOWLEDGEMENTS
The authors are thankful to Dr. Satish R. Shetye, Director of National Institute
of Oceanography for their encouragement and kind permission to publish this
report. We are also grateful to all the cruise members on board the two vessels,
CRV Sagar Sukti and fish trawler Datta Ravalnath, as well as Mr. Abhijit
Mazumder and Mr. Rajiv Saraswat for their help in sample collection. We
thank Dr. P.D. Naidu, Scientist, NIO, for reviewing this manuscript and his
suggestions.
LITERATURE CITED
1. K.K. Rao, “Ecology of Mandovi and Zuari estuaries, Goa: distribution
of foraminiferal assemblages” Indian J. Mar. Sci. 3, 61-66 (1974).
2. V. Yanko, A.J. Arnold and W.C. Parker, “Effects of marine pollution
on benthic Foraminifera” Modern Foraminifera (ed. B.K. Sen Gupta,
Kluwer Academic Publishers, Great Britain, 1999) pp.217-235.
3. E. Alve, “Benthic foraminiferal responses to estuarine pollution: a
review” J. Foram. Res. 25, 190-203 (1995).
4. R. Nigam, R. Saraswat and R. Panchang, “Application of Foraminifers
in ecotoxicology: retrospect, perspect and prospect” Environment
Intern. (In press, 2005).
5. M. G. A. P. Setty, “Pollution effects monitoring with foraminifera as
indices in the Thana Creek, Bombay Area” Intern. J. Environmental
Studies 18, 205-209 (1982).
6. M.G.A.P. Setty and R. Nigam “Benthic foraminifera as pollution
indices in the marine environment of west coast of India” Rev. Ital. de
Paleontol. de Stratigrafi. 89, 421-436 (1984).
7. S.G. Dalal, “Relationship between environmental parameters and
foraminiferal species in Mandovi and Zuari estuaries” Mahasagar Bull.
9, 9-13 (National Institute of Oceanography, India, 1976).
8. R. Nigam, R. Panchang, and P. Banerjee, “Foraminifera in surface
sediments of Mandovi River Estuary: indicators of mining pollution
and high sea stand in Goa” J. Coast. Res. 21(4) (In press, 2005).
9. C.T. Schafer, E.S. Collins and J.N. Smith, “Relationship of
foraminifera and thecamoebian distributions to sediments
contaminated by pulp mill effluent; saguency fiord, Quebec, Canada”.
Mar. Micropalaeontol. 17, 255-283 (1991).
10. R., Nigam, G.N. Nayak, and S. Naik, “Does Mining Pollution affect
the foraminiferal distribution in Mandovi estuary, Goa, India?” Rev.
Paleobiol. 21(2), 673-677 (2002).
11. S. Z. Qasim, and R. Sen Gupta, “Environmental characteristics of the
Mandovi-Zuari estuarine system in Goa” Estuar. Coast. Shelf Sci. 13,
557-578, (1981).
12. S.V. Salgaokar, “Goan iron ore industry, historical background and
present status” A Report- Seminar on mining and environmental
preservation- The Goan mineral ore industry, mining and the
environment (Goa Mineral Ore Exporter’s Association- GMOEA,
1991) pp. 32.
13. G.N. Nayak, “Impact of mining on environment in Goa, India”
(International Publishers New Delhi, 2002) pp.112.
14. J.W. Murray, “Ecology and Palaeoecology of Benthic Foraminifera”
(Longman Scientific and Technical, New York, 1991) pp. 397.
15. L. Berthois, Y. Le Calvez and A. Crosnier “Repartition des
foraminiferes dans les sediments du plateau continental camerounais;
essai d’ecologie” Acad. Sci. 266(7), 660-662 (1968).
16. T. Uchio “Influence of the River Shinano on foraminifera and
sediment grain-size distributions” Pap. Mar. Geol. 411-428 (Univ.
South Calif. Press, 1964).
17. D. Vedantam and M.S. Rao “Recent foraminifera from off Pentakata,
east coast of India” Micropalaeontol. 16(3), 325-344 (1970).
18. E.H. Myers “Ecologic relationship of some recent and fossil
foraminifera” Nat. Res. Counc. (Div. Geol. Geogr., Ann. Rept., Appen.
2, 1942).
19. W.E. Frerichs “Distribution and ecology of benthonic foraminifera in
the sediments of the Andaman Sea” Contr. Cushman Found. Foram.
Res. 21(4), 123-147 (1970).
20. R. Nigam “Living benthonic foraminifera in a tidal environment: Gulf
of Khambat (India)” Mar. Geol. 58, 415-425 (1984).
21. E. Boltovoskoy and R. Wright, ‘Recent Foraminifera’ (Dr. W. Junk
Publishers, The Hague, 1976) pp.515.
22. R. Nigam, and M.G.A.P. Setty “Palaeogene reworked foraminifera in
the recent sediments of Daman, western India” Proc. 3rd
Indian Geol.
Cong. 273-280 (1980).
23. R. Nigam, “Potentiality of Foraminifera in deciphering palaeosea
levels” India’s Exclusive Economic Zone (ed. S.Z. Qasim and G.S.
Roonwal, 1996) pp.225-232
24. N. Kamat, “Fossils throw light on sea level changes” The Navhind
Times 1& 8 (30 Nov. 2002).
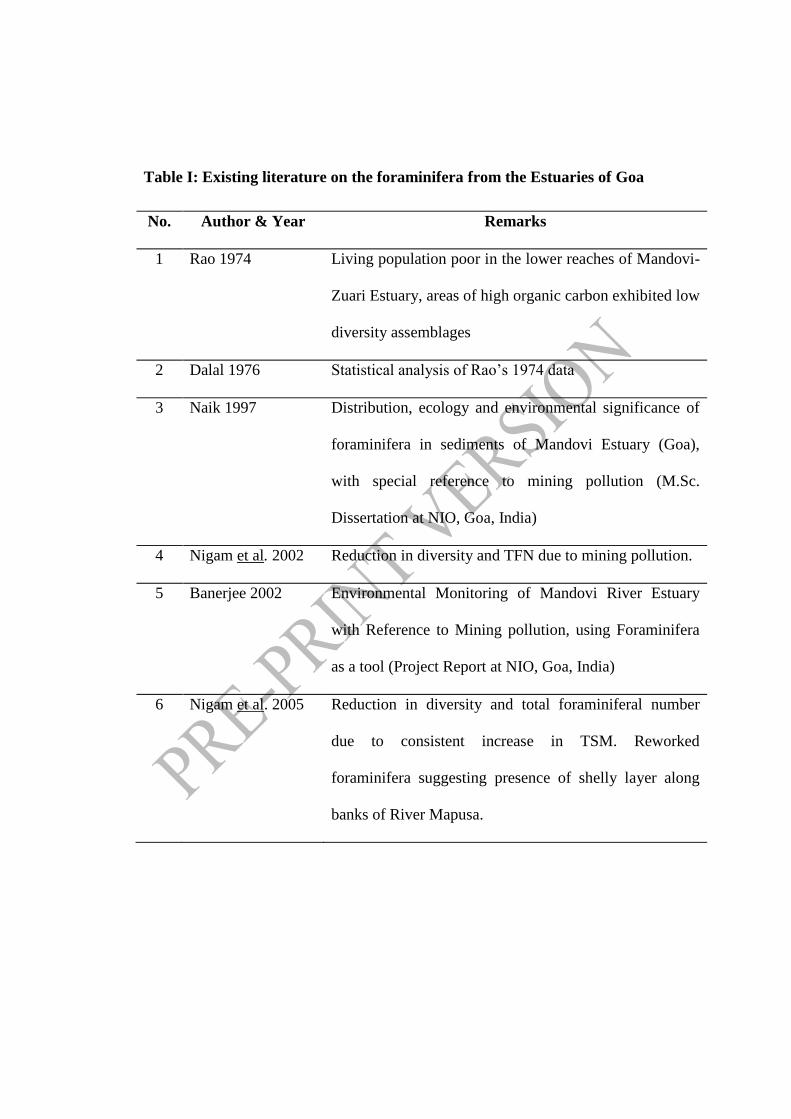
Table I: Existing literature on the foraminifera from the Estuaries of Goa
No. Author & Year Remarks
1 Rao 1974 Living population poor in the lower reaches of Mandovi-
Zuari Estuary, areas of high organic carbon exhibited low
diversity assemblages
2 Dalal 1976 Statistical analysis of Rao’s 1974 data
3 Naik 1997
Distribution, ecology and environmental significance of
foraminifera in sediments of Mandovi Estuary (Goa),
with special reference to mining pollution (M.Sc.
Dissertation at NIO, Goa, India)
4 Nigam et al. 2002 Reduction in diversity and TFN due to mining pollution.
5 Banerjee 2002 Environmental Monitoring of Mandovi River Estuary
with Reference to Mining pollution, using Foraminifera
as a tool (Project Report at NIO, Goa, India)
6 Nigam et al. 2005 Reduction in diversity and total foraminiferal number
due to consistent increase in TSM. Reworked
foraminifera suggesting presence of shelly layer along
banks of River Mapusa.
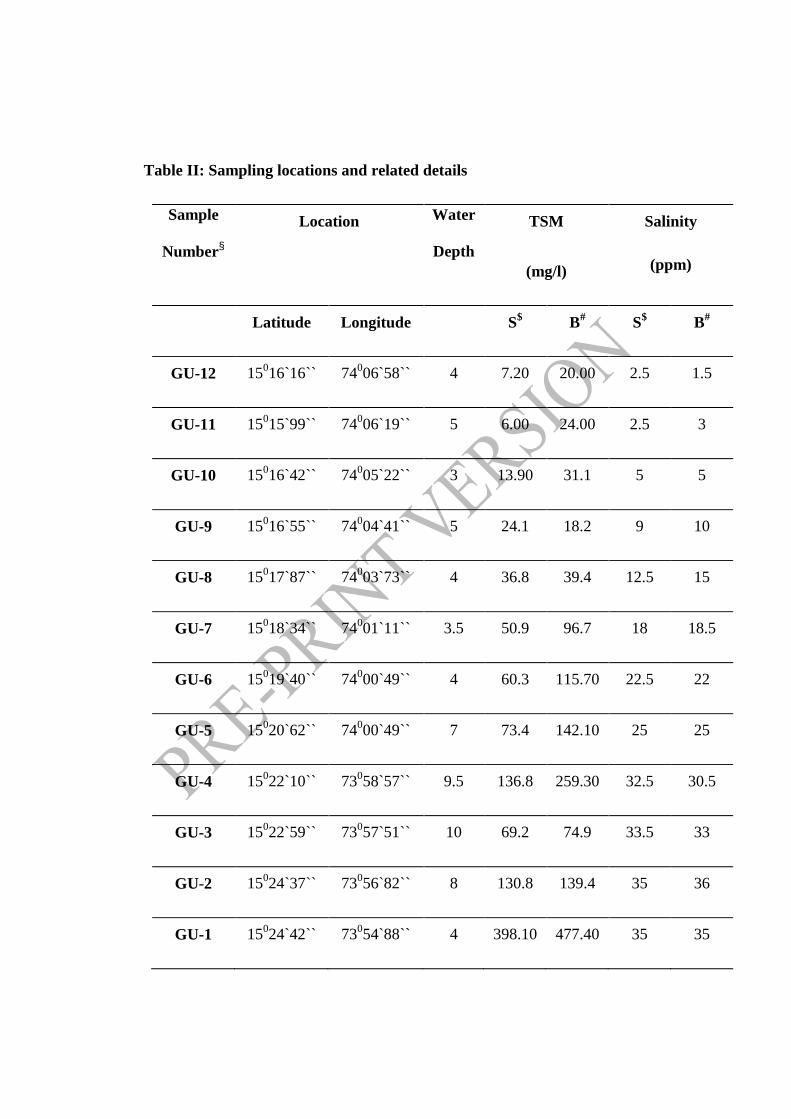
Table II: Sampling locations and related details
Sample
Number§
Location Water
Depth
TSM
(mg/l)
Salinity
(ppm)
Latitude Longitude S$ B
# S
$ B
#
GU-12 15016`16`` 74
006`58`` 4 7.20 20.00 2.5 1.5
GU-11 15015`99`` 74
006`19`` 5 6.00 24.00 2.5 3
GU-10 15016`42`` 74
005`22`` 3 13.90 31.1 5 5
GU-9 15016`55`` 74
004`41`` 5 24.1 18.2 9 10
GU-8 15017`87`` 74
003`73`` 4 36.8 39.4 12.5 15
GU-7 15018`34`` 74
001`11`` 3.5 50.9 96.7 18 18.5
GU-6 15019`40`` 74
000`49`` 4 60.3 115.70 22.5 22
GU-5 15020`62`` 74
000`49`` 7 73.4 142.10 25 25
GU-4 15022`10`` 73
058`57`` 9.5 136.8 259.30 32.5 30.5
GU-3 15022`59`` 73
057`51`` 10 69.2 74.9 33.5 33
GU-2 15024`37`` 73
056`82`` 8 130.8 139.4 35 36
GU-1 15024`42`` 73
054`88`` 4 398.10 477.40 35 35
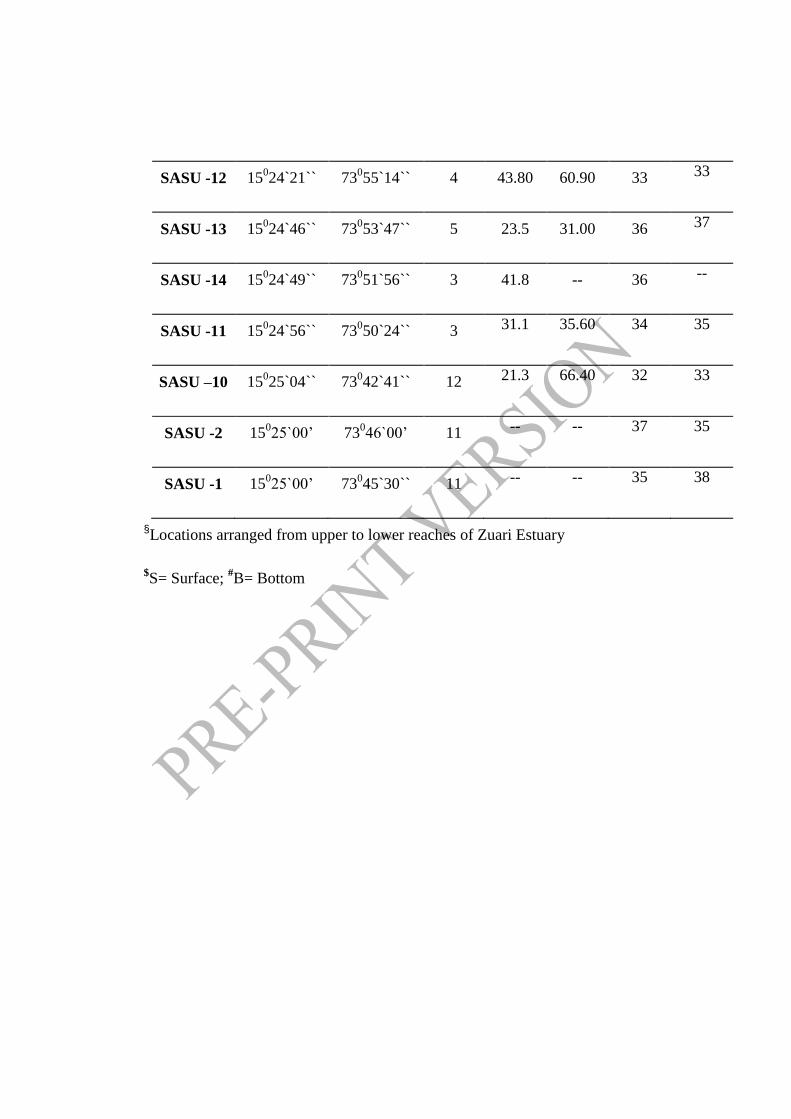
SASU -12 15024`21`` 73
055`14`` 4 43.80 60.90 33 33
SASU -13 15024`46`` 73
053`47`` 5 23.5 31.00 36 37
SASU -14 15024`49`` 73
051`56`` 3 41.8 -- 36 --
SASU -11 15024`56`` 73
050`24`` 3 31.1 35.60 34 35
SASU –10 15025`04`` 73
042`41`` 12 21.3 66.40 32 33
SASU -2 15025`00’ 73
046`00’ 11 -- -- 37 35
SASU -1 15025`00’ 73
045`30`` 11 -- -- 35 38
§Locations arranged from upper to lower reaches of Zuari Estuary
$S= Surface;
#B= Bottom
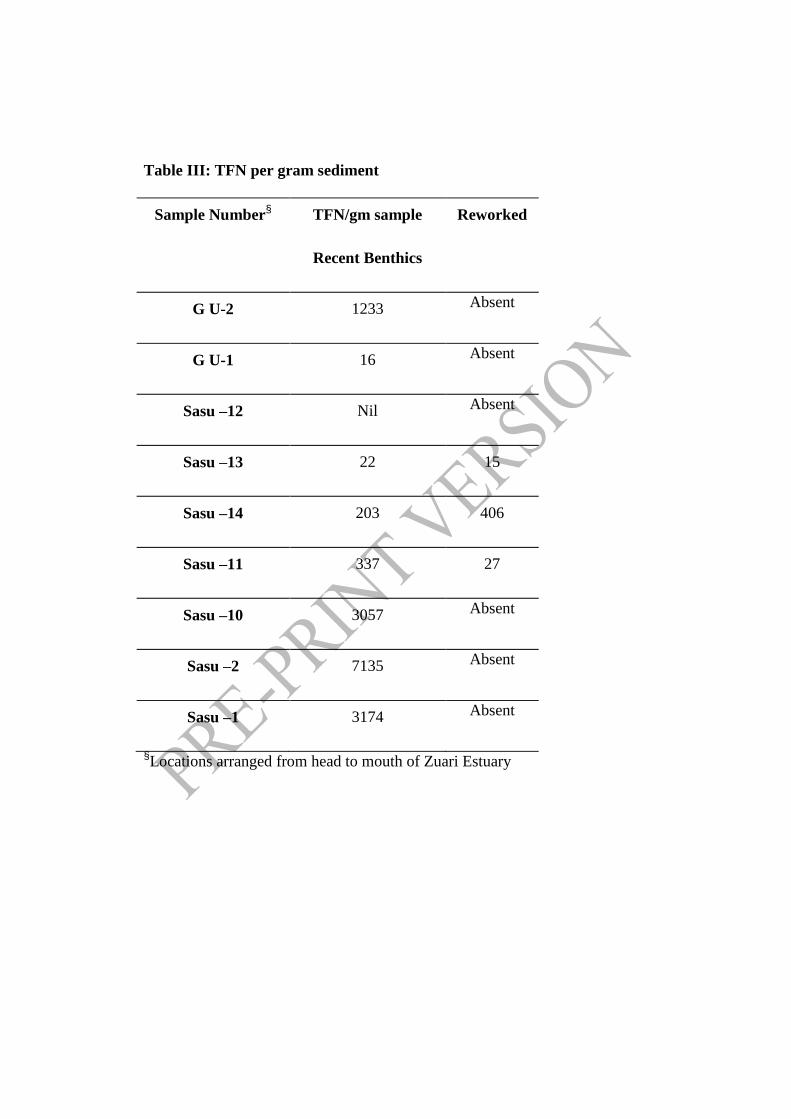
Table III: TFN per gram sediment
Sample Number§ TFN/gm sample
Recent Benthics
Reworked
G U-2 1233 Absent
G U-1 16 Absent
Sasu –12 Nil Absent
Sasu –13 22 15
Sasu –14 203 406
Sasu –11 337 27
Sasu –10 3057 Absent
Sasu –2 7135 Absent
Sasu –1 3174 Absent
§Locations arranged from head to mouth of Zuari Estuary

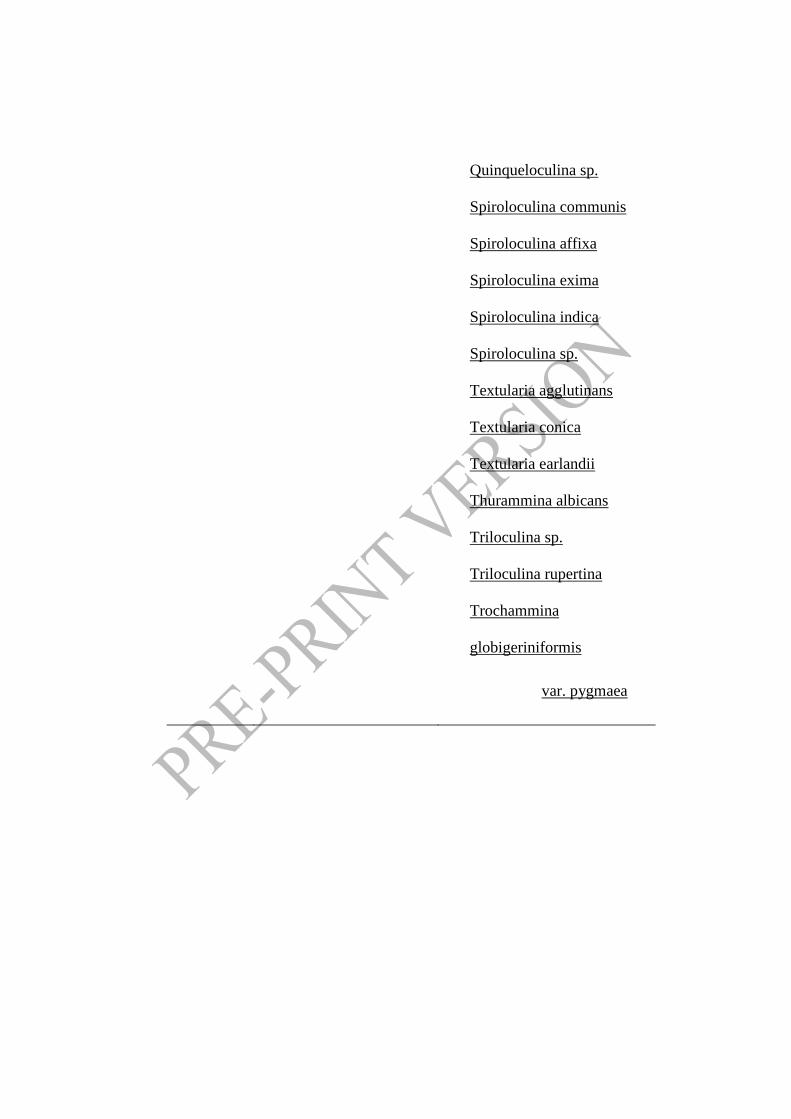
Table IV: Comparison of Foraminiferal distribution in Zuari River
Estuary in 1972 and 2003
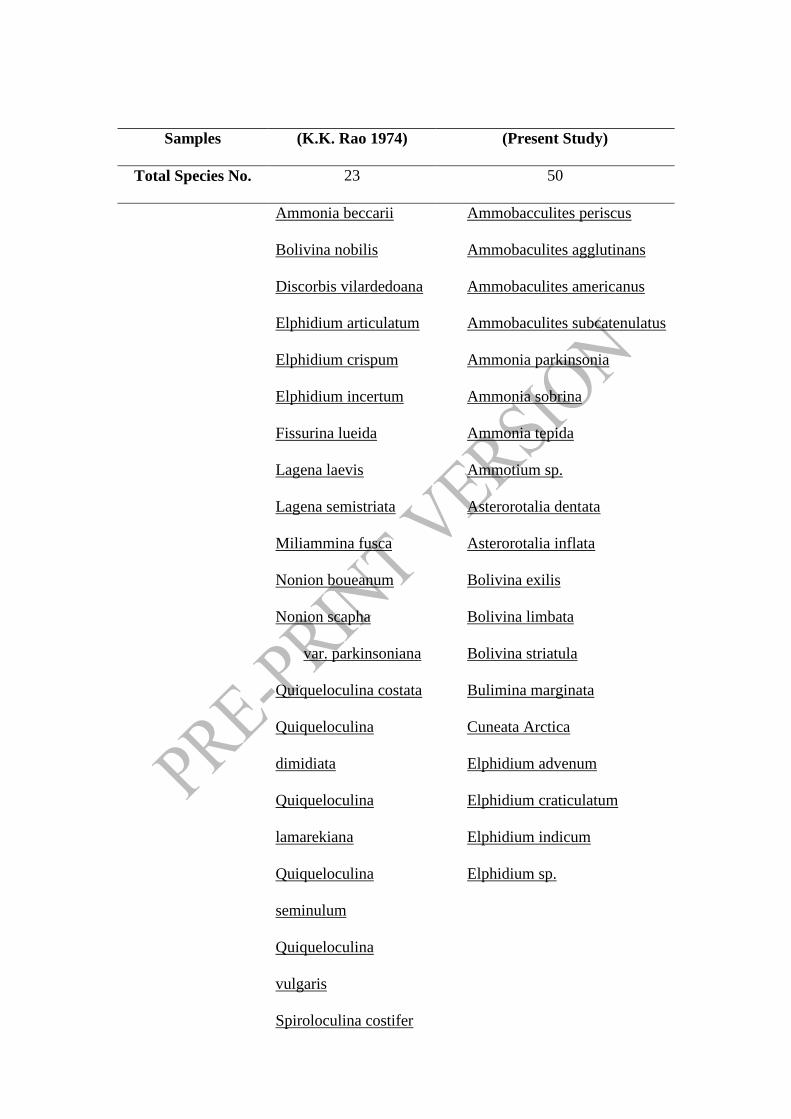
Samples (K.K. Rao 1974) (Present Study)
Total Species No. 23 50
Ammonia beccarii
Bolivina nobilis
Discorbis vilardedoana
Elphidium articulatum
Elphidium crispum
Elphidium incertum
Fissurina lueida
Lagena laevis
Lagena semistriata
Miliammina fusca
Nonion boueanum
Nonion scapha
var. parkinsoniana
Quiqueloculina costata
Quiqueloculina
dimidiata
Quiqueloculina
lamarekiana
Quiqueloculina
seminulum
Quiqueloculina
vulgaris
Spiroloculina costifer
Ammobacculites periscus
Ammobaculites agglutinans
Ammobaculites americanus
Ammobaculites subcatenulatus
Ammonia parkinsonia
Ammonia sobrina
Ammonia tepida
Ammotium sp.
Asterorotalia dentata
Asterorotalia inflata
Bolivina exilis
Bolivina limbata
Bolivina striatula
Bulimina marginata
Cuneata Arctica
Elphidium advenum
Elphidium craticulatum
Elphidium indicum
Elphidium sp.
Spiroloculina
planissima
Triloculina
trigonula
Trochammina
globigeriniformis
Trochammina
inflata
Eponides sp.
Glabratella patelliformis
Globigerina bulloides
Hauerinidae
Nonion asterizans
Nonion depressula
Nonion pacifacum
Nonion scaphum
Nonionides elongatum
Nonion sp.
Pararotalia minuta
nipponica
Poroeponides
cribrorepandus
Poroeponides lateralis
Quinqueloculina costata
Quinqueloculina
schlumbergeri
Quinqueloculina
seminulum
Quinqueloculina tropicalis
Quinqueloculina polygona
Quinqueloculina sp.
Spiroloculina communis
Spiroloculina affixa
Spiroloculina exima
Spiroloculina indica
Spiroloculina sp.
Textularia agglutinans
Textularia conica
Textularia earlandii
Thurammina albicans
Triloculina sp.
Triloculina rupertina
Trochammina
globigeriniformis
var. pygmaea
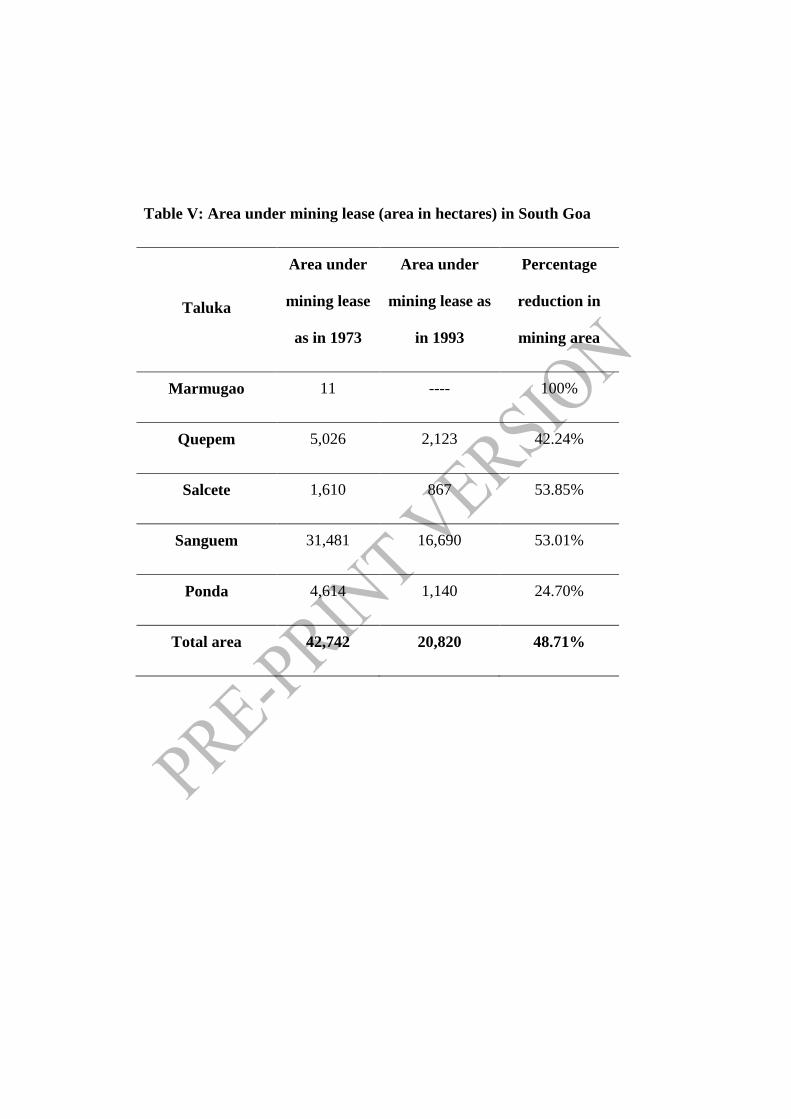
Table V: Area under mining lease (area in hectares) in South Goa
Taluka
Area under
mining lease
as in 1973
Area under
mining lease as
in 1993
Percentage
reduction in
mining area
Marmugao 11 ---- 100%
Quepem 5,026 2,123 42.24%
Salcete 1,610 867 53.85%
Sanguem 31,481 16,690 53.01%
Ponda 4,614 1,140 24.70%
Total area 42,742 20,820 48.71%
FIGURE LEGENDS
Fig.1: a. Study Area; b. Mining areas and political boundaries of Goa
Fig. 2: Variation in TFN with reference to TSM and mining
production over the years, within the catchment area of the
Zuari estuary
Fig. 3: Mining Production in Goa till 998 (a) Iron (b) Manganese
(c) Ferromanganese
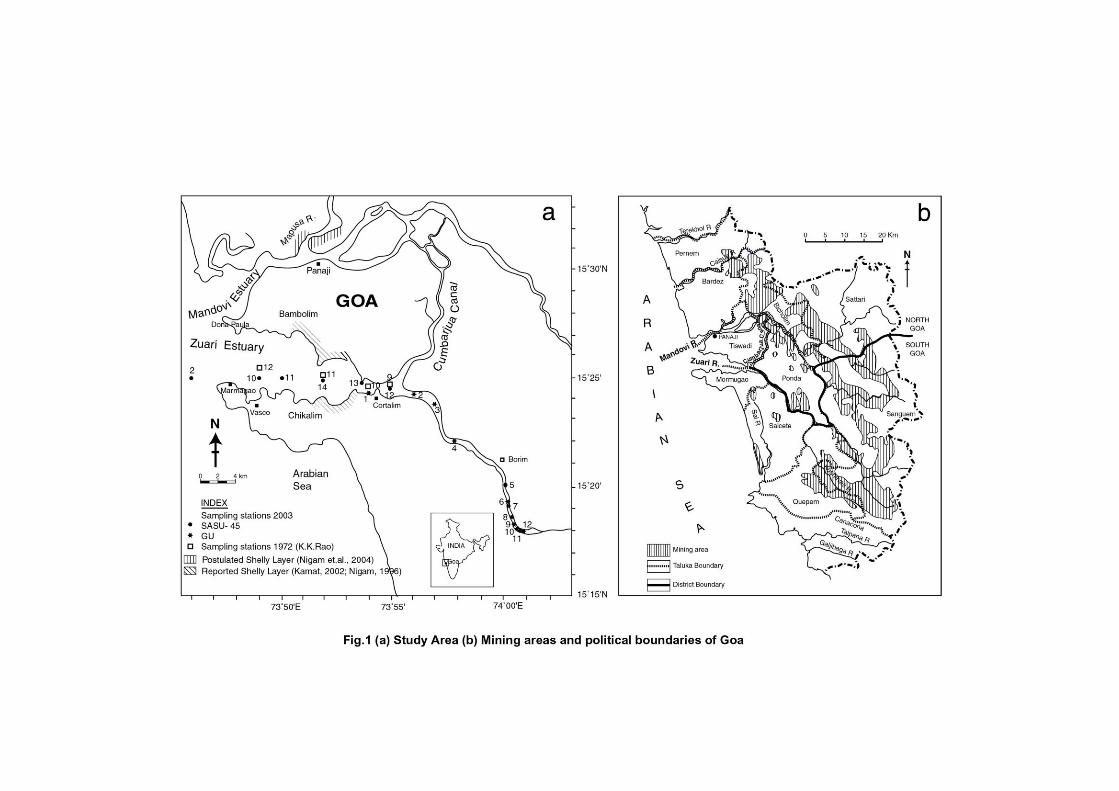
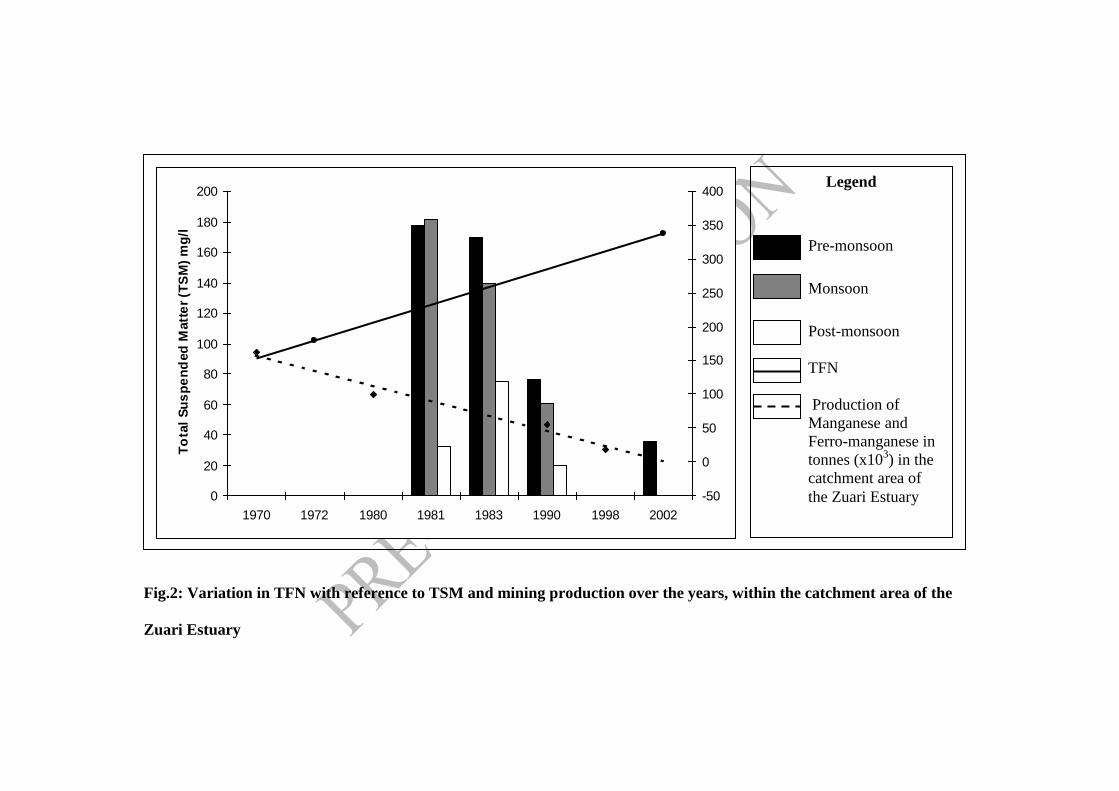
Fig.2: Variation in TFN with reference to TSM and mining production over the years, within the catchment area of the
Zuari Estuary
0
20
40
60
80
100
120
140
160
180
200
1970 1972 1980 1981 1983 1990 1998 2002
To
tal
Su
sp
en
ded
Matt
er
(TS
M)
mg
/l
-50
0
50
100
150
200
250
300
350
400Legend
Pre-monsoon
Monsoon
Post-monsoon
TFN
Production of
Manganese and
Ferro-manganese in
tonnes (x103) in the
catchment area of
the Zuari Estuary
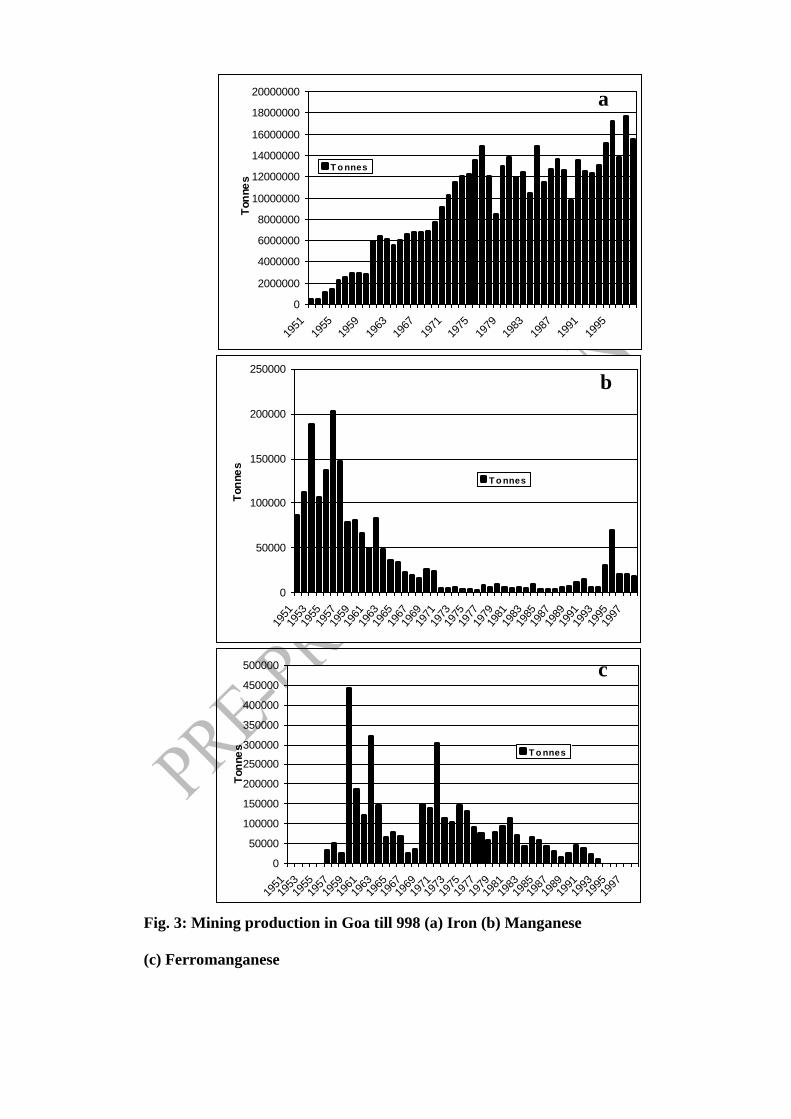
Fig. 3: Mining production in Goa till 998 (a) Iron (b) Manganese
(c) Ferromanganese
0
50000
100000
150000
200000
250000
1951
1953
1955
1957
1959
1961
1963
1965
1967
1969
1971
1973
1975
1977
1979
1981
1983
1985
1987
1989
1991
1993
1995
1997
Ton
ne
s
T o nnes
0
2000000
4000000
6000000
8000000
10000000
12000000
14000000
16000000
18000000
20000000
1951
1955
1959
1963
1967
1971
1975
1979
1983
1987
1991
1995
Ton
ne
s
T o nnes
0
50000
100000
150000
200000
250000
300000
350000
400000
450000
500000
195119
5319
5519
5719
5919
6119
6319
6519
6719
6919
7119
7319
7519
7719
7919
8119
8319
8519
8719
8919
9119
9319
9519
97
Ton
ne
s
T o nnes
a
b
c
Related Documents