Cato Institut e Policy Analysis No. 203: A Fiscal Policy Report Card on America Governors: 1994 January 28, 1994 Stephen Moore, Dean Stansel Stephen Moore is director of fiscal policy studies and Dean Stansel is a research assistant at the Cato Institute. Executive Summary This study presents an objective, comparative analysis of the spending and taxing policies of 47 of America's governors. In effect, it is a report card on their fiscal performance. For each of the govern ors who were elected before 1991, we constr ucted a 14-variable index of fiscal performance. The variabl es used include measur ements of the change in state expenditures, the change in state tax rates, and the change in the tax burden in each state under each current governor . For the 13 governo rs who took office after July 1991, we explored similar but fewer fiscal policy variables based on budget and tax changes enacted through fiscal 1994. Three governors receive A's on our fiscal policy report card: L. Douglas Wilder of Virginia, Stephen Merrill of New Hampshire, and Kirk Fordice of Mississippi. Five governors receive F's: Lowell Weicker of Connecticut, James Florio of New Jerse y, John Waihee of Hawaii, James Hunt of North Carolina, and Thomas Carp er of Delawa re. Other prominent governors and their grades, from best to worst, are William Weld of Massachusetts, B; Tommy Thompson of Wisconsin, B; John Engler of Michigan, B; Lawton Chiles of Florid a, B; Mario Cuomo of New York, C; Jim Edgar of Illinois , C; Ann Richards of Texas, D; and Pete Wilson of Calif ornia, D. Introduction This is the Cato Institute's second Fiscal Policy Report Card on America's Governors.[1] In it we examine the taxing and spending records of the governors of 47 states, 34 elected before 1991 and 13 after.[2] The governors' overall grades are given in Tables 1 and 2. Appendix A contai ns detailed tables. Major Findings Three findings of this study warrant special mention. First, the economic condition of a state and the fisca l grade of its governor tend to be closely connected.[3] That is no coincidence. Virtually all of the states with poor economic performance in recent years--especially California and the northeastern states of Connecticut, New Jersey, Pennsylvania, and Rhode Island--have governors who have pursued policies of high taxes and spending. Moreov er, studies have shown that states that have raised taxes in the 1990s have suffered deeper and more painful recessions than the rest of the nation.[4] Tax and spending policies are important factors in shaping the economic destinies of states.

Welcome message from author
This document is posted to help you gain knowledge. Please leave a comment to let me know what you think about it! Share it to your friends and learn new things together.
Transcript
8/9/2019 A Fiscal Policy Report Card on America Governors: 1994, Cato Policy Analysis
http://slidepdf.com/reader/full/a-fiscal-policy-report-card-on-america-governors-1994-cato-policy-analysis 1/23
Cato Institute Policy Analysis No. 203:
A Fiscal Policy Report Card on America Governors:
1994
January 28, 1994
Stephen Moore, Dean Stansel
Stephen Moore is director of fiscal policy studies and Dean Stansel is a research assistant at the Cato Institute.
Executive Summary
his study presents an objective, comparative analysis of the spending and taxing policies of 47 of America'sovernors. In effect, it is a report card on their fiscal performance.
or each of the governors who were elected before 1991, we constructed a 14-variable index of fiscal performancehe variables used include measurements of the change in state expenditures, the change in state tax rates, and thehange in the tax burden in each state under each current governor. For the 13 governors who took office after July991, we explored similar but fewer fiscal policy variables based on budget and tax changes enacted through fiscal994.
hree governors receive A's on our fiscal policy report card: L. Douglas Wilder of Virginia, Stephen Merrill of New
Hampshire, and Kirk Fordice of Mississippi. Five governors receive F's: Lowell Weicker of Connecticut, James Flof New Jersey, John Waihee of Hawaii, James Hunt of North Carolina, and Thomas Carper of Delaware. Otherrominent governors and their grades, from best to worst, are William Weld of Massachusetts, B; Tommy Thompsf Wisconsin, B; John Engler of Michigan, B; Lawton Chiles of Florida, B; Mario Cuomo of New York, C; Jim Ef Illinois, C; Ann Richards of Texas, D; and Pete Wilson of California, D.
ntroduction
his is the Cato Institute's second Fiscal Policy Report Card on America's Governors.[1] In it we examine the taxinnd spending records of the governors of 47 states, 34 elected before 1991 and 13 after.[2] The governors' overallrades are given in Tables 1 and 2. Appendix A contains detailed tables.
Major Findings
hree findings of this study warrant special mention. First, the economic condition of a state and the fiscal grade oovernor tend to be closely connected.[3] That is no coincidence. Virtually all of the states with poor economicerformance in recent years--especially California and the northeastern states of Connecticut, New Jersey,ennsylvania, and Rhode Island--have governors who have pursued policies of high taxes and spending. Moreovertudies have shown that states that have raised taxes in the 1990s have suffered deeper and more painful recessionshan the rest of the nation.[4] Tax and spending policies are important factors in shaping the economic destinies of tates.

8/9/2019 A Fiscal Policy Report Card on America Governors: 1994, Cato Policy Analysis
http://slidepdf.com/reader/full/a-fiscal-policy-report-card-on-america-governors-1994-cato-policy-analysis 2/23
econd, party affiliation makes less difference than some observers might expect. Republicans do score somewhatetter on average. The average grade for Republican governors is C+, versus C- for Democratic governors. Yet it isoteworthy that, among the pre-1992 governors, Democrats earned the top three grades and that Democrats, with thxception of Independent Lowell Weicker, also hold the bottom five spots.
inally, although this paper is an analysis of the governors' performance, the grades assigned also indirectly reflect scal policy performance of each state's legislature. We found that governors with high grades generally work withscally conservative legislatures. Conversely, governors with poor grades generally have pro-tax-and-spend
egislatures that are inclined to favor expansive fiscal policies.
Recent Developments in State Budgets
Table 1
Overall Fiscal Policy Grade--Pre-1992 Governors
Governor Ranking Grade
Wilder (VA) 75 A
Romer (CO 72 B
Z. Miller (GA) 71 B
Weld (MA) 69 B
Bayh (IN) 69 B
Engler (MI) 69 B
Sullivan (WY) 69 B
Campbell (SC) 67 B
Thompson (WI) 66 B
Chiles (FL) 66 B
McWherter (TN) 64 C
Schaefer (MD) 64 C
Edgar (IL) 62 C
Branstad (IA) 61 C
Symington (AZ) 61 C
Cuomo (NY) 61 C
Andrus (ID) 60 C
Walters (OK) 59 C
McKernan (ME) 59 C
Carlson (MN) 56 D
Richards (TX) 56 D
Nelson (NE) 56 D
Finney (KS) 55 D
B. Miller (NV) 52 D
King (NM) 51 D
Caperton (WV) 51 D
Voinovich (OH) 50 D
Casey (PA) 50 D
8/9/2019 A Fiscal Policy Report Card on America Governors: 1994, Cato Policy Analysis
http://slidepdf.com/reader/full/a-fiscal-policy-report-card-on-america-governors-1994-cato-policy-analysis 3/23
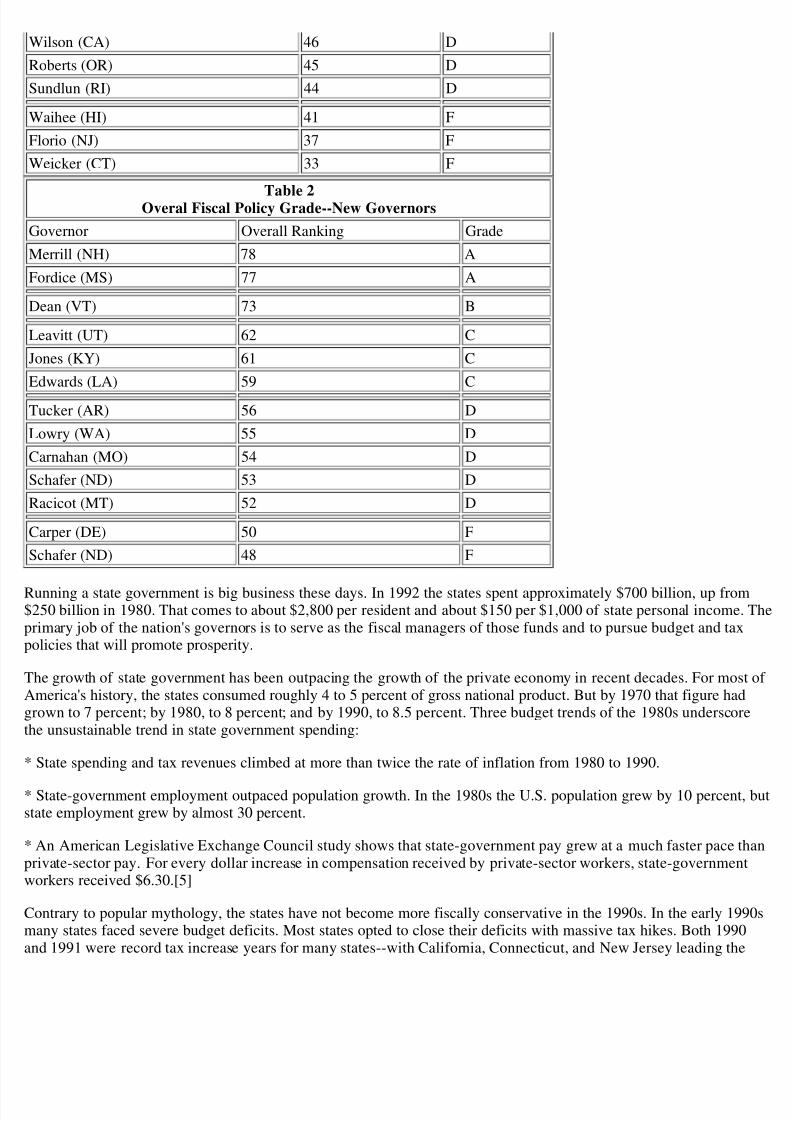
Wilson (CA) 46 D
Roberts (OR) 45 D
Sundlun (RI) 44 D
Waihee (HI) 41 F
Florio (NJ) 37 F
Weicker (CT) 33 F
Table 2Overal Fiscal Policy Grade--New Governors
Governor Overall Ranking Grade
Merrill (NH) 78 A
Fordice (MS) 77 A
Dean (VT) 73 B
Leavitt (UT) 62 C
Jones (KY) 61 C
Edwards (LA) 59 C
Tucker (AR) 56 D
Lowry (WA) 55 D
Carnahan (MO) 54 D
Schafer (ND) 53 D
Racicot (MT) 52 D
Carper (DE) 50 F
Schafer (ND) 48 F
Running a state government is big business these days. In 1992 the states spent approximately $700 billion, up from250 billion in 1980. That comes to about $2,800 per resident and about $150 per $1,000 of state personal income.rimary job of the nation's governors is to serve as the fiscal managers of those funds and to pursue budget and taxolicies that will promote prosperity.
he growth of state government has been outpacing the growth of the private economy in recent decades. For mosAmerica's history, the states consumed roughly 4 to 5 percent of gross national product. But by 1970 that figure had
rown to 7 percent; by 1980, to 8 percent; and by 1990, to 8.5 percent. Three budget trends of the 1980s underscorhe unsustainable trend in state government spending:
State spending and tax revenues climbed at more than twice the rate of inflation from 1980 to 1990.
State-government employment outpaced population growth. In the 1980s the U.S. population grew by 10 percent,tate employment grew by almost 30 percent.
An American Legislative Exchange Council study shows that state-government pay grew at a much faster pace thrivate-sector pay. For every dollar increase in compensation received by private-sector workers, state-governmen
workers received $6.30.[5]
Contrary to popular mythology, the states have not become more fiscally conservative in the 1990s. In the early 199many states faced severe budget deficits. Most states opted to close their deficits with massive tax hikes. Both 1990nd 1991 were record tax increase years for many states--with California, Connecticut, and New Jersey leading the
8/9/2019 A Fiscal Policy Report Card on America Governors: 1994, Cato Policy Analysis
http://slidepdf.com/reader/full/a-fiscal-policy-report-card-on-america-governors-1994-cato-policy-analysis 4/23
harge. Those tax increases have not been coupled with reductions in spending. With few exceptions, state lawmakave avoided undertaking painful cutbacks in state spending programs to balance their budgets. In 1991 state spendose by 10 percent, and in 1992 it grew by 12 percent. By no definition is that fiscal restraint.
ig spending binges have been most apparent in the states that have hiked taxes the most. In 1992 spending rose by6.0 percent in New Jersey, 12.4 percent in California, 31.4 percent in Pennsylvania, and 14.5 percent in Rhode Isla
he surge in federal mandates handed down to state and local governments has contributed to the expansion of statudgets. (Federal mandates are laws passed by the U.S. Congress that force states and localities to spend money.)
ederal mandates are the ultimate form of buck passing. Many state lawmakers complain that federal mandates are major reason state budgets are spiraling out of control. Mandates apply to some of the biggest programs in stateudgets, including Medicaid, Aid to Families with Dependent Children, roads and highways, and environmentalrotection. The ultimate mandated spending program, the state component of Medicaid, has been growing at betwe0 and 15 percent per year over the past 10 years. Some states complain that over half of each year's budget is eatey spending mandated by Washington.
Although mandates are increasingly irritating for the states, it is not true that governors and state legislators have litemaining discretion to control their state budgets. Spending on education, for example, is not generally mandated b
Washington (although in some cases the courts have mandated school funding). Moreover, innovative states can ano find ways to hold down spending, even on programs that are dictated by Washington. For example, Michigan,
Wisconsin, and several other states have been granted waivers of the federal rules governing welfare spending in oro implement cost-saving reforms. States can curtail Medicaid spending by refusing to cover more than 30 optionalervices--such as nursing care and chiropractors.
n sum, despite legitimate complaints about the policy mandates handed down from Capitol Hill, governors and staegislators do still hold their states' fiscal fate in their own hands. Some have handled their states' fiscal affairs mucetter than others.
Governors as Policy Innovators
xamining the fiscal policies of governors is important for several reasons. One is the sheer size of the enterprises tontrol. Today the budgets of California, Florida, New York, and Texas are larger than those of all but a few countr
very state in the country, even sparsely populated South Dakota and Wyoming, would rank in the Fortune 500 if iwere a business. And state government is the largest employer in many states. The state of Michigan currentlymploys more workers than does General Motors.
Another reason to focus on governors' policies is that the occupants of the state houses are highly influential politicagures in America. Today a governorship is regarded as a solid stepping stone to the White House. Bill Clinton,immy Carter, and Ronald Reagan all arrived at the White House via the state house. Moreover, Republican governohn Engler of Michigan, William Weld of Massachusetts, Carroll Campbell of South Carolina, Pete Wilson of
California, and Tommy Thompson of Wisconsin are all considered possible presidential or vice presidential candidn 1996. So is former Tennessee governor Lamar Alexander.
Governors are also leading public policy innovators. The states are increasingly fulfilling their roles as incubators f
ew ideas and as "laboratories of democracy." We have seen Governors Thompson of Wisconsin and Sullivan of Wyoming pursue innovative welfare strategies, Governor Engler of Michigan experiment with market-based schooleforms, Governors Wilder of Virginia and Weld of Massachusetts save tax dollars through privatization, and
Governors Fordice of Mississippi and Symington of Arizona implement pro-growth supply-side tax cuts.[6]
All too often, however, government activism is regarded as government success. Governors who are willing to spenmoney to solve problems have conventionally been touted as the best and most effective governors--at least in theopular press. That was certainly true in the 1980s when chusetts, Tom Kean of New Jersey, John Sununu of New
Hampshire, Bruce Babbitt of Arizona, and Bill Clinton of Arkansas--were all widely praised as bold architects of hanges in economic and social policy.[7] The more tax money those governors spent, the better was their reputatiomong policy experts. Yet the legacy of many of the highly praised state spending programs of the 1980s is a sea o
8/9/2019 A Fiscal Policy Report Card on America Governors: 1994, Cato Policy Analysis
http://slidepdf.com/reader/full/a-fiscal-policy-report-card-on-america-governors-1994-cato-policy-analysis 5/23
ed ink in the 1990s.
Willingness to spend tax dollars is no longer viewed as a positive achievement--especially by the voters. Since 1990 pro-tax governors--both Republicans and Democrats-- have either lost bids for reelection or not sought reelec- ecause of their low popularity ratings. Jim Florio was the latest political casualty. In short, the public is increasinglemanding fiscal restraint from state government.
urpose of the Fiscal Policy Report Card
Almost all existing ratings of governors are subjective. Typically, ratings are made by political scientists, othercademics, or even other politicians. Those ratings constitute little more than political popularity contests. To ournowledge, the Cato Fiscal Policy Report Card on America's Governors is the only objective system for measuringomparing the governors' fiscal performance. By contrast, there are dozens of prominent rating systems for assessin
members of Congress on a whole range of issues-- from their budget and tax policies to their positions on foreignolicy and abortion.
he objective of this report card is to find out which governors have pursued budget and tax policies that promote tnterests of the taxpayers of their states. Of course, special-interest groups would no doubt rate the governors entireifferently. What we measure is the degree of fiscal restraint exercised by each governor.
Limitations of the Report Card
At the outset, we acknowledge several unavoidable problems in grading the performance of the governors. The firsmentioned earlier, is that we do not take direct account of the influence of the state legislatures.[8] In most states, thegislature's influence on budget outcomes is roughly equal to the governor's. However, if the state legislature isontrolled by a party that is different from the one to which the governor belongs, the governor's influence on fiscaolicy outcomes is normally diminished. (Appendix B contains a summary of the fiscal policy record of each governd indicates whether or not the legislature is of the same party as the governor.) There are 12 governors in our sur
who have legislatures controlled by another party.
We find that the dominant party in the legislature does appear to make an important difference in the performance oome governors. For example, three of the top-scoring Democratic governors have worked with Republican
egislatures: Bayh (IN), Romer (CO), and Sullivan (WY). The flip side is also true. Republican governors with poorcores tend to have Democratic legislatures. Those governors include most prominently Wilson (CA) and CarlsonMN).
he average governor's grade is C- for states in which the legislature is controlled by Democrats. It is C- for states iwhich control of the legislature is split. And it is C for states in which Republicans control the legislature.
How to interpret those findings is unclear. It may be that when a "Republican" state elects a Democratic governor, overnor tends to be more fiscally conservative than the typical Democrat. Similarly, when a "Democratic" state eleRepublican governor, that politician may be predisposed to be more moderate on fiscal issues than the typical
Republican. In other words, it may be that Evan Bayh, for example, has a fiscally conservative record because theoters of Indiana are fiscally conservative and would not tolerate high-tax policies, not because the legislature is
ushing Bayh in that direction. On the other hand, it may be that the legislature is successfully imposing its fiscaliews on the governor.
Regardless of which explanation is correct, it is important to emphasize that, with only a few exceptions, mostovernors have been granted greater constitutional authority over the state budget process than has the president ovhe federal purse strings.[9] For example, more than 40 governors have line-item-veto authority, a budget tool theresident lacks. Just as it is appropriate to hold the president at least partially accountable for the fiscal policies of thederal government, it is appropriate to hold governors accountable for the fiscal outcomes in their states.
Another potential complication in this study is that every state has peculiarities in its expenditure and tax policies than make interstate comparisons of taxing and spending difficult. For instance, in Hawaii most school funding com
8/9/2019 A Fiscal Policy Report Card on America Governors: 1994, Cato Policy Analysis
http://slidepdf.com/reader/full/a-fiscal-policy-report-card-on-america-governors-1994-cato-policy-analysis 6/23
rom the state, not the local governments, which inflates Hawaii's spending figures. Alaska and several northwestertates receive tax revenues from severance taxes on oil produced or minerals mined in the state. Those taxes are oftaid by out-of-state residents. Furthermore, the fiscal condition of those states can improve or deteriorate dramatican response to changes in the market price of commodities. We believe that severance taxes are a significant distortnly for Alaska and therefore exclude that state from the study.
Also, some changes in the states' tax codes may not be fully accounted for in the rate structures we examine. Fornstance, a broadening of the sales tax base is not directly measured in the tax rates analysis, whereas an increase inhe sales tax rate is. Comparisons of income tax structures may not fully account for all the manifold deductions an
xemptions that make each state's tax code unique. That is why we measure changes in both tax rates and tax revent allows us to detect the fiscal impact of all tax changes.
Methodology
We compute three separate grades for the governors: one on how well they control spending, one on how well theyestrain taxes, and one on overall fiscal policy. All of the tax and expenditure data used in this study come from the
U.S. Census Bureau and other nonpartisan sources.[10]
or the 13 governors who took office after July 1991, official Census Bureau data are not yet available to use inmeasuring all of the spending and tax changes that have been implemented in their first year or years in office.
herefore, we divide the governors into two groups: those who took office before August 1991 (pre-1992 governorsnd those who have taken office since July 1991 (new governors). For the 13 new governors, we rely on general fuudget data and tax rate changes through fiscal 1994, as compiled by the National Association of State Budget
Officers. Those data do not include all spending and taxes and are less reliable than the Census Bureau data. They aowever, the best numbers currently available.
ince the grades for the new governors are based on their performance after just one or two years in office, thoserades might be likened to "midterm" grades. They could markedly change depending on the governors' policieshroughout the remainder of their terms. We note that of the midterm grades assigned in the first Cato Fiscal Policy
Report Card in 1992, 7 have remained the same, 10 have changed by one grade, and 2 have changed by two grades
Grading Procedure
or the pre-1992 governors, we examine 14 policy variables, 5 of which are for spending. We standardize the resulor each variable, such that the lowest score is zero and the highest score is 100. We then assign a weight to eachariable and add the scores achieved in each category.[11] That provides us with separate grades for spending and axes. We combine those scores to obtain an overall fiscal policy grade for each governor.
he same basic procedures are used for grading the new governors except that only nine variables are used.
olicy Variables Examined
One objective of our analysis is to compile as comprehensive a picture as possible of the fiscal policy changes madach governor. We attempt to do that by examining a broad spectrum of fiscal policy measures that take account of
conomic, demographic, and other factors within each state. All but two of the variables measure the change duringach governor's tenure. Two of the variables measure the level of taxes and spending in each state in 1992.
Expenditure Variables for Pre-1992 Governors
he following expenditure variables are used for each of the pre-1992 governors.
. Overall level of state spending per family in 1992.[12]
. Average annual change in real state spending per family through 1992.
8/9/2019 A Fiscal Policy Report Card on America Governors: 1994, Cato Policy Analysis
http://slidepdf.com/reader/full/a-fiscal-policy-report-card-on-america-governors-1994-cato-policy-analysis 7/23
. Average annual change in state spending per $1,000 of personal income through 1992.
. Average annual percentage change in real state spending through 1992.
. Real change in state general fund expenditures per family from 1992 to 1994, as recommended by the governor.[
Tax and Revenue Variables for Pre-1992 Governors
he following tax rate and revenue variables are used for each of the pre-1992 governors.
. Average annual real percentage change in state taxes through 1992.
. Average annual change in real state revenues per family through 1992.[14]
. Average annual percentage change in state revenues per $1,000 of personal income through 1992.
. Revenues from tax changes for fiscal years 1992 through 1994, as a percentage of 1991 general fund revenues.
. Percentage point change in the state's top marginal individual and corporate income tax rates through 1994.
. Change in state personal income tax rate paid by median-income wage earners through 1994.
. Sum of the state's top marginal individual and corporate income tax rates in 1994.
. Change in the state gasoline tax rate through 1994.
. Change in the state sales tax rate through 1994.
Expenditure Variables for New Governors
he following three expenditure variables are examined for each of the 13 new governors.
. Total 1992 state spending per family.
. Average annual change in real state general fund expenditures per family through 1994.
. Average annual percentage change in real general fund expenditures through 1994.
Tax and Revenue Variables for New Governors
he following six tax rate and revenue variables are examined for each of the 13 new governors.
. Revenues from recommended tax changes as a percentage of state revenues.
. Average annual percentage change in general fund revenues through 1994
. Percentage point change in the state's top marginal individual and corporate income tax rates through 1994.
. Sum of the state's top marginal individual and corporate income tax rates in 1994.
. Change in the state gasoline tax rate through 1994.
. Change in the state sales tax rate through 1994.
Ratings for the Pre-1992 Governors
8/9/2019 A Fiscal Policy Report Card on America Governors: 1994, Cato Policy Analysis
http://slidepdf.com/reader/full/a-fiscal-policy-report-card-on-america-governors-1994-cato-policy-analysis 8/23
Expenditures
A summary of the results and ratings on five expenditure variables is given in Table A-1 in Appendix A. Tables Ahrough A-6 list the five biggest spenders and the five biggest budget cutters in each individual spending category.
wo governors distinguished themselves as outstanding on the spending side of the budget and receive an A: WeldMA) and Wilder (VA). Both reduced real government spending per family in 1992--in Massachusetts the decline early $400 per family. Sullivan (WY) also has an enviable record on spending. Real outlays in Wyoming have bee
ut on an average annual basis and as a share of personal income during Sullivan's tenure.
he biggest spenders have been Waihee (HI), Florio (NJ), and Sundlun (RI). In each of those states real spending rt a double-digit annual pace in 1992. Moreover, the average annual increase in spending per family was over $1,2n each of those states. Other governors who have presided over huge spending binges are Wilson (CA) and WalterOK). In both California and Oklahoma, spending as a share of personal income rose by about 11 percent in 1992.
he spending scores highlight major differences in fiscal strategies for dealing with deficits. In Rhode Island, Sundnacted taxes to close deficits, and spending rose nearly $1,600 per family in 1992. In Massachusetts, taxes have bepurned by governor Weld, and the strategy of cutting spending has brought it down by almost $400 per family.
Massachusetts is now in better fiscal health than Rhode Island.
Rhode Island is not the only tax increase state where spending has exploded. In the other four states with major taxncreases in 1990-91--California, Connecticut, New Jersey, and Pennsylvania--expenditures also surged. Althoughhose record tax hikes were supposed to be coupled with budget cutbacks, real annual per capita expenditures rose b967 under Wilson (CA), $265 under Weicker (CT), $1,573 under Florio (NJ), and $636 under Casey (PA). Theromised spending cuts have materialized slowly, if at all.
Tax Rates and Revenues
ables A-7 through A-16 present the results for the pre-1992 governors on tax rates and revenues. The champion tautter in recent years has been Symington (AZ), who received an A for his performance on tax rates and revenues. ax burden on families has been reduced during Symington's term in Arizona, and revenues have fallen both in realerms and as a share of personal income. Symington has cut income taxes and held the line on all other major taxes
Governors Wilder (VA), Engler (MI), Romer (CO), and Sullivan (WY) have also done a superior job of holding thne on taxes. In late 1993 Engler enacted a multi-billion-dollar reduction in the state and local property taxes. Thaeduction is too recent to have been included in the tax statistics for Engler in this report.
he biggest tax hikers have been Weicker (CT) and Roberts (OR), both of whom received an F in the tax categoryhe tax burden rose by nearly $2,000 per family in Connecticut under Weicker and by nearly $1,750 per family in
Oregon under Roberts in 1992. Taxes rose 20 percent as a share of personal income in both those states.
hree governors have brought down income tax rates substantially: Cuomo (NY), Romer (CO), and Branstad (IA).hose tax rate reductions have actually led to an increase in income tax revenue collections in those states. Meanw
he largest tax rate increases have been enacted under Casey (PA), Sundlun (RI), Florio (NJ), Finney (KS), Weicke
CT), and Wilson (CA). Virtually all of those states have suffered a much more severe recession than theireighbors.[15] Wilson's tax increase has produced only a fraction of the revenue expected.[16]
Ratings for the New Governors
hirteen states have governors who took office after July 1991.[17] The fiscal policy track records of those governos much more limited than those of the pre-1992 governors. Census Bureau expenditure and tax data are not yetvailable to measure the performance of the new governors. We are limited to two years' data for Governors JonesKY), Edwards (LA), Fordice (MS), and Dean (VT) and just one fiscal year's data for the other nine. We rely mostln general fund expenditure data and enacted changes in deriving midterm grades for the new governors.
8/9/2019 A Fiscal Policy Report Card on America Governors: 1994, Cato Policy Analysis
http://slidepdf.com/reader/full/a-fiscal-policy-report-card-on-america-governors-1994-cato-policy-analysis 9/23
Governors Fordice (MS) and Merrill (NH) received A's. Two pro-tax-and-spend governors received F's: Hunt (NCnd Carper (DE) (see Table 2).
Expenditures
he results for each of the three spending categories we investigated for the new governors are shown in Tables A-hrough A-20. The two governors with the best records for cutting the budget are Fordice (MS) and Schafer (ND).hey have cut general fund spending both in real terms and on a per family basis.
Hunt (NC) and Carper (DE) have shown a strong proclivity for higher spending in their first budgets. Last year, reaeneral fund spending was hiked by $316 per family in North Carolina and by $144 per family in Delaware.
Tax Rates and Revenues
he results for the new governors in the revenues and tax rates categories are given in Tables A-21 through A-27. Tew governor with by far the best record on taxes is Merrill (NH). He has recommended tax reductions equal to abo.5 percent of total general fund revenues at a time when most governors have been recommending tax hikes. DeanVT) also deserves credit for approving an income tax rate reduction, as does Fordice (MS) for vetoing an increase he state sales tax--a veto that was subsequently overridden by the legislature.
On the other end of the scale, Racicot (MT) and Schafer (ND) earned F's for their tax policies. Racicot has tried to
aise virtually every tax the state levies and has requested an enormous 21 percent increase in taxes in his first yearHe raised the gas tax and approved a new 4 percent sales tax, which voters quashed overwhelmingly in a referendu
chafer and Carnahan (MO), who received a D on taxes, approved large increases in their states' income taxes.
Overall, the fiscal record of the new governors has been uninspiring, with far more showing a willingness to raise than to cut them.
Conclusion
As has been the case on the federal level, the 1990s have been years of significant fiscal expansion for the states. Tmajor lesson of the 1990s so far is that governors who try to combat budget deficits with major tax increases harmheir states' economies and have very little success in slowing the tide of red ink. California, Connecticut, New Jers
Rhode Island, and Pennsylvania all bear unhappy witness to the fiscal and economic consequences of raising stateaxes.
or the first time in many years, the fiscal outlook for the states is rosy. Many states will have the luxury of a budgurplus in 1994. Several governors, including Cuomo, Engler, Fordice, King, Symington, Weld, Wilson, and newlylected New Jersey governor Christine Todd Whitman have proposed major tax cuts this year. That is precisely theroper fiscal strategy for state governments to pursue after several years of budget hemorrhaging in state capitals.
Governors who refuse to cut taxes this year will see their states fall further behind in the competition for investmenew business creation, and jobs.
Notes
1] The first was Stephen Moore, "A Fiscal Policy Report Card on America's Governors," Cato Institute PolicyAnalysis no. 167, January 30, 1992.
2] Three governors are not included in this report. Walter Hickel of Alaska is excluded because of peculiarities inAlaska's budget system that make interstate comparisons problematic. Jim Folsom of Alabama is excluded becauseid not become governor until April 1993, when the previous governor, Guy Hunt, was indicted. Walter Miller of outh Dakota also did not become governor until April 1993, when George Mickelson was killed in a plane crash. Wo not yet have sufficient information on the fiscal policies of Gover nors Folsom and Miller.
3] Several of the variables used reflect the growth of spending and taxes relative to the growth of personal income

8/9/2019 A Fiscal Policy Report Card on America Governors: 1994, Cato Policy Analysis
http://slidepdf.com/reader/full/a-fiscal-policy-report-card-on-america-governors-1994-cato-policy-analysis 10/23
he states. Governors who have presided over periods of rapid growth in state personal income have better grades,ther things being equal, than governors whose tenure has corresponded with declines in state personal income.
4] U.S. Congress, Joint Economic Committee, "Taxing Lessons from the States," Minority staff report prepared foReps. Jim Saxton and Chris Cox, 1993
5] Wendell Cox and Sam Brunelli, "America's Protected Class II," The State Factor 19, no. 1 (January 1993): 7.
6] See Stephen Moore, "Reform Afoot," National Review, May 11, 1992, pp. 36-39.
7] For instance, in the 1980s the left-leaning New York- based Corporation for Economic Development publishedeveral ratings of the states to determine which governors were implementing the best economic policies.
Massachusetts and Michael Dukakis routinely ranked at the top of the rating scale, until the fiscal collapse of Massachusetts in 1989.
8] We use fiscal year 1994 figures from the governors' recommendations rather than the amounts appropriated by egislatures.
9] In the South the state constitutions tend to confer fewer powers on the governors than is typical in the rest of th
ation. The southern states have typically followed what is sometimes called the "weak executive model." The weaovernor in the nation is the governor of North Carolina, who does not have veto authority of any kind.
10] For the pre-1992 governors, unless otherwise noted, the U.S. Census Bureau is the source of all the data presenn state spending, state taxes, state population, and state personal income. The U.S. Census Bureau monitors stateovernment finances each year and publishes a detailed report of its findings entitled "State Government Finances.he census data on state governments is superior to data from all other sources because they account for every type utlay and every type of revenue generated for each state. The most recently published data are for 1992.
he data on general fund expenditures and general fund tax revenues come from biannual compilations by the NatiAssociation of State Budget Officers published in "Fiscal Survey of the States"; and from Tax Foundation, State TaRates and Collections in 1993, Special Report no. 27 (Wash ington: Tax Foundation, January 1994).
he data on changes in tax rates come from several sources: the Advisory Commission on Intergovernmental Relaons, "Significant Features of Fiscal Federalism," various years; the National Conference of State Legislatures, "Stax Actions," various years; and statistics obtained direct ly from the finance and tax offices of the individual state
11] All spending and revenue variables have a weight of 1. The tax rate variables are assigned lower weights, as exlained in the notes to Tables A-7 and A-21.
12] Throughout this report "family" means a family of four.
13] This last spending measure captures the effect of spending decisions that have been made in the last two years
he states but are not yet compiled by the Census Bureau. For this measure we use annual data compiled by theNational Association of State Budget Officers. The 1994 fiscal year estimates are based on the levels recommendedhe gover nors during last year's budget cycle. General fund data are far from ideal for measuring total spendingrowth in a state. General fund spending does not include certain types of nonappropriated spending, such as pensiund spending and some entitlement outlays. Furthermore, state lawmakers sometimes move spending into or out ohe general fund to mask fiscal problems. Despite those defects, the general fund data do, for the most part, provide
with a fairly good picture of how the states' spending patterns have changed since 1992. The 1992-93 growth rateswere used in estimating the 1994 population.
14] All state revenues in this report exclude intergovern mental funds from the federal government.
8/9/2019 A Fiscal Policy Report Card on America Governors: 1994, Cato Policy Analysis
http://slidepdf.com/reader/full/a-fiscal-policy-report-card-on-america-governors-1994-cato-policy-analysis 11/23
15] Victor A. Canto and Arthur B. Laffer, "The State Compet itive Environment: 1993-94 Update," Laffer and CanAssoci ates, La Jola, Calif., November 1993.
16] Although tax increases are often viewed as fiscally responsible, recent evidence indicates that states' bond ratinenerally fall after taxes are raised and rise after taxes are cut. In other words, raising taxes hurts the fiscal conditiostate. See Victor A. Canto, Christo pher Charles, and Arthur B. Laffer, "The Determinants and Consequences of tate General Obligation Bond Rating Changes," Laffer, Canto & Associates, La Jola, Calif., 1991.
17] Lt. Gov. Jim Guy Tucker of Arkansas took over the gover norship when Bill Clinton was elected president in
992.
ublished by the Cato Institute, Policy Analysis is a regular series evaluating government policies and offeringroposals for reform. Nothing in Policy Analysis should be construed as necessarily reflecting the views of the Catnstitute or as an attempt to aid or hinder the passage of any bill before Congress.
Contact the Cato Institute for reprint permission. Additional copies of Policy Analysis are $4.00 each ($2.00 in bulko order, or for a complete listing of available studies, write to: Policy Analysis, Cato Institute, 1000 Massachusetts
Avenue NW, Washington, D.C. 20001. (202)842-0200 FAX (202)842-3490 E-mail [email protected].
Appendix A: Detailed Tables [Omitted]
Appendix B: Summary of Fiscal Policy Recordsf the GovernorsTables Omitted]
Due to rounding, the figures in the tables in this appendix may not match those in Appendix A. The figures inAppendix A were used in determining the ranking of the governors.
Arizona
ife Symington, Republican Legislature: Republicanook Office: 3/91
Grade: C
lected in 1990 as a self-described "Reagan Republican" with an agenda of cutting taxes and state spending,ymington has delivered on half his promise. In his first two years, Symington has shunned all tax increases and evnacted two small tax cuts--at a time when most governors have been raising taxes. Thanks to a small budget surpln 1993, Symington has promised more income tax cuts in 1994. However, Arizona's spending continues to spiral of control. (Arizona had the fastest growing state budget in the nation in the 1980s.) In Symington's first fiscal year992, the state budget grew by 12 percent. The one positive sign is that since then general fund expenditures haveeclined slightly.
Arkansas
im Guy Tucker, Democrat Legislature: Democraticook Office: 12/92
Grade: D
ucker was elevated to the governorship after Bill Clinton's election to the presidency. So far Tucker has continuedClinton's 10-year state budget and tax build-up. To address a Medicaid funding gap, upon his swearing-in Tuckeralled a special session of the legislature that resulted in an almost $80-million increase in state revenue. Among thax hikes were an increase of 12.5 cents in the cigarette tax, a new soft drink excise tax of 2 cents per 12 ounces or quivalent, an expansion of the sales tax to various services, new taxes on health care providers, a new gross receipax on bingo, and an increase in the real estate transfer tax. Taxes and spending both rose by 4 percent above inflatn his first budget.

8/9/2019 A Fiscal Policy Report Card on America Governors: 1994, Cato Policy Analysis
http://slidepdf.com/reader/full/a-fiscal-policy-report-card-on-america-governors-1994-cato-policy-analysis 12/23
California
ete Wilson, Republican Legislature: Democraticook Office: 1/91
Grade: D
ete Wilson's fiscal stewardship has been hard on California. In 1991 Wilson rammed through the legislature a $7-illion tax increase--the largest state tax hike in American history. It has contributed to the outmigration of people,usinesses, and an estimated half million jobs. In three years Wilson has raised virtually every state tax imaginable
he income tax, the sales tax, the gasoline tax, the cigarette tax, and a host of others. Yet only a frac- tion of therojected revenues has been delivered, and thus big budget deficits remain. Tax collections actually fell in 1992, anndication that California's new 11 percent income tax rate is losing money for the state. Every dollar raised in taxe991 was supposed to have been linked with $2 of spending cuts. In Wilson's first year alone, the state budgetncreased by 10 percent, or $9 billion or almost $1,000 per family--after inflation. The one bright spot in the fiscalutlook is that last year Wilson finally requested and won sharp cutbacks in the state's $100-billion budget.
Colorado
Roy Romer, Democrat Legislature: Republicanook Office: 1/87
Grade: B
During Romer's tenure as governor, Colorado has done an enviable job of keeping the lid on spending and taxes. Sf that solid performance is attributable to a fiscally conservative legislature and an even more fiscally conservativelectorate, which recently passed a referendum requiring voter approval of state and local tax increases. Expenditurave been growing at a real rate of 2 percent per year--much lower than the budget growth in most states. By far th
most important fiscal achievement of Romer's governorship came in his first term when the state's progressiveorporate and personal income tax rates, which topped out at 8 percent, were converted to a flat, simplified 5 perceate. However, of late Romer has been acting like a traditional tax-and-spend liberal. He lobbied against the ballot
measure requiring voter approval of tax increases and for his own initiative to raise the sales tax to pay for morepending on education. Fortunately, the voters ignored his advice on both measures.
Connecticut
owell P. Weicker, Jr., Legislature: Democraticndependent Took Office: 1/91
Grade: F
Weicker is the champion tax-and-spend governor--edging out New Jersey's Jim Florio. After a decade during whicConnecticut's budget increased by 150 percent, Weicker's solution to the resulting red ink in 1991 was to enact amassive tax hike. Despite roughly two-thirds public opposition to the concept, Weicker won narrow support in theegislature for the state's first personal income tax in exchange for a decline in the state sales tax. For the average
Connecticut taxpayer, that was a bad deal: the real tax burden climbed by $2,000 per family, and annual state revenwent up by 20 percent after inflation. Over roughly the same time period, 1989-92, real income per family inConnecticut dropped by almost $2,500 and jobs disappeared. There has been no fiscal restraint on the expenditure sf the budget; real expenditures have climbed by more than $200 per family per year.
Delaware
om Carper, Democrat Legislature: Dividedook Office: 1/93
Grade: F
After serving five terms in the U.S. House of Representatives, Carper won a landslide election to the governorship

8/9/2019 A Fiscal Policy Report Card on America Governors: 1994, Cato Policy Analysis
http://slidepdf.com/reader/full/a-fiscal-policy-report-card-on-america-governors-1994-cato-policy-analysis 13/23
992. As governor, he has shown about as much fiscal restraint as one might expect of a 10-year veteran of the U.Congress. Carper has followed closely in the footsteps of his Republican predecessor, Michael Castle, by increasingpending on health care, education, and economic development. He has sought to extend access to health care to alhildren and provide early childhood education. To pay for all of that, Carper increased Delaware's gasoline tax by ents per gallon, hiked turnpike tolls from $1.00 to $1.25, and raised the motor vehicle document fee. If Carper tru
wants to promote economic development in Delaware, he should imitate the policies of another former Republicanovernor, Pete DuPont, who cut tax rates and presided over a lengthy period of prosperity in Delaware.
lorida
awton Chiles, Democrat Legislature: Dividedook Office: 1/91
Grade: B
Chiles took office in 1991 pledging to reinvent state government and "right-size" the bureaucracy, but so far he hasevoted most of his attentions to raising taxes. In 1992 Chiles introduced his "investment budget," which called for1.4 billion in new taxes, including an expansion of the sales tax to utilities and various personal services and anncrease in taxes on businesses. Chile's relatively good grade here is to some extent a reflection of the fact that all httempts to enact tax hikes have been stymied by the legislature and a skeptical public. Florida's expenditures haveeen growing at about an average pace (5 percent per year) during his term. But because Florida remains a low-axing-and-spending state, its economy continues to perform fairly well under Chiles.
Georgia
ell Miller, Democrat Legislature: Democraticook Office: 1/91
Grade: B
Miller's fiscal performance has been above average in almost all spending and taxing categories. He has not raised major new taxes, and the tax burden in Georgia actually fell by about $150 per family in 1992. Miller did, howeverhrow his support behind a new state lottery, to pay for more spending on education. Although Georgia remains onehe South's highest spending states, Miller held the growth of spending to less than 3 percent in 1992. He has also c
he state-government payroll by 5,000 workers. The only disturbing development is that general fund spendingpproved last year included substantial spending hikes for fiscal 1994.
Hawaii
ohn Waihee, Democrat Legislature: Democraticook Office 12/86
Grade: F
Waihee has helped to create and prolong the recession in Hawaii by his spendthrift budget policies. In his first fiveears, he allowed the state budget to mushroom from $3.2 billion to $5.3 billion--an average annual increase of 10ercent. That amounts to about $1,200 per family every year. Since then, spending has continued to rise at a rate w
bove the U.S. average. Waihee has pumped funds into an expensive new universal health care program--whichhreatens to bankrupt the state--new low-income housing projects, education, and "economic development." Despitf those "pro-growth" spending initiatives, the unemployment rate in Hawaii has increased by 2 percentage pointsince 1989, and property values are in a depression. The spending path charted under Waihee is clearly unsustainaboth fiscally and economically.
daho
Cecil D. Andrus, Democrat Legislature: Republicanook Office: 1/87
Grade: C
8/9/2019 A Fiscal Policy Report Card on America Governors: 1994, Cato Policy Analysis
http://slidepdf.com/reader/full/a-fiscal-policy-report-card-on-america-governors-1994-cato-policy-analysis 14/23
Andrus has a pro-tax, pro-spending bias that seems out of step with historically fiscally conservative Idaho. He hasaised corporate taxes, gasoline taxes, and other fees. Tax receipts have been accelerating at 6 percent per year abovnflation. Andrus has used that money to expand the state budget by more than one-third, after inflation, since 1987
Much of the money has been channeled into the schools, children's programs, and the environment. Idaho is losing istinction as a low-tax state under Andrus's leadership.
linois
im Edgar, Republican Legislature: Dividedook Office: 1/91
Grade: C
he Republican party apparatus in Illinois has long been ruled by moderates, and Edgar is the prototypical IllinoisGOP politician. He has not raised major taxes, but he made permanent an anti-growth state income tax increaseenacted by his predecessor Republican Jim Thompson) that was supposed to have been temporary. Although Edgaromotes himself as an anti-spending crusader and talks of aggressively downsizing state bureaucracy, during his fiear, the Illinois budget grew by more than $1 billion, or almost 6 percent. Over the past year, however, Edgar'serformance has finally started to match his budget-hawk rhetoric. In 1993 and 1994 the budget will grow by onlybout 1 percent per year after inflation. Edgar falls in the middle of our ranking of governors.
ndiana
van Bayh, Democrat Legislature: Dividedook Office: 1/89
Grade: B
ayh has an admirable overall fiscal and economic record as governor of Indiana since 1989. Indiana has been onehe top states in job creation in the 1990s, and its unemployment rate has declined significantly relative to the natioverage. Bayh has been conspicuous among governors in firmly keeping his promise not to raise any major taxes. B992 the tax burden had declined by about $300 per family. His record on spending is not as solid; expenditureslimbed by 4 percent per year above inflation, with more money poured into education, health care, and children'srograms. Still, on balance, his performance is better than that of most governors.
owa
erry E. Branstad, Republican Legislature: Dividedook Office: 1/83
Grade: C
As one of the two governors with the longest tenures (the other is Mario Cuomo), Branstad has had a tough task doattle year in and year out with a notoriously pro-big-government legislature. His major successes came in his firsterm when he cut business taxes and personal income tax rates. But the state still has one of the 10 highest top
marginal income tax rates in the country at 10 percent. Branstad hurt himself severely by not vetoing an unpopular
ales tax rate hike and base-broadening measure in 1992, the same year he gave state employees an 8 percent raiseOverall, Branstad's budget numbers are a bit better than average. He has held real spending and revenue growth tobout 2.5 percent per year for almost 10 years. His tax cuts and fiscal restraint have made Iowa one of the fastestrowing states since the mid-1980s.
Kansas
oan Finney, Democrat Legislature: Republicanook Office: 1/91
Grade: D

8/9/2019 A Fiscal Policy Report Card on America Governors: 1994, Cato Policy Analysis
http://slidepdf.com/reader/full/a-fiscal-policy-report-card-on-america-governors-1994-cato-policy-analysis 15/23
8/9/2019 A Fiscal Policy Report Card on America Governors: 1994, Cato Policy Analysis
http://slidepdf.com/reader/full/a-fiscal-policy-report-card-on-america-governors-1994-cato-policy-analysis 16/23
Grade: C
chaefer may have made the biggest mistake of his 40 years in public office two years ago when he rammed a majax increase through the state legislature. That tax hike included higher income tax rates on the rich, a gas tax incren expanded sales tax, and a doubling of the cigarette tax. The tax bill propelled Maryland, which already collecte500 more per resident in tax revenues than the average state, even higher into the ranks of America's most taxingtates. As so often happens, the tax rate increases have failed to translate into increases in tax revenue. Hence, chroudget deficits remain. Schaefer has failed to support even modest restraint in spending. The Maryland budget grewn annual pace of almost 4 percent above inflation between 1987 and 1992--notwithstanding Schaefer's assurances
elt-tightening in Annapolis. Overall, Schaefer's fiscal performance has been less than inspiring.
MassachusettsWilliam F. Weld, Republican Legislature: Democratic
ook Office: 1/91Grade: B
Weld has demolished the myth that it is politically impossible to cut government spending. Except for a brief sophomore slump," Weld has a stunningly successful fiscal record in Massachusetts. His supply-side fiscalonservatism has reversed a decade of uninterrupted budget growth during the "Massachusetts Miracle" years underedecessor Michael Dukakis. Inheriting a $1-billion deficit, Weld balanced the budget in his first year by slashingtate expenditures by $600 million--a 3 percent real cut--by shunning all new taxes, and by repealing a sales tax onervices that had been enacted in December 1990. Since then the budget has grown by a modest 2 percent per year,
with most of that growth occurring in his slump year, fiscal 1993, when he increased funding for "investment" andnvi- ronmental programs. In addition to balancing what had been perceived as a hopelessly imbalanced budget, Was had several other noteworthy triumphs. He has cut taxes five times, slowed the growth of Medicaid and welfarepending, proposed eliminating the state tax on long-term capital gains, and engineered a triple up-grade in the statond rating in just three years. His latest bombshell was a pronouncement that he will seek a $300-million income ut to offset the impact of President Clinton's federal income tax increase. Weld is on the way to creating a genuin
Massachusetts miracle.
Michiganohn Engler, Republican Legislature: Divided
ook Office: 1/91Grade: B
ngler has helped to catapult Michigan, once derided as the rust-belt state, into one of the fastest growing states in nion. Last year Michigan's unemployment rate fell below the national average for the first time in 25 years. Englerrowth-oriented fiscal policies are in part responsible for that impressive economic performance. Engler has held stpending growth to just above the inflation rate in his first three years. He has cut the state workforce by 4,000
workers; eliminated an entire department; and cut spending on the arts, commerce, and labor in half. Engler gainedational attention for eliminating the state's general assistance welfare program for some 80,000 employable adults-hus disproving the mythical iron rule of politics that entitlements cannot be eliminated. The only blemish on his recas been an increase in school funding over the past three years. But Engler's latest crusade is to sharply cut sky-hi
roperty taxes that fund the schools, while demanding greater parental choice in education. Engler's unique blend oolicy innovation and fiscal conservatism has been positive for Michigan.
MinnesotaArne H. Carlson, Republican Legislature: Democratic
ook Office: 1/91Grade: D
Carlson came to the governor's mansion with a reputation as a moderate Republican, not as a dedicated budget cutto far, he has lived up to that reputation. In his first three years, spending in real terms has grown at a respectable raf less than 3 percent per year. Carlson deserves credit for holding the Democratic legislature to that moderate
8/9/2019 A Fiscal Policy Report Card on America Governors: 1994, Cato Policy Analysis
http://slidepdf.com/reader/full/a-fiscal-policy-report-card-on-america-governors-1994-cato-policy-analysis 17/23
pending level. But he has created several new spending programs, including a universal health care program calleHealthRight, which will cost state taxpayers at least $250 million a year. On the tax side, he has fared worse. Thencome tax and sales tax have been raised, and tax revenues climbed by $650 per family in his first year alone.
Overall, Carlson's fiscal performance has been slightly below average in most categories.
MississippiKirk Fordice, Republican Legislature: Democratic
ook Office: 1/92Grade: A
ordice is Mississippi's first Republican governor in 115 years. A self-made businessman, he has pursued annapologetic pro-business, pro-jobs agenda. Fordice has stuck to his guns and refused to consider any tax hikes;nstead, he trimmed the budget by nearly 5 percent during his first two years in office. In 1992 the Democrat-ontrolled legislature passed a 1 cent increase in the state sales tax--overriding Fordice's veto. Because of Fordice'sghtfistedness, the budget is now running a surplus that Fordice wants to erase by cutting income taxes. His policieave been a spectacular economic success. In 1993 U.S. News & World Report ranked Mississippi first in economierformance coming out of the recession.
MissouriMel Carnahan, Democrat Legislature: Democratic
ook Office: 1/93Grade: D
Democratic lieutenant governor Mel Carnahan soundly defeated state attorney general William Webster for theovernorship in 1992. Carnahan campaigned on the promise of a tax increase for education--to reduce class size,xpand merit pay, and reorganize higher education--and to establish a Missouri Research Alliance to assist businesrowth. Unfortunately for Missouri taxpayers and businesses, he has kept his promises. His first-year budget includ5.3 percent real increase in spending. The legislature added yet another $119 million to that figure, which means t
pending will rise by 7 or 8 percent. Furthermore, the corporate income tax rate was raised from 5 to 6.25 percent, he federal income tax deduction from both the state personal income tax and the state corporate income tax washarply reduced.
MontanaMarc Racicot, Republican Legislature: Divided
ook Office: 1/93Grade: D
Racicot has one of the most pro-government, pro-tax philosophies of any governor of either party. His first initiativs governor was to push for a new 4 percent sales tax (Montana does not have one)--an idea the voters soundlyefeated when it appeared on the ballot last year. The fallback measure approved by the legislature and Racicot wasncome tax increase. An avalanche of public opposition to the increased income tax has forced a voter referendum ohe issue in November 1994. In the meantime, Racicot has doubled the state payroll tax, raised the state gas tax 7 cgallon, and increased dozens of fees and assessments. Racicot's latest brainstorm is a government-run universalealth care program for Montana. In his first year in office, Racicot came up with a seemingly endless stream of badeas for Montana.
Nebraska. Benjamin Nelson,
Democrat Legislature: Nonpartisanook Office: 1/91
Grade: D
Nelson is the third straight Nebraska Democrat to win the governorship by ousting a pro-tax Republican. Heelentlessly attacked incumbent Kay Orr for breaking a no-new- taxes pledge. But once he gained office, Nelson raaxes several times himself. Both the top marginal corporate and personal income tax rates have been raised, althou
8/9/2019 A Fiscal Policy Report Card on America Governors: 1994, Cato Policy Analysis
http://slidepdf.com/reader/full/a-fiscal-policy-report-card-on-america-governors-1994-cato-policy-analysis 18/23
Nebraskans did see a small reduction in the gasoline tax. In Nelson's first year in office, real state expenditures grewy nearly 8 percent, but since then spending has been held to roughly the inflation rate. Nebraska currently ranks 40mong the states in tax burden and spending, but in recent years it has been moving toward the middle. That is notoing to bring jobs and families back to a state that has been losing both.
Nevadaob Miller, Democrat Legislature: Dividedook Office: 1/89
Grade: D
he Nevada economy has been surging over the past several years--thanks in no small part to the exodus of businesnd jobs from high-tax neighbor California and the fact that Nevada has no personal or corporate income tax.
Unfortunately, Nevada's budget has surged forward even faster than the economy and population growth. In Miller'rst full three years in office (1989-92), the state budget grew by more than 10 percent per year above inflation. Repending per family grew by $1,200 in those years. To help finance that enormous spending build-up, Miller raised ales tax, the gas tax, and the cigarette tax. After a miserable start, Miller's budget performance is slowly improvingince 1992 spending has fallen below the inflation rate and Miller is insisting on no new taxes. If Nevada's spectacuconomic boom is to continue, the state needs to follow Miller's new policies.
New Hampshiretephen Merrill, Republican Legislature: Republicanook Office: 1/93
Grade: A
New Hampshire has the lowest per capita state tax burden, no personal income tax, and no state sales tax. Residenwant it to stay that way. Since 1972 every governor and state legislator has taken a pledge not to vote for a sales tan income tax. In 1992 Merrill trounced his Democratic opponent Deborah Arnesen, who refused to take "the pled
During his first full year in office, Merrill held the line on taxes and made real cuts in state spending. Cutting the sif government in a state that already has the lowest tax burden in America is an impressive accomplishment indeed
Merrill's policies have helped New Hampshire crawl out of the recession in stronger economic shape than most of eighbors. Jobs are finally reappearing, and the half-decade-long budget crisis is finally over.
New Jerseyames Florio, Democrat Legislature: Republicanook Office: 1/90
Grade: F
lorio's just-completed four-year term as governor was a period of severe economic decline and fiscal deteriorationNew Jersey. After winning a landslide election by pledging no new taxes, Florio immediately rammed through theegislature a "soak the rich" $2.8-billion tax hike to provide a massive infusion of funds to the inner-city schools. Tconomy immediately sank deeper into recession, business bankruptcies increased by 150 percent, 300,000 jobs weost, and the unemployment rate rocketed to 9.1 percent-- the highest in the nation. Florio contended that his tax hik
was an unavoidable dose of bitter medicine to balance the budget. The truth is that Florio was among the three bigg
pending governors in the nation. In 1991 the budget in nominal terms grew by 8.4 percent; that increase was followy a 1992 budget expansion of 26.1 percent (the third largest in the nation). In his first two years the budget grew bmore than $3,000 per family. Florio's woeful fiscal record would be worse, except that after the Democrats were swrom the legislature in the 1991 midterm elections, the newly elected legislators enacted spending and tax cuts overlorio vetoes. From start to finish, Florio's new-age progressive populism was an enormous bust for New Jersey.
New Mexicoruce King, Democrat Legislature: Democraticook Office: 1/91
Grade: D
8/9/2019 A Fiscal Policy Report Card on America Governors: 1994, Cato Policy Analysis
http://slidepdf.com/reader/full/a-fiscal-policy-report-card-on-america-governors-1994-cato-policy-analysis 19/23
New Mexico ranks among the top five states in virtually all spending and tax categories. It spends about $1,500 moer family than the average state; it has roughly twice as many state employees as a share of the population; and itsurden is the highest among the 48 contiguous states. Under King the disparities have widened. From 1980 to 1992
New Mexico budget grew by 67 percent, and the welfare budget alone rose 150 percent above inflation--King wasovernor during roughly half of those years. (This is King's third stint in the governor's mansion; New Mexico doesllow governors to serve consecutive terms.) His performance in recent years has been especially poor. In 1992 Kinllowed spending to climb by more than $535 per family. Last year he raised the gas tax by 6 cents per gallon, a 38ercent increase. As Forbes recently summarized the fiscal situation in New Mexico under Governor King, "Until toliticians understand that states don't attract capital with high taxes and red tape, you'd want to think twice before
tarting or expanding a business here."
New York Mario M. Cuomo, Democrat Legislature: Divided
ook Office: 1/83Grade: C
n many ways Cuomo has governed as an old-school north-eastern liberal Democrat. He seemingly never met apending program he didn't like. During his three terms Cuomo has approved enormous budget increases for educatransportation, social services, AIDs, the homeless, and children's programs. In 10 years Cuomo took the New Yorkudget from less than $50 billion to $75 billion--a 55 percent real increase. New York spends $6,000 more per fam
oday than it did when Cuomo was first inaugurated in 1983. Thanks to spending excesses, New York is now saddlwith what the New York Times calls "a rotten credit rating, the worst among the 50 states." But the complicatingeature of Cuomo's record is that his tax policies have been supply side. He chopped the top tax rate in the state fro4 percent to 8 percent--a policy that generated strong economic growth for New York in the 1980s and thus produrevenue windfall, which Cuomo eagerly spent. Cuomo has also held the line on the sales and gas tax for 10 yearse prepares for his fourth election bid, he is now talking about cuts in business taxes to spur an economy that has loome half million jobs in the 1990s. The big question is whether New York would be getting Cuomo the tax cutter
Cuomo the free-wheeling big spender.
North Carolinaames B. Hunt, Jr., Democrat Legislature: Democraticook Office: 1/93
Grade: F
Hunt's third term as governor (he served from 1976 to 1984) has been anything but a charm for North Carolina. Heame to office promoting big-government ideas--including school-based apprenticeship programs, increased spendn day care, and more money for the schools--and so far he has been successful at implementing them. His first-yeudget contained a recommended 8.7 percent real increase in spending, far above the increase that was legislated in
most states for 1994. Hunt's pro-spending philosophy threatens to disrupt a decade of strong economic performancNorth Carolina.
North Dakotadward T. Schafer, Republican Legislature: Divided
ook Office: 1/93Grade: D
While sending Schafer to the governor's mansion, North Dakotans also defeated a proposed one-half cent sales taxike. Schafer did not get the voters' anti-tax message. In his first year North Dakota raised its income tax (because tate piggybacks on the federal rates, which were raised by Bill Clinton), the gas tax, the state's tax on charitableaming tickets, and the cigarette tax (from 29 cents a pack to 44 cents). To his credit, however, Schafer has pushedhrough significant cuts in state spending. In 1994 state general fund outlays will grow more slowly than inflation.
OhioGeorge V. Voinovich, Legislature: Divided

8/9/2019 A Fiscal Policy Report Card on America Governors: 1994, Cato Policy Analysis
http://slidepdf.com/reader/full/a-fiscal-policy-report-card-on-america-governors-1994-cato-policy-analysis 20/23
Republican Took Office: 1/91Grade: D
Voinovich campaigned for governor as a fiscal conservative. Unfortunately, he has not governed that way. In hisecond year in office he pushed through a $1-billion tax hike. That package added a new top bracket for the personncome tax; expanded the sales tax base; increased taxes on gas, cigarettes, and alcoholic beverages; and imposedeveral new taxes, including a bed tax on nursing homes, a tax on soft drinks, and several environmental taxes. Des
Voinovich's encouraging talk about streamlining government, state expenditures rose by nearly $2 billion--$580 peramily--in his first year. Since then spending and revenue growth have slowed, but both are still climbing ahead of
nflation rate. During Voinovich's tenure, Ohio has lost 35,000 manufacturing jobs, and it now ranks 36th inmployment growth. On the positive side of the ledger, Voinovich has overhauled the state's costly workmen'sompensation system and has recently launched a new program of corporate tax credits for new investment.
Nevertheless, overall, Voinovich's fiscal performance has been a disappointment.
OklahomaDavid Walters, Democrat Legislature: Democratic
ook Office: 1/91Grade: C
Walters's term as governor have been dominated by continuous allegations that he ran afoul of campaign finance lauring the 1990 governor's race. He recently pleaded guilty to a misdemeanor. Amidst all the turmoil, Walters's fiscecord has been overlooked. It has been a mixed bag. In 1992 he increased spending by 9 percent, primarily to pum
more money into the schools. But he has held the line on taxes--thanks in part to passage of a recent ballot initiativhat requires a three-fourths vote of the legislature or a vote of the people to raise taxes. In 1993 he called for and wn across-the-board cut in spending on the entire budget, except education. The economy is on the rebound with a urge in new business incorporations and a below-average unemployment rate, despite the depression in the oilndustry. At least on fiscal and economic issues, Walters has not been the villain that the press has made him out to
Oregonarbara Roberts, Democrat Legislature: Dividedook Office: 1/91
Grade: D
Roberts describes herself as an old-school liberal Democrat. But even in liberal-leaning Oregon, she may be too fahe left for the average citizen. She has spent her first three years barnstorming the state unsuccessfully for one majew tax after another. She made it a personal crusade to overturn the state's 1990, 30 percent, property tax reductioneferendum measure. The voters rejected that effort. She lobbied for instituting a state sales tax, but the measure waefeated on the ballot by a three-to-one margin. Meanwhile, the Oregon budget has exploded. Roberts's cries that ttate was being depleted of revenues were greeted with universal scorn after her first-year budget saw state revenueurge by a nation-leading 22 percent--or $1,700 per family. In spite of her claims that spending had been tightlyestrained by tax caps, she somehow found the money to raise spending by $500 per family in 1992. Also in 1992
Roberts narrowly eluded a recall petition, inspired in no small part by her abysmal fiscal record.
ennsylvaniaRobert P. Casey, Democrat Legislature: Democratic
ook Office: 1/87Grade: D
oth taxes and government spending have been steadily on the rise during Casey's tenure. During his first five yearhe state budget roughly doubled. Adjusting for inflation, that amounts to more than $3,000 per family. In 1991 Casoined the tax hike bandwagon and won passage of a $2-billion personal and corporate income tax increase, whichaised the rates and added a surtax to each. (The surtax on personal income expired as scheduled.) The state's econtill has not recovered. Pennsylvania has lost nearly 100,000 manufacturing jobs since 1989; its unemployment ratesen by almost 3 percentage points; and it has been one of the slowest states to come out of the 1991-92 recession
8/9/2019 A Fiscal Policy Report Card on America Governors: 1994, Cato Policy Analysis
http://slidepdf.com/reader/full/a-fiscal-policy-report-card-on-america-governors-1994-cato-policy-analysis 21/23
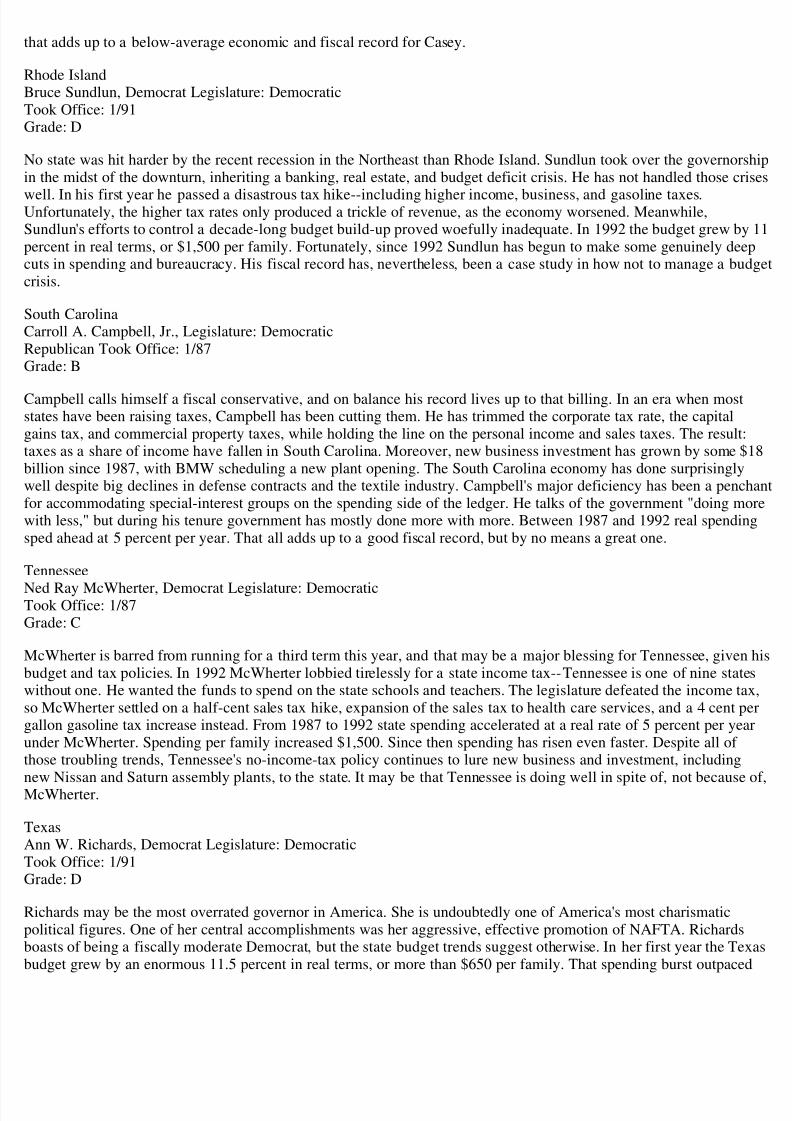
hat adds up to a below-average economic and fiscal record for Casey.
Rhode Islandruce Sundlun, Democrat Legislature: Democraticook Office: 1/91
Grade: D
No state was hit harder by the recent recession in the Northeast than Rhode Island. Sundlun took over the governorn the midst of the downturn, inheriting a banking, real estate, and budget deficit crisis. He has not handled those cr
well. In his first year he passed a disastrous tax hike--including higher income, business, and gasoline taxes.Unfortunately, the higher tax rates only produced a trickle of revenue, as the economy worsened. Meanwhile,
undlun's efforts to control a decade-long budget build-up proved woefully inadequate. In 1992 the budget grew byercent in real terms, or $1,500 per family. Fortunately, since 1992 Sundlun has begun to make some genuinely deeuts in spending and bureaucracy. His fiscal record has, nevertheless, been a case study in how not to manage a burisis.
outh CarolinaCarroll A. Campbell, Jr., Legislature: DemocraticRepublican Took Office: 1/87Grade: B
Campbell calls himself a fiscal conservative, and on balance his record lives up to that billing. In an era when mosttates have been raising taxes, Campbell has been cutting them. He has trimmed the corporate tax rate, the capitalains tax, and commercial property taxes, while holding the line on the personal income and sales taxes. The resultaxes as a share of income have fallen in South Carolina. Moreover, new business investment has grown by some $illion since 1987, with BMW scheduling a new plant opening. The South Carolina economy has done surprisingly
well despite big declines in defense contracts and the textile industry. Campbell's major deficiency has been a pencor accommodating special-interest groups on the spending side of the ledger. He talks of the government "doing m
with less," but during his tenure government has mostly done more with more. Between 1987 and 1992 real spendinped ahead at 5 percent per year. That all adds up to a good fiscal record, but by no means a great one.
ennessee
Ned Ray McWherter, Democrat Legislature: Democraticook Office: 1/87
Grade: C
McWherter is barred from running for a third term this year, and that may be a major blessing for Tennessee, givenudget and tax policies. In 1992 McWherter lobbied tirelessly for a state income tax--Tennessee is one of nine stat
without one. He wanted the funds to spend on the state schools and teachers. The legislature defeated the income tao McWherter settled on a half-cent sales tax hike, expansion of the sales tax to health care services, and a 4 cent pallon gasoline tax increase instead. From 1987 to 1992 state spending accelerated at a real rate of 5 percent per yender McWherter. Spending per family increased $1,500. Since then spending has risen even faster. Despite all of hose troubling trends, Tennessee's no-income-tax policy continues to lure new business and investment, includingew Nissan and Saturn assembly plants, to the state. It may be that Tennessee is doing well in spite of, not because
McWherter.
exasAnn W. Richards, Democrat Legislature: Democratic
ook Office: 1/91Grade: D
Richards may be the most overrated governor in America. She is undoubtedly one of America's most charismaticolitical figures. One of her central accomplishments was her aggressive, effective promotion of NAFTA. Richardsoasts of being a fiscally moderate Democrat, but the state budget trends suggest otherwise. In her first year the Teudget grew by an enormous 11.5 percent in real terms, or more than $650 per family. That spending burst outpace
8/9/2019 A Fiscal Policy Report Card on America Governors: 1994, Cato Policy Analysis
http://slidepdf.com/reader/full/a-fiscal-policy-report-card-on-america-governors-1994-cato-policy-analysis 22/23
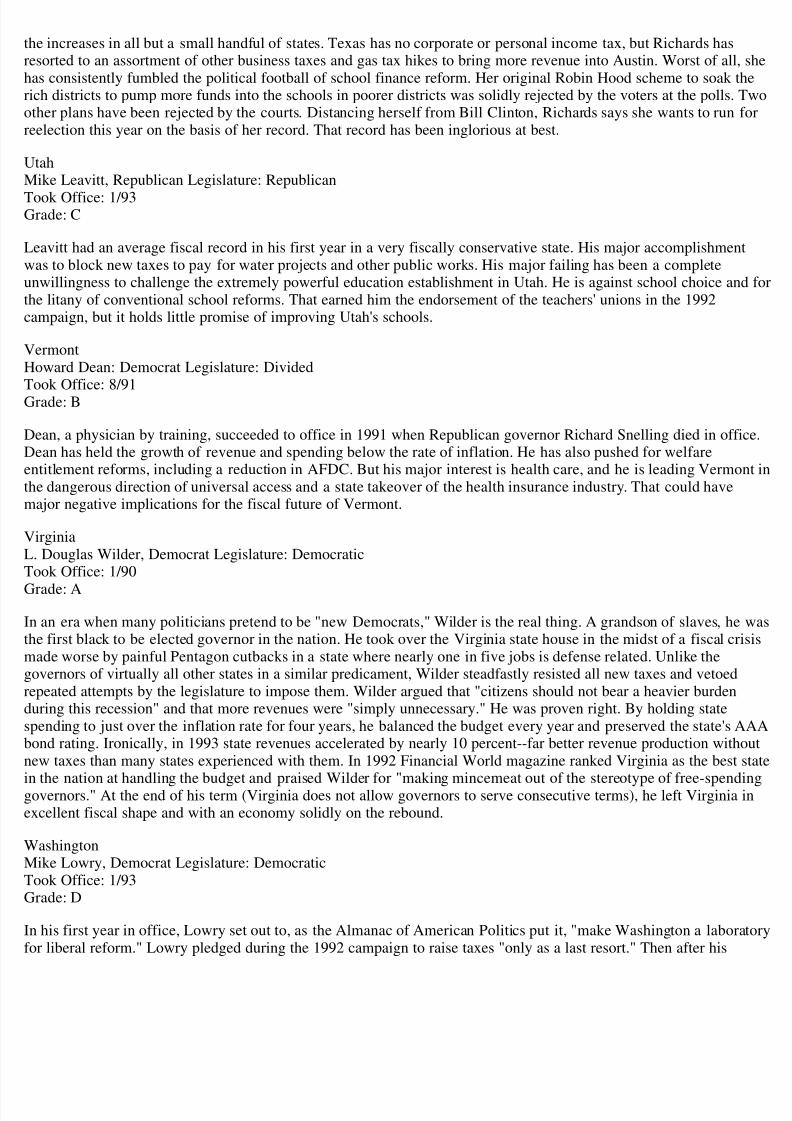
he increases in all but a small handful of states. Texas has no corporate or personal income tax, but Richards hasesorted to an assortment of other business taxes and gas tax hikes to bring more revenue into Austin. Worst of all, as consistently fumbled the political football of school finance reform. Her original Robin Hood scheme to soak thch districts to pump more funds into the schools in poorer districts was solidly rejected by the voters at the polls. Tther plans have been rejected by the courts. Distancing herself from Bill Clinton, Richards says she wants to run feelection this year on the basis of her record. That record has been inglorious at best.
UtahMike Leavitt, Republican Legislature: Republican
ook Office: 1/93Grade: C
eavitt had an average fiscal record in his first year in a very fiscally conservative state. His major accomplishmentwas to block new taxes to pay for water projects and other public works. His major failing has been a completenwillingness to challenge the extremely powerful education establishment in Utah. He is against school choice andhe litany of conventional school reforms. That earned him the endorsement of the teachers' unions in the 1992ampaign, but it holds little promise of improving Utah's schools.
VermontHoward Dean: Democrat Legislature: Divided
ook Office: 8/91Grade: B
Dean, a physician by training, succeeded to office in 1991 when Republican governor Richard Snelling died in officDean has held the growth of revenue and spending below the rate of inflation. He has also pushed for welfarentitlement reforms, including a reduction in AFDC. But his major interest is health care, and he is leading Vermohe dangerous direction of universal access and a state takeover of the health insurance industry. That could have
major negative implications for the fiscal future of Vermont.
Virginia. Douglas Wilder, Democrat Legislature: Democraticook Office: 1/90
Grade: A
n an era when many politicians pretend to be "new Democrats," Wilder is the real thing. A grandson of slaves, he he first black to be elected governor in the nation. He took over the Virginia state house in the midst of a fiscal cri
made worse by painful Pentagon cutbacks in a state where nearly one in five jobs is defense related. Unlike theovernors of virtually all other states in a similar predicament, Wilder steadfastly resisted all new taxes and vetoedepeated attempts by the legislature to impose them. Wilder argued that "citizens should not bear a heavier burdenuring this recession" and that more revenues were "simply unnecessary." He was proven right. By holding statepending to just over the inflation rate for four years, he balanced the budget every year and preserved the state's Aond rating. Ironically, in 1993 state revenues accelerated by nearly 10 percent--far better revenue production withoew taxes than many states experienced with them. In 1992 Financial World magazine ranked Virginia as the best s
n the nation at handling the budget and praised Wilder for "making mincemeat out of the stereotype of free-spendiovernors." At the end of his term (Virginia does not allow governors to serve consecutive terms), he left Virginia xcellent fiscal shape and with an economy solidly on the rebound.
WashingtonMike Lowry, Democrat Legislature: Democratic
ook Office: 1/93Grade: D
n his first year in office, Lowry set out to, as the Almanac of American Politics put it, "make Washington a laboraor liberal reform." Lowry pledged during the 1992 campaign to raise taxes "only as a last resort." Then after his
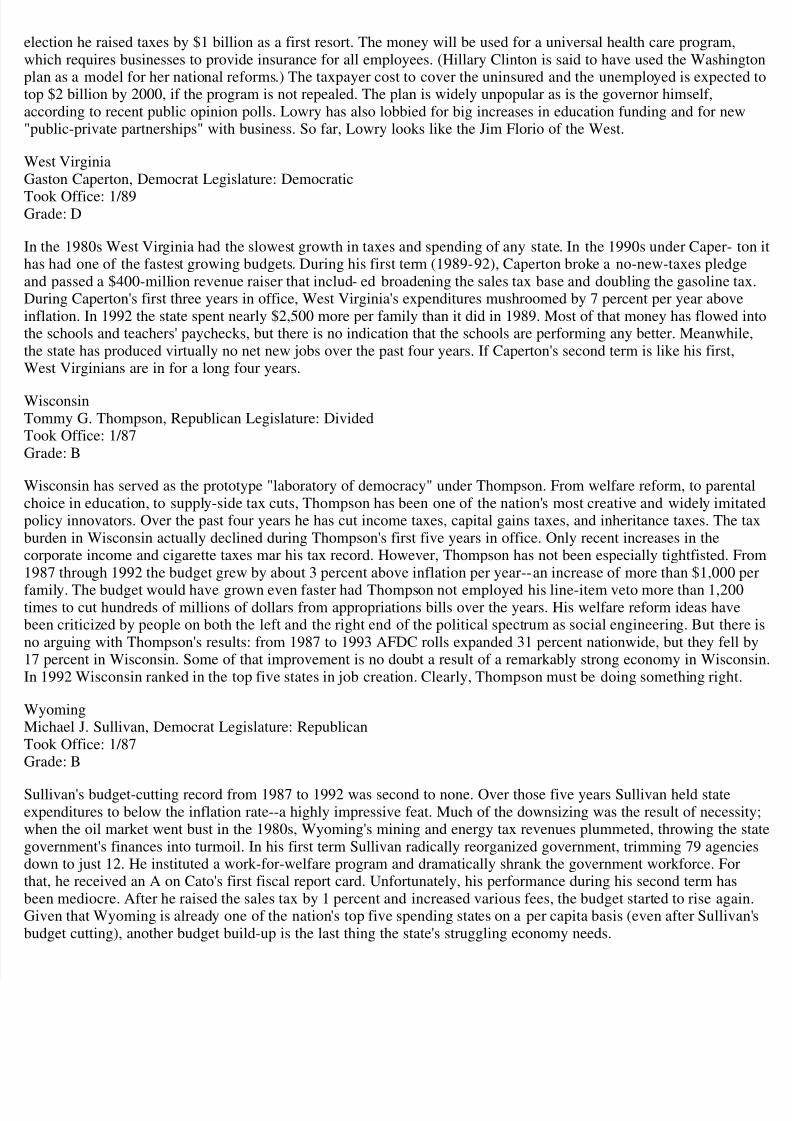
8/9/2019 A Fiscal Policy Report Card on America Governors: 1994, Cato Policy Analysis
http://slidepdf.com/reader/full/a-fiscal-policy-report-card-on-america-governors-1994-cato-policy-analysis 23/23
lection he raised taxes by $1 billion as a first resort. The money will be used for a universal health care program,which requires businesses to provide insurance for all employees. (Hillary Clinton is said to have used the Washing
lan as a model for her national reforms.) The taxpayer cost to cover the uninsured and the unemployed is expectedop $2 billion by 2000, if the program is not repealed. The plan is widely unpopular as is the governor himself,ccording to recent public opinion polls. Lowry has also lobbied for big increases in education funding and for newpublic-private partnerships" with business. So far, Lowry looks like the Jim Florio of the West.
West VirginiaGaston Caperton, Democrat Legislature: Democratic
ook Office: 1/89Grade: D
n the 1980s West Virginia had the slowest growth in taxes and spending of any state. In the 1990s under Caper- toas had one of the fastest growing budgets. During his first term (1989-92), Caperton broke a no-new-taxes pledgend passed a $400-million revenue raiser that includ- ed broadening the sales tax base and doubling the gasoline ta
During Caperton's first three years in office, West Virginia's expenditures mushroomed by 7 percent per year abovenflation. In 1992 the state spent nearly $2,500 more per family than it did in 1989. Most of that money has flowed he schools and teachers' paychecks, but there is no indication that the schools are performing any better. Meanwhilhe state has produced virtually no net new jobs over the past four years. If Caperton's second term is like his first,
West Virginians are in for a long four years.
Wisconsinommy G. Thompson, Republican Legislature: Dividedook Office: 1/87
Grade: B
Wisconsin has served as the prototype "laboratory of democracy" under Thompson. From welfare reform, to parenthoice in education, to supply-side tax cuts, Thompson has been one of the nation's most creative and widely imitaolicy innovators. Over the past four years he has cut income taxes, capital gains taxes, and inheritance taxes. The turden in Wisconsin actually declined during Thompson's first five years in office. Only recent increases in theorporate income and cigarette taxes mar his tax record. However, Thompson has not been especially tightfisted. Fr987 through 1992 the budget grew by about 3 percent above inflation per year--an increase of more than $1,000 p
amily. The budget would have grown even faster had Thompson not employed his line-item veto more than 1,200mes to cut hundreds of millions of dollars from appropriations bills over the years. His welfare reform ideas haveeen criticized by people on both the left and the right end of the political spectrum as social engineering. But thero arguing with Thompson's results: from 1987 to 1993 AFDC rolls expanded 31 percent nationwide, but they fell 7 percent in Wisconsin. Some of that improvement is no doubt a result of a remarkably strong economy in Wisconn 1992 Wisconsin ranked in the top five states in job creation. Clearly, Thompson must be doing something right.
WyomingMichael J. Sullivan, Democrat Legislature: Republican
ook Office: 1/87Grade: B
ullivan's budget-cutting record from 1987 to 1992 was second to none. Over those five years Sullivan held statexpenditures to below the inflation rate--a highly impressive feat. Much of the downsizing was the result of necessi
when the oil market went bust in the 1980s, Wyoming's mining and energy tax revenues plummeted, throwing the sovernment's finances into turmoil. In his first term Sullivan radically reorganized government, trimming 79 agenciown to just 12. He instituted a work-for-welfare program and dramatically shrank the government workforce. Forhat, he received an A on Cato's first fiscal report card. Unfortunately, his performance during his second term haseen mediocre. After he raised the sales tax by 1 percent and increased various fees, the budget started to rise agai
Given that Wyoming is already one of the nation's top five spending states on a per capita basis (even after Sullivaudget cutting), another budget build-up is the last thing the state's struggling economy needs.
Related Documents