Teachers' Voice Use in Teaching Environments: A Field Study Using Ambulatory Phonation Monitor. Lyberg Åhlander, Viveka; Pelegrín García, David; Whitling, Susanna; Rydell, Roland; Löfqvist, Anders Published in: Journal of Voice DOI: 10.1016/j.jvoice.2014.03.006 2014 Link to publication Citation for published version (APA): Lyberg Åhlander, V., Pelegrín García, D., Whitling, S., Rydell, R., & Löfqvist, A. (2014). Teachers' Voice Use in Teaching Environments: A Field Study Using Ambulatory Phonation Monitor. Journal of Voice, 28(6), 841.e5. https://doi.org/10.1016/j.jvoice.2014.03.006 Total number of authors: 5 General rights Unless other specific re-use rights are stated the following general rights apply: Copyright and moral rights for the publications made accessible in the public portal are retained by the authors and/or other copyright owners and it is a condition of accessing publications that users recognise and abide by the legal requirements associated with these rights. • Users may download and print one copy of any publication from the public portal for the purpose of private study or research. • You may not further distribute the material or use it for any profit-making activity or commercial gain • You may freely distribute the URL identifying the publication in the public portal Read more about Creative commons licenses: https://creativecommons.org/licenses/ Take down policy If you believe that this document breaches copyright please contact us providing details, and we will remove access to the work immediately and investigate your claim.

Welcome message from author
This document is posted to help you gain knowledge. Please leave a comment to let me know what you think about it! Share it to your friends and learn new things together.
Transcript
LUND UNIVERSITY
PO Box 117221 00 Lund+46 46-222 00 00
Teachers' Voice Use in Teaching Environments: A Field Study Using AmbulatoryPhonation Monitor.
Lyberg Åhlander, Viveka; Pelegrín García, David; Whitling, Susanna; Rydell, Roland; Löfqvist,AndersPublished in:Journal of Voice
DOI:10.1016/j.jvoice.2014.03.006
2014
Link to publication
Citation for published version (APA):Lyberg Åhlander, V., Pelegrín García, D., Whitling, S., Rydell, R., & Löfqvist, A. (2014). Teachers' Voice Use inTeaching Environments: A Field Study Using Ambulatory Phonation Monitor. Journal of Voice, 28(6), 841.e5.https://doi.org/10.1016/j.jvoice.2014.03.006
Total number of authors:5
General rightsUnless other specific re-use rights are stated the following general rights apply:Copyright and moral rights for the publications made accessible in the public portal are retained by the authorsand/or other copyright owners and it is a condition of accessing publications that users recognise and abide by thelegal requirements associated with these rights. • Users may download and print one copy of any publication from the public portal for the purpose of private studyor research. • You may not further distribute the material or use it for any profit-making activity or commercial gain • You may freely distribute the URL identifying the publication in the public portal
Read more about Creative commons licenses: https://creativecommons.org/licenses/Take down policyIf you believe that this document breaches copyright please contact us providing details, and we will removeaccess to the work immediately and investigate your claim.
Teachers’ voice use in teaching environments:
A field study using Ambulatory Phonation Monitor
Viveka Lyberg Åhlander
Dept. Logopedics, Phoniatrics and Audiology, Clinical Sciences, Lund, Lund University,
Lund, Sweden
David Pelegrín García*
Acoustic Technology, Dept. Electrical Engineering, Technical University of Denmark,
Lyngby, Denmark
Susanna Whitling, Roland Rydell**, and Anders Löfqvist
Dept. Logopedics, Phoniatrics and Audiology, Clinical Sciences, Lund, Lund University,
Lund, Sweden
*also Laboratory of Acoustics and Thermal Physics, K.U. Leuven, Belgium
**also ENT Department, Lund University Hospital, Lund, Sweden
Address editorial correspondence to: Viveka Lyberg Åhlander Dept. Logopedics, Phoniatrics and Audiology University Hospital SE-221 85 Lund Sweden E-mail: [email protected] Phone: +46 46 177830, Fax: + 46 46 171732
Abstract
Objectives. This case-control designed field-study examines the vocal behavior in teachers
with self-estimated voice problems and their age-, and school-matched voice-healthy
colleagues. It was hypothesized that teachers with and teachers without voice problems use
their voices differently regarding fundamental frequency, sound pressure level and in relation
to the background noise.
Methods. Teachers with self-estimated voice-problems (n=14, 2M/12F) were age and gender
matched to voice-healthy school-colleagues (n=14, 2M/12F). The subjects, recruited from an
earlier study, had been examined in laryngeal, vocal, hearing and psychosocial aspects. The
fundamental frequency, Sound Pressure Level, and phonation-time were recorded with an
Ambulatory Phonation Monitor during one representative workday. The teachers reported
their activities in a structured diary. The sound pressure level (including teacher and students’
activity and ambient noise) was recorded with a sound level meter; the room temperature and
air quality were measured simultaneously. The acoustic properties of the empty classrooms
were measured.
Results. Teachers with voice problems behaved vocally different from their voice healthy
peers, in particular during teaching sessions. The phonation time was significantly higher in
the group with voice problems and the number of vibratory cycles differed between the
female teachers. The F0 pattern, related to the vocal sound pressure level and room acoustics
differed between the groups.
Conclusion. The results suggest a different vocal behavior in subjects with subjective voice
problems and a higher vocal load with fewer possibilities for vocal recovery.
1
INTRODUCTION
This paper examines teachers’ voice use in their work-environment, exploring the vocal
behavior in a group of teachers with self-assessed voice problems (non-patients), comparing
them to a group of teachers with self-assessed voice health. This is a follow up study to
Lyberg Åhlander et al 2011 and Lyberg Åhlander et al 2012 1, 2.
One of the most important aspects of teaching is for the teacher to make her- or himself
heard. The demands on a teacher’s voice are varied. The voice is needed to communicate,
instruct and clarify. The teaching tasks at elementary and middle school levels can vary from
soft, facilitating talk during morning assembly, to singing, reading loud, lecturing, and
teaching in the sports hall. It is thus important for a teacher’s voice to be flexible. However,
with high levels of BNL and unfavorable room acoustics, this can be an effortful task that
may be detrimental to the voice. Recently published data suggest that very few teachers in
Swedish schools have undergone any voice training and that voice amplification is rare, even
in the schools’ sports halls 1. As pointed out by many authors, teachers are at risk of
developing voice problems and there is a high prevalence of voice disorders in teaching staff
also when compared to other occupations with vocal demands 3-6. Teachers’ vocal load is also
indicated by self-reported sick-leave due to voice problems. In a group of teachers who assess
themselves as suffering from voice problems, 35% compared to 9% in a group of voice
healthy teachers reported recurring sick-leave due to voice problems 1. According to Sapir et
al., 1993, none in a group with no occupational vocal demands reported sick-leave for this
reason 7.
Recent results from comparisons between a group of 31 teachers with self-assessed
voice problems and their 31 voice-healthy colleagues indicated that there were no differences
between the groups in vocal, laryngeal, hearing or psychosocial aspects. The differences were
found in the time needed to recover from voice problems, in the occurrence of voice problems
2
without a concurrent upper air-way infection, and in the subjective assessment of voice
symptoms 2. This leads us to hypothesize that the differences between teachers with and
without voice problems might be found in their daily voice use, possibly related to the
teaching environment. The differences in teaching environment, other than classroom
acoustics, can be in the activity noise produced and in the ability of the teacher to manage and
vocally cope with classroom noise. A teacher with voice problems might manage classroom
noise less well than a voice-healthy teacher.
During the last decades, a number of research groups have tried to understand teachers’
voice use, based on the hypothesis that this behavior might differ from what can be seen in
laboratory or clinical settings. e.g. 8-13. Parameters that have been studied are fundamental
frequency (F0), sound pressure level (SPL), and phonation (or speaking) time.
Södersten et al 12 studied the vocal behavior of subjects at their work place and concluded that
levels of F0 and SPL differed from the levels measured in quiet environment. Hunter and
Titze 14 also studied nonoccupational time and found that the SPL and phonation time of the
occupational voice differed from the measurements of the nonoccupational voice. Changes in
fundamental frequency during a workday have been identified as a sign of voice load.
Laukkanen et al 15 described the rise of F0 as a result of an increase in muscular activity, most
likely an adaptation to vocal loading during a day at work. In addition, they described that
the voice changes during vocal loading include an increase of the SPL and a decrease of
jitter and shimmer.. Also Jónsdóttir et al 16 suggests that an F0 increase is a healthy reaction
to voice load that promotes effective voice function. However, there seems to be a deviant
pattern of the increase of F0 in individuals with voice problems. Rantala et al 10 studied
teachers’ vocal behavior during a workday, and found a tendency for teachers with many
voice complaints to show a smaller increase of their F0 level than their colleagues with fewer
3
complaints, and Jonsdottír et al 16 found a smaller F0 and SPL increase in teachers with voice
complaints when they did not use voice amplification compared to when they did.
The teacher does not act alone in the classroom. Results from an earlier study showed
that 92% of the teachers found the activity noise from the students to be disturbing1. Thus, it
is important to consider the effect of the activity noise on the teacher’s voice. The Lombard
effect 17 describes the influence of surrounding noise on the voice. The speaker automatically
raises the SPL and changes the spectral contents of the voice signal as the noise level
increases. The BNL in classrooms is usually high, also during instruction, e.g 18-20. There are a
number of studies exploring the effects of noise on vocal behavior, most performed in a
laboratory setting: Södersten et al 21 investigated the rise of F0 and SPL due to background
noise in healthy subjects. They showed that the speaker increases the SPL and F0 and
prolongs the phonation time when exposed to noise, especially continuous noise. In that
study, female speakers also reported less success in making themselves heard and greater
effort to do so 21. Ternström et al 22 measured the ratio of energy in the frequency bands 2-6
kHz and .1-1 kHz, and found it to be less negative as a function of increasing BNL and voice
SPL. Moreover, Lindström et al 13 showed that there is a large variation in vocal behavior due
to noise exposure. Thus, it is important to study voice use outside the laboratory to further
understand the vocal behavior and detect possible individual differences in voice use and in
the management of vocal load.
Dry air is often mentioned by patients at voice clinics to affect their voices. The
dryness of air has been proven to affect vocal prerequisites in laboratory settings, e.g. 23.
However, only one field-study seems to have been made where the effects of air quality and
temperature on voice problems have been examined. Rantala et al 24 concluded that poor
ambient air quality affected the occurrence of laryngitis in teachers.
4
One of the factors often mentioned, but seldom studied in relation to the development of
voice disorders, is the influence of the room acoustics on the teacher’s voice. Pekkarinen and
Viljanen 18 concluded that many Finnish classrooms were too reverberant with a resulting
reduced intelligibility, which may cause the speaker to use more effort when speaking. Kob et
al 25 studied teachers with different voice status acting in different rooms and concluded that
teachers with voice problems were more affected by the acoustic properties of the room than
their voice healthy colleagues. Lacking a measure describing the speaker’s perception of the
room acoustics, earlier investigations have used measures that focus on the listeners’
perspective, like the reverberation time or the speech transmission index. Brunskog et al 26
and Pelegrín García 27 introduced a measure of voice support, linked to vocal intensity
variations experienced by an individual talking under different room acoustic conditions. It is
a measure based on the two properties of the impulse response defining the airborne acoustic
path between the mouth and the ears. These are the direct sound from the mouth to the ears,
and the indirect sound from the reflection at the boundaries of the room. Thus, the voice
support is the ratio between the energy of the reflected sound (Er) and the energy of the direct
sound (Ed), Equation 1.
(1)
This study is a field study with case-control design. The paper presents the results of the
measurements of the teachers’ voices exploring the vocal behavior in a group of teachers with
self-assessed voice problems and comparing them to a group of teachers with self-assessed
voice health. This paper further presents the room acoustics, background noise, and ambient
air quality in the two groups’ teaching environment. Detailed results on the link between the
voice support and the vocal behavior are presented in Pelegrin-Garcia et al 28.
METHODS
5
Subjects and schools
The subject group of 28 teachers was recruited among participants who had been
followed in two previous studies, Lyberg Åhlander et al 1, (a cross-sectional study) and
Lyberg Åhlander et al 2 (a case-control design). In Lyberg Åhlander et al 1, teachers at 23
randomly selected schools rated their voices and prevailing voice problems, together with
aspects of their teaching environment in a questionnaire. All teachers present at pre-scheduled
collegial meetings responded to the questionnaire (n=487). The grouping of teachers with and
without voice problems was based on the statements “I have problems with my voice”. The
division to the two groups was further validated by the answers to the questions on voice
symptoms from a Swedish validated version of the VHI (Voice Handicap Index-Throat) 29.
The group with self-assessed voice problems consisted of individuals most of whom without
previous contact with any clinical voice care. In Lyberg Åhlander et al, 2 31 individuals
among the teachers with self-assessed voice problems were matched to 31 voice healthy
colleagues, for gender, school and as close as possible for age. For the present study, among
the 31 pairs, 14 pairs from the schools with the highest frequency of matched pairs were asked
to participate. The pairs included 24 women and four men. The demographics of the teachers
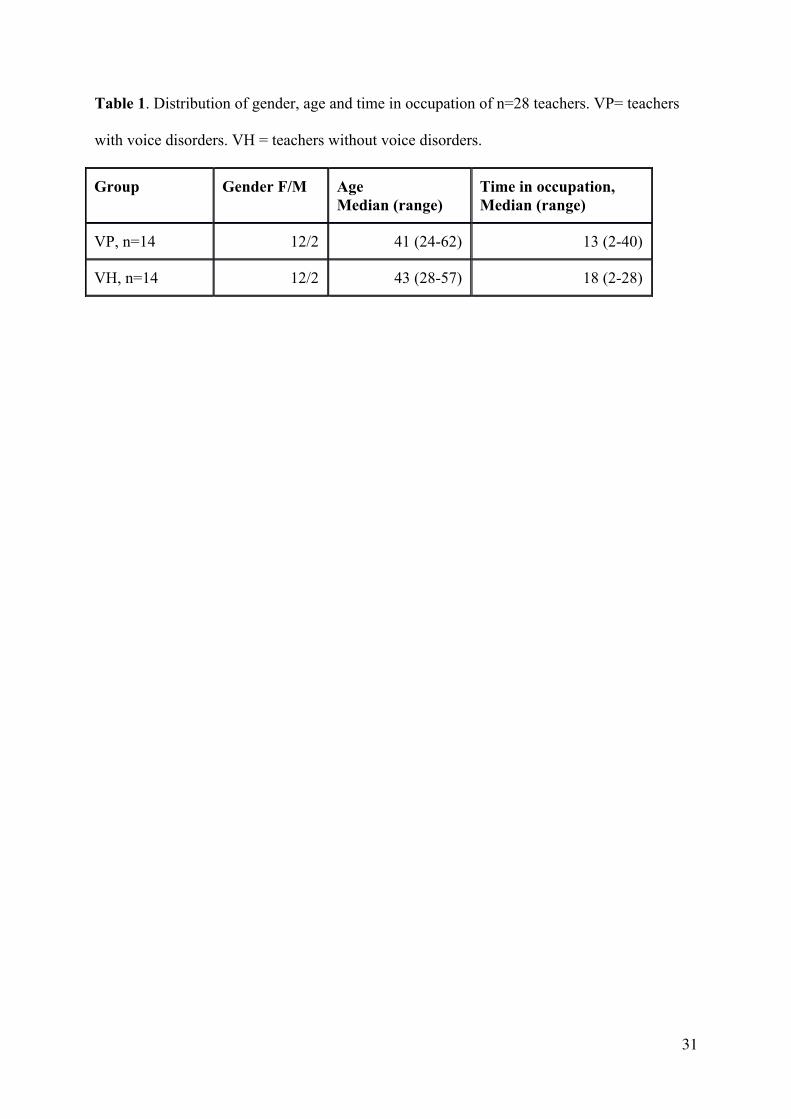
in the present study are shown in Table 1. As emerges from Table 1 there were no differences
between the groups for age or time in occupation, respectively, as shown by a t-test: t(223) =
.579 and t(223)=.510, with p > .05 in both cases. Teaching subject varied between individuals
as emerges from Table 2.
The teachers worked at three different schools in Lund, teaching primary to high school
levels. The schools were approximately equivalent to each other in size, in number of students
and staff, and were built during the same decade (mid 1960 to mid-1970). Two schools taught
all levels from primary to junior high, and one junior high level. All participants had recently
undergone examinations of the larynx, voice recordings and Voice Range Profiling, hearing,
6
and had rated psychosocial aspects as described in Lyberg Åhlander et al, 2 . There were some
minor remarks on laryngeal status in both groups but without statistical differences between
the groups for any of the above mentioned aspects (for further details, see 2 2.
The subjects were contacted by phone, were informed about the project, and asked if
they wanted to participate. Written information was sent by e-mail after the contact was
established. Both the teachers and the headmasters of the three schools gave their written
consent to participate. The teachers were further asked to identify a “typical” workday on
which the APM measurement could be performed. Due to the teachers’ schedules and
limitations of the APM, it was not possible to record the teachers for more than one day.
Description of the Ambulatory Phonation Monitor (APM) and definition of parameters
Several different methods to study the vocal behavior in the field have been developed
during the years, e. g. 30-36. These devices have used various techniques. The ones in use today
are based on accelerometers that estimate fundamental frequency and sound pressure level
from skin vibrations produced by the vibrations of the vocal folds. Using this technique, it is
possible to track the speaker’s voice also in noisy environments without recording the
background noise and without privacy intrusions.
The Ambulatory Phonation Monitor (APM) used in this study, made by Kay-Pentax, is
a microprocessor based system, estimating the fundamental frequency, SPL, phonation time,
and the number of vibratory cycles from skin vibrations captured by an accelerometer that is
attached to the front of the subject’s neck, above the sternal notch 33, 37. The software
calculates the mode and average of the fundamental frequency in Hz and the mode and
average sound pressure level in dB.
Based on these measures, Titze et al 38and Svec et al 32 have defined the following vocal
dose measures:

7
*The time dose is defined as the total duration of phonation, i.e., the total cumulated time and
the percentage of this time spent phonating.
*The cycle dose is the total number of vibratory cycles during a period of time. The cycle
dose was originally introduced by Rantala and Vilkman 9 as Vocal Loading Index.
Materials
The data were collected with the Ambulatory Phonation Monitor 3200 model 1.04
(APM) (Kay-Pentax, Lincoln Park, NJ). Based on a master thesis, a voice-diary was
developed for the teacher to fill-out during the day, to track the activities of the teacher. The
diary had two sections. The first consisted of nine questions on general information regarding
the teaching situation: the number and grade of the students taught, the teaching activities, the
distance from and noise-level of students along with one question on voice hygiene (intake of
water during the lesson). There was also a 100 mm Visual Analogue Scale for continuous
voice self-assessment where the subjects rated their current voice status (no voice problems -
maximum voice problems). The second part consisted of nine questions on voice aspects and
one on stress, rated on a categorical scale (not at all; partly; moderately and very much). The
voice questions were modified from the VHI-T (Voice Handicap Index-Throat)29 and from
The Voice Symptom Questionnaire 39 (See Tables 7 and 8).
Simultaneously with the APM recordings, the SPL at the teacher’s position were measured
with a sound level meter (Svantek, model SV-102, Svantek Inc,Warszawa, Poland). The
signal was picked up with a lapel microphone at a distance of 15 cm from the teacher’s
mouth. The sound level meter was placed in the same waist-bag as the APM box. The activity
noise levels LN,A,90 are defined in this study as the A-weighted, 1-s equivalent sound pressure
levels that are exceeded 90 per cent of the time, calculated from the measurements with the
sound level meter carried by the teacher. This measure is very weakly affected by the
vocalizations of the teacher, which produce much higher sound pressure levels.
8
The acoustic properties of the classrooms were evaluated with the following acoustic
parameters background noise level (BNL), reverberation time (RT), speech transmission index
(STI), sound strength (G) and voice support (STv). These measurements were made while the
classrooms were empty. Additionally, the geometrical dimensions of the room were
measured. Only the BNL, RT, STI and STv will be presented in this paper. For details on the
measurements of the rooms, For details on the measurements of the rooms, refer to Ref 40 .
The ambient air humidity, room temperature and the carbon dioxide (CO2) contents of
the air were simultaneously measured during the work-hours with an indoor air quality
measuring device: Q-Trak IAQ Monitor Model 8550 (TSI Inc, Shoreview, MN), analyzed
with Trak Pro Data Analysis Software (TSI Inc)
APM-procedure
The data was collected from late January through March 2010. Before the workday
started, the APM accelerometer was glued to the subject’s neck with prosthesis glue B-401,
Secure Adhesive, just above the sternal notch. The cable, connecting the accelerometer and
the APM device, was taped to the back of the neck and thread under the clothes, exiting the
garments at waist level. All procedures, including the calibration of the APM followed the
manufacturer’s recommendations. The teacher stood or sat in front of the calibration
microphone, with the distance guide (15 cm) resting on the upper lip. The subject was then
instructed to phonate on the vowel /a/ from the softest to the loudest phonation possible. The
APM device was then put in a waist-bag. The APM was worn by the teacher during the
workday and preferably also after work hours. The subject was also instructed how to
complete the diary, which was supposed to be filled out after each lesson together with the
Visual Analogue Scale on current voice status. The journal questions on voice were
completed on three occasions: after the first lesson, after lunch and just after the removal of
the accelerometer.
9
Statistics and ethical considerations
The statistical analyses were computed using SPSS 18.1 (IBM, Armonk, NY). For most
continuous variables, paired samples t-tests were used. Chi-Square tests were used when
parameters where categorical. One way ANOVA was used to compare variations between
activities and a standard multiple regression model was used to analyze the influence of the
ambient air quality and temperature on F0 and SPL. The alpha level for all statistical analyses
was set to .05. The study has been approved by the Institutional Review Board at Lund
University (#248/2008).
RESULTS
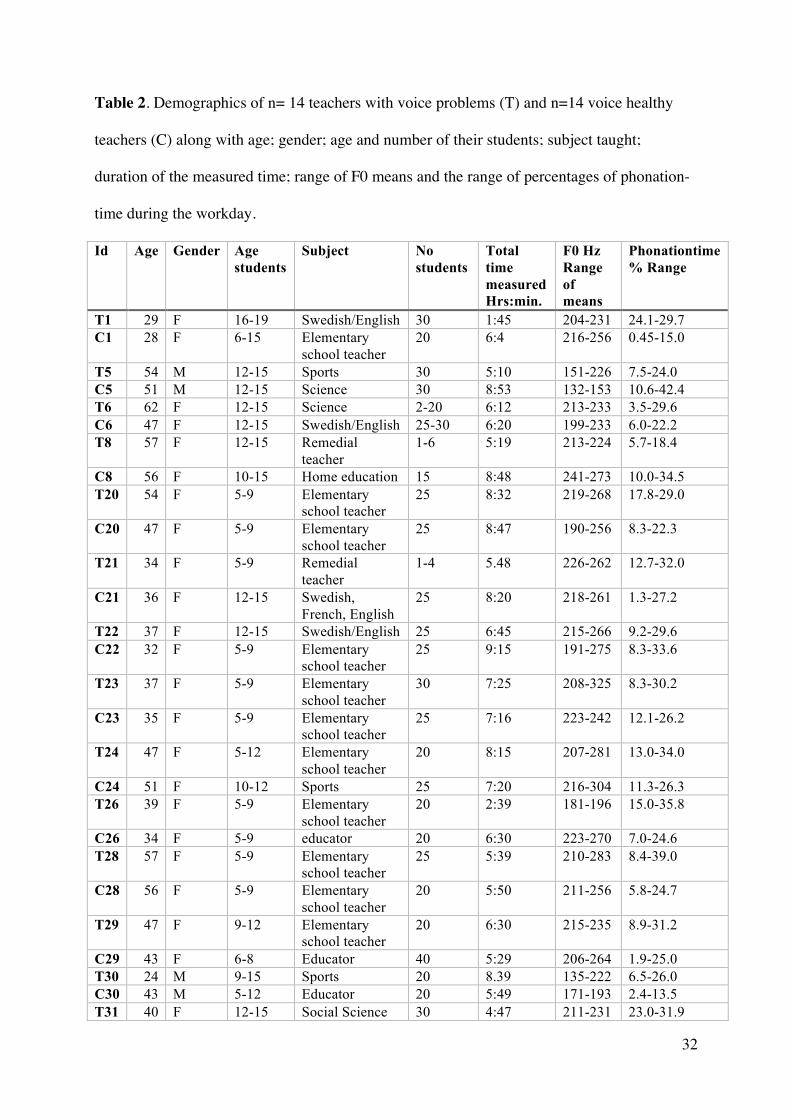
An overview of the subjects’ demographics along with ranges of F0, phonation-time and
duration of the recordings is found in Table 2.
Activities and duration-times
The activities during the day were labeled and classified into preparation, teaching, lunch
(including private lunch and lunch with the students), meeting, after work, and working out,
based on the information in the diary. The data were analyzed by comparisons between work
time, time after work and teaching (lessons). There were no significant differences between
the teachers with self-assessed voice problems (VP-group) and the teachers with self-assessed
voice health (VH-group) for duration of work-time (defined as preparation, teaching, and
lunch) during the recorded day as shown by a t-test t(199)=-949 p=.344. Nor were there any
differences between the groups for the duration of each activity, shown by a two-way between
groups ANOVA F(3, 184)=0.324 p=0.808 or for the type of activity during work time, shown
by a chi-square test for independence χ2(6, n=225)9.87 p=0.130. Due to processing limitations
10
of the APM only a small number of recordings were made for time-off and thus, no further
comparisons were made for time outside work.
Phonation-time and number of cycles
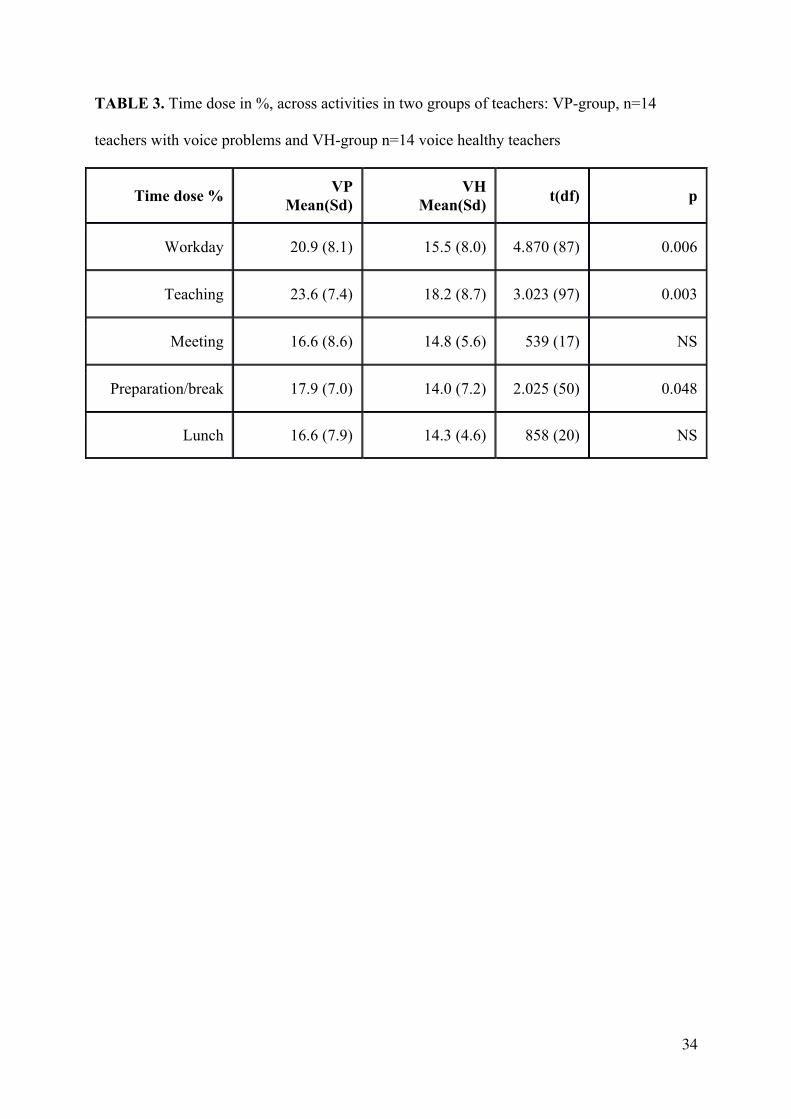
There were significant differences between the groups for percentage of voicing (Time
dose) in particular for teaching, during the work-day as shown by a paired t-test, see Table 3.
The VP-group consistently had a higher time dose during all activities.
Further, a one-way ANOVA showed significant differences for Time dose between
activities for the VP-group: F(3.89)= 6.870 p=.00003. Post-hoc comparisons using the Tukey
HSD test indicated that the mean scores for all activities differed significantly from
“teaching”: “teaching” (M=23.6 SD=7.2) differed significantly from the activities
“preparation/break” (M=18.5 SD=7.2), “meeting” (M=15.0 SD=8.9) and “lunch” (M=13.5
SD=5.41). The percent of voicing also differed significantly between some of the activities in
the VH-group: F(3,95)=3.550, p=.01. The post hoc test indicated significant differences
between “teaching” (M=18.8 SD=8.6) and “preparation/break” (M=13.5 SD=7.2). The effect
size, calculated with the eta squared, was 0.20 for the VP-group and 0.11 for the VH-group,
showing that the actual difference between activities was small for both groups. The mean
Time dose during “teaching”, thus ranges between 18 and 24% (SD=7) in this material (Table
3).
There were no significant overall differences between the groups for the number of
cycles during total work-time or in any specific activity. However for women specifically, the
groups differed as shown by a t-test: VP-group: (M=178 765 SD167 063) and VH-group:
(M=130 725 SD 100 058), t(194)=2.487 p=0.014.
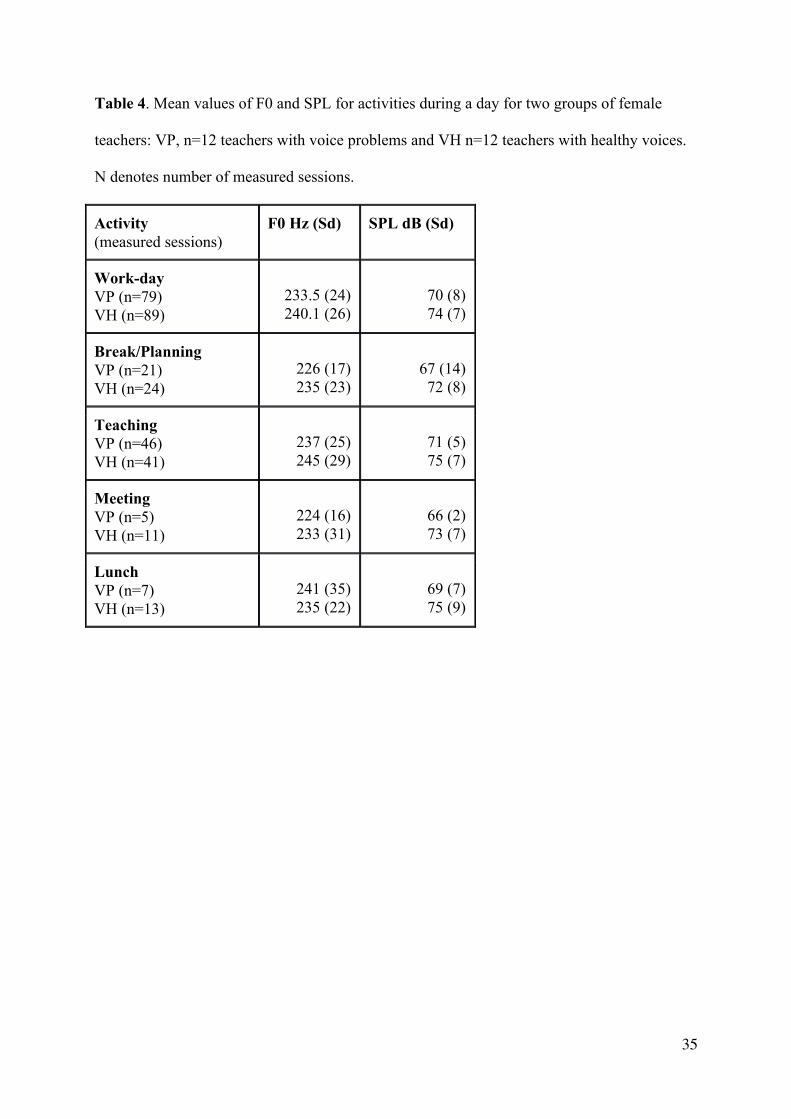
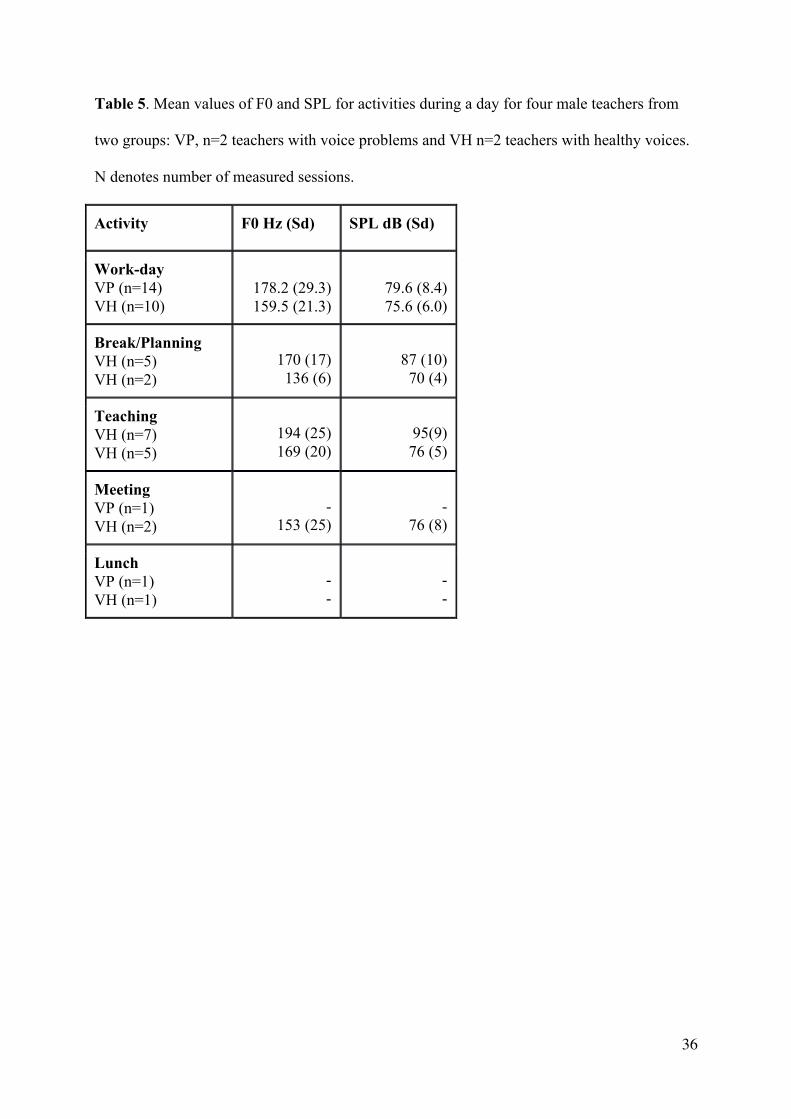
F0 and SPL, changes during the day
The results for F0 and SPL as a function of activity and group are shown in Table 4
(female teachers) and 5 (male teachers). Differences in F0 and SPL between activities were
11
assessed with a one-way ANOVA. No significant differences were found for F0 between the
groups for the workday or activities, including both males and females. For the measurements
of the workday, the SPL values differed significantly for women specifically as shown by a t-
test: VP(M=70.0 SD=5.2) and VH (M=74.1 SD=7.8) t(166)= -3.158 p=0,02. As emerging
from Tables 4 and 5 the results for males and females showed different trends between the
groups. For the females Table 4, the VP-group always had lower values for F0 and SPL than
the VH-group, but for the males in Table 5, the opposite was the case. The range of the F0
during the work-day emerges from Table 2.
There were no differences between activities for any group or gender as shown by post-
hoc comparisons using the Tukey HSD test.
Fundamental frequency and sound pressure level
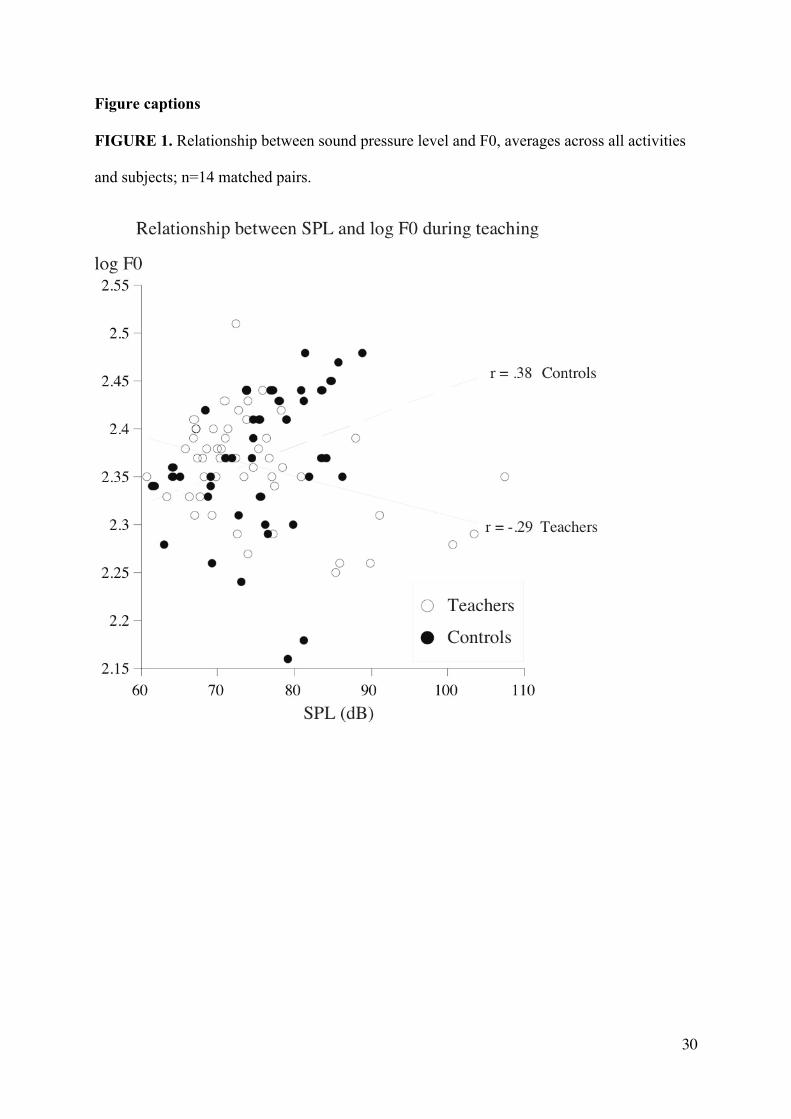
There was a difference between the groups in the correlation of the inter-play of F0 and
SPL during teaching. The correlation for VP was r(104) = -237, and for VH: r(120) = 331,
with p< .05 in both cases. Fisher’s r to z transform showed the difference between the groups
to be highly significant. As shown in Figure 1, this indicates that the group with voice
problems decreases the F0 when increasing the SPL, but the voice healthy group increases the
F0 when increasing the SPL.
Room parameters
Activity noise in the class-rooms
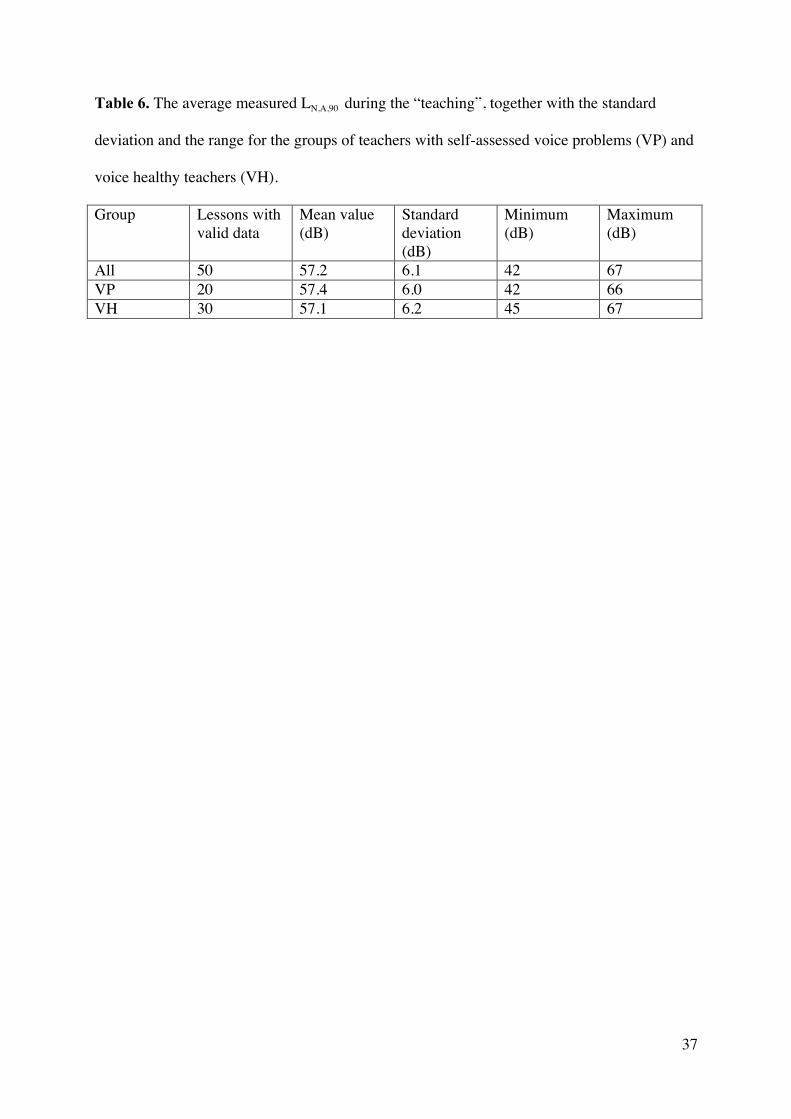
An analysis of the pooled results of the measurements of the activity noise during lessons
shows that the average A-weighted activity noise level (LN,A,90) in classrooms during lessons
was 57.2 dB (within a range from 42 dB to 67 dB). The LN,A,90 in the two groups did not differ
significantly as shown by a two-sample t-test: t(48) = 0.167, p = 0.866. The average
12
measured LN,A,90 during the lessons, together with the standard deviation and the range, is
shown in Table 6.
Background noise, speech transmission index, reverberation time and voice support
Since many parameters of room acoustics have a strong dependence on the room volume, the
rooms were grouped according to the following criteria:
• Small classrooms (V < 100 m3): classrooms for special education or small groups.
• Medium sized classrooms (100 m3 < V < 500 m3): regular classrooms, including also
classrooms for science and home ed.
• Sports halls (V > 3500 m3): acoustic requirements differ from those for regular
classrooms in the building regulations, due to the physical differences with smaller
spaces.
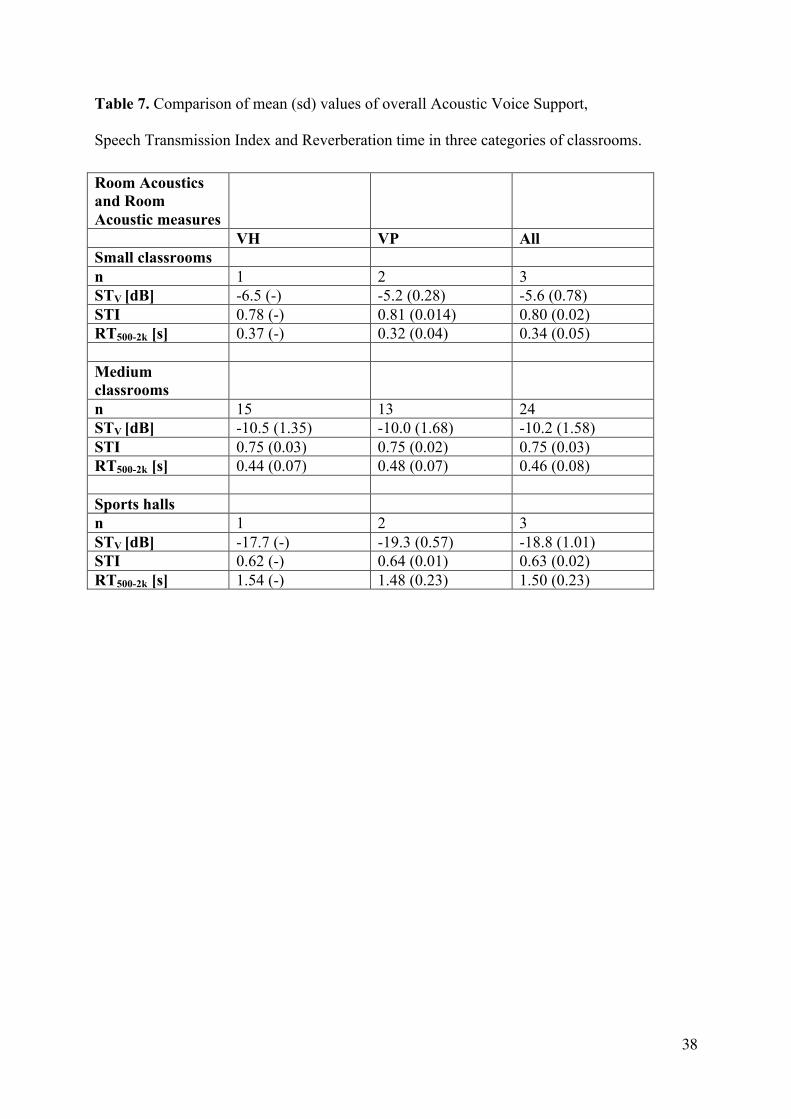
The overall mean/maximum A-weighted level of background noise (BNL) in the empty
rooms ranged between 32.3 dB/38.5dB (small classrooms); 32.7dB/43.5dB (medium sized
classrooms) and 37.6dB/43.5dB (sports halls). The BNL were similar in all rooms, although
the overall level in the large rooms was slightly higher than in smaller rooms. Low frequency
noise was markedly dominating, all over, indicating that the noise sources could be ventilation
or external noise.
The minimum acceptable Speech Transmission Index (STI) value according to the Swedish
regulation is STI=0.641. All the classrooms fulfilled this requirement. The small classrooms
had the highest STI, which is labeled as excellent. The medium classrooms had an average
STI rating which is in between “good” and excellent, and the sports halls had an STI rating of
good which will decrease in the presence of activity noise. The values for each room category
emerge from Table 7.
13
The reverberation time (RT) is highly correlated to the volume of the rooms; those with
smallest volumes have the lowest reverberation times. The mean RT in small and medium
classrooms did not exceed the regulation for reverberation time in classrooms (0.6 s).
The mean values of Voice Support (STv) are shown in Table 7. The only difference between
the small and medium sized rooms was that the small classrooms had a slightly higher over-
all value. The large classrooms (sports halls) not only had an overall lower value, but the
frequency characteristics were qualitatively different, because the low frequencies were
predominating. This indicates that the room does not reflect efficiently the high frequencies
needed for the speaker’s comfort.
For the comparison between the groups, only between-groups statistical comparisons with
middle-sized classrooms were meaningful. There were no significant differences between the
teaching environments for the VP and VH groups for any of the parameters, STv, STI or RT,
shown by independent samples t-tests: STV: t(23) = -0.86, p = 0.399; STI: t(23) = 0.21, p =
0.834; RT: t(23) = -1.36, p = 0.187
Air quality parameters There were no differences in temperature between the classrooms or for the classrooms
for each specific group, the temperature ranging from 19.2°-25.1°C (Median 22°C). Similarly,
there were no significant differences between the rooms for the aspects of air-quality or
humidity. The mean for air-quality, CO2 measured in particles/million (ppm) = 687 (SD
=143) and for Humidity, in % = 25% (SD=4.3). A standard multiple regression-model did not
find any parameter to be significantly contributing to differences in F0 or SPL in any group.
Diary and VAS estimates
14
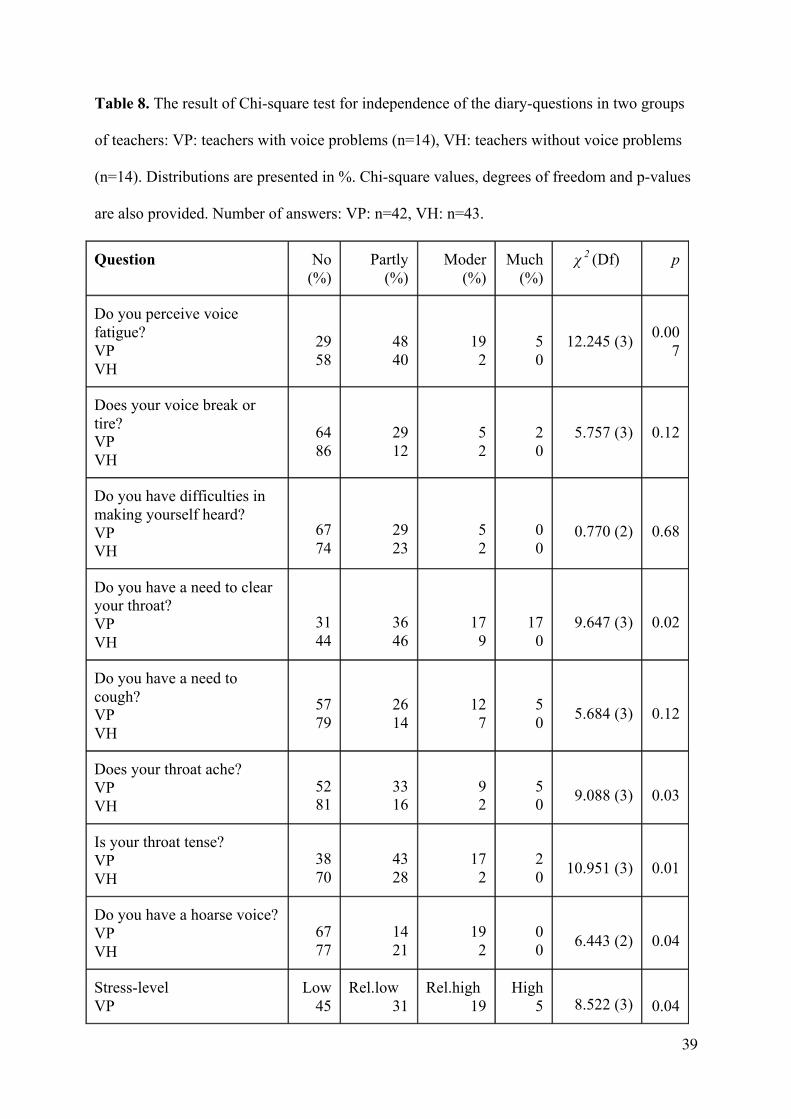
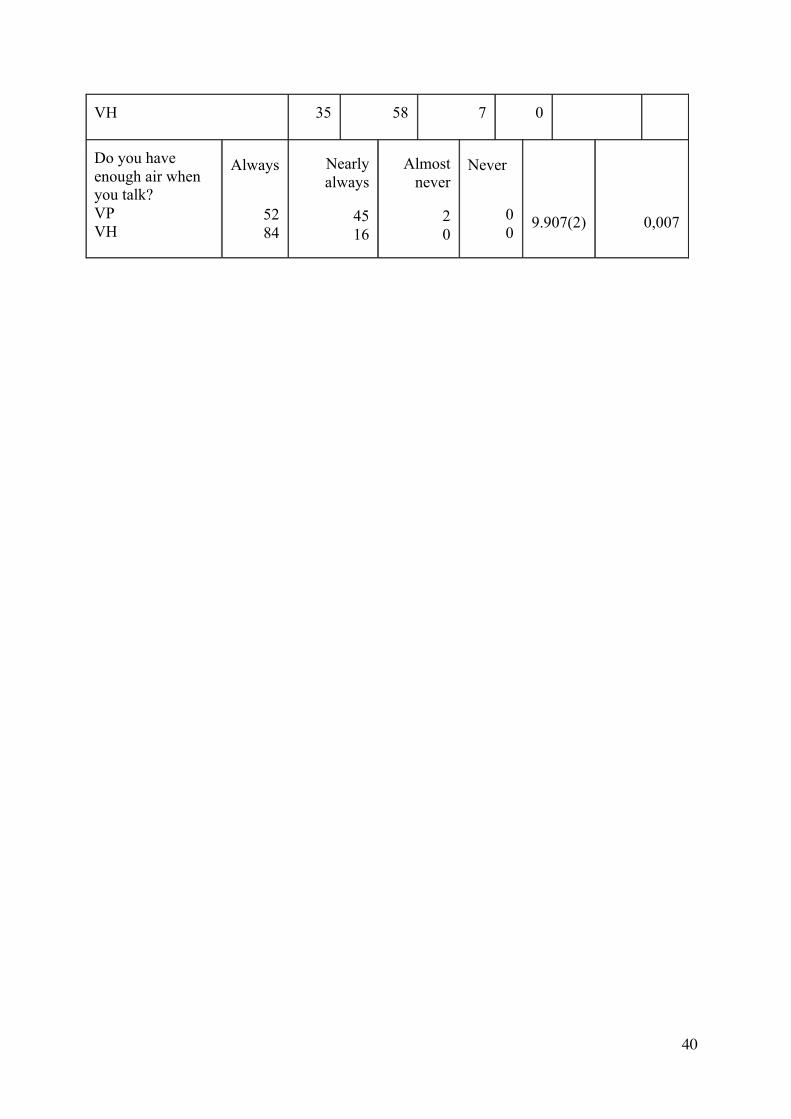
There were significant differences between the groups for the following questions as
shown by a chi-square test for independence: voice-fatigue; throat-clearing; throat-ache;
tenseness of throat; hoarseness; air-loss and stress-level. For female and male teachers there
were no differences between the groups for voice changes during speech, difficulties in
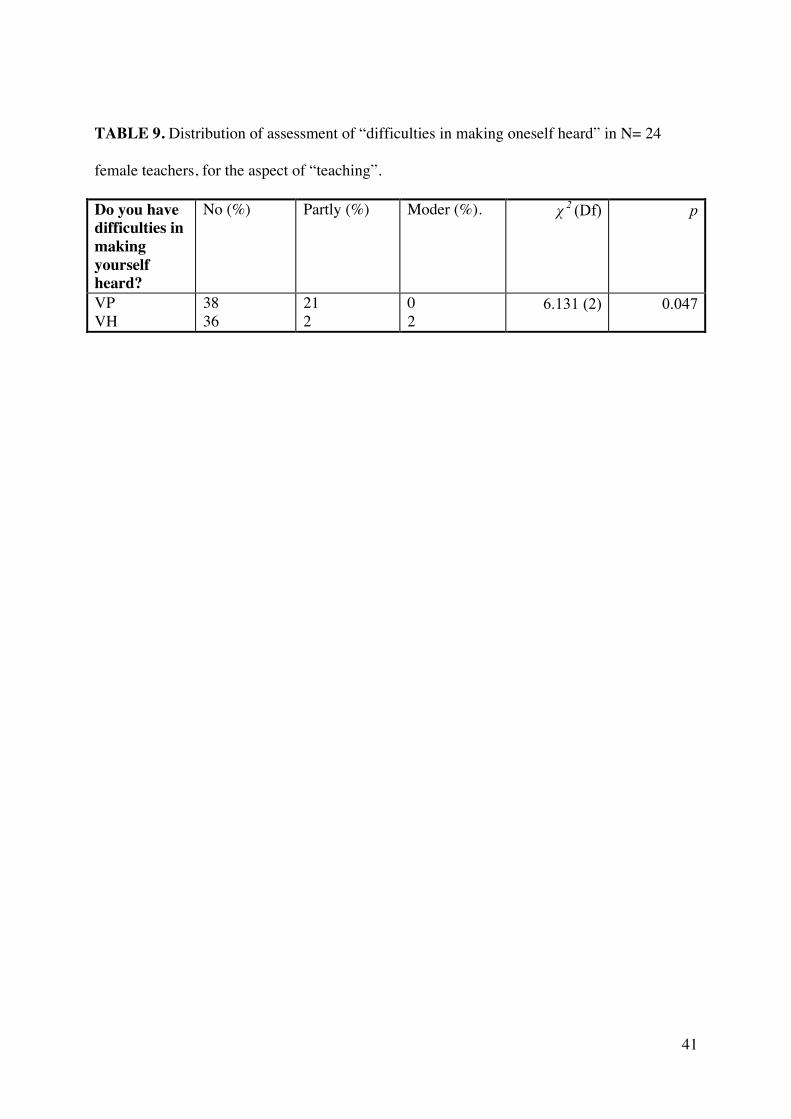
making oneself heard, or coughing. However, there was a difference between the groups of
female teachers, for “teaching” specifically, for the assessment of difficulties in making
oneself heard χ 2=(2)6.131 p=0.047. The distribution of the answers along with χ 2 and p-
values are shown in Tables 8 and 9.
The estimations of voice problems on a VA scale showed significant differences between
the groups according to a paired t-test: VP (M=32.3 SD=20.8) and VH (M=11.2 SD=11.8)
t(19)=3.441, p=.003. A one-way ANOVA showed no differences between teaching-sessions.
DISCUSSION
The teachers’ voice use in the classrooms differed between the groups for a number of
parameters. The phonation-time differed significantly between the VP and the VH groups and
for the female teachers there was a difference between the groups for number of cycles.
Further, there was a difference between the groups in the subjective assessments of vocal
aspects during the day and also the VAS estimations were significantly higher in the VP-
group. Of special interest are the findings of the differences in vocal behavior concerning the
levels of fundamental frequency in relation to the Sound Pressure Level. An increase in
fundamental frequency has been interpreted as a healthy reaction to voice load in other
studies. Laukkanen et al 15, and Jonsdottír et al 16 showed the F0-rise rise to be more evident
after voice amplification, unburdening the voice. Rantala and Vilkman 9 found F0 changes to
be significant in a group of teachers with few complaints of voice problems but not in the
compared group with many complaints. The difference between the groups in the present
15
study thus, confirms that a rise of the F0 can be interpreted as a crucial sign of a healthy
voice. We suggest that a rise of F0 should be occurring as a healthy adaption to voice load and
that a non-rise of F0 might occur due to voice problems.
A non-occurring F0 rise might reflect a loss of tissue flexibility, a difference in behavior,
or of neuro-muscular capacity. Measurements of F0 in relation to SPL during a work day may
thus be important for the detection and objective verification of voice problems.
It is essential to point out that these different strategies, or possibilities, of raising the F0
simultaneous with an SPL increase emerged only during field measurements. No differences
were detected by the full voice-range profiles (VRP) performed by the same individuals, in
Lyberg Åhlander et al 2. The fact that there were no differences between the VP and VH
groups for the VRPs might show that both groups have both the functional and physical
means to increase F0 along with increasing SPL in laboratory conditions and without
occupational voice load. When comparing measurements, methodological differences need to
be considered. Most methods used in clinic and research are based on registrations where the
acoustic signal is recorded, but measurements with accelerometer devices are based on
mathematical estimations calculated from vibrations transmitted through the skin.
The APM recordings in the present study were made during one ordinary school-day and
represent the individual’s typical vocal behavior. There was a difference between groups in
the subjective assessments of vocal aspects during the day. Also the VAS estimations were
significantly higher in the VP-group.
One of the two questions in the diary that separated the groups the most was, not
surprisingly, the question about perceived vocal fatigue. The answers to the question of loss
of air while talking (do you have enough air when you talk?) might of course reflect an
insufficient breathing technique. Loss of air during talking may also reflect an underlying
16
functional incompetency of the vocal apparatus or a compensatory behavior to reduce the
phonation effort.
We don’t know if wearing the APM influenced the teachers’ vocal behavior during the
day. Apart from some comments on the cables being in the way at some points during the day,
the device caused no problems for the subjects. Nor do we know if the measurements
influenced the students’ behavior. Some of the smaller children reacted when they saw the
accelerometer and even told their peers: “better keep the voice low today: Miss xxx has a sore
throat”. However, the teachers did not note any differences in the behavior of the children.
One difficulty in the present study was the matching of the pairs in relation to the groups that
the teachers taught. Even if each pair taught the same age groups, it was not possible to
control the children’s age at the group level. The pupils’ age and cognitive level probably
affect teachers’ vocal behavior. Perhaps more importantly, the measurements were made
during a single day, which is a limitation to the study and also of the APM recorder. The
APM needs to be recalibrated every day, which logistically prevented long-time
measurements. However, Masuda et al 31, concluded that their measurements of 29 subjects
over several days did not vary between days within the same subject. The day for the present
recordings was selected by the subjects as a “normal” day at work. A newly performed pilot
study comparing the voice use during work and leisure in four individuals indicates that the
variation between days occurs during the leisure time and not during work time 42. The fact
that the recorded day was the teachers’ own choice of day together with the findings by
Masuda et al 31, suggest that the chosen day is most likely representative of the subjects’ daily
pattern of voice use.
Cycle and time doses
The time and cycle doses are two of the potentially most useful measures for
understanding the stresses on the tissue of the vocal folds during phonation32, 38. There were
17
significant differences between the groups for the time dose and the cycle dose differed
specifically between females, in our material with the higher dose in the VP-group. The cycle
dose was originally introduced as Vocal Loading Index (VLI) by Rantala and Vilkman, 9 and
had a moderate correlation with the voice complaints in their subjects. That is, the more voice
complaints, the higher the VLI values. A higher cycle dose in the group with voice problems
may thus indicate the usefulness of the cycle dose as a measure of vocal load.
The cycle-dose describes the total number of vibratory cycles of the vocal folds. Since
there was no difference between the groups for F0 or SPL the difference in cycle-dose is most
likely related to phonation time. The percentage of phonation was significantly greater in the
voice problem group (24% vs 17%) which confirms the findings by Rantala and Vilkman 9.
Our result of 17-24% of voicing is in line with the findings of others for the teachers’ time
spent at work. Earlier studies have reported phonation-time in teachers. Masuda et al reported
a phonation-time of 20% 31, Titze et al a phonation-time of 23% 15, 43 and in a recent study
Hunter and Titze reported phonation-times of 30%, +/-11% 14. Södersten et al reported a
phonation-time of 16.9% in pre-school teachers 12. To compare: a recently performed study
showed that speaking continuously over noise between 3-30 min. gives phonation-times as
high as 60-80% 42. When making comparisons of phonation-time during teaching it is
however, necessary to take into account possible differences between countries in teaching
methods. In Sweden today, co-teaching is rather common, especially at the elementary and
middle school levels. Moreover, there is a general paradigm shift towards a more student-
focused teaching style. To teach under such circumstances means less need to lecture in a
traditional manner and probably also means more possibilities for vocal rest.
But do the teachers with voice problems really talk more? The answer is probably yes.
As shown in Table 2 all the teachers in the VP-group had a low limit of phonation-time range
that was higher than the teachers in the VH-group. However, it is important to underline that
18
talking more probably includes less time for pauses and recovery which might start a vicious
circle. Further studies are necessary where also qualitative vocal aspects are taken into
account.
Recovery
The importance of pausing, both long and short, has been identified in relation to voice
recovery after vocal load 43-45. Short pauses occur during breathing and swallowing. The
earlier study by Lyberg Åhlander et al 2 concluded that the subjects with voice problems, also
included in the present study, reported significantly longer time periods for recovery after
voice load than their voice-healthy colleagues. In the present study, the difference in both
cycle and time dose between the groups indicates a difference in vocal load. This may also
reflect a difference in the pausing during phonation. The combined results of the differences
in estimated recovery times and vocal doses between the VP and the VH groups might
indicate that there are changes taking place at a micro-level. This is also hypothesized by
McCabe and Titze who developed a conceptual and behavioral model of vocal fatigue and
voice recovery 46. This model describes how phonatory effort, i.e. “central fatigue”, leads to
compensatory functional changes (e.g. greater adduction of the vocal folds), which lead to
alterations of neuromuscular processes and changes of the lamina propria (e.g. prevention of a
stable blood circulation, and organic micro-changes). These alterations result in non-volitional
changes of voice quality, i.e. “peripheral fatigue”, increasing the phonatory effort, further
leading to increased central fatigue, etc. Based on the outcomes of a therapy based on this
model, performed in four teachers with vocal fatigue, McCabe and Titze 46 suggest that vocal
recovery occurs in two phases. The first, short time recovery, occurs during the first 1-2 hours
after voice load as a constant process independent of the rated level of fatigue. The second,
long-time recovery takes several days and is hypothesized to correlate to recovery of the
lamina propria (ibid). The occurrence and distributions of pauses during the day may thus be
19
crucial for the possibility of recovery and the lack of pauses might according to the model
contribute to a chronic voice problem.
The high vocal doses measured during lunch need some comments. The lunch-break may
be considered to be a time for pause and recovery. Lindström et al 36 observed a decrease in
F0 during lunch time. We did not find such a decrease. Instead there were peaks for both SPL
and F0 during lunch-time, probably due to a number of teachers having lunch with the
children in so called “educational lunches” which might result in higher levels of BNL.
Activity noise and room acoustics
The measured F0 and SPL values also depend on the teachers’ vocal behavior in relation
to the room acoustics and the BNL. These aspects were examined for all the subjects in this
study by Pelegrin-Garcia et al 28 using a sound level meter and a lapel-mounted microphone.
The results showed that both groups were equally affected by noise and behaved in
accordance with the Lombard effect 17, increasing their voice intensity with increasing BNL.
The values for BNL in this study were very similar to the 56.3 dB reported by Shield and
Dockrell 20 in classrooms with quiet pupils and the 56 dB reported by Hodgson 47 and by
MacKenzie 19, the latter in acoustically untreated classrooms. The range of measured activity
noise levels from 42 to 67 dB is comparable to the range of 40 to 70 dB reported in the study
by Hodgson et al47. It is noteworthy that the maximum values for BNL in both small and
medium sized classrooms exceeded the regulated maximum of 35 dB48, which probably
affects the vocal behavior of both teachers and students.
The room acoustics did affect the teachers’ vocal behavior differently which is shown by
the relation between the teachers’ voice SPL and the STv. As mentioned above, the STv is the
speaker’s perception of the voice, related to both the direct sound from the mouth to the ears
and the reflected sound from the room and is thus, a measure of the assistance that the talker
gets from the reflections from the room 26. The two groups showed opposite trends in their use
20
of the STv. The teachers in the VP-group decreased the SPL of the voice with increasing
voice support in the classrooms, whereas the teachers in the VH-group increased the voice
SPL.
These results are thus intriguing and needs to be further explored. One possibility is that
teachers experiencing voice problems are more attentive to room acoustics out of necessity to
preserve their vocal health. Another possibility is that they are too affected by their voice
problems to be able to behave differently.
Air quality and temperature
In the clinic, patients with voice problems often mention aspects of the indoor climate in
class rooms or offices to be troubling. The most commonly mentioned aspects are “dry air”,
“poor air”, and dustiness. One additional factor sometimes mentioned is “bad smell” due to
dirty filters in the airshafts. Although there were no differences in temperature between the
classrooms of the groups, with temperature ranging from 17.3°-25.1°C, the high temperature
in some classrooms is still worth to consideration. The Swedish regulation for indoor work
recommends an upper range value of 22°C for teaching environments. There is evidence that
mild heat might make the children sleepy and un-focused 49. Depending on their age, the
students may react with more noise due to their need to stay alert, or they may need to be
activated, forcing the teacher to be the active part. Both alternatives increase the teacher’s
voice load.
The mean CO2 levels were below the Swedish regulation for indoor work, 1000 ppm, but
in a few rooms, the CO2 level exceeded the stipulated maximum value. The reaction to the
CO2 levels depends on the air humidity and the temperature. Higher temperatures increase the
perception of poor air, even though the particles per million values do not exceed the
recommendation. The mean humidity estimate was low, 26%, which is normal during winter
in Sweden. Air humidity measures are more complicated than the other measures. The level
21
of air humidity is an effect of indoor heating, number of individuals in the room, and the
weather. As a consequence, there is no limit value or recommendation for air-humidity in
working environment in the Swedish regulation for indoor work.
The present measurements were made during winter, a season during which indoor
temperature is regulated by indoor heating, which also may contribute to the perception of air
dryness. In an earlier study, teachers with voice problems assessed the class-room air as dry to
a significantly higher degree than their voice healthy colleagues did, working at the same
schools and during the same season 1. We can only speculate about the effects of air-dryness
on voice and vocal loading in classrooms. It is possible that the origin can be found in the
combination of air-way hypersensitivity and vocal loading. Ratings of dry air might be a sign
of a generally dryer lower airway mucosa, or a predisposition for this. There were
significantly more teachers with allergies and hypersensitivity to strong odors in the group
with voice problems in Lyberg Åhlander et al 1. Thus, the feeling of dryness might be induced
by an almost constantly blocked nose. Nasal congestion may originate from allergies or by an
easily affected upper airway mucosa, preventing the individual from breathing through the
nose, which is essential for moisturizing and warming the inhaled air. Oral breathing might
thus enhance the perception of dryness of the inhaled air and might partly explain differences
among the groups in having enough air when talking. This line of reasoning is supported by
studies of e.g. Sivasankar et al 50 who conclude that oral breathing increased the phonation
threshold which, in turn, results in an increased vocal effort. Further studies are required.
Intake of water may help in reducing some of the symptoms and is commonly recommended
in voice therapy. In the present study, the teachers were asked about their intake of water
during teaching. None of the teachers drank water during teaching, which is both remarkable
and surprising.
22
CONCLUSIONS
The APM measurements of two groups of teachers showed that teachers with self-
estimated voice problems differed from their age-, gender- and school-matched voice healthy
peers in several aspects of voice use, in particular during teaching sessions. The time- and
cycle doses were both significantly higher in the group with voice problems. This suggests a
higher vocal load with fewer opportunities for vocal recovery during teaching. Moreover, the
pattern of F0 changes in relation to both room acoustics and the SPL of the voice differed
between the groups, possibly indicating a reduced vocal flexibility in the group with voice
problems.
Acknowledgements
This work was supported by AFA-insurance. The authors express their gratitude to Ulf
Bergendorf, specialist in occupational hygiene, Lund University, for support and help with the
air-quality measurements and to Maria Södersten, Karolinska Institute, Stockholm for
valuable comments during the process.
23
REFERENCES
1. Lyberg Åhlander V, Rydell R, Löfqvist A. Speaker's comfort in teaching
environments: Voice problems in Swedish teaching staff. J Voice. 2011;25:430-440.
2. Lyberg Åhlander V, Rydell R, Löfqvist A. How do teachers with self-reported voice
problems differ from their peers with self-reported voice health? J Voice.
2012;26:e149-161.
3. Fritzell B. Voice disorders and occupations. Logoped Phoniat Vocol. 1996;21:7 - 12.
4. Roy N, Merrill RM, Gray SD, Smith EM. Voice disorders in the general population:
Prevalence, risk factors, and occupational impact. Laryngoscope. 2005;115:1988-
1995.
5. Smith E, Lemke J, Taylor M, Kirchner HL, Hoffman H. Frequency of voice problems
among teachers and other occupations. J Voice. 1998;12:480-488.
6. Titze IR, Lemke J, Montequin D. Populations in the U.S. workforce who rely on voice
as a primary tool of trade: A preliminary report. J Voice. 1997;11:254-259.
7. Sapir S, Keidar A, Mathers-Schmidt B. Vocal attrition in teachers: Survey findings.
Eur J Disord Commun. 1993;28:177 - 185.
8. Rantala L, Paavola L, Korkko P, Vilkman E. Working-day effects on the spectral
characteristics of teaching voice. Folia Phoniatr et Logop. 1998;50:205-211.
9. Rantala L, Vilkman E. Relationship between subjective voice complaints and acoustic
parameters in female teachers' voices. J Voice. 1999;13:484-495.
10. Rantala L, Vilkman E, Bloigu R. Voice changes during work - subjective complaints
and objective measurements for female primary and secondary schoolteachers. J
Voice. 2002;16:344-355.
24
11. Jónsdóttir V, Boyle B, Martin P, Sigurdardóttir G. A comparison of the occurrence
and nature of vocal symptoms in two groups of Icelandic teachers. Logoped Phoniatr
Vocol. 2002;27:98-105.
12. Södersten M, Granqvist S, Hammarberg B, Szabo A. Vocal behavior and vocal
loading factors for preschool teachers at work studied with binaural DAT recordings. J
Voice. 2002;16:356-371.
13. Lindström F, Waye KP, Södersten M, McAllister A, Ternström S. Observations of the
relationship between noise exposure and preschool teacher voice usage in day-care
center environments. J Voice. 2011;25:166-172.
14. Hunter EJ, Titze IR. Variations in intensity, fundamental frequency, and voicing for
teachers in occupational versus nonoccupational settings. J Speech Lang Hear Res.
2010;53:862-875.
15. Laukkanen AM, Ilomaki I, Leppanen K, Vilkman E. Acoustic measures and self-
reports of vocal fatigue by female teachers. J Voice. 2008;22:283-289.
16. Jonsdottír V, Laukkanen AM, Vilkman E. Changes in teachers' speech during a
working day with and without electric sound amplification. Folia Phoniatr Logop.
2002;54:282-287.
17. Lane H, Tranel B. The Lombard sign and the role of hearing in speech. J Speech Hear
Res. 1971;14:677-709.
18. Pekkarinen E, Viljanen V. Acoustic Conditions for Speech Communication in
Classrooms. Scand. Audiology. 1991;20:257 - 263.
19. MacKenzie D. Noise sources and levels in UK schools. International Symposium on
Noise Control and Acoustics for Educational Buildings. Istanbul, Turkey: Proc
Turkish Acoustical Society; 2000:97–106.
25
20. Shield BM, Dockrell JE. External and internal noise surveys of London primary
schools. J. Acoust. Soc. Am. 2004;115:730-738.
21. Södersten M, Ternström S, Bohman M. Loud speech in realistic environmental noise:
Phonetogram data, perceptual voice quality, subjective ratings, and gender differences
in healthy speakers. J Voice. 2005;Vol. 19:pp. 29–46.
22. Ternström S, Bohman M, Södersten M. Loud speech over noise: Some spectral
attributes, with gender differences. J Acoust Soc Am. 2006;119:1648-1665.
23. Vintturi J, Alku P, Sala E, Sihvo M, Vilkman E. Loading-related subjective symptoms
during a vocal loading test with special reference to gender and some ergonomic
factors. Folia Phoniatr Logop. 2003;55:55-69.
24. Rantala LM, Hakala SJ, Holmqvist S, Sala E. Connections between voice ergonomic
risk factors and voice symptoms, voice handicap, and respiratory tract diseases. J
Voice. 2012;26:819 e813-820.
25. Kob M, Behler G, Kamprolf A, Goldschmidt O, Neuschaefer-Rube C. Experimental
investigations of the influence of room acoustics on the teacher's voice. Acoustical
Science and Technol. 2008;29:86-94.
26. Brunskog J, Gade AC, Payá-Bellester G, Reig-Calbo L. Increase in voice level and
speaker comfort in lecture rooms. J Acoust Soc Am. 2009;125:2072-2083.
27. Pelegrín García D. Comment on “Increase in voice level and speaker comfort in
lecture rooms”. J Acoust Soc Am. 2011;131:194-204.
28. Pelegrin-Garcia D, Brunskog J, Lyberg Åhlander V, Rydell R, Löfqvist A. Influence
of classroom acoustics on the voice levels of teachers with and without voice
problems: A field study. Proceedings of Meetings on Acoustics, Vol. 11, 2010.
26
29. Lyberg-Åhlander V, Rydell R, Eriksson J, Schalén L. Throat related symptoms and
voice: development of an instrument for self assessment of throat-problems. BMC
Ear, Nose Throat. 2010;10:5.
30. Ohlsson A-C, Brink O, Löfqvist A. A voice accumulator - validation and application.
J Speech Hear Res. 1989;32:451-457.
31. Masuda T, Ikeda Y, Manako H, Komiyama S. Analysis of vocal abuse: fluctuations in
phonation time and intensity in 4 groups of speakers. Acta Otolaryngol.
1993;113:547-552.
32. Svec JG, Popolo PS, Titze IR. Measurement of vocal doses in speech: experimental
procedure and signal processing. Logoped Phoniatr Vocol. 2003;28:181-192.
33. Cheyne HA, Hanson HM, Genereux RP, Stevens KN, Hillman RE. Development and
testing of a portable vocal accumulator. J Lang Hear Res. 2003;46:1457-1468.
34. Szabo A, Hammarberg B, Håkansson A, Södersten M. A voice accumulator device:
Evaluation based on studio and field recordings. Logoped Phoniatr Vocol.
2001;26:102-117.
35. Szabo A, Hammarberg B, Granqvist S, Södersten M. Methods to study pre-school
teachers' voice at work: simultaneous recordings with a voice accumulator and a DAT
recorder. Logoped Phoniatr Vocol. 2003;28:29-39.
36. Lindström F, Ohlsson AC, Sjöholm J, PerssonWaye K. Mean F0 values obtained
through standard phrase pronunciation compared with values obtained from the
normal work environment: a study on teacher and child voices performed in a
preschool environment. J Voice. 2010;24:319-323.
37. Hillman RE, Heaton JT, Masaki A, Zeitels SM, Cheyne HA. Ambulatory monitoring
of disordered voices. Ann Otol Rhinol Laryngol. 2006;115:795-801.
27
38. Titze IR, Svec JG, Popolo PS. Vocal dose measures: Quantifying accumulated
vibration exposure in vocal fold tissues. J Speech Lang Hear Res. 2003;46:919-932.
39. Simberg S, Sala E, Vehmas K, Laine A. Changes in the prevalence of vocal symptoms
among teachers during a twelve-year period. J Voice. 2005;19:95-102.
40. Pelegrín-García D, Brunskog J, Lyberg-Åhlander V, Löfqvist A. Measurement and
prediction of voice support and room gain in school classrooms. J Acoust Soc
Am.2012;131:194-204.
41. Swedish Standards Institute. Acoustics - Sound classification of spaces in buildings -
Institutional premises, rooms for education, preschools and leisure-time centres, rooms
for office work and hotels. Vol SS 25268:2007. Stockholm, Sweden: SIS; 2007.
42. Whitling, S., Rydell, R., & Lyberg Åhlander, V. (2014). Design of a Clinical Vocal
Loading Test With Long-Time Measurement of Voice. Journal of Voice. doi:
10.1016/j.jvoice.2014.07.012
43. Titze IR, Hunter JE, Svec JG. Voicing and silence periods in daily and weekly
vocalizations of teachers. J Acoust Soc Am. 2007;121:469-478.
44. Vintturi J, Alku P, Lauri ER, Sala E, Sihvo M, Vilkman E. The Effects of Post-
Loading Rest on Acoustic Parameters with Special Reference to Gender and
Ergonomic Factors. Folia Phoniatr Logop. 2001;53:338-350.
45. Hunter EJ, Titze IR. Quantifying Vocal Fatigue Recovery: Dynamic Vocal Recovery
Trajectories After a Vocal Loading Exercise. Annals Otol Rhinol & Laryngol.
2009;118:449-461.
46. McCabe D, Titze I. Chant therapy for treating vocal fatigue among public school
teachers: a preliminary study. Am J Speech-Language Pathol. 2002;11:356-369.
47. Hodgson M. UBC-classroom acoustical survey. Canadian Acoustics. 1994;22:3-10.
28
48. Arbetsmiljöverket. AFS 2009:02 Arbetsplatsens utformning [Work place design].
Stockholm 2009.
49. Hygge S. The interaction of noise and mild heat on cognitive performance and serial
reaction time. Environm Internat. 1991;17:239-244.
50. Sivasankar M, Erickson E, Schneider S. Phonatory effects of airway dehydration:
Preliminary evidence for impaired compensation to oral breathing in individuals with
a history of vocal fatigue. J Speech Lang Hear Res. 2008;51:1494-1507.

29
30
Figure captions
FIGURE 1. Relationship between sound pressure level and F0, averages across all activities
and subjects; n=14 matched pairs.
31
Table 1. Distribution of gender, age and time in occupation of n=28 teachers. VP= teachers
with voice disorders. VH = teachers without voice disorders.
Group Gender F/M Age Median (range)
Time in occupation, Median (range)
VP, n=14 12/2 41 (24-62) 13 (2-40)
VH, n=14 12/2 43 (28-57) 18 (2-28)
32
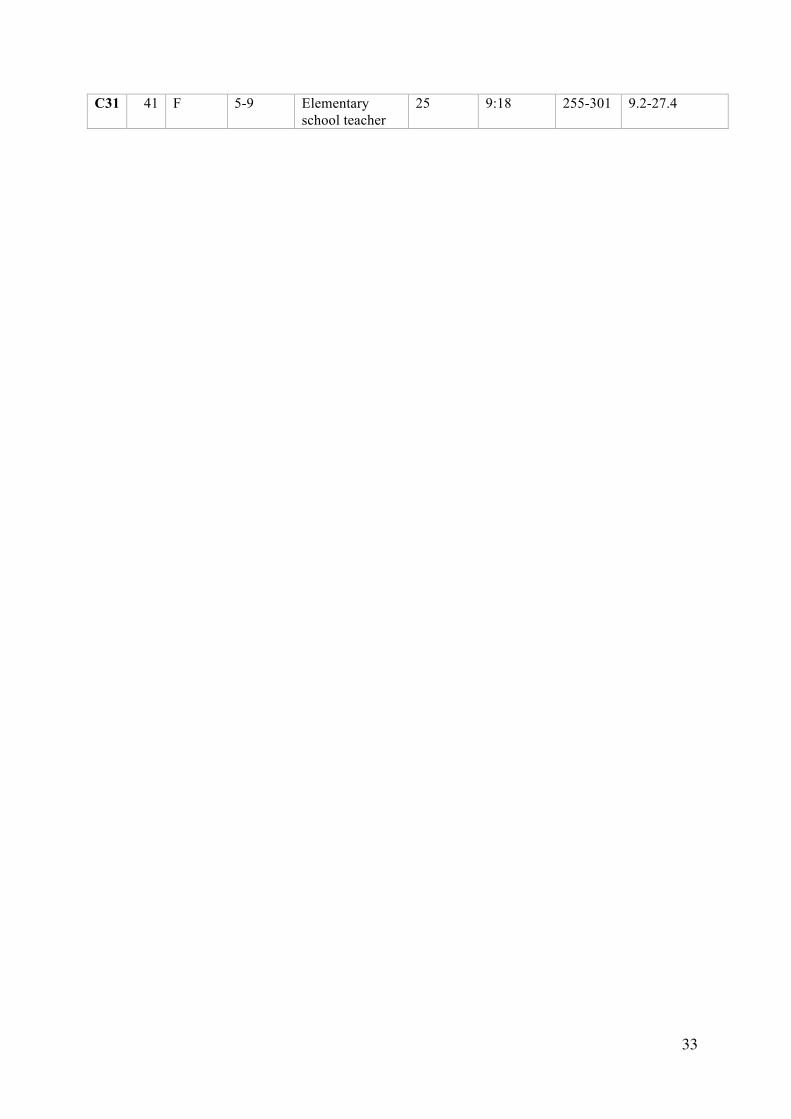
Table 2. Demographics of n= 14 teachers with voice problems (T) and n=14 voice healthy
teachers (C) along with age; gender; age and number of their students; subject taught;
duration of the measured time; range of F0 means and the range of percentages of phonation-
time during the workday.
Id Age Gender Age students
Subject No students
Total time measured Hrs:min.
F0 Hz Range of means
Phonationtime % Range
T1 29 F 16-19 Swedish/English 30 1:45 204-231 24.1-29.7 C1 28 F 6-15 Elementary
school teacher 20 6:4 216-256 0.45-15.0
T5 54 M 12-15 Sports 30 5:10 151-226 7.5-24.0 C5 51 M 12-15 Science 30 8:53 132-153 10.6-42.4 T6 62 F 12-15 Science 2-20 6:12 213-233 3.5-29.6 C6 47 F 12-15 Swedish/English 25-30 6:20 199-233 6.0-22.2 T8 57 F 12-15 Remedial
teacher 1-6 5:19 213-224 5.7-18.4
C8 56 F 10-15 Home education 15 8:48 241-273 10.0-34.5 T20 54 F 5-9 Elementary
school teacher 25 8:32 219-268 17.8-29.0
C20 47 F 5-9 Elementary school teacher
25 8:47 190-256 8.3-22.3
T21 34 F 5-9 Remedial teacher
1-4 5.48 226-262 12.7-32.0
C21 36 F 12-15 Swedish, French, English
25 8:20 218-261 1.3-27.2
T22 37 F 12-15 Swedish/English 25 6:45 215-266 9.2-29.6 C22 32 F 5-9 Elementary
school teacher 25 9:15 191-275 8.3-33.6
T23 37 F 5-9 Elementary school teacher
30 7:25 208-325 8.3-30.2
C23 35 F 5-9 Elementary school teacher
25 7:16 223-242 12.1-26.2
T24 47 F 5-12 Elementary school teacher
20 8:15 207-281 13.0-34.0
C24 51 F 10-12 Sports 25 7:20 216-304 11.3-26.3 T26 39 F 5-9 Elementary
school teacher 20 2:39 181-196 15.0-35.8
C26 34 F 5-9 educator 20 6:30 223-270 7.0-24.6 T28 57 F 5-9 Elementary
school teacher 25 5:39 210-283 8.4-39.0
C28 56 F 5-9 Elementary school teacher
20 5:50 211-256 5.8-24.7
T29 47 F 9-12 Elementary school teacher
20 6:30 215-235 8.9-31.2
C29 43 F 6-8 Educator 40 5:29 206-264 1.9-25.0 T30 24 M 9-15 Sports 20 8.39 135-222 6.5-26.0 C30 43 M 5-12 Educator 20 5:49 171-193 2.4-13.5 T31 40 F 12-15 Social Science 30 4:47 211-231 23.0-31.9
33
C31 41 F 5-9 Elementary school teacher
25 9:18 255-301 9.2-27.4
34
TABLE 3. Time dose in %, across activities in two groups of teachers: VP-group, n=14
teachers with voice problems and VH-group n=14 voice healthy teachers
Time dose % VP Mean(Sd)
VH Mean(Sd) t(df) p
Workday 20.9 (8.1) 15.5 (8.0) 4.870 (87) 0.006
Teaching 23.6 (7.4) 18.2 (8.7) 3.023 (97) 0.003
Meeting 16.6 (8.6) 14.8 (5.6) 539 (17) NS
Preparation/break 17.9 (7.0) 14.0 (7.2) 2.025 (50) 0.048
Lunch 16.6 (7.9) 14.3 (4.6) 858 (20) NS
35
Table 4. Mean values of F0 and SPL for activities during a day for two groups of female
teachers: VP, n=12 teachers with voice problems and VH n=12 teachers with healthy voices.
N denotes number of measured sessions.
Activity (measured sessions)
F0 Hz (Sd) SPL dB (Sd)
Work-day VP (n=79) VH (n=89)
233.5 (24) 240.1 (26)
70 (8) 74 (7)
Break/Planning VP (n=21) VH (n=24)
226 (17) 235 (23)
67 (14) 72 (8)
Teaching VP (n=46) VH (n=41)
237 (25) 245 (29)
71 (5) 75 (7)
Meeting VP (n=5) VH (n=11)
224 (16) 233 (31)
66 (2) 73 (7)
Lunch VP (n=7) VH (n=13)
241 (35) 235 (22)
69 (7) 75 (9)
36
Table 5. Mean values of F0 and SPL for activities during a day for four male teachers from
two groups: VP, n=2 teachers with voice problems and VH n=2 teachers with healthy voices.
N denotes number of measured sessions.
Activity F0 Hz (Sd) SPL dB (Sd)
Work-day VP (n=14) VH (n=10)
178.2 (29.3) 159.5 (21.3)
79.6 (8.4) 75.6 (6.0)
Break/Planning VH (n=5) VH (n=2)
170 (17) 136 (6)
87 (10) 70 (4)
Teaching VH (n=7) VH (n=5)
194 (25) 169 (20)
95(9) 76 (5)
Meeting VP (n=1) VH (n=2)
-
153 (25)
-
76 (8)
Lunch VP (n=1) VH (n=1)
- -
- -
37
Table 6. The average measured LN,A,90 during the “teaching”, together with the standard
deviation and the range for the groups of teachers with self-assessed voice problems (VP) and
voice healthy teachers (VH).
Group Lessons with valid data
Mean value (dB)
Standard deviation (dB)
Minimum (dB)
Maximum (dB)
All 50 57.2 6.1 42 67 VP 20 57.4 6.0 42 66 VH 30 57.1 6.2 45 67
38
Table 7. Comparison of mean (sd) values of overall Acoustic Voice Support,
Speech Transmission Index and Reverberation time in three categories of classrooms.
Room Acoustics and Room Acoustic measures
VH VP All Small classrooms n 1 2 3 STV [dB] -6.5 (-) -5.2 (0.28) -5.6 (0.78) STI 0.78 (-) 0.81 (0.014) 0.80 (0.02) RT500-2k [s] 0.37 (-) 0.32 (0.04) 0.34 (0.05) Medium classrooms
n 15 13 24 STV [dB] -10.5 (1.35) -10.0 (1.68) -10.2 (1.58) STI 0.75 (0.03) 0.75 (0.02) 0.75 (0.03) RT500-2k [s] 0.44 (0.07) 0.48 (0.07) 0.46 (0.08) Sports halls n 1 2 3 STV [dB] -17.7 (-) -19.3 (0.57) -18.8 (1.01) STI 0.62 (-) 0.64 (0.01) 0.63 (0.02) RT500-2k [s] 1.54 (-) 1.48 (0.23) 1.50 (0.23)
39
Table 8. The result of Chi-square test for independence of the diary-questions in two groups
of teachers: VP: teachers with voice problems (n=14), VH: teachers without voice problems
(n=14). Distributions are presented in %. Chi-square values, degrees of freedom and p-values
are also provided. Number of answers: VP: n=42, VH: n=43.
Question No (%)
Partly (%)
Moder (%)
Much (%)
χ 2 (Df) p
Do you perceive voice fatigue? VP VH
29 58
48 40
19 2
5 0
12.245 (3) 0.00
7
Does your voice break or tire? VP VH
64 86
29 12
5 2
2 0
5.757 (3) 0.12
Do you have difficulties in making yourself heard? VP VH
67 74
29 23
5 2
0 0
0.770 (2)
0.68
Do you have a need to clear your throat? VP VH
31 44
36 46
17 9
17 0
9.647 (3)
0.02
Do you have a need to cough? VP VH
57 79
26 14
12 7
5 0
5.684 (3)
0.12
Does your throat ache? VP VH
52 81
33 16
9 2
5 0
9.088 (3)
0.03
Is your throat tense? VP VH
38 70
43 28
17 2
2 0
10.951 (3)
0.01
Do you have a hoarse voice? VP VH
67 77
14 21
19 2
0 0
6.443 (2)
0.04
Stress-level VP
Low 45
Rel.low 31
Rel.high 19
High 5
8.522 (3)
0.04
40
VH 35 58 7 0
Do you have enough air when you talk? VP VH
Always
52 84
Nearly always
45 16
Almost never
2 0
Never
0 0
9.907(2)
0,007
41
TABLE 9. Distribution of assessment of “difficulties in making oneself heard” in N= 24
female teachers, for the aspect of “teaching”.
Do you have difficulties in making yourself heard?
No (%) Partly (%) Moder (%). χ 2 (Df) p
VP VH
38 36
21 2
0 2
6.131 (2) 0.047
Related Documents