American Economic Review 2012, 102(5): 1773–1804 http://dx.doi.org/10.1257/aer.102.5.1773 1773 Externalities are commonplace within assignment processes: In the housing mar- ket, the value of a property depends on the demographics of neighboring home- owners. In an oligopolistic market, the returns from joining one firm depend on the composition of rivals. In universities, the desirability of a specific dorm room may depend on the peers in nearby rooms. In politics, the benefit from joining a particular party or coalition varies with the other political alliances formed. In team sports, the value of joining one team depends on the quality of other teams’ play- ers. And so on and so forth. Despite the wide range of applications featuring exter- nalities, the matching literature, both positive and prescriptive, has largely ignored their presence. 1 One of the significant challenges in assessing the role of externalities is that the underlying networks generating them are often unobservable or difficult to pin down. In particular, while attributes such as income, professional qualification, and education are frequently available, other important measurements of social connec- tion—friendship, a shared professional history, etc.—are more difficult to obtain. 1 For several exceptions, see the literature review below. A Field Study on Matching with Network Externalities † By Mariagiovanna Baccara, Ay¸ se ˙ Imrohoro ˘ glu, Alistair J. Wilson, and Leeat Yariv* We study the effects of network externalities within a protocol for matching faculty to offices in a new building. Using web and sur- vey data on faculty’s attributes and choices, we identify the different layers of the social network: institutional affiliation, coauthorships, and friendships. We quantify the effects of network externalities on choices and outcomes, disentangle the layers of the networks, and quantify their relative influence. Finally, we assess the protocol used from a welfare perspective. Our study suggests the importance and feasibility of accounting for network externalities in assignment problems and evaluates techniques that can be employed to this end. (JEL C78, C93, D62, D85, Z13) * Baccara: Olin School of Business, Washington University in St. Louis, Campus Box 1133, One Brookings Drive, St. Louis, MO 63130 (e-mail: [email protected]); ˙ Imrohoro ˘ glu: Department of Finance and Business Economics, University of Southern California, Marshall School of Business, 3670 Trousdale Parkway, Los Angeles, CA 90089 (e-mail: [email protected]); Wilson: Department of Economics, University of Pittsburgh, 230 S. Bouquet St., Pittsburgh, PA 15260 (e-mail: [email protected]); Yariv: Division of Humanities and Social Sciences, California Institute of Technology, 1200 E. California Blvd., Pasadena, CA 91125 (e-mail: [email protected]). Atila Abdulkadiro ˘ glu, Dan Ackerberg, Estelle Cantillon, Allan Collard-Wexler, Jeremy Fox, Guillaume Fréchette, Maggie McConnell, Ariel Pakes, Debraj Ray, and Matt Shum provided helpful conversations and feedback. We thank three anonymous referees for many useful comments and suggestions. Financial support from the National Science Foundation (SES 0963583) and the Gordon and Betty Moore Foundation is gratefully acknowledged. † To view additional materials, visit the article page at http://dx.doi.org/10.1257/aer.102.5.1773.

Welcome message from author
This document is posted to help you gain knowledge. Please leave a comment to let me know what you think about it! Share it to your friends and learn new things together.
Transcript
American Economic Review 2012, 102(5): 1773–1804 http://dx.doi.org/10.1257/aer.102.5.1773
1773
Externalities are commonplace within assignment processes: In the housing mar-ket, the value of a property depends on the demographics of neighboring home-owners. In an oligopolistic market, the returns from joining one firm depend on the composition of rivals. In universities, the desirability of a specific dorm room may depend on the peers in nearby rooms. In politics, the benefit from joining a particular party or coalition varies with the other political alliances formed. In team sports, the value of joining one team depends on the quality of other teams’ play-ers. And so on and so forth. Despite the wide range of applications featuring exter-nalities, the matching literature, both positive and prescriptive, has largely ignored their presence.1
One of the significant challenges in assessing the role of externalities is that the underlying networks generating them are often unobservable or difficult to pin down. In particular, while attributes such as income, professional qualification, and education are frequently available, other important measurements of social connec-tion—friendship, a shared professional history, etc.—are more difficult to obtain.
1 For several exceptions, see the literature review below.
A Field Study on Matching with Network Externalities†
By Mariagiovanna Baccara, Ayse I mrohoro g lu,
Alistair J. Wilson, and Leeat Yariv*
We study the effects of network externalities within a protocol for matching faculty to offices in a new building. Using web and sur-vey data on faculty’s attributes and choices, we identify the different layers of the social network: institutional affiliation, coauthorships, and friendships. We quantify the effects of network externalities on choices and outcomes, disentangle the layers of the networks, and quantify their relative influence. Finally, we assess the protocol used from a welfare perspective. Our study suggests the importance and feasibility of accounting for network externalities in assignment problems and evaluates techniques that can be employed to this end.(JEL C78, C93, D62, D85, Z13)
* Baccara: Olin School of Business, Washington University in St. Louis, Campus Box 1133, One Brookings Drive, St. Louis, MO 63130 (e-mail: [email protected]); I mrohoro g lu: Department of Finance and Business Economics, University of Southern California, Marshall School of Business, 3670 Trousdale Parkway, Los Angeles, CA 90089 (e-mail: [email protected]); Wilson: Department of Economics, University of Pittsburgh, 230 S. Bouquet St., Pittsburgh, PA 15260 (e-mail: [email protected]); Yariv: Division of Humanities and Social Sciences, California Institute of Technology, 1200 E. California Blvd., Pasadena, CA 91125 (e-mail: [email protected]). Atila Abdulkadiro g lu, Dan Ackerberg, Estelle Cantillon, Allan Collard-Wexler, Jeremy Fox, Guillaume Fréchette, Maggie McConnell, Ariel Pakes, Debraj Ray, and Matt Shum provided helpful conversations and feedback. We thank three anonymous referees for many useful comments and suggestions. Financial support from the National Science Foundation (SES 0963583) and the Gordon and Betty Moore Foundation is gratefully acknowledged.
† To view additional materials, visit the article page at http://dx.doi.org/10.1257/aer.102.5.1773.
Contents
I. Related Literature 1776
II. The Allocation Process 1778
A. The Matching Protocol 1778
B. The Assignment Data 1780
III. The Underlying Networks 1782
A. Institutional Network 1782
B. Coauthorship Network 1783
C. Friendship Network 1783
D. Overlap of Networks 1786
E. Existence of Network Effects in Office Selection 1786
IV. Dartboard Approach: Network Effects and Outcomes 1788
V. Estimating the Relative Effects of Different Networks 1791
A. Stability with Externalities 1792
B. Implementation 1795
C. Stability-Estimation Results 1796
VI. Welfare 1799
VII. Conclusion 1803

1774 THE AMERICAN ECONOMIC REVIEW AUgUST 2012
Beyond the scarcity of data, the matching literature lacks a definitive framework to account for externalities, while still enabling empirical evaluations.
The current paper uses unique field data from a centralized assignment process in which connections between individuals were mapped at both the professional and social levels. Specifically, our data originate from a matching process that assigned faculty members from a US professional school to newly renovated offices. Using web and survey sources, we identify the institutional, coauthorship, and friendship networks of associations between the faculty involved.
Our study has three goals: first, to provide an empirical account of the effects of externalities resulting from agents’ connections in assignment processes on behav-ior and outcomes; second, to assess the differing networks’ relative effects;2 third, to evaluate the efficiency of matching protocols in terms of welfare, accounting for the identified externalities. As a by-product, our analysis suggests and appraises several econometric and computational techniques for estimating network externalities.
Our data describe the matching process and final assignment of 73 faculty into offices. The offices vary in their physical attributes—in particular, elevation, geo-graphical exposure, and size, as well as their position and spatial relation to other offices. School officials designed a serial-dictatorship matching protocol in which faculty members were ranked coarsely into four tiers according to career seniority, those with the greatest seniority choosing first, where the order of choice within each seniority level was determined by a random draw. Based on the resulting order, each faculty member was called upon in sequence to select an office from those remaining, having observed all preceding selections. After the selection process was completed, faculty were free to trade offices, and, additionally, were permitted to use transfers from their research budgets to facilitate trades.
In this environment, the externalities across agents can easily be mapped and separated into three layers of a social network. The first is institutional: the faculty members are divided into departments. The second social network is mapped using the past and current coauthorship links between faculty members. This network provides an alternative map of professional proximity, in which links between indi-viduals were not incumbent on institutional affiliation, but allowed to arise sponta-neously through a bilateral choice. Finally, making use of a survey, we map a third social network, the social interactions and friendships between faculty members.
Our analysis follows several stages. As a preliminary step, we estimate an array of discrete-choice models in which, at each decision node, a faculty member chooses from a menu of offices, and decides based on each office’s physical attributes, as well as the network characteristics at the time of choice (for example, the number of coauthors located nearby). If network effects play no role in choice, the correspond-ing network elements in our model should have no weight. All of our specifications generate significant network effects, however—in fact, the estimates suggest that net-work effects have an impact comparable to those of physical attributes. Nonetheless, this approach, while standard, is tantamount to assuming that faculty are myopic, ignoring the implications of their choices on their peers’ subsequent selections. In
2 Most existing work estimating peer effects elicits one layer of interactions (be it social, professional, or geo-graphical). In our study, we allow the data to speak as to which of the network layers matters and to what extent. For some related work, see Conley and Udry (2010), and Kremer and Miguel (2007), discussed in Section IB.
1775BACCARA ET AL.: MATCHINg WITH NETWORk ExTERNALITIESVOL. 102 NO. 5
that respect, while we reject the hypothesis that networks have no impact on choice, the magnitude of these effects should be interpreted carefully. This leads us to more closely inspect the dynamic and strategic aspects of the matching process.
In order to quantify the magnitudes of network sorting effects on outcomes, while accounting for the strategic aspects present during the matching process, we compare the observed assignment to a counterfactual in which faculty choose offices based only on physical attributes. Using the sequence in which faculty made decisions, we examine the outcomes that would result were faculty to locate solely on the basis of offices’ physical characteristics—for instance, preferring offices on higher floors to lower ones, larger offices to smaller ones, etc. Where faculty face a choice from a subset of offices with the same physical characteristics, we assume one office is chosen randomly from the subset. This allows us to simu-late the resulting network “clustering” (for several preference specifications over offices’ physical attributes) and compare it to that observed in the data.3 The results from this comparison suggest that office proximity among linked individuals (both at the floor and office-neighbor levels) occurs significantly more frequently in the observed assignment than in the simulated ones. Specifically, in the simulated assignments, members of the same department, coauthors, and friends are on the same floor at least 8 percent, 36 percent, and 30 percent less often than in our data, respectively. Similarly, proximity of office neighbors from every network layer were lower by 21–59 percent. From a general perspective, these results are illustra-tive, in both significance and magnitude, of the potential importance of network externalities on assignment outcomes.
Next, we disentangle the relative importance of each of the three network lay-ers. In particular, we are interested in separating the effects of the institutional net-work, generated by department affiliation, from the idiosyncratic choice networks, described by coauthorships and friendships.
As mentioned before, following the sequential choice process, faculty were allowed to exchange their allocated offices using transfers between their research budgets. This allows us to define a simple notion of stability pertaining to the final assignment (after all swaps were carried out). We say that an assignment is pairwise stable with transfers if there is no trade in office assignments between two faculty members that results, with a transfer, in an improvement for both faculty, keeping all other office assignments fixed. We show that pairwise-stable assignments exist when utilities are such that: (i) the effects of offices’ physical attributes are common across faculty and separable from network effects; and (ii) network effects are symmetric across linked individuals and separably addi-tive (for example, utilities depend linearly on the number of peers that are within the relevant neighborhood).4
Pairwise stability (with transfers) entails a sequence of constraints corresponding to all faculty pairs in our data. Using techniques developed recently for matching
3 This is sometimes referred to as a dartboard approach in the context of spatial econometrics, described in the literature review below.
4 This is interesting from a theoretical perspective. Indeed, the literature on matching with externalities has mostly concentrated on existence of stable outcomes. As discussed in the literature review, the difficulty arises due to the freedom one has in specifying beliefs over other players’ reactions upon deviation. Our notion essentially implies myopic beliefs about the swaps that ensue. This assures existence.

1776 THE AMERICAN ECONOMIC REVIEW AUgUST 2012
games without externalities (Bajari and Fox 2009; Fox 2008), we estimate utility parameters for each of our network layers. We find that the coauthorship network has a greater impact than both the institutional and the friendship networks, where we find the latter to have a negligible effect. Nonetheless, the interaction between coau-thorship and friendship has a sizeable effect on preferences. Beyond the relevance to the matching process per se, this observation highlights the importance of studying the appropriate network of connections when examining peer effects. From a meth-odological perspective, these estimations underscore the importance of accounting for strategic behavior in dynamic matching markets. Indeed, the relative magnitudes of our estimates are different than those we achieve using standard discrete-choice models, which, as stressed above, omit the forward-looking strategic aspects.
Given the significance of externalities in individuals’ utilities, it is interesting to contemplate the design of efficient assignments. In principle, designing the most efficient assignment is a complex problem due to the vast number of possible assign-ments (73! > 1 0 105 in our dataset).5 As it turns out, for a class of preferences allow-ing for network externalities (that encompasses those we estimate), the problem is a special case of the quadratic assignment problem (see Koopmans and Beckmann 1957). While generally difficult computationally, and subject of an active line of investigation in operations research, we show how new techniques, still unexploited in the economics literature, can be used to approximate an optimal assignment.
Under our assumptions that the utilities from offices’ physical attributes are shared across faculty and are separable from network characteristics, utilitarian effi-ciency is influenced only through the network effects present in our population. In fact, given our utility specification and the estimation results, any assignment that would increase the proximity of members from the different network layers would increase efficiency. Using our estimates for the relative preference weights of the different network variables, we can evaluate the efficiency of the matching protocol at hand. Namely, we identify an assignment that nearly triples welfare relative to the implemented assignment, achieving a 183 percent improvement in network utility. From a general institutional-design point of view, our analysis suggests the impor-tance of recognizing and accounting for the underlying networks of relevant con-nections when constructing assignment mechanisms, and illustrates computational techniques for doing so in practice.
I. Related Literature
The idea that externalities may play a crucial role in group formation appears in some of the recent theoretical work on cooperative games. The general setup of games that are often referred to as “partition function games” (Lucas and Thrall 1963; Myerson 1977) or “global games” (Gilboa and Lehrer 1991) presumes that players’ payoffs depend on the partition of the population. There are two general approaches that the literature takes. One strand focuses on core-like or Shapley-value notions in which a particular belief structure (pertaining to the entire population’s reaction to a coalitional deviation) is imposed (for example, Gilboa and Lehrer 1991; De Clippel
5 Furthermore, the presence of network externalities makes the problem significantly more intricate than those pertaining to well-known problems of assigning goods exhibiting complementarities (e.g., spectrum rights auctions).

1777BACCARA ET AL.: MATCHINg WITH NETWORk ExTERNALITIESVOL. 102 NO. 5
and Serrano 2008; Hafalir 2007). The goal of this literature is to provide conditions under which the relevant solution concept exists. The other line of work is more explicitly dynamic in that it proposes a particular “bargaining protocol” by which coalitions are formed, and analyzes the resulting set of equilibria in terms of effi-ciency and the pattern of emerging coalitions (see Bloch 1996; Maskin 2003; Ray and Vohra 1999; Yi 1997).
In the context of matching, Sasaki and Toda (1996) illustrate the large freedom in beliefs upon deviations, assuring the existence of stable matches for any pre-vailing preferences.6
Without externalities, there is a large body of theoretical work that studies hous-ing matching environments similar to ours (starting from Shapley and Scarf 1974, and more recently explored in, for example, Che and Gale 2009; Ehlers 2002; Pycia and Ünver 2010, and references therein).7
Empirically, while we are not aware of any studies quantifying the effects of network externalities in cooperative setups (matching environments in particu-lar), the idea that peers may affect behavior and outcomes has been explored in many realms (see, for instance, Jackson 2008, and Wasserman and Faust 1994 for references).8 In fact, recent field data suggest differential effects of multilayered networks on outcomes (see Conley and Udry 2010; Kremer and Miguel 2007). Another related strand of empirical work considers field performance of assign-ment mechanisms, without accounting for externalities (see Abdulkadiro g lu et al. 2006, and references therein).9
Methodologically, the dartboard approach used in Section IV to estimate the impact of network externalities on the observed bunching of connected faculty has been used in other empirical studies on spatial clustering (for instance, Ellison and Glaeser 1997, who use a similar approach to estimate geographic concentration of US manufacturing industries; see also Guimarães, Figueiredo, and Woodward 2009, and Head and Ries 2005 ). The estimations we perform in order to assess the relative magnitudes of the effects of the different layers of the underlying networks utilize identification techniques developed by Bajari and Fox (2010) and Fox (2010).
Finally, our welfare analysis involves finding the optimal solution for a quadratic assignment problem, which dates back to the specification of location assignments with externalities in Koopmans and Beckmann (1957). Solving this problem, which is nondeterministic polynomial-time hard (NP-hard), is a continuing area of research within the operations-research and combinatorics literatures.10
6 The matching literature has also considered different types of externalities in many-to-one matching envi-ronments in which agents (say, workers in a firm, or students in a school) care about the peers who are assigned with them (but not the entire population assignment). That literature focuses mostly on conditions under which particular notions of stability generate nonempty predictions. See Echenique and Yenmez (2007) and Pycia (2012) for details.
7 In the no-externalities world, there is also a budding literature studying decentralized dynamic matching games in which, similar to our setting, agents may consider other agents’ actions when deciding to commit to an irrevers-ible match (see Niederle and Yariv 2009).
8 Several recent papers have mapped friendship networks in order to test for their effects on behavior in experi-mental games (for example, Leider et al. 2010; and Goeree et al. 2010).
9 For anecdotal evidence on how office locations impact faculty interactions, see Kraut, Egido, and Galegher (1988).10 Loiola et al. (2007) provide an extensive list of references in the operations research literature, and Brandeau
and Chiu (1989) provide a general taxonomy for a planner’s location/assignment problem.
1778 THE AMERICAN ECONOMIC REVIEW AUgUST 2012
Several recent papers contain welfare assessments of assignments via random serial dictatorship without externalities. Manea (2007) characterizes subgame-perfect equilibrium outcomes of serial-dictatorship procedures for multiple objects, and finds that outcomes are not generically efficient, in contrast with the single-object case. Budish and Cantillon (forthcoming) analyze data from a university’s course-assignment process and find that the university’s manipulable mechanism provides an ex ante welfare improvement over the strategy-proof and ex post effi-cient random serial dictatorship.
Another assignment mechanism extensively studied in the literature is auc-tions. Bajari and Fox (2009) analyze the welfare loss in the sale of Federal Com-munications Commission (FCC) spectrum licenses via auctions after constructing estimates of license complementarities. Again, externalities across different bid-ders’ license assignments are assumed not to be present. Sönmez and Ünver (2010) discuss the welfare losses caused through auction mechanisms with endowment of fiat currency, demonstrating the failure of these markets over straightforward state-ments of ordinal preferences. Krishna and Ünver (2008) empirically analyze the results from course assignments with bidding, finding auctions inferior to a standard Gale-Shapley mechanism.
II. The Allocation Process
In this section, we describe the details of the matching protocol that was utilized, as well as the components of our dataset.
A. The Matching Protocol
In 2006, plans to renovate one building of a large US professional school were revealed to the faculty. The renovation would result in 74 vacant offices. Dean-level negotiations produced an initial list of 74 faculty members from four departments to occupy the new building.11
The assignment process used was a random serial-dictatorship procedure. As a first step, the school officials produced a coarse ranking of the 74 faculty mem-bers according to career seniority: priority was given first to chaired professors and department chairs, then full professors, followed by associate professors and, finally, assistant professors. The ordering of faculty within each group was deter-mined by a random draw administered by the dean’s office, under the supervision of department representatives.
Once the ranking was determined, the faculty members bound for the new build-ing received a memo providing the complete sequence, as well as instructions on how the process would unfold. These instructions indicated that all the office choices were to be conducted in one day. Each faculty member was able to see all the choices made up to the time of his/her own choice. Faculty members who could
11 Before the renovation, three different buildings housed the offices of the school’s faculty members, with departments assigned to different floors within these buildings.

1779BACCARA ET AL.: MATCHINg WITH NETWORk ExTERNALITIESVOL. 102 NO. 5
not be present on the day of the draft were asked to fill out a proxy form detailing their preferences.12
Faculty members were encouraged to make pre- and post-draft exchanges (prior to the draft, exchanges of rank numbers, and after the draft, exchanges of offices). Furthermore, faculty were allowed to use funds from their research accounts to facilitate both types of exchange. Indeed, while no ex ante draft-number trades took place, ex post trades involving seven offices occurred immediately following the draft. Specifically, there were three office changes observed after the initial assign-ment: (i) a bilateral swap; (ii) a swap triggered by one faculty member leaving the building, followed by a second faculty member taking his office, a third faculty member taking the office of the second, and a fourth faculty member taking the office of the third; (iii) a move of one faculty member to a vacant office. Both swaps (i) and (ii) involved research money transfers, while of course (iii) did not. We have detailed data regarding 73 of these faculty, which are the subject of our study.
B. The Assignment Data
We collected three types of data: data on office characteristics, population charac-teristics, and the matching process. We now describe these in turn.
Office Characteristics.—The building had housed one of the departments for many years prior to the renovation. Therefore, faculty members from that depart-ment had detailed information on the desirability of different offices. Moreover, before the office selections were made, the dean’s office provided detailed descrip-tions regarding office attributes to all faculty and encouraged them to tour the build-ing with its current tenants.
The top panel of Table 1 summarizes the characteristics of the available offices, which vary in floor, view, and size. The offices are located on the top five floors of an eight-floor building. Half of floor four and floors five, six, seven, and eight had undergone renovation.13 Each floor has offices that face east, west, and south.
In terms of size, there are three office types. The majority of offices are identi-cally sized (at about 213 square feet). These are the 56 offices facing either west or east, aligned on the two sides of a main corridor, on floors five, six, seven, and eight (accounting for 76 percent of all offices). Then there are eight large offices in the corners of the south sides of floors four through eight (corresponding to ten percent of all offices). These have an area of approximately 261 square feet and include an additional 20 square feet of closets. Finally, there are 10 smaller offices in the south sides of floors 4 through 8 that have an area of approximately 200 square feet. Since the offices are very similar in terms of size, the view was considered an important distinguishing characteristic. Faculty were told that the preferred views tend to be on the higher floors, and on the sides facing west and south (in high floors, the west- and south-exposed offices have open city views, while the east ones look onto a high-traffic artery). See Figure 2 for a graphic illustration of the offices’ spatial
12 Also, three offices were reserved for potential new hires, who were given numbers in the ranking similarly to the other faculty members. Department representatives were in charge of selecting those offices.
13 The lower floors and the other half of the fourth floor contain classrooms (and were not modified).

1780 THE AMERICAN ECONOMIC REVIEW AUgUST 2012
arrangement. In what follows, we will consider two offices to be in the same neigh-borhood if the distance between the office doors is shorter than 30 feet.14
Population Characteristics.—The bottom two panels of Table 1 contain the sum-mary statistics of our population, and Section III provides a detailed description of its characteristics. Faculty members’ attributes were collected using two sources:
(i) Web-harvested individual data on department, research cluster, arrival at the school, PhD cohort, coauthorship, education background, and gender.
(ii) Survey results. Faculty members were surveyed after the draft and the ex post trades took place. There were 36 completed survey respondents (50 percent of the total number of faculty members). The survey elicited information on the faculty’s social network as well as their preferences over the offices’ physical (floor, view, and size) and nonphysical (colleagues’ proximity) attributes. The respondents were also asked to assess the importance of each office attribute, keeping the other attributes constant.15
The Matching Process Data.—Our data contain the complete results from the matching process. In particular, besides the final assignment of offices after swaps,
14 The 30 feet figure is chosen to include offices that are at most two doors away on either side of the main cor-ridor. Since there are no offices directly in front of them, offices facing south have neighbors only on their own side of the corridor.
15 The complete list of questions asked in the survey and the aggregate responses are available in the online Appendix.
Table 1—Summary Statistics of Office and Population Characteristics
Variable Mean SD Min. Max. N
Office variables Large, corner office 0.10 0.30 0 1 73 Western exposure 0.38 0.49 0 1 Floor 6.40 1.24 4 8
Faculty variables Years since PhD 13.45 11.13 0 37 73 Years since joining school 9.38 8.79 0 35 Female 0.21 0.41 0 1 Coauthors 1.56 1.63 0 6 Lunches 2.5 2.34 0 9 54 Social events 0.94 1.22 0 4 Friends 2.86 2.47 0 9 Coauthors and not-friends 0.81 1.01 0 3 Coauthors and friends 0.97 1.32 0 4 Department links 18.6 5.21 12 25 73 Research cluster links 5.32 2.31 0 8
Institutional variables Departments 18.25 5.73 13 26 4 Research clusters 4.87 2.90 1 9 15
Notes: Lunches refers to colleagues with whom survey respondents report having regular lunches in Question 6 of the survey. Social events refers to colleagues with whom survey respondents report meeting socially outside school in Question 8 of the survey.
1781BACCARA ET AL.: MATCHINg WITH NETWORk ExTERNALITIESVOL. 102 NO. 5
for every choice made we know the set of faculty who had already chosen an office, how the partial assignment looked at the time of choice, and the remaining faculty who still had to make a choice.
III. The Underlying Networks
Individuals interact in different spheres. Since the location of an office may affect one’s quality of work life on both purely social and purely intellectual levels, we elic-ited peer connections on three dimensions: institutional links, determined according to the department or research cluster each faculty belongs to; coauthorship links; and friendship links. Below, we describe each of these layers of the network of con-nections and the correlations between them.
A. Institutional Network
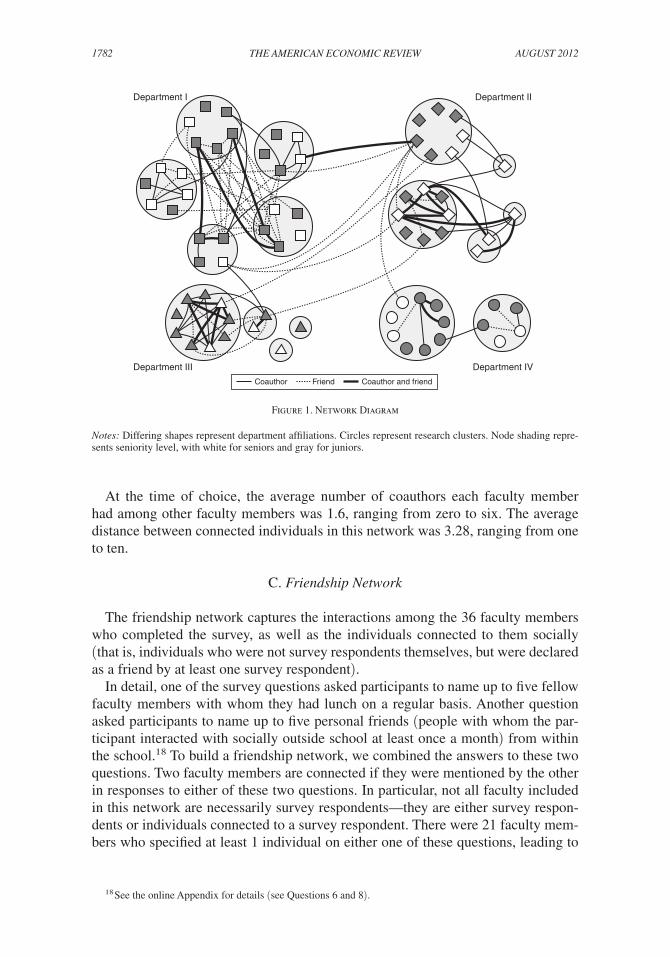
The first network we consider addresses the research interests of faculty mem-bers, dividing them according to their research fields. The 73 faculty members are divided into 4 departments according to main research fields. Each department is further divided into research clusters according to subfields, resulting in a total of 15 clusters. The average department contains 18.25 individuals (with a range of 13 to 26 members). The average cluster size contains approximately five individuals (with a range of one to nine members). The research network appears in Figure 1. In the figure, each node’s shape corresponds to a particular research department, where each of the four departments is located in a different quadrant. Nodes are encircled in a shaded circle if they belong to the same research cluster. In both the Department and Research Cluster networks all individuals are connected to one another, so each component in these networks is complete (in particular, the aver-age distance16 within a connected component is 1).17 In all our results, we focus on the institutional network defined by the departments alone. Using research clusters in addition to or instead of departments does not change any of the results or the utilized methodology qualitatively.
B. Coauthorship Network
The second network encapsulates professional interactions among faculty, as cap-tured by the existence of coauthored work. This network has been constructed by combining web-harvested and survey data. Two faculty members are considered connected if they coauthored at least one paper together in the past or are currently collaborating on a project (the latter element declared in survey responses). The coauthorship network is described by the solid lines between nodes (both bold and faint) in Figure 1.
16 The distance between two nodes is defined as the number of links on the shortest path in the network connect-ing the two nodes.
17 Moreover, we distinguish the faculty seniority levels in Figure 1 using the shading of nodes (white for senior faculty and gray for junior faculty).
1782 THE AMERICAN ECONOMIC REVIEW AUgUST 2012
At the time of choice, the average number of coauthors each faculty member had among other faculty members was 1.6, ranging from zero to six. The average distance between connected individuals in this network was 3.28, ranging from one to ten.
C. Friendship Network
The friendship network captures the interactions among the 36 faculty members who completed the survey, as well as the individuals connected to them socially (that is, individuals who were not survey respondents themselves, but were declared as a friend by at least one survey respondent).
In detail, one of the survey questions asked participants to name up to five fellow faculty members with whom they had lunch on a regular basis. Another question asked participants to name up to five personal friends (people with whom the par-ticipant interacted with socially outside school at least once a month) from within the school.18 To build a friendship network, we combined the answers to these two questions. Two faculty members are connected if they were mentioned by the other in responses to either of these two questions. In particular, not all faculty included in this network are necessarily survey respondents—they are either survey respon-dents or individuals connected to a survey respondent. There were 21 faculty mem-bers who specified at least 1 individual on either one of these questions, leading to
18 See the online Appendix for details (see Questions 6 and 8).
Figure 1. Network Diagram
Notes: Differing shapes represent department affiliations. Circles represent research clusters. Node shading repre-sents seniority level, with white for seniors and gray for juniors.
Department I Department II
Department III Department IV
Coauthor Friend Coauthor and friend
1783BACCARA ET AL.: MATCHINg WITH NETWORk ExTERNALITIESVOL. 102 NO. 5
54 extended survey participants who compose the friendship network. We stress that survey respondents who did not specify colleagues’ names answering the above questions could either (i) not have any social interactions with other members of the faculty, or (ii) have social interactions they prefer not to disclose in the survey.
This generates the network given by the dotted and bold line connections in Figure 1.19 We assume links are bidirectional. Indeed, the survey questions described above were phrased so that individuals were specifically asked to report the frequency of interactions (lunches or social events outside the school) that are inherently symmetric.20, 21
As reported in Table 1, the survey respondents are reported to have an average of 0.9 individuals (ranging from zero to four) with whom they interact socially outside the school, and 2.5 colleagues with whom they regularly have lunch (ranging from zero to nine). The average degree in the friendship network is 2.9, ranging from 0 to 9, and the average distance between individuals is 4.91, ranging from 1 to 12. Moreover, simple regression analysis reveals that the faculty members who filled out the survey do not exhibit significantly different observable attributes from those who did not.22
D. Overlap of Networks
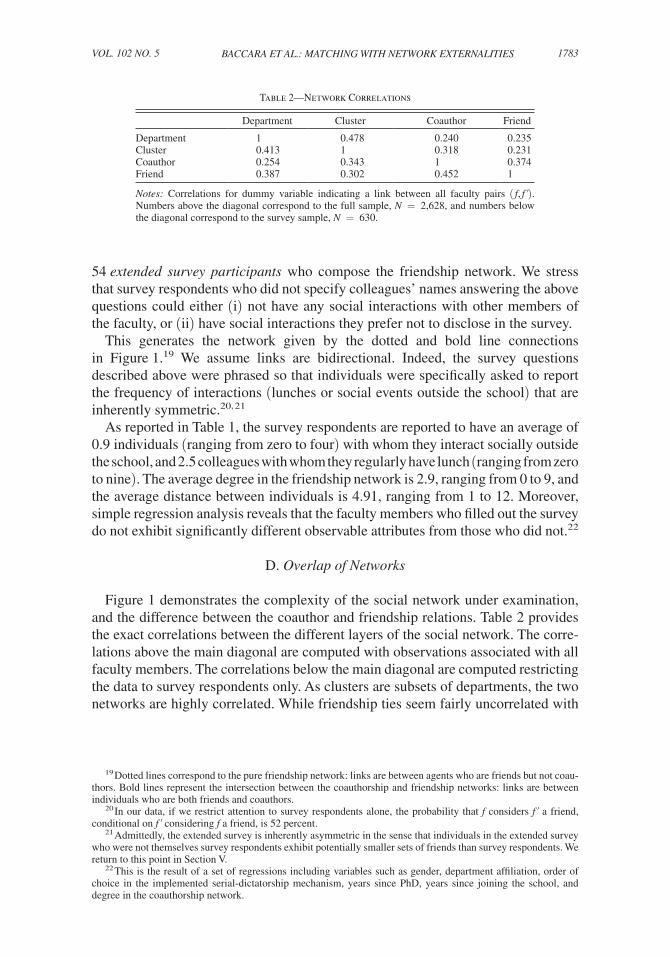
Figure 1 demonstrates the complexity of the social network under examination, and the difference between the coauthor and friendship relations. Table 2 provides the exact correlations between the different layers of the social network. The corre-lations above the main diagonal are computed with observations associated with all faculty members. The correlations below the main diagonal are computed restricting the data to survey respondents only. As clusters are subsets of departments, the two networks are highly correlated. While friendship ties seem fairly uncorrelated with
19 Dotted lines correspond to the pure friendship network: links are between agents who are friends but not coau-thors. Bold lines represent the intersection between the coauthorship and friendship networks: links are between individuals who are both friends and coauthors.
20 In our data, if we restrict attention to survey respondents alone, the probability that f considers f ′ a friend, conditional on f ′ considering f a friend, is 52 percent.
21 Admittedly, the extended survey is inherently asymmetric in the sense that individuals in the extended survey who were not themselves survey respondents exhibit potentially smaller sets of friends than survey respondents. We return to this point in Section V.
22 This is the result of a set of regressions including variables such as gender, department affiliation, order of choice in the implemented serial-dictatorship mechanism, years since PhD, years since joining the school, and degree in the coauthorship network.
Table 2—Network Correlations
Department Cluster Coauthor Friend
Department 1 0.478 0.240 0.235Cluster 0.413 1 0.318 0.231Coauthor 0.254 0.343 1 0.374Friend 0.387 0.302 0.452 1
Notes: Correlations for dummy variable indicating a link between all faculty pairs ( f, f ′). Numbers above the diagonal correspond to the full sample, N = 2,628, and numbers below the diagonal correspond to the survey sample, N = 630.

1784 THE AMERICAN ECONOMIC REVIEW AUgUST 2012
department and cluster links, they are correlated with coauthorship ties. We account for this correlation throughout our analysis.23
E. Existence of Network Effects in Office Selection
The choice made by each faculty member during the matching process could be influenced both by the office’s physical attributes (floor, exposure, size), as well as the choices made (or expected to be made) by others. Figure 2 describes the out-come of the matching process (after ex post trades took place), with dotted lines
23 We note that the preferences over physical office characteristics stated in the survey are not significantly cor-related within any of the networks (for example, department affiliation does not help to predict these preferences).
Floor 8
Floor 7
Floor 6
Floor 5
Floor 4
Coauthor Friend Coauthor and friend
Figure 2. The Observed Assignment
Notes: Differing shapes represent department affiliations. Circles represent research clusters. Node shading repre-sents seniority level, with white for seniors and gray for juniors.
1785BACCARA ET AL.: MATCHINg WITH NETWORk ExTERNALITIESVOL. 102 NO. 5
representing the friendship links within a floor, faint solid lines the coauthorship links, and bold solid lines the intersection of both network links. In particular, the figure represents the final spatial assignment by floor, with nodes placed schemati-cally at the doorways of the chosen offices.
We start our investigation by assessing the null hypothesis that network exter-nalities are not taken into consideration during office selection. As a first take, we consider the discrete choice each faculty is facing. Each observation in our sample corresponds to a pair ( f, o), where f is a faculty member and o is an office avail-able to this faculty member at her time of choice. We specify an array of models in which choices are explained by variables corresponding to both physical and network characteristics. Such an approach is inherently nonstrategic in that we do not take into account forward-looking strategic aspects that are potentially present if network effects are at play (in particular, the approach does not allow us to quantify the effects of externalities). Regardless, note that if the null hypothesis that network externalities are irrelevant to choice holds, any coefficient pertaining to network variables should not be significantly different from 0.
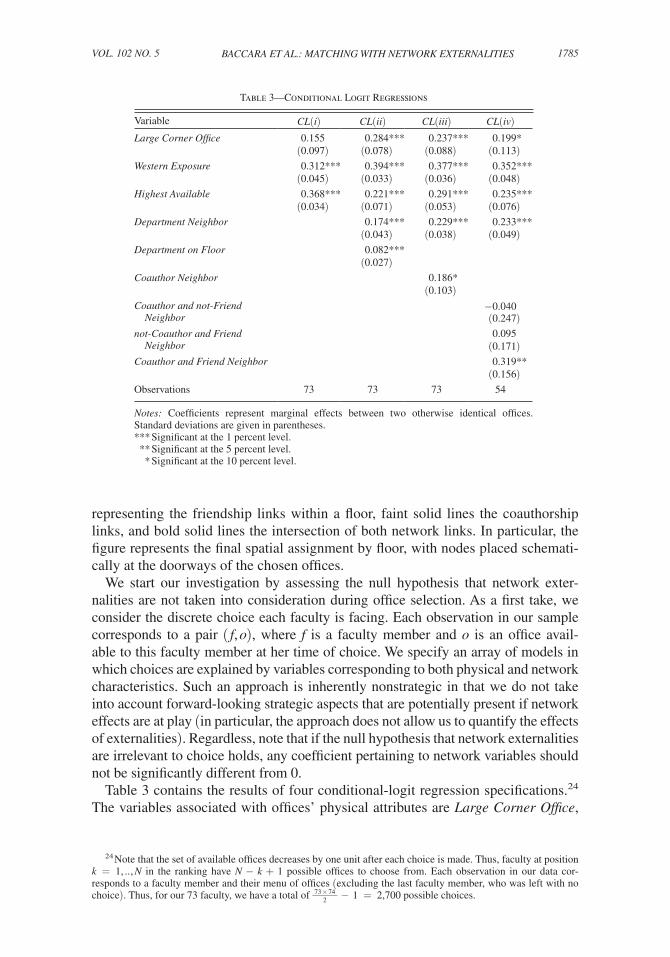
Table 3 contains the results of four conditional-logit regression specifications.24 The variables associated with offices’ physical attributes are Large Corner Office,
24 Note that the set of available offices decreases by one unit after each choice is made. Thus, faculty at position k = 1, .. , N in the ranking have N − k + 1 possible offices to choose from. Each observation in our data cor-responds to a faculty member and their menu of offices (excluding the last faculty member, who was left with no choice). Thus, for our 73 faculty, we have a total of 73 × 74
_ 2 − 1 = 2,700 possible choices.
Table 3—Conditional Logit Regressions
Variable CL(i) CL(ii) CL(iii) CL(iv)Large Corner Office 0.155 0.284*** 0.237*** 0.199*
(0.097) (0.078) (0.088) (0.113)Western Exposure 0.312*** 0.394*** 0.377*** 0.352***
(0.045) (0.033) (0.036) (0.048)Highest Available 0.368*** 0.221*** 0.291*** 0.235***
(0.034) (0.071) (0.053) (0.076)Department Neighbor 0.174*** 0.229*** 0.233***
(0.043) (0.038) (0.049)Department on Floor 0.082***
(0.027)Coauthor Neighbor 0.186*
(0.103)Coauthor and not-Friend −0.040 Neighbor (0.247)not-Coauthor and Friend 0.095 Neighbor (0.171)Coauthor and Friend Neighbor 0.319**
(0.156)Observations 73 73 73 54
Notes: Coefficients represent marginal effects between two otherwise identical offices. Standard deviations are given in parentheses.*** Significant at the 1 percent level. ** Significant at the 5 percent level. * Significant at the 10 percent level.

1786 THE AMERICAN ECONOMIC REVIEW AUgUST 2012
Western Exposure, and Highest Available (which are the corresponding dummy variables for the respective characteristics). The rest of the variables are associated with the department, coauthorship, and friendship networks. Specifically, con-sider an observation pertaining to a particular faculty-office pair ( f, o). Department Neighbor is a count of the number of offices neighboring o that are already taken by another member of f ’s department before his/her turn in the sequence; Department Floor indicates the number of individuals in f ’s department that were present on the floor corresponding to o at the time of choice. Similarly, Coauthor Neighbor is an integer variable representing the number of neighboring offices close to o that have been taken by faculty members with coauthor ties to f at the time of choice. Similarly, Coauthor and not-Friend Neighbor, not-Coauthor and Friend Neighbor, and Coauthor and Friend Neighbor represent the counts of faculty members that are coauthors but not friends, friends but not coauthors, and both friends and coauthors, respectively, in offices neighboring o at the time of choice.
Throughout all the specifications of Table 3, the coefficients measure the mar-ginal increase in the probability of an office being selected as a result of a unit increase in the variable under consideration. For example, in the first specifica-tion, denoted CL(i), we include only the physical attributes of offices. Given two offices that differ only in their exposure, the office with the western exposure is 31.2 percent more likely to be selected. In the subsequent specifications, denoted CL(ii)–CL(iv), we introduce the variables associated with network externalities.25 Network variables have significant explanatory power. For instance, each addi-tional coauthor located in a neighboring office raises the probability of an office being selected by 19 percent.
The results of these specifications provide two main insights. First, network variables’ coefficients are positive and, at the neighborhood level, significantly different from zero at any reasonable confidence level.26 In particular, we reject the null hypothesis that network externalities did not influence faculty’s office choices. Second, the regressions suggest the importance of accounting for net-work effects when estimating such matching processes. Indeed, the coefficients corresponding to offices’ physical attributes change significantly when we include network variables. Note that these coefficients respond in different ways to the omission of network variables: the effects of large corner offices are underesti-mated in CL(i) relative to CL(iii) since faculty choose offices close to colleagues even when large offices are available; the effects of highest floor are overestimated in CL(i) relative to CL(iii), suggesting that faculty may be choosing higher floors to be in proximity to particular colleagues, rather than out of a preference for higher floors per se.27
25 Specifications CL(ii–iv) were chosen to correspond to our ensuing specifications in Section V. The last specification, CL(iv), is restricted to faculty who have links in our friendship network, and as such pertains to fewer observations.
26 The joint hypothesis that the network variables are all zero in specifications CL(ii–iv) is rejected at the 99.9 percent level.
27 In principle, there could be instances in which physical characteristics of an office are correlated with network attributes (for instance, corner offices are by geography more isolated than others). When controlling for offices’ spatial arrangement by including offices’ number of neighbors and a corner office dummy, we find no significant effects associated with these variables.
1787BACCARA ET AL.: MATCHINg WITH NETWORk ExTERNALITIESVOL. 102 NO. 5
We stress that given the significant network effects, the magnitudes of the coeffi-cients we estimate need to be interpreted cautiously. Indeed, when network effects are present, individuals making choices within the serial-dictatorship protocol may consider future choices of others, making the conditional logit specification problematic. With that caveat, the results reported in Table 3 are useful in two respects. First, as we have discussed, they illustrate the existence of network effects in choices. Second, they provide a methodological baseline for our investigation since conditional logit analysis is common in studies such as ours. In what fol-lows, we estimate the extent to which network effects impacted final outcomes. When these effects turn out to be important, we introduce new techniques for esti-mating preferences, accounting for strategic motives present in the mechanism under consideration.
IV. Dartboard Approach: Network Effects and Outcomes
The exploratory regressions discussed in Section III suggest the existence of nontrivial effects of network externalities on individual choices. In order to assess the magnitude of these effects on outcomes, we start by considering counterfactual assignment procedures that do not account for any observable externalities and com-pare the degree to which such procedures generate network proximity relative to that observed in our data. Put differently, we assess to what extent a random assignment based on purely physical office attributes can explain the observed patterns of social connection, accounting for the mechanism in place (namely, the order in which faculty chose offices). We consider three benchmarks that differ in the prevailing faculty preferences for offices.
In our first specification, denoted CF(i), we consider all offices equivalent, so that at each stage, faculty choose one of the available offices at random. In specifica-tion CF(ii), we assume that each faculty has a lexicographic preference in which large corner offices are valued most, followed by western-exposure offices, followed by higher offices.28 Again, within each class of offices, faculty randomly select an office. In the third specification, denoted CF(iii), we suppose faculty have prefer-ences as in our discrete-choice model CL(i) in Table 3, where the probability of choosing any office is determined by the set of available offices, and the physical characteristics of those offices.29
For each of the specifications, we used the order in which faculty chose to simu-late the random-matching procedure 1 0 5 times. For every set of simulations, we considered the three network layers: institutional affiliation (captured by depart-ments), coauthorship, and friendship (encapsulating the connections determined through social interaction or lunch companionship, as described in Section II). We calculated the resulting average volume of faculty from each network in a faculty’s macro-neighborhood (the floor of their office) and their micro-neighborhood (the
28 The preference for higher offices over lower ones is consistent with survey results. Indeed, in the survey, 86 percent of respondents declared the top floors, floors 6–8, as their most preferred, and 83 percent declared the bottom floors, floors 4–5, as their least preferred. The assumption that faculty prefer larger offices to smaller ones and offices with city views to large road views seem natural first steps.
29 That is, the simulated choice probability for office i within choice set C is given by e x i β _ ∑ j∈ C e j x β
, where the values for β are obtained from the CL(i) in Table 3.
1788 THE AMERICAN ECONOMIC REVIEW AUgUST 2012
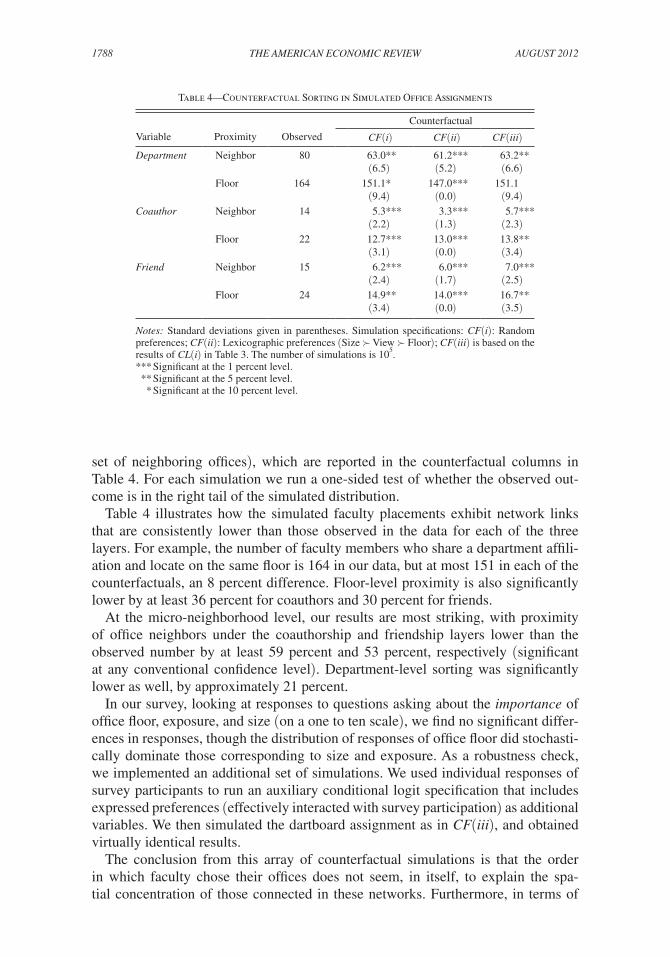
set of neighboring offices), which are reported in the counterfactual columns in Table 4. For each simulation we run a one-sided test of whether the observed out-come is in the right tail of the simulated distribution.
Table 4 illustrates how the simulated faculty placements exhibit network links that are consistently lower than those observed in the data for each of the three layers. For example, the number of faculty members who share a department affili-ation and locate on the same floor is 164 in our data, but at most 151 in each of the counterfactuals, an 8 percent difference. Floor-level proximity is also significantly lower by at least 36 percent for coauthors and 30 percent for friends.
At the micro-neighborhood level, our results are most striking, with proximity of office neighbors under the coauthorship and friendship layers lower than the observed number by at least 59 percent and 53 percent, respectively (significant at any conventional confidence level). Department-level sorting was significantly lower as well, by approximately 21 percent.
In our survey, looking at responses to questions asking about the importance of office floor, exposure, and size (on a one to ten scale), we find no significant differ-ences in responses, though the distribution of responses of office floor did stochasti-cally dominate those corresponding to size and exposure. As a robustness check, we implemented an additional set of simulations. We used individual responses of survey participants to run an auxiliary conditional logit specification that includes expressed preferences (effectively interacted with survey participation) as additional variables. We then simulated the dartboard assignment as in CF(iii), and obtained virtually identical results.
The conclusion from this array of counterfactual simulations is that the order in which faculty chose their offices does not seem, in itself, to explain the spa-tial concentration of those connected in these networks. Furthermore, in terms of
Table 4—Counterfactual Sorting in Simulated Office Assignments
Counterfactual
Variable Proximity Observed CF(i) CF(ii) CF(iii)Department Neighbor 80 63.0** 61.2*** 63.2**
(6.5) (5.2) (6.6)Floor 164 151.1* 147.0*** 151.1
(9.4) (0.0) (9.4)Coauthor Neighbor 14 5.3*** 3.3*** 5.7***
(2.2) (1.3) (2.3)Floor 22 12.7*** 13.0*** 13.8**
(3.1) (0.0) (3.4)Friend Neighbor 15 6.2*** 6.0*** 7.0***
(2.4) (1.7) (2.5)Floor 24 14.9** 14.0*** 16.7**
(3.4) (0.0) (3.5)
Notes: Standard deviations given in parentheses. Simulation specifications: CF(i): Random preferences; CF(ii): Lexicographic preferences (Size ≻ View ≻ Floor); CF(iii) is based on the results of CL(i) in Table 3. The number of simulations is 1 0 5 .*** Significant at the 1 percent level. ** Significant at the 5 percent level. * Significant at the 10 percent level.
1789BACCARA ET AL.: MATCHINg WITH NETWORk ExTERNALITIESVOL. 102 NO. 5
outcomes, the differences between procedures that disregard network attributes and those observed in the data is substantial.
In comparison with the discrete-choice models assessed in Table 3, the results in this section illustrate the potential importance of network externalities in determining outcomes. They do not, however, allow us to back out the preferences of partici-pants. Most importantly, the dartboard technique does not allow us to disentangle the differential effects from each of the different networks on agents’ choices. This is so for two reasons: First, since the different layers of the social networks are correlated, cross-layer comparisons of the dartboard approach results cannot be associated directly with agents’ utility. Second, because of the strategic nature of the matching process, significant differences in how agents perceive the different layers of the social networks may result in small differences in the counterfactual estimates based on outcomes, and vice versa.
V. Estimating the Relative Effects of Different Networks
The previous two sections motivated the importance of networks to the office selec-tion mechanism. In particular, they make the case that externalities matter. In this section, we seek to disentangle the relative importance of each of the three layers on office choice: the department affiliation, the coauthorship network, and the friendship network. In particular, we are interested in separating the effects of the institutional network generated by membership in a department from those of the spontaneous networks based on coauthorship and friendship.
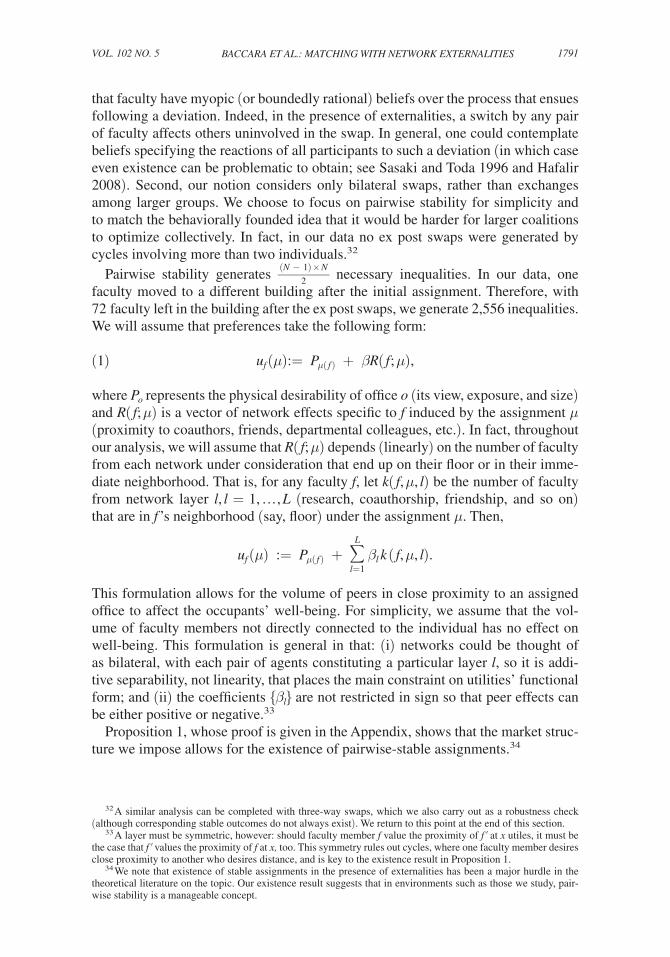
In principle, the mechanism used for allocating offices defines an extensive-form game. Assume that agents’ preferences take some functional form allowing for the weight placed on each network and each physical office characteristic to be param-etrized. Then, for any parameter value, there would be a corresponding set of equi-libria of the assignment mechanism. In principle, this approach would allow us to select the parameters that best match our data. Note, however, that strategies in this game are contingent plans that specify, for each agent, an office selection that depends on the entire history of choices made by all predecessors. Since our dataset contains 72 faculty members who have a nontrivial choice, the set of strategies is vast and finding parametric equilibria profiles is not computationally feasible.30
In order to overcome this computational difficulty and still exploit the strategic elements inherent in the matching process, we focus on natural restrictions on the final assignment, using the fact that faculty members were allowed to swap offices after the draft was completed, and that monetary transfers across research accounts were allowed to facilitate such swaps. In what follows, we assume that the transfers were not subject to budget constraints. Indeed, all faculty were allotted identical budget allocations and were allowed to borrow against future years’ provisions. Therefore, once the assignment has been determined (after all ex post office swaps had been carried out), we can assume that there are no remaining beneficial swaps;
30 The computation of the set of Nash equilibria requires a factorial time algorithm. In fact, for N faculty mem-bers, the number of edges of the extensive-form game is
N + N (N − 1) + ⋯ + N! _ 2!
+ N! _ 1!
= N! ∑ j=1
N−1
1 _ j!
≈ N!(e − 1) − 1.
1790 THE AMERICAN ECONOMIC REVIEW AUgUST 2012
that is, the assignment is stable. In the spirit of Bajari and Fox (2009) and Fox (2008), we require that no two faculty would benefit from exchanging offices (accounting for network effects derived from such an exchange) regardless of the monetary transfers between them. This requirement provides us with a manageable set of restrictions that allows for preference estimation.
A. Stability with Externalities
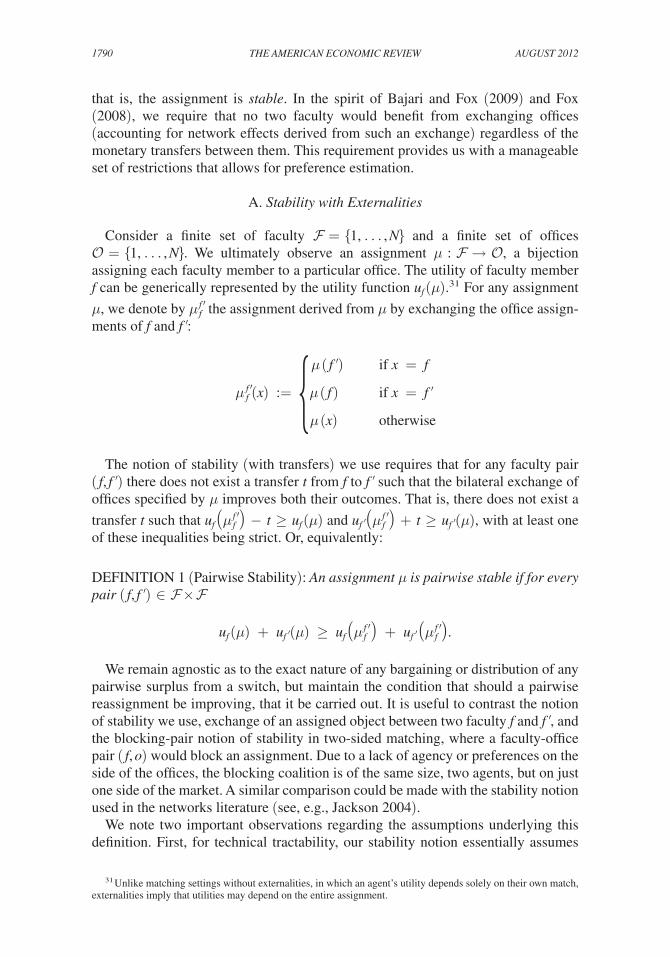
Consider a finite set of faculty = {1, … , N} and a finite set of offices = {1, … , N}. We ultimately observe an assignment μ : → , a bijection assigning each faculty member to a particular office. The utility of faculty member f can be generically represented by the utility function u f (μ).31 For any assignment
μ, we denote by μ f f ′ the assignment derived from μ by exchanging the office assign-ments of f and f ′:
μ ( f ′ ) if x = f
μ f f ′(x) := { μ ( f ) if x = f ′
μ (x) otherwise
The notion of stability (with transfers) we use requires that for any faculty pair ( f, f ′ ) there does not exist a transfer t from f to f ′ such that the bilateral exchange of offices specified by μ improves both their outcomes. That is, there does not exist a
transfer t such that u f ( μ f f ′ ) − t ≥ u f (μ) and u f ′ ( μ f f ′ ) + t ≥ u f ′ (μ), with at least one of these inequalities being strict. Or, equivalently:
DEFINITION 1 (Pairwise Stability): An assignment μ is pairwise stable if for every pair ( f, f ′ ) ∈ ×
u f (μ) + u f ′ (μ) ≥ u f ( μ f f ′ ) + u f ′ ( μ f f ′ ).
We remain agnostic as to the exact nature of any bargaining or distribution of any pairwise surplus from a switch, but maintain the condition that should a pairwise reassignment be improving, that it be carried out. It is useful to contrast the notion of stability we use, exchange of an assigned object between two faculty f and f ′, and the blocking-pair notion of stability in two-sided matching, where a faculty-office pair ( f, o) would block an assignment. Due to a lack of agency or preferences on the side of the offices, the blocking coalition is of the same size, two agents, but on just one side of the market. A similar comparison could be made with the stability notion used in the networks literature (see, e.g., Jackson 2004).
We note two important observations regarding the assumptions underlying this definition. First, for technical tractability, our stability notion essentially assumes
31 Unlike matching settings without externalities, in which an agent’s utility depends solely on their own match, externalities imply that utilities may depend on the entire assignment.
1791BACCARA ET AL.: MATCHINg WITH NETWORk ExTERNALITIESVOL. 102 NO. 5
that faculty have myopic (or boundedly rational) beliefs over the process that ensues following a deviation. Indeed, in the presence of externalities, a switch by any pair of faculty affects others uninvolved in the swap. In general, one could contemplate beliefs specifying the reactions of all participants to such a deviation (in which case even existence can be problematic to obtain; see Sasaki and Toda 1996 and Hafalir 2008). Second, our notion considers only bilateral swaps, rather than exchanges among larger groups. We choose to focus on pairwise stability for simplicity and to match the behaviorally founded idea that it would be harder for larger coalitions to optimize collectively. In fact, in our data no ex post swaps were generated by cycles involving more than two individuals.32
Pairwise stability generates (N − 1) × N
_ 2 necessary inequalities. In our data, one faculty moved to a different building after the initial assignment. Therefore, with 72 faculty left in the building after the ex post swaps, we generate 2,556 inequalities. We will assume that preferences take the following form:
(1) u f (μ):= P μ( f ) + βR( f ; μ),
where P o represents the physical desirability of office o (its view, exposure, and size) and R( f; μ) is a vector of network effects specific to f induced by the assignment μ (proximity to coauthors, friends, departmental colleagues, etc.). In fact, throughout our analysis, we will assume that R( f; μ) depends (linearly) on the number of faculty from each network under consideration that end up on their floor or in their imme-diate neighborhood. That is, for any faculty f, let k( f, μ, l) be the number of faculty from network layer l, l = 1, … , L (research, coauthorship, friendship, and so on) that are in f ’s neighborhood (say, floor) under the assignment μ. Then,
u f (μ) := P μ( f ) + ∑ l=1
L
β l k ( f, μ, l).
This formulation allows for the volume of peers in close proximity to an assigned office to affect the occupants’ well-being. For simplicity, we assume that the vol-ume of faculty members not directly connected to the individual has no effect on well-being. This formulation is general in that: (i) networks could be thought of as bilateral, with each pair of agents constituting a particular layer l, so it is addi-tive separability, not linearity, that places the main constraint on utilities’ functional form; and (ii) the coefficients { β l } are not restricted in sign so that peer effects can be either positive or negative.33
Proposition 1, whose proof is given in the Appendix, shows that the market struc-ture we impose allows for the existence of pairwise-stable assignments.34
32 A similar analysis can be completed with three-way swaps, which we also carry out as a robustness check (although corresponding stable outcomes do not always exist). We return to this point at the end of this section.
33 A layer must be symmetric, however: should faculty member f value the proximity of f ′ at x utiles, it must be the case that f ′ values the proximity of f at x, too. This symmetry rules out cycles, where one faculty member desires close proximity to another who desires distance, and is key to the existence result in Proposition 1.
34 We note that existence of stable assignments in the presence of externalities has been a major hurdle in the theoretical literature on the topic. Our existence result suggests that in environments such as those we study, pair-wise stability is a manageable concept.
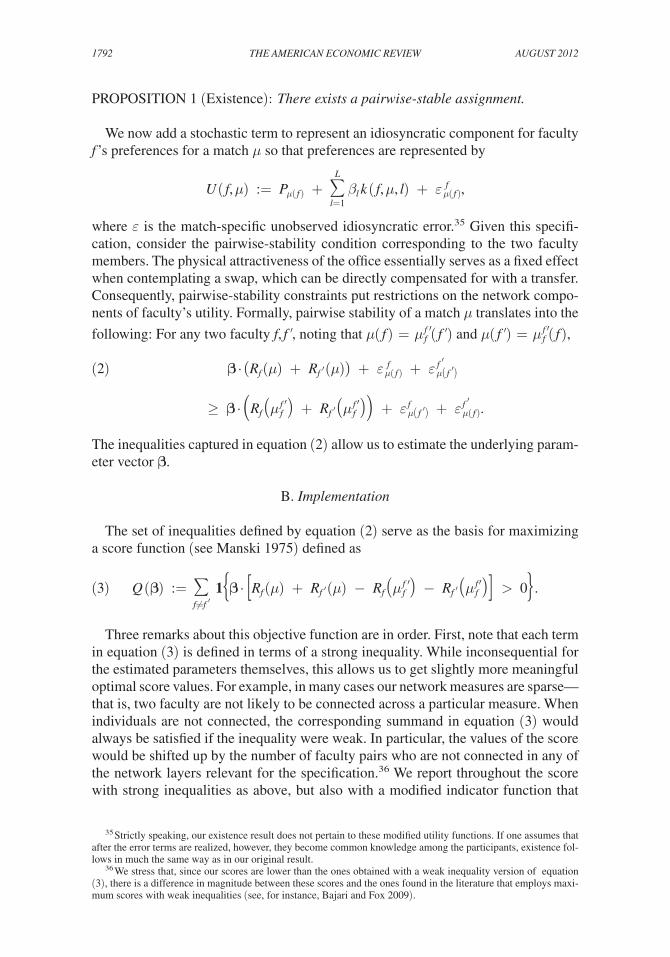
1792 THE AMERICAN ECONOMIC REVIEW AUgUST 2012
PROPOSITION 1 (Existence): There exists a pairwise-stable assignment.
We now add a stochastic term to represent an idiosyncratic component for faculty f ’s preferences for a match μ so that preferences are represented by
U ( f, μ) := P μ( f ) + ∑ l=1
L
β l k ( f, μ, l) + ε μ( f ) f ,
where ε is the match-specific unobserved idiosyncratic error.35 Given this specifi-cation, consider the pairwise-stability condition corresponding to the two faculty members. The physical attractiveness of the office essentially serves as a fixed effect when contemplating a swap, which can be directly compensated for with a transfer. Consequently, pairwise-stability constraints put restrictions on the network compo-nents of faculty’s utility. Formally, pairwise stability of a match μ translates into the
following: For any two faculty f, f ′, noting that μ( f ) = μ f f ′( f ′ ) and μ( f ′ ) = μ f f ′( f ),
(2) β ⋅ ( R f (μ) + R f ′ (μ)) + ε μ( f ) f + ε μ( f ′ ) f ′
≥ β ⋅ ( R f ( μ f f ′ ) + R f ′ ( μ f f ′ )) + ε μ( f ′ ) f + ε μ( f ) f ′ .
The inequalities captured in equation (2) allow us to estimate the underlying param-eter vector β.
B. Implementation
The set of inequalities defined by equation (2) serve as the basis for maximizing a score function (see Manski 1975) defined as
(3) Q (β) := ∑ f≠ f ′
1 { β ⋅ [ R f (μ) + R f ′ (μ) − R f ( μ f f ′ ) − R f ′ ( μ f f ′ )] > 0} .Three remarks about this objective function are in order. First, note that each term
in equation (3) is defined in terms of a strong inequality. While inconsequential for the estimated parameters themselves, this allows us to get slightly more meaningful optimal score values. For example, in many cases our network measures are sparse—that is, two faculty are not likely to be connected across a particular measure. When individuals are not connected, the corresponding summand in equation (3) would always be satisfied if the inequality were weak. In particular, the values of the score would be shifted up by the number of faculty pairs who are not connected in any of the network layers relevant for the specification.36 We report throughout the score with strong inequalities as above, but also with a modified indicator function that
35 Strictly speaking, our existence result does not pertain to these modified utility functions. If one assumes that after the error terms are realized, however, they become common knowledge among the participants, existence fol-lows in much the same way as in our original result.
36 We stress that, since our scores are lower than the ones obtained with a weak inequality version of equation (3), there is a difference in magnitude between these scores and the ones found in the literature that employs maxi-mum scores with weak inequalities (see, for instance, Bajari and Fox 2009).
1793BACCARA ET AL.: MATCHINg WITH NETWORk ExTERNALITIESVOL. 102 NO. 5
assigns value 1/2 to pairs satisfying the condition with equality, and value 1 to those associated with a strong inequality.
Second, instead of maximizing the score Q(β), one can consider a smoothed ver-sion of the score, a là Horowitz (1992), which would be continuous and amenable to differential methods of optimization and would produce a point estimate. The point identification assumptions required for smoothed scores are similar to those required in the Manski score setup, however, and rely on data covariates being continuously distributed. Therefore, although the procedure would produce a point estimate, results would depend heavily on the smoothing function used and would not be asymptotically consistent for an arbitrary smoothing function.
The advantages of the objective given in equation (3) are threefold: First, the objective is computationally simple. Second, although we do not meet the condi-tions required for asymptotic point identification, the boundaries of the estimated intervals are identified. Third, the score specification is robust to heteroskedasticity of the match-specific errors, which seems important in this setting.37
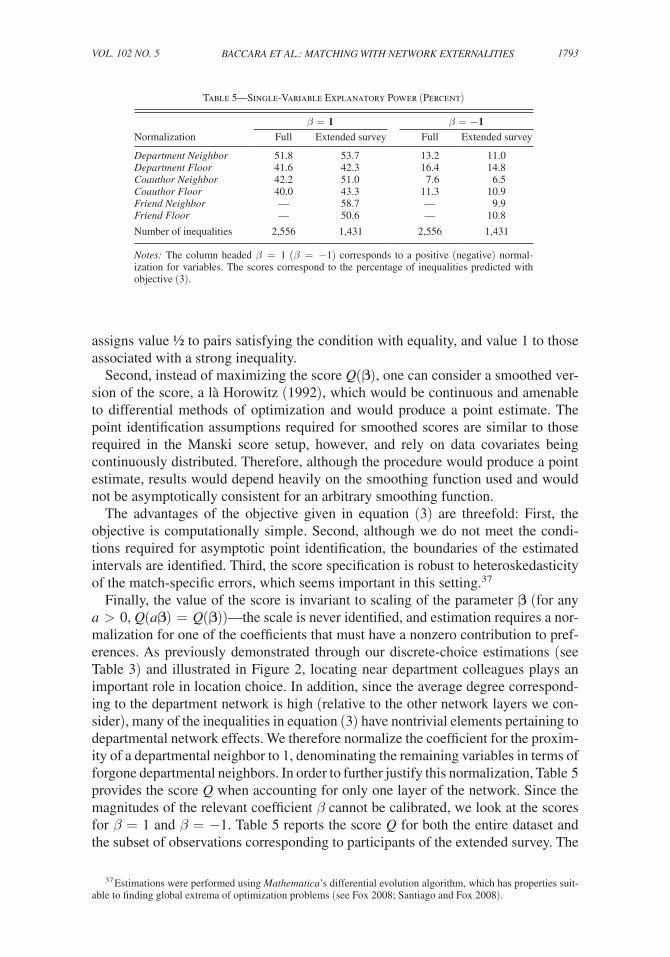
Finally, the value of the score is invariant to scaling of the parameter β (for any a > 0, Q(aβ) = Q(β))—the scale is never identified, and estimation requires a nor-malization for one of the coefficients that must have a nonzero contribution to pref-erences. As previously demonstrated through our discrete-choice estimations (see Table 3) and illustrated in Figure 2, locating near department colleagues plays an important role in location choice. In addition, since the average degree correspond-ing to the department network is high (relative to the other network layers we con-sider), many of the inequalities in equation (3) have nontrivial elements pertaining to departmental network effects. We therefore normalize the coefficient for the proxim-ity of a departmental neighbor to 1, denominating the remaining variables in terms of forgone departmental neighbors. In order to further justify this normalization, Table 5 provides the score Q when accounting for only one layer of the network. Since the magnitudes of the relevant coefficient β cannot be calibrated, we look at the scores for β = 1 and β = −1. Table 5 reports the score Q for both the entire dataset and the subset of observations corresponding to participants of the extended survey. The
37 Estimations were performed using Mathematica’s differential evolution algorithm, which has properties suit-able to finding global extrema of optimization problems (see Fox 2008; Santiago and Fox 2008).
Table 5—Single-Variable Explanatory Power (Percent)
β = 1 β = −1Normalization Full Extended survey Full Extended survey
Department Neighbor 51.8 53.7 13.2 11.0Department Floor 41.6 42.3 16.4 14.8Coauthor Neighbor 42.2 51.0 7.6 6.5Coauthor Floor 40.0 43.3 11.3 10.9Friend Neighbor — 58.7 — 9.9Friend Floor — 50.6 — 10.8
Number of inequalities 2,556 1,431 2,556 1,431
Notes: The column headed β = 1 (β = −1) corresponds to a positive (negative) normal-ization for variables. The scores correspond to the percentage of inequalities predicted with objective (3).
1794 THE AMERICAN ECONOMIC REVIEW AUgUST 2012
Department Neighbor variable is the one generating the highest score levels over the full sample, and the second highest over the extended-survey sample.38
C. Stability-Estimation Results
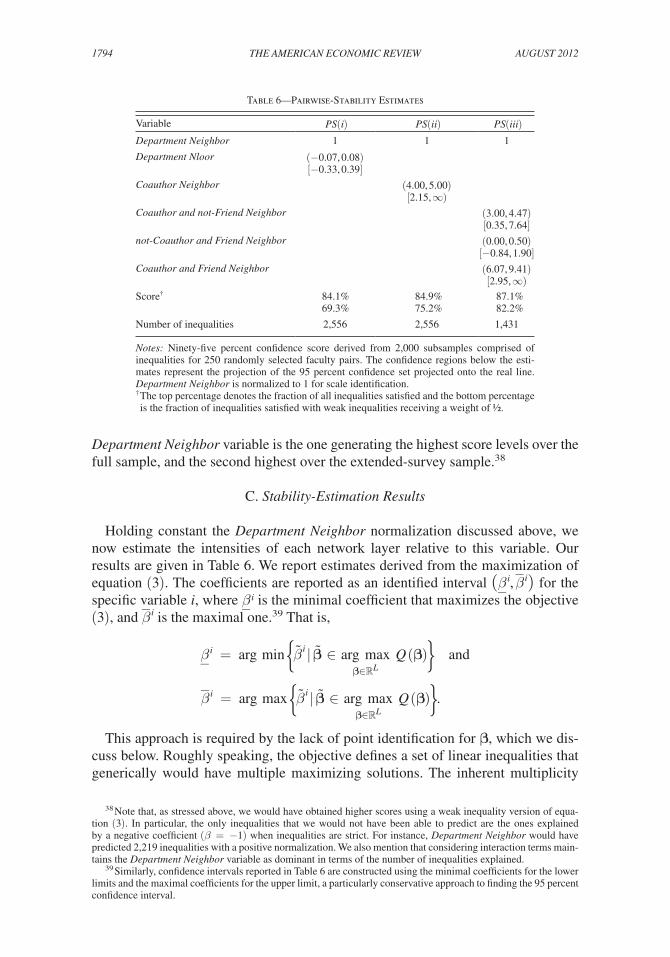
Holding constant the Department Neighbor normalization discussed above, we now estimate the intensities of each network layer relative to this variable. Our results are given in Table 6. We report estimates derived from the maximization of equation (3). The coefficients are reported as an identified interval ( β _ i ,
_ β i ) for the
specific variable i, where β _ i is the minimal coefficient that maximizes the objective (3), and
_ β i is the maximal one.39 That is,
β _ i = arg min { β i | β ∈ arg max β∈ ℝ L
Q (β)} and
_ β i = arg max { β i | β ∈ arg max
β∈ ℝ L
Q (β)}.
This approach is required by the lack of point identification for β, which we dis-cuss below. Roughly speaking, the objective defines a set of linear inequalities that generically would have multiple maximizing solutions. The inherent multiplicity
38 Note that, as stressed above, we would have obtained higher scores using a weak inequality version of equa-tion (3). In particular, the only inequalities that we would not have been able to predict are the ones explained by a negative coefficient (β = −1) when inequalities are strict. For instance, Department Neighbor would have predicted 2,219 inequalities with a positive normalization. We also mention that considering interaction terms main-tains the Department Neighbor variable as dominant in terms of the number of inequalities explained.
39 Similarly, confidence intervals reported in Table 6 are constructed using the minimal coefficients for the lower limits and the maximal coefficients for the upper limit, a particularly conservative approach to finding the 95 percent confidence interval.
Table 6—Pairwise-Stability Estimates
Variable PS(i) PS(ii) PS(iii)Department Neighbor 1 1 1
Department Nloor (−0.07, 0.08)[−0.33, 0.39]
Coauthor Neighbor (4.00, 5.00)[2.15, ∞)
Coauthor and not-Friend Neighbor (3.00, 4.47)[0.35, 7.64]
not-Coauthor and Friend Neighbor (0.00, 0.50)[−0.84, 1.90]
Coauthor and Friend Neighbor (6.07, 9.41)[2.95, ∞)
Score† 84.1% 84.9% 87.1%69.3% 75.2% 82.2%
Number of inequalities 2,556 2,556 1,431
Notes: Ninety-five percent confidence score derived from 2,000 subsamples comprised of inequalities for 250 randomly selected faculty pairs. The confidence regions below the esti-mates represent the projection of the 95 percent confidence set projected onto the real line. Department Neighbor is normalized to 1 for scale identification. † The top percentage denotes the fraction of all inequalities satisfied and the bottom percentage is the fraction of inequalities satisfied with weak inequalities receiving a weight of 1/2.
1795BACCARA ET AL.: MATCHINg WITH NETWORk ExTERNALITIESVOL. 102 NO. 5
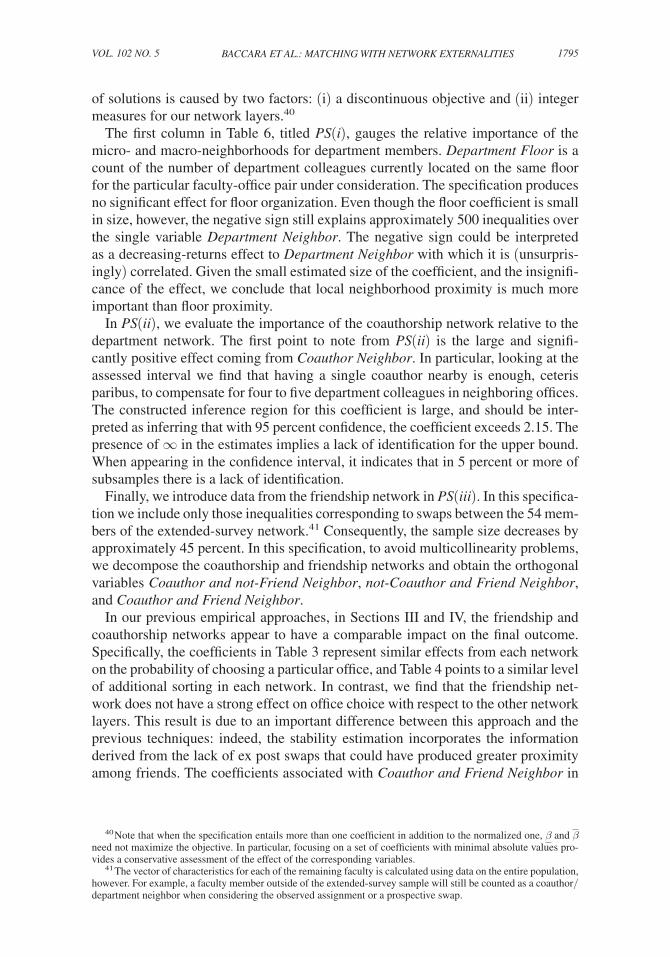
of solutions is caused by two factors: (i) a discontinuous objective and (ii) integer measures for our network layers.40
The first column in Table 6, titled PS(i), gauges the relative importance of the micro- and macro-neighborhoods for department members. Department Floor is a count of the number of department colleagues currently located on the same floor for the particular faculty-office pair under consideration. The specification produces no significant effect for floor organization. Even though the floor coefficient is small in size, however, the negative sign still explains approximately 500 inequalities over the single variable Department Neighbor. The negative sign could be interpreted as a decreasing-returns effect to Department Neighbor with which it is (unsurpris-ingly) correlated. Given the small estimated size of the coefficient, and the insignifi-cance of the effect, we conclude that local neighborhood proximity is much more important than floor proximity.
In PS(ii), we evaluate the importance of the coauthorship network relative to the department network. The first point to note from PS(ii) is the large and signifi-cantly positive effect coming from Coauthor Neighbor. In particular, looking at the assessed interval we find that having a single coauthor nearby is enough, ceteris paribus, to compensate for four to five department colleagues in neighboring offices. The constructed inference region for this coefficient is large, and should be inter-preted as inferring that with 95 percent confidence, the coefficient exceeds 2.15. The presence of ∞ in the estimates implies a lack of identification for the upper bound. When appearing in the confidence interval, it indicates that in 5 percent or more of subsamples there is a lack of identification.
Finally, we introduce data from the friendship network in PS(iii). In this specifica-tion we include only those inequalities corresponding to swaps between the 54 mem-bers of the extended-survey network.41 Consequently, the sample size decreases by approximately 45 percent. In this specification, to avoid multicollinearity problems, we decompose the coauthorship and friendship networks and obtain the orthogonal variables Coauthor and not-Friend Neighbor, not-Coauthor and Friend Neighbor, and Coauthor and Friend Neighbor.
In our previous empirical approaches, in Sections III and IV, the friendship and coauthorship networks appear to have a comparable impact on the final outcome. Specifically, the coefficients in Table 3 represent similar effects from each network on the probability of choosing a particular office, and Table 4 points to a similar level of additional sorting in each network. In contrast, we find that the friendship net-work does not have a strong effect on office choice with respect to the other network layers. This result is due to an important difference between this approach and the previous techniques: indeed, the stability estimation incorporates the information derived from the lack of ex post swaps that could have produced greater proximity among friends. The coefficients associated with Coauthor and Friend Neighbor in
40 Note that when the specification entails more than one coefficient in addition to the normalized one, β _ and _ β
need not maximize the objective. In particular, focusing on a set of coefficients with minimal absolute values pro-vides a conservative assessment of the effect of the corresponding variables.
41 The vector of characteristics for each of the remaining faculty is calculated using data on the entire population, however. For example, a faculty member outside of the extended-survey sample will still be counted as a co author/department neighbor when considering the observed assignment or a prospective swap.

1796 THE AMERICAN ECONOMIC REVIEW AUgUST 2012
PS(iii), however, illustrate that friendship and coauthorship are important together, exceeding a coefficient of 2.95 with 95 percent confidence.42
The reported confidence intervals corresponding to the maximal score estimators utilize an i.i.d. subsampling methodology (for additional details on subsampling, see Politis, Romano, and Wolf 1999; as it applies to maximum score estimators, see Delgado, Rodriguez-Poo, and Wolf 2001) to estimate the 95 percent confidence interval of the maximum score estimator.43, 44
Regarding the econometric techniques we employ and the estimated errors, Manski and Thompson (1986) present simulation evidence suggesting that the boot-strap method allows a good approximation for the estimator’s root-mean-squared error. There is little additional evidence on the performance of the bootstrap method in this specific application before Delgado, Rodriguez-Poo, and Wolf (2001), who provide a theoretical justification for subsampling and present simulation evidence suggesting inconsistency of the bootstrap method.
In terms of the asymptotic identification assumptions required for these estima-tion methods, the assumptions in Bajari and Fox (2009) require that, given enough data, for any parameter vector different from the true one, more inequalities would be violated. In a setting in which all of the underlying explanatory variables are related to social-network degrees, one may expect problems since: (i) network degrees (and, in fact, many other network characteristics) are discrete by nature; and (ii) it is unlikely that individuals have unboundedly many social connections, even as we consider arbitrarily large samples. Point identification is therefore inher-ently problematic. In that respect, we find the intervals that maximize our objective function appealing in that they are pessimistic in terms of coefficients’ significance.
We performed a series of robustness checks on our results. First, one might be con-cerned that senior and junior faculty behave differently in the assignment process.45 Namely, they could have access to different resources to carry out trades, or they may have differing preferences over office attributes. To address the former concern, we run a set of estimations in which faculty are allowed to trade only within their tenure status (i.e., seniors with seniors, and juniors with juniors). As for the latter concern, we also run estimations separately for senior and junior faculty. Both sets of estimations yield results similar to the ones we report.46 Furthermore, we consid-ered an alternative stability notion allowing three-way swaps, which yields virtually identical estimates to those reported.
42 Specifications including floor-level variables for both coauthors and friendships generated results similar to PS(iii). While the inclusion increases the score slightly, the magnitude and significance of the coefficients remain similar. This leads us to believe that floor-level variables do not have powerful explanatory value.
43 For additional econometric results on partial identification, see Imbens and Manski (2004); Chernozhukov, Hong, and Tamer (2007); Stoye (2009); and Romano and Shaikh (2010), as well as references therein.
44 We also estimated the confidence regions using the Romano and Shaikh (2010) methodology. Results are qualitatively similar. Nonetheless, the subsampling results that we report provide tighter confidence intervals than those produced using the Romano and Shaikh technique, which, in our setting, are insensitive to the con-fidence level.
45 In fact, regression analysis using survey responses reveals that the only significant source of heterogeneity in preferences is associated with seniority levels with respect to office size. Specifically, senior faculty exhibit a stronger preference for large corner offices, which represent only ten percent of the offices under consideration.
46 The results do indicate, however, a slightly stronger response to coauthors’ proximity among seniors relative to juniors.
1797BACCARA ET AL.: MATCHINg WITH NETWORk ExTERNALITIESVOL. 102 NO. 5
Finally, we considered two alternative specifications of the underlying networks. First, we obtained auxiliary data regarding the location of faculty prior to the move and generated a fourth network of connections based on the proximity of the old offices. We then replicated the stability estimations including additional variables reflecting this fourth network layer. In these estimations, the variables associated with previous proximity turn out not to be significant, while the other variables exhibit magnitudes similar to the above.
Second, we generated a new, noninstitutional network obtained by the union of the coauthorship and friendship networks.47 The impact of the noninstitutional net-work is within the range of the effects of its three separate components (Coauthor and non-Friend Neighbor, not-Coauthor and Friend Neighbor, and Coauthor and Friend Neighbor in Table 6). Specifically, while friendship alone (not-Coauthor and Friend Neighbor) produced coefficients close to zero in Table 6, the new network has a signifi-cant positive impact on individuals’ preferences. On the other hand, its impact does not appear to be as large as the one associated with coauthorship alone (Coauthor and non-Friend Neighbor) in the estimation we report. Not surprisingly, given the high correla-tion between friendship and coauthorship in the survey sample (see Table 2), Coauthor or Friend Neighbor yields results comparable to the variables associated with coauthor-ship in PS(iii) of Table 6 when we restrict the estimation to survey respondents only.
VI. Welfare
Having established the importance of network externalities in individual prefer-ences, a natural next step is to identify the socially optimal assignment, and to evalu-ate the mechanism implemented by the school. In this section, we illustrate techniques for doing so. Namely, the analysis in the previous section allowed us to determine the network layers and the proximity notion that impact individuals’ utilities the most. In this section we identify a pairwise-stable assignment that, under the estimated prefer-ences, would increase overall efficiency relative to the one implemented. We therefore provide a lower bound on the welfare loss generated by the observed assignment.
Given the utility specification introduced in the previous section, an efficient assignment μ * must satisfy (using our previous notation)
(4) μ * ∈ arg max μ∈Θ
∑ f∈ u f (μ) = arg max
μ∈Θ ∑ f∈
[ P μ( f ) + ∑ l=1
L β l k ( f, μ, l)]
= arg max μ∈Θ
∑ f∈ ∑ l=1
L β l k ( f, μ, l),
where Θ is the set of all possible assignments, and the second equality follows from the fact that the utility derived from offices’ physical characteristics is homo-geneous across agents.
In light of the preference-estimation results in Section V, we now assume that the only links that matter to agents are those between departmental colleagues and coauthors in local neighborhoods. Even with this simplifying assumption, the
47 This potentially alleviates the asymmetry between survey respondents and nonsurvey respondents within the friendship network.

1798 THE AMERICAN ECONOMIC REVIEW AUgUST 2012
pro b lem of finding the most efficient assignment is still not trivial: there are | Θ | = 72! > 1 0 103 possible assignments and the problem is inherently combi- natorial, so differential techniques cannot be employed.48 As it turns out, the prob-lem fits into the class of quadratic assignment problems (QAP), first described in Koopmans and Beckmann (1957) in the context of locating industrial plants with spillovers and transportation costs. Specifically, let b f f ′ (a generic entry in a sym-metric (N × N)-matrix B) be the overall intensity of network externalities between any two agents f and f ′ (obtained by summing up the links present in the different networks, weighted by their estimated relative importance through β).49 Also, let h o o ′ (a generic entry in a symmetric (N × N)-matrix H) be a variable that takes value 1 if an office o neighbors an office o′, and 0 otherwise. Finally, an assignment matrix X is an (N × N)-matrix, where each row and column are made up of N − 1 entries of 0 and a single entry of 1, with element x fo being 1 whenever office o is assigned to agent f ; the row and column restrictions guarantee a single assignment for each faculty member, and one faculty member to each office. Let Π be the set of all assignment matrices. The problem of finding the most efficient assignment μ * can therefore be specified in the Koopmans-Beckmann formulation as50
max X∈Π
∑ f=1
N
∑ f ′=1
N
∑ o=1
N
∑ o′=1
N
b f f ′ h o o ′ x fo x f ′ o ′ .
Note that the matrix BXH X T has generic element ∑ f ′ =1 N ∑ o ′ =1
N ∑ o=1
N b f f ′ x f ′ o ′ h o ′ o x f ′ o .
Thus, using the symmetry of H and changing summation order, the trace of BXH X T is equal to the objective function above. Therefore, we have the following proposition:
PROPOSITION 2 (Quadratic Assignment Problem): Finding an efficient assign-ment μ * is a quadratic assignment problem—that is, it is equivalent to identifying a matrix X ∈ Π that maximizes tr{BXH X T }, where tr{⋅} is the trace operator.
The QAP has been shown to be NP-hard; in fact, even the problem of finding an ϵ-approximation is computationally complex.51 Full solutions to this class of prob-lems are still considered numerically intractable for N > 30. We therefore assess a lower bound for the potential efficiency gain by identifying an alternative pair-wise-stable assignment using an ant-colony algorithm (see Dorigo 1992; Dorigo,
48 We note that the subtlety of the network architectures makes this a more intricate problem than others pertain-ing to efficient design in the presence of complementarities, such as, say, FCC spectrum allocations.
49 Note that this formulation takes bilateral links as the de facto networks. The values appearing in the matrix B essentially identify the coefficient vector β in our utility specification, and the utility flows between members in the (bilateral) network.
50 The generalized formulation of QAP allows for an arbitrary term c ijlm in place of b ij h lm . For details, see Çela (1998).
51 The proof that the problem is NP-hard can be seen by reinterpreting the locations as a time sequence of visits to differing cities, with b ij representing the distance between a city pair, and h lm assuming value 1 if l and m are sequential time-periods. This reinterpretation gives the fairly well-known NP-hard Traveling Salesman’s Problem. The complexity of an approximation of the QAP is demonstrated in Sahni and Gonzalez (1976). They show that if an ϵ-approximation can be found in polynomial time, then P = NP.
1799BACCARA ET AL.: MATCHINg WITH NETWORk ExTERNALITIESVOL. 102 NO. 5
Di Caro, and Gambardella 1999), which has been demonstrated to be effective in finding optima of the QAP.52, 53, 54
Using specification PS(iii) in Table 6 from Section V, we consider three com-binations of coefficients corresponding to the variables Coauthor Neighbor and Coauthor and Friend Neighbor relative to Department Neighbor. The first cor-responds to the lower bounds of the estimated intervals: three and six, respec-tively; the second corresponds to the lower bounds of the confidence intervals: 0.35 and 2.95; the third approximates the midpoint of the estimated intervals: 3.75 and eight.
Figure 3 illustrates the most efficient assignment found by the algorithm under the first combination of coefficients, three and six.55 The comparison with the observed assignment in Figure 2 suggests the potential for more network clustering in the matching process. In fact, for this combination of coefficients, the algorithm identi-fies a lower bound on the potential network efficiency gain of 183 percent, nearly tri-pling the efficiency of the implemented assignment.56 An identical welfare increase is generated when the coefficients are the midpoints of the estimated intervals. When the coefficients correspond to the lower bounds of the confidence intervals, the gen-erated network-efficiency increase is 158 percent.
Given our efficiency results, we conclude that the assignment selected by the serial-dictatorship mechanism in place appears suboptimal. We stress, however, that the limitations of our dataset force us to assume homogeneous preferences across faculty. The efficiency of the observed assignment could, in principle, improve with respect to our estimates if individuals put different weights on network externali-ties. For example, if faculty members who care less about externalities tend to be more senior, they may sort themselves toward better offices at the cost of fewer network links, allowing others to generate more high-efficiency links among them-selves (however, as discussed in Section V, allowing junior and senior faculty to put different weights on network externalities, yields results similar to the homogeneous preferences case).57
The wedge between efficiency and our stability concept is driven by the fact that the constraint on final outcomes is that there are no blocking coalitions of size two.
52 The efficiency gain we identify represents a lower bound on the potential efficiency gain only because, as is common in this literature, the most efficient assignment we identify represents a local maximum, but we are unable to tell whether it is also global.
53 We can also identify a slack upper bound for the problem using the properties of the trace and the eigenvalues of B and H. Given the ordered eigenvalues of H and B—( υ 1 ≤ ⋯ ≤ υ N ) and ( ρ 1 ≤ ⋯ ≤ ρ N ), respectively—we can give a simple upper bound on welfare since we have
tr {BXH X T } ≤ ∑ i=1
N
υ i ρ i
for any X ∈ Π. This points to an upper bound on the network gain of 270 percent to 337 percent across our 3 specifications for β.
54 This algorithm is discussed in more detail in the online Appendix.55 The most efficient assignment is not unique. Indeed, notice that floors five and seven are interchangeable, as
are floors six and eight.56 We note that despite the fact that friendship enters the utility specification only through Coauthor and Friend
Neighbor, the number of friendship links in local neighborhoods increases from 18 in the observed assignment to 32 in the best-found assignment.
57 We can also compare the assignment implemented by the school with the best-found assignment in terms of fairness across seniority levels and departmental affiliations. We find that the best-found assignment implies more egalitarian outcomes across seniority, but somewhat fewer egalitarian outcomes across departments. For details, see analysis reported in the online Appendix.

1800 THE AMERICAN ECONOMIC REVIEW AUgUST 2012
In order to glean some intuition as to why inefficient outcomes may arise when individuals manage swaps in a decentralized manner, we performed the following exercise. We considered singular three-way and four-way blocking coalitions and calculated the effect of their formation on overall welfare. Depending on the coef-ficients considered, the range of average welfare improvements is between one per-cent and 1.4 percent. If individuals collectively chose the blocking coalitions that maximize efficiency improvements, the range of improvement is between 10.9 per-cent and 23.1 percent. This suggests that reaching the efficient outcome would require a fair amount of coordination or a very long sequence of blocking swaps.
Furthermore, we analyzed a dynamic process in which, starting from our observed assignment, at each step of the process a blocking coalition (of size three in our
Coauthor Friend Coauthor and friend
Figure 3. The Best-Found Assignment
Notes: Differing shapes represent department affiliations. Circles represent research clusters. Node shading repre-sents seniority level, with white for seniors and gray for juniors.

1801BACCARA ET AL.: MATCHINg WITH NETWORk ExTERNALITIESVOL. 102 NO. 5
simulations) is formed at random.58 When looking at 100 simulations that place a cap of 500 on the number of coalitional swaps, we approach efficiency gains that are close to those generated by the best-found assignment (and achieve 3-way sta-ble outcomes in 73 percent to 82 percent of cases). The average number of steps required is quite large, however, ranging from 152.4 to 192.3, echoing the idea that achieving improvements in a decentralized fashion would not be trivial.
Finally, our results allow the evaluation of different mechanisms. Indeed, our esti-mates from Section V provide individual utilities, while the analysis above pro-vides a benchmark against which to compare any mechanism in welfare terms. One can therefore consider a class of variations of the mechanism implemented by the school, and evaluate their performance from a welfare perspective.59
VII. Conclusion
We document an assignment protocol of faculty to offices in which locations (offices) varied in physical characteristics. We elicited three layers of network con-nections: institutional and choice-based (coauthorship and friendship). Our data allow us to study the role of network externalities.
Three main insights stand out. First, network externalities have a crucial impact on behavior and final outcomes in the assignment process. Second, the different net-work layers have unequal impacts on outcomes. Third, from a normative perspective, identifying the relevant networks is important for the design of efficient assignments.
From a methodological point of view, our study suggests the usefulness of a mod-ified notion of stability for the estimation of network externalities in assignment processes. The paper also contributes to the empirical literature on social networks. Namely, we show how to account for the relative impact of different layers of peer connections. We also point out techniques that can be employed to evaluate the welfare performance of assignments in the presence of externalities. Ultimately, this paper highlights the conceptual significance and empirical feasibility of considering network externalities in matching setups.
Appendix
PROOF OF PROPOSITION 1:Since the number of possible assignments is finite, there exists a most efficient
one. Let μ be the most utilitarian efficient assignment. We now show that μ is pair-wise stable. Indeed, suppose that faculty f and f ′ form a blocking pair. That is, there exists some transfer t such that:
P μ f f ′ ( f ) + ∑
l=1
L
β l k ( f, μ f f ′ , l) + t ≥ P μ( f ) + ∑ l=1
L
β l k ( f, μ, l);
P μ f f ′ ( f ) + ∑
l=1
L
β l k ( f ′, μ f f ′ , l) − t ≥ P μ( f ′ ) + ∑ l=1
L
β l k ( f ′, μ, l);
58 This process is reminiscent of that suggested by Roth and Vande Vate (1990).59 We consider several such examples at https://sites.google.com/site/matchingexternalities/.

1802 THE AMERICAN ECONOMIC REVIEW AUgUST 2012
and at least one of the inequalities is strict. Since μ f f ′ ( f ) = μ( f ′ ) and μ f f ′ ( f ′ ) = μ( f ), summing up these inequalities implies that
(A1) δ ≡ ∑ l=1
L
β l k ( f, μ f f ′ , l) + ∑ l=1
L
β l k ( f ′, μ f f ′ , l)
− ∑ l=1
L
β l k ( f, μ, l) − ∑ l=1
L
β l k ( f ′, μ, l) > 0.
Suppose that under μ, in office μ( f ), faculty f has k 1 , … , k L connected faculty from layers 1, … , L (including themselves), and, in office μ( f ′ ), faculty f has r 1 , … , r L faculty from layers 1, … , L. Then, after some manipulation, Condition (A1) can be written as
(A2) δ = ∑ l=1
L
β l ( r l + r l ′ − k l − k l ′ + 2) > 0.
Consider now the effects on utilitarian efficiency from a shift from μ to μ f f ′ . For each layer l, we need to take into account the changes (an addition or reduction of one peer for the shift of f and the shift of f ′ ) for all members of that network layer other than f and f ′. Using (A2), the overall efficiency gain is then
Δ = ∑ l=1
L
β l ( r l + r l ′ − ( k l − 1) − ( k l ′ − 1)) + δ = 2δ > 0
in contradiction to μ being the most efficient assignment.
REFERENCES
Abdulkadiro g lu, Atila, Parag Pathak, Alvin E. Roth, and Tayfun Sönmez. 2006. “Changing the Boston School Choice Mechanism.” National Bureau of Economic Research Working Paper 11965.
Baccara, Mariagiovanna, Ayse I mrohoro g lu, Alistair J. Wilson, and Leeat Yariv. 2012. “A Field Study
on Matching with Network Externalities: Dataset.” American Economic Review. http://dx.doi.org/10.1257/aer.102.5.1773.
Bajari, Patrick, and Jeremy T. Fox. 2009. “Measuring the Efficiency of an FCC Spectrum Auction.” National Bureau of Economic Research Working Paper 11671.
Bloch, Francis. 1996. “Sequential Formation of Coalitions in Games with Externalities and Fixed Pay-off Division.” games and Economic Behavior 14 (1): 90–123.
Brandeau, Margaret L., and Samuel S. Chiu. 1989. “An Overview of Representative Problems in Location Research.” Management Science 35 (6): 645–74.
Budish, Eric, and Estelle Cantillon. Forthcoming. “The Multi-Unit Assignment Problem: Theory and Evidence from Course Allocation at Harvard.” American Economic Review.
Çela, Eranda. 1998. The Quadratic Assignment Problem: Theory and Algorithms. New York: Springer.
Che, Yeon-Koo, and Ian Gale. 2009. “Market versus Non-Market Assignment of Ownership.” Colum-bia University Department of Economics Discussion Paper 0607-05.
Chernozhukov, Victor, Han Hong, and Elie Tamer. 2007. “Estimation and Confidence Regions for Parameter Sets in Econometric Models.” Econometrica 75 (5): 1243–84.
Conley, Timothy G., and Christopher R. Udry. 2010. “Learning about a New Technology: Pineapple in Ghana.” American Economic Review 100 (1): 35–69.
1803BACCARA ET AL.: MATCHINg WITH NETWORk ExTERNALITIESVOL. 102 NO. 5
De Clippel, Geoffroy, and Roberto Serrano. 2008. “Marginal Contributions and Externalities in the Value.” Econometrica 76 (6): 1413–36.
Delgado, Miguel A., Juan M. Rodriguez-Poo, and Michael Wolf. 2001. “Subsampling Inference in Cube Root Asymptotics with an Application to Manski’s Maximum Score Estimator.” Economics Letters 73 (2): 241–50.
Dorigo, Marco. 1992. “Optimization, Learning and Natural Algorithms.” Unpublished.Dorigo, Marco, Gianni Di Caro, and Luca M. Gambardella. 1999. “Ant Algorithms for Discrete Opti-
mization.” Artificial Life 5 (2): 137–72.Echenique, Federico, and M. Bumin Yenmez. 2007. “A Solution to Matching with Preferences over
Colleagues.” games and Economic Behavior 59 (1): 46–71.Ehlers, Lars. 2002. “Coalitional Strategy-Proof House Allocation.” Journal of Economic Theory
105 (2): 298–317.Ellison, Glenn, and Edward L. Glaeser. 1997. “Geographic Concentration in U.S. Manufacturing
Industries: A Dartboard Approach.” Journal of Political Economy 105 (5): 889–927.Fox, Jeremy T. 2008. “Estimating Matching Games with Transfers.” National Bureau of Economic
Research Working Paper 14382.Gilboa, Itzhak, and Ehud Lehrer. 1991. “Global Games.” International Journal of game Theory
20 (2): 129–47.Goeree, Jacob K., Margaret A. McConnell, Tiffany Mitchell, Tracey Tromp, and Leeat Yariv. 2010.
“The 1/d Law of Giving.” American Economic Journal: Microeconomics 2 (1): 183–203.Guimarães, Paulo, Octávio Figueiredo, and Douglas Woodward. 2009. “Dartboard Tests for the Loca-
tion Quotient.” Regional Science and Urban Economics 39 (3): 360–64.Hafalir, Isa E. 2007. “Efficiency in Coalition Games with Externalities.” games and Economic Behav-
ior 61 (2): 242–58. Hafalir, Isa E. 2008. “Stability of Marriage with Externalities.” International Journal of game Theory
37 (3): 353–69.Head, Keith, and John Ries. 2005. “Judging Japan’s FDI: The Verdict from a Dartboard Model.” Jour-
nal of the Japanese and International Economies 19 (2): 215–32.Horowitz, Joel L. 1992. “A Smoothed Maximum Score Estimator for the Binary Response Model.”
Econometrica 60 (3): 505–31.Imbens, Guido W., and Charles F. Manski. 2004. “Confidence Intervals for Partially Identified Param-
eters.” Econometrica 72 (6): 1845–57.Jackson, Matthew O. 2005. “A Survey of Network Formation Models: Stability and Efficiency.” In
group Formation in Economics: Networks, Clubs, and Coalitions, edited by Gabrielle Demange and Myrna Wooders, 11–57. Cambridge, UK: Cambridge University Press.
Jackson, Matthew O. 2008. Social and Economic Networks. Princeton, NJ: Princeton University Press.
Koopmans, T. C., and M. Beckmann. 1957. “Assignment Problems and the Location of Economic Activities.” Econometrica 25 (1): 53–76.
Kraut, Robert, Carmen Egido, and Jolene Galegher. 1988. “Patterns of Contact and Communication in Scientific Research Collaboration.” In Proceedings of the 1988 Association for Computing Machin-ery Conference on Computer-Supported Cooperative Work, 1–12. New York: Association for Com-puting Machinery.
Kremer, Michael, and Edward Miguel. 2007. “The Illusion of Sustainability.” Quarterly Journal of Economics 122 (3): 1007–65.
Krishna, Aradhna, and M. Utku Ünver. 2008. “Improving the Efficiency of Course Bidding at Busi-ness Schools: Field and Laboratory Studies.” Marketing Science 27 (2): 262–82.
Leider, Stephen, Markus M. Mobius, Tanya Rosenblat, and Quoc-Anh Do. 2010. “What Do We Expect from Our Friends?” Journal of the European Economic Association 8 (1): 120–38.
Loiola, Eliane Maria, Nair Maria Maia de Abreu, Paulo Oswaldo Boaventura-Netto, Peter Hahn, and Tania Querido. 2007. “A Survey for the Quadratic Assignment Problem.” European Journal of Operational Research 176 (2): 657–90.
Lucas, W. F., and R. M. Thrall. 1963. “n-Person Games in Partition Form.” Naval Research Logistics Quarterly 10 (1): 281–98.
Manea, Mihai. 2007. “Serial Dictatorship and Pareto Optimality.” games and Economic Behavior 61 (2): 316–30.
Manski, Charles F., and T. Scott Thompson. 1986. “Operational Characteristics of Maximum Score Estimation.” Journal of Econometrics 32 (1): 85–108.
Maskin, Eric. 2003. “Bargaining, Coalitions, and Externalities.” Presidential Address to the Wissen-schaftszentrum Berlin für Sozialforschung Conference on Markets and Political Economy 2003, Berlin, Germany.
1804 THE AMERICAN ECONOMIC REVIEW AUgUST 2012
Myerson, R. B. 1977. “Values of Games in Partition Function Form.” International Journal of game Theory 6 (1): 23–31.
Niederle, Muriel, and Leeat Yariv. 2009. “Decentralized Matching with Aligned Preferences.” National Bureau of Economic Research Working Paper 14840.
Politis, Dimitris N., Joseph P. Romano, and Michael Wolf. 1999. Subsampling. New York: Springer.
Pycia, Marek. 2012. “Stability and Preference Alignment in Matching and Coalition Formation.” Econometrica 80 (1): 323–62.
Pycia, Marek, and M. Utku Ünver. 2010. “Incentive Compatible Allocation and Exchange of Discrete Resources.” Boston College Working Papers in Economics 715.
Ray, Debraj, and Rajiv Vohra. 1999. “A Theory of Endogenous Coalition Structures.” games and Eco-nomic Behavior 26 (2): 286–336.
Romano, Joseph P., and Azeem M. Shaikh. 2010. “Inference for the Identified Set in Partially Identified Econometric Models.” Econometrica 78 (1): 169–211.
Roth, Alvin E., and John H. Vande Vate. 1990. “Random Paths to Stability in Two-Sided Matching.” Econometrica 58 (6): 1475–80.
Sahni, Sartaj, and Teofilo Gonzalez. 1976. “P-Complete Approximation Problems.” Journal of the Association for Computing Machinery 23 (3): 555–65.
Santiago, David, and Jeremy T. Fox. 2008. “A Toolkit for Matching Maximum Score Estimation and Point and Set Identified Subsampling Inference.” Unpublished.
Sasaki, Hiroo, and Manabu Toda. 1996. “Two-Sided Matching Problems with Externalities.” Journal of Economic Theory 70 (1): 93–108.
Shapley, Lloyd, and Hebert Scarf. 1974. “On Cores and Indivisibility.” Journal of Mathematical Eco-nomics 1 (1): 23–37.
Sönmez, Tayfun, and M. Utku Ünver. 2010. “Course Bidding at Business Schools.” International Eco-nomic Review 51 (1): 99–123.
Stoye, Jorg. 2009. “More on Confidence Intervals for Partially Identified Parameters.” Econometrica 77 (4): 1299–315.
Wasserman, Stanley, and Katherine Faust. 1994. Social Network Analysis: Methods and Applications. New York: Cambridge University Press.
Yi, Sang-Seung. 1997. “Stable Coalition Structures with Externalities.” games and Economic Behav-ior 20 (2): 201–37.
Related Documents