VOL. 7, NO. 1, JANUARY 2012 ISSN 1819-6608 ARPN Journal of Engineering and Applied Sciences ©2006-2012 Asian Research Publishing Network (ARPN). All rights reserved. www.arpnjournals.com 50 A FACTOR MODEL TO EXPLAIN THE HYDROCHEMISTRY AND CAUSES OF FLUORIDE ENRICHMENT IN GROUNDWATER FROM THE MIDDLE VOLTAIAN SEDIMENTARY AQUIFERS IN THE NORTHERN REGION, GHANA Sandow Mark Yidana 1 , Duke Ophori 2 , Bruce Banoeng-Yakubo 1 and Abdul Aliou Samed 1 1 Department of Earth Science, University of Ghana, Legon, Accra, Ghana 2 Department of Earth and Environmental Studies, Montclair State University, Montclair, New Jersey, USA E-Mail: [email protected] ABSTRACT Groundwater plays a pivotal role in the domestic water delivery system in Northern Ghana. The resource has sometimes been rendered unsuitable for use due to contamination from various sources. In this study, a factor model was developed to determine the major hydrochemical processes that control the variations in the concentrations of fluoride and other ions in the groundwater delivered by the Middle Voltaian aquifers in Savelugu and surrounding areas in the Northern Region of Ghana. This study finds that four major processes control the hydrochemistry of groundwater resources in the area: dissolution of soluble salts in the aquifers, the oxidation of organic carbon by nitrate, silicate mineral weathering and the dissolution of sulfate minerals in the aquifers. The present study finds that fluoride enrichment is related to the weathering of silicate minerals. A linear interpolation map, showing the distribution of fluoride concentrations in the groundwater system has been produced. Two major groundwater types have been distinguished in this study: fresh Na-K- HCO 3 groundwater types, and Na-Cl groundwater types. The Na-Cl water types are associated with areas of high influence of chloride rich sedimentary beds, where groundwater has extremely high salinity and is therefore not suitable for domestic and several other uses. Mineral stability diagrams suggest that the most stable silicate mineral phase is montmorillonite which indicates restricted groundwater flow owing to the limited interconnectivity of the fracture systems that control the hydrogeological properties of the aquifers in the area. Keywords: fluoride, ground water, Savelugu, hierarchical cluster analysis, factor model, speciation. INTRODUCTION The application of multivariate statistical methods to multivariate geo-environmental datasets have facilitated the unveiling of hidden structures in the datasets and assisted in resolving key geo-environmental problems at various scales. Although statistical associations do not establish cause-and-effect relationships, they provide helpful associations from which such relationships can be deduced. The application of these advanced statistical models in recent times in the geosciences has been diverse and ranges from the resolution of simple geo- environmental problems to the determination of groundwater flow directions (Farnham et al., 2003; Stetzenbach et al., 2001), the identification of factors that influence dam hydrologic changes (Matteau et al., 2009), and the characterization of hydrochemical variations among groundwater basins (Yidana, 2010). Other classical applications of multivariate statistical methods in the Earth Sciences are contained in Güler et al. (2002), Cloutier et al. (2008), Jiang et al. (2009), Kim et al. (2009), and Yidana et al. (2010). Cloutier et al. (2008) used principal component analysis with hierarchical cluster analysis to delineate confined and unconfined aquifer systems in some parts of Quebec. They were able to distinguish 7 groundwater associations on the basis of the lithology. From the results of the Q-mode HCA, Cloutier et al. (2008) defined confinement indices which indicated the level of confinement of the aquifers in the area. In their bid to discover the hidden processes responsible for high nitrate concentrations in groundwater, Jiang et al. (2009) applied multivariate methods to the major physico-chemical parameters of groundwater from Yunan in China and ascribed anthropogenic contributions to groundwater contamination in the area. They combined factor analysis with geospatial methods to determine the spatial distribution of the major causes of variation in groundwater quality in the area. Yidana et al. (2010) used a similar methodology to study sources of variation, and the spatial distribution of groundwater salinity in the Keta basin in Ghana. In addition to the factor model and ordinary kriging of the resulting factor scores, Yidana et al. (2010) used Q-mode HCA to classify groundwater from the unconfined aquifer units, into useful hydrochemical facies. The outcome of the study of Yidana et al. (2010) provided another angle to the assessment of groundwater quality variations in the Keta basin. Earlier, Helstrup et al. (2007) used principal component analysis and Q-mode HCA to classify groundwater from wells of various depths in the Keta basin and some parts of the Republic of Togo. Factor and cluster analysis are the most copiously used multivariate statistical methods in geo-environmental studies. Their combined use facilitates an understanding of complex geo-environmental problems, and when used with an expert understanding of the underlying issues, they provide helpful links for the resolution of such geo- environmental problems. Factor analysis is a data

Welcome message from author
This document is posted to help you gain knowledge. Please leave a comment to let me know what you think about it! Share it to your friends and learn new things together.
Transcript

VOL. 7, NO. 1, JANUARY 2012 ISSN 1819-6608
ARPN Journal of Engineering and Applied Sciences
©2006-2012 Asian Research Publishing Network (ARPN). All rights reserved.
www.arpnjournals.com
50
A FACTOR MODEL TO EXPLAIN THE HYDROCHEMISTRY AND CAUSES OF FLUORIDE ENRICHMENT IN GROUNDWATER FROM THE MIDDLE VOLTAIAN SEDIMENTARY AQUIFERS
IN THE NORTHERN REGION, GHANA
Sandow Mark Yidana1, Duke Ophori2, Bruce Banoeng-Yakubo1 and Abdul Aliou Samed1 1Department of Earth Science, University of Ghana, Legon, Accra, Ghana
2Department of Earth and Environmental Studies, Montclair State University, Montclair, New Jersey, USA E-Mail: [email protected]
ABSTRACT
Groundwater plays a pivotal role in the domestic water delivery system in Northern Ghana. The resource has sometimes been rendered unsuitable for use due to contamination from various sources. In this study, a factor model was developed to determine the major hydrochemical processes that control the variations in the concentrations of fluoride and other ions in the groundwater delivered by the Middle Voltaian aquifers in Savelugu and surrounding areas in the Northern Region of Ghana. This study finds that four major processes control the hydrochemistry of groundwater resources in the area: dissolution of soluble salts in the aquifers, the oxidation of organic carbon by nitrate, silicate mineral weathering and the dissolution of sulfate minerals in the aquifers. The present study finds that fluoride enrichment is related to the weathering of silicate minerals. A linear interpolation map, showing the distribution of fluoride concentrations in the groundwater system has been produced. Two major groundwater types have been distinguished in this study: fresh Na-K-HCO3 groundwater types, and Na-Cl groundwater types. The Na-Cl water types are associated with areas of high influence of chloride rich sedimentary beds, where groundwater has extremely high salinity and is therefore not suitable for domestic and several other uses. Mineral stability diagrams suggest that the most stable silicate mineral phase is montmorillonite which indicates restricted groundwater flow owing to the limited interconnectivity of the fracture systems that control the hydrogeological properties of the aquifers in the area. Keywords: fluoride, ground water, Savelugu, hierarchical cluster analysis, factor model, speciation. INTRODUCTION
The application of multivariate statistical methods to multivariate geo-environmental datasets have facilitated the unveiling of hidden structures in the datasets and assisted in resolving key geo-environmental problems at various scales. Although statistical associations do not establish cause-and-effect relationships, they provide helpful associations from which such relationships can be deduced. The application of these advanced statistical models in recent times in the geosciences has been diverse and ranges from the resolution of simple geo-environmental problems to the determination of groundwater flow directions (Farnham et al., 2003; Stetzenbach et al., 2001), the identification of factors that influence dam hydrologic changes (Matteau et al., 2009), and the characterization of hydrochemical variations among groundwater basins (Yidana, 2010). Other classical applications of multivariate statistical methods in the Earth Sciences are contained in Güler et al. (2002), Cloutier et al. (2008), Jiang et al. (2009), Kim et al. (2009), and Yidana et al. (2010). Cloutier et al. (2008) used principal component analysis with hierarchical cluster analysis to delineate confined and unconfined aquifer systems in some parts of Quebec. They were able to distinguish 7 groundwater associations on the basis of the lithology. From the results of the Q-mode HCA, Cloutier et al. (2008) defined confinement indices which indicated the level of confinement of the aquifers in the area.
In their bid to discover the hidden processes responsible for high nitrate concentrations in groundwater, Jiang et al. (2009) applied multivariate methods to the major physico-chemical parameters of groundwater from Yunan in China and ascribed anthropogenic contributions to groundwater contamination in the area. They combined factor analysis with geospatial methods to determine the spatial distribution of the major causes of variation in groundwater quality in the area. Yidana et al. (2010) used a similar methodology to study sources of variation, and the spatial distribution of groundwater salinity in the Keta basin in Ghana. In addition to the factor model and ordinary kriging of the resulting factor scores, Yidana et al. (2010) used Q-mode HCA to classify groundwater from the unconfined aquifer units, into useful hydrochemical facies. The outcome of the study of Yidana et al. (2010) provided another angle to the assessment of groundwater quality variations in the Keta basin. Earlier, Helstrup et al. (2007) used principal component analysis and Q-mode HCA to classify groundwater from wells of various depths in the Keta basin and some parts of the Republic of Togo.
Factor and cluster analysis are the most copiously used multivariate statistical methods in geo-environmental studies. Their combined use facilitates an understanding of complex geo-environmental problems, and when used with an expert understanding of the underlying issues, they provide helpful links for the resolution of such geo-environmental problems. Factor analysis is a data

VOL. 7, NO. 1, JANUARY 2012 ISSN 1819-6608
ARPN Journal of Engineering and Applied Sciences
©2006-2012 Asian Research Publishing Network (ARPN). All rights reserved.
www.arpnjournals.com
51
reduction tool which reduces a large set of data of many variables into a smaller number of uncorrelated factors which provide clues on trends in the data. Various rotation methods are usually used to optimize the results of the factor analysis. Varimax rotation (Kaiser, 1960) is the most frequently used rotation method in the literature. It is the application of an orthogonal matrix to the results of factor analysis with an objective of maximizing the differences among the resulting factors in the final factor model. In water quality studies, factor analysis is used in a similar way as Piper (1944) trilinear diagrams, with an added advantage that the researcher is able to include other parameters which are not usually used in conventional graphical treatment of hydrochemical data such as the Piper (1944) diagrams.
Cluster analysis places variables or samples into associations based on their similarities and/or dissimilarities with each other in the field. Similar variables or samples are connected to each other in the same cluster (group) whilst dissimilar variables are grouped into different clusters (groups). The dendrogram is the visual result of cluster analysis and shows spatial associations of parameters or cases. Different clustering methods exist but the most frequently used is the hierarchical cluster analysis (HCA) (e.g. Cloutier et al., 2008; Banoeng-Yakubo et al., 2009; Yidana, 2010). Where the cases or samples are clustered rather than the parameters or variables, the procedure is often referred to as the Q-mode HCA. The converse is true for R-mode HCA.
In the Savulugu and surrounding communities in the Northern Region of Ghana, groundwater is the main source of drinking water. The area is underlain by Voltaian aquifers which have been tapped at various depths to provide groundwater of acceptable quality and quantity for the populations. The use of groundwater from some of the wells is sometimes limited due to high fluoride content. This study will apply the strengths of multivariate statistical methods to assess the major sources of high fluoride in groundwater from Savulugu and surrounding areas. Factor and cluster analyses are being used together to model the hydrochemistry of groundwater in the area with a view to elucidating the major processes controlling the general quality and the spatial variation of such processes in the study area. The study area
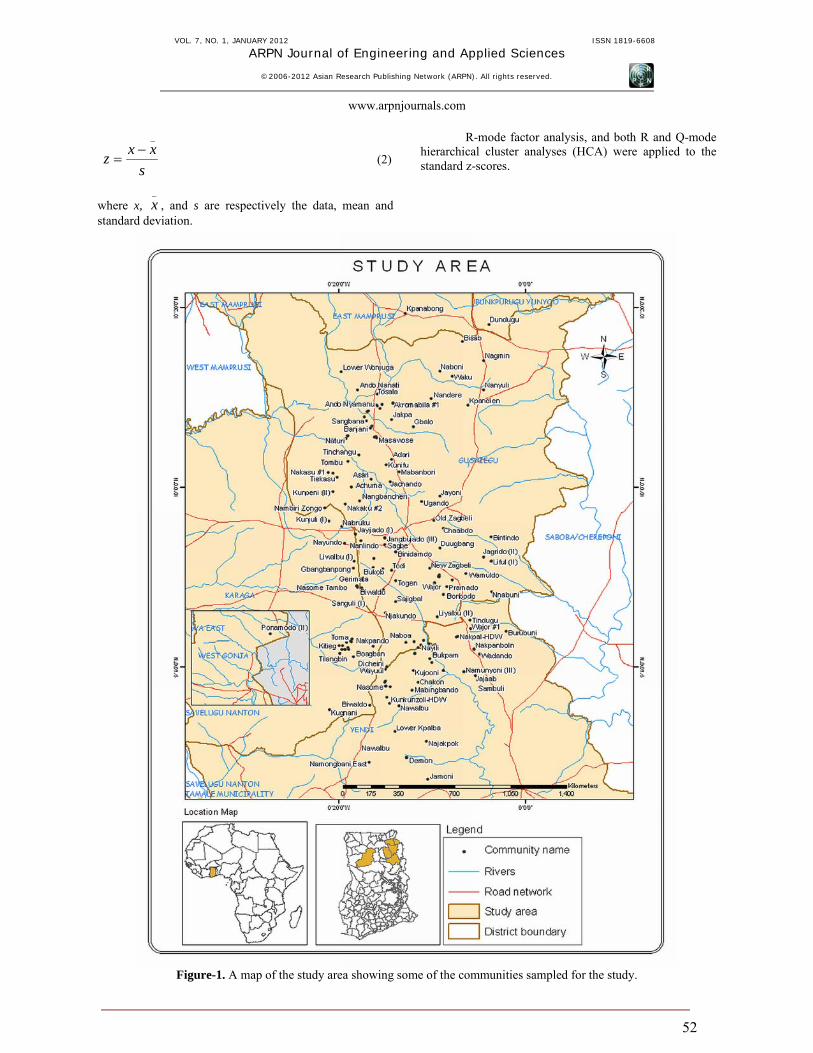
The study area (Figure-1) is predominantly within the Middle Voltaian (Oti-Pendjari Group) rocks which are predominantly sandstones, mudstones, and siltstones of variable groundwater potential. The Middle Voltaian sedimentary rocks form the most extensive sedimentary sequence in Ghana and consist of interbedded mudstone, sandstone, arkose, conglomerate, and some shale. In the study area, the boreholes sampled were drilled mainly through the sandstone and mudstone aquifers. Rocks of the Middle Voltaian are generally well consolidated and are not inherently permeable except for a few places where the strata may be locally permeable due
to some fracturing and weathering. There is no apparent relationship between borehole yield and depth, suggesting that the structural entities that control the hydrogeological properties of the rocks are discrete and do not vary with depth (Yidana, in review). Recently, a few deep boreholes (over 100 m deep) drilled by the Hydrogeological Assessment Project (HAP) of the Ghana Water Resources Commission suggest a possible relationship between depth and yield, although the number of deep boreholes drilled in this way is too small to establish a concrete relationship. There is a strong relationship between aquifer transmissivity and specific capacity amongst aquifers of both the sandstones and mudstones in the area. Success rates for drilling boreholes amongst aquifers within the Middle Voltaian in the Northern Region general is about 56% and the average yield is about 3.6 m3/h (Dapaah-Siakwan and Gyau-Boakye, 2000). Saline water is common in the Middle Voltaian in the Northern parts of the country due the presence of some salt rich beds. METHODOLOGY
Data of the physico-chemical parameters were obtained from the Northern Regional Office of the Community Water and Sanitation Agency (CWSA) for this study. The data consists of one hundred and sixty (160) wells/boreholes with their corresponding data of the physico-chemical parameters such as pH, electrical conductivity (EC), sodium (Na+), calcium (Ca2+), magnesium (Mg2+), potassium (K+), bicarbonate (HCO3
-), chloride (Cl-), sulfate (SO4
2-), nitrate (NO3-), fluoride (F-),
and silica (SiO2). The CWSA and its stakeholders adhered to standard sampling and analytical protocols to acquire all the data used in this study. As such the data is of reasonably high quality and sufficiently represents the insitu hydrochemical characteristics of the aquifers in the study area. The samples were collected by the staff of the World Vision Ghana, and analyzed in the laboratory of the Water Research Institute (WRI) in Tamale.
The acquired data were subjected to internal consistency tests using the Charge Balance Error (CBE) formula (Equation 1).
%100xAnionsCationsAnionsCations
CBE∑ ∑∑ ∑
+
−= (1)
where the ions are measured in meq/l. According to standard practice, the cations should not differ from the anions by more than 5%.
Samples outside of this range would be dropped from further treatment. The resulting dataset were subjected to tests of normality and homogeneity. This is because optimal multivariate analyses require normal distribution of data. Data that are not normally distributed would have to be log-transformed and/or standardized. In this study, the parameters were log-transformed and standardized to their corresponding z-scores according to equation (2).
VOL. 7, NO. 1, JANUARY 2012 ISSN 1819-6608
ARPN Journal of Engineering and Applied Sciences
©2006-2012 Asian Research Publishing Network (ARPN). All rights reserved.
www.arpnjournals.com
52
s
xxz_
−= (2)
where x, _x , and s are respectively the data, mean and
standard deviation.
R-mode factor analysis, and both R and Q-mode hierarchical cluster analyses (HCA) were applied to the standard z-scores.
Figure-1. A map of the study area showing some of the communities sampled for the study.

VOL. 7, NO. 1, JANUARY 2012 ISSN 1819-6608
ARPN Journal of Engineering and Applied Sciences
©2006-2012 Asian Research Publishing Network (ARPN). All rights reserved.
www.arpnjournals.com
53
Geochemistry of fluoride Fluoride is an essential element for the health of
bones and teeth, and is necessary element for primary health care. In areas where the concentration of fluoride in drinking water is very low (lower than 1 mg/l), some fluoride is added to strengthen teeth and bones and reduce the occurrence of cavities in teeth (Judy, 2003). High fluoride concentrations on the hand can lead to skeletal and dental fluorosis. The World Health Organization (WHO, 2003) recommends that the highest permissible fluoride content in drinking water should be 1.50 mg/l. higher concentrations of this element in drinking water can lead to serious health problems. Issues of dental and skeletal fluorosis present serious health concerns in the Upper East region of Ghana. Fluoride in groundwater is often associated with the dissolution of fluorine containing minerals in the rocks. In mineral form, fluoride is only found as fluorite (CaF2), usually as an accessory mineral of granitic rocks (Kundu, et al., 2001). Water discharging through granitic rocks shows an average fluoride content of 810 mg/l (Ramamohana et al., 1993; Valenzuela-Vasquez et al., 2006), which is higher than water flowing through metamorphic and sedimentary rocks (Lisa, 1994). Fluoride concentration in groundwater is controlled by the amount of fluoride in the rock, the residence time of the water in the rock as well as the pH, presence or absence of ion complexes and colloids, the temperature, anion exchange capacity of the aquifer material, as well as the presence or absence of Ca2+ and HCO3
- ions in the water.
Fluoride occurs in almost all natural waters from trace concentrations to as high as 15,000 mg/l in mine water (Kraynov et al., 1969). The principal controls on fluoride concentration in natural water are the climate, host rock composition and the hydrogeology. The amount of fluoride from fluorite dissolution in waters of low ionic strength is about 8 - 10 mg/l (Boyle, 1992; Apambire et al., 1997; Valenzuela-Vasquez et al. 2006). The concentrations of Ca2+, Na+, and OH- as well as certain ionic complexes such as Fe3+, Al3+, B3+, Si4+, Mg2+, and H+ may modify fluoride concentrations (Valenzuela-Vasquez et al. 2006).
The solubility and precipitation of fluorite, the mineral whose dissolution principally controls the concentration of fluoride in natural groundwater, is governed by equation (1). The presence of chloroapatite, mica, amphibole, clay minerals and villiaumite has hydrogeochemical effects on the concentration of fluoride in natural waters (Apambire et al., 1997; Kundu et al., 2001). The solubility limits of fluorite and calcite provide a natural control on the composition of water. As a result, the activities of calcium, fluoride, and carbonate are interdependent (Kundu et al., 2001).
CaF2 → Ca2+ + 2F- (3)
At 25˚C, the equilibrium constant (K) for fluorite is Ks=10-10.60.
Due to the common ion effect, the dissolution of fluorite is suppressed when the concentration of Ca is above the limit for fluorite solubility (Apambire et al., 1997). There is a negative correlation between Ca2+ and F- in groundwater that contain Ca concentrations in excess of that required for fluorite solubility (Boyle, 1992; Apambire et al., 1997). Calcium concentrations in excess of those contributed by the dissolution of fluorite can seriously affect fluoride concentration levels at levels of 0.5 - 3.0 mg/l (Voroshelov, 1966). Since this range is lower than the fluoride concentrations resulting from the dissolution of fluorite, the implication is that majority of groundwaters are undersaturated with respect to fluorite. In natural water systems where cation exchange occurs, there may be a strong positive correlation between Na+ and F- such that high concentrations of Na+ increases the solubility of fluorite, thus enhancing the concentration of F- in the water.
Fluoride solubility in groundwater is strongly influenced by the pH. At a pH range of 6.0-6.5, fluoride solubility is low (Viero et al., 2009). At low pH conditions, fluoride solubility is enhanced by the formation of complexes with aluminum (AlF2+, AlF2
+, AlF3
0 , AlF4-), iron (FeF2+, FeF2
+ and FeF30), and
hydrogen (HF0 and HF2-), whilst alkaline pH conditions
discourage the adsorption of fluoride onto clay minerals surfaces (Viero et al., 2009). Although aluminum (Al3+) and ferric (Fe3+) ions do not usually form complexes with the fluoride ion due to their low solubilities, they can play important roles in fluoride solubility under restricted strongly acid (pH<4) and oxidized conditions (Brookins, 1988). At high temperatures, the boron ion (B2+), which can be present at concentrations in excess of 15 mg/L, is also an important agent for complexing fluoride (Viero et al., 2009). RESULTS AND DISCUSSIONS General hydrochemistry and fluoride enrichment
Statistical summaries of the physico-chemical parameters used in this study for the 160 samples are presented in Table-1. The parameters are very variable in terms of their concentrations in the entire study area. The EC ranges from a low of 114.00 µS/cm to 11140.00 µS/cm which respectively represent fresh and brackish groundwater types, as they respectively represent total dissolved solids (TDS) concentrations of 68.40 mg/L and 6684.00 mg/L. The variability in the EC value is indicated by the rather high standard deviation (Table-1). Due to the presence of some saline beds at some locations, the salinities are quite high in a few wells in the area. In such areas, the saline taste renders such waters unsuitable for most domestic uses. Some of the wells have had to be abandoned. High fluoride levels in groundwater are one of the major concerns in some areas within the study area. The average fluoride content in the area is 1.62 mg/L, which is higher than the WHO (2003) standard for fluoride in drinking water. In the Bongo district of the Upper East region, where high fluoride

VOL. 7, NO. 1, JANUARY 2012 ISSN 1819-6608
ARPN Journal of Engineering and Applied Sciences
©2006-2012 Asian Research Publishing Network (ARPN). All rights reserved.
www.arpnjournals.com
54
levels have been noted in groundwater, studies suggest that the high fluoride is attributed to the dissolution of fluorite in the aquifers (e.g. Apambire et al., 1997). Geochemical analyses of the aquifers indicate the presence of fluorite in appreciable quantities to cause such high fluoride levels in the groundwater. In the Savulugu and surrounding areas, the sources of high fluoride in groundwater have not yet been constrained.
At Biwaldo, where the EC is the highest in the study area, concentrations of the other physico-chemical parameters are equally higher than the WHO recommended levels in potable water. This might be due to the presence of chloride-rich beds. The fluoride concentration in this sample is 3.17 mg/L, which is higher than the recommended WHO (2003) value of 1.50 mg/L.
Table-1. Statistical summaries of the major parameters used for this study.
Parameter Minimum Maximum Mean EC (µS/cm) 114.00 11140.00 1008.71 pH 6.83 8.44 7.60 Alk 24.00 682.00 362.39 HCO3
- (mg/l) 29.30 832.00 439.30 SO4
2- (mg/l) 3.70 737.00 26.48 Cl- (mg/l) 2.00 3403.00 90.25 NO3
- (mg/l) 0.01 63.85 3.89 PO4
3- (mg/l) 0.00 0.94 0.06 F- (mg/l) 0.15 8.12 1.62 Ca2+ (mg/l) 3.20 866.00 29.61 Mg2+ (mg/l) 1.00 106.00 14.80 Na+ (mg/l) 18.60 1245.00 174.56 K+ (mg/l) 0.10 20.40 3.26 SiO2 (mg/l) 5.00 112.00 35.10 TDS 56.60 5570.00 559.16
The relationship between fluoride
concentrations and the EC is not apparent in the study area (Figure-2), but the highest fluoride concentrations have been associated with EC values between 114 and 2000 µS/cm. Within this EC range, there is a weak relationship between these two parameters. This means that high fluoride levels in some of the wells sampled may not be related to the key hydrochemical process that control groundwater hydrochemistry in the area. In addition, the relationship between fluoride and calcium concentrations in groundwater in the study area is rather poor (Figure-3). A poor relationship between these two parameters does not preclude fluoride enrichment due to the dissolution of fluorite in the aquifers. This is because of the other complex processes such as cation exchange, silicate mineral weathering among others, which have a bearing on the concentration of calcium in the medium. Cation exchange has been noted as a major hydrochemical process within the Voltaian aquifers (Yidana and Yidana, 2009). In the current study, a plot of Ca+Mg-SO4-HCO3 (meq/L) against Na+K-Cl (meq/L) (Figure-4) suggests that cation exchange processes probably do occur in the study area. The Ca+Mg-SO4-HCO3 (meq/L) and Na+K-Cl (meq/L) indices, respectively represent the concentrations of the alkaline earth elements and alkali elements after
subtracting the contributions of their sulfates and carbonate minerals (for the alkaline earth elements), and chlorides (for the alkali elements). These indices provide a good way of determining how the concentrations of the alkaline earth elements vary with those of the alkali elements. If the two indices vary inversely with a slope close to -1, with the data plotting away from the origin, cation exchange activity is most probably significant in the hydrochemistry (Jalali, 2007). In Figure-4, the slope of the line is -1. In addition, the data is plotted away from the origin, suggesting that cation exchange plays an active role in the hydrochemistry.
Minerals which have the greatest effect on the hydrogeochemistry of fluoride are fluorite, apatite, micas, amphiboles, certain clays, and villiamite (Apambire et al., 1997). Although fluorite is the major source of fluoride enrichment in most environments, there have been some notable exceptions in some sedimentary and granitic environments (e.g. Foster, 1950; Krainov et al., 1969). Apatite, amphiboles, and micas generally have low solubilities and their rates of dissolution are usually pronounced under low pH (Apambire et al., 1997). There is a weak relationship between fluoride concentration in groundwater from the study area and the pH (Figure-5). Apart from apatite and micas which are common among sedimentary rocks of

VOL. 7, NO. 1, JANUARY 2012 ISSN 1819-6608
ARPN Journal of Engineering and Applied Sciences
©2006-2012 Asian Research Publishing Network (ARPN). All rights reserved.
www.arpnjournals.com
55
the types in the study area, amphiboles have not been noted. The presence of certain clay minerals may act as suitable anion exchange environments which favor the release of fluoride lodged in some anion exchange sites as a substitute for OH- ions. The poor relationship between the concentrations of calcium and fluoride in the study area may suggest sources other than fluorite, in which case anion exchange on clay mineral surfaces is suspected. Villiamite (NaF) is a notable source of fluoride in groundwaters associated with peralkaline intrusives (e.g. Krainov et al., 1969). In the study area
illite, vermiculite and smectite groups of clay minerals are common, and may well control the hydrochemistry of fluoride in groundwater.
The distribution of fluoride in groundwater in the study area is shown in Figure-6. Fluoride concentrations range between 0.50 mg/L and 6.50 mg/L. In most places, in the northern and northeastern parts of the study area, fluoride concentrations are higher than 1.50 mg/L. The lowest concentrations are located in the western and southwestern sections where concentrations lower than 1.0 mg/L are common.
Figure-2. A scatterplot showing the relationship between fluoride concentrations and electrical conductivity (EC) in the study area.

VOL. 7, NO. 1, JANUARY 2012 ISSN 1819-6608
ARPN Journal of Engineering and Applied Sciences
©2006-2012 Asian Research Publishing Network (ARPN). All rights reserved.
www.arpnjournals.com
56
Figure-3. A scatter plot showing the relationship between fluoride and calcium
concentrations in the study area.
Figure-4. A biplot suggesting the possibility of cation exchange in the study area.

VOL. 7, NO. 1, JANUARY 2012 ISSN 1819-6608
ARPN Journal of Engineering and Applied Sciences
©2006-2012 Asian Research Publishing Network (ARPN). All rights reserved.
www.arpnjournals.com
57
Figure-5. The relationship between pH and fluoride concentrations in the study area.
Figure-6. Spatial distribution of fluoride concentrations in the study area. Sources of variation of groundwater hydrochemistry
The R-mode factor analysis with varimax rotation resulted in four factors representing four sources of variation in the hydrochemistry (Table-2).
Table-2(a). Percentage variance explained by each of the factors in the final factor model.
Initial eigenvalues Extraction sums of squared loadings
Rotation sums of squared loadings Component
Total % of variance
Cumulative % Total % of
variance Cumulative
% Total % of variance
Cumulative %
1 4.134 34.446 34.446 4.134 34.446 34.446 4.009 33.411 33.411 2 2.420 20.165 54.611 2.420 20.165 54.611 2.278 18.981 52.392 3 1.972 16.432 71.043 1.972 16.432 71.043 2.198 18.316 70.708 4 1.235 10.289 81.332 1.235 10.289 81.332 1.275 10.624 81.332 5 .765 6.376 87.708 6 .595 4.958 92.666 7 .381 3.173 95.838 8 .305 2.541 98.380

VOL. 7, NO. 1, JANUARY 2012 ISSN 1819-6608
ARPN Journal of Engineering and Applied Sciences
©2006-2012 Asian Research Publishing Network (ARPN). All rights reserved.
www.arpnjournals.com
58
9 .157 1.311 99.691 10 .024 .200 99.891 11 .011 .089 99.980 12 .002 .020 100.000
Extraction method: Principal component analysis.
Table-2(b). Factor loadings of the four factors in the final factor model.
Factor
1 2 3 4 EC .985 -.012 -.087 .070 pH -.067 -.140 -.845 -.127 Alk -.114 .945 .111 -.039
HCO3- -.112 .965 .095 -.039
SO42- -.010 -.009 .039 .931
Cl- .971 -.194 -.087 -.029 NO3
- -.115 -.465 .404 -.093 F- .078 -.210 -.634 .446
Ca2+ .922 -.149 .047 -.066 Mg2+ .549 .279 .467 .403 Na+ .913 .112 -.219 .082 SiO2 -.243 -.152 .783 .056
Extraction Method: Principal Component Analysis. Rotation Method: Varimax with Kaiser Normalization. a. Rotation converged in 5 iterations.
These four factors account for a total of 81% of
the variance in the hydrochemical dataset. Factor 1, which accounts for 34% of the variance has high loadings for Na+, Mg2+, Ca2+ and Cl-. Clearly, the principal process controlling groundwater hydrochemistry is the dissolution of chlorides in the salt rich zones. Domestic waste is also a process that can contribute to the concentrations of these ions in groundwater. There are no proper waste disposal sites in the area, and the wanton dumping of solid waste is one of the issues of environmental concern in the north. Wanton waste disposal is a threat to groundwater quality especially where the wellhead is poorly protected from surface activities. Even where the wellhead is amply protected, recharge areas are not protected, and these ions from domestic waste have the potential to leach down to the groundwater system through recharging waters. Domestic contamination is, however, scattered, and insignificant in most places. Except in a few locations where the concentrations of Na+ and Cl- are higher than the recommended WHO (2003) values, concentrations of the major ions are generally within acceptable ranges for most domestic purposes. Halite
and the chlorides of the major cations are common among the sediments in the area. Concentrations of the chloride salts of these cations are so high that salt is mined in commercial quantities from some salt beds in Daboya, which is within the Middle Voltaian, and close to the study area.
Factor 2 has high positive loadings for HCO3-
and alkalinity, and a negative loading for NO3- and
accounts for over 20% of the variance in the hydrochemistry. It represents the oxidation of organic matter by nitrate in the unsaturated zone. Nitrate is a powerful oxidizing agent apart from oxygen. Where the oxygen content is low, the nitrate is used in the oxidation of organic matter lodged within some of the sedimentary beds and the unsaturated zone. The dissolved oxygen content of the groundwater was not measured, but the relationship between NO3
- and HCO3- is poor (Figure-7),
suggesting that the two parameters are not linearly related to each other in the system. This, however, does not preclude the oxidation of organic matter by nitrate since the HCO3
- ion concentration is affected by several other processes such as the incongruent silicate mineral in the aquifers.

VOL. 7, NO. 1, JANUARY 2012 ISSN 1819-6608
ARPN Journal of Engineering and Applied Sciences
©2006-2012 Asian Research Publishing Network (ARPN). All rights reserved.
www.arpnjournals.com
59
Figure-7. Scatter plot for the relationship between NO3- and HCO3
- in the study area.
Factor 3 accounts for over 16% of the variance in the hydrochemistry and has a high positive loading for SiO2 and a high negative loading for pH and F-. Other parameters such as NO3
- and Mg2+ also have loadings above 0.4 under factor 3, which represents the incongruent weathering of some silicate minerals in the aquifers. Unlike other parts of the Middle Voltaian such as the Afram Plains in the south of Ghana (Acheampong and Hess, 1998; Yidana, 2008; Yidana et al., 2008) where silicate mineral weathering has been noted as the principal source of variation in groundwater hydrochemistry, incongruent silicate mineral weathering ranks third here among the processes that affect groundwater quality in the north of the same basin. This difference is largely attributed to the presence of very soluble salt beds which have contributed more significantly to the enrichment of the major cations in the northern parts of the Middle Voltaian. Silicate mineral weathering in particular is a slow process which requires low pH conditions in order to play an active role in the hydrochemistry. The analysis also suggests that F- enrichment in groundwater in the area is related to silicate mineral weathering, except that the two processes are inversely related. Fluoride generation is probably related to the dissolution of fluorite (CaF2)
which is inversely related to the weathering of Ca-containing silicate minerals due to the common ion effect. As is noted in Figure-5, there is a weak positive relationship between pH and F- for pH above 7. Both pH and F- concentration in groundwater in the study area are negatively correlated with factor 3. This rules out the contribution of amphiboles, micas, and apatites to fluoride enrichment in the groundwater system since these processes are effective under low pH conditions (Viero et al., 2009).
The last factor in the hydrochemistry is strongly positively loaded with SO4
2-. Fluoride and Mg2+ are positively loaded with factor 4 with coefficients above 0.40. This suggests that factor 4 is related to the dissolution of magnesium sulfate in the aquifers and accounts for over 10% of the variance in the hydrochemistry. Factor 4 therefore suggests multiple sources of the F- ion in the hydrochemistry in the study area: one related to silicate mineral weathering and the other one associated with the dissolution of sulfate minerals in the hydrochemistry. Spatial groundwater associations in the study area
Three spatial groundwater associations (clusters) were distinguished from the Q-mode HCA.

VOL. 7, NO. 1, JANUARY 2012 ISSN 1819-6608
ARPN Journal of Engineering and Applied Sciences
©2006-2012 Asian Research Publishing Network (ARPN). All rights reserved.
www.arpnjournals.com
60
Groundwater spatial relationships are usually used to distinguish different processes in the groundwater flow system. It is frequently used to identify different locations within the groundwater flow regime. The phenon line was drawn across the dendrogram (Figure-8) at a linkage distance of about 8. As noted by Cloutier et al. (2008), the position of the phenon line can be moved up or down the dendrogram to define less or more clusters by the user. This aspect of cluster analysis makes the process a semi-objective one as there are no fixed rules governing its position on the dendrogram. The choice of the position of the phenon line is usually principally advised by the author’s best judgment of the probable number of spatial associations based on his understanding of the geology and hydrogeological processes prevailing. In the current study, the observed position of the phenon line produced the best classification and reveals four field associations or clusters. Figure-9 is the Schoeller diagram for the median concentrations of the parameters in each group defined in Figure-8. On the average, cluster 2 (group 2) has the lowest average concentrations of the physico-chemical parameters, and represents Na-K-HCO3 water types. These are generally fresh water types and are suitable for most domestic uses in the area based on the concentrations of the individual ions, and the EC values. The general dominance of the alkali elements over the alkaline earth elements is attributed to the abundance of the salts of these elements in the rocks and in the unsaturated zone. The sources of the HCO3
- ion are variable and range from the decomposition of organic matter (organic carbon oxidation) to incongruent silicate mineral weathering. In clusters 1 and 2, the HCO3
- ion is the most abundant amongst the anions, whereas Na+K predominates the cations. In addition, the average EC values in clusters (groups) 1 and 2 are respectively 852.74 µS/cm and 430.40 µS/cm, suggesting that the samples generally represent fresh groundwaters. Where the effects of the salt beds are minimal, wells drilled through the Middle Voltaian aquifers in the study area lend groundwater of acceptable quality for most uses.
The highest EC value of 797 µS/cm in group 2 is at Gbangbong, where minimal effects of the salt beds are felt. All the other members of this group have EC values lower than 700 µS/cm, with the lowest at Banjani.
Groups 3 and 4 are the most saline, although in most cases, the salinities are within acceptable limits for domestic uses in group 3. Both groups represent Na-Cl water types, and have registered effects of the saline beds in the Middle Voltaian in the area. Group 4 has an average EC of 11,140 µS/cm representing a TDS value of about 6, 684 mg/L, which is extremely high, and represents a clear situation whereby the quality of groundwater in the basin is influenced strongly by the dissolution of halite and associated minerals in the aquifers. In group 3, the average EC value is 3,333.30 µS/cm and the median EC value is 2,930.00 µS/cm. The lowest EC in this group is 2,070 µS/cm (TDS = 1,242 mg/L) at Jangbujado. This sample has a relatively low Cl- concentration at 52 mg/L, but the Na+ concentration of 328 mg/L, is higher than the recommended WHO (2003). Except 1 sample (WVI 2070) where the F- concentration is lower than the recommended 1.50 mg/L in drinking water, all the other boreholes sampled have concentrations of F- higher than 1.50 mg/L and will pose dental and skeletal problems if used for drinking purposes. Group 3 members are therefore unsuitable on two fronts: high salinities are high F- concentrations.
Figure-10 presents the Piper diagrams (Piper, 1944) for all the groups (clusters). All the samples from cluster 1 plot within the high Na+K, and HCO3
- region of the diamond in the Piper diamond, suggesting that these samples were taken from fresh groundwater aquifers. Two of the samples in cluster 2 are mixed groundwater types whilst the remaining 3 are fresh Na-HCO3 groundwater types. All the group 3 samples plot within the region of the diamond that suggests Na-Cl water types. These are the regions influenced the most by the saline beds in the Middle Voltaian. All the samples in group 3 have high EC values and specific concentrations of Na+ and Cl- ions.

VOL. 7, NO. 1, JANUARY 2012 ISSN 1819-6608
ARPN Journal of Engineering and Applied Sciences
©2006-2012 Asian Research Publishing Network (ARPN). All rights reserved.
www.arpnjournals.com
61
Figure-8. A dendrogram from the Q-mode HCA, showing three groundwater associations.
Figure-9. A Schoeller diagram showing the median concentrations of the major hydrochemical parameters in the four groundwater groups.

VOL. 7, NO. 1, JANUARY 2012 ISSN 1819-6608
ARPN Journal of Engineering and Applied Sciences
©2006-2012 Asian Research Publishing Network (ARPN). All rights reserved.
www.arpnjournals.com
62
Figure-10(a). Piper diagram for group 1 members.
Figure-10(b). Piper diagram for cluster (group) 2 members.

VOL. 7, NO. 1, JANUARY 2012 ISSN 1819-6608
ARPN Journal of Engineering and Applied Sciences
©2006-2012 Asian Research Publishing Network (ARPN). All rights reserved.
www.arpnjournals.com
63
Figure-10(c). Piper diagram for group (cluster) 3 members. Silicate mineral weathering processes
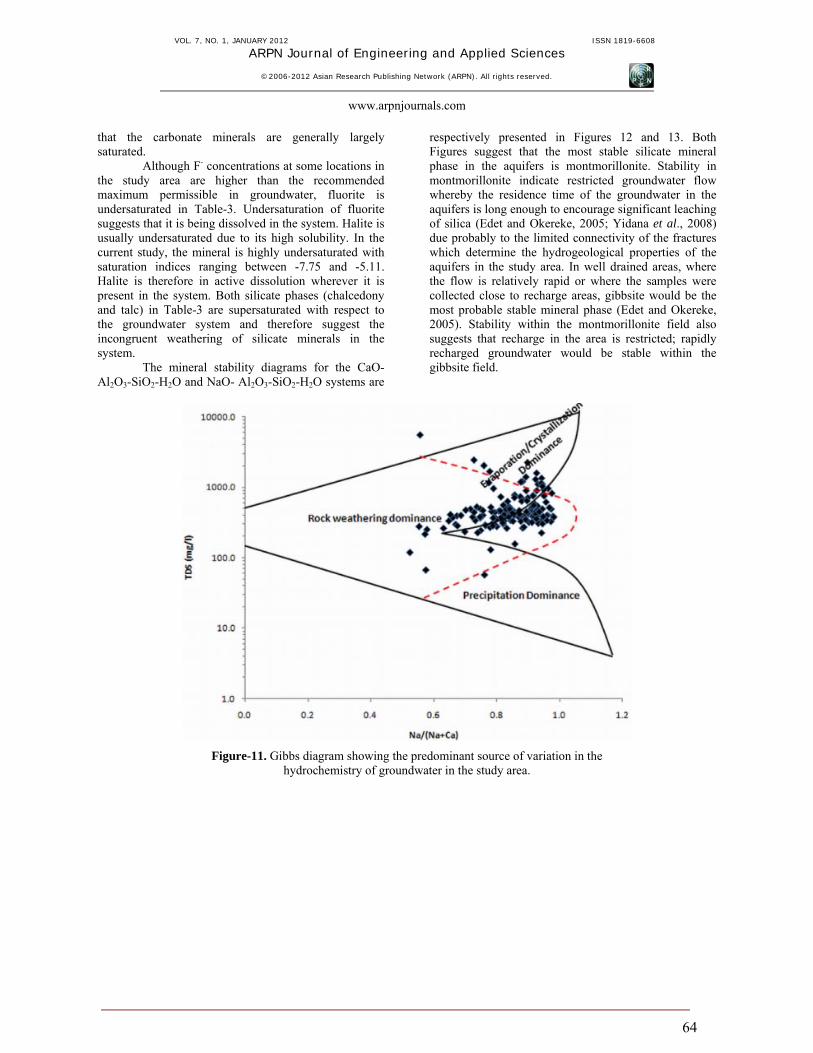
A Gibbs diagram (Gibbs, 1970) for the samples indicates that rock weathering processes are the principal agents of hydrochemical variations in the area (Figure-11). This corroborates the results of the factor analysis presented above, in which factors 1, 3, and 4 suggest various mineral weathering processes. As suggested by factor 3 in the factor model, incongruent silicate mineral weathering plays an active role in the hydrochemistry. Silicate mineral stability diagrams and the saturation states of the various mineral phases in the system are useful tools in determining the most stable silicate phase in the hydrochemistry. In this study, mineral speciation calculations were done from PHREEQC (Parkhurst and Appelo, 1999) to determine the possible mineral phases responsible for hydrochemical variation in the aquifers. PHREEQC is a steady state mass balance geochemical inverse modeling and speciation code which has been copiously used in the literature to highlight hydrochemical trends, and model surface water and groundwater transitioning from recharge areas to discharge areas in the flow regime (e.g. Helstrup et al., 2007; Yidana et al., 2008). Mineral saturation indices have facilitated the identification of mineral dissolution and precipitation processes in aquifers. Saturation indices are computed from Equation 4.
spsp
KIAPKIAPLogSI loglog −== (4)
where IAP and Ksp are respectively the ion activity product and the solubility product constant for the dissociation of the mineral in question.
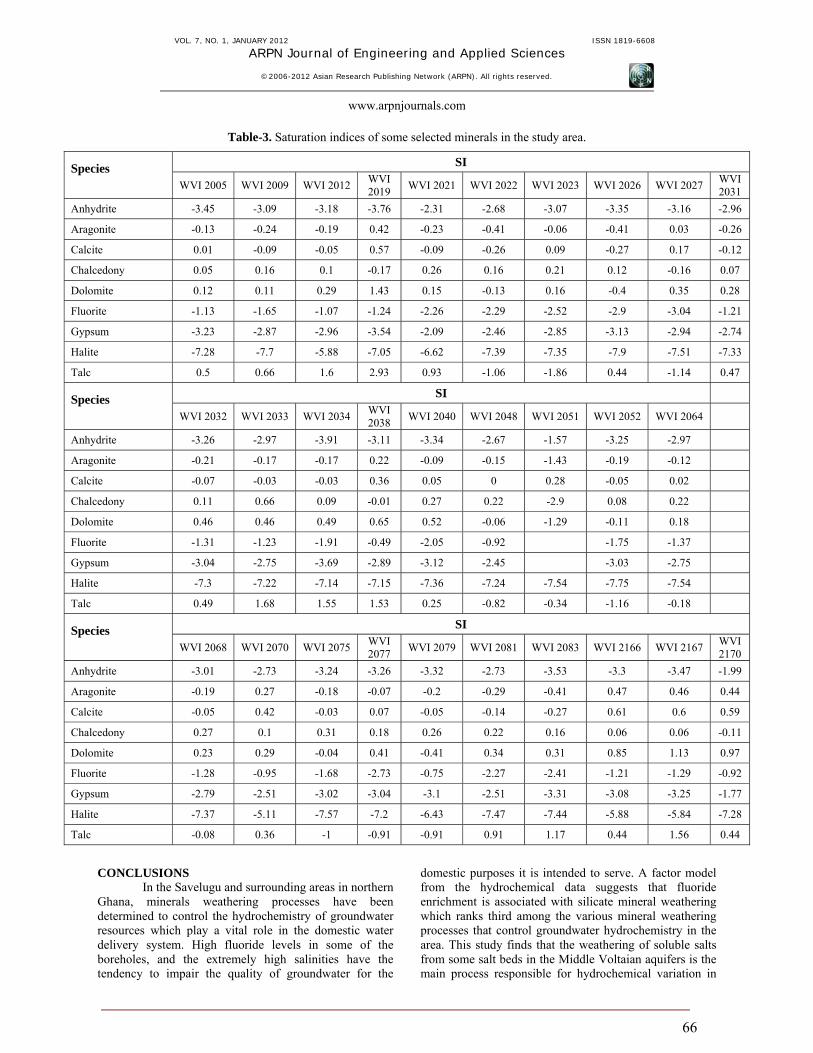
When the saturation index (SI) of a mineral is positive, the suggestion is that the mineral is saturated or supersaturated with respect to the solution. In that case the mineral in question will precipitate under the right conditions. On the other hand, a SI lower than 0, suggests that the log IAP in equation 3 is lower than log Ksp, which suggests that the mineral is undergoing dissolution in the system. The converse is true for a mineral that is supersaturated with respect to a solution. Table-3 shows the SIs of some key minerals in the system. The carbonate minerals are generally supersaturated - saturated in the system, whilst the sulfate minerals are undersaturated throughout the system. Several factors may have contributed to the saturation-supersaturation of the carbonate minerals: incongruent weathering of silicate minerals and carbonate mineral dissolution. In the study area, the aquifers are not known to contain appreciable quantities of carbonate minerals whose weathering could lead to the supersaturation of these minerals in the groundwater system. However, the presence of feldspars up to 25% of the mineral composition of the sandstones in the area is possible (Kesse, 1985). Incongruent silicate mineral weathering is therefore the most likely source of the enrichment of Ca2+ and HCO3
- ions. Silicate mineral weathering is a slow process and will require several years of rock-water interaction to generate a couple of mg/l of ions in solution. It is probably on account of this
VOL. 7, NO. 1, JANUARY 2012 ISSN 1819-6608
ARPN Journal of Engineering and Applied Sciences
©2006-2012 Asian Research Publishing Network (ARPN). All rights reserved.
www.arpnjournals.com
64
that the carbonate minerals are generally largely saturated.
Although F- concentrations at some locations in the study area are higher than the recommended maximum permissible in groundwater, fluorite is undersaturated in Table-3. Undersaturation of fluorite suggests that it is being dissolved in the system. Halite is usually undersaturated due to its high solubility. In the current study, the mineral is highly undersaturated with saturation indices ranging between -7.75 and -5.11. Halite is therefore in active dissolution wherever it is present in the system. Both silicate phases (chalcedony and talc) in Table-3 are supersaturated with respect to the groundwater system and therefore suggest the incongruent weathering of silicate minerals in the system.
The mineral stability diagrams for the CaO-Al2O3-SiO2-H2O and NaO- Al2O3-SiO2-H2O systems are
respectively presented in Figures 12 and 13. Both Figures suggest that the most stable silicate mineral phase in the aquifers is montmorillonite. Stability in montmorillonite indicate restricted groundwater flow whereby the residence time of the groundwater in the aquifers is long enough to encourage significant leaching of silica (Edet and Okereke, 2005; Yidana et al., 2008) due probably to the limited connectivity of the fractures which determine the hydrogeological properties of the aquifers in the study area. In well drained areas, where the flow is relatively rapid or where the samples were collected close to recharge areas, gibbsite would be the most probable stable mineral phase (Edet and Okereke, 2005). Stability within the montmorillonite field also suggests that recharge in the area is restricted; rapidly recharged groundwater would be stable within the gibbsite field.
Figure-11. Gibbs diagram showing the predominant source of variation in the hydrochemistry of groundwater in the study area.

VOL. 7, NO. 1, JANUARY 2012 ISSN 1819-6608
ARPN Journal of Engineering and Applied Sciences
©2006-2012 Asian Research Publishing Network (ARPN). All rights reserved.
www.arpnjournals.com
65
Figure-12. Mineral stability diagram for the CaO-H2O-Al2O3-SiO2 system.
Figure-13. Mineral stability diagram for the NaO-H2O-Al2O3-SiO2 system.
VOL. 7, NO. 1, JANUARY 2012 ISSN 1819-6608
ARPN Journal of Engineering and Applied Sciences
©2006-2012 Asian Research Publishing Network (ARPN). All rights reserved.
www.arpnjournals.com
66
Table-3. Saturation indices of some selected minerals in the study area.
SI Species WVI 2005 WVI 2009 WVI 2012 WVI
2019 WVI 2021 WVI 2022 WVI 2023 WVI 2026 WVI 2027 WVI 2031
Anhydrite -3.45 -3.09 -3.18 -3.76 -2.31 -2.68 -3.07 -3.35 -3.16 -2.96
Aragonite -0.13 -0.24 -0.19 0.42 -0.23 -0.41 -0.06 -0.41 0.03 -0.26
Calcite 0.01 -0.09 -0.05 0.57 -0.09 -0.26 0.09 -0.27 0.17 -0.12
Chalcedony 0.05 0.16 0.1 -0.17 0.26 0.16 0.21 0.12 -0.16 0.07
Dolomite 0.12 0.11 0.29 1.43 0.15 -0.13 0.16 -0.4 0.35 0.28
Fluorite -1.13 -1.65 -1.07 -1.24 -2.26 -2.29 -2.52 -2.9 -3.04 -1.21
Gypsum -3.23 -2.87 -2.96 -3.54 -2.09 -2.46 -2.85 -3.13 -2.94 -2.74
Halite -7.28 -7.7 -5.88 -7.05 -6.62 -7.39 -7.35 -7.9 -7.51 -7.33
Talc 0.5 0.66 1.6 2.93 0.93 -1.06 -1.86 0.44 -1.14 0.47
SI Species WVI 2032 WVI 2033 WVI 2034 WVI
2038 WVI 2040 WVI 2048 WVI 2051 WVI 2052 WVI 2064
Anhydrite -3.26 -2.97 -3.91 -3.11 -3.34 -2.67 -1.57 -3.25 -2.97
Aragonite -0.21 -0.17 -0.17 0.22 -0.09 -0.15 -1.43 -0.19 -0.12
Calcite -0.07 -0.03 -0.03 0.36 0.05 0 0.28 -0.05 0.02
Chalcedony 0.11 0.66 0.09 -0.01 0.27 0.22 -2.9 0.08 0.22
Dolomite 0.46 0.46 0.49 0.65 0.52 -0.06 -1.29 -0.11 0.18
Fluorite -1.31 -1.23 -1.91 -0.49 -2.05 -0.92 -1.75 -1.37
Gypsum -3.04 -2.75 -3.69 -2.89 -3.12 -2.45 -3.03 -2.75
Halite -7.3 -7.22 -7.14 -7.15 -7.36 -7.24 -7.54 -7.75 -7.54
Talc 0.49 1.68 1.55 1.53 0.25 -0.82 -0.34 -1.16 -0.18
SI Species WVI 2068 WVI 2070 WVI 2075 WVI
2077 WVI 2079 WVI 2081 WVI 2083 WVI 2166 WVI 2167 WVI 2170
Anhydrite -3.01 -2.73 -3.24 -3.26 -3.32 -2.73 -3.53 -3.3 -3.47 -1.99
Aragonite -0.19 0.27 -0.18 -0.07 -0.2 -0.29 -0.41 0.47 0.46 0.44
Calcite -0.05 0.42 -0.03 0.07 -0.05 -0.14 -0.27 0.61 0.6 0.59
Chalcedony 0.27 0.1 0.31 0.18 0.26 0.22 0.16 0.06 0.06 -0.11
Dolomite 0.23 0.29 -0.04 0.41 -0.41 0.34 0.31 0.85 1.13 0.97
Fluorite -1.28 -0.95 -1.68 -2.73 -0.75 -2.27 -2.41 -1.21 -1.29 -0.92
Gypsum -2.79 -2.51 -3.02 -3.04 -3.1 -2.51 -3.31 -3.08 -3.25 -1.77
Halite -7.37 -5.11 -7.57 -7.2 -6.43 -7.47 -7.44 -5.88 -5.84 -7.28
Talc -0.08 0.36 -1 -0.91 -0.91 0.91 1.17 0.44 1.56 0.44
CONCLUSIONS
In the Savelugu and surrounding areas in northern Ghana, minerals weathering processes have been determined to control the hydrochemistry of groundwater resources which play a vital role in the domestic water delivery system. High fluoride levels in some of the boreholes, and the extremely high salinities have the tendency to impair the quality of groundwater for the
domestic purposes it is intended to serve. A factor model from the hydrochemical data suggests that fluoride enrichment is associated with silicate mineral weathering which ranks third among the various mineral weathering processes that control groundwater hydrochemistry in the area. This study finds that the weathering of soluble salts from some salt beds in the Middle Voltaian aquifers is the main process responsible for hydrochemical variation in

VOL. 7, NO. 1, JANUARY 2012 ISSN 1819-6608
ARPN Journal of Engineering and Applied Sciences
©2006-2012 Asian Research Publishing Network (ARPN). All rights reserved.
www.arpnjournals.com
67
the study area. Two major groundwater types have also been distinguished in the study area: the Na-K-HCO3 and Na-Cl groundwater types. The Na-Cl water types are associated with areas where the hydrochemistry is dominated by the dissolution of soluble salts from the salt beds, and where the salinities are quite high. The Na-K-HCO3 water types are quite fresher groundwater types. Mineral speciation calculations suggest that the carbonate minerals are largely saturated-supersaturated in the area. Mineral stability diagrams produced from the speciation calculations indicate that the most stable silicate mineral phase in the groundwater system in the area is montmorillonite, which suggests that groundwater flow in the area is restricted, probably due to the restricted interconnectivity among the fracture systems that control the hydro geological properties of the aquifers in the area. REFERENCES Acheampong S.Y. and Hess J.W. 1998. Hydrogeologic and hydrochemical framework of the shallow groundwater system in the southern Voltaian Sedimentary Basin, Ghana. Hydrogeol. J. 6: 527-537. Apambire W.B., Boyle D.R. and Michel F.A. 1997. Geochemistry, genesis, and health implications of fluoriferous groundwater in the upper regions of Chana. Environ Geol. 33(1): 13-24. Banoeng-Yakubo B., Yidana S.M. and Nti E. 2009. Hydro chemical modeling of groundwater using multivariate statistical methods - the Volta Region, Ghana. KSCE Journal of Civil Engineering. 13(1): 55-63. Boyle D.R. 1992. Effects of Base Exchange softening on fluoride uptake in groundwaters of the Moncton Sub-Basin, New Brunkswick, Canada. In: Kharaka YK, Maest AS (Eds). Waterrock interaction. Proc. 7th Int. Symp Water-rock interaction. A.A. Balkema, Rotterdam. pp. 771-774. Brookins D.G. 1988. Eh-pH diagrams for geochemistry. Springer, London, U.K. p. 176. Cloutier V., Lefebvre R., Therrien R. and Savard M.M. 2008. Multivariate statistical analysis of geochemical data as indicative of the hydrogeochemical evolution of groundwater in a sedimentary rock aquifer system. J. of Hydrology. 353: 294-313. Dapaah-Siakwan S. and Gyau-Boakye P. 2000. Hydrogeologic framework and borehole yields in Ghana. Hydrogeology. 8: 405-416. Edet A. and Okereke C. 2005. Hydro geological and hydro chemical character of the regolith aquifer, northern Obudu Plateau, southern Nigeria. Hydrogeology.13: 391-415.
Farnham I.M., Johannesson K.H., Singh A.K., Hodge V.F. and Stetzenbach K.J. 2003. Factor analytical approaches for evaluating groundwater trace element chemistry data. Analytical Chimica Acta. 490: 123-138. Foster M.D. 1950. The origin of high sodium bicarbonate waters in the Atlantic and Gulf Coastal Plains. Geochim Cosmochim Acta. 1: 32-48. Gibbs R.J. 1970. Mechanisms controlling world water chemistry. Science. 17: 1088-1090. Güler C., Thyne G.D., McCray J.E. and Turner A.K. 2002. Evaluation of graphical and multivariate statistical methods for classification of water chemistry data. Hydrogeology Journal. 10: 455-474. Helstrup T., Jorgensen N.O. and Banoeng-Yakubo B. 2007. Investigation of hydrochemical characteristics of groundwater from the Cretaceous–Eocene limestone in southern Ghana and southern Togo using hierarchical cluster analysis. Hydrogeology. 15: 977-989. Jalali M. 2007. Hydrochemical identification of groundwater resources and their changes under the impacts of human activity in the Chah Basin in Western Iran. Environ Monit Assess. 130: 347-364. Jiang Y., Wu Y., Groves C., Yuan D. and Kambesis P. 2009. Natural and anthropogenic factors affecting the groundwater quality in the Nandong karst underground river system in Yunan, China. Journal of contaminant hydrology. 109: 49-61. Judy A.R. 2003. Fluoride in encyclopedia of water science. Marcel Dekker, New York, USA. Kaiser H.F. 1960. The application of electronic computers to factor analysis. Educ. Psychol. Meas. 20: 141-151. Kesse G.O. 1985. The Mineral and Rock Resources of Ghana: A.A. Balkema, Rotterdam. p. 610. Kim K-H, Yun S-T, Choi B-Y., Chae G-T., Joo Y., Kim K. and Kim H-S. 2009. Hydrochemical and multivariate statistical interpretations of spatial controls of nitrate concentrations in a shallow alluvial aquifer around oxbow lakes. Osong area, central Korea. Journal of Contaminant Hydrology. 107: 114-127. Kraynov S.R., Merkov A.N., Petrova N.G., Baturinskaya I.V. and Zharikova V.M. 1969. Highly alkaline (pH 12) fluosilicate waters in the deeper zone of the Lovozero Massif. Geochem Int. 6: 635-640. Kundu N, Panigrahi MK, Tripathy S, Munshi S, Powell MA and Hart B.R. 2001. Geochemical appraisal of fluoride contamination of groundwater in the Nayagarh District of Orissa, India. Environ Geol. 41: 451-460.

VOL. 7, NO. 1, JANUARY 2012 ISSN 1819-6608
ARPN Journal of Engineering and Applied Sciences
©2006-2012 Asian Research Publishing Network (ARPN). All rights reserved.
www.arpnjournals.com
68
Lisa S. B. 1994. Factors influencing fluoride concentration in Norwegian lakes. Water Air Soil Pollut. 77(1-2): 151-167. Matteau M., Assani A.A. and Mesfioui M. 2009. Application of multivariate statistical analysis to the dam hydrologic impact studies. J. Hydrol. 371: 120-128. Parkhurst D.L. and Appelo C.A.J. 1999. User’s Guide to PHREEQC (Version 2)-A Computer Program for Speciation, Batch-Reaction, One-Dimensional Transport, and Inverse Geochemical Calculations. United States Geological Survey, Water Resources Investigations Report 99-4259, Washington, DC, USA. p. 326. Piper A.M. 1944. A graphic procedure in the geochemical interpretation of water-analyses. American Geophysical Union. Papers, Hydrology. pp. 914-923. Ramamohana R.N.V., Rao N., Prakash R.S.K. and Schuiling R.D. 1993. Fluorine distribution in water Nalgonda District, Andhra Pradesh, India. Environ Geol. 21: 84-89. Stetzenbach K.J., Hodge V.F., Guo C., Farnham I.M. and Johannesson K.H. 2001. Geochemical and statistical evidence of deep carbonate groundwater within averlying volcanic rock aquifers/aquitards of southern Neveda, USA. Journal of Hydrology. 243: 254-271. Valenzuela-Vásquez L., Ramírez-Hernández J., Yeyes-López J., Sol-Uribe A. and Lázaro-Mancilla O. 2006. The origin of fluoride in groundwater supply to Hermosillo City, Sonora, Mexico. Environ. Geol. 51: 17-27. Viero A.P., Roisenberg C., Roisenberg A. and Vigo A. 2009. The origin of fluoride in the granitic aquifer of Porto Alegre, Southern Brazil. Environ. Geol. 56: 1707-1719. Voroshelov Y.I. 1966. Geochemical behaviour of fluorine in the groundwaters of the Moscow region. Geochem Int. 2: 261. World Health Organization. 2003. Guidelines for Drinking Water Quality. 2nd Ed., Vol. 3, Geneva. Yidana S.M. 2008. Groundwater resources management for productive uses in the Afram Plains area, Ghana. Doctoral Dissertation, Montclair State University, USA. Yidana S.M. 2010. Groundwater classification using multivariate statistical methods: Southern Ghana. Journal of African Earth Sciences. 57: 455-469.
Yidana S.M., Banoeng-Yakubo B. and Akabzaa T.M. 2010. Analysis of groundwater quality using multivariate and spatial analyses in the Keta basin, Ghana. Journal of African Earth Sciences. Yidana S.M. and Yidana A. 2009. Assessing groundwater quality using water quality index and multivariate statistical analysis - the Voltaian basin, Ghana. Journal of Environmental Earth Science. DOI:10.1007/s12665-009-0132-3. Yidana S.M., Ophori D. and Banoeng-Yakubo B. 2008. Hydrochemical evaluation of the Voltaian system - the Afram Plains area, Ghana. Environmental Management. 88: 697-707.
Related Documents