A Factor Analysis of Supermarket Management Practices Robert P. King and Elaine M. Jacobson Department of Applied Economics University of Minnesota St. Paul, MN 55108 Abstract: Empirically based management practice indices are constructed using results from factor analysis of data from 344 stores in the 2000 Supermarket Panel. These indices are compared to six management indices based on expert opinion. The empirical indices group variables differently and provide a more compact summary of supermarket management practices. Selected Paper for the 2001 American Agricultural Economics Association Annual Meeting Copyright 2001 by Robert P. King and Elaine M. Jacobson. All rights reserved. Readers may make verbatim copies of this document for non-commercial purposes by any means, provided that this copyright notice appears on all copies.

Welcome message from author
This document is posted to help you gain knowledge. Please leave a comment to let me know what you think about it! Share it to your friends and learn new things together.
Transcript

A Factor Analysis of Supermarket Management Practices
Robert P. King and Elaine M. Jacobson
Department of Applied EconomicsUniversity of Minnesota
St. Paul, MN 55108
Abstract: Empirically based management practice indices are constructed using results fromfactor analysis of data from 344 stores in the 2000 Supermarket Panel. These indices arecompared to six management indices based on expert opinion. The empirical indices groupvariables differently and provide a more compact summary of supermarket managementpractices.
Selected Paper for the 2001 American Agricultural Economics Association Annual Meeting
Copyright 2001 by Robert P. King and Elaine M. Jacobson. All rights reserved. Readers maymake verbatim copies of this document for non-commercial purposes by any means, providedthat this copyright notice appears on all copies.
A Factor Analysis of Supermarket Management Practices
The decade of the 1990s was a time of great change in the supermarket industry. By the
early 1990s, mass merchants such as Wal-Mart were posing a serious competitive threat as they
expanded their scope of operations into food retailing. At the same time, advances in
information technology were making new, potentially more efficient business practices possible,
including category management, computer assisted ordering, and vendor managed inventory.
Finally, in the late 1990s tight labor markets, the new competitive threat of on-line shopping and
increasing consolidation of supermarket chains posed significant new management challenges at
the store level.
In 1999, The Retail Food Industry Center at the University of Minnesota established the
Supermarket Panel. This annual survey of supermarket managers provides information on store
characteristics, operations, and performance. The Panel is unique because the unit of analysis is
the individual store and the same stores are tracked over time. This makes it possible to trace the
impacts of new technologies and business practices as they are adopted.
After a pilot test of the Panel in 1999 with 100 non-randomly selected stores, full-scale
operation for the Panel began in 2000. A random sample of 2,000 stores was selected from a list
of nearly 32,000 supermarkets in the U.S. that accept food stamps. Questionnaires were mailed
to these stores in January 2000. A total of 344 stores responded with useable surveys. These
344 stores include supermarkets in forty-nine states, representing a wide range of ownership
structures and formats. Across all Panel stores, King, Wolfson, and Seltzer (p. 5) report that
median values for annual store sales, selling area, weekly sales per checkout, and weekly sales
per square foot are quite similar to those reported in the 67th Annual Report of the Grocery
Industry published by Progressive Grocer. The median level for sales per full-time equivalent

1 See King, Wolfson, and Seltzer for a more complete discussion of data collection proceduresfor the 2000 Supermarket Panel and a detailed descriptive profile of the Panel stores.
2
employee is higher for Panel stores than the figure reported by Progressive Grocer, but this may
be due to differences in the definition of a full-time employee.1
The Panel survey instrument includes a large number of questions about store-level
management practices. Responses to these questions are summarized by index scores for six key
management areas: (1) supply chain practices, (2) human resource practices, (3) food handling,
(4) environmental practices, (5) quality assurance, and (6) service offerings. These make it easier
for managers to assess relative strengths and weaknesses and identify areas for increased
management attention. They also are used in statistical analysis of store performance.
Because 2000 was the first year of full-scale operation for the Panel, construction of these
indices was based on expert opinion rather than empirical analysis. Now that data are available,
it is possible to assess whether the grouping of management practices under these indices is
appropriate and to determine whether they are actually measuring distinct aspects of store
management. Factor analysis is an appropriate tool for this assessment.
This paper presents results from a factor analysis of the management practice indices
from the 2000 Supermarket Panel. In the sections that follow, we first describe the components
of the six management practice indices. We then introduce and present results for two factor
analysis models designed to determine how appropriately the indices characterize store practices
over a broad range of management activities. Finally, we compare the performance of the
original indices and factors based on the two models in regression models that predict four key
store performance measures.

3
The Original Management Practice Indices
Complete definitions of the six management practice indices are provided in sections
3 through 8 and Appendix C of King, Wolfson, and Seltzer. The primary objective in
constructing the indices was to develop summary measures of management practices in key areas
that could be helpful to store managers and useful in statistical analyses of the Panel data. In
most cases, individual variables included in an index were weighted equally and added together
since there were no previous studies that had constructed such indices.
Supply Chain Practices The supply chain index is designed to be an indicator of a
store’s ability to participate in supply chain initiatives. It has two equally weighted components:
technology adoption and decision sharing. The technology component measures a store’s
adoption of eight store-level technologies related to supply chain management: (1) electronic data
interchange (EDI), (2) electronic-assisted receiving, (3) scan-based trading, (4) computer assisted
ordering, (5) electronic shelf tags, (6) product movement analysis, (7) plan-o-grams for shelf-
space allocation, and (8) loyalty card programs. The first four are associated with technologies
and business practices that link the store to its suppliers. The second four are associated with
product selection, promotions, and merchandising. These eight technologies are equally
weighted, and the score for this component is simply the percent of technologies adopted. The
decision sharing component measures the extent to which parties outside the store are involved in
store-level decisions in five key areas: (1) pricing, (2) advertising, (3) space allocation,
(4) display merchandising, and (5) promotions. Store managers were asked who has primary
responsibility for decisions in each of these areas for four products: apples, dry cereal, direct
store delivery (DSD) snacks, and fluid milk. This component is the percent of these twenty

2 This index was developed by Professor Ted Labuza from the Department of Food Science andNutrition at the University of Minnesota.
4
decisions (five for each of four products) for which someone outside the store has primary
responsibility. The overall supply chain score is the simple average of the two component
scores.
Human Resource Practices The human resources index measures adoption of
“progressive” human resource practices. It has three equally weighted components: training, use
of full-time employees, and compensation and benefits. The training component is based on
hours of training during the first six months of employment for new hires in cashier, deli, and
other positions. The use of full-time employees component is simply the percent of employees
classified as full-time. The compensation and benefits component measures the use of
performance-based compensation and the presence of benefits such as health and disability
insurance in the compensation packages of four employees types: store managers, department
heads, other full-time employees, and part-time employees. Each component is scored on a
100 point scale, and the overall index is simply the average of the three components.
Food Handling The food handling score measures adoption of practices that promote
food safety and quality.2 It has six components: (1) conformity with target temperatures for self
service meat, dairy products, and self service deli; (2) conformity with recommended frequency
for temperature checks in self service meat, dairy products, self service deli, and frozen food
cases; (3) conformity with recommended frequency for store sanitation audits; (4) use of “sell
by” or “use by” dating information for poultry, red meat, seafood, and deli products;
(5) conformity with recommended inventory rotation practices for meat, dairy, self service deli,

5
and frozen foods; and (6) provision of training on food safety for deli and meat department
employees. Each component is scored on a 100 point scale, and the overall index is a weighted
average of the components.
Environmental Practices The environmental practices index measures adoption of
practices that promote environmental quality. It has two equally weighted components. The first
is the store’s adoption rate for three consumer-oriented environmental practices:
(1) environmentally friendly products, (2) organic products, and (3) recycling services. The
second is the store’s adoption rate for three environmental practices related to store operations:
(1) energy efficient lighting, (2) refrigeration management, and (3) store waste recycling. The
overall environmental practices score is the simple average of these two adoption rates.
Quality Assurance The quality assurance index measures adoption of quality assurance
practices. It has three equally weighted components, each measured on a 100 point scale. The
first is the adoption rate of three formal tools for assessing customer satisfaction: (1) customer
focus groups, (2) customer satisfaction surveys, and (3) mystery shopper programs. The second
component indicates the extent to which stores emphasize quality assurance in their marketing
programs by stressing perishables excellence and strong service. The third component is based
on four components of the food handling index: (1) temperature checks, (2) sanitation audits,
(3) inventory rotation, and (4) food safety training. The overall quality assurance score is the
average of scores for these three components.
Service Offerings The service offerings index measures the breadth of services offered
by a store. The overall score is the percentage of the following services that are offered:
(1) bagging, (2) carryout, (3) custom meat cutting, (4) fax ordering, (5) Internet ordering,
3 Books by Harmon, by Gorsuch, and by Kline provide good overviews of factor analysismethods.
6
(6) fresh prepared meals, (7) hot meals for home meal replacement (HMR), (8) special checkout
lane for HMR customers, (9) pharmacy, (10) post office, (11) in-store banking, (12) videos, and
(13) strong service featured in store marketing programs.
Factor Analysis Models of Store Management Practices
The development of the six management practice indices can be viewed as an attempt at
data reduction based on expert opinion. Responses to a large number of survey questions were
combined into six overall measures. Factor analysis is a statistically-based tool for data
reduction. As described in the user documentation for the Stata statistical software package used
for the analysis in this study (StataCorp., Volume 1, p. 460):
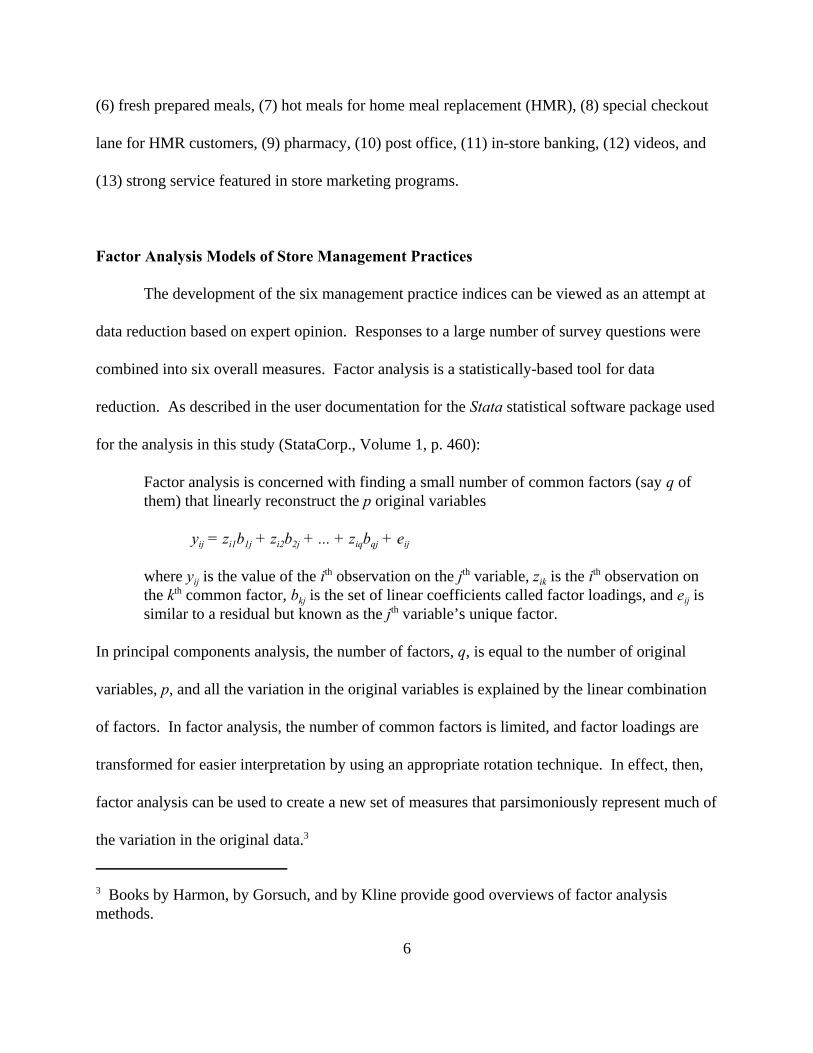
Factor analysis is concerned with finding a small number of common factors (say q ofthem) that linearly reconstruct the p original variables
yij = zi1b1j + zi2b2j + ... + ziqbqj + eij
where yij is the value of the ith observation on the jth variable, zik is the ith observation onthe kth common factor, bkj is the set of linear coefficients called factor loadings, and eij issimilar to a residual but known as the jth variable’s unique factor.
In principal components analysis, the number of factors, q, is equal to the number of original
variables, p, and all the variation in the original variables is explained by the linear combination
of factors. In factor analysis, the number of common factors is limited, and factor loadings are
transformed for easier interpretation by using an appropriate rotation technique. In effect, then,
factor analysis can be used to create a new set of measures that parsimoniously represent much of
the variation in the original data.3

4 These twenty components include, without duplication, all the variables used to construct theoriginal indices except two variables that indicate whether or not a store emphasizes perishablesexcellence and strong service in its marketing programs. More than 95% of stores answered“yes” to both these questions. These variables were included in the quality assurance and serviceofferings indices.
7
Two factor analysis models are considered in this study. Variable names and definitions
for the original variables in each model are presented in Table 1. In the first model, the original
variables are simply the six management indices. In the second model, the original variables are
twenty components of the six management indices.4 Results from the first factor analysis model
should indicate whether or not the six indices are actually measuring distinct aspects of store
management practices. Results from the second factor analysis should indicate whether or not
scores for index components are actually associated with underlying factors that correspond to
the indices.
A three step process was used in conducting both factor analyses. First, a principal
components analysis was performed and a scree test was used to determine the number of factors
to retain. The scree test is based on a graph of successive eigenvalues of the transformed
correlation matrix. The point at which the plot abruptly levels out signals the cutoff point for
retained factors. Second, the factor analysis was performed again with the limited number of
factors. Finally, the factors were rotated to facilitate interpretation. Two types of rotations can
be performed: orthogonal and oblique. An orthogonal rotation requires the factors to remain
uncorrelated while an oblique rotation does not. Since there was no prior evidence to warrant the
assumption of orthogonal factors, an oblique rotation, promax, was used.
Rotated factor loadings for the two models are presented in Table 2. To make the table
easier to read and the results easier to interpret, only factor loadings greater than 0.25 in absolute

8
Table 1. Variable Definitions and Abbreviations for Factor Analysis Models
Variable Definition Abbreviation Model 1 Model 2
Supply Chain Index SCScr X
• Data sharing technologies SCData X
• Category management technologies SCCatMan X
• Decision sharing, pricing, advertising, promotions SCDSPAP X
• Decision sharing, shelf space and merchandising SCDSSM X
Human Resources Index HRScr X
• Training for deli, cashier, other HRTrain X
• Percent full-time employees HRPerFt X
• Use of performance-based compensation HRPerPay X
• Non-cash benefits HRBen X
Food Handling Index FHScr X
• Target temperatures FHTTemp X
• Temperature checks FHTChk X
• Sanitation audits FHSanAud X
• Dating information FHDating X
• Inventory rotation FHInv X
• Food safety training FHTrain X
Environmental Practices Index EPScr X
• Consumer-oriented environmental practices EPCon X
• Store operations environmental practices EPStore X
Quality Assurance Index QAScr X
• Customer satisfaction assessment tools QACSat X
Service Offerings Index SOScr X
• Fax and Internet ordering SOFaxInt X
• Home meal replacement services SOHMR X
• Other services SOOther X

9
Table 2. Rotated Factor Loadings for Models 1 and 2
Model 1 Model 2
Variable Factor 1 Factor 2 Factor 3 Factor 1 Factor 2 Factor 3 Factor 4
SCScr 0.4591
• SCData 0.6429
• SCCatMan 0.5553
• SCDSPAP 0.8282
• SCDSSM 0.8163
HRScr 0.4094
• HRTrain 0.4217
• HRPerFt
• HRPerPay
• HRBen 0.6645
FHScr -0.7532
• FHTTemp
• FHTChk
• FHSanAud 0.3270
• FHDating 0.3615
• FHInv 0.4931
• FHTrain 0.3584
EPScr 0.5798
• EPCon 0.5678
• EPStore 0.5834
QAScr -0.6716
• QACSat 0.5385
SOScr 0.5859
• SOFaxInt 0.4207
• SOHMR 0.2497 0.3888
• SOOther 0.3156 0.3571

10
value are reported. Three factors were retained in Model 1. Each factor loads on two indices.
Factor 1, which loads on environmental practices and service offerings, can be interpreted as a
“services” factor, since consumer services are also an important component of the environmental
practices index. Factor 2, which loads on the food handling and quality assurance indices, can be
interpreted as a “quality control” factor. Because the factor loadings are negative for each index,
however, higher scores for this factor are associated with less attention to quality control.
Finally, Factor 3, which loads on the supply chain and human resources indices, can be
interpreted as an “operational efficiency” factor. The results for this model suggest that the six
indices are not measuring independent sets of store management practice characteristics.
Four factors were retained for Model 2. Factor 1 loads on components of five of the six
original indices. Since all might be considered progressive management practices, this can be
interpreted as a “progressiveness” factor. Factor 2 loads on the two decision sharing components
of the supply chain index and so can be interpreted as a “decision sharing” factor. Factor 3 loads
on the three components of the original service offerings index, training from the human resource
and food handling indices, and food sanitation audits and can be interpreted as an “outstanding
service” factor. This is actually a logical combination of variables since training and good
sanitation practices are needed to deliver outstanding service, especially in the area of home meal
replacement. Finally, Factor 4 loads on dating and inventory rotation practices and can be
interpreted as a “fresh food” factor. The results for this model suggest that the original indices
may not have grouped variables correctly. Variables from several of the original indices load on
the “progressiveness” and “outstanding service” factors, and subsets of the supply chain and food
handling indices are separated out in the “decision sharing” and “fresh food” factors.

5 A store’s factor score is constructed by multiplying the transposed vector of factor scoringcoefficients by the vector of component variable values for the store. See Harmon (pp 363-376)for a good discussion of scoring procedures.
6 The union workforce variable was not included in the human resource index because decisionson unionization are often outside the control of store management
11
Using Alternative Management Practices Models in Predicting Store Performance
King, Wolfson, and Seltzer use the six management indices, along with other variables
describing store and market characteristics, in regression analyses designed to identify factors
associated with superior store performance. In this section we report results for regressions in
which we substitute factor scores based on the two factor analysis models for the management
indices.5 We consider four key performance measures: (1) weekly sales per square foot of selling
area, (2) sales per labor hour, (3) annual inventory turns, and (4) annual percentage sales growth.
The regression model for each performance measure includes four groups of explanatoryvariables.
C Market Characteristics variables include: population density (PopDen) and medianhousehold income (HHInc) for the zip code in which the store is located and a binaryvariable indicating whether the store is located in a metropolitan area (SMSA).
C Store Characteristics variables include: store selling area (SellSize), three binaryvariables indicating store format – superstore/upscale (US), food/drug combination(FD), and warehouse (WH) with conventional being considered the base format – thenumber of stores owned and operated by the store’s owner (Gsize), and binaryvariables indicating whether the store is part of a self-distributing group (SelfDist)and if the store has a union workforce (Union).6
C Competitive Strategy variables include four non-mutually exclusive binary variablesindicating whether the store considers itself to the price leader (PLeader) qualityleader (QLeader) service leader (SLeader), and/or variety leader (VLeader) in itslocal market.
C Management Practices variables in the base model include the six managementindices: supply chain (SCScr), human resources (HRScr), food handing (FHScr),environmental practices (EPScr), quality assurance (QAScr), and service offerings

12
(SOScr). For Model 1 they include scores based on rotated loadings for the threeretained factors: Services, Quality Control, and Operational Efficiency. ForModel 2 they include scores based on rotated loadings for the four retained factors:Progressiveness, Decision Sharing, Outstanding Service, and Fresh Food.
For each performance measure, the statistical model is a simple linear equation including
all the variables in each category, a constant term, and an additive error term. Heteroskedasticity
was not expected to be a problem, since the dependent variables are either output/input ratios or
percentage changes. On the other hand, multicollinearity was expected to be a problem, since
correlations are high among some of the explanatory variables. Finally, stores with missing
values were dropped from the analysis for each performance measure. Therefore the sample size
differs across regressions.
Regression results for weekly sales per square foot of selling area, a common measure of
efficiency in space utilization, are presented in Table 3. Overall goodness of fit is similar for the
original model and Model 1 but is slightly lower for Model 2. Signs and statistical significance
levels for parameters in the first three variable groups are similar across the three models. Higher
sales per square foot levels are associated with higher population density, superstore/upscale and
warehouse formats, unionization, and price and service leadership. On the other hand, stores
with larger selling areas tend to have lower levels of sales per square foot. One management
practice variable is statistically significant at the 5% level in each model – the supply chain score
in the original model, the operational efficiency factor in Model 1, and the progressiveness factor
in Model 2. Considering the factor loadings, the results for Model 2 suggest that the technology
component of the original supply chain index is more closely associated with sales per square
foot than is the decision sharing component.

13
Table 3. Regression Results for Weekly Sales per Square Foot
Original Indices Model 1 Model 2
Coef. t Coef. t Coef. t
Constant 5.798009 3.004 ** 8.689401 6.698 ** 8.348495 6.413 **
MARKET CHARACTERISTICS PopDen 0.000302 2.130 ** 0.000313 2.284 ** 0.000334 2.380 **
HHInc -0.000014 -0.443 -0.000014 -0.483 -0.000014 -0.461 SMSA 1.229171 1.547 1.194019 1.533 1.002897 1.250
STORE CHARACTERISTICS SellSize -0.000142 -5.077 ** -0.000143 -5.504 ** -0.000125 -4.664 **
US 2.851495 3.142 ** 2.865911 3.208 ** 2.656039 2.870 **
FD 1.598191 1.610 1.591015 1.623 1.597956 1.585 WH 3.498068 2.417 ** 3.478849 2.616 ** 3.102200 2.219 **
Gsize 0.000149 0.336 0.000164 0.375 0.000009 0.019 SelfDist -0.159585 -0.207 -0.113200 -0.154 0.135713 0.182 Union 2.332461 3.296 ** 2.395206 3.490 ** 1.918322 2.647 **
COMPETITIVE STRATEGY Pleader 1.873111 2.930 ** 1.906825 3.039 ** 2.004984 3.082 **
Qleader 0.214523 0.268 0.234860 0.308 0.213303 0.271 Sleader 1.252109 1.772 * 1.220732 1.759 * 1.013601 1.441 Vleader -0.044648 -0.061 -0.055840 -0.078 0.122746 0.166
MANAGEMENT PRACTICESOriginal Indices SCScr 0.036976 2.062 **
HRScr 0.045727 1.529 FHScr -0.016773 -0.814 EPScr 0.018116 1.263 QAScr -0.005459 -0.178 SOScr -0.014944 -0.637Model 1 Services -0.698837 -0.684 Quality Control 0.462871 0.908 Operational Efficiency 2.658485 2.545 **
Model 2 Progressiveness 1.172022 2.376 **
Decision Sharing 0.271522 0.706 Outstanding Service -0.509623 -1.118 Fresh Food -0.800859 -1.504
Observations 140 140 140R-squared 0.4492 0.4475 0.4277Adj R-Squared 0.3566 0.3705 0.3426
* Denotes statistical significance at the 10% level for a two-tailed test.** Denotes statistical significance at the 5% level for a two-tailed test.

14
Regression results for sales per labor hour are presented in Table 4. Overall goodness of
fit for this measure of efficiency in labor utilization is best for Model 2 and is similar for the
original model and Model 1. Once again, parameter signs and significance levels are similar
across all three models for explanatory variables in the first three groups. Labor efficiency is
positively associated with population density and unionization. In addition, price leadership has
a positive sign that is statistically significant at the 10% level in Model 2. None of the
management practices variables is statistically significant in the original model or Model 1. The
progressiveness factor has a positive coefficient that is statistically significant at the 5% level in
Model 2. This makes good sense, since this factor contains adoption rates for technologies that
may enhance labor productivity. Once again, then, the grouping of management practice
variables in Model 2 yields statistical results with more meaningful interpretation.
Regression results for annual inventory turns, a measure of efficiency in managing
product inventory, are presented in Table 5. The overall goodness of fit for Model 2 is slightly
better than that for the original model, and both these models perform considerably better than
Model 1. In all three models, unionization and quality leadership are strongly associated with
higher inventory turn levels, and the binary variable for membership in a self distributing group
has a positive, statistically significant parameter for the original model and Model 2. On the
other hand, lower inventory turn levels are associated with higher population density and the
food/drug combination and warehouse formats. Three of the six management indices have
statistically significant coefficients in the original model – human resources with a positive
coefficient and environmental practices and quality assurance with negative coefficients. It is
difficult to develop a plausible explanation for these particular indices being linked strongly to

15
Table 4. Regression Results for Sales per Labor Hour
Original Indices Model 1 Model 2Coef. t Coef. t Coef. t
Constant 57.121660 3.646** 94.231800 9.306** 98.331430 9.993**
MARKET CHARACTERISTICS PopDen 0.003470 2.592** 0.003653 2.804** 0.004047 3.125**
HHInc 0.000126 0.520 0.000151 0.650 0.000020 0.092 SMSA -4.547183 -0.744 -4.331418 -0.726 -4.906164 -0.829
STORE CHARACTERISTICS SellSize -0.000088 -0.425 -0.000132 -0.665 -0.000104 -0.530 US -7.865636 -1.139 -7.886537 -1.163 -6.025246 -0.890 FD 2.382587 0.314 2.009831 0.269 4.427972 0.601 WH 15.565160 1.399 18.530490 1.825 13.599720 1.312 GSize 0.002627 0.793 0.002514 0.769 0.000587 0.179 SelfDist -3.391764 -0.570 -3.454071 -0.597 -3.012216 -0.527 Union 20.092240 3.632** 19.644740 3.665** 18.365100 3.396**
COMPETITIVE STRATEGY PLeader 7.093616 1.470 7.134465 1.501 9.151503 1.936 * QLeader -1.858092 -0.301 -0.891820 -0.149 0.151317 0.026 SLeader -4.253926 -0.743 -4.088733 -0.727 -6.136457 -1.115 VLeader 1.916913 0.335 1.739104 0.309 2.330580 0.425
MANAGEMENT PRACTICESOriginal Indices SCScr 0.106285 0.789 HRScr 0.238946 0.992 FHScr -0.108128 -0.661 EPScr 0.181326 1.519 QAScr 0.302204 1.248 SOScr -0.061139 -0.322Model 1 Services 3.240626 0.371 Quality Control -0.961885 -0.223 Operational Efficiency 9.288145 1.126Model 2 Progressiveness 14.207450 3.683**
Decision Sharing -0.477550 -0.175 Outstanding Service -4.651837 -1.311 Fresh Food 1.670579 0.423
Observations 119 119 119R-squared 0.4692 0.4646 0.4858Adj R-Squared 0.3608 0.3745 0.3933
* Denotes statistical significance at the 10% level for a two-tailed test.** Denotes statistical significance at the 5% level for a two-tailed test.

16
Table 5. Regression Results for Annual Inventory Turns
Original Indices Model 1 Model 2Coef. t Coef. t Coef. t
Constant 23.326190 3.068** 18.019420 3.837** 19.804690 4.111**
MARKET CHARACTERISTICS PopDen -0.001403 -2.637** -0.001253 -2.357** -0.001116 -2.296**
HHInc -0.000147 -1.336 -0.000174 -1.579 -0.000181 -1.798 SMSA 4.347022 1.486 3.715374 1.257 3.497997 1.239
STORE CHARACTERISTICS SellSize 0.000003 0.027 0.000041 0.381 -0.000005 -0.048 US 0.782148 0.215 0.683257 0.192 0.381669 0.115 FD -11.729650 -3.095** -8.599085 -2.374** -9.325903 -2.663**
WH -8.884632 -2.066** -9.810598 -2.335** -9.015442 -2.192**
GSize 0.001221 0.632 0.000002 0.001 0.000794 0.422 SelfDist 5.455817 1.867 * 4.497111 1.525 5.702450 2.088**
Union 8.892669 3.534** 8.334577 3.365** 7.130675 2.994**
COMPETITIVE STRATEGY PLeader -1.103641 -0.460 -1.176143 -0.497 -0.197608 -0.087 QLeader 8.906931 2.976** 7.788750 2.706** 7.622502 2.801**
SLeader -3.489916 -1.264 -2.588364 -0.965 -3.022232 -1.228 VLeader 0.632459 0.256 -0.094281 -0.039 -1.732318 -0.774
MANAGEMENT PRACTICESOriginal Indices SCScr 0.027276 0.489 HRScr 0.218579 2.074**
FHScr 0.054585 0.697 EPScr -0.097083 -2.072**
QAScr -0.221524 -1.895**
SOScr -0.011718 -0.139Model 1 Services -7.921053 -2.102**
Quality Control 0.960322 0.590 Operational Efficiency 6.939750 1.850 *Model 2 Progressiveness -0.429920 -0.257 Decision Sharing 3.754289 3.419**
Outstanding Service -4.249783 -2.450**
Fresh Food -0.816268 -0.504
Observations 88 88 88R-squared 0.4208 0.3712 0.4320Adj R-Squared 0.2479 0.2184 0.2838
* Denotes statistical significance at the 10% level for a two-tailed test.** Denotes statistical significance at the 5% level for a two-tailed test.

17
inventory management. Two factors have statistically significant coefficients in Model 1 –
services with a negative sign and operational efficiency with a positive sign. Recall that the
services factor loads on the environmental practices and service offerings indices, while the
operational efficiency factor loads on the supply chain and human resources indices. Finally, two
factors have statistically significant signs in Model 2. The coefficient for the decision sharing
factor has a positive sign, indicating that the presence of decision sharing relationships with
parties outside the store is associated with superior inventory management. This is consistent
with expectations. The coefficient for the outstanding service factor has a negative sign,
suggesting that stores with strong service offerings may carry higher inventory levels for a wider
range of products in order to be able to consistently meet customer expectations.
Regression results for annual sales growth are presented in Table 6. Model 2 clearly has
the best overall goodness of fit, followed by the original model and Model 1. Higher levels of
sales growth are associated with higher population density and price and quality leadership in all
models and with higher median household income in the original model and Model 1. On the
other hand, lower sales growth is associated with the warehouse format and membership in larger
ownership groups in all models, with a service leadership strategy in Models 1 and 2 and with
larger selling area in Model 2. Only one management practice index has a statistically significant
coefficient in the original model, but it is difficult to explain why more progressive human
resource policies would be associated with lower sales growth. No management practice factors
have statistically significant coefficients in Model 1, but two factors have statistically significant
coefficients in Model 2. Increases in the decision sharing factor score are associated with lower
sales growth. One possible interpretation for this is that adaptation to local conditions, which is

18
Table 6. Regression Results for Annual Sales Growth
Original Indices Model 1 Model 2
Coef. t Coef. t Coef. t
Constant 1.019328 18.789** 0.963297 29.005** 0.966616 30.332**
MARKET CHARACTERISTICS PopDen 0.000006 1.723 * 0.000007 2.033** 0.000008 2.469**
HHInc 0.000001 1.932 * 0.000002 2.020** 0.000001 1.320 SMSA 0.002132 0.109 -0.004368 -0.224 0.011971 0.640
STORE CHARACTERISTICS SellSize -0.000001 -1.451 -0.000001 -1.583 -0.000001 -2.170**
US 0.008418 0.379 0.008122 0.363 0.033178 1.496 FD 0.008381 0.296 0.005189 0.182 0.010373 0.386 WH -0.076902 -2.129** -0.084746 -2.433** -0.074416 -2.236**
GSize -0.000025 -2.200** -0.000024 -2.105** -0.000019 -1.736 * SelfDist 0.022474 1.097 0.028135 1.424 0.028490 1.597 Union 0.008789 0.504 0.016340 0.952 0.029532 1.774 *
COMPETITIVE STRATEGY PLeader 0.039295 2.536** 0.044046 2.853** 0.055315 3.746**
QLeader 0.039771 1.990** 0.039137 2.009** 0.039967 2.181**
SLeader -0.028234 -1.610 -0.030519 -1.736 * -0.034013 -2.076**
VLeader 0.015389 0.818 0.015148 0.801 0.010705 0.600
MANAGEMENT PRACTICESOriginal Indices SCScr 0.000450 0.994 HRScr -0.001338 -1.737 * FHScr 0.000504 0.944 EPScr 0.000127 0.356 QAScr -0.000455 -0.578 SOScr -0.000649 -1.133Model 1 Services -0.020440 -0.778 Quality Control -0.011215 -0.868 Operational Efficiency 0.003901 0.140Model 2 Progressiveness -0.003379 -0.292 Decision Sharing -0.034197 -2.690**
Outstanding Service -0.012948 -1.183 Fresh Food 0.039896 3.185**
Observations 127 127 127R-squared 0.3670 0.3372 0.4179Adj R-Squared 0.2475 0.2338 0.3209
* Denotes statistical significance at the 10% level for a two-tailed test.** Denotes statistical significance at the 5% level for a two-tailed test.

19
highest when decisions are made at the store level, may promote sales growth. If this is true, it
may also help explain the negative sign for the ownership group size variable. Higher levels for
the fresh food factor score are associated with higher sales growth, suggesting that attention to
this aspect of quality assurance may be a key to faster growth.
Looking across the results for all four performance measures, Model 2 has the best
overall fit for three of the four measures, and the results from Model 2 are, in general, easier to
interpret. On the other hand, Model 1, which is a statistically-based simplification of the original
management indices, performs poorly relative to the other models. Despite the superior
performance of Model 2, the original model is also attractive because the indices are linked to
facets of management that practitioners recognize as distinct and important. Nevertheless, the
results of this analysis call the breakdowns of activities based on expert opinion into question.
Concluding Remarks
The results presented in this paper suggest that information summarized by the six
management practice indices developed for the 2000 Supermarket Panel can be represented more
parsimoniously and more effectively by scores based on factor analysis. The four retained factors
for Model 2 are readily related to recognized management issues. The progressiveness and
outstanding service factors load on components of several of the original indices, while the
decision sharing and fresh food factors load on components that had been combined with others
in the supply chain and food handling indices. Each of the factors for Model 2 was statistically
significant in at least one of the performance regressions, indicating that all are associated with
store performance.

20
Data collection for the 2001 Supermarket Panel has been completed. An identical factor
analysis will be conducted for these new data to determine whether the results from this analysis
are statistically robust.

21
References
Gorsuch, Richard L. Factor Analysis. Hillsdale, N.J.: L. Erlbaum Associates, 1983.
Harman, Harry H. Modern Factor Analysis. Chicago: University of Chicago Press, 1976.
King, Robert P., Paul J. Wolfson, and Jonathan M. Seltzer. The 2000 Supermarket Panel Annual
Report. St. Paul, MN: The Retail Food Industry Center, University of Minnesota, 2000.
Kline, Paul. An Easy Guide to Factor Analysis. London: Routledge, 1994.
Sixty-Seventh Annual Report of the Grocery Industry. Stamford, CT: Progressive Grocer, 2000.
StataCorp. Stata Statistical Software: Release 6.0. College Station, TX: Stata Corporation,
1999.
Related Documents