arXiv:astro-ph/0503445v1 21 Mar 2005 A Dynamical Simulation of the Debris Disk Around HD 141569A D. R. Ardila 1 , S. H. Lubow 2 , D. A. Golimowski 1 , J. E. Krist 2 , M. Clampin 7 , H. C. Ford 1 , G. F. Hartig 2 , G. D. Illingworth 3 , F. Bartko 4 , N. Ben´ ıtez 1 , J. P. Blakeslee 1 , R. J. Bouwens 1 , L. D. Bradley 1 , T. J. Broadhurst 5 , R. A. Brown 2 , C. J. Burrows 2 , E. S. Cheng 6 , N. J. G. Cross 1 , P. D. Feldman 1 , M. Franx 8 , T. Goto 1 , C. Gronwall 9 , B. Holden 3 , N. Homeier 1 , L. Infante 10 R. A. Kimble 7 , M. P. Lesser 11 , A. R. Martel 1 , F. Menanteau 1 , G. R. Meurer 1 , G. K. Miley 8 , M. Postman 2 , M. Sirianni 2 , W. B. Sparks 2 , H. D. Tran 13 , Z. I. Tsvetanov 1 , R. L. White 2 , W. Zheng 1 & A. W. Zirm 8 ABSTRACT We study the dynamical origin of the structures observed in the scattered- light images of the resolved debris disk around HD 141569A. The disk has two conspicuous spiral rings and two large-scale spiral arms. We explore the roles of radiation pressure from the central star, gas drag from the gas disk, and the tidal forces from two nearby stars in creating and maintaining these structures. The 1 Department of Physics and Astronomy, Johns Hopkins University, 3400 North Charles Street, Baltimore, MD 21218. 2 STScI, 3700 San Martin Drive, Baltimore, MD 21218. 3 UCO/Lick Observatory, University of California, Santa Cruz, CA 95064. 4 Bartko Science & Technology, 14520 Akron Street, Brighton, CO 80602. 5 Racah Institute of Physics, The Hebrew University, Jerusalem, Israel 91904. 6 Conceptual Analytics, LLC, 8209 Woburn Abbey Road, Glenn Dale, MD 20769 7 NASA Goddard Space Flight Center, Code 681, Greenbelt, MD 20771. 8 Leiden Observatory, Postbus 9513, 2300 RA Leiden, Netherlands. 9 Department of Astronomy and Astrophysics, The Pennsylvania State University, 525 Davey Lab, Uni- versity Park, PA 16802. 10 Departmento de Astronom´ ıa y Astrof´ ısica, Pontificia Universidad Cat´ ølica de Chile, Casilla 306, Santiago 22, Chile. 11 Steward Observatory, University of Arizona, Tucson, AZ 85721. 12 European Southern Observatory, Karl-Schwarzschild-Strasse 2, D-85748 Garching, Germany. 13 W. M. Keck Observatory, 65-1120 Mamalahoa Hwy., Kamuela, HI 96743

Welcome message from author
This document is posted to help you gain knowledge. Please leave a comment to let me know what you think about it! Share it to your friends and learn new things together.
Transcript
arX
iv:a
stro
-ph/
0503
445v
1 2
1 M
ar 2
005
A Dynamical Simulation of the Debris Disk Around HD 141569A
D. R. Ardila1, S. H. Lubow2, D. A. Golimowski1, J. E. Krist2, M. Clampin7, H. C. Ford1,
G. F. Hartig2, G. D. Illingworth3, F. Bartko4, N. Benıtez1, J. P. Blakeslee1, R. J.
Bouwens1, L. D. Bradley1, T. J. Broadhurst5, R. A. Brown2, C. J. Burrows2, E. S. Cheng6,
N. J. G. Cross1, P. D. Feldman1, M. Franx8, T. Goto1, C. Gronwall9, B. Holden3, N.
Homeier1, L. Infante10 R. A. Kimble7, M. P. Lesser11, A. R. Martel1, F. Menanteau1, G. R.
Meurer1, G. K. Miley8, M. Postman2, M. Sirianni2, W. B. Sparks2, H. D. Tran13, Z. I.
Tsvetanov1, R. L. White2, W. Zheng1 & A. W. Zirm8
ABSTRACT
We study the dynamical origin of the structures observed in the scattered-
light images of the resolved debris disk around HD 141569A. The disk has two
conspicuous spiral rings and two large-scale spiral arms. We explore the roles of
radiation pressure from the central star, gas drag from the gas disk, and the tidal
forces from two nearby stars in creating and maintaining these structures. The
1Department of Physics and Astronomy, Johns Hopkins University, 3400 North Charles Street, Baltimore,
MD 21218.
2STScI, 3700 San Martin Drive, Baltimore, MD 21218.
3UCO/Lick Observatory, University of California, Santa Cruz, CA 95064.
4Bartko Science & Technology, 14520 Akron Street, Brighton, CO 80602.
5Racah Institute of Physics, The Hebrew University, Jerusalem, Israel 91904.
6Conceptual Analytics, LLC, 8209 Woburn Abbey Road, Glenn Dale, MD 20769
7NASA Goddard Space Flight Center, Code 681, Greenbelt, MD 20771.
8Leiden Observatory, Postbus 9513, 2300 RA Leiden, Netherlands.
9Department of Astronomy and Astrophysics, The Pennsylvania State University, 525 Davey Lab, Uni-
versity Park, PA 16802.
10Departmento de Astronomıa y Astrofısica, Pontificia Universidad Catølica de Chile, Casilla 306, Santiago
22, Chile.
11Steward Observatory, University of Arizona, Tucson, AZ 85721.
12European Southern Observatory, Karl-Schwarzschild-Strasse 2, D-85748 Garching, Germany.
13W. M. Keck Observatory, 65-1120 Mamalahoa Hwy., Kamuela, HI 96743
– 2 –
disk’s color, scattering function, and infrared emission suggest that submicron-
sized grains dominate the dust population observed in scattered light. CO obser-
vations indicate the presence of up to 60 M⊕ of gas. The dust grains are subject
to the competing effects of expulsive radiation pressure (β > 1, where β is the
ratio of the radiation and gravitational forces) and retentive gas drag. We use
a simple one-dimensional axisymmetric model to show that the presence of the
gas helps confine the dust and that a broad ring of dust is produced if a central
hole exists in the disk. This model also suggests that the disk is in a transient,
excited dynamical state, as the observed dust creation rate applied over the age
of the star is inconsistent with submillimeter mass measurements. We model in
two dimensions the effects of a fly-by encounter between the disk and a binary
star in a prograde, parabolic, coplanar orbit. We track the spatial distribution
of the disk’s gas, planetesimals, and dust. We conclude that the surface density
distribution reflects the planetesimal distribution for a wide range of parameters.
Our most viable model features a disk of initial radius 400 AU, a gas mass of
50M⊕, and β = 4 and suggests that the system is being observed within 4000 yr
of the fly-by periastron. The model reproduces some features of HD 141569A’s
disk, such as a broad single ring and large spiral arms, but it does not reproduce
the observed multiple spiral rings or disk asymmetries nor the observed clearing
in the inner disk. For the latter, we consider the effect of a 5 MJup planet in an
eccentric orbit on the planetesimal distribution of HD 141569A.
Subject headings: hydrodynamics — planetary systems: formation — planetary
systems: protoplanetary disks — stars: individual (HD 141569) — circumstellar
matter
1. Introduction
Debris disks around main-sequence stars are dusty, optically thin, and gas-poor. Radi-
ation pressure (RP) and Poynting-Robertson (PR) drag eliminate dust grains on timescales
shorter than the stellar age, so the observed dust must be continuously replenished by col-
lisions among, or evaporation of, planetesimals (Backman & Paresce 1993). The Infrared
Astronomical Satellite (IRAS) and the Infrared Space Observatory (ISO) revealed over 100
stars with far-infrared excesses indicating the presence of debris disks. However, spatially
resolved images of these disks are relatively rare: only about a dozen debris disks have been
resolved since the early 1980s (see Zuckerman 2001 and references therein).
The resolved disks are not featureless. They frequently display warps, spiral structures,
– 3 –
and other azimuthal and radial asymmetries. Different mechanisms have been suggested to
explain these features. They may be caused by interactions between the dust and the gas
in the disk (Takeuchi & Artymowicz 2001, hereafter TA01), the formation of small planets
(Kenyon & Bromley 2004), the dynamical forces of embedded planets (Ozernoy et al. 2000),
or stellar-mass companions (Larwood & Kalas 2001; Augereau & Papaloizou 2004; Quillen
et al. 2005). Whatever their cause(s), the features observed in the dust disks provide insight
into the characteristics of the unseen planetesimal population and illuminate the dynamical
processes of young planetary systems.
HD 141569A (A0 V; age 5±3 Myr, Weinberger et al. 2000) has a resolved circumstellar
debris disk. Its Hipparcos distance is 99 pc from the Sun and has co-moving M2 V and
M4 V companions separated by 1.4” and located at distances of 7.′′55 and 8.′′93, respectively
(Weinberger et al. 2000; Augereau et al. 1999). The disk was first resolved in scattered light
by Weinberger et al. (1999) and Augereau et al. (1999) using the Hubble Space Telescope’s
(HST’s) Near-Infrared Camera Multi-Object Spectrometer (NICMOS). Mouillet et al. (2001)
imaged the disk with HST’s Space Telescope Imaging Spectrograph (STIS) and noticed
strong brightness asymmetries. These observations have recently been complemented by
images from HST’s Advanced Camera for Surveys (ACS) (Clampin et al. 2003, hereafter
C03). Together, these scattered-light images reveal very complex structure, including an
inner clearing within 175 AU of the star, a bright spiral “ring” with a sharp inner edge from
175 to 215 AU, a faint zone from 215 to 300 AU, and a broad spiral “ring” from 300 to
400 AU (C03). These distances are measured along the projected disk’s southern semimajor
axis. (For convenience, we will hereafter refer to the two tightly-wound spiral rings simply
as “rings.”) C03 also observed two low-intensity, large-scale spiral arms in the outermost
part of the disk, that they attributed to tidal interaction with the M dwarf companions.
The influence of the M dwarf companions on the disk’s morphology was first discussed
by Weinberger et al. (2000). They argued that if all three stars were coplanar with the
disk, the system would not be stable. Given its young age, however, the system may be
bound. With this assumption, Weinberger et al. (2000) concluded that resonant interactions
between the companions and the disk do not account for the disk structure. Assuming that
the companions revolve around the primary star in a highly eccentric orbit, Augereau &
Papaloizou (2004) constructed dynamical models of the optical disk comprising dust grains
that respond to the stellar gravitational field. They assumed that the grains are large enough
that RP, PR drag, and gas drag are unimportant. They also ignored the presence of the large-
scale spiral arms reported by C03. Their model reproduces the general appearance of the
brightness asymmetries observed in the disk. Quillen et al. (2005) constructed hydrodynamic
models of HD 141569A’s gas disk without dust, and concluded also that the companions lie
in an eccentric orbit. Their models reproduced the large-scale spiral arms (even after several
– 4 –
periastron passages) and some other disk asymmetries.
TA01 modeled the interaction between disks of gas and intermediately-sized (& 8 µm)
dust grains, and Lecavelier Des Etangs, Vidal-Madjar, & Ferlet 1998 considered disks with
very small particles. It is not clear that the conditions explored by any of these models
is the correct one for the scattered light images of the disk around HD 141569A. In §2,
we argue that submicron-sized grains account for most of the scattering opacity at optical
wavelengths. Such small grains are subject to RP which quickly expels them from the disk.
The gas detected in the disk (Zuckerman et al. 1995) tempers somewhat the short “blow
out” timescales, but its mass is not enough to dominate the dynamics of the dust (§3). In
this paper, we explore the effects of strong RP, gas drag, and gravity on small dust grains,
using HD 141569A’s disk as a benchmark. We simultaneously track the behavior of three
different populations – the unseen planetesimals controlled by gravity, the gas controlled by
gravity and volumetric fluid forces, and the dust controlled by gravity, RP, and gas drag.
The insights obtained from this analysis should be applicable to other systems where RP is
important.
In §2, we review the observational constraints that every model of the system should
satisfy. We consider evidence that indicates the dominance of submicron-sized grains and we
set limits on the amount of gas in the disk. In §3, we explore the interaction between gas and
dust by means of a one-dimensional model. We show that the gas slows the outward motion
of the dust and can produce broad ring-like structures. In §4, we present two-dimensional
dynamical simulations of the interactions between planetesimals, dust grains, gas, and the
three stars. Assuming that the two M dwarf companions are co-moving but unbound, we
find that a recent parabolic fly-by causes some of the observed disk structure, including the
large-scale arms. However, our models produce a more disorganized disk than is observed.
We argue that the central hole in the disk can be produced by a planet with a mass a few
times that of Jupiter (or, alternatively, some number of smaller planets) in a highly eccentric
orbit about the primary star.
2. Observational Constraints
2.1. Grain Size
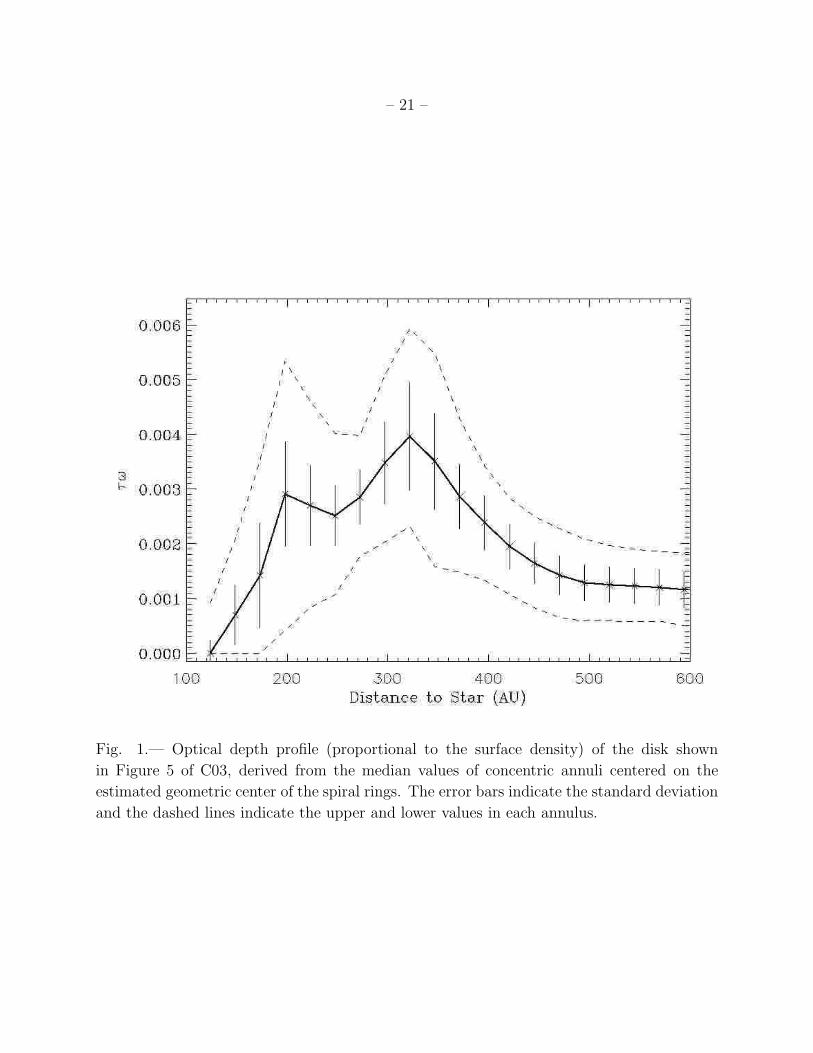
Figure 1 shows the optical depth profile of the disk, taken from Figure 5 of C03. This
profile represents the median values of concentric annuli centered on the primary star. Drawn
from a composite of F435W (ACS B band) and F606W (ACS broad-V band) images, it is
roughly indicative of the optical characteristics of the disk at 0.5 µm. Power-law fits to
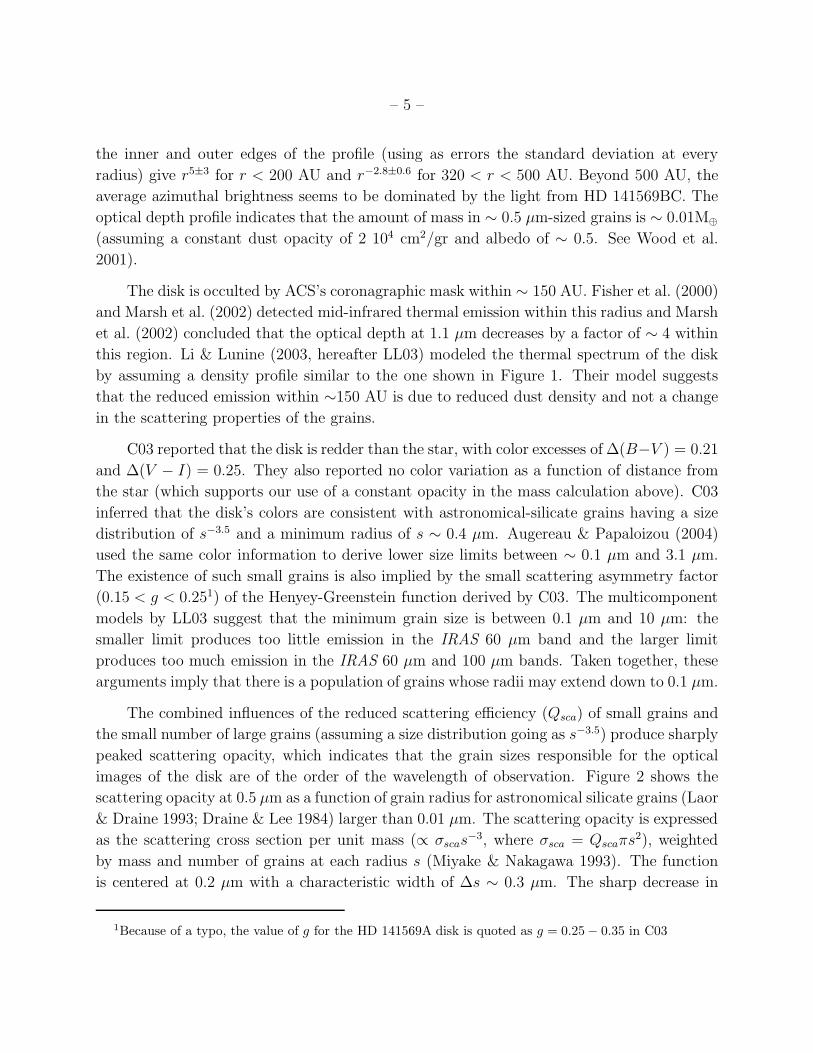
– 5 –
the inner and outer edges of the profile (using as errors the standard deviation at every
radius) give r5±3 for r < 200 AU and r−2.8±0.6 for 320 < r < 500 AU. Beyond 500 AU, the
average azimuthal brightness seems to be dominated by the light from HD 141569BC. The
optical depth profile indicates that the amount of mass in ∼ 0.5 µm-sized grains is ∼ 0.01M⊕
(assuming a constant dust opacity of 2 104 cm2/gr and albedo of ∼ 0.5. See Wood et al.
2001).
The disk is occulted by ACS’s coronagraphic mask within ∼ 150 AU. Fisher et al. (2000)
and Marsh et al. (2002) detected mid-infrared thermal emission within this radius and Marsh
et al. (2002) concluded that the optical depth at 1.1 µm decreases by a factor of ∼ 4 within
this region. Li & Lunine (2003, hereafter LL03) modeled the thermal spectrum of the disk
by assuming a density profile similar to the one shown in Figure 1. Their model suggests
that the reduced emission within ∼150 AU is due to reduced dust density and not a change
in the scattering properties of the grains.
C03 reported that the disk is redder than the star, with color excesses of ∆(B−V ) = 0.21
and ∆(V − I) = 0.25. They also reported no color variation as a function of distance from
the star (which supports our use of a constant opacity in the mass calculation above). C03
inferred that the disk’s colors are consistent with astronomical-silicate grains having a size
distribution of s−3.5 and a minimum radius of s ∼ 0.4 µm. Augereau & Papaloizou (2004)
used the same color information to derive lower size limits between ∼ 0.1 µm and 3.1 µm.
The existence of such small grains is also implied by the small scattering asymmetry factor
(0.15 < g < 0.251) of the Henyey-Greenstein function derived by C03. The multicomponent
models by LL03 suggest that the minimum grain size is between 0.1 µm and 10 µm: the
smaller limit produces too little emission in the IRAS 60 µm band and the larger limit
produces too much emission in the IRAS 60 µm and 100 µm bands. Taken together, these
arguments imply that there is a population of grains whose radii may extend down to 0.1 µm.
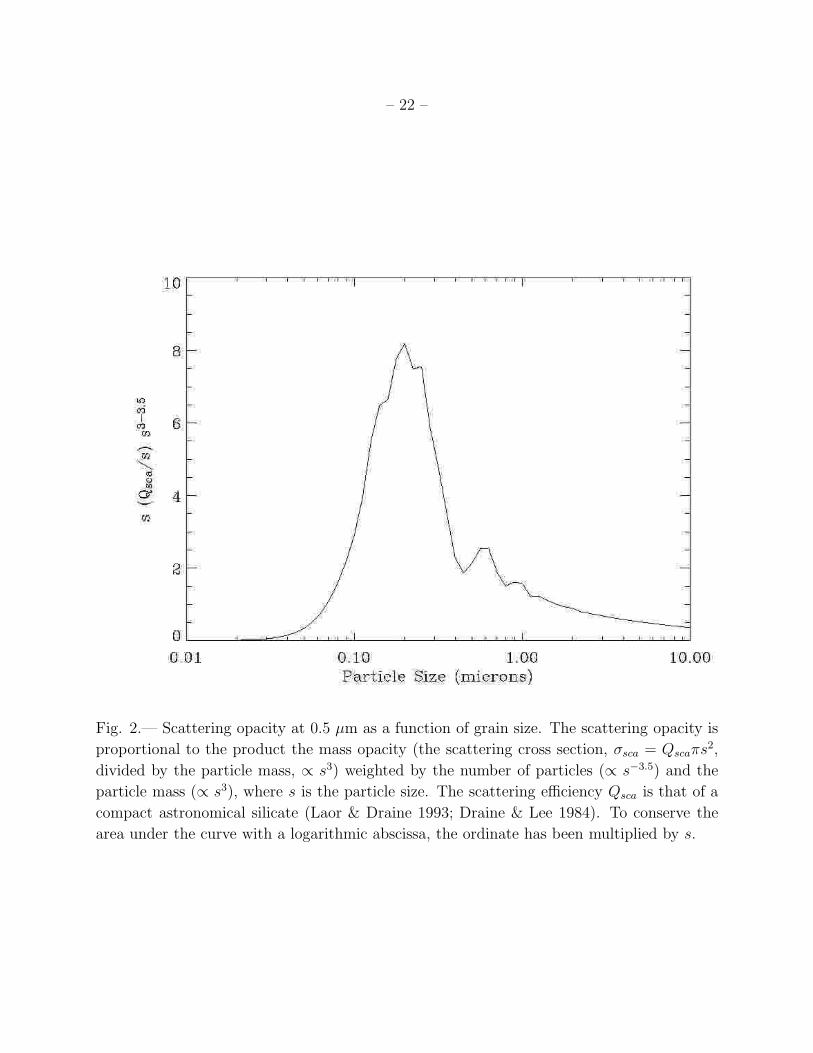
The combined influences of the reduced scattering efficiency (Qsca) of small grains and
the small number of large grains (assuming a size distribution going as s−3.5) produce sharply
peaked scattering opacity, which indicates that the grain sizes responsible for the optical
images of the disk are of the order of the wavelength of observation. Figure 2 shows the
scattering opacity at 0.5 µm as a function of grain radius for astronomical silicate grains (Laor
& Draine 1993; Draine & Lee 1984) larger than 0.01 µm. The scattering opacity is expressed
as the scattering cross section per unit mass (∝ σscas−3, where σsca = Qscaπs2), weighted
by mass and number of grains at each radius s (Miyake & Nakagawa 1993). The function
is centered at 0.2 µm with a characteristic width of ∆s ∼ 0.3 µm. The sharp decrease in
1Because of a typo, the value of g for the HD 141569A disk is quoted as g = 0.25 − 0.35 in C03
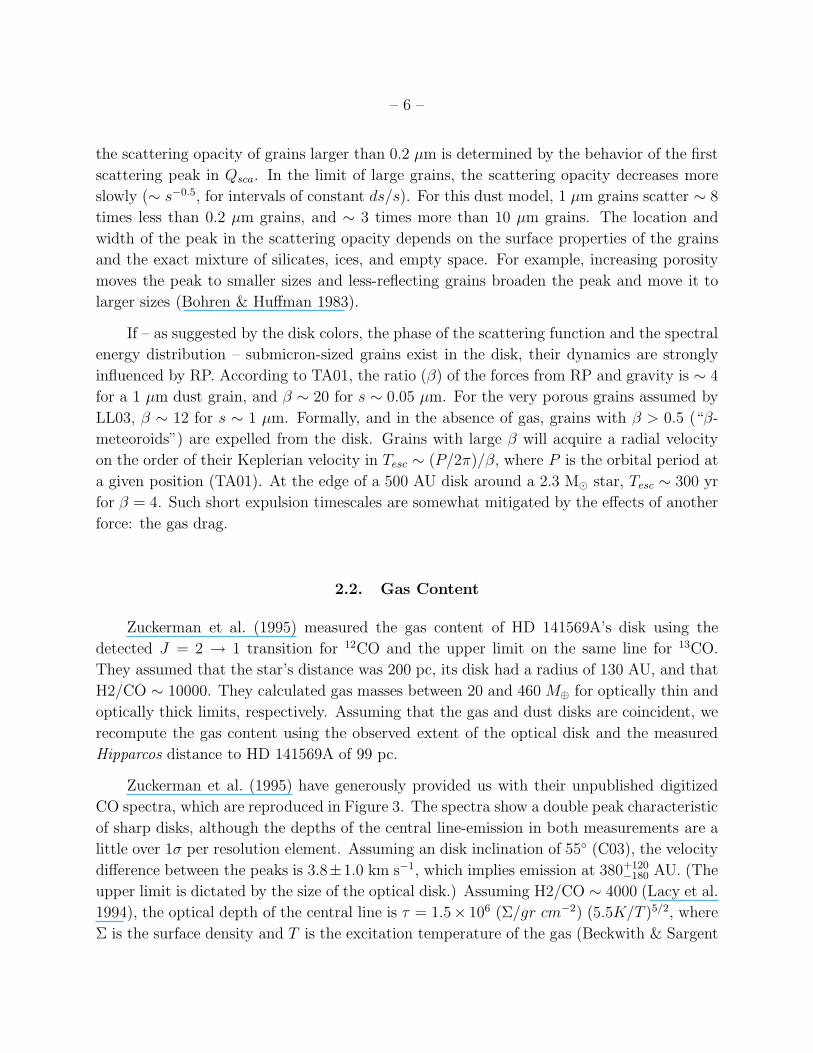
– 6 –
the scattering opacity of grains larger than 0.2 µm is determined by the behavior of the first
scattering peak in Qsca. In the limit of large grains, the scattering opacity decreases more
slowly (∼ s−0.5, for intervals of constant ds/s). For this dust model, 1 µm grains scatter ∼ 8
times less than 0.2 µm grains, and ∼ 3 times more than 10 µm grains. The location and
width of the peak in the scattering opacity depends on the surface properties of the grains
and the exact mixture of silicates, ices, and empty space. For example, increasing porosity
moves the peak to smaller sizes and less-reflecting grains broaden the peak and move it to
larger sizes (Bohren & Huffman 1983).
If – as suggested by the disk colors, the phase of the scattering function and the spectral
energy distribution – submicron-sized grains exist in the disk, their dynamics are strongly
influenced by RP. According to TA01, the ratio (β) of the forces from RP and gravity is ∼ 4
for a 1 µm dust grain, and β ∼ 20 for s ∼ 0.05 µm. For the very porous grains assumed by
LL03, β ∼ 12 for s ∼ 1 µm. Formally, and in the absence of gas, grains with β > 0.5 (“β-
meteoroids”) are expelled from the disk. Grains with large β will acquire a radial velocity
on the order of their Keplerian velocity in Tesc ∼ (P/2π)/β, where P is the orbital period at
a given position (TA01). At the edge of a 500 AU disk around a 2.3 M⊙ star, Tesc ∼ 300 yr
for β = 4. Such short expulsion timescales are somewhat mitigated by the effects of another
force: the gas drag.
2.2. Gas Content
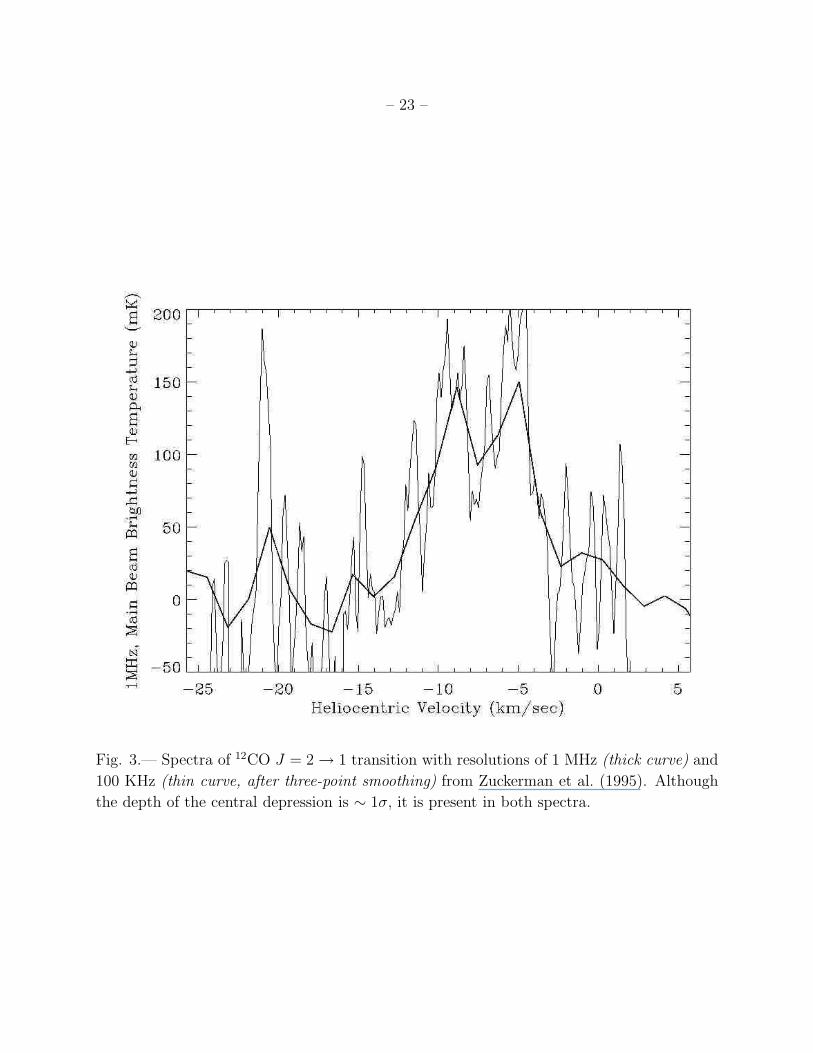
Zuckerman et al. (1995) measured the gas content of HD 141569A’s disk using the
detected J = 2 → 1 transition for 12CO and the upper limit on the same line for 13CO.
They assumed that the star’s distance was 200 pc, its disk had a radius of 130 AU, and that
H2/CO ∼ 10000. They calculated gas masses between 20 and 460 M⊕ for optically thin and
optically thick limits, respectively. Assuming that the gas and dust disks are coincident, we
recompute the gas content using the observed extent of the optical disk and the measured
Hipparcos distance to HD 141569A of 99 pc.
Zuckerman et al. (1995) have generously provided us with their unpublished digitized
CO spectra, which are reproduced in Figure 3. The spectra show a double peak characteristic
of sharp disks, although the depths of the central line-emission in both measurements are a
little over 1σ per resolution element. Assuming an disk inclination of 55 (C03), the velocity
difference between the peaks is 3.8±1.0 km s−1, which implies emission at 380+120−180 AU. (The
upper limit is dictated by the size of the optical disk.) Assuming H2/CO ∼ 4000 (Lacy et al.
1994), the optical depth of the central line is τ = 1.5× 10⁶ (Σ/gr cm−2) (5.5K/T )5/2, where
Σ is the surface density and T is the excitation temperature of the gas (Beckwith & Sargent
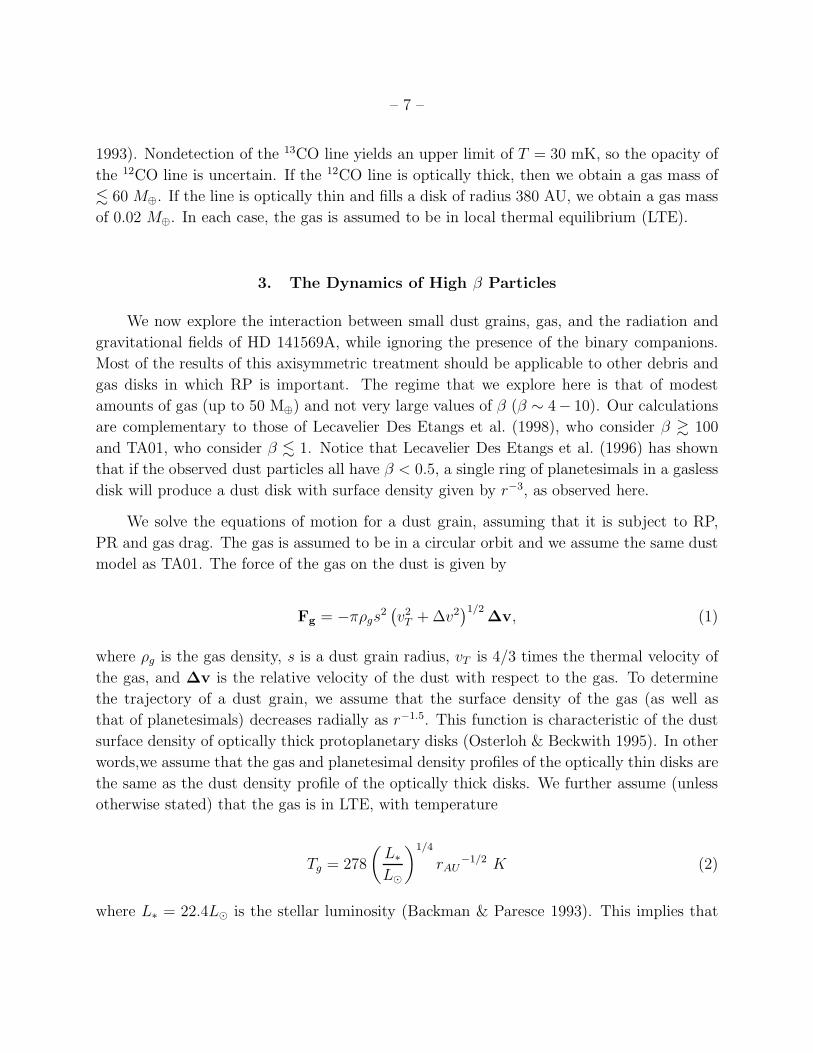
– 7 –
1993). Nondetection of the 13CO line yields an upper limit of T = 30 mK, so the opacity of
the 12CO line is uncertain. If the 12CO line is optically thick, then we obtain a gas mass of
. 60 M⊕. If the line is optically thin and fills a disk of radius 380 AU, we obtain a gas mass
of 0.02 M⊕. In each case, the gas is assumed to be in local thermal equilibrium (LTE).
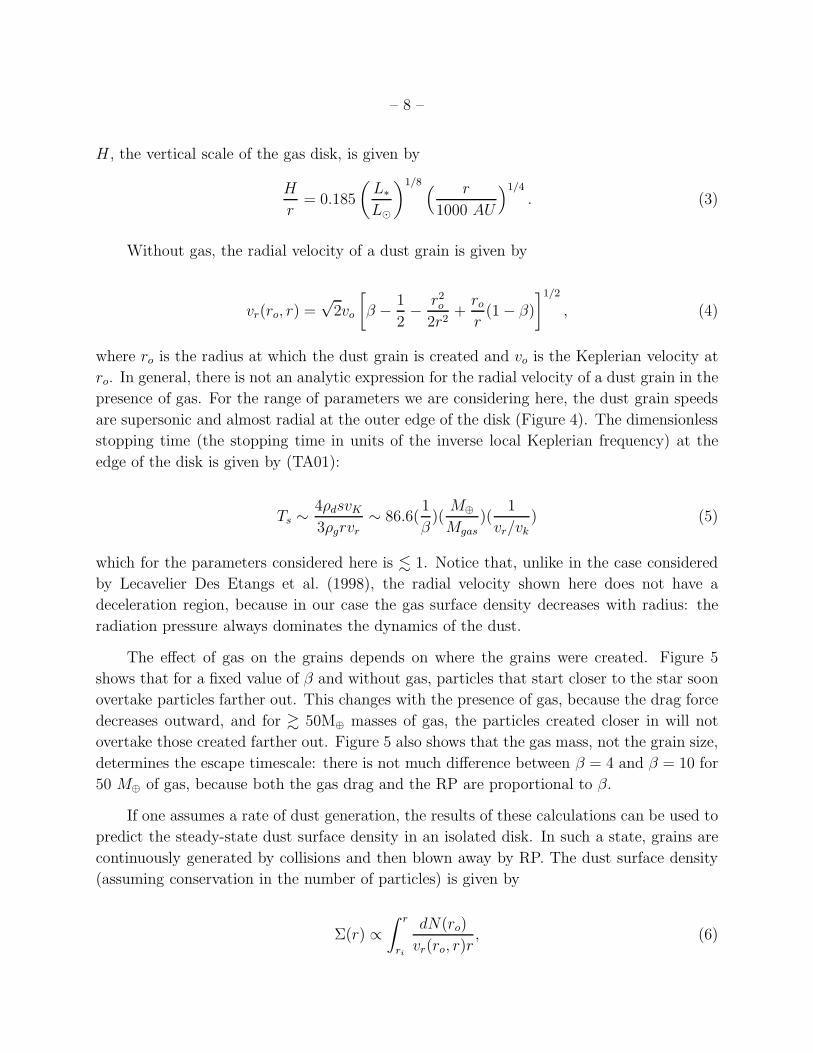
3. The Dynamics of High β Particles
We now explore the interaction between small dust grains, gas, and the radiation and
gravitational fields of HD 141569A, while ignoring the presence of the binary companions.
Most of the results of this axisymmetric treatment should be applicable to other debris and
gas disks in which RP is important. The regime that we explore here is that of modest
amounts of gas (up to 50 M⊕) and not very large values of β (β ∼ 4− 10). Our calculations
are complementary to those of Lecavelier Des Etangs et al. (1998), who consider β & 100
and TA01, who consider β . 1. Notice that Lecavelier Des Etangs et al. (1996) has shown
that if the observed dust particles all have β < 0.5, a single ring of planetesimals in a gasless
disk will produce a dust disk with surface density given by r−3, as observed here.
We solve the equations of motion for a dust grain, assuming that it is subject to RP,
PR and gas drag. The gas is assumed to be in a circular orbit and we assume the same dust
model as TA01. The force of the gas on the dust is given by
Fg = −πρgs2(
v2T + ∆v2
)1/2∆v, (1)
where ρg is the gas density, s is a dust grain radius, vT is 4/3 times the thermal velocity of
the gas, and ∆v is the relative velocity of the dust with respect to the gas. To determine
the trajectory of a dust grain, we assume that the surface density of the gas (as well as
that of planetesimals) decreases radially as r−1.5. This function is characteristic of the dust
surface density of optically thick protoplanetary disks (Osterloh & Beckwith 1995). In other
words,we assume that the gas and planetesimal density profiles of the optically thin disks are
the same as the dust density profile of the optically thick disks. We further assume (unless
otherwise stated) that the gas is in LTE, with temperature
Tg = 278
(
L∗
L⊙
)1/4
rAU−1/2 K (2)
where L∗ = 22.4L⊙ is the stellar luminosity (Backman & Paresce 1993). This implies that
– 8 –
H , the vertical scale of the gas disk, is given by
H
r= 0.185
(
L∗
L⊙
)1/8( r
1000 AU
)1/4
. (3)
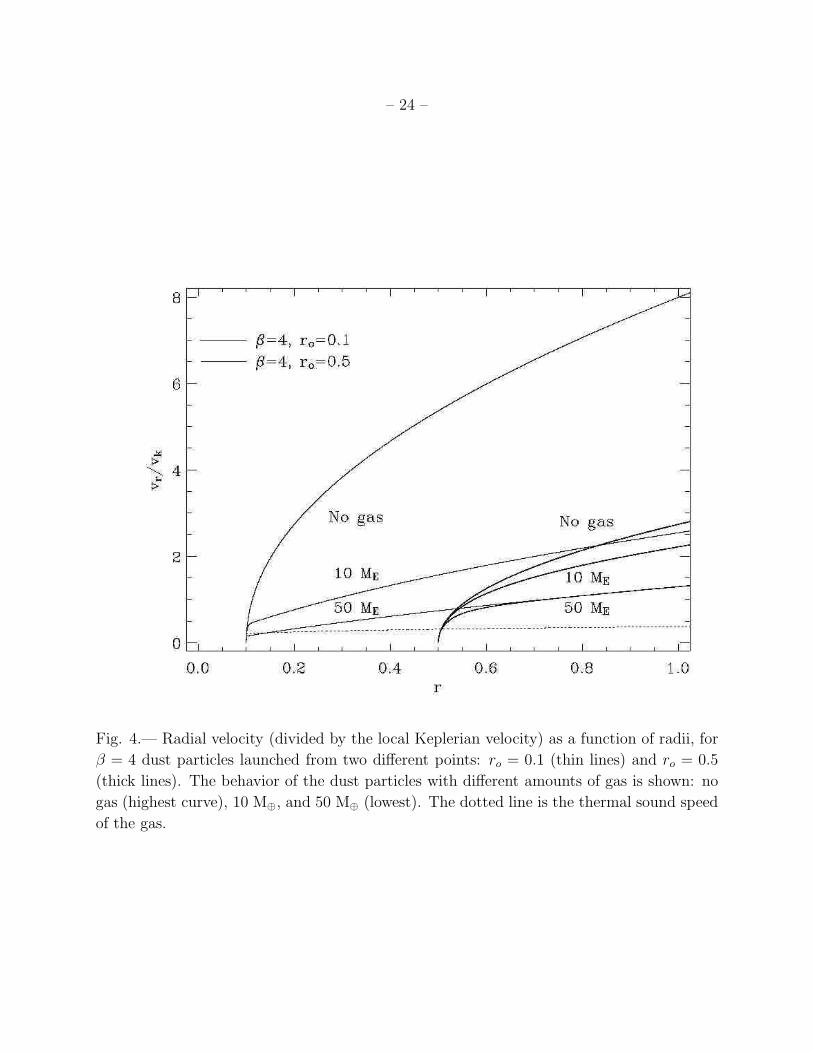
Without gas, the radial velocity of a dust grain is given by
vr(ro, r) =√
2vo
[
β − 1
2− r2
o
2r2+
ro
r(1 − β)
]1/2
, (4)
where ro is the radius at which the dust grain is created and vo is the Keplerian velocity at
ro. In general, there is not an analytic expression for the radial velocity of a dust grain in the
presence of gas. For the range of parameters we are considering here, the dust grain speeds
are supersonic and almost radial at the outer edge of the disk (Figure 4). The dimensionless
stopping time (the stopping time in units of the inverse local Keplerian frequency) at the
edge of the disk is given by (TA01):
Ts ∼4ρdsvK
3ρgrvr
∼ 86.6(1
β)(
M⊕
Mgas
)(1
vr/vk
) (5)
which for the parameters considered here is . 1. Notice that, unlike in the case considered
by Lecavelier Des Etangs et al. (1998), the radial velocity shown here does not have a
deceleration region, because in our case the gas surface density decreases with radius: the
radiation pressure always dominates the dynamics of the dust.
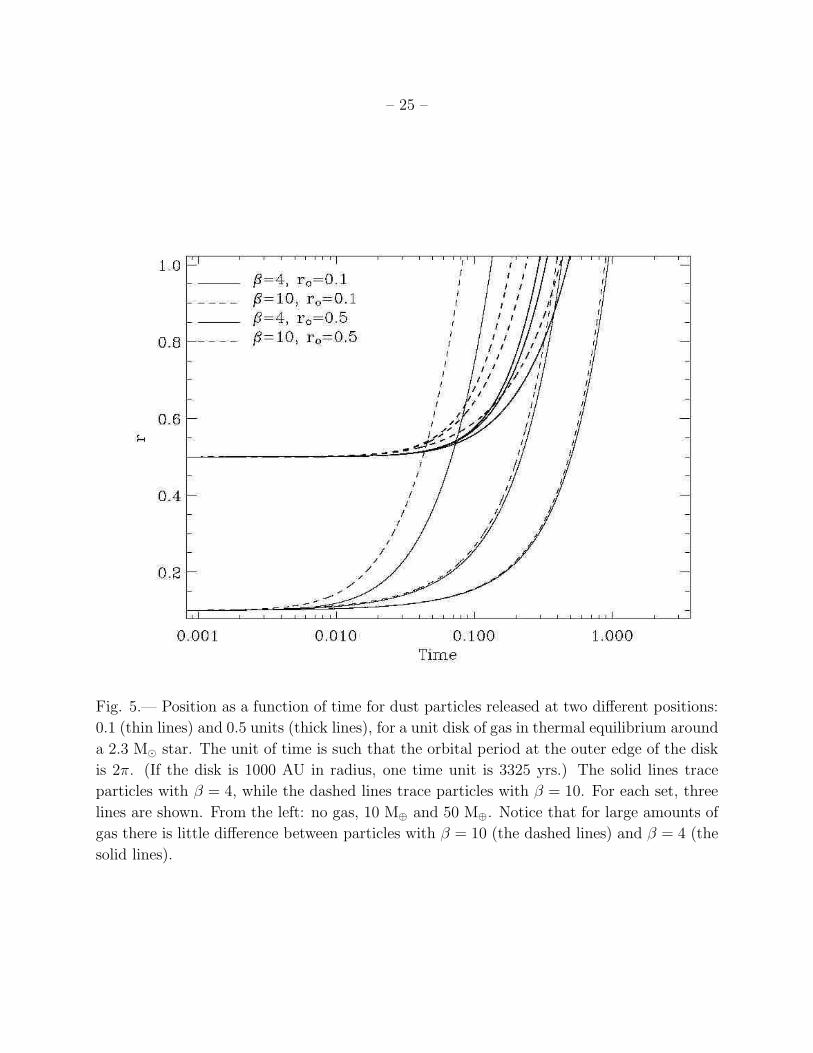
The effect of gas on the grains depends on where the grains were created. Figure 5
shows that for a fixed value of β and without gas, particles that start closer to the star soon
overtake particles farther out. This changes with the presence of gas, because the drag force
decreases outward, and for & 50M⊕ masses of gas, the particles created closer in will not
overtake those created farther out. Figure 5 also shows that the gas mass, not the grain size,
determines the escape timescale: there is not much difference between β = 4 and β = 10 for
50 M⊕ of gas, because both the gas drag and the RP are proportional to β.
If one assumes a rate of dust generation, the results of these calculations can be used to
predict the steady-state dust surface density in an isolated disk. In such a state, grains are
continuously generated by collisions and then blown away by RP. The dust surface density
(assuming conservation in the number of particles) is given by
Σ(r) ∝∫ r
ri
dN(ro)
vr(ro, r)r, (6)
– 9 –
where ri is the inner radius of dust generation, ro is the position at which the grains are
created, dN(ro) is the number of grains created at ro, and vr(ro, r) is the radial velocity at r
of grains created at ro. The dust creation rate per unit volume is taken to be vrel×σcoll×Np2,
where Np is the number of planetesimals per unit volume, σcoll is the collision cross section
and vrel is the relative velocity between the planetesimals, which is proportional to the
dimensionless planetesimal disk thickness (Hp/r) times the Keplerian velocity (Thebault
et al. 2003). This implies
dN(ro) = vrel σcoll Np2 Hp 2πrodro ∝ Ωk Σ2
p 2πrodro (7)
where Σp is the surface density of planetesimals at the creation point, which we assume to
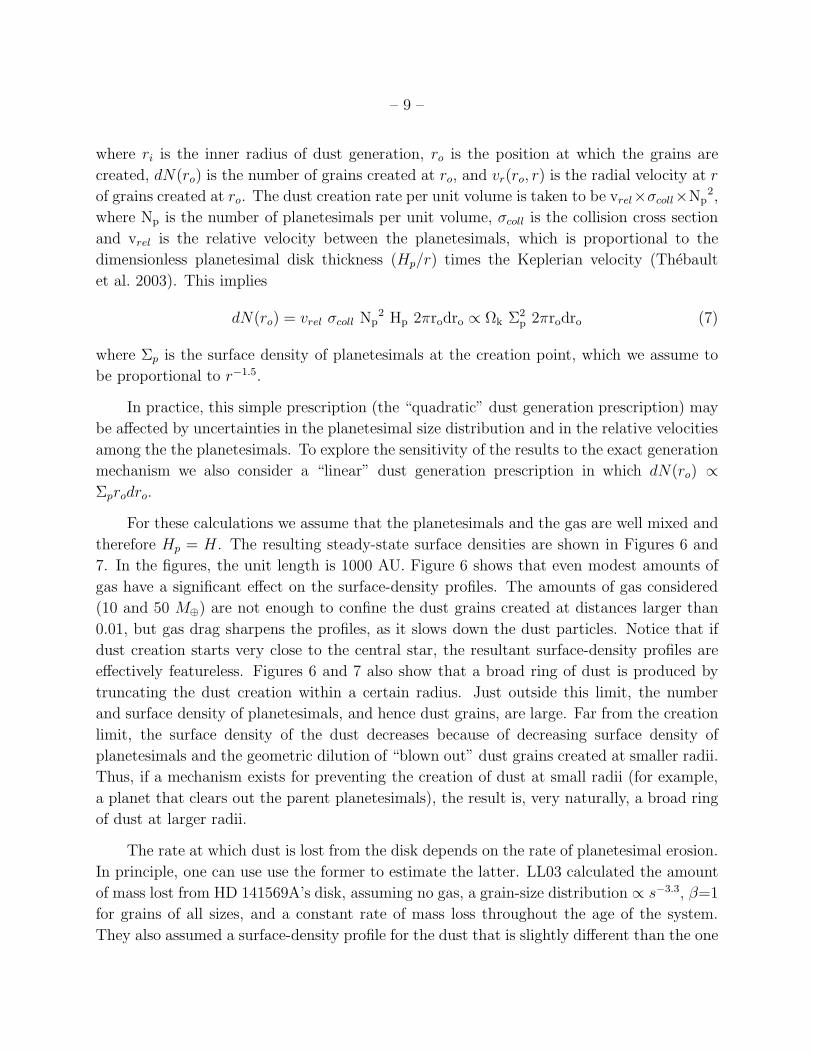
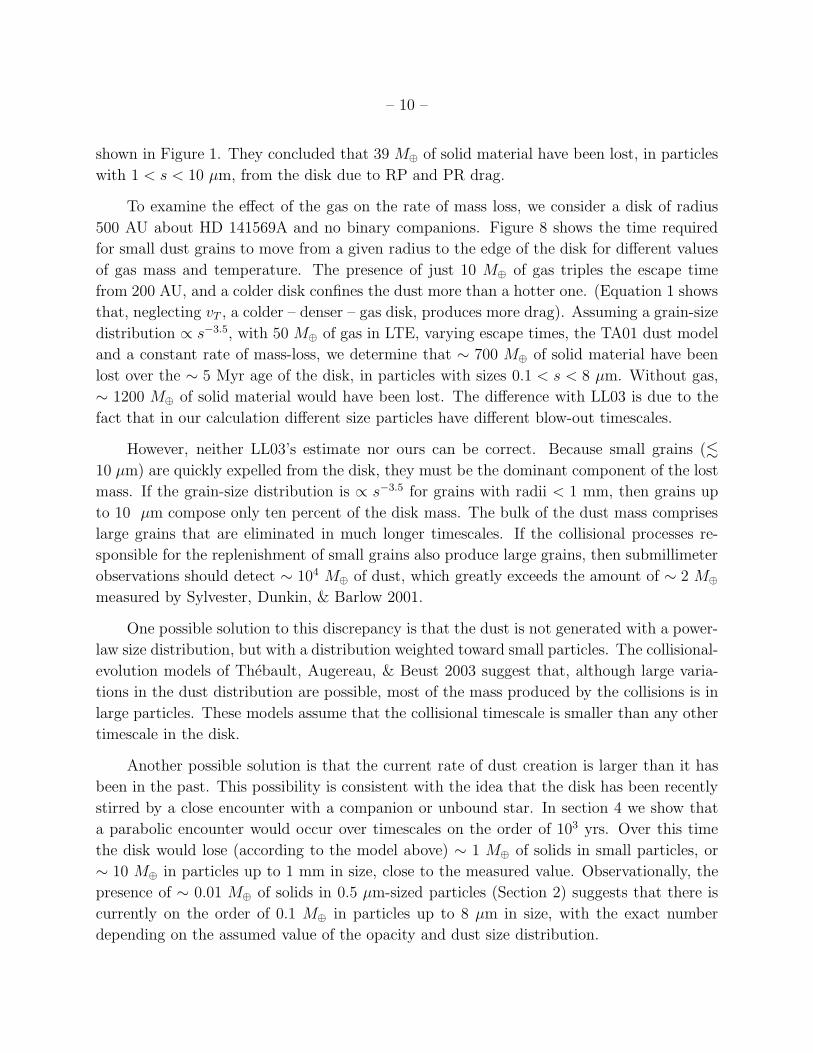
be proportional to r−1.5.
In practice, this simple prescription (the “quadratic” dust generation prescription) may
be affected by uncertainties in the planetesimal size distribution and in the relative velocities
among the the planetesimals. To explore the sensitivity of the results to the exact generation
mechanism we also consider a “linear” dust generation prescription in which dN(ro) ∝Σprodro.
For these calculations we assume that the planetesimals and the gas are well mixed and
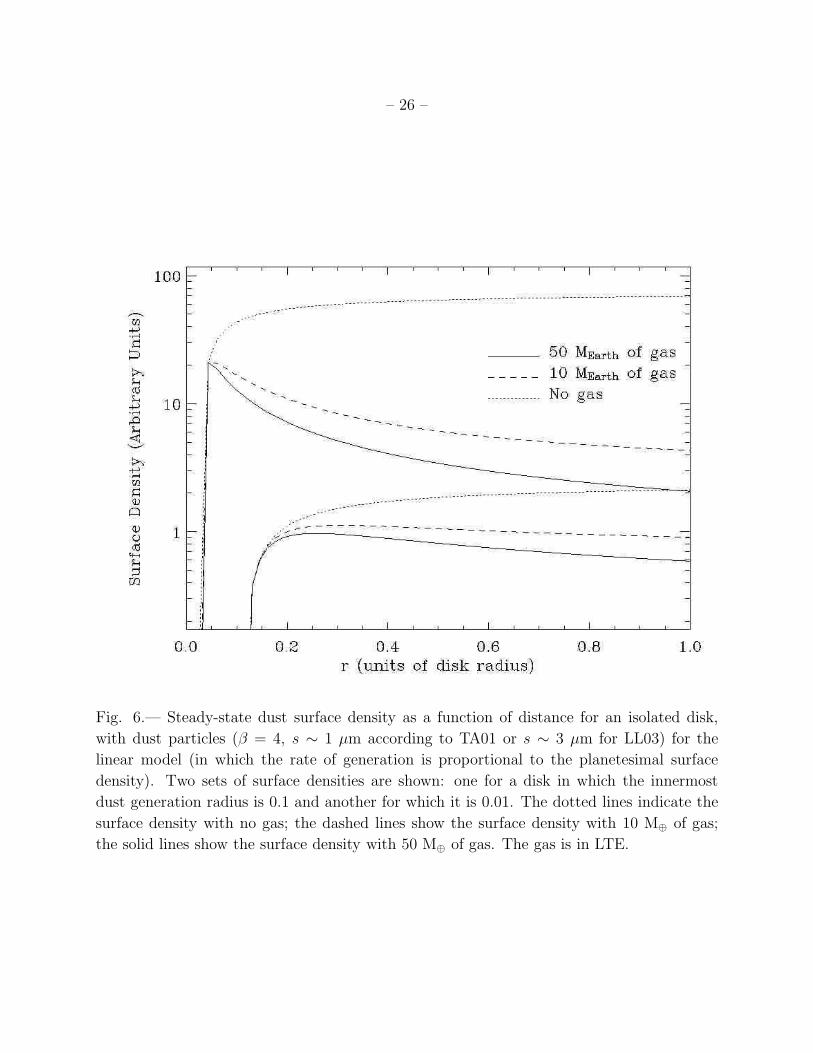
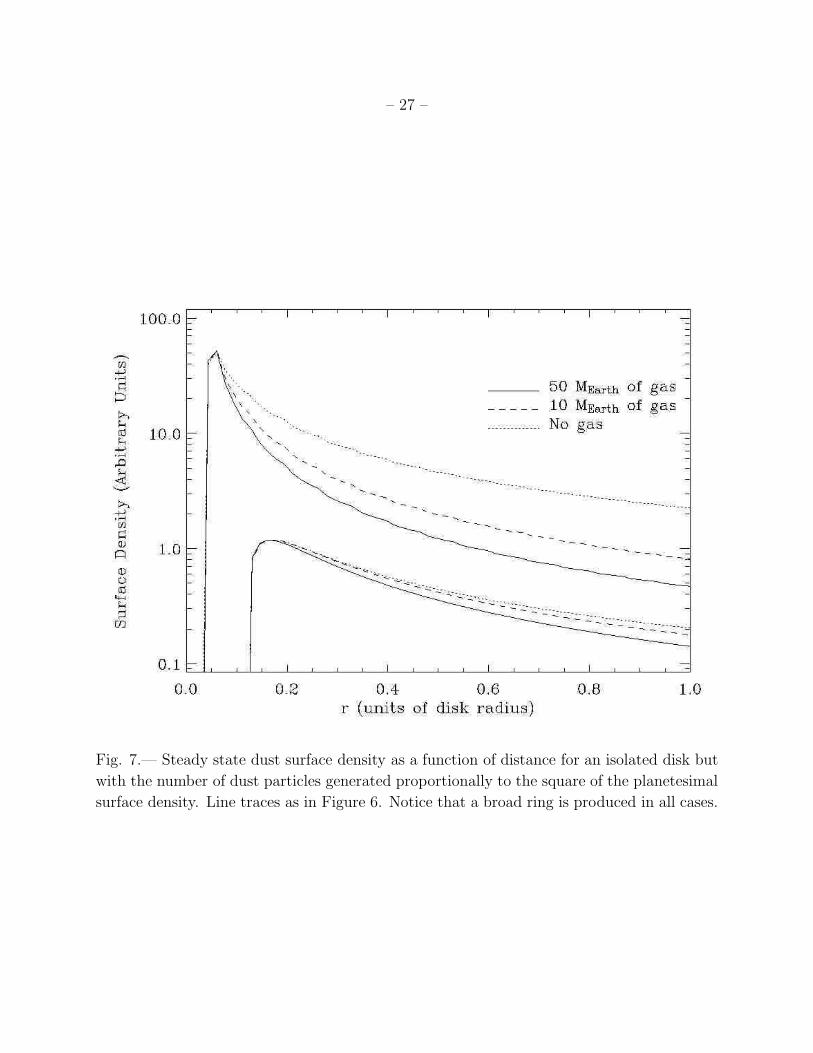
therefore Hp = H . The resulting steady-state surface densities are shown in Figures 6 and
7. In the figures, the unit length is 1000 AU. Figure 6 shows that even modest amounts of
gas have a significant effect on the surface-density profiles. The amounts of gas considered
(10 and 50 M⊕) are not enough to confine the dust grains created at distances larger than
0.01, but gas drag sharpens the profiles, as it slows down the dust particles. Notice that if
dust creation starts very close to the central star, the resultant surface-density profiles are
effectively featureless. Figures 6 and 7 also show that a broad ring of dust is produced by
truncating the dust creation within a certain radius. Just outside this limit, the number
and surface density of planetesimals, and hence dust grains, are large. Far from the creation
limit, the surface density of the dust decreases because of decreasing surface density of
planetesimals and the geometric dilution of “blown out” dust grains created at smaller radii.
Thus, if a mechanism exists for preventing the creation of dust at small radii (for example,
a planet that clears out the parent planetesimals), the result is, very naturally, a broad ring
of dust at larger radii.
The rate at which dust is lost from the disk depends on the rate of planetesimal erosion.
In principle, one can use use the former to estimate the latter. LL03 calculated the amount
of mass lost from HD 141569A’s disk, assuming no gas, a grain-size distribution ∝ s−3.3, β=1
for grains of all sizes, and a constant rate of mass loss throughout the age of the system.
They also assumed a surface-density profile for the dust that is slightly different than the one
– 10 –
shown in Figure 1. They concluded that 39 M⊕ of solid material have been lost, in particles
with 1 < s < 10 µm, from the disk due to RP and PR drag.
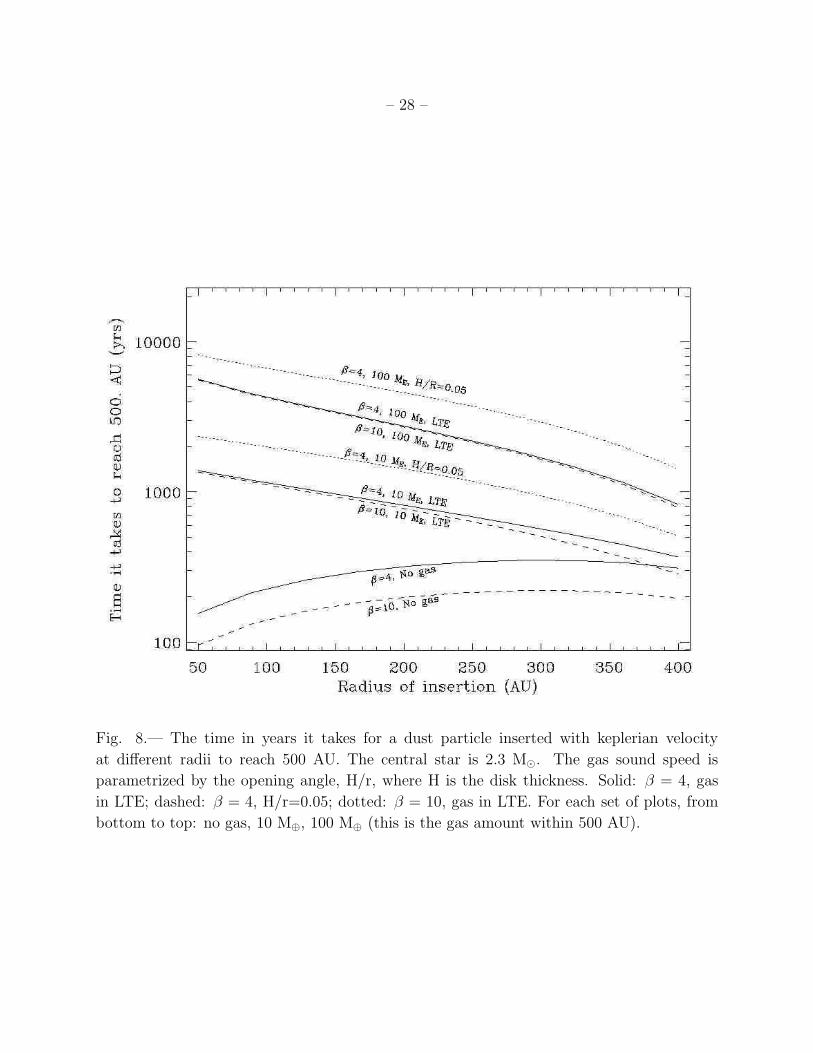
To examine the effect of the gas on the rate of mass loss, we consider a disk of radius
500 AU about HD 141569A and no binary companions. Figure 8 shows the time required
for small dust grains to move from a given radius to the edge of the disk for different values
of gas mass and temperature. The presence of just 10 M⊕ of gas triples the escape time
from 200 AU, and a colder disk confines the dust more than a hotter one. (Equation 1 shows
that, neglecting vT , a colder – denser – gas disk, produces more drag). Assuming a grain-size
distribution ∝ s−3.5, with 50 M⊕ of gas in LTE, varying escape times, the TA01 dust model
and a constant rate of mass-loss, we determine that ∼ 700 M⊕ of solid material have been
lost over the ∼ 5 Myr age of the disk, in particles with sizes 0.1 < s < 8 µm. Without gas,
∼ 1200 M⊕ of solid material would have been lost. The difference with LL03 is due to the
fact that in our calculation different size particles have different blow-out timescales.
However, neither LL03’s estimate nor ours can be correct. Because small grains (.
10 µm) are quickly expelled from the disk, they must be the dominant component of the lost
mass. If the grain-size distribution is ∝ s−3.5 for grains with radii < 1 mm, then grains up
to 10 µm compose only ten percent of the disk mass. The bulk of the dust mass comprises
large grains that are eliminated in much longer timescales. If the collisional processes re-
sponsible for the replenishment of small grains also produce large grains, then submillimeter
observations should detect ∼ 104 M⊕ of dust, which greatly exceeds the amount of ∼ 2 M⊕
measured by Sylvester, Dunkin, & Barlow 2001.
One possible solution to this discrepancy is that the dust is not generated with a power-
law size distribution, but with a distribution weighted toward small particles. The collisional-
evolution models of Thebault, Augereau, & Beust 2003 suggest that, although large varia-
tions in the dust distribution are possible, most of the mass produced by the collisions is in
large particles. These models assume that the collisional timescale is smaller than any other
timescale in the disk.
Another possible solution is that the current rate of dust creation is larger than it has
been in the past. This possibility is consistent with the idea that the disk has been recently
stirred by a close encounter with a companion or unbound star. In section 4 we show that
a parabolic encounter would occur over timescales on the order of 103 yrs. Over this time
the disk would lose (according to the model above) ∼ 1 M⊕ of solids in small particles, or
∼ 10 M⊕ in particles up to 1 mm in size, close to the measured value. Observationally, the
presence of ∼ 0.01 M⊕ of solids in 0.5 µm-sized particles (Section 2) suggests that there is
currently on the order of 0.1 M⊕ in particles up to 8 µm in size, with the exact number
depending on the assumed value of the opacity and dust size distribution.
– 11 –
Furthermore, these estimates support the idea of a single exciting event, like an en-
counter with an unbound companion, as opposed to repeated exciting events. In the models
by Augereau & Papaloizou (2004), which assume a bound companion, repeated encounters
are required to explain the brightness asymmetries in the debris disk.
4. A Dynamical Simulation
The presence of large-scale spiral arms suggests that the dynamical influence of the
binary companions, HD 141569B and C, is important. If they are coplanar with the disk,
their center of mass is ∼ 1250 AU away from the primary star and their separation is
∼ 275 AU. Augereau & Papaloizou (2004) assumed that the companions are bound to
HD 141569A in a very eccentric orbit. Their dynamical models show that close encounters
between the companions and the disk produced well-developed spiral rings within the disk
after only a few periastron passages. However, the models do not maintain large-scale spiral
arms after a few orbits. Thus, within their model, the interaction geometry needed to
create the spiral rings in the disk is not consistent with the presence of the large-scale spiral
arms. The hydrodynamic model by Quillen et al. (2005) does produce spiral arms after
repeated close encounters, because the viscosity and gas pressure help generate a spiral at
every periastron passage. However, the amount of gas actually present in the disk (§2.2)
discourages the notion that the dynamics of the dust conforms to that of the gas. Figure
5 shows that, for a reasonable range of gas mass, β-meteoroid grains responsible for the
scattered-light disk are impeded by gas drag, but they are not bound by the gas. So the
assumption by Quillen et al. (2005) that gas dynamics control the observed structures in the
dust disk is not appropriate.
4.1. Assumptions and Methodology
We assume that the encounter between the disk and the binary companions is a parabolic
fly-by, a situation known to produce spiral arms in dusty disks (Larwood & Kalas 2001).
Such an encounter is consistent with the proper motion of the system. Within an error
box of 0.′′1, the position of the companions relative to HD 141569A has not changed over
the 60 yr baseline of observations noted by Weinberger et al. (2000). The largest expected
relative motion is obtained when the system is currently at periastron and the encounter
occurs in the plane of the sky. In this scenario, the relative motion of the companions over
60 yr would be 0.′′012, which is well inside the error box of the proper motion measurements.
– 12 –
Dust grains are created by collisions of planetesimals. We assume that the planetesimals
themselves experience gravity, but not RP or gas drag. We also ignore self-gravity and the
dynamical effects of the collisions. Our simulation is performed in two phases. First, we
obtain the distribution of planetesimals and gas as a function of time. Then, for each
planetesimal configuration, we generate a dust distribution and follow it as a function of
time. We repeat this sequence for all planetesimal and gas configurations. At any given
time, the dust in the disk consists of dust created at that time and dust remaining from
earlier times.
The model is two-dimensional. We assign fixed masses of 2.3, 0.5, and 0.25 M⊙ to
HD 141569A, B, and C, respectively. We assume that the encounter is prograde, as a
retrograde encounter fails to produce large-scale spiral arms. The phase of the encounter is
fixed so that, at periastron, the three stars are aligned, with HD 141569B between A and
C. (The results are mostly insensitive to the choice of phase.) Most of our simulations start
with 104 planetesimals. The inner dust destruction limit is set at r > 0.1, where the distance
r is measured relative to the separation of HD 141569A and HD 141569BC’s barycenter at
periastron. We assume that the initial surface density of planetesimals declines as r−1.5. The
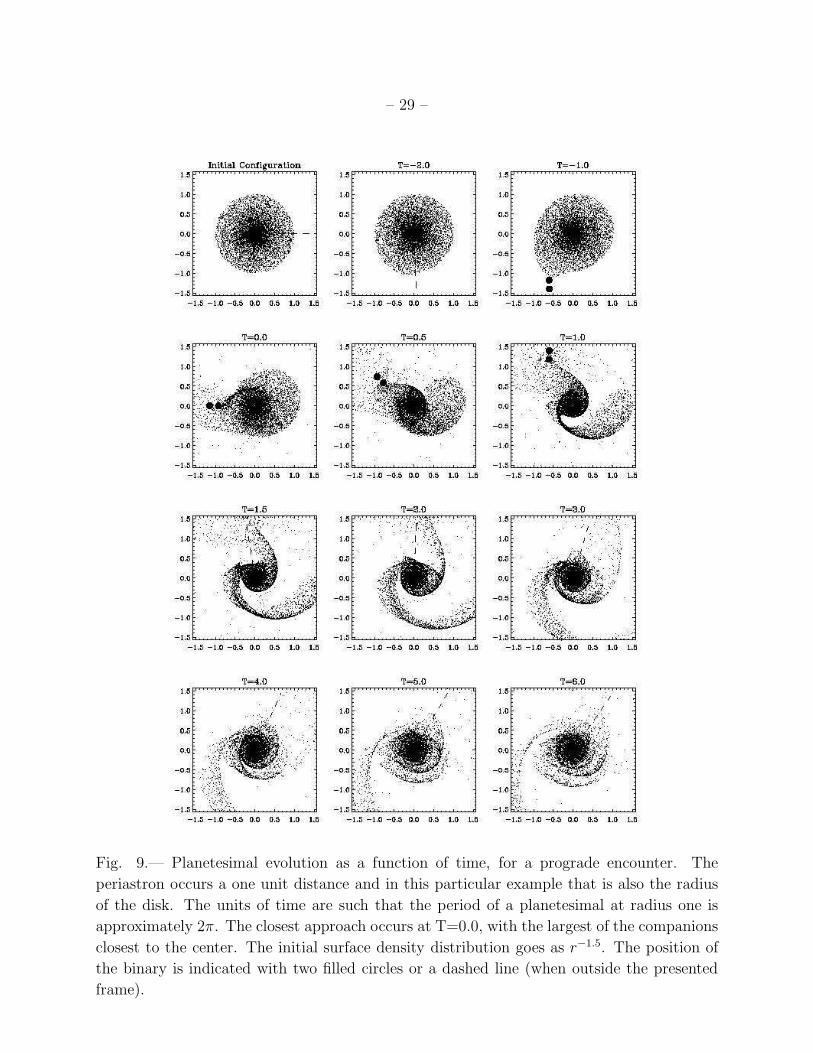
outer radius of the planetesimal disk is a free parameter. Figure 9 shows the evolution of
the planetesimals in a disk of unit radius. We define T = 0 as the time of periastron. The
time unit is such that the period at unit distance is 2π√
(m1+m2
m1
) = 7.2 time units, where
m1 = 2.3M⊙ and m2 = 0.75M⊙ (the later is the sum of the companion masses). Notice that
the particular fly-by configuration shown in Figure 9 shows that some planetesimals can be
captured by the companions and therefore that some of the IR excess measured by IRAS
may be associated with them.
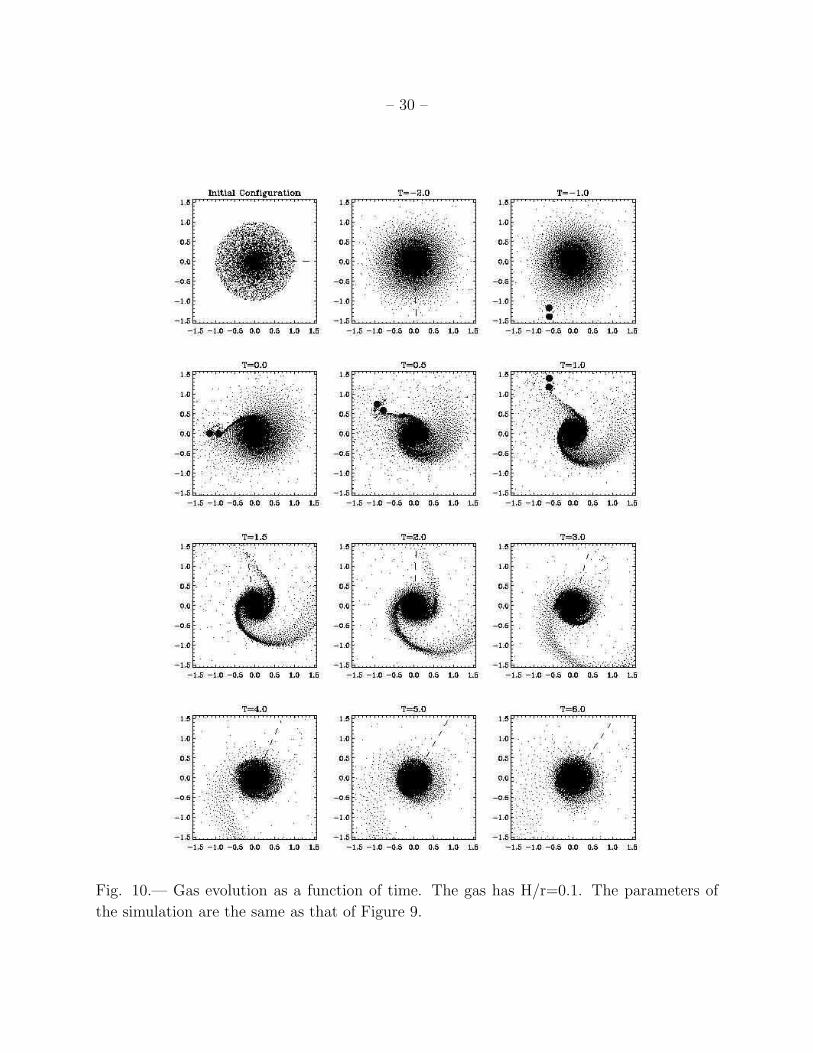
The total mass of gas is a free parameter. We consider gas disks with r > 0.01, an
initial surface-density profile ∝ r−1.5 and masses of 0, 10, 50, and 100 M⊕, before truncation
by the encounter. We model the gas evolution using the Smoothed Particle Hydrodynamics
(SPH) formalism (Monaghan 1992), which allows one to track the motion of gas pseudo-
particles using Lagrangian equations. Viscosity is parametrized according to Equation 4.2
of Monaghan (1992). SPH permits the exploration of parameter space without a large
investment of computer time, but with limited resolution at small scales.
We explore different limits for the gas sound speed, which is parametrized by the disk
opening angle, H/r = cs/rΩK , where H is the scale height of the gas, cs is the speed of sound,
and ΩK is the Keplerian angular frequency at radius r. We consider gas with H/r = 0.05,
0.1, 0.2, and in LTE (Equation 3). Brandeker et al. (2004) has shown that the empirical
opening angle of the β Pictoris gas disk is H/r ∼ 0.28, which is close to the expected LTE
value at 1000 AU. Figure 10 shows the evolution of gas particles for the case of H/r = 0.1.
– 13 –
To simulate the dust grains, we consider the linear (particles created with r > 0.1)
and quadratic (particles created with r > 0.15) dust-creation prescriptions described in §3.
Particles are created every 0.01 time units. The ratio β, which couples the dust and the
radiation, is also a free parameter. We explore two values: (1) β = 4, which corresponds to
s ∼ 1 µm (TA01) or s ∼ 4 µm (LL03), and (2) β = 10, which corresponds to s ∼ 0.3 µm
(TA01) or s ∼ 1 µm (LL03). We assume a single value of β per simulation, which is
equivalent to assuming that the scattering opacity (Figure 2) is a delta function.
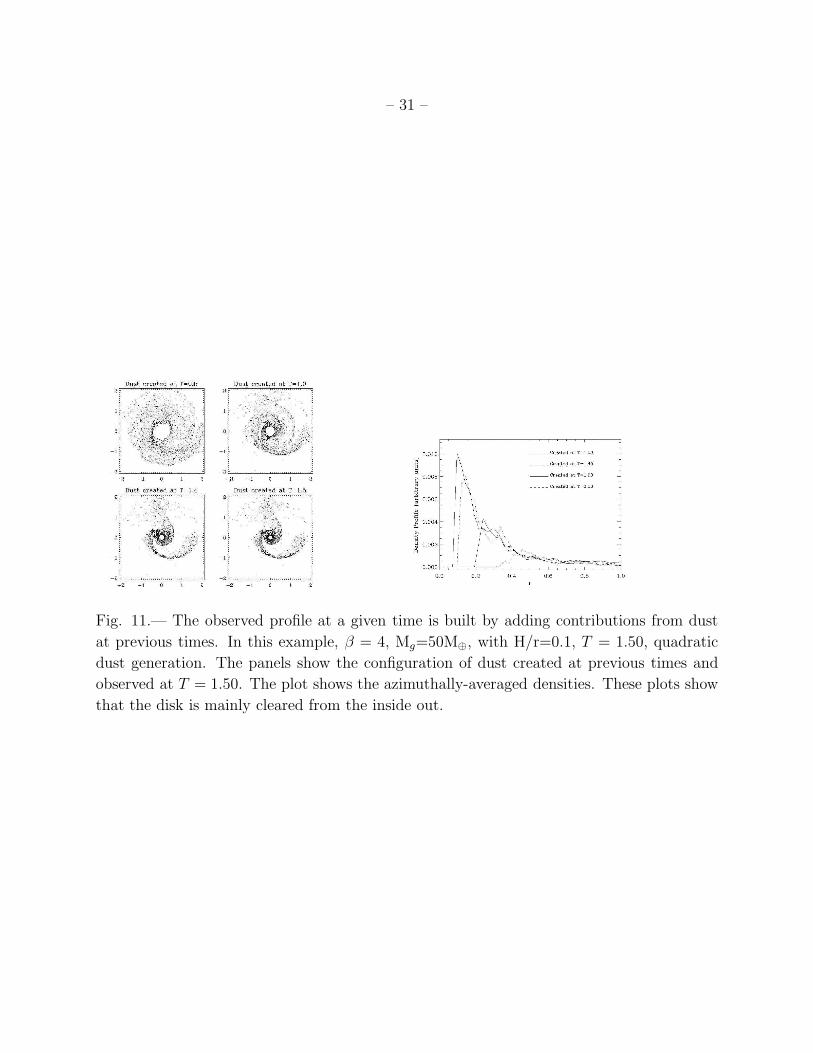
To obtain the dust distribution at a given time, we consider all the dust particles created
at previous times. Figure 11 shows the behavior of dust particles created at various time
intervals for β = 4, Mgas = 50 M⊕, H/r = 0.1, and linear dust creation. The generations
of particles were tracked to T = 1.5, and their respective surface densities were summed
and azimuthally averaged at each time interval. This simulation tracks the entire history of
dust generation, but in practice, dust blowout eliminates from the “current” surface density
profile all the contributions of dust created before the last half time unit (i.e., T − 0.5).
4.2. Simulation Results
We now present our models for the fly-by encounter with a composite disk of planetes-
imals, gas, and dust. Representative simulations are shown in Figures 12–16. Although
most of the models are shown at T = 1.5, the images and profiles are representative of
0.8 . T . 2.0. To give our distance and time scales physical meaning, we set the distance
between HD 141569A and the barycenter of the companions at T = 1.5 equal to that ob-
served in the ACS images (C03). Thus, one distance unit corresponds to 718 AU and one
time unit corresponds to 1800 yr. The companions are out of the frames.
For each of the Figures 12–16 we show the predicted logarithm of the density profile
with linear dust generation (top row) or quadratic dust generation (bottom row). The use
of the logarithmic stretch allow us to highlight faint features. The images are all normalized
to the same arbitrary constant. In general, the color table of the bottom row has a lower
limit value that the color table at the top row. This means that “white” in the bottom
panels corresponds to somewhat less material than it does in the top panels. In this way,
we can show faint features in the bottom rows that would not be visible were we to use
the same color table as that from the top rows. This modification has little effect on the
color the dark features, which implies that all panels within a given figure can be compared
to each other. As mentioned before, an artificial inner hole has been set for the linear (at
r = 0.1) and quadratic simulations (at r = 0.15). In each panel, the plot inset compares
the measured density profile with the model density profile. The latter is normalized to the
– 14 –
value measured at 500 AU.
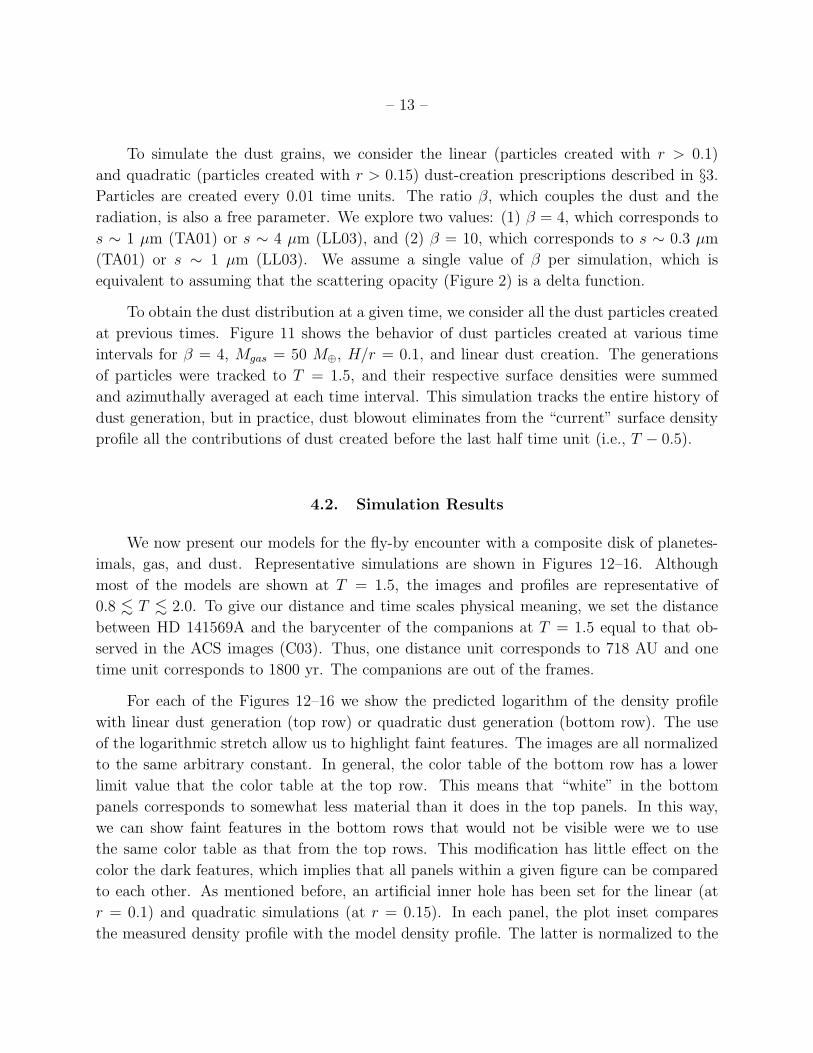
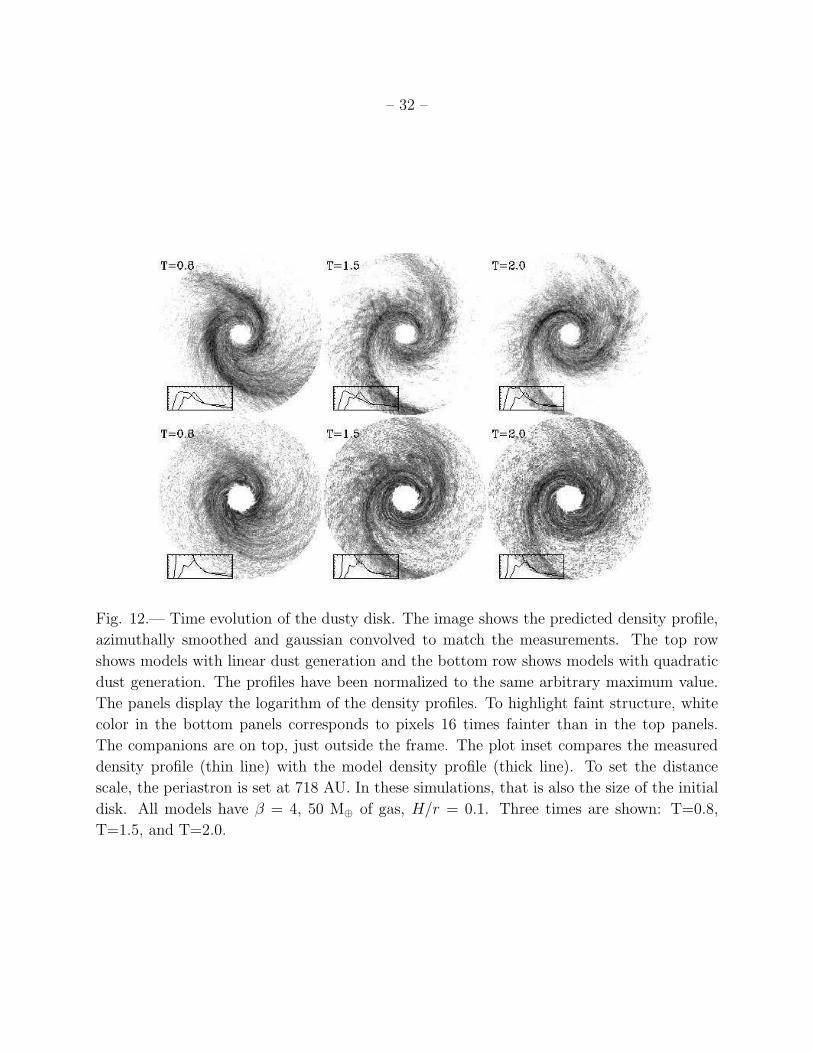
Figure 12 shows the evolution of the dust structures for β = 4, Mgas = 50 M⊕, H/r =
0.1, an initial disk size of one unit distance, and both linear and quadratic dust generation.
Figures 13 and 14 show the effect of the amount of gas on β = 4 and β = 10 dust particles,
respectively. The sharp, concentric rings in the gasless models (panels 1 and 4) are artifacts of
discrete dust generation. Figure 15 illustrates the role of the gas temperature, and Figure 16
shows the roles of disk sizes and planets. A side-by-side comparison of the observed disk and
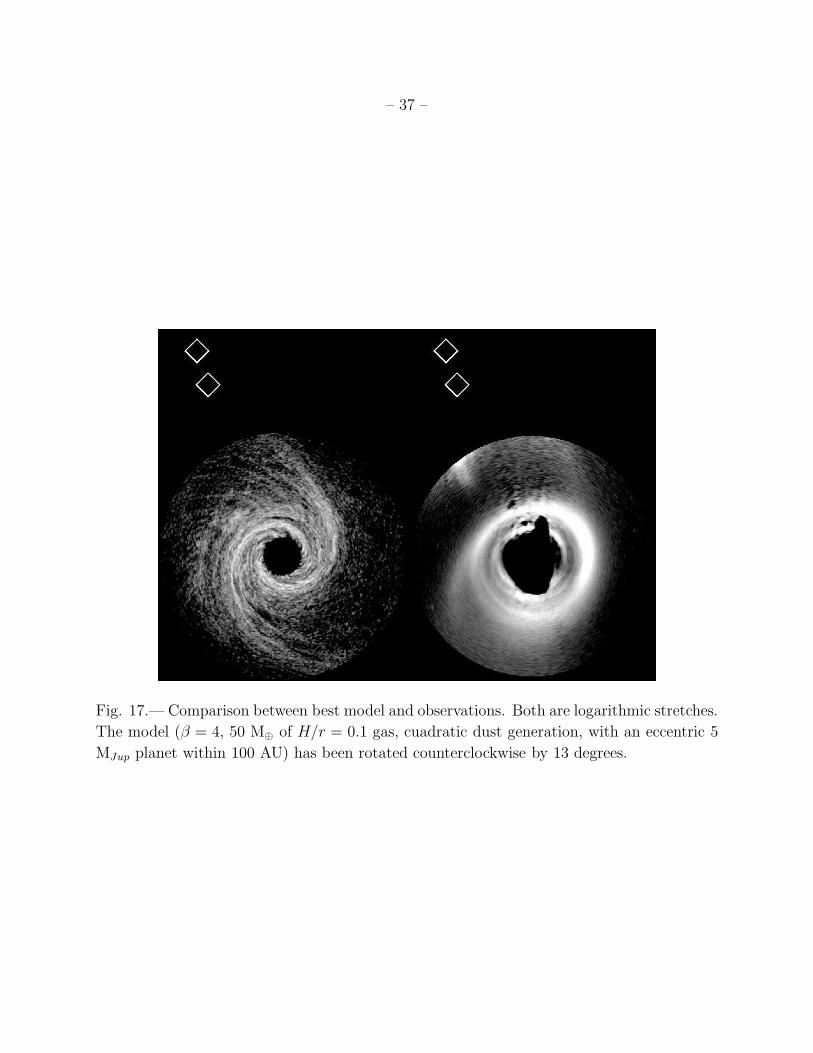
our favorite model is presented in Figure 17.
All the models look similar. Despite the dynamical importance of RP, the overall ap-
pearance of the dust disk resembles the underlying distribution of planetesimals. Figures 13
and 14 show that models with gas reproduce the observed profiles better than models with-
out gas, but it is not clear that 10 M⊕ of H/r = 0.1 gas (panel 2 of each figure) is better than
50 M⊕ of H/r = 0.1 gas (panel 3 of each figure). There are no significant qualitative differ-
ences between the β = 4 and β = 10 conditions shown in Figures 13 and 14, respectively,
as expected from the results in §3. There is also no clearly preferred prescription for dust
creation. The quadratic prescription does produce a more disorganized structure, as the dust
is mostly generated in the denser spiral arms. Overdensities in the planetesimal distribution
produce streams of matter in these models. Nevertheless, the combination of large β and
quadratic dust generation with H/r = 0.1 gas (Figure 14, panels 5 and 6) reproduces very
well the decay of the surface-density profile. Notice that because more gas confines the dust
better, the spirals in panels 3 and 6 of each figure look darker than the others.
Figure 15 shows that the simulations are sensitive to the gas temperature. Cold gas
(panels 1 and 4) tends to produce sharper spiral structures than hot gas, because cold gas
is denser and imparts greater drag on the dust. This effect is less pronounced for quadratic
dust generation, as the large density variations obscure the temperature-dependent effects
of the gas.
All the models produce a two-armed spiral. The arms are less pronounced for quadratic
dust generation than for the linear dust generation because the former emphasizes regions
of large planetesimal density. The density and extent of the arm diametrically opposite the
companions can be reduced (and made more compatible with the observations) by diminish-
ing the size of the initial disk (Figure 16). The appearance of this arm can also be changed
with a different encounter geometry. Larwood & Kalas (2001) show that, in a encounter
between a circumstellar disk and a passing star, the spiral arm opposite the projectile is
affected by the indirect tidal component of the potential, which diminishes as the collision
becomes more hyperbolic.
– 15 –
In general, the models with quadratic dust generation produce more disorganized images
than models with linear dust generation. Planetesimal condensates are strong sources of dust
that produce “noise” in the models. However, they also produce more peaked surface-density
profiles, which match the observed profiles better. Flatter initial density profiles (not shown
here) produce large amounts of dust at large distances. Disks with initial radii larger than
∼1000 AU produce remnant structures that are not observed, including very long spiral arms.
Conversely, disks with an initial radius of 400 AU yield dust distribution that reproduce well
the observed large-scale arms and surface-density profiles (Figure 16). We surmise from
our models that HD 141569A’s initial planetesimal and gas disks had radii . 700 AU and
10–50 M⊕ of H/r = 0.1 gas (Figure 17).
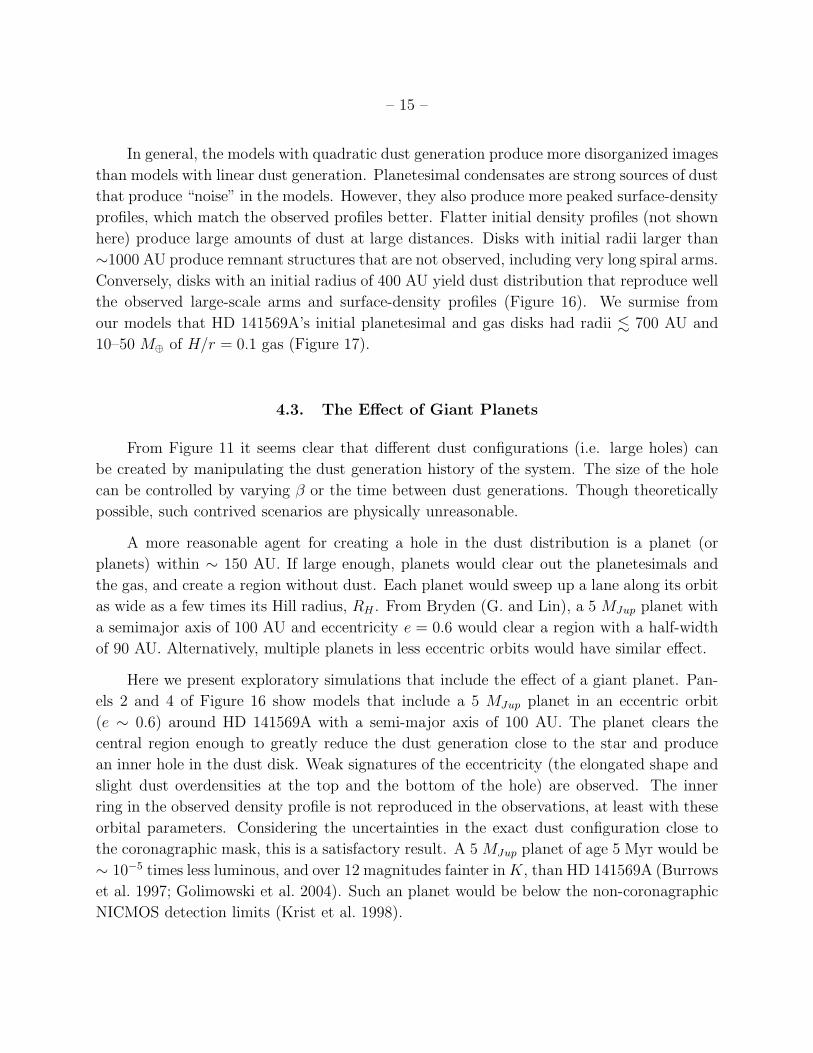
4.3. The Effect of Giant Planets
From Figure 11 it seems clear that different dust configurations (i.e. large holes) can
be created by manipulating the dust generation history of the system. The size of the hole
can be controlled by varying β or the time between dust generations. Though theoretically
possible, such contrived scenarios are physically unreasonable.
A more reasonable agent for creating a hole in the dust distribution is a planet (or
planets) within ∼ 150 AU. If large enough, planets would clear out the planetesimals and
the gas, and create a region without dust. Each planet would sweep up a lane along its orbit
as wide as a few times its Hill radius, RH . From Bryden (G. and Lin), a 5 MJup planet with
a semimajor axis of 100 AU and eccentricity e = 0.6 would clear a region with a half-width
of 90 AU. Alternatively, multiple planets in less eccentric orbits would have similar effect.
Here we present exploratory simulations that include the effect of a giant planet. Pan-
els 2 and 4 of Figure 16 show models that include a 5 MJup planet in an eccentric orbit
(e ∼ 0.6) around HD 141569A with a semi-major axis of 100 AU. The planet clears the
central region enough to greatly reduce the dust generation close to the star and produce
an inner hole in the dust disk. Weak signatures of the eccentricity (the elongated shape and
slight dust overdensities at the top and the bottom of the hole) are observed. The inner
ring in the observed density profile is not reproduced in the observations, at least with these
orbital parameters. Considering the uncertainties in the exact dust configuration close to
the coronagraphic mask, this is a satisfactory result. A 5 MJup planet of age 5 Myr would be
∼ 10−5 times less luminous, and over 12 magnitudes fainter in K, than HD 141569A (Burrows
et al. 1997; Golimowski et al. 2004). Such an planet would be below the non-coronagraphic
NICMOS detection limits (Krist et al. 1998).
– 16 –
The formation of small planets may produce sharp rings in the disk by stirring nearby
planetesimals and enhancing dust generation. This process has been modeled in detail by
Kenyon & Bromley (2004). Both this effect and the presence of a giant planet modeled above
produce inner ring variability on timescales of ∼ 1000 yr.
5. Discussion
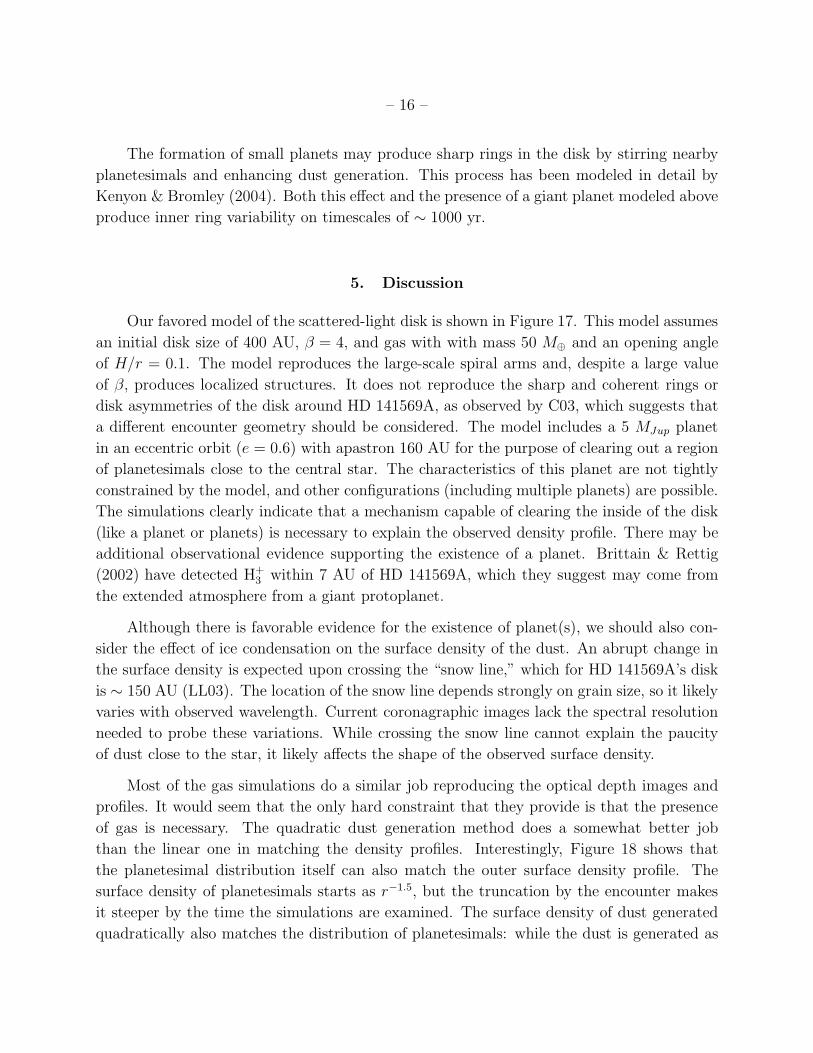
Our favored model of the scattered-light disk is shown in Figure 17. This model assumes
an initial disk size of 400 AU, β = 4, and gas with with mass 50 M⊕ and an opening angle
of H/r = 0.1. The model reproduces the large-scale spiral arms and, despite a large value
of β, produces localized structures. It does not reproduce the sharp and coherent rings or
disk asymmetries of the disk around HD 141569A, as observed by C03, which suggests that
a different encounter geometry should be considered. The model includes a 5 MJup planet
in an eccentric orbit (e = 0.6) with apastron 160 AU for the purpose of clearing out a region
of planetesimals close to the central star. The characteristics of this planet are not tightly
constrained by the model, and other configurations (including multiple planets) are possible.
The simulations clearly indicate that a mechanism capable of clearing the inside of the disk
(like a planet or planets) is necessary to explain the observed density profile. There may be
additional observational evidence supporting the existence of a planet. Brittain & Rettig
(2002) have detected H+3 within 7 AU of HD 141569A, which they suggest may come from
the extended atmosphere from a giant protoplanet.
Although there is favorable evidence for the existence of planet(s), we should also con-
sider the effect of ice condensation on the surface density of the dust. An abrupt change in
the surface density is expected upon crossing the “snow line,” which for HD 141569A’s disk
is ∼ 150 AU (LL03). The location of the snow line depends strongly on grain size, so it likely
varies with observed wavelength. Current coronagraphic images lack the spectral resolution
needed to probe these variations. While crossing the snow line cannot explain the paucity
of dust close to the star, it likely affects the shape of the observed surface density.
Most of the gas simulations do a similar job reproducing the optical depth images and
profiles. It would seem that the only hard constraint that they provide is that the presence
of gas is necessary. The quadratic dust generation method does a somewhat better job
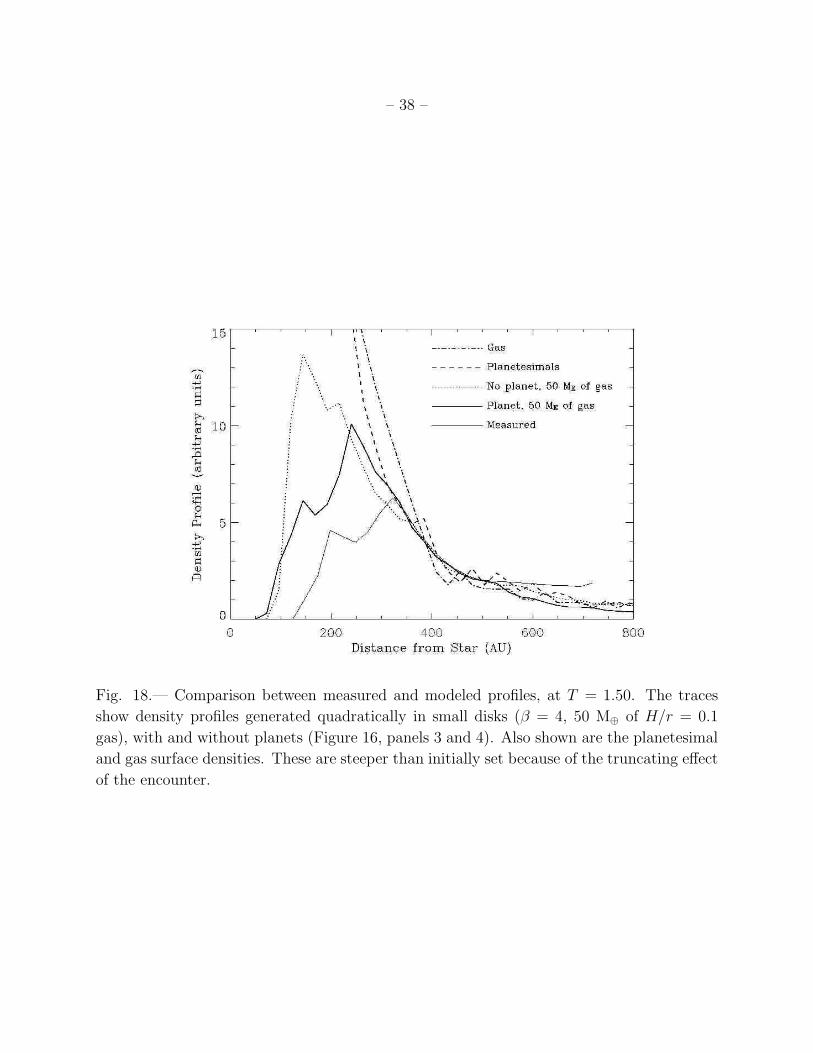
than the linear one in matching the density profiles. Interestingly, Figure 18 shows that
the planetesimal distribution itself can also match the outer surface density profile. The
surface density of planetesimals starts as r−1.5, but the truncation by the encounter makes
it steeper by the time the simulations are examined. The surface density of dust generated
quadratically also matches the distribution of planetesimals: while the dust is generated as
– 17 –
the square of the planetesimal distribution, it is blown outward by radiation pressure. This
process tends to flatten the simulated profile.
The applicability of our models to the debris disk around HD 141569A depends on the
premise that the observed dust grains are small enough so that β > 1. This condition is
borne out by the disk colors, the mean-scattering phase, and thermal models. Could larger
particles (β < 0.5) be contributing to the observed scattered light image? In deriving the
scattering-opacity function (Figure 2), we assumed that the collisional equilibrium timescale
is smaller than any other systemic timescale, which implies that the number of grains of size
s decreases as s−3.5. If small grains were more quickly removed from their points of creation,
then an excess of larger grains would result because they would no longer suffer erosion from
collisions with the smaller grains (Thebault et al. 2003). In the absence of gas, β < 0.5 grains
are eliminated by PR drag on timescales orders of magnitude larger than the RP timescales
(Chen & Jura 2001), so the proportion of larger grains would further increase. However, in
the presence of modest amounts of gas, β < 0.5 grains migrate to stationary orbits (TA01),
and small particles settle down at the outer edge of the disk. The timescale over which
this migration occurs is quite small for small grains, but larger than the purely dynamical
timescales associated with β > 0.5 motions. All these processes may alter the shape of the
dust size distribution. If, for example, the distribution is flatter than s−3.5, then the peak of
the scattering-opacity function is broadened. While the optical image of the disk may still
be dominated by β-meteoroids, the contributions of larger, bound grains may be significant.
The entangled roles of RP, gas drag, and the dynamical role of the companions greatly
complicate any effort to model all components of the disk. To do so successfully requires
multi-wavelength images of the disk. Observations by the Spitzer Space Telescope should
soon help this situation, as Spitzer will observe larger grains that are less affected by RP.
Future observations with the Atacama Large Millimeter Array (ALMA) will also contribute
valuable information about the composition and distribution of the dust.
6. Conclusions
We have developed dynamical models to investigate the structures observed in the debris
disk around HD 141569A. The models include, for the first time, the effects of radiation
pressure and gas drag. The disk’s colors and scattering phase indicate that the scattered-
light images are produced by submicron-sized dust grains. To understand these images, we
must consider the behavior of grains with values of β (the ratio of radiation and gravitational
forces) larger than one. These grains are expelled from the disk in shorter-than-dynamical
timescales. We show that up to 60 M⊕ of gas may be present in the disk. Gas drag slows
– 18 –
the blow-out of grains and is fundamental to understanding the structure of the disk.
If the dust is continuously created, its steady-state surface density is featureless and has
a radial profile dependent upon the amount of gas and the prescription for dust creation. To
produce a broad ring of dust, its creation must be prevented within some inner radial limit
(Figure 7). In principle, one can use the observed surface-density profile to estimate the
amount of mass lost from by the disk throughout its history. However, because large grains
remain in the disk longer than smaller grains, this estimation implies an implausible amount
of solid material in the disk. Consequently, either the observed rate of dust generation is
limited to times near the encounter of the disk with HD 141569A’s binary companions, or
small grains are created highly preferentially over larger ones.
Inspired by disk’s large-scale spiral arms, we explored the effect on the disk from a
parabolic fly-by of the binary companions. Such an encounter is consistent with the mea-
sured proper motion of the system. Our models consider the dynamical evolution of three
different populations: planetesimals (subject only to gravity), gas (subject to gravity and
hydrodynamic forces), and dust (subject to gravity, radiation pressure and gas drag). The
Poynting-Robertson effect, self-gravity, and the dynamical effects of collisions are ignored.
We vary β, the initial gas mass, the gas disk opening angle, and the prescription for dust
generation. We find that the dust distribution resembles that of the contemporary plan-
etesimal distribution. The models are most sensitive to the gas temperature, with hotter
gas producing more disorganized structures than colder gas. Five-fold differences in the gas
mass and two-fold differences in β do not produce significant differences in the simulated
disks. Quadratic dust generation produces more disorganized and less distinct structures
than linear dust generation. Smaller initial disks produce smaller and less pronounced spiral
arms.
Our favored model (Figure 17) has an initial disk size of 400 AU, β = 4, and gas with
with mass 50 M⊕ and an opening angle of H/r = 0.1. A planet is introduced to reduce
the surface density of the planetesimals close to the central star, but the characteristics of
this planet are not tightly constrained. The model successfully reproduces the large-scale
structures seen in the scattered-light images of the disk. However, the model does not
reproduce the tightly-wound spiral rings or other observed asymmetries, which suggests that
another population of grains (perhaps with smaller β) or a non-coplanar encounter geometry
should be investigated.
The authors thank B. Zuckerman, T. Forveille, and J. Kastner for generously providing
the data from their 1995 paper. We are grateful to K. Anderson, W. J. McCann, S. Busching,
A. Framarini, and T. Allen for their invaluable contributions to the ACS project at JHU. ACS
– 19 –
was developed under NASA contract NAS 5-32865, and this research has been supported by
NASA grant NAG5-7697. We are grateful for an equipment grant from Sun Microsystems,
Inc. The Space Telescope Science Institute is operated by AURA, Inc., under NASA contract
NAS5-26555. Furthermore, we gratefully acknowledge support from NASA Origins of Solar
Systems grants NAG5-10732 and NNG04GG50G. Finally we wish to thank the anonymous
referee whose comments greatly improved the paper.
REFERENCES
Augereau, J. C., Lagrange, A. M., Mouillet, D., & Menard, F. 1999, A&A, 350, L51
Augereau, J. C. & Papaloizou, J. C. B. 2004, A&A, 414, 1153
Backman, D. E. & Paresce, F. 1993, in Protostars and Planets III, 1253–1304
Beckwith, S. V. W. & Sargent, A. I. 1993, ApJ, 402, 280
Bohren, C. F. & Huffman, D. R. 1983, Absorption and scattering of light by small particles
(New York: Wiley, 1983)
Brandeker, A., Liseau, R., Olofsson, G., & Fridlund, M. 2004, A&A, 413, 681
Brittain, S. D. & Rettig, T. W. 2002, Nature, 418, 57
Bryden, G. and Lin, D. N. C. and Ida, S. 2000, ApJ, 544, 481
Burrows, A. et al. 1997, ApJ, 491, 856
Chen, C. H. & Jura, M. 2001, ApJ, 560, L171
Clampin, M. et al. 2003, AJ, 126, 385
Draine, B. T. & Lee, H. M. 1984, ApJ, 285, 89
Fisher, R. S., Telesco, C. M., Pina, R. K., Knacke, R. F., & Wyatt, M. C. 2000, ApJ, 532,
L141
Golimowski, D. A. et al. 2004, AJ, 127, 3516
Kenyon, S. J. & Bromley, B. C. 2004, AJ, 127, 513
Krist, J. E., Golimowski, D. A., Schroeder, D. J., & Henry, T. J. 1998, PASP, 110, 1046
Lacy, J. H., Knacke, R., Geballe, T. R., & Tokunaga, A. T. 1994, ApJ, 428, L69
– 20 –
Laor, A. & Draine, B. T. 1993, ApJ, 402, 441
Larwood, J. D. & Kalas, P. G. 2001, MNRAS, 323, 402
Lecavelier Des Etangs, A., Vidal-Madjar, A., & Ferlet, R. 1996, A&A, 307, 542
Lecavelier Des Etangs, A., Vidal-Madjar, A., & Ferlet, R. 1998, A&A, 339, 477
Li, A. & Lunine, J. I. 2003, ApJ, 594, 987
Marsh, K. A., Silverstone, M. D., Becklin, E. E., Koerner, D. W., Werner, M. W., Wein-
berger, A. J., & Ressler, M. E. 2002, ApJ, 573, 425
Miyake, K. & Nakagawa, Y. 1993, Icarus, 106, 20
Monaghan, J. J. 1992, ARA&A, 30, 543
Mouillet, D., Lagrange, A. M., Augereau, J. C., & Menard, F. 2001, A&A, 372, L61
Osterloh, M. & Beckwith, S. V. W. 1995, ApJ, 439, 288
Ozernoy, L. M., Gorkavyi, N. N., Mather, J. C., & Taidakova, T. A. 2000, ApJ, 537, L147
Quillen, A. C., Varniere, P., Minchev, I., & Frank, A. 2005, Submitted to AJ, ArXiv Astro-
physics e-prints
Sylvester, R. J., Dunkin, S. K., & Barlow, M. J. 2001, MNRAS, 327, 133
Takeuchi, T. & Artymowicz, P. 2001, ApJ, 557, 990
Thebault, P., Augereau, J. C., & Beust, H. 2003, A&A, 408, 775
Weinberger, A. J., Becklin, E. E., Schneider, G., Smith, B. A., Lowrance, P. J., Silverstone,
M. D., Zuckerman, B., & Terrile, R. J. 1999, ApJ, 525, L53
Weinberger, A. J., Rich, R. M., Becklin, E. E., Zuckerman, B., & Matthews, K. 2000, ApJ,
544, 937
Wood, K., Smith, D., Whitney, B., Stassun, K., Kenyon, S. J., Wolff, M. J., & Bjorkman,
K. S. 2001, ApJ, 561, 299
Zuckerman, B. 2001, ARA&A, 39, 549
Zuckerman, B., Forveille, T., & Kastner, J. H. 1995, Nature, 373, 494
This preprint was prepared with the AAS LATEX macros v5.2.
– 21 –
Fig. 1.— Optical depth profile (proportional to the surface density) of the disk shown
in Figure 5 of C03, derived from the median values of concentric annuli centered on the
estimated geometric center of the spiral rings. The error bars indicate the standard deviation
and the dashed lines indicate the upper and lower values in each annulus.
– 22 –
Fig. 2.— Scattering opacity at 0.5 µm as a function of grain size. The scattering opacity is
proportional to the product the mass opacity (the scattering cross section, σsca = Qscaπs2,
divided by the particle mass, ∝ s3) weighted by the number of particles (∝ s−3.5) and the
particle mass (∝ s3), where s is the particle size. The scattering efficiency Qsca is that of a
compact astronomical silicate (Laor & Draine 1993; Draine & Lee 1984). To conserve the
area under the curve with a logarithmic abscissa, the ordinate has been multiplied by s.
– 23 –
Fig. 3.— Spectra of 12CO J = 2 → 1 transition with resolutions of 1 MHz (thick curve) and
100 KHz (thin curve, after three-point smoothing) from Zuckerman et al. (1995). Although
the depth of the central depression is ∼ 1σ, it is present in both spectra.
– 24 –
Fig. 4.— Radial velocity (divided by the local Keplerian velocity) as a function of radii, for
β = 4 dust particles launched from two different points: ro = 0.1 (thin lines) and ro = 0.5
(thick lines). The behavior of the dust particles with different amounts of gas is shown: no
gas (highest curve), 10 M⊕, and 50 M⊕ (lowest). The dotted line is the thermal sound speed
of the gas.
– 25 –
Fig. 5.— Position as a function of time for dust particles released at two different positions:
0.1 (thin lines) and 0.5 units (thick lines), for a unit disk of gas in thermal equilibrium around
a 2.3 M⊙ star. The unit of time is such that the orbital period at the outer edge of the disk
is 2π. (If the disk is 1000 AU in radius, one time unit is 3325 yrs.) The solid lines trace
particles with β = 4, while the dashed lines trace particles with β = 10. For each set, three
lines are shown. From the left: no gas, 10 M⊕ and 50 M⊕. Notice that for large amounts of
gas there is little difference between particles with β = 10 (the dashed lines) and β = 4 (the
solid lines).
– 26 –
Fig. 6.— Steady-state dust surface density as a function of distance for an isolated disk,
with dust particles (β = 4, s ∼ 1 µm according to TA01 or s ∼ 3 µm for LL03) for the
linear model (in which the rate of generation is proportional to the planetesimal surface
density). Two sets of surface densities are shown: one for a disk in which the innermost
dust generation radius is 0.1 and another for which it is 0.01. The dotted lines indicate the
surface density with no gas; the dashed lines show the surface density with 10 M⊕ of gas;
the solid lines show the surface density with 50 M⊕ of gas. The gas is in LTE.
– 27 –
Fig. 7.— Steady state dust surface density as a function of distance for an isolated disk but
with the number of dust particles generated proportionally to the square of the planetesimal
surface density. Line traces as in Figure 6. Notice that a broad ring is produced in all cases.
– 28 –
Fig. 8.— The time in years it takes for a dust particle inserted with keplerian velocity
at different radii to reach 500 AU. The central star is 2.3 M⊙. The gas sound speed is
parametrized by the opening angle, H/r, where H is the disk thickness. Solid: β = 4, gas
in LTE; dashed: β = 4, H/r=0.05; dotted: β = 10, gas in LTE. For each set of plots, from
bottom to top: no gas, 10 M⊕, 100 M⊕ (this is the gas amount within 500 AU).
– 29 –
Fig. 9.— Planetesimal evolution as a function of time, for a prograde encounter. The
periastron occurs a one unit distance and in this particular example that is also the radius
of the disk. The units of time are such that the period of a planetesimal at radius one is
approximately 2π. The closest approach occurs at T=0.0, with the largest of the companions
closest to the center. The initial surface density distribution goes as r−1.5. The position of
the binary is indicated with two filled circles or a dashed line (when outside the presented
frame).
– 30 –
Fig. 10.— Gas evolution as a function of time. The gas has H/r=0.1. The parameters of
the simulation are the same as that of Figure 9.
– 31 –
Fig. 11.— The observed profile at a given time is built by adding contributions from dust
at previous times. In this example, β = 4, Mg=50M⊕, with H/r=0.1, T = 1.50, quadratic
dust generation. The panels show the configuration of dust created at previous times and
observed at T = 1.50. The plot shows the azimuthally-averaged densities. These plots show
that the disk is mainly cleared from the inside out.
– 32 –
Fig. 12.— Time evolution of the dusty disk. The image shows the predicted density profile,
azimuthally smoothed and gaussian convolved to match the measurements. The top row
shows models with linear dust generation and the bottom row shows models with quadratic
dust generation. The profiles have been normalized to the same arbitrary maximum value.
The panels display the logarithm of the density profiles. To highlight faint structure, white
color in the bottom panels corresponds to pixels 16 times fainter than in the top panels.
The companions are on top, just outside the frame. The plot inset compares the measured
density profile (thin line) with the model density profile (thick line). To set the distance
scale, the periastron is set at 718 AU. In these simulations, that is also the size of the initial
disk. All models have β = 4, 50 M⊕ of gas, H/r = 0.1. Three times are shown: T=0.8,
T=1.5, and T=2.0.
– 33 –
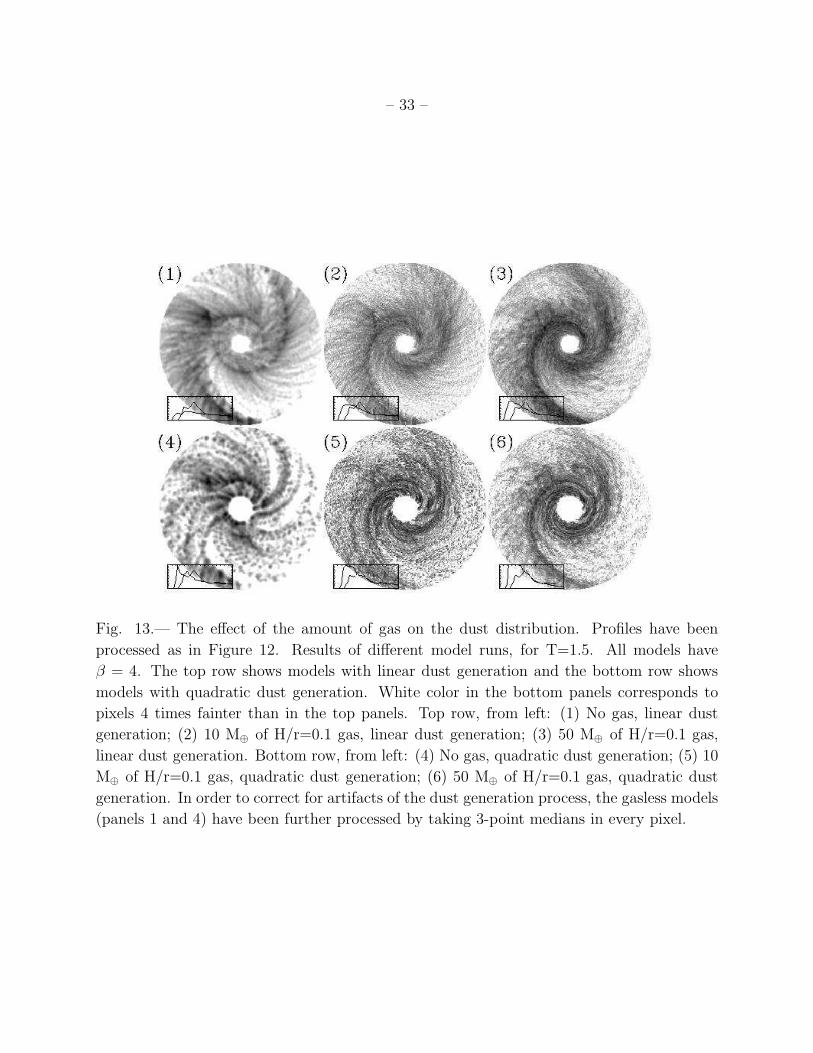
Fig. 13.— The effect of the amount of gas on the dust distribution. Profiles have been
processed as in Figure 12. Results of different model runs, for T=1.5. All models have
β = 4. The top row shows models with linear dust generation and the bottom row shows
models with quadratic dust generation. White color in the bottom panels corresponds to
pixels 4 times fainter than in the top panels. Top row, from left: (1) No gas, linear dust
generation; (2) 10 M⊕ of H/r=0.1 gas, linear dust generation; (3) 50 M⊕ of H/r=0.1 gas,
linear dust generation. Bottom row, from left: (4) No gas, quadratic dust generation; (5) 10
M⊕ of H/r=0.1 gas, quadratic dust generation; (6) 50 M⊕ of H/r=0.1 gas, quadratic dust
generation. In order to correct for artifacts of the dust generation process, the gasless models
(panels 1 and 4) have been further processed by taking 3-point medians in every pixel.
– 34 –
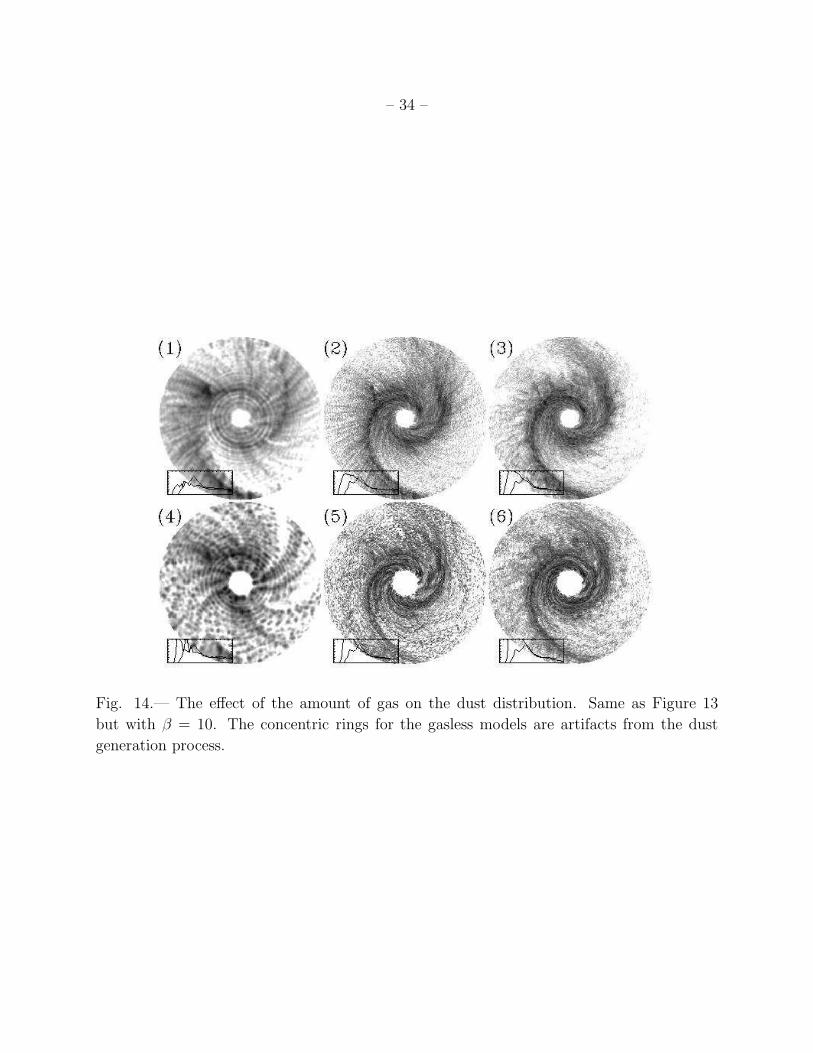
Fig. 14.— The effect of the amount of gas on the dust distribution. Same as Figure 13
but with β = 10. The concentric rings for the gasless models are artifacts from the dust
generation process.
– 35 –
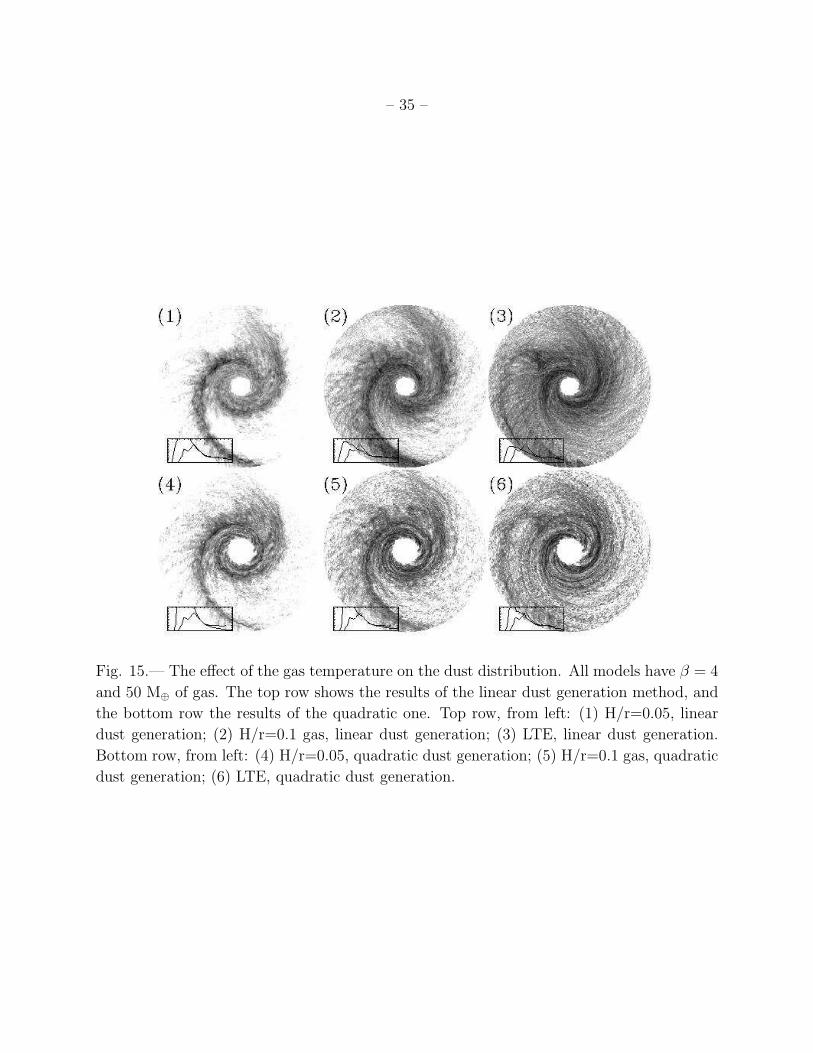
Fig. 15.— The effect of the gas temperature on the dust distribution. All models have β = 4
and 50 M⊕ of gas. The top row shows the results of the linear dust generation method, and
the bottom row the results of the quadratic one. Top row, from left: (1) H/r=0.05, linear
dust generation; (2) H/r=0.1 gas, linear dust generation; (3) LTE, linear dust generation.
Bottom row, from left: (4) H/r=0.05, quadratic dust generation; (5) H/r=0.1 gas, quadratic
dust generation; (6) LTE, quadratic dust generation.
– 36 –
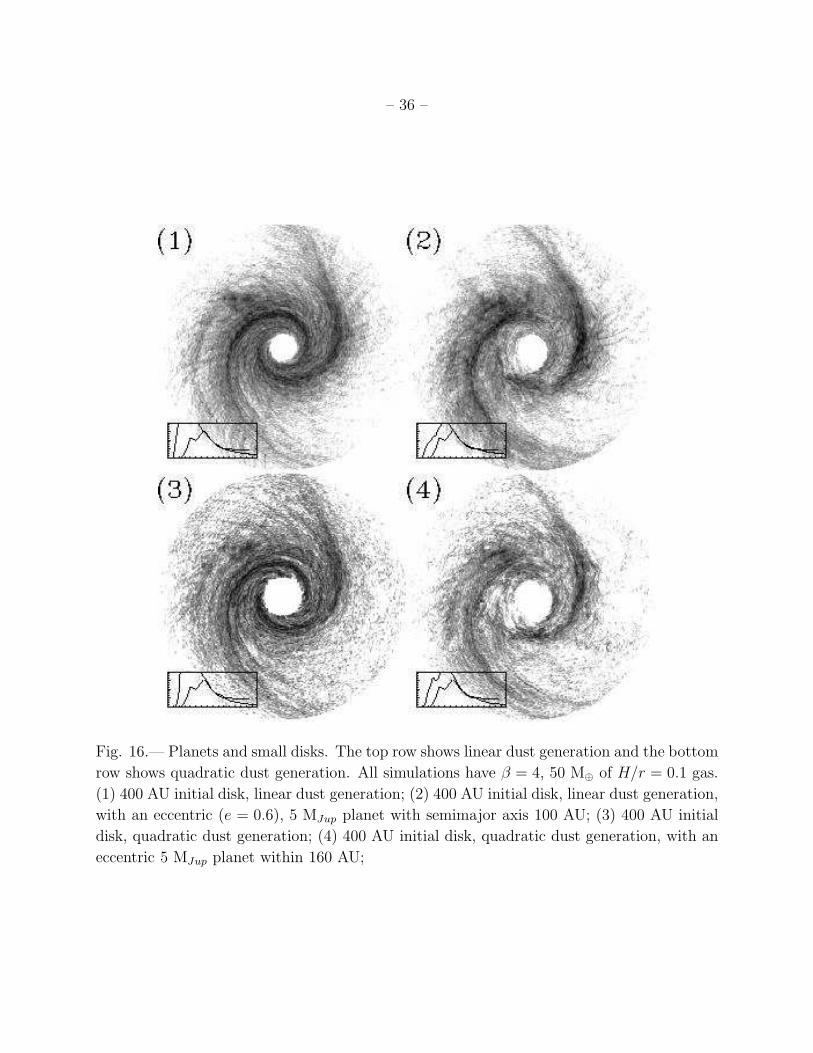
Fig. 16.— Planets and small disks. The top row shows linear dust generation and the bottom
row shows quadratic dust generation. All simulations have β = 4, 50 M⊕ of H/r = 0.1 gas.
(1) 400 AU initial disk, linear dust generation; (2) 400 AU initial disk, linear dust generation,
with an eccentric (e = 0.6), 5 MJup planet with semimajor axis 100 AU; (3) 400 AU initial
disk, quadratic dust generation; (4) 400 AU initial disk, quadratic dust generation, with an
eccentric 5 MJup planet within 160 AU;
– 37 –
Fig. 17.— Comparison between best model and observations. Both are logarithmic stretches.
The model (β = 4, 50 M⊕ of H/r = 0.1 gas, cuadratic dust generation, with an eccentric 5
MJup planet within 100 AU) has been rotated counterclockwise by 13 degrees.
– 38 –
Fig. 18.— Comparison between measured and modeled profiles, at T = 1.50. The traces
show density profiles generated quadratically in small disks (β = 4, 50 M⊕ of H/r = 0.1
gas), with and without planets (Figure 16, panels 3 and 4). Also shown are the planetesimal
and gas surface densities. These are steeper than initially set because of the truncating effect
of the encounter.
Related Documents


![A circumbinary debris disk in a polluted white dwarf system (1).pdf · 2018. 4. 9. · arXiv:1612.05259v1 [astro-ph.EP] 15 Dec 2016 A circumbinary debris disk in a polluted white](https://static.cupdf.com/doc/110x72/6148050ba830d0442101cfe2/a-circumbinary-debris-disk-in-a-polluted-white-dwarf-system-1pdf-2018-4-9.jpg)


