A Dynamic Model of Membrane-Bound Phospholipase C2 Activation by G Subunits Daniel S. Han, Urszula Golebiewska, Sebastian Stolzenberg, Suzanne F. Scarlata, and Harel Weinstein Department of Physiology and Biophysics, Weill Cornell Medical College, Cornell University, New York, New York (D.H., S.S., H.W.); and Department of Physiology & Biophysics, Stony Brook University, Stony Brook, New York (U.G., S.F.S.) Received May 6, 2011; accepted June 20, 2011 ABSTRACT Phospholipase C (PLC) 2, a well studied member of the family of enzymes that catalyze the hydrolysis of the membrane lipid phosphatidylinositol 4,5-bisphosphate (PIP 2 ) into secondary messengers, can be activated by the G subunits of hetero- trimeric G-proteins in a manner that depends on the presence and composition of the associated phospholipid membrane surface. The N-terminal pleckstrin homology (PH) domain of PLC2 mediates both the response to G and membrane binding, but how these interactions are coupled to yield an activated catalytic core remains unknown. Here we propose a mechanism based on molecular models of truncated PLC2 in its activated form complexed with G and in the catalytically inactive/membrane-bound form, obtained with the application of protein-protein docking algorithms and coarse-grained mo- lecular dynamics simulations. These models were probed ex- perimentally, and the inferences were confirmed by results from a combination of molecular biology and fluorescence assays. Results from the dynamic simulations of the molecular models and their interactions with various lipid bilayers identify the determinants of PLC2-PH domain specificity for G and lipid membranes and suggest a mechanism for the previously re- ported dependence of G activation on the associated mem- brane composition. Together, these findings explain the roles of the different activators in terms of their effect on the orienta- tions of the PH and catalytic core domains relative to the lipid membranes. Introduction Mammalian phospholipase C (PLC) enzymes are multido- main proteins that catalyze the hydrolysis of phosphatidyl- inositol 4,5-bisphosphate (PIP 2 ) to generate the second mes- sengers inositol 1,4,5-trisphosphate and diacylglycerol (Suh et al., 2008). In addition to the catalytic domain, PLCs con- tain multiple regulatory protein domains (Rebecchi and Pentyala, 2000; Rhee, 2001). Members of the PLC family contain a pleckstrin homology (PH) domain, an “EF hand” domain, the X-Y catalytic (CAT) domain, a C2 domain, and a coiled-coiled helical C-terminal region. Each domain is known to interact with other proteins, phospholipids, and ions with varying affinities within the PLC family, and these interac- tions ultimately serve to regulate the physiological activity of the protein (Drin and Scarlata, 2007). The PH domains play a particularly important role in the regulation of PLC2 by mediating both protein activators (Harden and Sondek, 2006; Drin and Scarlata, 2007) and membrane association (Wang et al., 1999). Rac1 and G regulate PLC2. Based on recent crystal struc- tures of PLC2 constructs (Jezyk et al., 2006; Hicks et al., 2008), the activating interaction with Rac1 was considered to occur exclusively through the PH domain. These studies sug- gested that Rac1 activates PLC2 by stabilizing its membrane association, which in turn destabilizes the association of a neg- atively charged loop to the catalytic region. Activation of PLC2 by G subunits occurs by a mecha- nism that is distinct from Rac1, because the Rac1-activated This work was supported by the National Institutes of Health National Institutes on Drug Abuse [Grants P01-DA012408, P01-DA012923, T32- DA007274]; and the National Institutes of Health National Institutes of Gen- eral Medical Sciences [Grant R01-GM053132]. Article, publication date, and citation information can be found at http://molpharm.aspetjournals.org. doi:10.1124/mol.111.073403. ABBREVIATIONS: PLC, mammalian inositol-specific phospholipase C; PH, pleckstrin homology; CAT, catalytic; POPC, 1-palmitoyl-2-oleoyl-sn- glycero-3-phosphocholine; POPE, 1-palmitoyl-2-oleoyl-sn-glycero-3-phosphoethanolamine; PIP 2 , phosphatidylinositol 4,5-bisphosphate; PC, phosphocholine; RMSD, root-mean-square deviation; MD, molecular dynamics; SASA rel , relative solvent-accessible solvent areas; PH2, pleckstrin homology domain of PLC2; PLC2 chimera, PH2-PLC1 chimera; CPM, 7-diethylamino-3-(4-maleimidylphenyl)-4-methylcoumarin; AS, anthryloxystearic acid; FRET, Fo ¨ rster resonance energy transfer; NBD, nitrobenzofurazanylamino dodecanoic acid; DOPC, dioleoyl phos- phatidylcholine; DOPE, dioleoyl phosphatidylethanolamine;; LUV, large unilamellar vesicle; DABCYL, 4,4-dimethylamino-azobenzene-4-carboxy- lic acid; IP 3 , inositol trisphosphate. 0026-895X/11/8003-434–445$25.00 MOLECULAR PHARMACOLOGY Vol. 80, No. 3 Copyright © 2011 The American Society for Pharmacology and Experimental Therapeutics 73403/3712475 Mol Pharmacol 80:434–445, 2011 Printed in U.S.A. 434

Welcome message from author
This document is posted to help you gain knowledge. Please leave a comment to let me know what you think about it! Share it to your friends and learn new things together.
Transcript

A Dynamic Model of Membrane-Bound Phospholipase C�2Activation by G�� Subunits
Daniel S. Han, Urszula Golebiewska, Sebastian Stolzenberg, Suzanne F. Scarlata,and Harel WeinsteinDepartment of Physiology and Biophysics, Weill Cornell Medical College, Cornell University, New York, New York (D.H., S.S.,H.W.); and Department of Physiology & Biophysics, Stony Brook University, Stony Brook, New York (U.G., S.F.S.)
Received May 6, 2011; accepted June 20, 2011
ABSTRACTPhospholipase C (PLC) �2, a well studied member of the familyof enzymes that catalyze the hydrolysis of the membrane lipidphosphatidylinositol 4,5-bisphosphate (PIP2) into secondarymessengers, can be activated by the G�� subunits of hetero-trimeric G-proteins in a manner that depends on the presenceand composition of the associated phospholipid membranesurface. The N-terminal pleckstrin homology (PH) domain ofPLC�2 mediates both the response to G�� and membranebinding, but how these interactions are coupled to yield anactivated catalytic core remains unknown. Here we propose amechanism based on molecular models of truncated PLC�2 inits activated form complexed with G�� and in the catalyticallyinactive/membrane-bound form, obtained with the application
of protein-protein docking algorithms and coarse-grained mo-lecular dynamics simulations. These models were probed ex-perimentally, and the inferences were confirmed by results froma combination of molecular biology and fluorescence assays.Results from the dynamic simulations of the molecular modelsand their interactions with various lipid bilayers identify thedeterminants of PLC�2-PH domain specificity for G�� and lipidmembranes and suggest a mechanism for the previously re-ported dependence of G�� activation on the associated mem-brane composition. Together, these findings explain the roles ofthe different activators in terms of their effect on the orienta-tions of the PH and catalytic core domains relative to the lipidmembranes.
IntroductionMammalian phospholipase C (PLC) enzymes are multido-
main proteins that catalyze the hydrolysis of phosphatidyl-inositol 4,5-bisphosphate (PIP2) to generate the second mes-sengers inositol 1,4,5-trisphosphate and diacylglycerol (Suhet al., 2008). In addition to the catalytic domain, PLCs con-tain multiple regulatory protein domains (Rebecchi andPentyala, 2000; Rhee, 2001). Members of the PLC� familycontain a pleckstrin homology (PH) domain, an “EF hand”domain, the X-Y catalytic (CAT) domain, a C2 domain, and acoiled-coiled helical C-terminal region. Each domain is known to
interact with other proteins, phospholipids, and ions withvarying affinities within the PLC family, and these interac-tions ultimately serve to regulate the physiological activity ofthe protein (Drin and Scarlata, 2007). The PH domains playa particularly important role in the regulation of PLC�2 bymediating both protein activators (Harden and Sondek, 2006;Drin and Scarlata, 2007) and membrane association (Wanget al., 1999).
Rac1 and G�� regulate PLC�2. Based on recent crystal struc-tures of PLC�2 constructs (Jezyk et al., 2006; Hicks et al.,2008), the activating interaction with Rac1 was considered tooccur exclusively through the PH domain. These studies sug-gested that Rac1 activates PLC�2 by stabilizing its membraneassociation, which in turn destabilizes the association of a neg-atively charged loop to the catalytic region.
Activation of PLC�2 by G�� subunits occurs by a mecha-nism that is distinct from Rac1, because the Rac1-activated
This work was supported by the National Institutes of Health NationalInstitutes on Drug Abuse [Grants P01-DA012408, P01-DA012923, T32-DA007274]; and the National Institutes of Health National Institutes of Gen-eral Medical Sciences [Grant R01-GM053132].
Article, publication date, and citation information can be found athttp://molpharm.aspetjournals.org.
doi:10.1124/mol.111.073403.
ABBREVIATIONS: PLC, mammalian inositol-specific phospholipase C; PH, pleckstrin homology; CAT, catalytic; POPC, 1-palmitoyl-2-oleoyl-sn-glycero-3-phosphocholine; POPE, 1-palmitoyl-2-oleoyl-sn-glycero-3-phosphoethanolamine; PIP2, phosphatidylinositol 4,5-bisphosphate; PC,phosphocholine; RMSD, root-mean-square deviation; MD, molecular dynamics; SASArel, relative solvent-accessible solvent areas; PH�2,pleckstrin homology domain of PLC�2; PLC�2 chimera, PH�2-PLC�1 chimera; CPM, 7-diethylamino-3-(4�-maleimidylphenyl)-4-methylcoumarin;AS, anthryloxystearic acid; FRET, Forster resonance energy transfer; NBD, nitrobenzofurazanylamino dodecanoic acid; DOPC, dioleoyl phos-phatidylcholine; DOPE, dioleoyl phosphatidylethanolamine;; LUV, large unilamellar vesicle; DABCYL, 4,4-dimethylamino-azobenzene-4�-carboxy-lic acid; IP3, inositol trisphosphate.
0026-895X/11/8003-434–445$25.00MOLECULAR PHARMACOLOGY Vol. 80, No. 3Copyright © 2011 The American Society for Pharmacology and Experimental Therapeutics 73403/3712475Mol Pharmacol 80:434–445, 2011 Printed in U.S.A.
434

enzyme can be further activated by G�� subunits (Jezyk etal., 2006; Hicks et al., 2008). It is noteworthy that the acti-vation by G�� subunits is also conferred through the PHdomain, as demonstrated by experiments in which the PHdomain of PLC�2 was swapped for that of PLC�1 [which isnot activated by G�� subunits (Wang et al., 2000)]. Thisexchange of activators was possible because of the high se-quence conservation of the catalytic sites of the two enzymes.Further studies showed that enzymatic activity, membranebinding, and G�� activation of a PH�2PLC�1 chimera (re-ferred to throughout as the “PLC�2 chimera”) were identicalto those of full-length PLC�2 (Wang et al., 2000; Drin et al.,2006). Because both Rac1 and G�� bind to membranes, andtheir activation of PLC�2 is mediated by the PH domain,activation was suggested to involve recruitment of the PHdomain to membranes (Hicks et al., 2008). However, PLC�2independently binds to membranes before G�� activation(Runnels et al., 1996), and cell studies show that PLC�2 hasa significant plasma membrane population (Guo et al., 2010).Because activation of PLC�2 can also be achieved by a pep-tide derived from G�� (G�86–105) that does not interactwith membranes (Buck et al., 1999), it is likely that activa-tion by G�� is more complex, and rearrangement of the PLCprotein domains relative to each other and to the membrane(Runnels et al., 1996; Drin et al., 2006).
Unlike PLC�1, which binds to membranes that containPIP2 molecules via its PH domain (Rebecchi et al., 1992),membrane association of PLC�2 shows little dependence onthe nature of the lipid head group (Wang et al., 1999). Inter-changing the PH domains of PLC�2 and PLC�1 was shown tolead to an exchange of their membrane binding specificities,demonstrating that binding of these enzymes to lipid mem-branes is determined by their PH domains (Wang et al.,2000), but the details of the PLC�2 PH domain interactionwith lipid membranes are unknown. It is noteworthy thatactivation of the PLC�2 chimera by G�� or by G�86–105 islow when substrate is embedded in POPC bilayers andgreatly enhanced in the presence of POPE (Drin et al., 2006).Thus, the nature of the membrane surface plays a key role inG�� activation of PLC�2, but not binding.
To decipher the molecular details of PLC�2 activation, wecarried out molecular modeling of the interactions betweenthe PH domain and 1) its own catalytic core, 2) one of itsprotein activators (G��), and 3) phospholipid membranesand supported these findings experimentally. We identifiedthe quaternary structures of an “active” PLC�2 bound toG��, and of PLC�2 in a novel “inactive” conformational stateusing computational docking algorithms to predict protein-protein interactions that were substantiated by mutagenesisand spectroscopic measurements. Together, the results fromour multiscale analysis yield a mechanistic model of the wayin which PLC�2 activity depends on protein-protein and pro-tein-lipid interactions that occur at various time and lengthscales. A proposed mechanism of PH domain regulation ofthe PLC�2 enzyme emerges from these results, in which theorientation of the PH domain with respect to the membranesurface plays a determinant role.
Materials and MethodsProtein-Protein Docking Algorithm. A two-step docking pro-
cedure was used to predict the conformation of protein quaternary
complexes. In the first step, termed “global search,” a preparedensemble of conformations of protein complexes is ranked with anenergy-scoring function using two protein-protein docking softwareprograms, ZDOCK (Chen et al., 2003) and PatchDock (Schneidman-Duhovny et al., 2003). These programs aim to search through theentire conformational space and rank the structures according to acalculated energy value (energy scoring function). Both have beenshown to perform well in blind protein–protein docking competitions(Mendez et al., 2005), and the use of two different energy-scoringfunctions improves the chance of finding a true positive by reducingthe bias that any one program might have. The programs wereapplied with the default parameters, and the top 2000 predictionsfrom each were retained. The predictions from both programs wereclustered based on RMSD. Representative structures from the larg-est clusters were designated as the most likely candidates for nativeprotein-protein interaction complexes. The goal of this search is toretain at least one native-like conformation from among the top hits.
In the next step, termed the “local binding energy landscapecalculation,” the binding energy landscape of a given protein complexis tested to determine whether it is a local energy minimum. Thiswas achieved by carrying out a Monte Carlo minimization scheme(known as a perturbation or refinement run) with the docking pro-gram RosettaDock (Gray et al., 2003). In this scheme, the complex isseparated into two regions, a fixed “receptor” and a moveable “li-gand.” Starting from an initial prediction, a perturbation is appliedto the position of the ligand: up to a 10-Å translation along a direc-tion parallel to a line connecting the center of masses of the receptorand ligand, up to a 5-Å translation in the plane perpendicular to thesame line, and up to a 10° rotation. The exact magnitude of theseperturbations did not seem to affect the results. After the perturba-tion, the ligand is docked onto the receptor using a Monte Carlominimization scheme with simultaneous side-chain optimization(Gray et al., 2003). The protocol was repeated 1000 times for eachpredicted complex solution, to generate a plot of RMSD with respectto the initial structure, versus the binding energy score. For a likelynative structure, the points with the most negative binding energyscore cluster in a shape indicative of a binding energy funnel. Thismethod of identifying native protein-protein complexes by examiningthe shapes of binding energy landscapes has proven to be effective(London and Schueler-Furman, 2008).
Coarse-Grained Molecular Dynamics Simulations. Molecu-lar dynamics simulations of the solvated lipid bilayer systems wereperformed using GROMACS version 3.3.1 (Van Der Spoel et al.,2005) and the coarse-grained MARTINI forcefield (Marrink et al.,2007). The bilayer system was simulated at 300 K using the Berend-sen thermostat. The pressure was separately coupled in the mem-brane lateral and normal directions with Berendsen barostats set to1 bar. The timestep used in these coarse-grained MD simulationswas 40 ps.
For this simulation, a coarse-grained representation of the PLC�2PH domain was prepared from the all-atom coordinates of the crystalstructure (Jezyk et al., 2006). The position of the backbone bead wasthe center of mass of the backbone of each residue. The coordinatesof side-chain beads were also placed at the center of mass of thecorresponding atoms taken from the same Protein Data Bank file. Inthe crystal structure, the 10 most N-terminal residues were notresolved. Therefore, they were first modeled in an extended confor-mation at the all-atom level before a coarse-grained model wasconstructed. In addition to the interactions specified in the MARTINIforcefield, harmonic restraints were also added between backbonesbeads in the protein that were less than 7 Å apart. This ensured thatthe overall tertiary structure available in the crystal was maintainedthroughout the simulation. These additional constraints were notadded to the 10 most N-terminal residues, which were unresolved inthe Protein Data Bank file (Jezyk et al., 2006).
Relative Solvent-Accessible Solvent Areas. SASArel weremeasured using the program NACCESS (http://www.bioinf.manchester.
Molecular Model of G Protein Activation of Phospholipase C� 435
ac.uk/naccess/) with a probe radius of 1.4 Å and other defaultparameters.
Protein Expression and Purification. All PLC domain con-structs, including the His6-PLC�1, His6-PLC�2 chimera, His6-PLC�2 chimera mutants, His6-PH domains, and the His6-catalyticdomains were expressed in BL21D3 Escherichia coli and purified asdescribed previously (Drin et al., 2006). Point mutants, the N-termi-nal deletion mutant of PH�2, and a single Cys construct in which allCys residues except for Cys599 of the PLC��1 catalytic domain (11total) were mutated to Ser using QuikChange (QIAGEN, Valencia,CA) also used this same expression and purification scheme. G�1�2
subunits were prepared by coexpression of G�q, G�1, and His6-G�2 inSf9 cells and purified on a nickel-nitrilotriacetic acid column (Kozasaand Gilman, 1995). The purity of proteins was assessed by SDS-polyacrylamide gel electrophoresis gel and concentrations were de-termined by a Bradford assay (Bio-Rad) or by SDS-polyacrylamidegel electrophoresis with known concentrations of bovine serum albu-min for reference. All PLC�2 constructs had activities near that(within 30%) of the wild-type full-length enzyme. The PLC�2 cata-lytic peptide 348–359 (NH2-CFLEAIEAIESF-CONH2) was pur-chased from the American Peptide Company (Sunnyvale, CA) with apurity �90% as confirmed by analytical high-performance liquidchromatography and mass spectrometry.
Lipids. POPE, POPC, palmitoyl-oleoyl phosphatidylserine, andPIP2 in chloroform were purchased from Avanti Polar Lipids, Inc.(Alabaster, AL). [3H]PIP2 was from PerkinElmer Life and AnalyticalSciences (Waltham, MA).
Enzyme Activity Studies. Measurements of PIP2 hydrolysis byPLC enzymes were carried out using small, unilamellar vesicles com-posed of POPE/palmitoyl-oleoyl phosphatidylserine/PIP2 at a 66:32:2molar ratio doped with [3H]PIP2 (Drin et al., 2006).
Fluorescence Labeling and Measurements. Proteins were la-beled on ice with the thiol-reactive probe 7-diethylamino-3-(4�-ma-leimidylphenyl)-4-methylcoumarin (CPM; Invitrogen, Carlsbad, CA)at a probe/protein ratio of 4:1. This same ratio was used in thetime-course study (Fig. 12), except that the latter study was carriedout at room temperature. The reaction was stopped after 60 min byadding 10 mM �-mercaptoethanol, and the protein was purifiedeither by extensive dialysis or using a PD6 column (GE Healthcare;Chalfont St. Giles, Buckinghamshire, UK). PH�2 was also labeled onthe N terminus with Alexa Fluor 488 2,4,6-trinitrophenol (Invitro-gen) by raising the pH of the protein solution to 8.0 and incubatingthe probe with the protein for 1 h. The reaction was quenched by theaddition of hydroxylamine and the labeled protein was isolated fromunreacted probe using a 1-ml PD6 column followed by elution with 1ml of 20 mM HEPES, pH 7.4, 150 mM NaCl, and 1 mM dithiothreitolbuffer.
Fluorescence measurements were performed on a spectrofluorom-eter (ISS Inc., Champaign, IL) using 3-mm quartz cuvettes. Peptideand protein stocks were diluted into 20 mM HEPES, pH 7.2, 160 mMNaCl, and 1 mM dithiothreitol. Intrinsic fluorescence was monitoredat �ex � 280 nm and scanning from 290 to 400 nm. The emissionspectrum of CPM-labeled protein was measured from 415 to 630 nm(�ex � 384 nm). The background spectra of unlabeled protein orpeptide were subtracted from each spectrum along the titrationcurve. All of the spectra were corrected for the 10 to 12% dilution thatoccurred during the titration. For the CPM time course study, theintensity was taken every 1 s at a single emission wavelength (560 nm).
FRET measurements to assess the orientation of Alexa Fluor488-PH��2 on POPC versus POPC/POPE bilayers or of the CPM-labeled single Cys PLC�2 chimera was carried out by doping thebilayers with 0.5 mol % 6-anthryloxystearic acid (6-AS) or 12-AS orwith 0.5 mol% NBD by adding the fatty acids from a concentratedsolution in ethanol directly to preformed large unilamellar vesicles(LUVs) and sonicating the mixture for 10 min at low power in a bathsonicator. The relative FRET from AS donors to Alexa Fluor 488 wasassessed by measuring the increase in Alexa emission exciting at 488nm versus 381 nm, and the relative FRET from CPM donors to NBD
was assessed by comparing the NBD emission exciting at 360 nmversus 480 nm. FRET efficiency was calculated by E � (I � Fi(d �a)/Fi(d)) where Fi(d � a) is the fluorescence intensity of the donor inthe presence of acceptor and Fi(d) is the intensity for the donor alone.
Membrane Binding Studies. Membrane binding was carriedout either by titrating LUVs (prepared by manual extrusion through0.1 �m polycarbonate filter) into a 100 nM solution of labeled proteinand by measuring the change in the integrated area of the probespectra after correcting for background and dilution using the set-tings described above. Membrane binding of PH�2 and �N10-PH�2was determined for both the His-tagged and cleaved protein. In thesestudies, LUVs were labeled with 0.1% Laurdan (Scarlata, 2002), andthe emission was scanned from 400 to 580 nm with �ex � 360 nm.After correction for dilution and background, the change in fluores-cence intensity was plotted as a function of lipid concentration and fitto a hyperbolic curve using SigmaPlot (Systat Software, Inc., SanJose, CA) to obtain the apparent partition coefficient (Kp), whichcorresponds to the lipid concentration at which 50% of the protein orpeptide is bound.
ResultsPLC�2-G�� Complex. To derive a structural context for
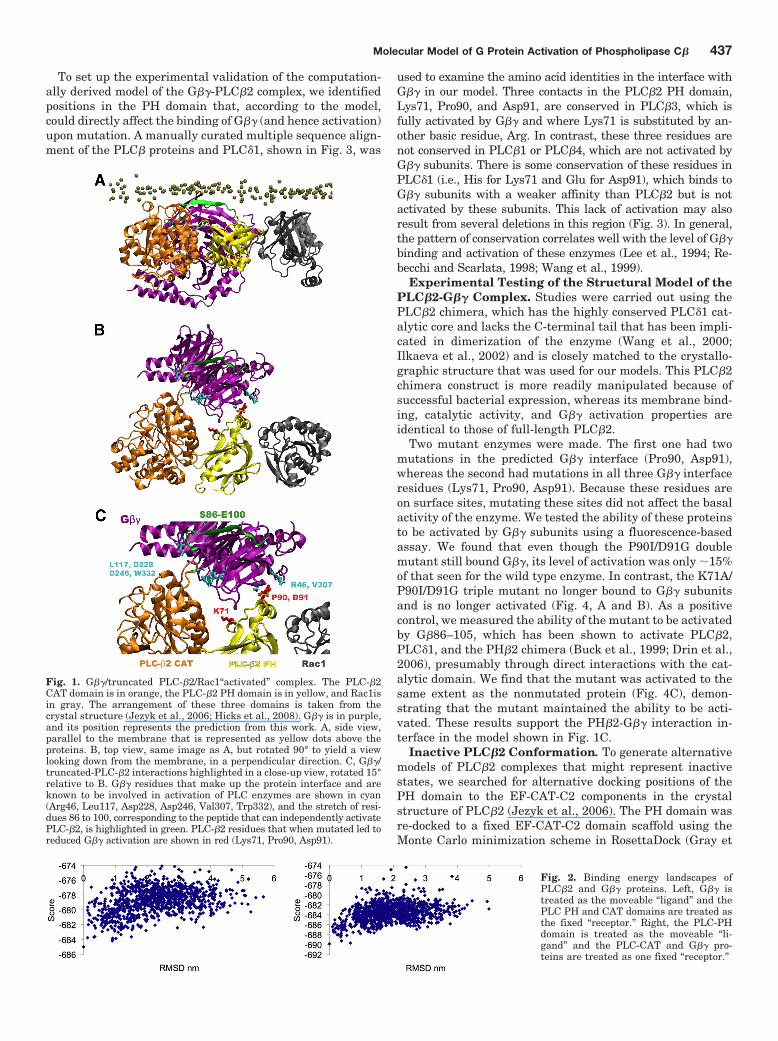
the activation of PLC�2 by G��, we used the crystal struc-ture of a truncated form of PLC�2 (Jezyk et al., 2006) re-ferred to throughout as PLC�2, for short) and the crystalstructure of G�� (Lodowski et al., 2003) to perform an inter-action energy-driven global search of the protein-proteindocking space (see Materials and Methods). A set of candi-date complexes containing the G�� heterodimer and PH, EFhand, CAT, and C2 domains of PLC�2, was obtained fromthis search using two different protein-protein docking pro-grams, ZDOCK (Chen et al., 2003) and PatchDock (Sch-neidman-Duhovny et al., 2003). These candidates were thenclustered based on RMSD, and representative structuresfrom the largest clusters were retained for further analysis.Candidate complexes in which the G�� occluded the catalyticsite of the CAT domain were removed, because this would beincompatible with activation. Likewise, we discarded anycomplexes in which the Rac1 binding site on PLC�2 wasoccluded by G��, because the G�� and Rac1 interaction sur-faces are considered to be distinct (Jezyk et al., 2006). Arepresentative structure from the largest cluster that metthe above criteria (Fig. 1) was retained as a possible interac-tion complex.
To evaluate whether candidate complexes had native-likecharacteristics (for a discussion, see Shan et al., 2010), weconstructed a local binding energy landscape for them andapplied the criteria for identifying native-like structure, asdescribed under Materials and Methods. In brief, Rosetta-Dock (Gray et al., 2003) was used to apply a Monte Carlominimization scheme to each starting complex. The resultingbinding energies are plotted against the RMSD relative tothe initial state. The local binding energy landscapes areshown in Fig. 2 for two different sets of protein complexensembles. These binding energy landscapes were obtainedby allowing either the G�� to move relative to a fixed PLCconstruct composed of the PH and CAT domains (Fig. 2, left),or the PH domain was moved relative to a fixed G��-PLC�2catalytic core complex (Fig. 2, right). The initial orientation ofthe PH and CAT domain were taken from the crystal struc-tures (Jezyk et al., 2006). The binding energy landscapes forboth protein ensembles display the canonical funnel shapethat is characteristic of native complexes (Gray et al., 2003).
436 Han et al.
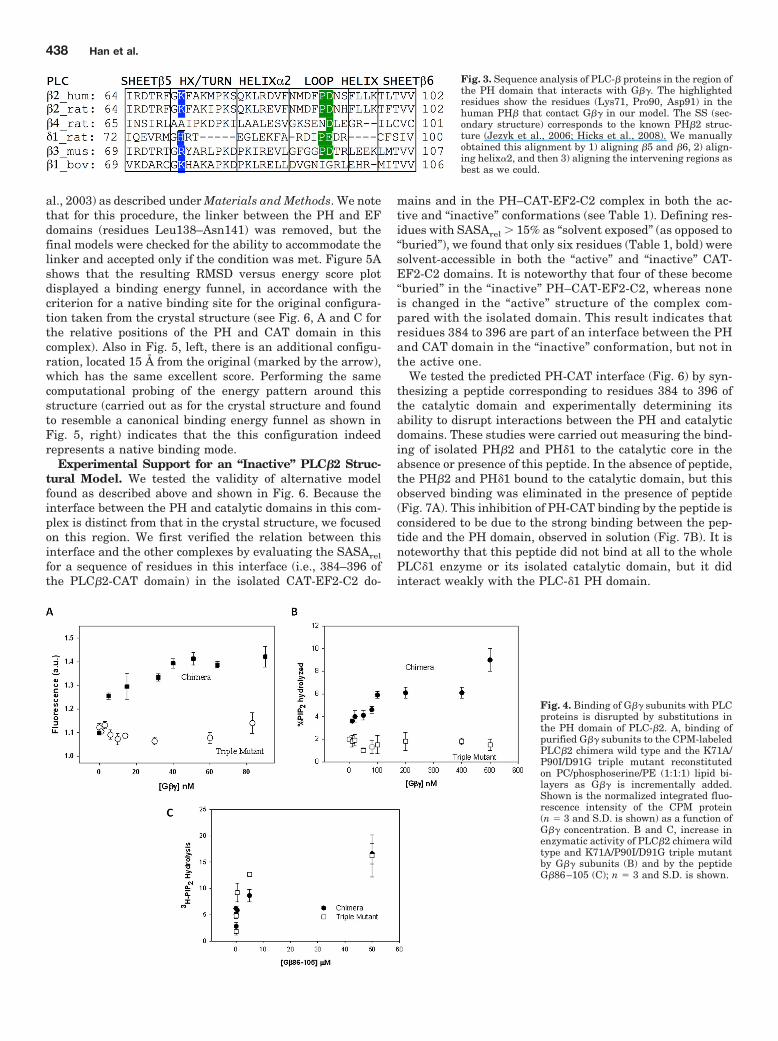
To set up the experimental validation of the computation-ally derived model of the G��-PLC�2 complex, we identifiedpositions in the PH domain that, according to the model,could directly affect the binding of G�� (and hence activation)upon mutation. A manually curated multiple sequence align-ment of the PLC� proteins and PLC�1, shown in Fig. 3, was
used to examine the amino acid identities in the interface withG�� in our model. Three contacts in the PLC�2 PH domain,Lys71, Pro90, and Asp91, are conserved in PLC�3, which isfully activated by G�� and where Lys71 is substituted by an-other basic residue, Arg. In contrast, these three residues arenot conserved in PLC�1 or PLC�4, which are not activated byG�� subunits. There is some conservation of these residues inPLC�1 (i.e., His for Lys71 and Glu for Asp91), which binds toG�� subunits with a weaker affinity than PLC�2 but is notactivated by these subunits. This lack of activation may alsoresult from several deletions in this region (Fig. 3). In general,the pattern of conservation correlates well with the level of G��binding and activation of these enzymes (Lee et al., 1994; Re-becchi and Scarlata, 1998; Wang et al., 1999).
Experimental Testing of the Structural Model of thePLC�2-G�� Complex. Studies were carried out using thePLC�2 chimera, which has the highly conserved PLC�1 cat-alytic core and lacks the C-terminal tail that has been impli-cated in dimerization of the enzyme (Wang et al., 2000;Ilkaeva et al., 2002) and is closely matched to the crystallo-graphic structure that was used for our models. This PLC�2chimera construct is more readily manipulated because ofsuccessful bacterial expression, whereas its membrane bind-ing, catalytic activity, and G�� activation properties areidentical to those of full-length PLC�2.
Two mutant enzymes were made. The first one had twomutations in the predicted G�� interface (Pro90, Asp91),whereas the second had mutations in all three G�� interfaceresidues (Lys71, Pro90, Asp91). Because these residues areon surface sites, mutating these sites did not affect the basalactivity of the enzyme. We tested the ability of these proteinsto be activated by G�� subunits using a fluorescence-basedassay. We found that even though the P90I/D91G doublemutant still bound G��, its level of activation was only �15%of that seen for the wild type enzyme. In contrast, the K71A/P90I/D91G triple mutant no longer bound to G�� subunitsand is no longer activated (Fig. 4, A and B). As a positivecontrol, we measured the ability of the mutant to be activatedby G�86–105, which has been shown to activate PLC�2,PLC�1, and the PH�2 chimera (Buck et al., 1999; Drin et al.,2006), presumably through direct interactions with the cat-alytic domain. We find that the mutant was activated to thesame extent as the nonmutated protein (Fig. 4C), demon-strating that the mutant maintained the ability to be acti-vated. These results support the PH�2-G�� interaction in-terface in the model shown in Fig. 1C.
Inactive PLC�2 Conformation. To generate alternativemodels of PLC�2 complexes that might represent inactivestates, we searched for alternative docking positions of thePH domain to the EF-CAT-C2 components in the crystalstructure of PLC�2 (Jezyk et al., 2006). The PH domain wasre-docked to a fixed EF-CAT-C2 domain scaffold using theMonte Carlo minimization scheme in RosettaDock (Gray et
Fig. 1. G��/truncated PLC-�2/Rac1“activated” complex. The PLC-�2CAT domain is in orange, the PLC-�2 PH domain is in yellow, and Rac1isin gray. The arrangement of these three domains is taken from thecrystal structure (Jezyk et al., 2006; Hicks et al., 2008). G�� is in purple,and its position represents the prediction from this work. A, side view,parallel to the membrane that is represented as yellow dots above theproteins. B, top view, same image as A, but rotated 90° to yield a viewlooking down from the membrane, in a perpendicular direction. C, G��/truncated-PLC-�2 interactions highlighted in a close-up view, rotated 15°relative to B. G�� residues that make up the protein interface and areknown to be involved in activation of PLC enzymes are shown in cyan(Arg46, Leu117, Asp228, Asp246, Val307, Trp332), and the stretch of resi-dues 86 to 100, corresponding to the peptide that can independently activatePLC-�2, is highlighted in green. PLC-�2 residues that when mutated led toreduced G�� activation are shown in red (Lys71, Pro90, Asp91).
Fig. 2. Binding energy landscapes ofPLC�2 and G�� proteins. Left, G�� istreated as the moveable “ligand” and thePLC PH and CAT domains are treated asthe fixed “receptor.” Right, the PLC-PHdomain is treated as the moveable “li-gand” and the PLC-CAT and G�� pro-teins are treated as one fixed “receptor.”
Molecular Model of G Protein Activation of Phospholipase C� 437
al., 2003) as described under Materials and Methods. We notethat for this procedure, the linker between the PH and EFdomains (residues Leu138–Asn141) was removed, but thefinal models were checked for the ability to accommodate thelinker and accepted only if the condition was met. Figure 5Ashows that the resulting RMSD versus energy score plotdisplayed a binding energy funnel, in accordance with thecriterion for a native binding site for the original configura-tion taken from the crystal structure (see Fig. 6, A and C forthe relative positions of the PH and CAT domain in thiscomplex). Also in Fig. 5, left, there is an additional configu-ration, located 15 Å from the original (marked by the arrow),which has the same excellent score. Performing the samecomputational probing of the energy pattern around thisstructure (carried out as for the crystal structure and foundto resemble a canonical binding energy funnel as shown inFig. 5, right) indicates that the this configuration indeedrepresents a native binding mode.
Experimental Support for an “Inactive” PLC�2 Struc-tural Model. We tested the validity of alternative modelfound as described above and shown in Fig. 6. Because theinterface between the PH and catalytic domains in this com-plex is distinct from that in the crystal structure, we focusedon this region. We first verified the relation between thisinterface and the other complexes by evaluating the SASArel
for a sequence of residues in this interface (i.e., 384–396 ofthe PLC�2-CAT domain) in the isolated CAT-EF2-C2 do-
mains and in the PH–CAT-EF2-C2 complex in both the ac-tive and “inactive” conformations (see Table 1). Defining res-idues with SASArel � 15% as “solvent exposed” (as opposed to“buried”), we found that only six residues (Table 1, bold) weresolvent-accessible in both the “active” and “inactive” CAT-EF2-C2 domains. It is noteworthy that four of these become“buried” in the “inactive” PH–CAT-EF2-C2, whereas noneis changed in the “active” structure of the complex com-pared with the isolated domain. This result indicates thatresidues 384 to 396 are part of an interface between the PHand CAT domain in the “inactive” conformation, but not inthe active one.
We tested the predicted PH-CAT interface (Fig. 6) by syn-thesizing a peptide corresponding to residues 384 to 396 ofthe catalytic domain and experimentally determining itsability to disrupt interactions between the PH and catalyticdomains. These studies were carried out measuring the bind-ing of isolated PH�2 and PH�1 to the catalytic core in theabsence or presence of this peptide. In the absence of peptide,the PH�2 and PH�1 bound to the catalytic domain, but thisobserved binding was eliminated in the presence of peptide(Fig. 7A). This inhibition of PH-CAT binding by the peptide isconsidered to be due to the strong binding between the pep-tide and the PH domain, observed in solution (Fig. 7B). It isnoteworthy that this peptide did not bind at all to the wholePLC�1 enzyme or its isolated catalytic domain, but it didinteract weakly with the PLC-�1 PH domain.
Fig. 3. Sequence analysis of PLC-� proteins in the region ofthe PH domain that interacts with G��. The highlightedresidues show the residues (Lys71, Pro90, Asp91) in thehuman PH� that contact G�� in our model. The SS (sec-ondary structure) corresponds to the known PH�2 struc-ture (Jezyk et al., 2006; Hicks et al., 2008). We manuallyobtained this alignment by 1) aligning �5 and �6, 2) align-ing helix�2, and then 3) aligning the intervening regions asbest as we could.
Fig. 4. Binding of G�� subunits with PLCproteins is disrupted by substitutions inthe PH domain of PLC-�2. A, binding ofpurified G�� subunits to the CPM-labeledPLC�2 chimera wild type and the K71A/P90I/D91G triple mutant reconstitutedon PC/phosphoserine/PE (1:1:1) lipid bi-layers as G�� is incrementally added.Shown is the normalized integrated fluo-rescence intensity of the CPM protein(n � 3 and S.D. is shown) as a function ofG�� concentration. B and C, increase inenzymatic activity of PLC�2 chimera wildtype and K71A/P90I/D91G triple mutantby G�� subunits (B) and by the peptideG�86–105 (C); n � 3 and S.D. is shown.
438 Han et al.

The combined inferences from our computational and ex-perimental findings lead us to propose that the PLC�2 com-plex shown in Fig. 6, B and D, which is different from the oneseen in the crystal structures (Jezyk et al., 2006; Hicks et al.,2008), is a native binding mode that represents the inactiveconformation of PLC�2. In further support of this proposi-tion, we find that the interface contains residues Lys80 andArg82 of the PH domain that were found in other experi-ments to stabilize the inactive complex (Drin et al., 2006).
Membrane Binding Studies Support Alternate Mod-els of PLC�2. Previous studies suggest that the orientationof the PH domain relative to the catalytic domain is alteredupon membrane binding (Drin et al., 2006). Because thePLC�2-PH domain also determines the binding affinity andspecificity for phospholipid membranes (Wang et al., 1999), itis likely to be important for regulation of PLC activity. How-ever, the arrangement of domains as seen in the crystalstructure (Jezyk et al., 2006; Hicks et al., 2008) and in thecombined activated complex with G�� (Fig. 1A) does not
seem to allow for direct membrane interaction of the PHdomain despite the need for this domain to target the hostenzyme to the membrane surface. We reasoned that anotherconformational state exists, such as the one presented in Fig.6, in which PLC�2 interacts with membranes directlythrough its PH domain. To this end, we sought to identify thesurface of the PH domain that interacts with lipid mem-branes. These studies were carried out through MD simula-tions with a coarse-grained model of a solvated lipid bilayerand a PLC�2 PH domain comprising residues 1 to 144 (seeMaterials and Methods for details).
The coarse-grained model of the PLC�2 PH domain wasinitially placed outside of a mixed lipid membrane system(see Fig. 8A) that contained 341 DOPC and 170 DOPE lipids(�2:1). The simulation system contained �1.5 � 104 waterbeads, which provides ample volume for the PH domain todiffuse freely. During the MD simulations, the protein dif-fused in the solution without associating with the membraneuntil t � 0.6 �s; at this point, the N-terminal end of the PHdomain began to interact with the interfacial region of the
Fig. 5. Binding energy versus RMSD plot for the interaction between the PH domain and the EF-CAT-C2 catalytic core. Left, initial and referenceconformation is taken from the crystal structure of a PLC-�2 construct. The red arrow points to a high scoring structure, shown in Fig. 6. Right, initialand reference conformation is taken from the docking output in the left panel, indicated by the red arrow.
Fig. 6. Difference between the active and inactive states involves both atranslation and a rotation of the PH domain (shown in green for theactive complex and in red for the inactive complex), with respect to theCAT-EF2-C2 domain (shown in orange). Residues that were previouslymutated and reported to decrease the basal level of signaling (Drin et al.,2006) are shown in purple van der Waals (VdW) representation (Lys80/Arg82 from the PH domain). Residues 384 to 396 of the CAT domain,which were used as a peptide template to test our modeled “inactive”complex conformation are shown in cyan VdW representation, except forresidues 389, 392, 393, and 396, which interact with the PH domain andare shown in blue VdW representation. A and B, orthographic “side” viewof the active complex taken from the crystal structure (A) and the inactivecomplex (B). C and D, orthographic “top” view of the active complex (fromthe crystal) (C) and the inactive complex (D).
TABLE 1Relative SASA values (as measured with the program NACCESS(http://www.bioinf.manchester.ac.uk/naccess/) measured in the “active”crystal and “inactive” model for residues 384 to 396 for an isolatedCAT-EF2-C2 domain and in the context of the PH–CAT-EF2-C2complex. Defining a residue with SASArel � 15% as “exposed” and“buried” otherwise, one can observe six residues (marked in bold) inboth the active and inactive AT-EF2-C2 domains, among which fourbecome “buried” in the “inactive” PH–CAT-EF2-C2, but none in theactive one. Shown are SASArel values of residues Phe384 to Phe396 inthe CAT-EF2-C2 domain in isolation (“CAT-EF2-C2”) and in complexwith the PH domain (“PH–CAT-EF2-C2”), respectively, for both theactive and inactive conformations. Highlighted in bold are the residuesthat undergo significant decreases in SASArel because of contact withthe PH domain, undergo a significant decreases in SASArel.
CAT Residue
SASArel
Active Inactive
PH–CAT-EF2-C2 CAT-EF2-C2 PH–CAT-EF2-C2 CAT-EF2-C2
%
Phe384 0.1 0 0 0Lys385 41.1 59.9 47.9 59.9Glu386 41.3 40.9 41.8 41.8Ala387 0 0 0 0Ile388 0 0 0 0Glu389 43.3 36.9 15.4 41.7Ala390 0 0 1.2 11.2Ile391 0 0 0 0Ala392 19.5 20 0 21.2Glu393 18.8 46.1 0 65.8Ser394 1.4 0 0 0Ala395 0 0.5 0 0.5Phe396 24.8 23.5 2.8 24.8
Molecular Model of G Protein Activation of Phospholipase C� 439

membrane (see Fig. 8B). Soon thereafter, several other resi-dues from the N-terminal end of the protein, up to residue 10,were found to lie on the surface of the phospholipid bilayerand remained that way for the duration of the simulation(see Fig. 8C). A parallel simulation with the same lipid mem-brane system, but with a PLC�2 PH domain where the first
10 residues were deleted, was performed under identicalconditions for 2 �s. This protein never achieved a sustainedmembrane association (data not shown).
These observations suggest that the N-terminal residues ofthe PH domain are necessary for its interaction with lipidmembranes. We confirmed the impact of these residues onmembrane binding experimentally by testing in vitro aPLC�2-PH domain in which the first 10 residues were de-leted (see Materials and Methods). In agreement with ourcomputational simulations, Fig. 9 shows that the membranebinding affinity of this truncated construct for both POPCand mixed POPC/POPE membranes is significantly lowerthan measured for the wild-type.
G�� activation of PLC�2 seems to be inhibited by PClipids, but increasing the concentration of PE headgroupsleads to full activation (Drin et al., 2006). We therefore hy-pothesized that there may be differences in the nature of theinteraction between PLC�2 PH domains and lipid mem-branes that also depend on the concentration of PE lipidheadgroups, and that this might account for the differentialresponse to G��. This hypothesis was tested computationallywith a coarse-grained protein-bilayer interaction model of aPLC�2-PH domain binding with its N-terminal region tobilayers with a series of different DOPC/DOPE lipid ratios:all DOPC, 2:1 DOPC/DOPE, 1:1 DOPC/DOPE, and 1:2 DOPC/DOPE. The simulations were performed for solvated bilayersystems containing 200 total lipids and �3 � 103 waterbeads, and each system representing a different lipid ratiowas simulated for 2.5 �s (see Materials and Methods for moredetails). In this set of simulations, only residues 1 to 135 ofthe PH domain were included, to eliminate a spurious inter-action observed in the previous simulation, between themembrane and the C-terminal residue (144); in the full pro-tein, this residue is connected to the EF domain and wouldnot be available for membrane interaction.
The nature of the PH domain-membrane interaction wasfound to depend on membrane composition. Specifically, wefound that the distance of residue Thr30 from the center ofthe bilayer strongly correlated with the PE lipid concentration.Thr30 was chosen as an indicator of PH domain orientationbecause it is positioned on the opposite surface from the Nterminus. Thus changes to the orientation of the N-terminal-membrane bound PH domain are reflected in the distancebetween residue Thr30 and the membrane. Figure 10 showsthat the Thr30-membrane distance, presented as the averagevalue from the last half of the simulation, decreases as theconcentration of DOPE increases. Two representative snap-shots showing the orientation of the PH domain with Thr30
Fig. 7. Peptide inhibition of PH-CAT binding supports inactive model.A, binding of the PH domains of PLC�2 and PLC�1 to the CAT domain ofPLC�1 labeled with CPM where binding is seen as an increase in CPMfluorescence. No changes in fluorescence of CPM-CAT are observed in thepresence of 600 nM the peptide PLC�2(385–394), which is a segmentcorresponding to a region that lies in the interface of the inactive statemodel, when either PH�2 or PH�1 are added (note that an offset of �5was added to the x value of these data to allow them to be seen). All dataare an average of three trials, and S.D. is shown. B, binding of the PLC�2(385–394) peptide to CM-PH�2 in solution (F) or to CM-PLC�2 (E); n �3 and S.D. is shown.
Fig. 8. Snapshots from the coarse-grained molecular dy-namics simulation of the PLC�2 PH domain and a hydratedphospholipid membrane taken at t � 0.5, 0.6 and 1.4 �s(A–C). The lipid membrane is shown above the protein ascolored points, and the water was omitted for clarity. Notethat these images include one periodic image in the verticaldirection to illustrate the size of the box.
440 Han et al.
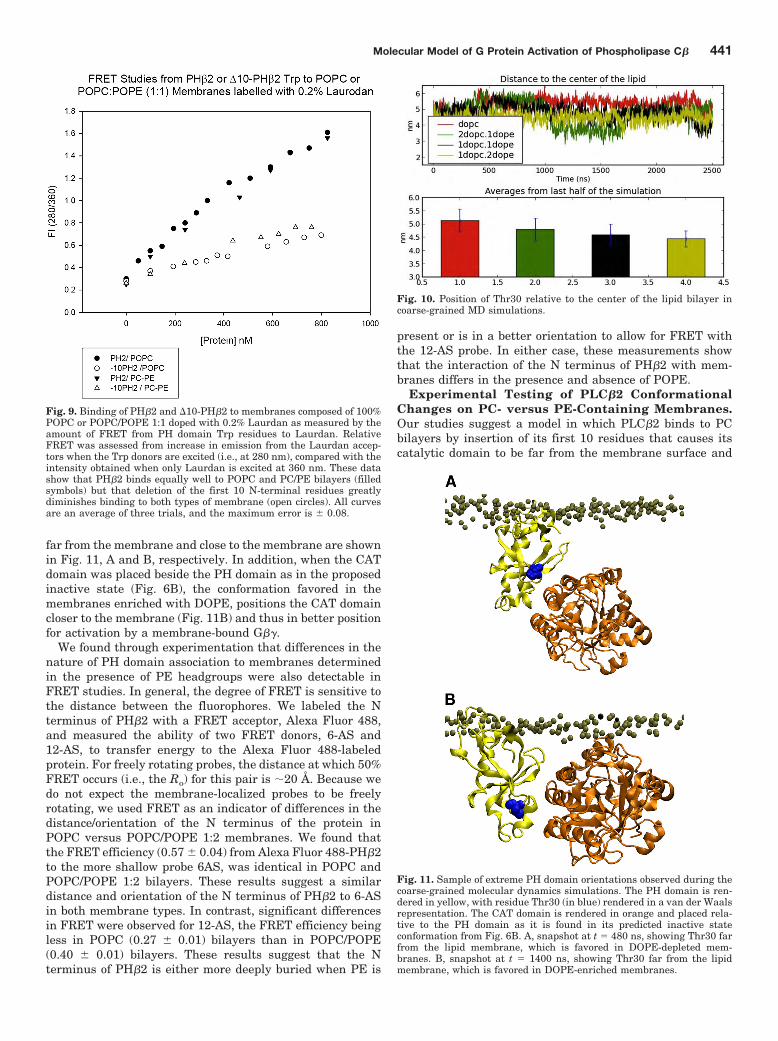
far from the membrane and close to the membrane are shownin Fig. 11, A and B, respectively. In addition, when the CATdomain was placed beside the PH domain as in the proposedinactive state (Fig. 6B), the conformation favored in themembranes enriched with DOPE, positions the CAT domaincloser to the membrane (Fig. 11B) and thus in better positionfor activation by a membrane-bound G��.
We found through experimentation that differences in thenature of PH domain association to membranes determinedin the presence of PE headgroups were also detectable inFRET studies. In general, the degree of FRET is sensitive tothe distance between the fluorophores. We labeled the Nterminus of PH�2 with a FRET acceptor, Alexa Fluor 488,and measured the ability of two FRET donors, 6-AS and12-AS, to transfer energy to the Alexa Fluor 488-labeledprotein. For freely rotating probes, the distance at which 50%FRET occurs (i.e., the Ro) for this pair is �20 Å. Because wedo not expect the membrane-localized probes to be freelyrotating, we used FRET as an indicator of differences in thedistance/orientation of the N terminus of the protein inPOPC versus POPC/POPE 1:2 membranes. We found thatthe FRET efficiency (0.57 0.04) from Alexa Fluor 488-PH�2to the more shallow probe 6AS, was identical in POPC andPOPC/POPE 1:2 bilayers. These results suggest a similardistance and orientation of the N terminus of PH�2 to 6-ASin both membrane types. In contrast, significant differencesin FRET were observed for 12-AS, the FRET efficiency beingless in POPC (0.27 0.01) bilayers than in POPC/POPE(0.40 0.01) bilayers. These results suggest that the Nterminus of PH�2 is either more deeply buried when PE is
present or is in a better orientation to allow for FRET withthe 12-AS probe. In either case, these measurements showthat the interaction of the N terminus of PH�2 with mem-branes differs in the presence and absence of POPE.
Experimental Testing of PLC�2 ConformationalChanges on PC- versus PE-Containing Membranes.Our studies suggest a model in which PLC�2 binds to PCbilayers by insertion of its first 10 residues that causes itscatalytic domain to be far from the membrane surface and
Fig. 9. Binding of PH�2 and �10-PH�2 to membranes composed of 100%POPC or POPC/POPE 1:1 doped with 0.2% Laurdan as measured by theamount of FRET from PH domain Trp residues to Laurdan. RelativeFRET was assessed from increase in emission from the Laurdan accep-tors when the Trp donors are excited (i.e., at 280 nm), compared with theintensity obtained when only Laurdan is excited at 360 nm. These datashow that PH�2 binds equally well to POPC and PC/PE bilayers (filledsymbols) but that deletion of the first 10 N-terminal residues greatlydiminishes binding to both types of membrane (open circles). All curvesare an average of three trials, and the maximum error is 0.08.
Fig. 10. Position of Thr30 relative to the center of the lipid bilayer incoarse-grained MD simulations.
Fig. 11. Sample of extreme PH domain orientations observed during thecoarse-grained molecular dynamics simulations. The PH domain is ren-dered in yellow, with residue Thr30 (in blue) rendered in a van der Waalsrepresentation. The CAT domain is rendered in orange and placed rela-tive to the PH domain as it is found in its predicted inactive stateconformation from Fig. 6B. A, snapshot at t � 480 ns, showing Thr30 farfrom the lipid membrane, which is favored in DOPE-depleted mem-branes. B, snapshot at t � 1400 ns, showing Thr30 far from the lipidmembrane, which is favored in DOPE-enriched membranes.
Molecular Model of G Protein Activation of Phospholipase C� 441

unable to be activated by G�� subunits. In contrast, the morenonpolar PE-containing membrane surface promotes differ-ent enzyme orientations in which the catalytic domain isclose to the membrane surface and can contact G�� subunits.
We carried out a series of fluorescence-based studies to testthis model. First, we determined differences in the reactivityof PLC�’s Cys residues when the protein is bound to purePOPC versus POPC/POPE 1:2 LUVs. CPM is not fluorescentin its unreacted form but becomes highly fluorescent when itcovalently attaches to thiol groups. We monitored the in-crease in CPM fluorescence at 560 nm when it was added toa 100 nM solution of PLC�2 bound to 100 �M POPC or 100�M POPC/POPE 1:2 membranes. A sample trace is shown inFig. 12A. Although the time course varied slightly for eachsample as a result of experimental error, the maximal valueconsistently showed a 3-fold higher intensity of CPM whenthe protein was bound to PE-containing membranes (n � 4).
This result is in accord with a larger number of orientationson PE-containing lipids being sampled by the enzyme.
The differences in protein-membrane orientations result-ing from the presence of PE-containing lipids were monitoredin an alternate series of studies measuring the solvent expo-sure of Trp/Tyr residues of PLC�2 bound to POPC versusPOPC/POPE 1:2 LUVs. Trp and Tyr residues are responsiblefor the intrinsic fluorescence of PLC�2 and these residues arequenched by collision with iodide ions. Therefore, the degreeof fluorescence quenching by iodide ions will indicate differ-ences in the ability of I� in solution to contact the Trp/Tyrwhen bound to the two different types of lipid membranes. InFig. 12B, we show that the degree of I� quenching is similarfor both samples at low amounts of added NaI, suggestingthat the most accessible residues are equally accessible withboth lipid surfaces. However, at high NaI, the quenchingcurve shows that the Trp/Tyr residues of PLC�2 on PC mem-branes are far more protected from quencher compared withthe PC/PE system. Because Tyr/Trp residues are spreadthroughout the protein, the higher degree of quenching on PEmembrane is consistent with accessibility to a larger numberof protein-membrane orientations on these surfaces, com-pared with PC membranes.
We then investigated whether the conformation promotedby the PE lipids positions the catalytic domain closer to themembrane surface. For these studies, we constructed aPLC�2 chimera containing a single Cys residue (Cys599)located in the catalytic domain. Using this mutant, we candetermine the differences in the relative distance betweenthe labeled site in the catalytic domain and a fluorescentprobe on the membrane surface (NBD) by FRET measure-ments. FRET value of negative controls were measured inthe absence of CPM donor molecules and positive controlsconsisting of doubly labeled NBD-bovine serum albumin-CPM, we find that when the enzyme is bound to PE mem-branes the amount of FRET is 37 8% higher than on PCmembranes. This result shows that PE lipids allow the cat-alytic domain of the enzyme to move close to the membranesurface (Fig. 11).
To test the prediction from our model that a differentorientation is achieved between the PH and catalytic do-mains on PC membranes compared with PE-containingmembranes, we used FRET to estimate the differences in thedistance between Cys599 and the N terminus of the enzymeon the two types of membranes. In our molecular models, thedistance is shorter in the active complex than in the PC-bound inactive model. To probe this prediction, we labeledthe single Cys with CPM and placed a FRET acceptor on theN terminus (DABCYL). DABCYL is a nonfluorescent FRETacceptor and the Ro, or distance at which 50% CPM is trans-ferred to DABCYL, is 22 Å (van der Meer, 1994). Keeping inmind that the enzyme has an N-terminal His6 tag, we findthat attachment of DABCYL to the N terminus results in alarge decrease in CPM intensity giving a FRET efficiency of62 13%. Binding of the enzyme to PC membranes nearlyeliminates FRET (efficiency is close to zero at 2 8%). Thisloss in FRET is consistent with an increased distance be-tween the N terminus and the catalytic domain as a result ofits insertion into the bilayer. In contrast, binding to PE lipidsincreases the FRET efficiency to 83 9, consistent with thelarge differences we find in our studies for the domain orien-tations in the two types of lipid compositions.
Fig. 12. A, time course of the increase of CPM fluorescence, as monitoredat �ex � 380 nm and �em � 560 nm upon covalent attachment to PLC�2.In this study, 100 nM PLC�2 was prebound to either 100 �M POPC or100 �M POPC/POPE 1:2 LUVs by simple addition. The reaction wasinitiated by the addition of 400 nM CPM to the cuvette at room temper-ature. Addition of CPM to membranes alone did not produce any changein fluorescence. B, comparison of the loss in intrinsic intensity of PLC�2by Trp and Try side chains due to quenching by NaI bound to POPC orPOPC/POPE 1:2 LUVs. Studies were carried out exciting the samples at280 nm and monitoring the integrated intensity from 290 to 400 nm.Experimental error (not shown) was less than 2% and n � 3.
442 Han et al.

DiscussionBecause of the physiological significance of PLC�2, the
mechanisms determining its regulation have engenderedgreat interest. Past work has identified protein activators ofPLC�2 on different membrane surfaces, but many of themolecular details regarding activation of the enzyme remainlargely undetermined. To reveal essential elements of thesemechanisms, we used a combination of correlated computa-tional and experimental approaches to construct and inter-rogate molecular models of the active and inactive complexes.Starting from the configuration of PLC�2 identified in thecrystal structure of one molecular state (Jezyk et al., 2006;Hicks et al., 2008), we constructed a model of the PLC�2/G��complex without any conformational changes to the backboneof the PLC� domains, which supports the notion that theconfiguration shown in the crystal structures represents anactivated state. Our model of the PLC�2/G�� complex agreeswell with past experimental work. For example, several res-idues in G� (Arg46, Val307, Leu117, Trp332, Asp228, andAsp246) that were previously identified as being importantfor G�� mediated activation of PLC�2 (Li et al., 1998; Pan-chenko et al., 1998) were found to make up part of thiscomplex’s interface (Fig. 1C). In addition, G�86–105, whichhas been shown to produce activation of both PLC�2 andPLC�1 (Buck et al., 1999; Drin et al., 2006), interacts directlywith the catalytic domain in our model, as predicted from itsability to activate the isolated catalytic domain as well as thewhole enzymes. Furthermore, our model accounts for the factthat activation by G�� is achieved for PLC�2, but not therelated PLC�1, by identifying the interaction site on thePLC�2-PH domain as a region of sequence not found inPLC�1 (identifiable as an insert in the alignment; Fig. 3). Toour knowledge, there is only one study that proposes anotherG�� binding site (Bonacci et al., 2005). This suggestion wasbased on triple alanine mutants in the catalytic domain.However, this catalytic site is highly conserved in PLC�2 andPLC�1, as well as in other PLCs that are not activated byG��. In addition, mutations in this region affected catalyticactivity as well as G�� activation, making it difficult touncouple the possible effects arising from structural changesin the catalytic site, from those involving changes in G��activation.
Given the arrangement of the PLC domains in the crystalstructures (Jezyk et al., 2006; Hicks et al., 2008), it remainedunclear how the PH domain could achieve the interactionwith lipid membranes suggested from experimental evidenceshowing that the PH domain is the key mediator of lipidmembrane association (Drin et al., 2006). We reasoned thatthere was likely to be at least one other conformational stateof PLC�2 in which the PH domain interacts with mem-branes, and we hypothesized that it would have featuresresembling the catalytically inactive state, because it pre-cedes G�� binding and activation. Note that the two crystalstructures of the system (Jezyk et al., 2006; Hicks et al.,2008), are very similar except for an anionic linker regionthat connects the two halves of the catalytic domain. Bothstructures show that in the absence of activator, the linkeroccludes the active site, and studies have shown that muta-tions and deletions of the linker region produce a more activeenzyme that can still be activated by G�, G��, and Rac1(Jezyk et al., 2006; Hicks et al., 2008).These authors had
suggested that enzyme activation occurs through the dis-placement of this linker by the membrane surface. As dis-cussed below, a great number of solution studies suggest thatthis relief of autoinhibitory interactions is not the only mech-anism of PLC�2 activation by G�� subunits and that differ-ent activation routes lead to different levels of activity.Therefore, given their great similarity of the crystal struc-tures and the evidence for allosteric regulation, both struc-tures were considered to represent the activated state.
We thus set out to determine inactive forms of the enzyme.Because the PH domain is required for membrane binding ofthe truncated enzyme, we used a combination of computa-tional modeling and experimental validation to identify theorientation of a membrane-bound PH domain, which involvesinsertion of its N-terminal residues, and generated an alter-native combined structure for the PH and CAT domains. It isnoteworthy that the positioning of the new PH-CAT domaincomplex that allows the insertion of the N-terminal region ofthe PH domain into a lipid membrane prevents the CATdomain’s catalytic site from facing the membrane (see Fig.11). The inability of this complex to catalyze PIP2 hydrolysisis further suggested by the configuration in which simulta-neous interactions of the PH domain with both the lipidmembrane and the catalytic domain, as we described, placethe CAT domain in an orientation that prevents catalysis. Asdetailed below, the propensity to achieve reorientation de-pends on the nature of the lipid surface that the enzyme isbound. This suggestion correlates well with observation thatG�� activation occurs on PE but not PC membranes (Drin etal., 2006) and with our computational studies showing thatPE lipids allow for domain reorientation. We propose that tostimulate the enzyme, an additional interaction is requiredto stabilize the orientation of the PH domain relative to lipidmembranes to produce a rearrangement within the CATdomain backbone and/or productive membrane orientation ofthe catalytic domain. This productive configuration of themembrane-bound PH-CAT domain is certainly expected topromote detachment of the anionic linker from the activesite, which has been previously suggested from crystallo-graphic studies (Hicks et al., 2008). This reorientation re-quires the binding of G protein activators, which have theirown preferred orientation relative to the membrane surface,to reorient the PH domain and the attached CAT domain onthe membrane surface. This reorientation promotes detach-ment of the anionic loop to open the active, as suggestedpreviously (Jezyk et al., 2006; Hicks et al., 2008), and movethe conformation of the enzyme from a structure based on theone presented in Fig. 11b to one seen in Fig. 1. The largechange in FRET between sites in the catalytic and PH do-mains we report here supports this idea. The directed seriesof rearrangements we propose in our model as the result ofspecific interaction at alternate interfaces constitutes amechanism that is somewhat different from the “scootingmechanism” of PLC�1, in which binding of the PH domain toa PIP2 lipid molecule alters the orientation between the PHand CAT domains to allow for activation without other ex-ternal protein interactions.
We note that the structural difference we propose betweenthe PLC�2 PH domain in the crystal structures (active-likestate) and the N-terminally membrane-bound domain (inac-tive-like state; see Fig. 11) involves a large rotation of at least90°, making it seem as if G proteins must induce a large
Molecular Model of G Protein Activation of Phospholipase C� 443
change in PLC�2 orientation for activation. However, wefound that although the PH domain always inserts its N-ter-minal residues into the interfacial region of membranes forbinding, regardless of membrane composition, the orienta-tion of the PH domain on membrane surfaces was quitevariable depending on the concentration of PE headgroups.Specifically, the PH domain penetrated more deeply andsampled orientations that were more similar to the one seenin the active-like crystal state when it is was associated withmembranes that contained PE lipids in a concentration-de-pendent manner. This implies that the change in the orien-tation from a PH-membrane bound inactive to an activatedstate may be reduced significantly depending on the mem-brane composition. Furthermore, membranes that containPE headgroups may allow the PH domain and its associatedCAT domain to preferentially sample states that are closer tothe active-like state and can therefore more easily bind toG��. As noted, these differences in PH domain orientationthat depend on the concentration of PE headgroups in themembrane may account for the increased potency of activa-tion of PLC�2 (Drin et al., 2006). The PH domain serves aunique role in PLC�2 regulation. It plays an inhibitory rolewhen it is bound to lipid membrane surfaces, yet it confersactivation when it encounters G�� or Rac1. Although webegan by identifying the molecular interactions that are es-sential to stabilize the various PH complexes, other key ques-tions concerning the differential response of PLC�2 to G��could only be answered when the dynamics on the PH do-main on membrane surfaces were considered.
We acknowledge that the molecular mechanism of bywhich G�� binding moves the preactive conformation intothe fully active one is not clear. It is possible that the initialbinding allows for movement of the PH and CAT domains ina sequential manner, and it is also possible that the mem-brane orientation of G�� subunits differs in the free andPLC�2-bound states. Current studies to determine thesemovements are under way. Regardless of these uncertainties,it is tempting to propose that a possible mechanistic role forthe reorientation of the CAT domain relative to the mem-brane after G�� binding helps the enzymatic reaction byfacilitating product release. We have found that G�� acti-vates the second half of the PIP2 hydrolysis (Feng et al.,2005). This hydrolysis occurs in two steps: cleavage of theDAG from the head group to give a cyclic IP3 and thenhydrolysis to give the linear IP3. It is noteworthy that incontrast to other PLCs, PLC�2 and the PH�2-PLC�1 chi-mera only produce linear IP3 showing that the product of thefirst reaction is held in the active site long enough for waterto attack the substrate (Feng et al., 2005). It is possible thatbinding of G�� helps to reorient the catalytic site from themembrane to allow for increased product release.
Acknowledgments
We thank Angelina Vaseva, Ray Phillip Llenes, Stephen D’Amico,Jaime LeBarron, and Rhodora Cristina Calizo, for technical help andDr. Lucy Skrabanek for helpful discussions. We are grateful to Dr.Elliott Ross for critically reading the manuscript. Computationalresources of the David A. Cofrin Center for Biomedical Informationin the HRH Prince Alwaleed Bin Talal Bin Abdulaziz Alsaud Insti-tute for Computational Biomedicine are gratefully acknowledged.
Authorship Contributions
Participated in research design: Scarlata and Weinstein.Conducted experiments: Han, Golebiewska, Stolzenberg, and Scarlata.Performed data analysis: Han, Golebiewska, Stolzenberg, Scar-
lata, and Weinstein.Wrote or contributed to the writing of the manuscript: Scarlata and
Weinstein.
ReferencesBonacci TM, Ghosh M, Malik S, and Smrcka AV (2005) Regulatory interactions
between the amino terminus of G-protein betagamma subunits and the catalyticdomain of phospholipase Cbeta2. J Biol Chem 280:10174–10181.
Buck E, Li J, Chen Y, Weng G, Scarlata S, and Iyengar R (1999) Resolution of asignal transfer region from a general binding domain in gbeta for stimulation ofphospholipase C-beta2. Science 283:1332–1335.
Chen R, Li L, and Weng Z (2003) ZDOCK: an initial-stage protein-docking algorithm.Proteins 52:80–87.
Drin G, Douguet D, and Scarlata S (2006) The pleckstrin homology domain ofphospholipase Cbeta transmits enzymatic activation through modulation of themembrane-domain orientation. Biochemistry 45:5712–5724.
Drin G and Scarlata S (2007) Stimulation of phospholipase C[beta] by membraneinteractions, interdomain movement, and G protein binding – How many ways canyou activate an enzyme? Cell Signalling 19:1383–1392.
Feng J, Roberts MF, Drin G, and Scarlata S (2005) Dissection of the steps ofphospholipase C beta 2 activity that are enhanced by G beta gamma subunits.Biochemistry 44:2577–2584.
Gray JJ, Moughon S, Wang C, Schueler-Furman O, Kuhlman B, Rohl CA, and BakerD (2003) Protein-protein docking with simultaneous optimization of rigid-bodydisplacement and side-chain conformations. J Mol Biol 331:281–299.
Guo Y, Golebiewska U, D’Amico S, and Scarlata S (2010) The small G protein Rac1activates phospholipase C�1 through phospholipase C�2. J Biol Chem 285:24999–25008.
Harden TK and Sondek J (2006) Regulation of phospholipase C isoenzymes by rassuperfamily GTPases. Annu Rev Pharmacol Toxicol 46:355–379.
Hicks SN, Jezyk MR, Gershburg S, Seifert JP, Harden TK, and Sondek J (2008)General and versatile autoinhibition of PLC isozymes. Mol Cell 31:383–394.
Ilkaeva O, Kinch LN, Paulssen RH, and Ross EM (2002) Mutations in the carboxyl-terminal domain of phospholipase C-beta 1 delineate the dimer interface and apotential Galphaq interaction site. J Biol Chem 277:4294–4300.
Jezyk MR, Snyder JT, Gershberg S, Worthylake DK, Harden TK, and Sondek J(2006) Crystal structure of Rac1 bound to its effector phospholipase C-beta2. NatStruct Mol Biol 13:1135–1140.
Kozasa T and Gilman AG (1995) Purification of recombinant G proteins from Sf9cells by hexahistidine tagging of associated subunits. Characterization of �12 andinhibition of adenylyl cyclase by �z. J Biol Chem 270:1734–1741.
Lee CW, Lee KH, Lee SB, Park D, and Rhee SG (1994) Regulation of phospholipaseC-beta 4 by ribonucleotides and the alpha subunit of Gq. J Biol Chem 269:25335–25338.
Li Y, Sternweis PM, Charnecki S, Smith TF, Gilman AG, Neer EJ, and Kozasa T(1998) Sites for Galpha binding on the G protein beta subunit overlap with sites forregulation of phospholipase Cbeta and adenylyl cyclase. J Biol Chem 273:16265–16272.
Lodowski DT, Pitcher JA, Capel WD, Lefkowitz RJ, and Tesmer JJ (2003) KeepingG proteins at bay: a complex between G protein-coupled receptor kinase 2 andGbetagamma. Science 300:1256–1262.
London N and Schueler-Furman O (2008) FunHunt: model selection based on energylandscape characteristics. Biochem Soc Trans 36:1418–1421.
Marrink SJ, Risselada HJ, Yefimov S, Tieleman DP, and de Vries AH (2007) TheMARTINI force field: coarse grained model for biomolecular simulations. J PhysChem B 111:7812–7824.
Mendez R, Leplae R, Lensink MF, and Wodak SJ (2005) Assessment of CAPRIpredictions in rounds 3–5 shows progress in docking procedures. Proteins 60:150–169.
Panchenko MP, Saxena K, Li Y, Charnecki S, Sternweis PM, Smith TF, Gilman AG,Kozasa T, and Neer EJ (1998) Sites important for PLCbeta2 activation by the Gprotein betagamma subunit map to the sides of the beta propeller structure. J BiolChem 273:28298–28304.
Rebecchi M, Peterson A, and McLaughlin S (1992) Phosphoinositide-specific phos-pholipase C-delta 1 binds with high affinity to phospholipid vesicles containingphosphatidylinositol 4,5-bisphosphate. Biochemistry 31:12742–12747.
Rebecchi MJ and Pentyala SN (2000) Structure, function, and control of phosphoi-nositide-specific phospholipase C. Physiol Rev 80:1291–1335.
Rebecchi MJ and Scarlata S (1998) Pleckstrin homology domains: a common foldwith diverse functions. Annu Rev Biophys Biomol Struct 27:503–528.
Rhee SG (2001) Regulation of phosphoinositide-specific phospholipase C. Annu RevBiochem 70:281–312.
Runnels LW, Jenco J, Morris A, and Scarlata S (1996) Membrane binding of phos-pholipases C-beta 1 and C-beta 2 is independent of phosphatidylinositol 4,5-bisphosphate and the alpha and beta gamma subunits of G proteins. Biochemistry35:16824–16832.
Scarlata S (2002) Determination of the strength and specificity of membrane-boundprotein association using fluorescence spectroscopy. Methods Enzymol 345:306–327.
Schneidman-Duhovny D, Inbar Y, Polak V, Shatsky M, Halperin I, Benyamini H,Barzilai A, Dror O, Haspel N, Nussinov R, et al. (2003) Taking geometry to itsedge: fast unbound rigid (and hinge-bent) docking. Proteins 52:107–112.
444 Han et al.

Shan J, Weinstein H, and Mehler EL (2010) Probing the structural determinants forthe function of intracellular loop 2 in structurally cognate G-protein-coupled re-ceptors. Biochemistry 49:10691–10701.
Suh PG, Park JI, Manzoli L, Cocco L, Peak JC, Katan M, Fukami K, Kataoka T, YunS, and Ryu SH (2008) Multiple roles of phosphoinositide-specific phospholipase Cisozymes. BMB reports 41:415–434.
van der Meer W, Coker G, and Chen SS(1994) Resonance Energy Transfer, Theoryand Data. VCH Publishers, Inc., New York.
Van Der Spoel D, Lindahl E, Hess B, Groenhof G, Mark AE, and Berendsen HJ(2005) GROMACS: fast, flexible, and free. J Comput Chem 26:1701–1718.
Wang T, Dowal L, El-Maghrabi MR, Rebecchi M, and Scarlata S (2000) The pleck-
strin homology domain of phospholipase C-beta(2) links the binding ofGbetagamma to activation of the catalytic core. J Biol Chem 275:7466–7469.
Wang T, Pentyala S, Rebecchi MJ, and Scarlata S (1999) Differential association ofthe pleckstrin homology domains of phospholipases C-beta 1, C-beta 2, and C-delta1 with lipid bilayers and the beta gamma subunits of heterotrimeric G proteins.Biochemistry 38:1517–1524.
Address correspondence to: S. Scarlata, Department of Physiology andBiophysics, Stony Brook University, Stony Brook, NY 11794-8661. E-mail:[email protected]
Molecular Model of G Protein Activation of Phospholipase C� 445
Related Documents