ANA L LLANDRES ET AL. 1 A Dynamic Energy Budget for the whole life-cycle of 1 holometabolous insects 2 3 Ana L. Llandres 1,5 , Gonçalo M. Marques 2 , James L. Maino 3 , S.A.L.M. Kooijman 4 , Michael R. 4 Kearney 3 & Jérôme Casas 1 5 6 1. Institut de Recherche sur la Biologie de l’Insecte, Université de Tours, UMR CNRS 635, 7 Avenue Monge-Parc Grandmont, 37200, Tours, France 8 2. Environment and Energy Section, DEM, and IN+ Center for Innovation Technology and 9 Policy Research, Instituto Superior Técnico, Universidade de Lisboa, Lisbon, Portugal 10 3. Department of Zoology, Melbourne University, Victoria, Australia 11 4. Department of Theoretical Biology, Vrije Universiteit, NL-1981 Amsterdam, the 12 Netherlands 13 5. Corresponding author. E-mail: [email protected] 14 15 Running head: energy budgets in holometabolous insects 16 17

Welcome message from author
This document is posted to help you gain knowledge. Please leave a comment to let me know what you think about it! Share it to your friends and learn new things together.
Transcript

ANA L LLANDRES ET AL.
1
A Dynamic Energy Budget for the whole life-cycle of 1
holometabolous insects 2
3
Ana L. Llandres1,5, Gonçalo M. Marques2, James L. Maino3, S.A.L.M. Kooijman4, Michael R. 4
Kearney3 & Jérôme Casas1 5
6
1. Institut de Recherche sur la Biologie de l’Insecte, Université de Tours, UMR CNRS 635, 7
Avenue Monge-Parc Grandmont, 37200, Tours, France 8
2. Environment and Energy Section, DEM, and IN+ Center for Innovation Technology and 9
Policy Research, Instituto Superior Técnico, Universidade de Lisboa, Lisbon, Portugal 10
3. Department of Zoology, Melbourne University, Victoria, Australia 11
4. Department of Theoretical Biology, Vrije Universiteit, NL-1981 Amsterdam, the 12
Netherlands 13
5. Corresponding author. E-mail: [email protected] 14
15
Running head: energy budgets in holometabolous insects 16
17

ANA L LLANDRES ET AL.
2
Abstract 18
Alterations of the amount and quality of food consumed during ontogeny can affect different 19
life-history traits, such as growth rate, developmental time, survival, adult size and fitness. 20
Understanding the dynamics of such metabolic and energetic pathways and investments is 21
particularly challenging in the case of holometabolous insects due to their strikingly different 22
life-stages. Here we show how whole-life-cycle energy and mass budgets can be achieved for 23
holometabolic insects through Dynamic Energy Budget (DEB) theory, permitting the fate of 24
acquired and stored nutrients to be followed over a complete life cycle. We applied the DEB 25
theory to model the whole life-cycle energetics of an endo-parasitic wasp, Venturia 26
caenescens (Hymenoptera: Ichneumonidae). Data on embryo, larval and pupal dry weights, 27
imago longevity and fecundity were used for assessing the goodness of fit of the model. Our 28
model predicted connections between the growth curves of the larval and pupal stages, the 29
number of eggs laid by the imago through time, and lifespan events such as the different 30
developmental times of the parasitoid. The model enabled us to distinguish and follow the 31
energy invested in eggs through income and capital reserves. The mechanisms leading to the 32
double costs of being small - a shorter life under starving conditions and fewer eggs - were 33
identified by running the model for varying amounts of food eaten early in life, according to 34
host sizes. The final larval instar harvests around 60 times the energy of a recently hatched 35
larva. Around 90 % of this energy is then used during pupation to build structure of the 36
imago and to pay maintenance. Imagoes therefore emerge with only a small percentage of the 37
energy stored by the last instar larvae. Our study shows that, despite being small, this 38
percentage of energy stored during the parasitoid development has a great impact on adult 39
fitness, the loss of which cannot be compensated for by a rich adult environment. Our model 40
is generic and has applications for a wide range of applied and theoretical questions about 41

ANA L LLANDRES ET AL.
3
insect energetics, from population dynamics in multitrophic systems to responses to climate 42
change and life-history strategies. 43
Key words: holometabolous insects, energy budgets, nutrient dynamics, income resources, 44
capital resources, fitness, parasitoids, resource allocation, energy acquisition, Venturia 45
canescens. 46

ANA L LLANDRES ET AL.
4
INTRODUCTION 47
Alterations of the amount and quality of food consumed during life have wide ranging 48
effects on many life-history characteristics of animals such as growth rate, developmental 49
time, survival, adult size and fitness (Joern and Behmer 1997, Taborsky 2006, Barrett et al. 50
2009). Fitness depends not only on resource uptake but also on the allocation of these 51
resources to various life history functions (Sibly and Calow 1986, Heino and Kaitala 1999). 52
The field of ecological energetics integrates metabolic processes and constraints, both internal 53
and external to the organism, to trace the quantities of nutriments and energy ingested and 54
their allocation to fitness enhancing processes (Tomlinson et al. 2014). The models used in 55
ecological energetics are diverse in their nature and contexts, but abide by common principles 56
such as homeostasis and the conservation of energy (Humphries and McCann 2014). They 57
can range from highly detailed, descriptive functions that are species-specific in their 58
parameters and structure, to more general formulations based on a core set of theoretical 59
assumptions, often involving a higher degree of abstraction (Nisbet et al. 2012). 60
Current approaches falling on the more formalized and general end of the spectrum include 61
the stoichiometric approach (Elser et al. 2000), the Geometric Framework of Nutrition 62
(Simpson and Raubenheimer, 2012), the Metabolic Theory of Ecology (Brown et al. 2004) 63
and the Dynamic Energy Budget theory (Kooijman 2010). The relative merits of these 64
different approaches and their relationship have been discussed in previous publications and 65
the convergence of these different theories is a vibrant field of research (Nisbet et al. 2012, 66
Maino et al. 2014, Sperfeld et al. In press). The contexts in which models of ecological 67
energetics are applied vary from conservation physiology and biology (Raubenheimer et al. 68
2012), the characterization of the niche (Kearney et al. 2010a) and the structure and stability 69
of food webs (Getz 2011), often in the context of global changes. Metabolic processes are 70
ANA L LLANDRES ET AL.
5
often strongly coupled to the ability of organisms and higher levels of biological organization 71
to adapt to changes, and this is a question at the heart of evolutionary biology (Applebaum et 72
al. 2014). Thus, the energetic view of resource acquisition and allocation spans both ecology 73
and evolution. 74
Most described species on earth are holometabolous insects, but the impact of acquisition 75
and allocation of resources in this group is challenging to study due to their strikingly 76
different life-stages (Simpson and Raubenheimer 2012). The differences can be so extreme 77
that entire life stages do not feed at all. The pupal stage in all holometabolous insects is 78
exemplary. The imago stage in some Diptera, Lepidoptera, Trichoptera and Megaloptera do 79
not feed either (Mathavan et al. 1987, Wissinger et al. 2004, Cover and Resh 2008, 80
Rosenheim et al. 2008). For holometabolous insects that do not feed during the imago stage, 81
egg provisioning is fuelled through the energy stores accumulated in earlier instars, called 82
capital resources (Jervis et al. 2008). For other insects that feed during the imago stage, the 83
egg provisioning is supplemented by income resources, i.e. energy gained at the imago stage 84
(Jervis et al. 2008). The consequences of resource acquisition and allocation during each life 85
stage of the insect are thus very complex to study as the resources are re-distributed between 86
compartments during metamorphosis. The fat body in particular, which has a key nutrient 87
storage function, undergoes a profound transformation during metamorphosis (Larsen 1976, 88
Nelliot et al. 2006, Hoshizaki et al. 2013). The tissue of the fat body dissociates as it is 89
transformed from an organized tissue in the larva to a loose association of individual fat cells 90
during pupation. This phenomenon has been documented in Diptera and Lepidoptera and is 91
likely to be a common phenomenon of holometabolous insects (Larsen 1976, Nelliot et al. 92
2006, Hoshizaki et al. 2013). Tracing the fate of stored nutrients over a complete life cycle of 93
insects is therefore complex but can be pursued through the existing theoretical framework 94
developed in the field of ecological energetics. 95
ANA L LLANDRES ET AL.
6
The broad concepts of DEB theory have recently been applied to understand metabolic 96
scaling phenomena in insects, and show that it can capture paradoxical patterns such as the U-97
shaped respiration curve during pupation (Maino and Kearney 2014). The advantage of using 98
the DEB approach for understanding energy budgets is that it provides a powerful set of null 99
expectations for the co-variation of life history traits based only on physico-chemical 100
constraints. The traditional approach in life history theory is to assume evolution optimizes 101
traits to maximize life-time reproduction (see Stearns 1992, Roff 2002). Such optimizations 102
must occur within constraints, and DEB theory specifies for particular linkages among life-103
history traits and their variation with the environment. It provides theoretically-grounded 104
predictions for how different life history traits are related in the context of an organism’s 105
energy and mass budget through ontogeny, and also predicts how life history traits should 106
scale with size, in the absence of any optimality criterion. There is great potential for a fusion 107
of DEB theory with traditional optimality methods (Kearney 2012, Nisbet et al. 2012, Maino 108
et al. 2014). 109
In this study we develop a detailed and generic DEB model for holometabolous insects 110
capable of making quantitative predictions of the processes of feeding, growth, development 111
and reproduction across the entire life cycle. In particular our model predicts the growth 112
curves of the larval and pupal stages, the number of eggs laid by the imago through time, and 113
different lifespan events such as the different developmental times of the parasitoid. We use it 114
to consider the energetics of a holometabolous insect, Venturia canescens parasitoid 115
(Hymenoptera: Ichneumonidae), and its implications for different life history traits. This 116
parasitoid species represents a hyper-diverse insect clade and is particularly interesting from 117
an energetic perspective in using both capital and income breeding strategies of energy 118
allocation to reproduction. This species will therefore also allow us to consider the carry over 119
effect of nutrition environments experienced by early developmental stages, i.e. capital 120

ANA L LLANDRES ET AL.
7
reserves, and the effect of adult nutrition, income reserves, on several life history traits of the 121
parasitoid. Our resultant model is detailed yet generalizable and is suitable for studying the 122
underlying energy demand, utilization and storage of capital and income reserves over an 123
entire life cycle of holometabolous insects. Furthermore, the formulation of the DEB model 124
for holometabolous insects provides new opportunities to address questions spanning from 125
life-history strategies and climate change responses in insects to food web structure and 126
population dynamics of host-parasitoid systems. These are further developed in the 127
discussion. 128
129
MATERIALS AND METHODS 130
I. Standard DEB model 131
This section briefly describes the standard DEB model which was constructed to model the 132
life cycle of a generic heterotrophic aerobe. A full description of the model can be found in 133
Kooijman (2010). The standard DEB model is a mechanistic model that tracks the energy 134
flow through organisms during their lifespan through development, reproduction, 135
maintenance and growth. 136
1. Life stages, state variables and energy fluxes. 137
In the standard DEB model the life cycle is characterized by three life stages that can be 138
distinguished by their energy fluxes: embryo, juvenile and adult. An embryo does not 139
assimilate energy from food but relies on stored energy supplies for development (normally 140
called maturation in DEB theory), growth and maintenance processes. The second stage is the 141
juvenile stage. The transition between embryo and juvenile stage occurs once the individual 142
has achieved a particular threshold of energy invested in development. A this point, the 143
ANA L LLANDRES ET AL.
8
individual is sufficiently complex to start feeding and uses the energy acquired through food 144
for continuing its development, growth and maintenance but it does not allocate energy to 145
reproduction. Further investment in development leads to a second transition that is the 146
transition between the juvenile and the adult stage. When the organism becomes an adult, it 147
stops allocating energy to development and redirects this energy to the formation of gametes. 148
The model has four state variables (units are given in parentheses), E (J), V (cm3) and 149
HE (J) -for embryos and juveniles- and RE (J) for adult individuals. E is the amount of 150
energy in reserve, V is the volume of structural mass, HE is the level of maturity, i.e. total 151
energy invested in maturation, which increases throughout the animal’s development until 152
adulthood. DEB theory links the occurrence of metabolic switches (e.g. when assimilation is 153
initiated, when allocation to maturation is redirected to reproduction, etc.) to the level of 154
maturity, i.e. the set of regulation systems that control metabolic performance (Kooijman 155
2010). The building up of maturity costs energy, and maturity is quantified as the cumulated 156
energy or amount of reserve that is invested in maturity. Energy invested in maturation cannot 157
be stored and so is dissipated as heat. In this way, the level of maturity controls life-stage 158
transitions: bHE indicates the onset of assimilation when the embryo turns into a juvenile and 159
pHE the onset of allocation to reproduction when the juvenile turns into adult. For a full 160
explanation of the maturity concept see Kooijman (2010). For pedagogical purpose, the 161
analogy between this state variable and the manual counter that the flight attendants use to 162
count the people sitting on an airplane is useful. Pressing the counter button costs energy 163
which is not stored anywhere but released to the environment. The counter has the same mass 164
and energy after each count. However the counter does store the information about the 165
number of people that has been counted so far, and although the mass is the same, it is 166
arranged in a different manner. As the manual counter, maturity stores information that tells 167
us when the animal experiences metabolic switches. Finally, the state variable RE is the 168

ANA L LLANDRES ET AL.
9
reproduction buffer, i.e. the amount of energy invested in reproduction by adult individuals 169
that will be converted to eggs. Dynamics of all the four state variables are determined by the 170
energy fluxes, expressed in J/d: Ap& , Cp& , Sp& , Gp& , Jp& and Rp& (see Appendix 1). For a detailed 171
specification of the energy fluxes see Table 1. 172
2. Model functioning: dynamics of the state variables 173
In the standard DEB model, food uptake is assumed to follow a type II functional response 174
according to Holling (1959). The animal ingests food and assimilates it with a certain 175
assimilation efficiency given by the parameter Xκ . The ingested food is converted into 176
assimilates which are added to the reserve, ,E through the relationship xpp XA && κ= . Therefore 177
an organism that assimilates energy from food changes the reserve compartment according to 178
an input Ap& , and an output Cp& that represents the flux of mobilized reserve that fuels the 179
animal energetic needs. A fixed proportion, kappa (κ ), of the energy mobilized from the 180
reserve is allocated to somatic maintenance and growth, and the rest, ( κ−1 ), is allocated to 181
maturity maintenance and to maturation/reproduction in juvenile/adults, respectively 182
(Appendix 1). This split is called the kappa rule and gives us information on the proportion of 183
energy invested in soma vs. development/reproduction. Adult individuals convert the 184
reproduction buffer, RE , to eggs with a constant reproduction efficiency, Rκ . As maximum 185
size differs among species, a zoom factor , z , is used to compare physical parameters of an 186
animal to a “reference animal” of maximum length refmL = 1cm (Kooijman 2010). The shape 187
coefficient Mδ converts physical length wL to structural length L by the equation 188
MwLL δ= . The structural volume is the structural length cubed, thus ( )3MwLV δ= .The 189
dynamics of the state variables are specified in Table 2 and the primary DEB parameters in 190
Table 3. 191
ANA L LLANDRES ET AL.
10
II. Study species 192
Venturia canescens is a solitary endoparasitoid that parasitizes several larval instars of 193
different pyralid moth species that are pest of stored food products (Salt 1976). This 194
parasitoid species is synovigenic and produces large number of small hydropic eggs, i.e. eggs 195
that absorb nutrients from the host (Fisher 1971, Ohbayashi et al. 1994, Jervis et al. 2001). 196
The larva develops inside the host by feeding from its hemolymph and tissues. The imagoes 197
emerge with some of their total egg complement matured and feed on sugar (Harvey et al. 198
2001). There is no egg resorption in this species (Eliopoulos et al. 2003). 199
III. A generic DEB Model for holometabolous insects 200
In this section we present the extensions of the DEB model for holometabolous insects. 201
These extensions include 1) the incorporation of four life stages (embryo, larvae, pupa and 202
imago), 2) allocation to reproduction and a constant maturation level at the larval stage, 3) an 203
energetic threshold for pupation, 4) a resetting of maturation at pupation for the building up of 204
the imaginal structure 5) a transformation of larval structure to reserve during pupation, 6) 205
the incorporation of egg maturation during the pupal stage, 7) a dual allocation of energy to 206
reproduction and maintenance in the adult insect and 8) a change in shape between life stages 207
and its concomitant metabolic acceleration. More specific extensions to V. canescens 208
parasitoid species are explained in section IV and include 9) the splitting of the embryonic life 209
into two stages to capture the hydropic nature of its eggs, 10) the production of cocoon silk by 210
the larva and 11) the mixing of nutrients from capital and income sources in eggs at the adult 211
stage. 212
213
1. Stages and associated parameters 214

ANA L LLANDRES ET AL.
11
A full schematic representation of each life stage modeled in Venturia canescens is shown 215
in figure 1. It is important to highlight that this figure includes not only the modifications 216
incorporated for the generic model built for holometabolous insects but also the specific 217
modifications incorporated for Venturia canescens in the embryo and imago stages. These 218
modifications are explained in section IV. 219
As in the standard DEB model, the embryo starts mobilizing the maternal reserve for 220
development, growth and maintenance processes but it does not assimilate energy from food 221
and it does not allocate energy to reproduction (called embryo1 in Fig. 1). As the individual 222
achieves a particular threshold of energy invested in development, bHH EE = it enters the 223
larval stage. The animal starts then feeding as in the standard DEB model but also starts 224
investing energy to reproduction (larva, Fig. 1). As the stage in which there is allocation to 225
reproduction is called adult stage in DEB terms (see section I), we will use interchangeably 226
the term imago and wasp instead of adult to refer to the ontogenetic stage that occurs after the 227
parasitoid emerges from the cocoon. A larva starts to fill the reproduction buffer already then 228
and continues to allocate energy to maintenance and growth. In DEB theory, allocation to 229
reproduction does not occur as long as maturity is still increasing. We assumed therefore that 230
maturity remains constant at bHE during the larval stage. This is a reasonable assumption 231
from a biological point of view as maturity involves cell differentiation. The imaginal discs 232
present in the larvae - which are precursors of imago structures - remain undifferentiated 233
during the larval phase (Chapman et al. 2013). While the reproduction buffer is not yet used 234
to build eggs during the larval stage, the insect accumulates energy that will be needed for 235
building the eggs later, either during the pupal stage or right after the insect emerges from the 236
cocoon, depending on the species (Jervis et al. 2001). The level of nutrient reserves 237
accumulated in the fat body modulates several important aspects of the insect’s life such as 238
the timing of metamorphosis and egg development (Arrese and Soulages 2010). Indeed, 239

ANA L LLANDRES ET AL.
12
recent work shows that energetic thresholds are one of the critical factors affecting the timing 240
of pupation in Manduca sexta (Lepidoptera: Sphingidae) (Helm 2013). For this as well as for 241
other species of holometabolous insects, metamorphosis occurs when the larvae achieves a 242
threshold of weight called 'critical weight' (see Suzuki et al. 2013). We assumed therefore 243
that the onset of the pupal stage occurs once the density of the reproduction buffer built 244
during the larval phase achieves a certain threshold[ ]jRE . The threshold for pupation is 245
[ ] [ ]mRj
jR EsE = which is introduced with a new parameter js and an expression that gives 246
the reference value, i.e. the maximum value for reproduction buffer density, for the onset of 247
pupation: [ ] [ ]ME
MEm
mR
kgkkkgEE&&
&&
++−= )1( κ (for a detailed explanation of this equation and 248
the associated parameters see Appendix 2). Therefore the larval stage is set from [ ] 0=RE to 249
[ ] [ ]jRR EE = .Note that our reproduction buffer density threshold assumption is compatible 250
with the 'critical weight' threshold for pupation hypothesis reported in the literature as the 251
reproduction buffer contributes to the weight of the animal and both increase over time. 252
It is during the time of pupation that the imago structure of the insect is formed while the 253
larval structures are broken down (Wald 1981, Mane-Padros et al. 2010, Kaneko et al. 2011, 254
Merkey et al. 2011). In the model, this is represented by the conversion of larval structure and 255
reserve to pupal reserve (Fig. 1, pupa). For achieving this, a new parameter is added to the 256
standard DEB model: EVy . Parameter EVy converts larval structure to reserve and its units are 257
in mol/mol. In order to convert it to J/cm3 of larval structure, we need to specify the chemical 258
potential of reserve ( Eμ , J/mol) and the volume-specific mass of structure ( ⎥⎦⎤
⎢⎣⎡ VM , mol/cm3) 259
whose values are given in Lika et al. (2011a). Moreover, we also need to specify the decay of 260
larval structure in the pupa, Elk& , which relates to energy conductance, so that jEl Lυk /&& = 261
ANA L LLANDRES ET AL.
13
where jL is the structural length of the larva at pupation. Like the embryo, the pupa does not 262
feed and does not allocate energy to reproduction but keeps the reproduction buffer, filled 263
during the larval stage, ready to mature eggs. The onset of the pupal stage resets the amount 264
of energy dissipated for maturation to 0, so development is reset at 0=HE (see Fig. 1, pupa). 265
This reset is needed as maturity is linked to structure and, as we have explained, a new 266
structure is built up from scratch. Since maturation is linked to cell differentiation in DEB 267
theory and the differentiation of imago structures from the larval imaginal discs starts at the 268
onset of metamorphosis (Arrese and Soulages 2010), it is reasonable to assume that the 269
amount of energy dissipated for maturation is re-set at 0 and increases during the pupal phase 270
until imago structures are completely formed. After the completion of the pupal phase, the 271
pupa has achieved a particular threshold of energy invested in development eHH EE = , which 272
specifies the timing of emergence of the imago from the cocoon (Fig. 1, pupa). 273
In some species of insects, egg maturation starts during the pupal stage (Stevens et al. 274
2000, Jervis et al. 2001, Jervis and Ferns 2004, Jervis et al. 2005); therefore, when the 275
individual has achieved a particular threshold of energy invested in development, eggsHH EE = 276
it starts maturing eggs from the reproduction buffer. eggsHE is thus the maturity level at which 277
egg production starts. At this maturity level, the reproduction buffer turnover is specified by a 278
new parameter, Ek& , with units d-1. This introduces a new state variable in the model called egg 279
buffer, eggsE , which is filled by the reproduction buffer (Fig. 1, pupa). Except for the 280
mobilization of the reproduction buffer, the pupa behaves, from an energetic point of view, 281
very much like the embryo. Indeed, after converting larval structure to pupal reserve it uses 282
this energy supply to fuel maintenance, development and growth. Once the imago emerges, it 283
starts feeding and stops allocating energy to development and growth. The energy that the 284
imago assimilates is now allocated to somatic and maturity maintenance on one hand, and 285
continues to fill the reproduction buffer to produce the eggs on the other hand (Fig. 1, imago). 286
ANA L LLANDRES ET AL.
14
Indeed, literature shows that there is influence of food on longevity and reproduction in many 287
species of holometabolous insects (e.g. Glaser 1923, Cheng 1972, Jervis et al. 2008). In this 288
life stage, the reserve and reproduction buffer turnover are both specified by the parameter Ek& . 289
As we mentioned in the introduction, some species of holometabolous insects do not feed 290
after emergence. This is modeled by the absence of assimilation in the imago stage. In these 291
species, the imago fuels its metabolic needs (maintenance and reproduction) by mobilizing 292
energy from the reserve built before emergence (see discussion for further explanation). The 293
energy fluxes, the equations describing the dynamics of the state variables, and the new model 294
parameters for holometabolous insects are shown in Tables 4, 5 and 6 respectively. The 295
maximum surface-area specific assimilation rate parameter{ }Amp& is absent from table 6. This 296
parameter is internally calculated by the model by using the relationship { } =Amp&[ ]κ
Mpz &(see 297
Kooijman 2010). 298
As for the standard DEB model (see section I), the variable that more directly controls 299
stage transitions (and hence time and size at maturation) is the level of maturity for all the life 300
stages except for the larva for which the transition to pupa is controlled by the reproduction 301
buffer density (see Fig.1). The level of maturity controls life-stage transitions from embryo 1 302
to embryo 2 ( xHE ), from embryo 2 to larva ( b
HE ) and from pupa to imago eHE . The 303
reproduction buffer density, [ ]RE , controls the onset of pupation and thus the stage transition 304
between larvae and pupa at [ ] [ ]mRj
jR EsE = . For the imago, the level of maturity remains 305
constant at eHH EE = . Therefore, what controls the life-stage transitions are the different 306
maturity and js parameters that are estimated through the fitting procedure (see Table 6). 307
308
2. Metabolic acceleration 309

ANA L LLANDRES ET AL.
15
An important difference between the standard DEB model and the model for 310
holometabolous insects is that the standard DEB model is built under the assumption that 311
animals do not change shape during their lifespan, i.e. they present an isomorphic growth 312
(Kooijman 2010). Change in shape is crucial in DEB since feeding is linked to surface area 313
and maintenance is linked to volume (see assimilation and somatic maintenance fluxes in 314
Table 1). The standard DEB model assumes, therefore, that feeding is proportional to surface 315
area and surface area is proportional to volume to the power 2/3 during the whole life of the 316
animal. However, in the case of holometabolous insects this assumption does not hold since 317
animals change morphology during their lives. Usually these animals present larval stages 318
that have a very different morphology compared to other stages of their lives; they are called 319
V1-morphs according to Kooijman (2010). These organisms change shape during growth 320
such that the surface area is proportional to volume. Some parameters of the standard DEB 321
model depend on the surface area-volume relationships: maximum surface-area specific 322
searching rate{ }mF& , maximum surface-area specific assimilation rate{ }Amp& , and energy 323
conductance υ& .Therefore the change in shape alters the surface-area to volume ratio for the 324
different stages, having also influence on the parameters{ }mF& , { }Amp& and υ& (note that the 325
dimension of υ& is length per time but this length is actually a ratio of volume and surface 326
area). For the sake of explanation we will use Θ to stand for any of the parameters that will 327
be affected by the change from isomorph to V1-morph ({ }mF& , { }Amp& and υ& ). We call 328
metabolic acceleration the process in which a specific stage of an animal's ontogeny behave as 329
a V-1 morph and can be modeled by a change in the parameters Θ (Kooijman 2010). In the 330
present model we assume that the embryo behaves as an isomorph, the larva as a V1-morph 331
and after pupation the animal switches back to isomorphy. In the embryo stage the dynamics 332
of the state variables is ruled by the parametersΘ . During the larval growth, the parameters 333
ANA L LLANDRES ET AL.
16
Θ increase proportional to length, that is, each parameter Θ is replaced by bLL /Θ , 334
ensuring that the state variables have V1-morph dynamics. bL is the length at birth, when the 335
larva starts feeding. When the organism eventually reaches pupation, the parameters Θ 336
become once again constant and the dynamics becomes again isomorphic. The parameters Θ 337
retain the value reached at the end of the larval phase, bjj LL /Θ=Θ , where jL is the length 338
at the onset of pupation. We define new parameters to make the dynamics equations explicit 339
in terms of the associated morphity: for the larva, the “reserve turnover”, Ek& , relates to the 340
energy conductance of the embryo, υ& , so that bE Lυk /&& = . Similarly, the maximum surface-341
area specific searching and assimilation rates are [ ] { } bmm LF F /&& = and [ ] { } bAmAm Lpp /&& = 342
respectively (see in Table 4 the fluxes making use of these parameters). Notice that the 343
definition of these parameters does not add any degrees of freedom to the model as they are 344
completely defined by the main parameters presented in Table 6. 345
346
IV. Particularities for Venturia canescens parasitoids 347
We have modeled the life history of V. canescens parasitoids by using the previously 348
explained generic DEB model for holometabolous insects (Fig. 1). In addition to the 349
modifications concerning holometabolous insects, V. canescens shows some further 350
particularities during the embryo, larval and imago stages that have also been incorporated in 351
the model. 352
1. Energy fluxes at the embryonic stage 353
Venturia canescens is known for having hydropic eggs, which are capable of absorbing 354
hemolymph from their host already at the embryo stage, i.e. the eggs swell during 355
embryogenesis (Fisher 1971, Ohbayashi et al. 1994). This is included in the model by 356

ANA L LLANDRES ET AL.
17
incorporating a new parameter xHE that represents the maturity at the time at which the 357
embryo starts assimilating food from the hemolymph of the host (Table 6). Thus, the embryo 358
stage is subdivided in two stages (see Fig. 1, embryo1 and embryo2): the first embryo stage 359
goes from 0=HE to xHE and is represented by the fluxes and equations of the embryonic 360
stage from the standard DEB model. The second embryonic stage goes from xHE to b
HE , 361
when the larva emerges. In this stage the organism behaves as the juvenile stage of the 362
standard DEB model: it starts assimilating energy from food and allocates the energy to 363
development, growth and maintenance (see Table 1). 364
2. Silk production during the larval stage 365
Some parasitoid species pupate within protective cocoons of silk produced by the larvae 366
themselves (Godfray 1994). In some species that go through three larval instars, silk 367
production starts during the late second instar once the silk glands are well developed (de 368
Eguileor et al. 2001). Venturia canescens goes through five larval instars and we do not know 369
when it starts producing silk. We have assumed that silk production starts when the density of 370
the reproduction buffer built during the larval phase achieves a certain threshold[ ]SRE . This 371
is introduced with a new parameter [ ] [ ]mR
SRS EEs /= . Silk production starts therefore when 372
[ ] [ ]mRS
SR EsE = (see Appendix 2 for a full explanation of the expression[ ]m
RE ). For the 373
inclusion of the silk we have incorporated a new state variable, S (J), that represents the silk 374
produced by the larvae. Silk is considered a product in DEB and changes through time as a 375
linear combination of assimilation, dissipation and growth (Table 5). To fully specify the 376
change in silk production through time we have incorporated three new parameters: SAκ , SGκ 377
and SDκ . These parameters determine the contribution of assimilation, growth and dissipation 378
flux to silk production respectively (Table 6). 379

ANA L LLANDRES ET AL.
18
3. Energy fluxes at the imago stage 380
We made several assumptions to determine the energy fluxes linked to the different 381
processes during the imago stage. Reproduction data on Venturia canescens parasitoids 382
shows that they lay eggs until approximately day 17 after emergence and stop laying eggs but 383
continue living until approximately day 36 (see Figure 2C in Harvey et al. 2001). These data 384
show that wasps can live much longer after laying all the eggs which suggest that they 385
emerge with a certain amount of energy in the reserves that will be used to produce eggs. 386
After this energy is depleted they do not produce more eggs but continue to be alive. We 387
have incorporated this in the model by assuming that the assimilation flux equals the 388
maintenance flux, JSA ppp &&& += , so that wasps ingest as much food as they need to pay 389
maintenance costs and are alive as long as they are ingesting food. We are aware that post-390
reproductive lifespan of the imago can be a laboratory artifact, but the assumptions that we 391
made on the energy fluxes during the imago stage do not limit the applicability of the model. 392
The lifespan of the organism is completely controlled by the Weibull ageing acceleration 393
parameter ah&& (see Table 3). Given that this parameter has no impact in any other model 394
feature, the fitting with a different, more realistic, lifespan will only impact the parameter ah&& , 395
leaving all the other predictions and parameters the same. Indeed, the results did not change 396
after we fitted our model by setting the imago longevity to 17 days, i.e. only the reproductive 397
lifespan (data not shown). 398
We also know that there is contribution of food to egg production in V. canescens wasps 399
(Eliopoulos et al. 2003). This is modeled by a rate of reserve mobilization higher than the 400
influx of assimilated food to fill the reserve, i.e. the output coming out from the reserve is 401
higher than the input which shows that food is redirected to egg production. The model 402
incorporates a succession of two buffers for egg production. Within the first pool, ,E food 403
consumed during the imago stage is mixed with the pool of reserve at imago emergence. The 404

ANA L LLANDRES ET AL.
19
reserve is thus partially filled with nutrients coming from food. The second pool, RE , 405
initially contains the reproduction buffer at the end of the pupal period. This pool is refilled 406
with a flux coming from the first pool, ,E during the imago stage. Finally, egg production is 407
determined by the energy contained in the egg buffer, eggsE , which is refilled with a flux 408
coming from RE (Fig. 1, imago). As in the standard model, imagoes convert the 409
reproduction buffer, RE , to eggs with a constant reproduction efficiency, Rκ . These energy 410
fluxes are described in Table 4 and the resulting dynamics of the reserve, the reproduction 411
buffer and the egg buffer are shown in Table 5. 412
413
V. Data collection to estimate model parameters 414
To estimate the DEB model parameters, we used measurements of weight (related to the state 415
variables ,E V and RE -for adult individuals) as a function of time (related to the state 416
variable HE ) (Fig. 2). In particular, we focused on published data on the size of a recently laid 417
egg (Ohbayashi et al. 1994), the dry weight through time of the larva and pupa (Harvey et al. 418
1994), and the number of eggs matured at emergence and after imago emergence (Harvey et 419
al. 2001) of Venturia canescens parasitoids parasitizing 5th instars of Plodia interpunctella 420
(Lepidoptera: Pyralidae) host. Data reported on egg production were those collected under 421
constant food and host access (Harvey et al. 2001). Data reported in Harvey el al. (2001) 422
show the number of progeny instead of the number of eggs. To calculate the number of eggs 423
from the number of progeny we used the % of survival of V. canescens parasitoids at 424
emergence when they develop in P. interpunctella hosts at 25°C (see Spanoudis and 425
Andreadis 2012). The survival at emergence is around 83% under these temperature 426
conditions, thus we multiplied the number of progeny by 100/83 to get an estimation of the 427
number of eggs. 428

ANA L LLANDRES ET AL.
20
The data on the embryo size, length 027.0=l cm and width 0047.0=w cm (Ohbayashi et al. 429
1994), were used to estimate embryo weight by assuming that the egg has a cylindrical shape 430
and that the density of the egg is 4.0=d g/cm3. 431
We also used data related to specific lifespan events (Table 7): the time and weight at 432
larval hatching, at pupation and at imago emergence (Harvey et al. 1994). In addition we used 433
data on the average parasitoid lifespan (Harvey et al. 1994) as well as weight of the cocoon 434
shell divided by the weight of the cocoon to determine the parameters related to silk 435
production (Howell and Fisher 1977). All data were obtained at 25°C. 436
437
Parameter estimation 438
The parameterization procedure has been described in detail in Lika et al. (2011a, 2011b). 439
The estimation was completed using the downloadable software DEBtool (Kooijman et al. 440
2008, http://www.bio.vu.nl/thb/deb/deblab/debtool/) run in Matlab (Mathworks, MA, USA). 441
All parameters were estimated simultaneously using weighted sum of squares routines 442
(nmregr.m) with the Nelder-Mead simplex method, generally followed by a Newton Raphson 443
optimization. The goodness of fit of the parameter estimates was quantified by the mean 444
relative error for the real data, i.e. 10(1- mean relative error) (Lika et al. 2011a, Lika et al. 445
2011b). A mean relative error of 0 gives the highest mark of the goodness of fit, i.e. fit=10. A 446
copy of the MATLAB model code can be found in the supplement 1 and 2. 447
448
Model validation 449
To validate our model we used an independent data set to compare the weight change 450
during pupation between real observations reported in Howell and Fisher (1977) and model 451
predictions. We used the dry weight of the larva at the end of the larval period and the dry 452
ANA L LLANDRES ET AL.
21
weight of the wasp at emergence. The data used to validate our model were data on the 453
growth of Venturia canescens parasitoids developing in Ephestia kuehniellia (Lepidoptera: 454
Pyralidae) host at 25°C. The weight of the hosts used in Howell and Fisher’s paper was 455
heavier than the host’s weight reported in the paper from which we collected the data to 456
estimate the model parameters, 10.48 mg vs 7 mg of host, respectively. Therefore when 457
comparing real data to model predictions, we ran our model by assuming that Venturia 458
ingestion is maximal when it develops in Ephestia. The scaled functional response attains thus 459
its maximal value, i.e. f = 1. We used the proportional weight loss from pupation to 460
emergence between predicted and observed data to validate our model. 461
462
For model validation we also used published data on the developmental times, from egg to 463
pupation, from pupation to emergence and from emergence to death, of Venturia canescens 464
parasitoids developing on 5th instars of Plodia interpunctella hosts at different temperatures: 465
17.5 , 20 , 22.5, 25, 27.5, 30 and 32.5 ºC (Spanoudis and Andreadis 2012). We thus ran model 466
simulations at all those temperatures to compare real data and model predictions. Note that for 467
imago longevity we use used the reproductive lifespan and ignored the post-reproductive 468
lifespan given that the value of imago longevity shown in Spanoudis and Andreadis at 25ºC 469
was 17 days. 470
We also used published data on the cumulative number of progeny two days after wasp 471
emergence under starving conditions at 25°C (Harvey et al. 2001) from wasps that developed 472
in 5th instars of P. interpunctella host. To calculate the number of eggs from the number of 473
progeny we used the % of survival of V. canescens parasitoids at emergence when they 474
develop in P. interpunctella hosts at 25°C (see Spanoudis and Andreadis 2012). Hence we 475
multiplied the number of progeny by 100/83 to get an estimation of the number of eggs (see 476

ANA L LLANDRES ET AL.
22
explanation below). This data was compared to the cumulated number of eggs predicted by 477
the model two days after eclosion after setting f =0, i.e. with no food ingestion. 478
479
Predictions of whole life-cycle energetics 480
We computed the dynamics of the state variables, E ,V , HE , RE and eggsE for the whole 481
parasitoid life-cycle once we got an estimation of the parameters that provided a satisfactory 482
fit of the model predictions to the data. To express all the state variables in Joules, we 483
converted V from cm3 to Joules by using the chemical potential of structure ( Vμ , J/mol) and 484
the volume-specific mass of structure ( [ ]VM , mol/cm3), whose values are given in Lika et al. 485
(2011a). 486
487
Model simulations: contribution of larval and imago feeding to egg production 488
Food variation was entered in the model by running simulations with different values of 489
the scaled functional response, f , in the juvenile and imago stages (see Table 6). The 490
dimensionless function f scales ingestion rate in relation to food concentration according to a 491
Holling II functional response. Note that f is not a parameter but a function of a (possibly 492
varying) food density. At constant food density it can, however, be treated as parameter. The 493
parameter called scaled functional response can reach a value between 0 and 1, where 0 494
corresponds to no food ingested and 1 to maximal food ingested. For the imago stage we ran 495
simulations by setting f to 0 and 1. We chose these values of f for the purpose 496
of comparison. A zero f during the imago stage implies that the animal does not assimilate 497
after emergence. In this case, we have a full capital breeder, i.e. a parasitoid that invests only 498
capital resources in egg maturation because it does not feed after emergence. By comparing 499

ANA L LLANDRES ET AL.
23
egg production between a parasitoid that feeds ad libitum ( f = 1) and a parasitoid that does 500
not feed ( f = 0) after emergence, we can understand which proportion of egg production is 501
attained from capital and income resources. 502
For the juvenile stages, the embryo and larval stages feed from the hemolymph and tissues 503
of the host. The functional response of Venturia’s juvenile stages must be linked to the state 504
variables of the hosts. As the aim of this work is not to model the parasite-host interaction in 505
such a detail, we have used different and fixed values of f as a proxy of the quantity of host 506
ingested (i.e. host size). We therefore ran model simulations at different values of ingestion 507
level, from f = 0.91 to f = 1 during the early stages of development, i.e. embryo and larval 508
stage, to determine the effect of food ingestion early in life on egg production and longevity 509
later on. The maximum value of ingestion f = 1 was chosen by assuming that the food 510
availability is maximum when Venturia develops in Ephestia kuehniellia hosts. We made this 511
assumption because we know from the literature that Venturia is able to parasitize and fully 512
consume E. kuehniellia final instar hosts and that these hosts are much heavier compared to P. 513
interpunctella hosts (Howell and Fisher 1977, Harvey et al. 1994). In addition, the dry weight 514
of a final instar larva attained by Venturia is 5.495 mg and that of the imago is 1.9 mg being 515
able to lay up to 700 eggs when it develops in a fully grown larva of E. kuehniellia host at 516
25ºC (Howell and Fisher 1977, Roberts and Schmidt 2004). We verified that our model 517
showed realistic results after setting f = 1: the predicted dry weights of a final instar larva 518
and of an imago were 5.1 mg and 1.3 mg, respectively, and the predicted total amount of eggs 519
laid were 711 eggs. The ingestion range between f =0.91 and f =1 is equivalent to 6.23 and 7 520
mg of host ingested respectively. The mg of host ingested during the parasitoid development 521
was estimated from the total joules ingested at the end of the larval period at the different 522
values of ingestion level. At each ingestion level, the conversion of joules ingested at the end 523

ANA L LLANDRES ET AL.
24
of the larval period to mg was done by assuming that each mg of host contains 18.84 J. The 524
last conversion was estimated by using (1) the total mass of host consumed at the end of the 525
larval period for parasitoids developing at 5th instars reported in Harvey et al (1994), i.e. 6.5 526
mg of host, and (2) the predicted amount of joules ingested by the parasitoid at the end of the 527
larval period, i.e. 122.4527 J. The lowest value of ingestion level was set at f =0.91 because 528
the model did not show realistic results for ingestion levels below 6.23 mg (see discussion for 529
a further explanation). 530
531
RESULTS 532
Model fit 533
The goodness of fit of the observed to predicted data was 8.9/10 (Lika et al. 2011a, Lika et 534
al. 2011b). Overall, the model predicted the larval and pupal growth curves well (Fig. 2A and 535
B). The predicted cumulative number of eggs produced during the imago stage was also close 536
to the real data (Fig. 2C). In addition, the comparison between the specific lifespan events 537
collected from the literature and the model predictions also showed a satisfactory similarity 538
(Table 7). The worst prediction was the weight of a recently laid egg, i.e. weight of the 539
embryo (see Table 7). Moreover, the prediction of the time at emergence was underestimated 540
by the model: while wasps emerged approximately on day 21 after oviposition, the model 541
predicted wasp emergence on day 16. This was due to the difference between the observed 542
and predicted duration of the pupal phase, 11 vs 6.5 days respectively. 543
Result of model validation 544
The comparison between the dynamics of the weight change during pupation showed a 545
similar pattern between observed and predicted data (Fig. 3). Overall, the proportion of 546

ANA L LLANDRES ET AL.
25
weight loss from pupation to emergence was similar between observed and predicted data: 547
65% and 74% of weigh loss respectively. 548
The comparisons of the different developmental times between model predictions and 549
observations show that our model captures the qualitative pattern of the thermal response in 550
the data well (see Fig. 4). Both model predictions (black circles) and real observations (white 551
circles) show that an increase in temperature reduces the different developmental times (see 552
Fig. 4). The predicted developmental times show lower values compared to real data for the 553
embryonic-larval (Fig. 4A) and pupal (Fig. 4B) stages and very similar values for the imago 554
lifespan (Fig. 4 C). The quantitative differences between the model predictions and 555
observations in the embryonic-larval and pupal developmental times can potentially be 556
explained by the different feeding conditions of the hosts used in the different studies. Our 557
model was developed using the data collected by Harvey et al. (1994). In Harvey’s study, the 558
hosts were fed with a mix of wheat middlings, yeast and glycerol (10:1:1) and the authors 559
gave 25 g of food to 200 Plodia eggs. It has been reported elsewhere that Harvey et al. (1994) 560
reared hosts with an excess of food (Jervis 2005). In the study used for model validation 561
(Spanoudis and Andreadis 2012), the hosts were fed with an artificial diet modified by the 562
addition of 450 g dry pinto beans and 31 g agar (they do not mention the number of larvae 563
that were fed with this amount of food). It is therefore likely that the 5th instar larvae of Plodia 564
interpunctella hosts used by Venturia in both studies achieved different sizes. We know from 565
the literature that host size affects the larval and pupal developmental time: developmental 566
time from egg to wasp emergence decreases with host size at oviposition (Harvey and Strand 567
2002). 568
The cumulative number of eggs two days after emergence at 25°C under starving 569
conditions predicted by the model was very similar to that reported in the literature: 100 vs. 570
87 ± 11 eggs respectively. 571
ANA L LLANDRES ET AL.
26
572
Predictions of whole life-cycle energetic 573
The structure formation starts at the beginning of the embryo stage, reaching 0.00078 J and 574
0.1173 J at the end of the first and second embryo stage respectively (Fig. 5, top left panel). 575
Structure formation continues during the larval stage, reaching a maximum at 6.95 J at the 576
end of the larval stage. During pupation the larval structure disappears and its energy is used, 577
together with energy from the reserve buffer, to build the imago structure. At wasp emergence 578
the imago structure stores 14.11 J and remains constant until the end of the parasitoid life. 579
Maturity increases from 0 to 0.00029 J during the first embryo stage; it continues up to 580
0.045 J during the second embryo stage and remains constant during the larval stage. After 581
pupation maturity restarts from zero and it reaches 5.56 J at wasp emergence. After wasp 582
emergence maturity remains constant (Fig. 5, top right panel). 583
Most of the reserve is built during the larval stage and used after pupation (Fig. 5, bottom 584
left panel). Although not visible in the figure due to the chosen scale, there is no increase in 585
the reserve by feeding in the first embryo stage: the reserve changes from 0.013 J at time 0 to 586
0.009 J at time 0.48 days, the timing at which the second embryo stage starts, equivalent to 587
maturity level xHE = 0.00029 J. It is not until the onset of the second embryo stage that the 588
parasitoid starts refilling the reserve buffer by feeding. At the end of the embryo stage the 589
reserve increased up to 1.35 J. During the larval stage the accumulation of reserve continues 590
until it reaches a maximum (i.e., 80.14 J) at the end of the larval period. At the end of 591
pupation the parasitoid has 4.91 J in the reserve, it is thus during metamorphosis that the 592
parasitoid uses most of the accumulated reserve. After wasp emergence the parasitoid 593
continues to use the stored reserve until the reserve buffer reaches a level of 2.89 J and 594
remains constant until the end of the parasitoid’s life. 595
ANA L LLANDRES ET AL.
27
The reproduction buffer starts appearing at the onset of the larval phase and grows until it 596
accumulates a total of 2.64 J (Fig. 5, bottom right panel). During pupation the reproduction 597
buffer remains constant until the parasitoid reaches a certain maturity threshold, eggsHE = 5.48 598
J, at which egg maturation starts. From eggsHE until e
HE (which is the maturity at wasp 599
emergence) the wasp matures eggs from the reproduction buffer. The reproduction buffer is 600
therefore emptied from 2.64 J to 1.89 J during this period, which translates into a total of 601
48.08 eggs matured at wasp emergence, equivalent to 0.63 J stored in the egg buffer. After 602
emergence, the imago continues to produce eggs. The wasp produces a total of 300 eggs at the 603
end of its life, equivalent to 3.97 J of accumulated energy in eggs. From emergence until 604
death, the reproduction buffer decreases from 1.89 J until it is emptied approximately on day 605
34. During this period the input (energy coming from the reserve) is lower than the output 606
(energy taken from the reproduction buffer to mature eggs) and thus the reproduction buffer 607
decreases. 608
Results of model simulations 609
The model simulations show that the food ingested during the imago stage greatly affected 610
egg production. Wasps simulated to feed ad libitum produce a higher number of eggs 611
compared to those simulated not to feed after emergence (Fig. 6, top left panel). In addition, 612
feeding conditions experienced during the juvenile stages greatly affected imago 613
performance: the amount of host ingested early in life positively affected wasp length at 614
emergence (Fig. 6, top right panel), there was also a positive relationship between wasp 615
length and wasp longevity under food deprivation conditions after emergence (Fig. 6, bottom 616
left panel) and the amount of host ingested early in life positively affected the total number of 617
eggs matured at the end of the parasitoid’s life (Fig. 6, bottom right panel). 618
DISCUSSION 619

ANA L LLANDRES ET AL.
28
We start the discussion by explaining what we have learned with our model and by 620
describing the implications of our model for Venturia canescens and other parasitoid species. 621
We continue by explaining potential reasons for the differences between model predictions 622
and observations. We conclude our discussion with implications regarding life-history traits, 623
host-parasite population dynamics and climate change responses in holometabolous insects. 624
625
Impact of wasp feeding 626
The holometabolous DEB model enables us to distinguish and follow the energy invested 627
in egg through capital or income investment in V. canescens (Fig. 6, top left panel). The 628
model predicts that females produce fewer eggs when they do not feed after emergence 629
compared to when they do, the difference being noticeable 1 day after wasp emergence (Fig. 630
6, top left panel). This is because wasps start maturing eggs from the energy stored in the 631
reproduction buffer during the larval stage; it is not until the second day after emergence that 632
one can notice that the reproduction buffer is being refilled by the food ingested that flows 633
from the reserve to the reproduction buffer. One of the assumptions underlying DEB model 634
construction is that the wasp eats as much as it needs to cover the maintenance costs of living. 635
When feeding, wasps therefore mobilize the reserve with which they emerge to produce eggs 636
and pay the maintenance costs. In contrast, when wasps do not feed, they need to pay 637
maintenance from the reserve buffer, leaving less reserve energy for egg production. On the 638
long term, the impact of imago feeding on egg production is even more striking as feeding 639
wasps produce almost twice as many eggs as non-feeding wasps, given that feeding wasps 640
also live longer (300 vs. 176 eggs). 641
Impact of larval feeding: carry over effects over ontogeny 642

ANA L LLANDRES ET AL.
29
The conditions experienced early in life may have strong effects on the phenotype of the 643
adult, affecting in turn the fitness of the animal. For example, when nutritional conditions 644
during the juvenile stage are good, adults tend to have a larger body size (Day and Rowe 645
2002), a trait that is strongly correlated with fitness in a wide range of species (Rowe and 646
Ludwig 1991, Honek 1993, Abrams and Rowe 1996, Nylin and Gotthard 1998). In 647
parasitoids, Rivero and West (2002) studied the physiological costs of being small in Nasonia 648
vitripennis (Hymenoptera: Pteromalidae). They showed that the number of mature eggs in 649
small wasps is greatly affected by the feeding conditions that they experience after emergence 650
due to the carry over effects over ontogeny. Smaller wasps emerge with lower amount of 651
lipids and glycogen in the reserve. If they do not feed, they mature fewer eggs than when they 652
do feed because presumably they do not refill the energy buffer for eggs. The environment 653
does not alter egg maturation so dramatically for larger wasps because they can still use the 654
large amount of reserves built during the larval stage for maturing eggs. In addition, their 655
results showed that wasp size affected wasp longevity only in starved females. 656
The results of our work allow us to expand the conclusions of Rivero and West to the 657
whole life cycle of a parasitoid species and to both growth and reproduction. With respect to 658
growth, the results of our model show that there is a positive relationship between the amount 659
of food ingested during the early stages of the parasitoid development and the wasp length at 660
emergence. If parasitoids eat more during the embryo and larval stages, they also grow bigger 661
(see Fig. 6, top right panel), confirming some results of an earlier study by Harvey et al. 662
(1994). We have run the model for different ingestion levels, ranging from 6.23 to 7 mg 663
across the lifetime. Below the lower ingestion level, parasitoids do not ingest enough food 664
during larval stage to store sufficient energy to survive the pupation period. Female V. 665
canscens sometimes oviposit in 2nd instar hosts of P. interpunctella, hosts which present a 666
maximum dry weight around 4.90 mg (or approximately 70% of the weight of the host instar 667

ANA L LLANDRES ET AL.
30
5th as reported in Harvey et al. 1994). If they do this, larvae are known to then delay their 668
development, allowing the parasitoid larva to wait until the host grows bigger to ingest more 669
food to complete its development. It is thus possible that the parasitoid larva "waits" until the 670
host weighs approximately 6.23 mg to complete its development successfully. In addition, 671
given that longevity is linked to size in several parasitoid species (Harvey et al. 1994, Rivero 672
and West 2002), these results also have potential implications on parasitoid survival, as we 673
could expect that larger parasitoids will also live longer. Indeed, similar to the results of 674
Rivero and West (2002), we find that wasp size affected wasp longevity in the absence of 675
food after emergence (see Fig. 6, bottom left panel). This only holds, however, under food 676
deprivation conditions. We cannot extend this result to situations with food, as the model, by 677
construction, assumed that wasps can ingest as much as they need to cover maintenance costs 678
in the presence of food. 679
With respect to reproduction, the results of our model show that there is a positive 680
relationship between the amount of food ingested during the early stages of the parasitoid 681
development and the number of eggs produced by the imago (Fig. 6, bottom right panel). 682
Below a given threshold, wasps emerge with very little energy in the reserve; not enough of 683
that energy is mobilized to pay maintenance costs to survive the first day after emergence. 684
Under this scenario, wasps then use also part of the energy stored in the reproduction buffer to 685
live. This is valid only on the first day after emergence. Wasps have enough energy to pay 686
maintenance by the second day, because we assumed that wasps take as much food as they 687
need to cover maintenance costs. Above the threshold, wasps mobilize enough energy from 688
the reserve to cover maintenance costs on the first day after emergence and also to refill the 689
reproduction buffer, and hence to build more eggs. This explains the change of slope between 690
number of matured eggs and food ingested from the threshold onwards. 691

ANA L LLANDRES ET AL.
31
To summarize these analyses, our mechanistic model provided a framework for 692
interpreting the underlying processes, i.e. energy fluxes, driving patterns shown in real data 693
for V. canescens parasitoids. In particular, the model enabled us to distinguish and follow the 694
energy invested in eggs through capital and income reserves. The predictions show that 695
feeding wasps produce almost twice as many eggs as non-feeding wasps by incorporating 696
income resources and living longer. Our results also show that the energy stores with which 697
imagoes emerge are heavily affected by how the energy is stored and used in earlier stages, 698
implying that capital resources also have direct implications in the life history traits and the 699
fitness of the animal. These results highlight the impact of the energy harvested during earlier 700
stages of the insect’s life on imago performance. Although it has been well recognized that 701
the reserves accumulated during the larval stages partly determine the fitness of animals in 702
holometabolous insects (O'Brien et al. 2000, Rivero et al. 2001, Min et al. 2006, Wessels et al. 703
2010), most of the research on insect energy budgets focuses on the energy dynamics during 704
the imago stage (Rivero and West 2002, Casas et al. 2005, Aluja et al. 2011). As far as we 705
know, our study is unique in providing a complete dynamic energy budget in holometabolous 706
insects, by incorporating all the life stages from embryo to imago. We found that most of the 707
reserve built during the larval stage is used during the pupal stage. The final larval instar 708
harvests around 61 times the energy of a recently hatched larva. Around 90 % of this energy 709
is then used during pupation. Imagoes therefore emerge with only a small percentage, around 710
10%, of the maximal energy stored by the larvae (Fig. 5 bottom left panel). While the exact 711
numbers shown in the figure are specific to V. canescens, the overall dynamics are likely true 712
for most holometabolous insects. Indeed for other parasitoid species, such as Aphidius ervi 713
(Hymenoptera, Braconidae), the imago weight mass is also correlated with the maximum 714
weight attained by the larva (Sequeira and Mackauer 1992). 715
716

ANA L LLANDRES ET AL.
32
Differences between model predictions and observations 717
The model predicted an embryo's weight 4.5 times heavier compared to the weight 718
estimated from real data (see Table 7). While the whole data set used to estimate the 719
parameters of the model was collected under the scenario of the parasitoid developing in P. 720
interpunctella hosts, the data used for the embryo weight were inform individuals developing 721
in Ephestia kuehniellia hosts. This may explain the difference between the model predictions 722
and observations for the weight of the embryo. In addition, the food type of the wasps from 723
which we obtained data of recently laid embryos vs. data on egg production through time 724
differed, i.e. sugar vs. honey, respectively. Given that imago feeding affects egg production in 725
V. canescens, the different feeding conditions may have also affected egg size and thus 726
weight. In addition, the model predictions show an exponential increase of larval growth 727
during the whole larval stage while the data show a different pattern from an exponential 728
increase in weight at the end of the larval phase (for the last three points the growth increase 729
is not exponential, see Fig. 2). The inclusion of the wandering phase within the larval phase 730
could improve the fitting of the model to the real growth trajectories of the larva. During the 731
wandering phase the larva stops feeding, hence, prior to the wandering phase the larva 732
presumably decreases its ingestion rate until it completely stops feeding before entering 733
pupation. This could explain the patterns of growth trajectories shown by the data and not 734
being captured by the model. For the pupa, we do not have a good argument to explain the 735
differences in weight trajectories between observations and predictions (see Fig. 2). The pupa 736
actually gains some weight from the forth data point shown in the graph onwards. The fact 737
that the pupa gains weight is against mass conservation laws as weight gain should not occur 738
if the animal does not consume resources (especially when we talk about dry weight, 739
variations in water content could explain the alterations in wet weight). The weight increase 740
through time in the pupa may thus be an experimental artifact. 741

ANA L LLANDRES ET AL.
33
IMPLICATIONS 742
The formulation of the DEB model for holometabolous insects in general, and for Venturia 743
canescens in particular, provides new opportunities to address questions spanning from life-744
history strategies and climate change responses in insects to food web structure and 745
population dynamics of host-parasitoid systems. We highlight here these developments only 746
cursorily, as some of them will be the focus of dedicated publications. 747
Our model can be applied to species that differ in life-history strategies, with strategies 748
ranging from income breeding to capital breeding (Stearns 1992, Tammaru and Haukioja 749
1996, Jonsson 1997, Casas et al. 2005, Jervis et al. 2007, Jervis et al. 2008, Stephens et al. 750
2009). The choice of breeding strategy can be made by choosing an assimilation rule for the 751
imago stage. The model can be applied to capital breeders that do not feed during the imago 752
stage by setting the assimilation flux during this stage to 0. In this case the investment in egg 753
production can only come from what has been accumulated in the reserves in the previous life 754
stages. For other types of capital breeders that feed during the imago stage but for which there 755
is not contribution of feeding to egg production, the assimilation can be chosen so that the 756
mobilization flux will approximate the maintenance flux. For these species, the mobilized 757
energy pays exclusively the maintenance costs and there will be no surplus of the mobilized 758
energy invested in reproduction. For a mixed capital and income breeding strategy, we can 759
use the same model that we used for Venturia with a higher assimilation flux. These species 760
feed during the imago stage and there is contribution of feeding to egg production: the surplus 761
of energy mobilized that is not used to pay maintenance is invested in reproduction. For 762
income breeders, i.e. species that feed during the imago stage for which there is always 763
contribution of feeding to egg production, the model can be the same. Having different values 764
for the model parameters would however allow us to use a lower ratio between the energy 765

ANA L LLANDRES ET AL.
34
stored in the reserve at imago emergence used for reproduction and the accumulated 766
assimilation flux throughout the imago stage used for reproduction. Thus, the model can be 767
used to compare species that present different life-history strategies. We could for example 768
study the consequences of larval vs. imago nutrition on reproductive traits for species that 769
present different breeding strategies, obtaining thereby insights about the adaptive value of 770
each strategy. The comparisons between insect species can also be done on the basis of DEB 771
parameters values as it has been done in fishes for example (Lika et al. 2014). In addition, 772
given applicability of DEB theory to all animal species, the holometabolous insects can not 773
only be compared to other insects species on the basis of the parameter values but also to non-774
insect species, which will help to discover evolutionary adaptations and patterns (Kooijman 775
2013, Lika et al. In press). 776
While our model assumes a constant environment, real organisms experience fluctuating 777
environments. The DEB formulation can readily be extended to incorporate the consequences 778
of environmental variability (Kearney et al. 2010a, Kearney 2012, Kearney et al. 2013). The 779
temperature dependence of biological rates can be integrated into the model by ensuring that 780
the DEB parameters with time dimensions scale appropriately with temperature. This is 781
commonly achieved by using the Boltzmann-Arrhenius temperature correction factor 782
(Gillooly et al. 2001, Kooijman 2010). A complete model of the lifecycle bioenergetics of the 783
Australian butterfly Heteronympha merope is currently being developed, to understand how 784
its distribution and phenology in Australia is expected to change under future climates 785
(Kearney et al. 2010b, Barton et al. 2014). A mechanistic model of the butterfly’s lifecycle 786
bionenergetics will result in a species distribution model that is more strongly grounded in the 787
underlying eco-physiological processes driving species abundance. DEB models can also 788
readily incorporate the effects of variable food availability (Pecquerie et al. 2009). In the case 789
ANA L LLANDRES ET AL.
35
of Venturia canescens, our model is valid for a range of host sizes. Host size has many 790
impacts on the life history traits of parasitic wasps (Godfray 1994, Vet et al. 1994). 791
The capacity to develop whole-life-cycle models of energetics for holometabolous insects 792
given by our DEB model provides new opportunities to study multi-trophic interactions and 793
food webs. One promising avenue of application is in physiologically structured population 794
dynamics modelling (Gordon et al. 1991). The extensive knowledge of Venturia bioenergetics 795
in the lab and in the field (e. g. Howell and Fisher 1977, Casas et al. 2003, Amat et al. 2012) 796
as well as its use as one of the classical systems of host-parasitoid interactions from the 60's 797
onwards (Takahashi 1959, White and Huffaker 1969), makes this parasitoid species one of the 798
very few for which this task is feasible. 799
ACKNOWLEDGEMENTS 800
We would like to thank E. Desouhant and P. Pelosse for providing us data on Venturia‘s eggs, 801
and two anonymous reviewers for their helpful comments in a previous version of the ms. 802
This work was funded by a Fondation de France post-doctoral fellowship to ALL and JC. It 803
was also partly funded by the Agroeco project of the Region Centre to JC, the CNRS and by a 804
grant to JM from the National Science Centre, Poland within HARMONIA 805
(2012/06/M/NZ/00137).806
ANA L LLANDRES ET AL.
36
LITERATURE CITED 807
Abrams, P. A., and L. Rowe. 1996. The effects of predation on the age and size of maturity of 808
prey. Evolution 50:1052-1061. 809
Aluja, M., A. Birke, L. Guillen, F. Diaz-Fleischer, and D. Nestel. 2011. Coping with an 810
unpredictable and stressful environment: The life history and metabolic response to 811
variable food and host availability in a polyphagous tephritid fly. Journal of Insect 812
Physiology 57:1592-1601. 813
Amat, I., S. Besnard, V. Foray, P. Pelosse, C. Bernstein, and E. Desouhant. 2012. Fuelling 814
flight in a parasitic wasp: which energetic substrate to use? Ecological Entomology 815
37:480-489. 816
Applebaum, S. L., T. C. F. Pan, D. Hedgecock, and D. T. Manahan. 2014. Separating the 817
Nature and Nurture of the Allocation of Energy in Response to Global Change. 818
Integrative and Comparative Biology 54:284-295. 819
Arrese, E. L., and J. L. Soulages. 2010. Insect Fat Body: Energy, Metabolism, and 820
Regulation. Annual Review of Entomology 55:207-225. 821
Barrett, E. L. B., J. Hunt, A. J. Moore, and P. J. Moore. 2009. Separate and combined effects 822
of nutrition during juvenile and sexual development on female life-history trajectories: 823
the thrifty phenotype in a cockroach. Proceedings of the Royal Society B-Biological 824
Sciences 276:3257-3264. 825
Barton, M., P. Sunnucks, M. Norgate, N. Murray, and M. Kearney. 2014. Co-Gradient 826
Variation in Growth Rate and Development Time of a Broadly Distributed Butterfly. 827
PLoS ONE 9. 828
Brown, J. H., J. F. Gillooly, A. P. Allen, V. M. Savage, and G. B. West. 2004. Toward a 829
metabolic theory of ecology. Ecology 85:1771-1789. 830

ANA L LLANDRES ET AL.
37
Casas, J., G. Driessen, N. Mandon, S. Wielaard, E. Desouhant, J. Van Alphen, L. Lapchin, A. 831
Rivero, J. P. Christides, and C. Bernstein. 2003. Energy dynamics in a parasitoid 832
foraging in the wild. Journal of Animal Ecology 72:691-697. 833
Casas, J., S. Pincebourde, N. Mandon, F. Vannier, R. Poujol, and D. Giron. 2005. Lifetime 834
nutrient dynamics reveal simultaneous capital and income breeding in a parasitoid. 835
Ecology 86:545-554. 836
Chapman, R. F., S. J. Simpson, and A. E. Douglas. 2013. The insects: structure and function. 837
4th edition edition. Cambridge University Press, Cambridge, UK. 838
Cheng, H. H. 1972. Oviposition and longevity of dark-sided cutworm, Euxoa messoria 839
(Lepidoptera-noctuidae), in laboratory. Canadian Entomologist 104:919-925. 840
Cover, M. R., and V. H. Resh. 2008. Global diversity of dobsonflies, fishflies, and alderflies 841
(Megaloptera : Insecta) and spongillaflies, nevrorthids, and osmylids (Neuroptera : 842
Insecta) in freshwater. Hydrobiologia 595:409-417. 843
Day, T., and L. Rowe. 2002. Developmental thresholds and the evolution of reaction norms 844
for age and size at life-history transitions. American Naturalist 159:338-350. 845
de Eguileor, M., A. Grimaldi, G. Tettamanti, R. Valvassori, M. G. Leonardi, B. Giordana, E. 846
Tremblay, M. C. Digilio, and F. Pennacchio. 2001. Larval anatomy and structure of 847
absorbing epithelia in the aphid parasitoid Aphidius ervi Haliday (Hymenoptera, 848
Braconidae). Arthropod Structure & Development 30:27-37. 849
Eliopoulos, P. A., J. A. Harvey, C. G. Athanassiou, and G. J. Stathas. 2003. Effect of biotic 850
and abiotic factors on reproductive parameters of the synovigenic endoparasitoid 851
Venturia canescens. Physiological Entomology 28:268-275. 852
Elser, J. J., R. W. Sterner, E. Gorokhova, W. F. Fagan, T. A. Markow, J. B. Cotner, J. F. 853
Harrison, S. E. Hobbie, G. M. Odell, and L. J. Weider. 2000. Biological stoichiometry 854
from genes to ecosystems. Ecology Letters 3:540-550. 855

ANA L LLANDRES ET AL.
38
Fisher, R. C. 1971. Aspects of the physiology of endoparasitic hymenoptera. Biological 856
Reviews 46:243-278. 857
Getz, W. M. 2011. Biomass transformation webs provide a unified approach to consumer-858
resource modelling. Ecology Letters 14:113-124. 859
Gillooly, J. F., J. H. Brown, G. B. West, V. M. Savage, and E. L. Charnov. 2001. Effects of 860
size and temperature on metabolic rate. Science 293:2248-2251. 861
Glaser, R. W. 1923. The effect of food on longevity and reproduction in flies. Journal of 862
Experimental Zoology 38:383-412. 863
Godfray, H. C. J., editor. 1994. Parasitoids: Behavioural and Evolutionary Ecology. 864
Monographs in Behavior and Ecology. Princeton University Press, Princeton, N. J. 865
Gordon, D. M., R. M. Nisbet, A. Deroos, W. S. C. Gurney, and R. K. Stewart. 1991. Discrete 866
generations in host-parasitoid models with contrasting life-cycles. Journal of Animal 867
Ecology 60:295-308. 868
Harvey, J. A., I. F. Harvey, and D. J. Thompson. 1994. Flexible larval growth allows use of a 869
range of host sizes by a parasitoid wasp. Ecology 75:1420-1428. 870
Harvey, J. A., I. F. Harvey, and D. J. Thompson. 2001. Lifetime reproductive success in the 871
solitary endoparasitoid, Venturia canescens. Journal of Insect Behavior 14:573-593. 872
Harvey, J. A., and M. R. Strand. 2002. The developmental strategies of endoparasitoid wasps 873
vary with host feeding ecology. Ecology 83:2439-2451. 874
Heino, M., and V. Kaitala. 1999. Evolution of resource allocation between growth and 875
reproduction in animals with indeterminate growth. Journal of Evolutionary Biology 876
12:423-429. 877
Helm, B. R. 2013. An ontogenetic perspective on the timing of maturation in insects with 878
special consideration of the role of physical and resource thresholds. The University of 879
Arizona, Arizona. 880

ANA L LLANDRES ET AL.
39
Holling, C. S. 1959. Some characteristics of simple types of predation and parasitism. 881
Canadian Entomologist 91:385-398. 882
Honek, A. 1993. Intraspecific variation in body size and fecundity in insects - A general 883
relationship. Oikos 66:483-492. 884
Hoshizaki, D. K., A. G. Gibbs, and N. D. Bond. 2013. Fat body.in R. F. Chapman, S. J. 885
Simpson, and A. E. Douglas, editors. The insects: structure and function. Cambridge 886
University Press, Cambridge. 887
Howell, J., and R. C. Fisher. 1977. Food conversion efficiency of a parasitic wasp, Nemeritis 888
canescens. Ecological Entomology 2:143-151. 889
Humphries, M. M., and K. S. McCann. 2014. Metabolic ecology. Journal of Animal Ecology 890
83:7-19. 891
Jervis, M. A. 2005. Insects as natural enemies: a practical perspective. Kluwer Academic 892
Publishers. 893
Jervis, M. A., C. L. Boggs, and P. N. Ferns. 2005. Egg maturation strategy and its associated 894
trade-offs: a synthesis focusing on Lepidoptera. Ecological Entomology 30:359-375. 895
Jervis, M. A., C. L. Boggs, and P. N. Ferns. 2007. Egg maturation strategy and survival trade-896
offs in holometabolous insects: a comparative approach. Biological Journal of the 897
Linnean Society 90:293-302. 898
Jervis, M. A., J. Ellers, and J. A. Harvey. 2008. Resource acquisition, allocation, and 899
utilization in parasitoid reproductive strategies. Annual Review of Entomology 900
53:361-385. 901
Jervis, M. A., and P. N. Ferns. 2004. The timing of egg maturation in insects: ovigeny index 902
and initial egg load as measures of fitness and of resource allocation. Oikos 107:449-903
460. 904

ANA L LLANDRES ET AL.
40
Jervis, M. A., G. E. Heimpel, P. N. Ferns, J. A. Harvey, and N. A. C. Kidd. 2001. Life-history 905
strategies in parasitoid wasps: a comparative analysis of 'ovigeny'. Journal of Animal 906
Ecology 70:442-458. 907
Joern, A., and S. T. Behmer. 1997. Importance of dietary nitrogen and carbohydrates to 908
survival, growth, and reproduction in adults of the grasshopper Ageneotettix deorum 909
(Orthoptera: Acrididae). Oecologia 112:201-208. 910
Jonsson, K. I. 1997. Capital and income breeding as alternative tactics of resource use in 911
reproduction. Oikos 78:57-66. 912
Kaneko, Y., T. Yasanga, M. Suzuki, and S. Sakurai. 2011. Larval fat body cells die during the 913
early pupal stage in the frame of metamorphosis remodelation in Bombyx mori. 914
Journal of Insect Physiology 57:1715-1722. 915
Kearney, M. 2012. Metabolic theory, life history and the distribution of a terrestrial 916
ectotherm. Functional Ecology 26:167-179. 917
Kearney, M., S. J. Simpson, D. Raubenheimer, and B. Helmuth. 2010a. Modelling the 918
ecological niche from functional traits. Philosophical Transactions of the Royal 919
Society B-Biological Sciences 365:3469-3483. 920
Kearney, M. R., N. J. Briscoe, D. J. Karoly, W. P. Porter, M. Norgate, and P. Sunnucks. 921
2010b. Early emergence in a butterfly causally linked to anthropogenic warming. 922
Biology Letters 6:674-677. 923
Kearney, M. R., S. J. Simpson, D. Raubenheimer, and S. Kooijman. 2013. Balancing heat, 924
water and nutrients under environmental change: a thermodynamic niche framework. 925
Functional Ecology 27:950-965. 926
Kooijman, S. 2013. Waste to hurry: dynamic energy budgets explain the need of wasting to 927
fully exploit blooming resources. Oikos 122:348-357. 928
ANA L LLANDRES ET AL.
41
Kooijman, S., T. Sousa, L. Pecquerie, J. van der Meer, and T. Jager. 2008. From food-929
dependent statistics to metabolic parameters, a practical guide to the use of dynamic 930
energy budget theory. Biological Reviews 83:533-552. 931
Kooijman, S. A. L. M. 2010. Dynamic Energy Budget Theory for Metabolic organisation. 932
Cambridge University Press, Cambridge, UK. 933
Larsen, W. J. 1976. Cell remodelling in the fat body of an insect. Tissue Cell 8:73-92. 934
Lika, K., S. Augustine, L. Pecquerie, and S. Kooijman. 2014. The bijection from data to 935
parameter space with the standard DEB model quantifies the supply-demand spectrum. 936
Journal of Theoretical Biology 354:35-47. 937
Lika, K., M. R. Kearney, V. Freitas, H. W. van der Veer, J. van der Meer, J. W. M. Wijsman, 938
L. Pecquerie, and S. Kooijman. 2011a. The "covariation method" for estimating the 939
parameters of the standard Dynamic Energy Budget model I: Philosophy and 940
approach. Journal of Sea Research 66:270-277. 941
Lika, K., M. R. Kearney, and S. Kooijman. 2011b. The "covariation method" for estimating 942
the parameters of the standard Dynamic Energy Budget model II: Properties and 943
preliminary patterns. Journal of Sea Research 66:278-288. 944
Lika, K., S. A. L. M. Kooijman, and N. Papandroulakis. In press. Metabolic acceleration in 945
Mediterranean Perciformes. Journal of Sea Research. 946
Maino, J. L., and M. R. Kearney. 2014. Ontogenetic and interespecific metabolic scaling in 947
insects. American Naturalist 184: 695-701. 948
Maino, J. L., M. R. Kearney, R. M. Nisbet, and S. Kooijman. 2014. Reconciling theories for 949
metabolic scaling. Journal of Animal Ecology 83:20-29. 950
Mane-Padros, D., J. Cruz, L. Vilaplana, C. Nieva, E. Urena, X. Belles, and D. Martin. 2010. 951
The hormonal pathway controlling cell death during metamorphosis in a 952
hemimetabolous insect. Developmental Biology 346:150-160. 953

ANA L LLANDRES ET AL.
42
Mathavan, S., G. Santhi, and B. N. Sethuraman. 1987. Effects of feeding regime on energy 954
allocation to reproduction in the silkworm Bombyx mori Proceedings of the Indian 955
Academy of Sciences-Animal Sciences 96:333-340. 956
Merkey, A. B., C. K. Wong, D. K. Hoshizaki, and A. G. Gibbs. 2011. Energetics of 957
metamorphosis in Drosophila melanogaster. Journal of Insect Physiology 57:1437-958
1445. 959
Min, K. J., M. F. Hogan, M. Tatar, and D. M. O'Brien. 2006. Resource allocation to 960
reproduction and soma in Drosophila: A stable isotope analysis of carbon from dietary 961
sugar. Journal of Insect Physiology 52:763-770. 962
Nelliot, A., N. Bond, and D. K. Hoshizaki. 2006. Fat-body remodeling in Drosophila 963
melanogaster. Genesis 44:396-400. 964
Nisbet, R. M., M. Jusup, T. Klanjscek, and L. Pecquerie. 2012. Integrating dynamic energy 965
budget (DEB) theory with traditional bioenergetic models. Journal of Experimental 966
Biology 215:892-902. 967
Nylin, S., and K. Gotthard. 1998. Plasticity in life-history traits. Annual Review of 968
Entomology 43:63-83. 969
O'Brien, D. M., D. P. Schrag, and C. M. del Rio. 2000. Allocation to reproduction in a 970
hawkmoth: A quantitative analysis using stable carbon isotopes. Ecology 81:2822-971
2831. 972
Ohbayashi, T., K. Iwabuchi, and J. Mitsuhashi. 1994. In-vitro rearing of a larval 973
endoparasitoid, Venturia canescens (Gravenhorst) (Hymenoptera, Ichneumonidae). 1. 974
Embryonic development. Applied Entomology and Zoology 29:123-126. 975
Pecquerie, L., P. Petitgas, and S. Kooijman. 2009. Modeling fish growth and reproduction in 976
the context of the Dynamic Energy Budget theory to predict environmental impact on 977
anchovy spawning duration. Journal of Sea Research 62:93-105. 978

ANA L LLANDRES ET AL.
43
Raubenheimer, D., S. J. Simpson, and A. H. Tait. 2012. Match and mismatch: conservation 979
physiology, nutritional ecology and the timescales of biological adaptation. 980
Philosophical Transactions of the Royal Society B-Biological Sciences 367:1628-981
1646. 982
Rivero, A., D. Giron, and J. Casas. 2001. Lifetime allocation of juvenile and adult nutritional 983
resources to egg production in a holometabolous insect. Proceedings of the Royal 984
Society B-Biological Sciences 268:1231-1237. 985
Rivero, A., and S. A. West. 2002. The physiological costs of being small in a parasitic wasp. 986
Evolutionary Ecology Research 4:407-420. 987
Roberts, H. L. S., and O. Schmidt. 2004. Lifetime egg maturation by host-deprived Venturia 988
canescens. Journal of Insect Physiology 50:195-202. 989
Roff, D. A. 2002. Life history evolution. Sunderland, MA. Sinauer Associates. 990
Rosenheim, J. A., S. J. Jepsen, C. E. Matthews, D. S. Smith, and M. R. Rosenheim. 2008. 991
Time limitation, egg limitation, the cost of oviposition, and lifetime reproduction by an 992
insect in nature. American Naturalist 172:486-496. 993
Rowe, L., and D. Ludwig. 1991. Size and Timing of Metamorphosis in Complex Life-Cycles 994
- Time Constraints and Variation. Ecology 72:413-427. 995
Salt, G. 1976. Hosts of Nemeretis canescens, a problem in host specificity of insect 996
parasitoids. Ecological Entomology 1:63-67. 997
Sequeira, R., and M. Mackauer. 1992. Nutritional ecology of an insect host parasitoid 998
association - The pea aphid Aphidius ervi system. Ecology 73:183-189. 999
Sibly, R. M., and P. Calow. 1986. Physiological Ecology of Animals: An Evolutionary 1000
Approach. Blackwell Scientific Publications, Oxford. 1001

ANA L LLANDRES ET AL.
44
Simpson, S. J., and D. Raubenheimer, editors. 2012. The nature of nutrition: an unifying 1002
framework from animal adaptation to human obesity. Princeton University Press, 1003
Princeton, New Jersey. 1004
Spanoudis, C. G., and S. S. Andreadis. 2012. Temperature-dependent survival, development, 1005
and adult longevity of the koinobiont endoparasitoid Venturia canescens 1006
(Hymenoptera: Ichneumonidae) parasitizing Plodia interpunctella (Lepidoptera: 1007
Pyralidae). Journal of Pest Science 85:75-80. 1008
Sperfeld, E., F. J. Clissold, H. M. Halvorson, M. Malishev, and N. D. Wagner. In press. 1009
Opening the black box of nutritional ecology: Scaling animals to ecosystems using 1010
Nutritional Geometry and Ecological Stoichiometry. Oikos. 1011
Stearns, S. C. 1992. The evolution of life histories. Oxford University Press, New York. 1012
Stephens, P. A., I. L. Boyd, J. M. McNamara, and A. I. Houston. 2009. Capital breeding and 1013
income breeding: their meaning, measurement, and worth. Ecology 90:2057-2067. 1014
Stevens, D. J., M. H. Hansell, and P. Monaghan. 2000. Developmental trade-offs and life 1015
histories: strategic allocation of resources in caddis flies. Proceedings of the Royal 1016
Society B-Biological Sciences 267:1511-1515. 1017
Suzuki, Y., T. Koyama, K. Hiruma, L. M. Riddiford, and J. W. Truman. 2013. A molt timer is 1018
involved in the metamorphic molt in Manduca sexta larvae. Proceedings of the 1019
National Academy of Sciences of the United States of America 110:12518-12525. 1020
Taborsky, B. 2006. The influence of juvenile and adult environments on life-history 1021
trajectories. Proceedings of the Royal Society B-Biological Sciences 273:741-750. 1022
Takahashi, F. 1959. The effect of host-finding efficiency of parasites on the cyclic 1023
fluctuations of populations in the interacting system of Ephestia and Nemeretis. 1024
Japanese Journal of Ecology 9:88-93. 1025
ANA L LLANDRES ET AL.
45
Tammaru, T., and E. Haukioja. 1996. Capital breeders and income breeders among 1026
Lepidoptera - Consequences to population dynamics. Oikos 77:561-564. 1027
Tomlinson, S., S. G. Arnall, A. Munn, S. D. Bradshaw, S. K. Maloney, K. W. Dixon, and R. 1028
K. Didham. 2014. Applications and implications of ecological energetics. Trends in 1029
Ecology & Evolution 29:280-290. 1030
Vet, L. E. M., A. Datema, A. Janssen, and H. Snellen. 1994. Clutch size in a larval pupal 1031
endoparasitoid - Consequences for fitness. Journal of Animal Ecology 63:807-815. 1032
Wald, G. 1981. Metamorphosis: an overview. Pages 1-39 in L. I. Gilbert and E. Frieden, 1033
editors. Metamorphosis: a problem in developmental biology. Plenum, New York. 1034
Wessels, F. J., D. C. Jordan, and D. A. Hahn. 2010. Allocation from capital and income 1035
sources to reproduction shift from first to second clutch in the flesh fly, Sarcophaga 1036
crassipalpis. Journal of Insect Physiology 56:1269-1274. 1037
White, E. G., and C. B. Huffaker. 1969. Regulatory processes and population cyclicity in 1038
laboratory populations of Anagasta kiihniella (Zeller) (Lepidoptera: Phycitidae). II. 1039
Parasitism, predation, competition and protecting cover. Researches on population 1040
ecology 11:150-185. 1041
Wissinger, S., J. Steinmetz, J. S. Alexander, and W. Brown. 2004. Larval cannibalism, time 1042
constraints, and adult fitness in caddisflies that inhabit temporary wetlands. Oecologia 1043
138:39-47. 1044
1045
1046
1047

ANA L LLANDRES ET AL.
46
TABLE 1. Energy fluxes linked to different metabolic processes present in the standard DEB 1048
model. The standard DEB model identifies three stage transitions with fundamental changes 1049
in the energy budget: embryo (em), juvenile (juv) and adult (adl). [ ]E represents energy 1050
density ( [ ] VEE /= , J·cm-3). f is the feeding functional response which can vary between 0 1051
and 1. 3/2V is the biosurface of the animal. For the units and meaning of the DEB parameters, 1052
see Table 3. 1053
Metabolic process Energy flux Life Stage
Assimilation { } 3/2fVp AmA p&& = juv, adl
Mobilization [ ] [ ][ ] [ ]G
SGC
EEpVEEp
++
=κυ &&
&3/1/
emb, juv,
adl
Somatic maintenance [ ] { } 3/2Vppp TMTMS pVp &&&&& +=+= emb, juv,
adl
Growth TMCSCG pppppp &&&&&& −−=−= κκ emb, juv,
adl
Maturity maintenance HJJ Ekp && = emb, juv,
adl
Maturation JCR ppp &&& −−= )1( κ emb, juv
Reproduction JCR ppp &&& −−= )1( κ adl
1054
1055
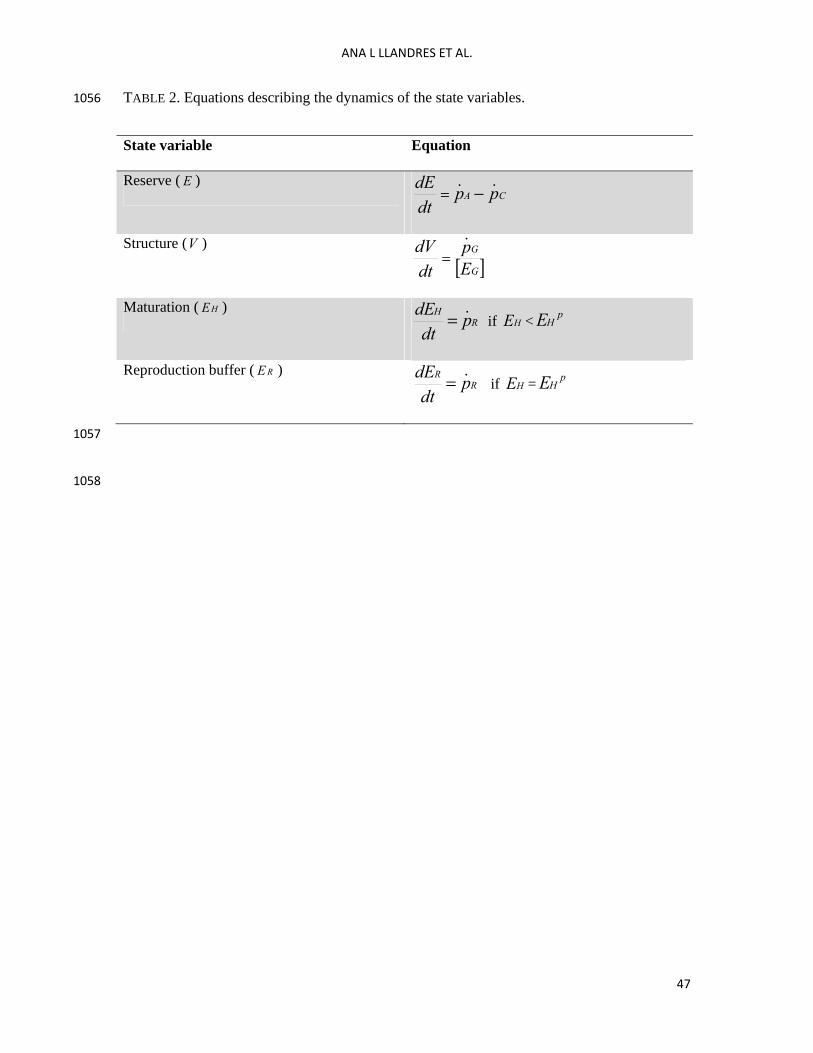
ANA L LLANDRES ET AL.
47
TABLE 2. Equations describing the dynamics of the state variables. 1056
State variable Equation
Reserve ( E ) CA pp
dtdE && −=
Structure (V )
[ ]G
G
Ep
dtdV &
=
Maturation ( HE ) R
H pdt
dE &= if HE < pHE
Reproduction buffer ( RE ) R
R pdt
dE &= if HE = pHE
1057
1058
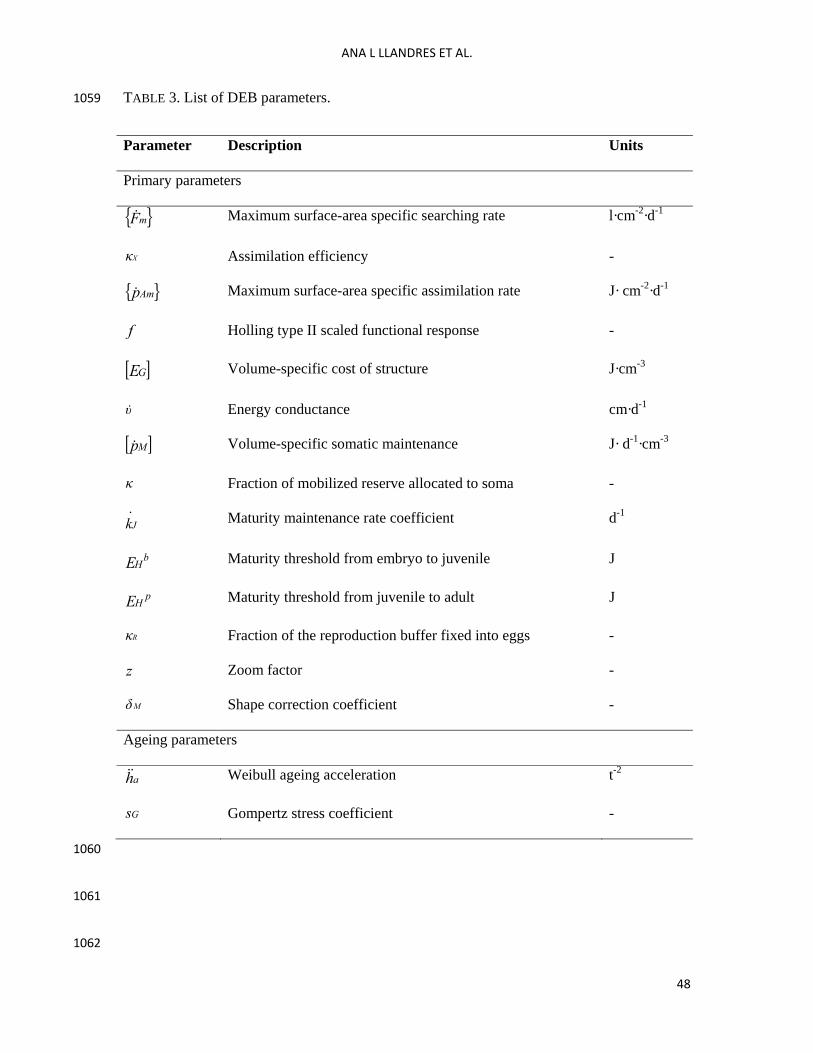
ANA L LLANDRES ET AL.
48
TABLE 3. List of DEB parameters. 1059
Parameter Description Units
Primary parameters
{ }mF& Maximum surface-area specific searching rate l·cm-2·d-1
Xκ Assimilation efficiency -
{ }Amp& Maximum surface-area specific assimilation rate J· cm-2·d-1
f Holling type II scaled functional response -
[ ]GE Volume-specific cost of structure J·cm-3
υ& Energy conductance cm·d-1
[ ]Mp& Volume-specific somatic maintenance J· d-1·cm-3
κ Fraction of mobilized reserve allocated to soma -
Jk& Maturity maintenance rate coefficient d-1
bHE Maturity threshold from embryo to juvenile J
pHE Maturity threshold from juvenile to adult J
Rκ Fraction of the reproduction buffer fixed into eggs -
z Zoom factor -
Mδ Shape correction coefficient -
Ageing parameters
ah&& Weibull ageing acceleration t-2
Gs Gompertz stress coefficient -
1060
1061
1062

ANA L LLANDRES ET AL.
49
TABLE 4. Energy fluxes associated to different metabolic processes modeled for a 1063
holometabolous insect. The energy fluxes for the embryo stage are the same as those 1064
described for the standard DEB model excluding assimilation and reproduction (see Table 1). 1065
In the pupal stage lV refers to larval structure. 1066
Metabolic process Energy flux
Larval stage
Assimilation [ ] fVpp AmA && =
Mobilization [ ] [ ][ ] [ ]G
SEGC EE
pEEp k+
+=
κ&
&&
Somatic maintenance [ ]VMMS ppp &&& ==
Growth MCSCG ppppp &&&&& −=−= κκ
Maturity maintenance bHJJ Ekp && =
Reproduction JCR ppp &&& −−= )1( κ
Pupal stage
Transformation of larval structure EllL kp V && =
Mobilization of E [ ] [ ][ ] [ ]G
SjGC
EEpEEp V
++
=κυ &
&& 3/1/
Somatic maintenance [ ]VMMS ppp &&& ==
Growth MCSCG ppppp &&&&& −=−= κκ
Maturity maintenance HJJ Ekp && =
Maturation JCR ppp &&& −−= )1( κ
Mobilization of RE REC Ekp && =2

ANA L LLANDRES ET AL.
50
Reproduction overhead 2)1( CRRO pp && κ−=
Egg flux ROCR ppp &&& −= 22
Imago stage
Assimilation JSA ppp &&& +=
Mobilization of E Ekp EC&& =
Somatic maintenance [ ]VMMS ppp &&& ==
Maturity maintenance eHJJ Ekp && =
Reproduction JSCR pppp &&&& −−=
Mobilization of RE REC Ekp && =2
Reproduction overhead 2)1( CRRO pp && κ−=
Egg flux ROCR ppp &&& −= 22
1067
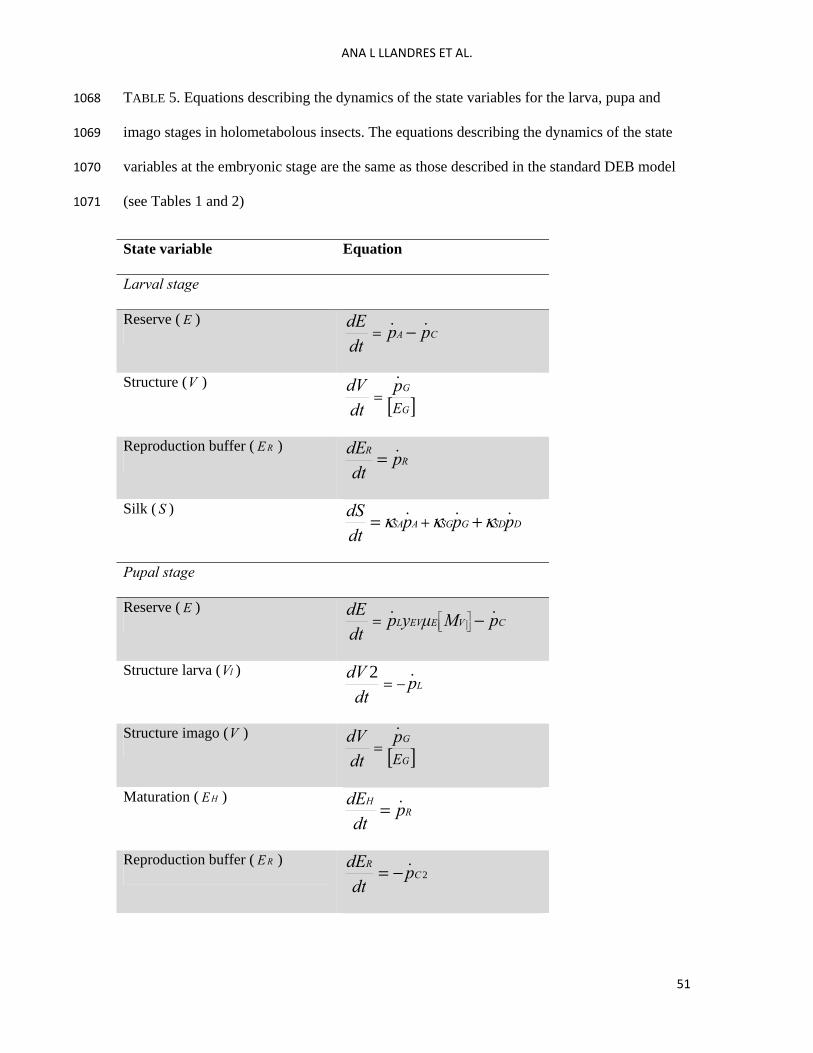
ANA L LLANDRES ET AL.
51
TABLE 5. Equations describing the dynamics of the state variables for the larva, pupa and 1068
imago stages in holometabolous insects. The equations describing the dynamics of the state 1069
variables at the embryonic stage are the same as those described in the standard DEB model 1070
(see Tables 1 and 2) 1071
State variable Equation
Larval stage
Reserve ( E ) CA pp
dtdE && −=
Structure (V )
[ ]G
G
Ep
dtdV &
=
Reproduction buffer ( RE ) R
R pdt
dE &=
Silk ( S ) DSDGSGASA ppp
dtdS &&& κκκ += +
Pupal stage
Reserve ( E ) CVEEVL pMμyp
dtdE && −⎥⎦⎤⎢⎣
⎡=
Structure larva ( lV ) Lp
dtdV &−=
2
Structure imago (V )
[ ]G
G
Ep
dtdV &
=
Maturation ( HE ) R
H pdt
dE &=
Reproduction buffer ( RE ) 2C
R pdt
dE &−=
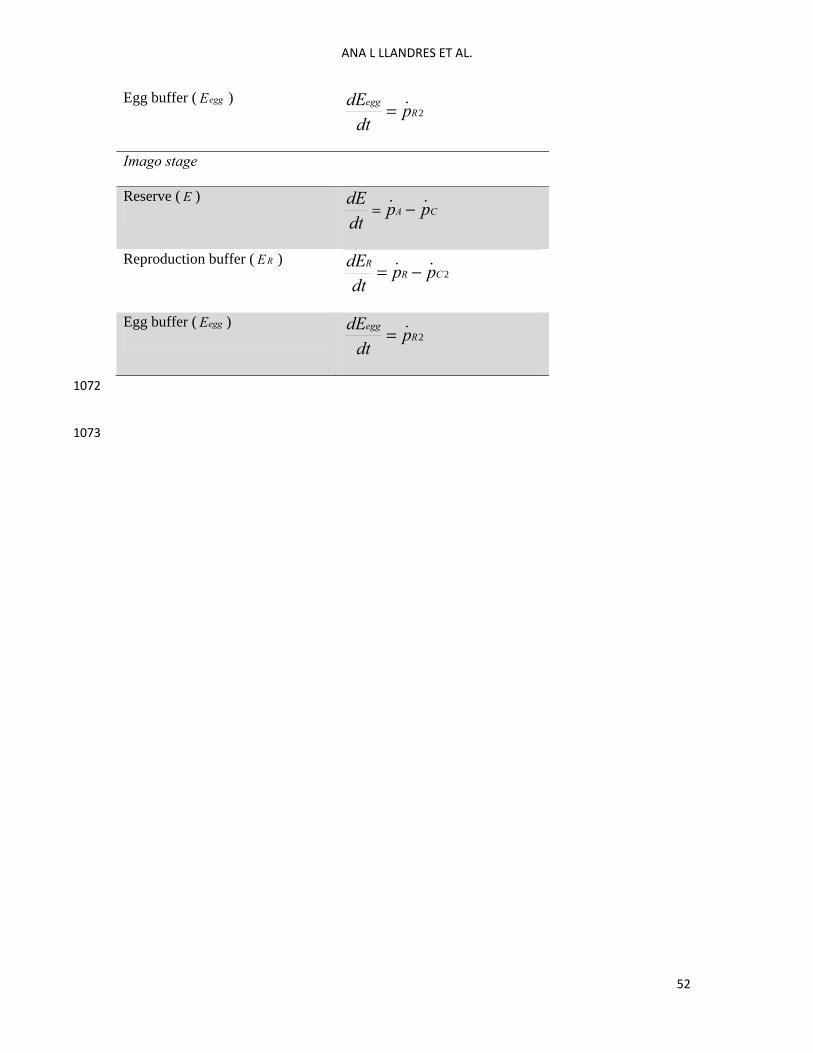
ANA L LLANDRES ET AL.
52
Egg buffer ( eggE ) 2R
egg pdt
dE &=
Imago stage
Reserve ( E ) CA pp
dtdE && −=
Reproduction buffer ( RE ) 2CR
R ppdt
dE && −=
Egg buffer ( eggE ) 2R
egg pdt
dE &=
1072
1073
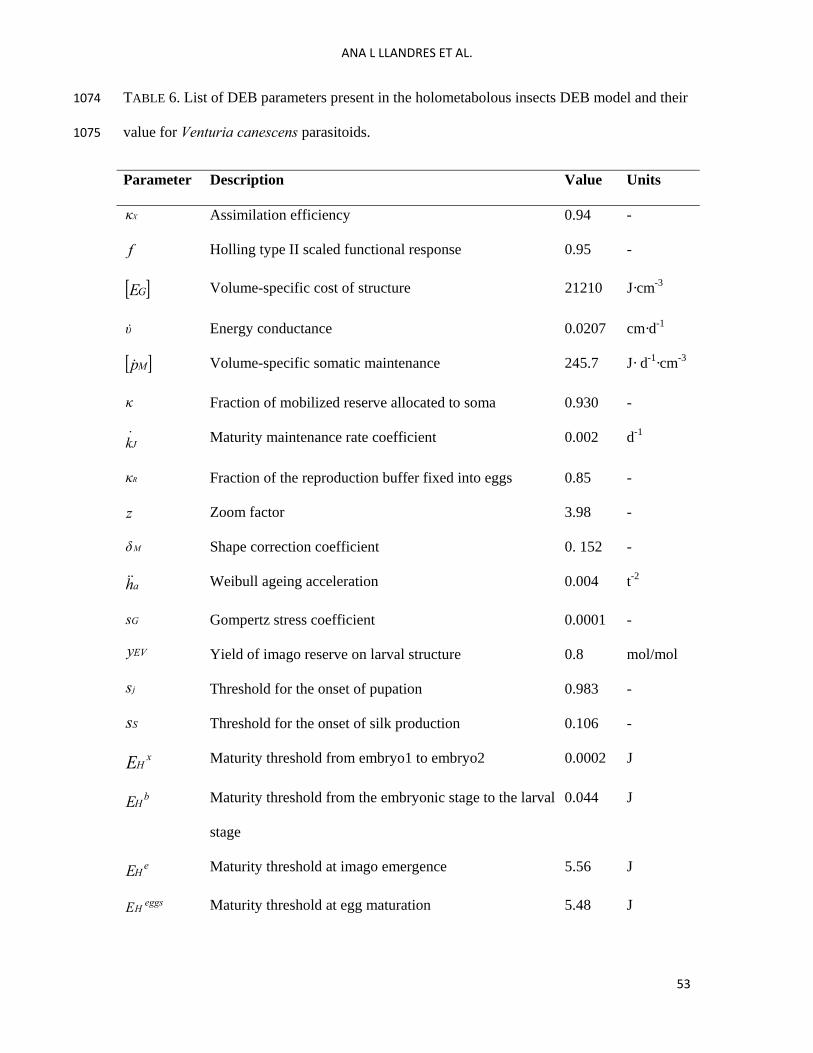
ANA L LLANDRES ET AL.
53
TABLE 6. List of DEB parameters present in the holometabolous insects DEB model and their 1074
value for Venturia canescens parasitoids. 1075
Parameter Description Value Units
Xκ Assimilation efficiency 0.94 -
f Holling type II scaled functional response 0.95 -
[ ]GE Volume-specific cost of structure 21210 J·cm-3
υ& Energy conductance 0.0207 cm·d-1
[ ]Mp& Volume-specific somatic maintenance 245.7 J· d-1·cm-3
κ Fraction of mobilized reserve allocated to soma 0.930 -
Jk& Maturity maintenance rate coefficient 0.002 d-1
Rκ Fraction of the reproduction buffer fixed into eggs 0.85 -
z Zoom factor 3.98 -
Mδ Shape correction coefficient 0. 152 -
ah&& Weibull ageing acceleration 0.004 t-2
Gs Gompertz stress coefficient 0.0001 -
EVy Yield of imago reserve on larval structure 0.8 mol/mol
js Threshold for the onset of pupation 0.983 -
Ss Threshold for the onset of silk production 0.106 -
xHE Maturity threshold from embryo1 to embryo2 0.0002 J
bHE Maturity threshold from the embryonic stage to the larval
stage
0.044 J
eHE Maturity threshold at imago emergence 5.56 J
eggsHE Maturity threshold at egg maturation 5.48 J

ANA L LLANDRES ET AL.
54
Ek& Reserve and reproduction buffer turnover of the imago 0.291 d-1
SAκ Weight coefficient from assimilation to silk production 0.03 -
SGκ Weight coefficient from growth to silk production 0.5 -
SDκ Weight coefficient from dissipation to silk production 0.94 -
1076

ANA L LLANDRES ET AL.
55
TABLE 7. Comparison of the model predictions to observations. 1077
Symbol Description Data Model
Prediction
Units Source
ba Age at larval hatching 4 3.9 d Harvey et al.
(1994)
ja Age at pupation 10 9.5 d Harvey et al.
(1994)
ea Age at imago
emergence
21.53 16 d Harvey et al.
(1994)
ma Imago lifespan 36.5 35.88 d Harvey et al.
(1994)
embW Dry weight of a
recently laid egg
1.87 10-7 8.5 10-7 g Ohbayashi et al.
(1994)
bW Dry weight at larval
hatching
6.9 10-5 6.4 10-5 g Harvey et al.
(1994)
jW Dry weight at pupation 4.77 10-3 4.82 10-3 g Harvey et al.
(1994)
eW Dry weight at
emergence
1.75 10-3 1.00 10-3 g Harvey et al.
(1994)
SW Weight cocoon
shell/weight pupa
0.19 0.18 - Howell and Fisher
(1977)
eN Matured eggs at
emergence
40.20 48.08 eggs Harvey et al.
(2001)
1078
1079

ANA L LLANDRES ET AL.
56
1080
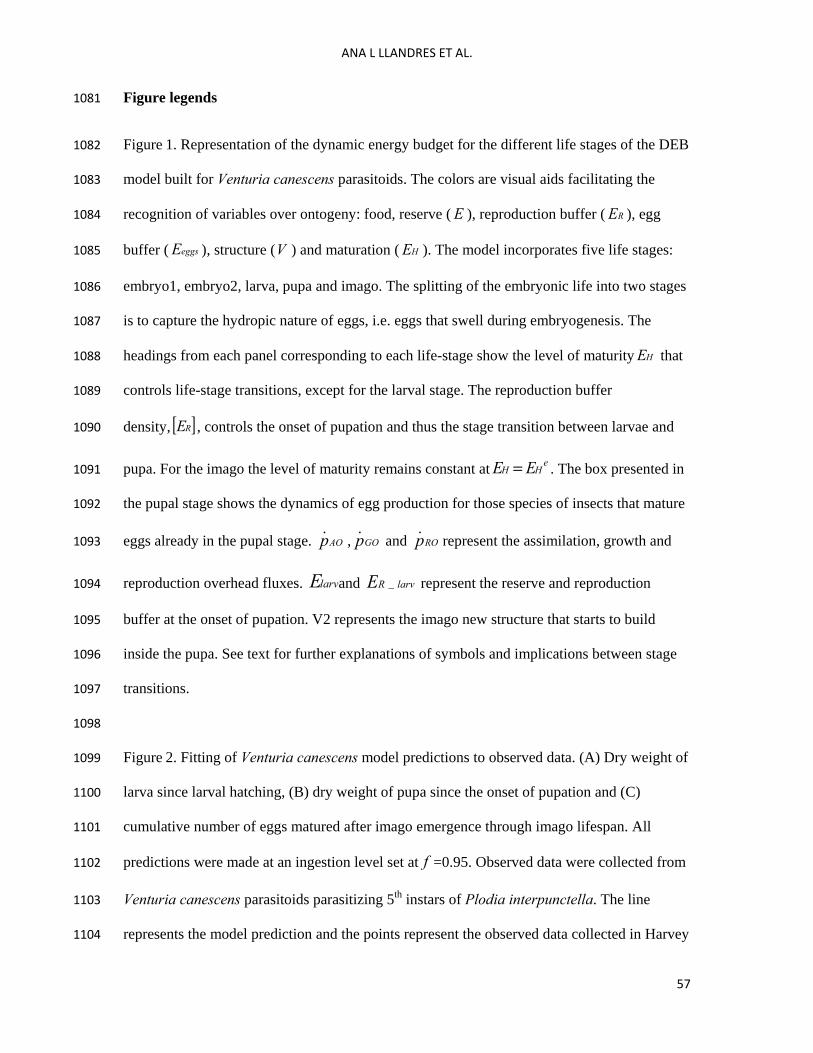
ANA L LLANDRES ET AL.
57
Figure legends 1081
Figure 1. Representation of the dynamic energy budget for the different life stages of the DEB 1082
model built for Venturia canescens parasitoids. The colors are visual aids facilitating the 1083
recognition of variables over ontogeny: food, reserve ( E ), reproduction buffer ( RE ), egg 1084
buffer ( eggsE ), structure (V ) and maturation ( HE ). The model incorporates five life stages: 1085
embryo1, embryo2, larva, pupa and imago. The splitting of the embryonic life into two stages 1086
is to capture the hydropic nature of eggs, i.e. eggs that swell during embryogenesis. The 1087
headings from each panel corresponding to each life-stage show the level of maturity HE that 1088
controls life-stage transitions, except for the larval stage. The reproduction buffer 1089
density, [ ]RE , controls the onset of pupation and thus the stage transition between larvae and 1090
pupa. For the imago the level of maturity remains constant at eHH EE = . The box presented in 1091
the pupal stage shows the dynamics of egg production for those species of insects that mature 1092
eggs already in the pupal stage. AOp& , GOp& and ROp& represent the assimilation, growth and 1093
reproduction overhead fluxes. larvE and larvRE _ represent the reserve and reproduction 1094
buffer at the onset of pupation. V2 represents the imago new structure that starts to build 1095
inside the pupa. See text for further explanations of symbols and implications between stage 1096
transitions. 1097
1098
Figure 2. Fitting of Venturia canescens model predictions to observed data. (A) Dry weight of 1099
larva since larval hatching, (B) dry weight of pupa since the onset of pupation and (C) 1100
cumulative number of eggs matured after imago emergence through imago lifespan. All 1101
predictions were made at an ingestion level set at f =0.95. Observed data were collected from 1102
Venturia canescens parasitoids parasitizing 5th instars of Plodia interpunctella. The line 1103
represents the model prediction and the points represent the observed data collected in Harvey 1104

ANA L LLANDRES ET AL.
58
et al. (1994, 2001). Note that in (A) and (B) the time is scaled between 0 and 1, 0 being the 1105
start of the larval/pupal phase and 1 being the end of the larval/pupal phase in each subpanel. 1106
The scaled value t = 1 corresponds to 6 and 5.62 days for the observed and predicted larval 1107
developmental times, respectively; and to 9 and 6.43 days for the observed and predicted 1108
pupal developmental times, respectively. 1109
1110
Figure 3. Comparison between observed (black points) and predicted (grey points) dry weight 1111
of V. cancescens. The points represent the weight of the larva at the end of the larval period 1112
and the weight of the imago at emergence. Predictions were made at an ingestion level set 1113
at f =1, i.e. assuming that the parasitoid develops on Ephestia host (see text for further 1114
explanation). Error bars represent standard errors. Observed data are reported in Howell and 1115
Fisher (1977). 1116
1117
Figure 4. Comparison between observed (empty circles) and predicted (full circles) 1118
developmental times of Venturia canescens parasitoids developing at different temperatures 1119
in 5th instars of Plodia interpunctella host. The different subpanels show the developmental 1120
times A) from egg to pupation, B) from pupation to emergence and C) from emergence to 1121
death. Error bars represent standard errors. Empty circles represent the observed data reported 1122
in Spanoudis & Andreadis (2012). Grey triangles represent the observed data reported in 1123
Harvey et al. (1994) and used to estimate the parameters of the model. 1124
1125
Figure 5. Dynamics of the DEB state variables from for Venturia canescens parasitoids. The 1126
dashed lines represent the duration of the embryo, larval, pupa and imago stage. In the top left 1127
panel, the black line represents the dynamics of the structure of the embryo and the larvae; the 1128
blue line represents the dynamics of the imago structure. In the bottom right panel, the red 1129

ANA L LLANDRES ET AL.
59
line represents the dynamics of the reproduction buffer; the blue line represents the joules 1130
stored in the egg buffer. The sudden dip in the reproduction buffer before imago eclosion is 1131
due to the production of eggs, which drains the reproduction buffer during the pupal stage. 1132
The reproduction buffer is replenished once the imago starts feeding but continue to decrease 1133
because the input (energy coming from the reserve) is lower than the output (energy taken 1134
from the reproduction buffer to mature eggs). 1135
1136
Figure 6. Effect of capital and income reserves on Venturia canescens parasitoid’s fitness and 1137
life history traits. The top left panel shows the predicted number of eggs matured after imago 1138
emergence for feeding (straight line) and starving (grey line) females until day 4 after imago 1139
emergence, the time of death under starving conditions. The ingesta during the embryo and 1140
larval stages is 95.0=f . The grey area between the black and the grey line corresponds to the 1141
cumulated number of eggs that result from the incorporation of income resources through 1142
feeding. The top right panel shows the relationship between the total amount of food ingested 1143
at the end of the larval period and the size of the wasp. The bottom left panel shows the 1144
relationship between longevity and size of the wasp under starving conditions, from 1145
emergence onwards. Longevity is defined as the time at which the maintenance cost to 1146
survive one day equals the total amount of energy stored in both the reserve and the 1147
reproduction buffer. The bottom right panel shows the total number of eggs matured at the 1148
end of the female life as function of amount of food ingested at the end of the larval period. 1149
1150

ANA L LLANDRES ET AL.
60
F igure 1 1151
1152
1153
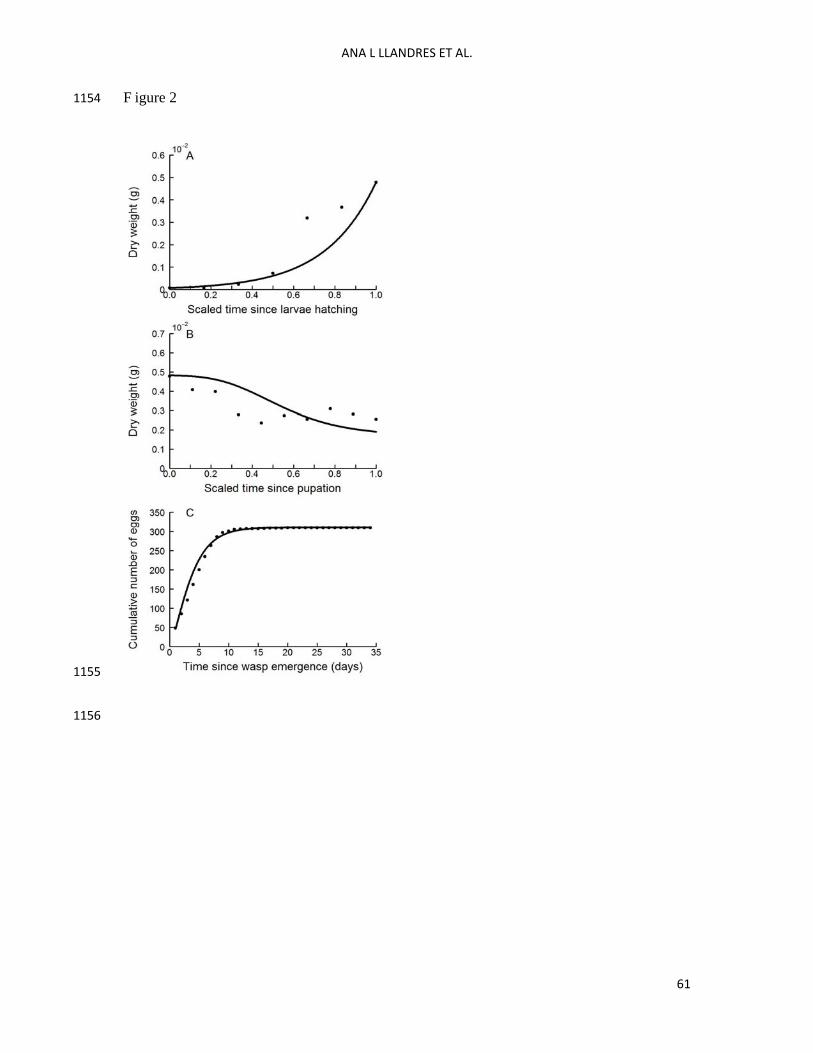
ANA L LLANDRES ET AL.
61
F igure 2 1154
1155
1156

ANA L LLANDRES ET AL.
62
F igure 3 1157
1158
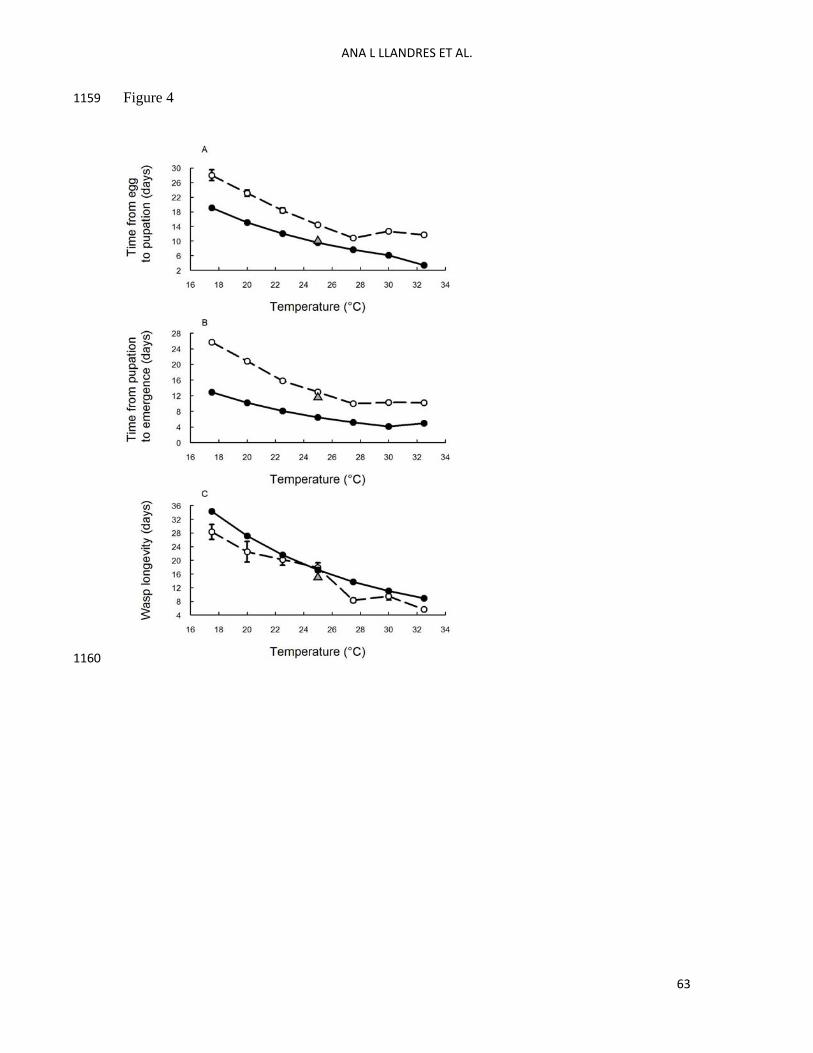
ANA L LLANDRES ET AL.
63
Figure 4 1159
1160

ANA L LLANDRES ET AL.
64
F igure 5 1161
1162
1163
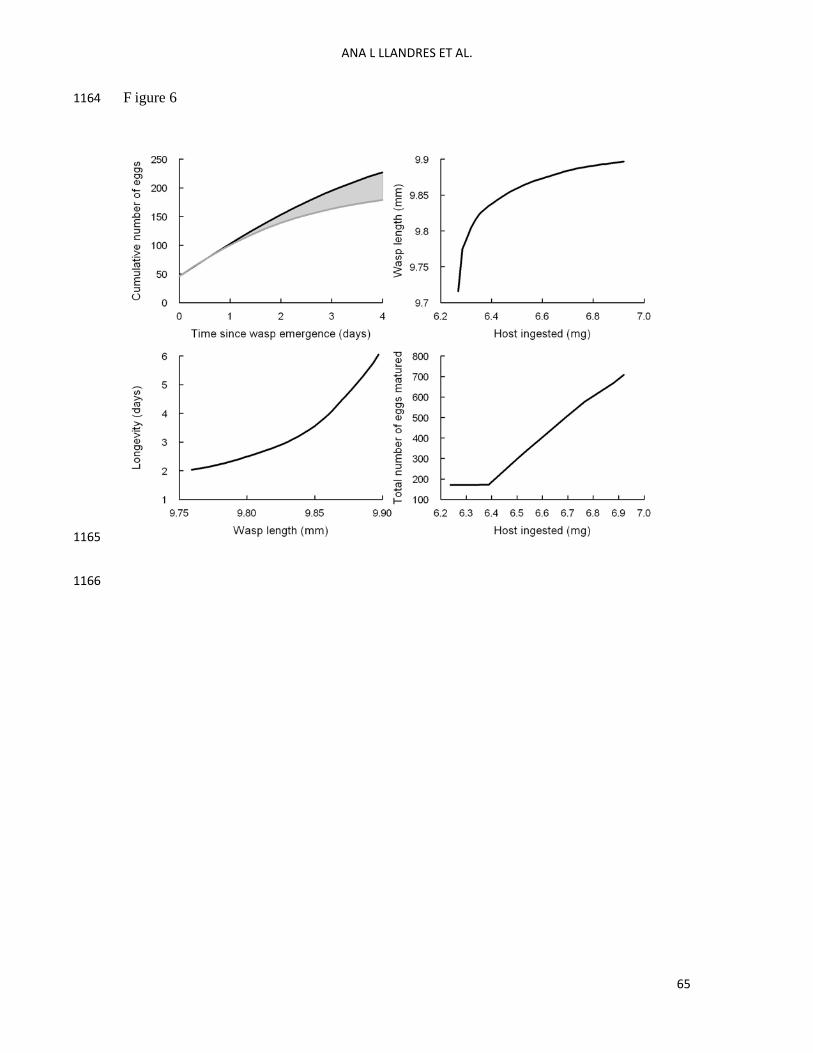
ANA L LLANDRES ET AL.
65
F igure 6 1164
1165
1166

ANA L LLANDRES ET AL.
66
SUPPLEMENTAL MATERIAL 1167
Appendix 1. Representation of the dynamic energy budget for the standard DEB model. 1168
1169
Appendix 2. Explanation to get the threshold for pupation and the associated parameters. 1170
1171
Supplement 1. MATLAB codes for the DEB model for holometabolous insects. Script 1. 1172
Supplement 2. MATLAB codes for the DEB model for holometabolous insects. Script 2. 1173
1174
1175

Appendix 1. Representation of the dynamic energy budget for the standard DEB model.
For embryos and juveniles a fixed proportion ( κ1 ) of the mobilization flux is
allocated to maturity maintenance and to maturation. For adults the same proportion is
allocated to reproduction. The reproduction overhead is the proportion of energy from
the reproduction flux that is used for egg production in the adult stage.

1
Appendix 2. Explanation to get the threshold for pupation and the associated parameters. 1
The threshold for pupation is mRjj
R EsE 2
with: 3
ME
MEm
mR
kgk
kkgEκE
)1( (equation 1) 4
where: 5
- Am
mp
E (J/cm3) is the reserve capacity and represents the ratio of assimilation and 6
mobilization fluxes. 7
- mG
E
Eg
(-) is the energy investment ratio and stands for the cost of new biovolume 8
relative to the maximum potentially available energy for growth plus maintenance. 9
- Ek (d-1) relates to the energy conductance of the embryo as bE Lk / 10
- Mk (d-1) is the somatic maintenance rate coefficient and expresses the maintenance cost 11
relative to the cost of structure GM
ME
pk
. 12
In this appendix we present the computation of mRE 13
In DEB theory (Kooijman 2010) the reproduction flux is given by 14
JCR ppp )1( (equation 2) 15
which in specific life stages (adult stage in the standard DEB model, larval and adult stage in 16
the present holometabolous insect DEB model) is accumulated in the reproduction buffer 17

2
t
RR dssptE0
)()( (equation 3) 18
In equation 3 the integral starts from 0 that represents the time when the accumulation starts. 19
We know that (see Kooijman 2010): 20
G
MEGEC
EEκ
pkEErkEp
)( (equation 4) 21
Using equations 2 and 4 one can rewrite equation 3 22
t
JER dsprkEtE0
))()1(()( (equation 5) 23
Under constant feeding conditions mEE
f which is the same as: 24
fVEE m (equation 6) 25
Replacing equation 6 in equation 5 and knowing that Jp is constant during the larval period 26
(see Table 4) we have: 27
JmER ptVdsfErktEt
0
))(1()( (equation 7) 28
During the larval phase the organism behaves as a V1-morph, meaning that at constant 29
feeding conditions, i.e. constant f , the growth is exponential: 30
treVtV b
)( (equation 8) 31
and the reproduction buffer RE is then: 32
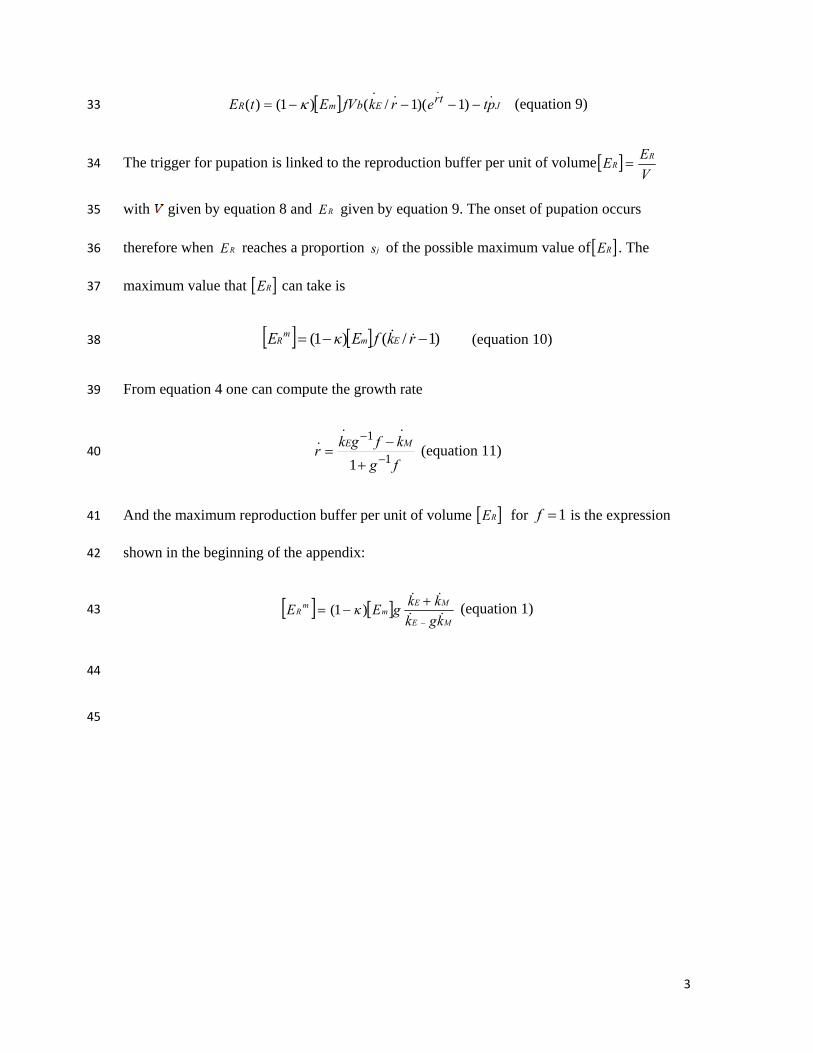
3
JEmR pterkfVEtE trb )1)(1/()1()( (equation 9) 33
The trigger for pupation is linked to the reproduction buffer per unit of volume V
EE
RR 34
with given by equation 8 and RE given by equation 9. The onset of pupation occurs 35
therefore when RE reaches a proportion js of the possible maximum value of RE . The 36
maximum value that RE can take is 37
)1/()1( rkfEκE EmmR (equation 10) 38
From equation 4 one can compute the growth rate 39
fg
kfgkr
ME
1
1
1
(equation 11) 40
And the maximum reproduction buffer per unit of volume RE for 1f is the expression 41
shown in the beginning of the appendix: 42
ME
MEm
mR
kgk
kkgEκE
)1( (equation 1) 43
44
45
Related Documents