Environ Monit Assess (2010) 164:43–52 DOI 10.1007/s10661-009-0873-1 A DSS for sustainable development and environmental protection of agricultural regions Basil D. Manos · Jason Papathanasiou · Thomas Bournaris · Kostas Voudouris Received: 11 September 2008 / Accepted: 10 March 2009 / Published online: 3 April 2009 © Springer Science + Business Media B.V. 2009 Abstract This paper presents a decision support system (DSS) for sustainable development and environmental protection of agricultural regions developed in the framework of the Interreg- Archimed project entitled WaterMap (develop- ment and utilization of vulnerability maps for the monitoring and management of groundwater re- sources in the ARCHIMED areas). Its aim is to optimize the production plan of an agricultural region taking in account the available resources, the environmental parameters, and the vulnera- bility map of the region. The DSS is based on an optimization multicriteria model. The spatial integration of vulnerability maps in the DSS en- ables regional authorities to design policies for optimal agricultural development and groundwa- ter protection from the agricultural land uses. The DSS can further be used to simulate different scenarios and policies by the local stakeholders due to changes on different social, economic, and environmental parameters. In this way, they can achieve alternative production plans and agricul- tural land uses as well as to estimate economic, social, and environmental impacts of different policies. The DSS is computerized and supported B. D. Manos (B ) · J. Papathanasiou · T. Bournaris · K. Voudouris Aristotle University of Thessaloniki, Thessaloniki, Greece e-mail: [email protected] by a set of relational databases. The correspond- ing software has been developed in a Microsoft Windows XP platform, using Microsoft Visual Basic, Microsoft Access, and the LINDO library. For demonstration reasons, the paper includes an application of the DSS in a region of Northern Greece. Keywords Decision support systems · Multicriteria mathematical programming · Sustainable development · Environmental management · Vulnerability maps Introduction Decision support systems Decision support systems (DSS) are defined as computerized systems, which include models and databases and are used in the decision-making process. They are “tools” that help decision mak- ers in the procedure of decision-making and in choosing the best (economic, social, or environ- mental) alternative solution. Several scientific sectors support their develop- ment and constitute the necessary background for the effective planning of decision support systems. The Science of Informatics has contributed in the planning and applications of decision support systems with the supply of tools, material, and

Welcome message from author
This document is posted to help you gain knowledge. Please leave a comment to let me know what you think about it! Share it to your friends and learn new things together.
Transcript
Environ Monit Assess (2010) 164:43–52DOI 10.1007/s10661-009-0873-1
A DSS for sustainable development and environmentalprotection of agricultural regions
Basil D. Manos · Jason Papathanasiou ·Thomas Bournaris · Kostas Voudouris
Received: 11 September 2008 / Accepted: 10 March 2009 / Published online: 3 April 2009© Springer Science + Business Media B.V. 2009
Abstract This paper presents a decision supportsystem (DSS) for sustainable development andenvironmental protection of agricultural regionsdeveloped in the framework of the Interreg-Archimed project entitled WaterMap (develop-ment and utilization of vulnerability maps for themonitoring and management of groundwater re-sources in the ARCHIMED areas). Its aim is tooptimize the production plan of an agriculturalregion taking in account the available resources,the environmental parameters, and the vulnera-bility map of the region. The DSS is based onan optimization multicriteria model. The spatialintegration of vulnerability maps in the DSS en-ables regional authorities to design policies foroptimal agricultural development and groundwa-ter protection from the agricultural land uses. TheDSS can further be used to simulate differentscenarios and policies by the local stakeholdersdue to changes on different social, economic, andenvironmental parameters. In this way, they canachieve alternative production plans and agricul-tural land uses as well as to estimate economic,social, and environmental impacts of differentpolicies. The DSS is computerized and supported
B. D. Manos (B) · J. Papathanasiou · T. Bournaris ·K. VoudourisAristotle University of Thessaloniki,Thessaloniki, Greecee-mail: [email protected]
by a set of relational databases. The correspond-ing software has been developed in a MicrosoftWindows XP platform, using Microsoft VisualBasic, Microsoft Access, and the LINDO library.For demonstration reasons, the paper includes anapplication of the DSS in a region of NorthernGreece.
Keywords Decision support systems ·Multicriteria mathematical programming ·Sustainable development ·Environmental management · Vulnerability maps
Introduction
Decision support systems
Decision support systems (DSS) are defined ascomputerized systems, which include models anddatabases and are used in the decision-makingprocess. They are “tools” that help decision mak-ers in the procedure of decision-making and inchoosing the best (economic, social, or environ-mental) alternative solution.
Several scientific sectors support their develop-ment and constitute the necessary background forthe effective planning of decision support systems.The Science of Informatics has contributed inthe planning and applications of decision supportsystems with the supply of tools, material, and
44 Environ Monit Assess (2010) 164:43–52
software. The sciences of Operational Researchand Management and Business Administrationprovide the theoretical frame for the analysis ofvarious decisions. The sciences of Behavior, Soci-ology, and the Management of Human Resourcesconstitute sources of information that concern themanner in which humans potential behave at thehandling of information and the decision-makingprocess.
A typical decision support system, uponSprague and Carlson (1982), Manos and Voros(1993), Manos et al. (2004a, b), Papathanasiouet al. (2005), Barac et al. (2004), and Kaur et al.(2007), comprises from the following elements(Fig. 1):
1. The Database and the Database ManagementSystem
2. The Model Base and the Model Base Manage-ment System (MBMS)
3. The Dialog Generation and ManagementSystem
The Database contains all the data that arerequired for the decision support system opera-tion. The software used for the systematic man-agement of data (storage, briefing, recuperation,and maintenance) constitutes what is known asthe Database Management System. The Data-base constitutes an essential tool for the orga-nized storage of data and information aiming attheir easy renewal, correction, and utilization inevery type analysis. In the DSS of WaterMap,
the database was developed using MicrosoftAccess.
The Model Base contains the models used fordata processing of the Database contents for theanalysis of input problems and the export of finalresults. The Model Base in a DSS includes mathe-matical, economical, and statistical models, as wellas models of Operational Research capable ofanalyzing problems and to support the process ofdecision-making. All the models are executed andoptimized by the MBMS. The models includedcan be models that execute specialized operations,models for operational, strategic, or tactic decisionsupport.
In WaterMap DSS, the basic model is anOptimization Multicriteria Mathematical Pro-gramming model. The transformation of data ininformation/results, which support the user/decision maker, is accomplished via the ModelBase Management System. In WaterMap DSS,the Model Base Management System was devel-oped utilizing LINDO. LINDO is a compre-hensive tool designed to build and solve linear,nonlinear, and integer optimization models.
The Dialog Generation and Management Sys-tem is responsible for the communication be-tween the user or decision-maker and the decisionsupport system plus the input of data and thepresentation of final results. It determines theinteractions between the user or decision-makerand the DSS, influencing in an important degreethe output, the flexibility, and the manageability
Fig. 1 Typical Decisionsupport system
Data
Base
Model
Base
Model Base
Management System
Data Base
Management System
User Interface
Decision Maker
Decision maker Support Base
Management System
Environ Monit Assess (2010) 164:43–52 45
of the DSS. WaterMap DSS was developed usingMicrosoft Visual Basic.
The need for WaterMap DSS
As underwater pollution levels and water demandtend to increase, and on the same time, availablewater levels are expected in the near future todecrease, the main target of WaterMap DSS isto develop strategies for optimal development ofagricultural regions and groundwater protection.
WaterMap (Development and utilization ofvulnerability maps for the monitoring andmanagement of groundwater resources in theARCHIMED areas) was a project designed tosupport the spatial development planning process.It was funded under the ARCHIMED Programof the Community Initiative INTERREG III Bthat specializes in the interventions for improve-ment of the spatial planning integration of theSoutheastern Mediterranean area (Voudouriset al. 2007).
WaterMap DSS integrates the vulnerabilitymap of a region and an Optimization MulticriteriaMathematical Programming model. This integra-tion enables the regional authorities in charge ofagricultural and water policy design and imple-mentation to design optimal agricultural devel-opment policies (Sofios et al. 2008) and simulatethe impact of different future scenarios (i.e., ex-ante evaluation of hypothetical implementation ofalternative policy instruments). It optimizes theproduction plan of an agricultural region taking inaccount the available resources (land, labor, andcapital), environmental parameters (agrochemi-cals and water consumption), and the vulnerabil-ity map of the region. The DSS can also be usedto simulate different scenarios and policies by thedecision-makers due to changes on different so-cial, economic, and environmental parameters. Inthis way, they can achieve alternative productionplans and agricultural land uses as well as to esti-mate economic, social, and environmental impactsof different policies.
WaterMap DSS is computerized and supportedby a set of relational databases. Input data areprovided by regional authorities and refer to agri-cultural land uses, available resources, etc. Infor-mation for the groundwater resources is provided
by vulnerability maps, which are used as a tool todetermine areas where aquifers are in high risk ofpollution.
For demonstration reasons, the paper includesan application of the DSS in a region of NorthernGreece.
Model development
The Model Base of WaterMap DSS mainly con-sists of a spatial model that was developed tosupport the sustainable planning process and theenvironmental protection of agricultural regions.The model is an Optimization Multicriteria Math-ematical Programming model (MCDM model)and achieves the optimum production plan in thearea combining different criteria to farmers’ utilityfunction under a set of constraints concerningdifferent categories of land, labor, etc. The modelcan then be used to simulate different scenariosand policies due to changes on different social,economic, and environmental parameters (e.g.,different levels of chemicals or water consumptionper crop). This way, we acquire alternative pro-duction plans and agricultural land uses as well asthe economic, social, and environmental impactsof different policies.
Objectives
The MCDM model in WaterMap optimizes at thesame time three different objectives or criteria:the profit maximization, the fertilizer minimiza-tion, and the labor minimization.
Max GM = ∑GMi Xi (1)
Min TF = ∑TFi Xi (2)
Min TL = ∑TLi Xi (3)
where:
GM is the total gross margin of the crop plan ofthe study region
Xi is the area of crop i in hectaresGMi is the gross margin of crop i per hectare
46 Environ Monit Assess (2010) 164:43–52
TF is the sum of fertilizers used for all crops ofthe crop plan
TFi is the fertilizer needed by crop i per hectareTL is the sum of labor for all farm activitiesTLi is the labor needed by crop i per hectare
In WarerMap MCDM model, nitrogen is usedas the fertilizer indicator. Similar indicators can bedesigned for other nutrients, such as phosphorusand potassium.
Constraints
The MCDM model includes a set of constraintsrelated with CAP. There are also market, agro-nomical, and rotational constraints as well asconstraints for labor and fertilizers.
Total cultivation area
All crops (Xi) must add up to 100. This con-straint is only introduced in order to obtain theoutcome of the model (decision variables Xi) aspercentages.
CAP
A large proportion of agricultural income dependsupon CAP subsidies, and farmers cannot affordto ignore CAP regulations that affect most of thecrops available for cultivation. For this reason, inaccordance with CAP rules, we need to includeset-aside activity (SA) related to the subsidizedcrops (which are the majority):
∑Xi + SA = 100
Market and other constraints
Some of the crops are not subject to CAP rules,but marketing channels put an upper limit onshort-term variations. In our model, we placesome market constraints for hard wheat, oat, andmaize in order to express the market demandof these products in the area, according to thehistorical quotas of the last 5 years (2001–2005) inthe Sarigkhiol basin.
Rotational and agronomic considerations
Agronomically, it is regarded as a sound policy notto cultivate a crop such as a cereal if, during theprevious year, the same plot has grown anothercereal. This is called a rotational constraint. Arotational constraint limits the cultivated area fora crop to a maximum number of the total availablearea and applies to all cereals.
Policy-relevant attributes
Attributes are values of interest relevant to policy-makers. The analyzed attributes in WaterMapDSS are:
1. Water consumption: the projected consump-tion of water measured in cubic meter perhectare is the variable that policy-makershope to control as a consequence of changesin water management policy.
2. Environmental impact: the main environmen-tal impact of irrigated agriculture is waterconsumption, with the creation of a mosaiclandscape and a rise in crop diversity andhumid areas. In addition to this positive im-pact, however, comes an increase in the useof fertilizers and chemicals that are the mainsource of nonpoint source pollution in agri-culture. We use the demand for fertilizers asan indicator of the environmental impact ofirrigated agriculture, measured in kilogram ofnitrogen added per hectare.
3. Nitrogen balance in groundwater: Physicaldifference (surplus/deficit) between nitrogeninputs and outputs from an agricultural sys-tem per hectare of agricultural land. Thisis the main form for calculating the sur-pluses of nitrogen potentially dangerous forthe environment. It would also be the mainindicator of the impact of farming on theenvironment as groundwater quality is con-cerned. This way, all nitrogen reaching thecultivated soil is included as input and thenitrogen in groundwater is considered as out-put. The difference is the net amount of ni-trogen that, over 1 year, is released in theenvironment.
Environ Monit Assess (2010) 164:43–52 47
Weighted goal programming
The MCDM model is based on weighted goal pro-gramming (WGP). Sumpsi et al. (1993, 1997) andAmador et al. (1998) consider this methodologysuitable and efficient for the analysis of decisionmaking and the simulation of agricultural systemsbased upon multicriteria techniques applied toagriculture. This methodology has been success-fully implemented on real agricultural systems(Bartolini et al. 2007a, b; Berbel and Rodriguez1998; Gomez-Limon and Berbel 2000; Gomez-Limon and Arriaza 2000; Gomez-Limon andRiesgo 2004; Gomez-Limon et al. 2002; Manos etal. 2004a, b, c, 2006, 2007; Pujol et al. 2006).
We employed this methodology to estimatea surrogate utility function in order to simu-late farmers’ decision-making processes. Briefly,the methodology can be summarized as follows(Romero 1991):
1. Tentatively establish a set of objectives orcriteria that may be supposed to be most im-portant for farmers.
2. Determine the payoff matrix for the aboveobjectives.
3. Using this matrix estimate a set of weights thatoptimally reflect farmers’ objectives.
In WaterMap MCDM model, the surrogate utilityfunction which is obtained by the application ofthe WGP methodology combines the three crite-ria 1, 2, and 3 defined in the “Objectives.” Thissurrogate utility function is the new objective ofour MCDM model which is used to achieve theoptimum crop plan of the study region as well as aseries of alternative crop plans.
Vulnerability map and vulnerability scenarios
The MCDM model is further used to simulatedifferent scenarios and policies due to changeson different social, economic, and environmentalparameters (e.g., different levels of chemicals orwater consumption per crop). In order to definethe different scenarios, we use the vulnerabilityindex from the DRASTIC Method Vulnerabilityindex.
Vulnerability refers to the sensitivity of anaquifer system to deterioration due to an externalaction. The concept of the groundwater vulnera-
bility is based on the assumption that the physicalenvironment may provide some degree of protec-tion to groundwater against human activities (Al-Zabet 2002). Regional assessment of groundwatervulnerability is a useful tool for groundwater re-sources management.
The most widely used groundwater vulnerabil-ity mapping method is DRASTIC. The methodwas developed by the US Environmental Protec-tion Agency as a technique for assessing ground-water pollution potential (Aller et al. 1987). Theacronym DRASTIC corresponds to the initial ofthe included seven parameters: depth, recharge,aquifer media, soil media, topography, impact ofthe vadose zone media, and hydraulic conductivityof the aquifer.
Determination of the DRASTIC index involvesmultiplying each parameter weight by its site rat-ing and summing the total. The equation for theDRASTIC (DI) index is:
DI = DrDw + RrRw + ArAw + SrSw + TrTw
+IrIw + CrCw (4)
where: D, R, A, S, T, I, C were defined earlier, rrating for the study area being evaluated and w theimportance weight for the parameter.
Each parameter has a rating scale between 1and 10. The higher sum values of DI representgreater potential for groundwater pollution orgreater aquifer vulnerability.
In WaterMap, we simulate five scenarios: VeryLow scenario (Drastic index <75), Low Scenario(Drastic index 75–90), Moderate Scenario (Dras-tic index 90–105), High Scenario (Drastic index105–120), and Very high Scenario (Drastic index>120). These scenarios are used as an attribute inthe MCDM model in order to take five differentcrop plans for the study region according to theDRASTIC Method and Vulnerability index.
Data
The data of WaterMap DSS that feed the MCDMmodel are of the following categories:
• Crops of the study region• Yields• Prices• Subsidies
48 Environ Monit Assess (2010) 164:43–52
• Income• Variable costs (we consider six categories to
describe inputs and variable costs: (1) seeds;(2) fertilizers; (3) chemicals; (4) machinery; (5)labor; and (6) cost of water)
• Gross margin• Fertilizer use• Water consumption• Allocation of utilized agricultural area of the
study region• Vulnerability maps of the study region
The technical and economic coefficients of thecrops are acquired from the processing of theabove data stored in Microsoft Access databasesby the MCDM model of the DSS.
The data concerning the required parametersfor the application of the DRASTIC methodwere collected from a hydrogeological and hy-drometeorological survey, drilling and pumpingtests, as well as groundwater levels measurements.The vulnerability map was produced applying theDRASTIC method in a GIS context (Voudouris2009).
The watermap DSS
WaterMap DSS is a simple step-by-step programthat is based on vulnerability maps of the study
region and facilitates and optimizes the decision-making process relating to the problems of landuse, water management, and environmental pro-tection. The system is computerized and sup-ported by a set of relational databases. The cor-responding software has been developed in aMicrosoft Windows XP platform, using MicrosoftVisual Basic, Microsoft Access, and the LINDOlibrary. During the design and programming ofthe DSS, one of the main targets was to producean application that is particularly user friendly tofacilitate the case of users with less informaticsbackground.
There are 11 steps in the main menu options,and the user has to complete each step from thebeginning in order to move to the next. Thesesteps are as following:
1. Crops2. Crop Plan3. Data Entry4. Matrix5. Pay off Matrix6. Utility Function7. Optimum Plan8. Vulnerability Map9. Vulnerability Index
10. Scenario Analysis11. Vulnerability vs Scenario Analysis
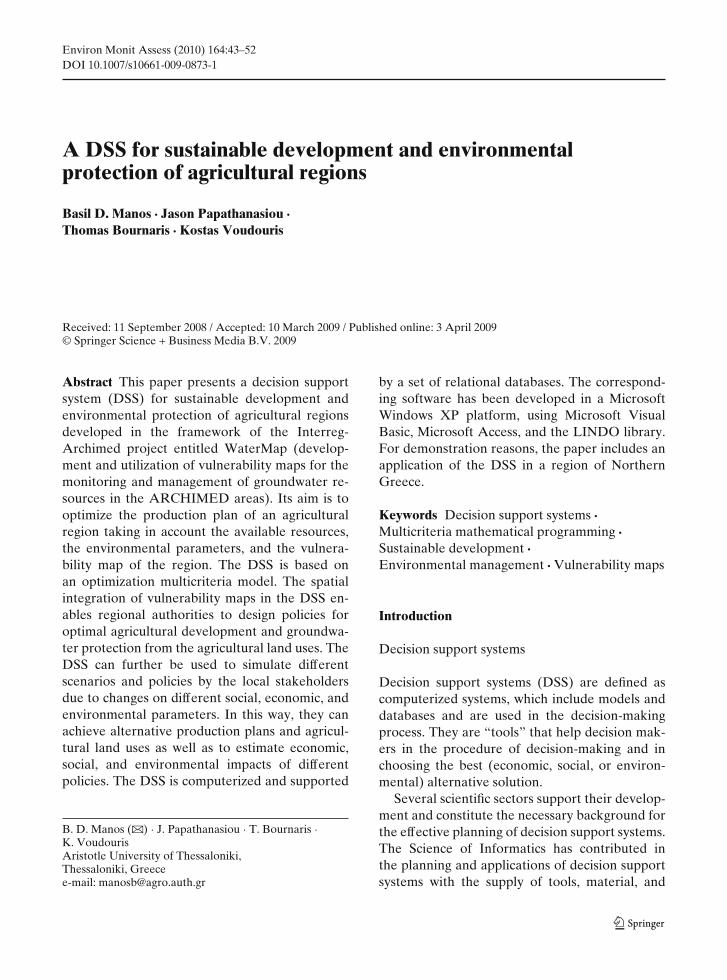
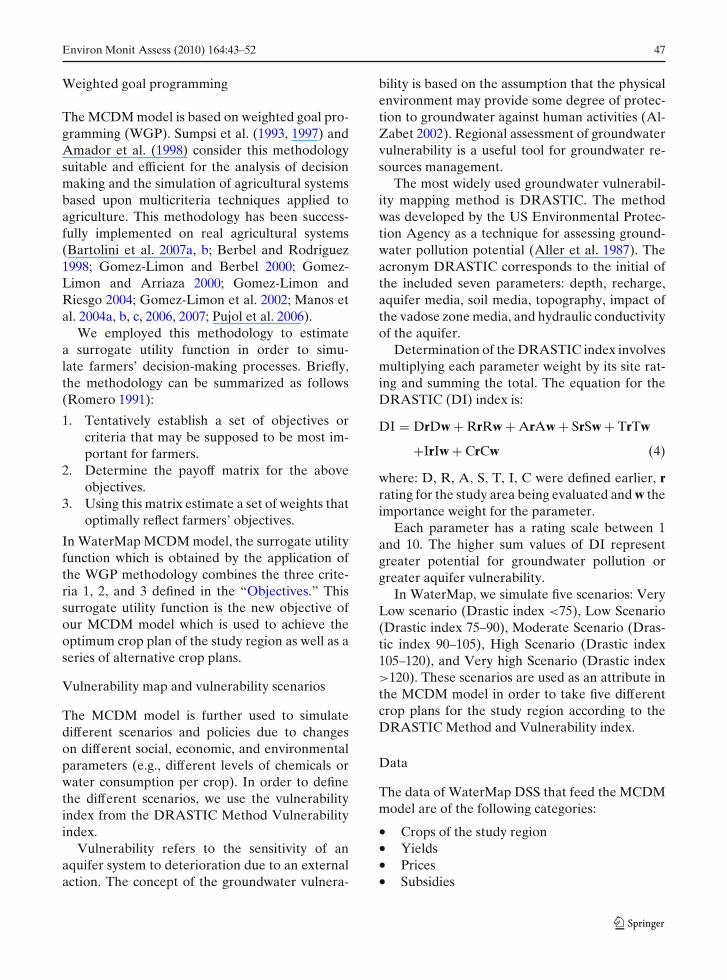
Fig. 2 The model
Environ Monit Assess (2010) 164:43–52 49
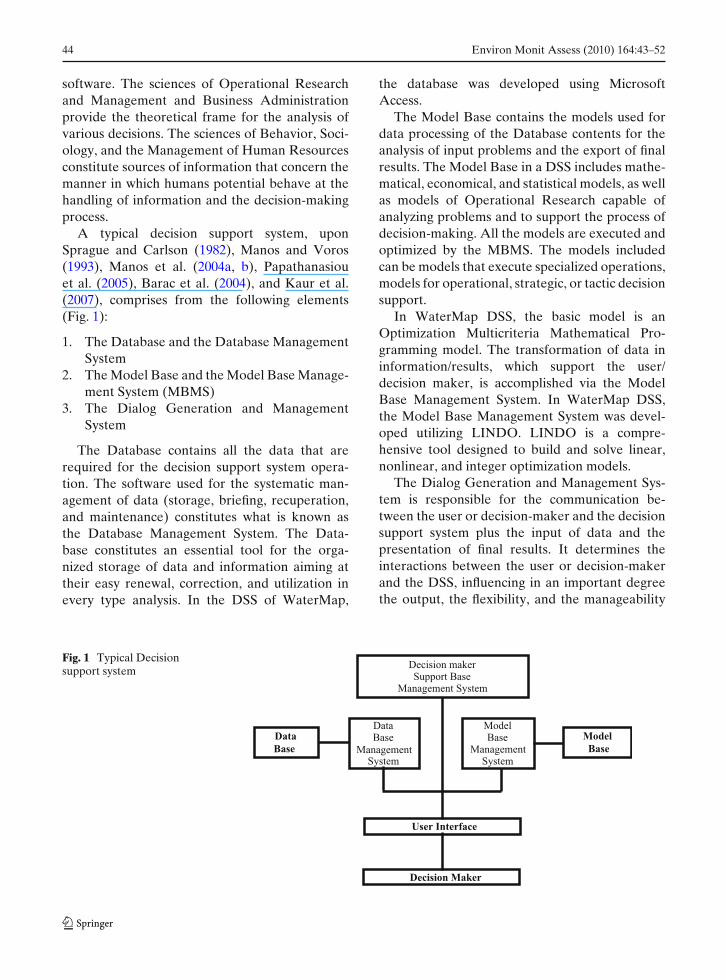
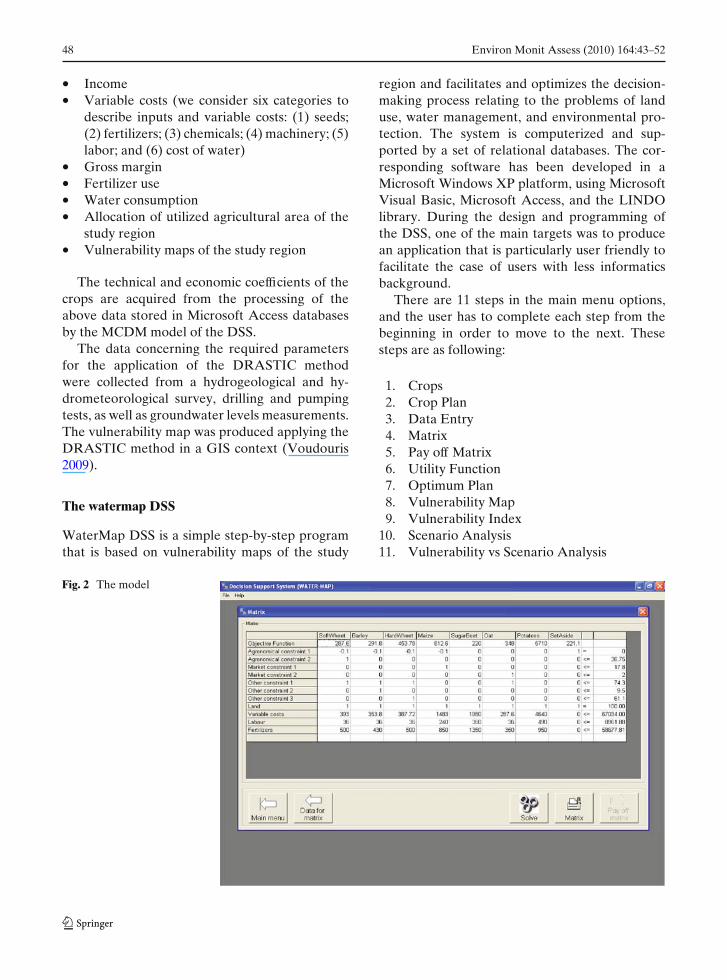
Fig. 3 Optimum Planview
The first three steps are about the data en-try and the formulation of the model, shown instep 4 where there is a full view of the MCDMmodel Matrix, the objective function, and all theconstraints (Fig. 2). A solution may always beunbounded or infeasible; so in order to proceed,the input data must be checked and changed ifpossible.
Step 5 is about the payoff matrix, the optimumGross Margin, Fertilizers, and Labor values, andone can see how far the real situation is fromany single optimum. We applied the weightedgoal programming algorithm for the study region.The three objectives were: maximization of GrossMargin (more revenue for the farmers), minimiza-tion of Fertilizers Use (less costs and mainly less
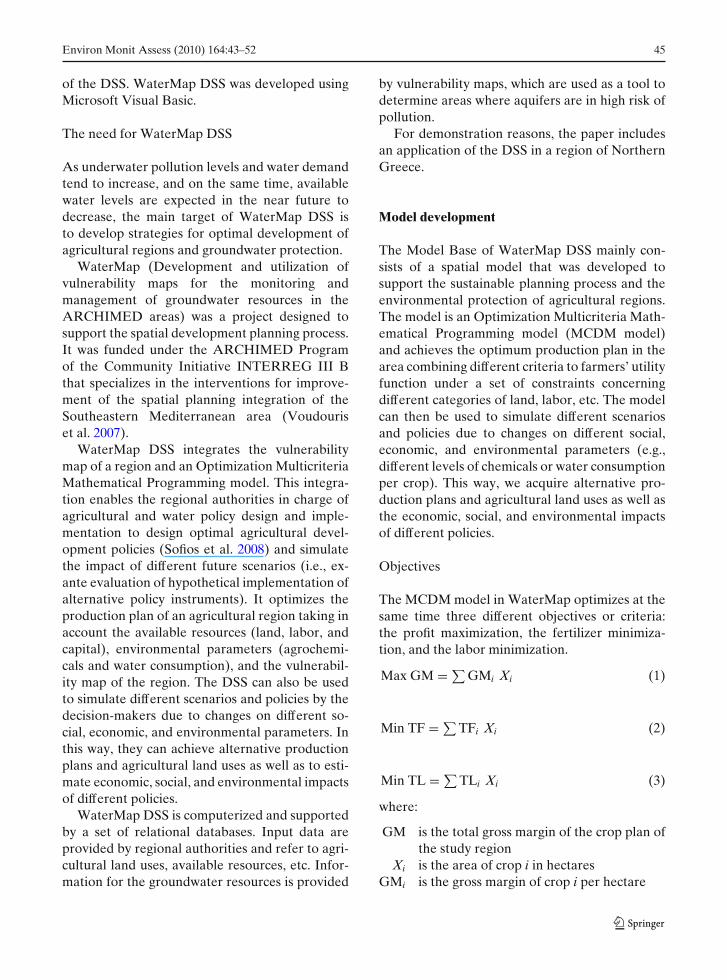
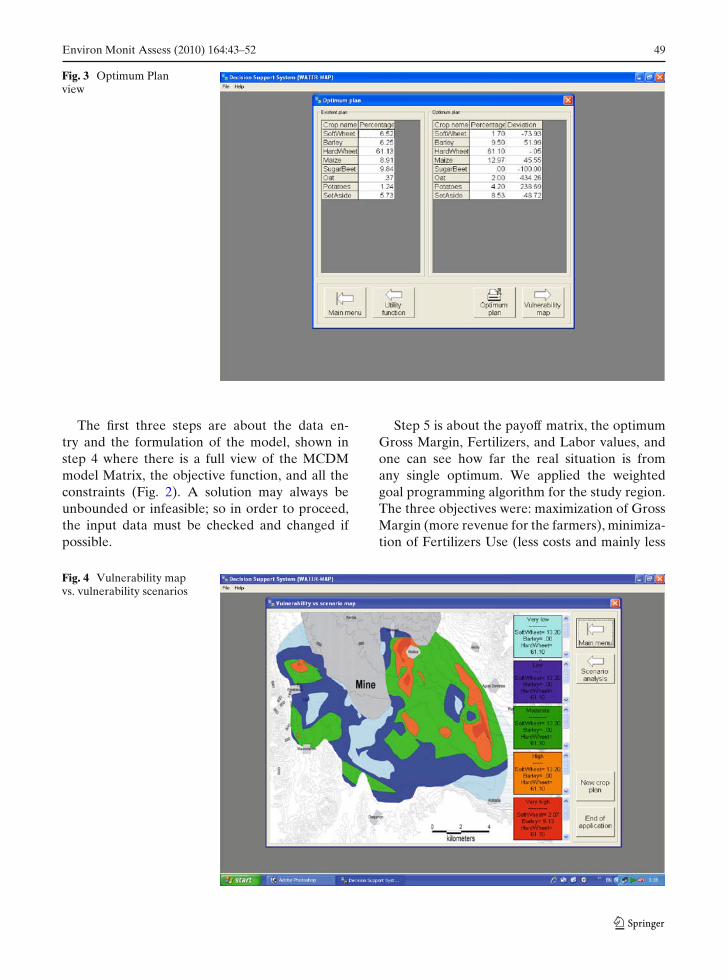
Fig. 4 Vulnerability mapvs. vulnerability scenarios
50 Environ Monit Assess (2010) 164:43–52
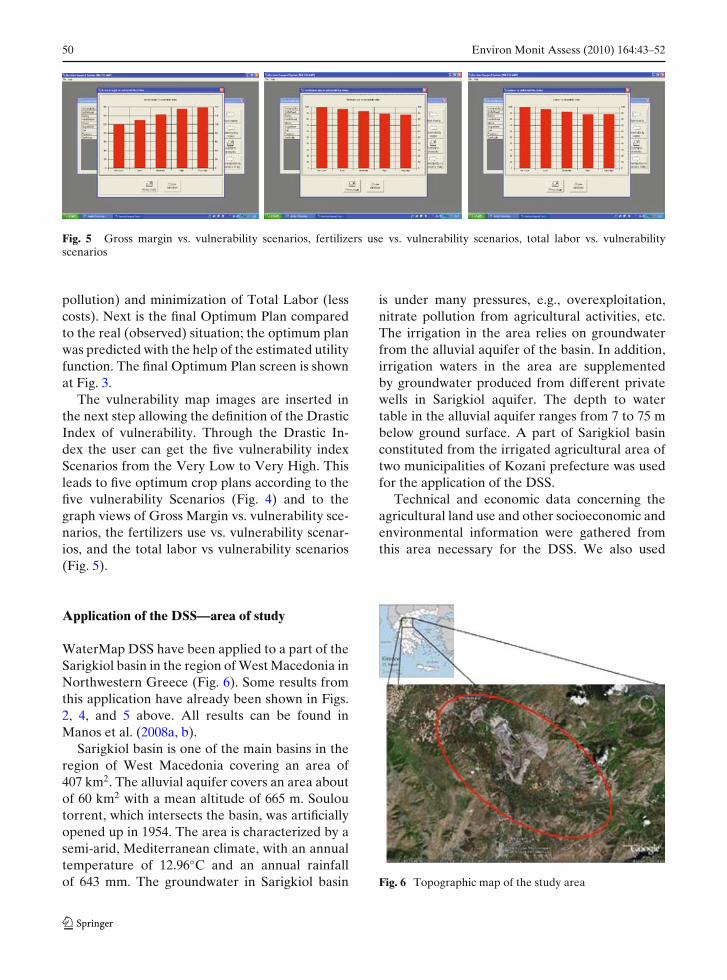
Fig. 5 Gross margin vs. vulnerability scenarios, fertilizers use vs. vulnerability scenarios, total labor vs. vulnerabilityscenarios
pollution) and minimization of Total Labor (lesscosts). Next is the final Optimum Plan comparedto the real (observed) situation; the optimum planwas predicted with the help of the estimated utilityfunction. The final Optimum Plan screen is shownat Fig. 3.
The vulnerability map images are inserted inthe next step allowing the definition of the DrasticIndex of vulnerability. Through the Drastic In-dex the user can get the five vulnerability indexScenarios from the Very Low to Very High. Thisleads to five optimum crop plans according to thefive vulnerability Scenarios (Fig. 4) and to thegraph views of Gross Margin vs. vulnerability sce-narios, the fertilizers use vs. vulnerability scenar-ios, and the total labor vs vulnerability scenarios(Fig. 5).
Application of the DSS—area of study
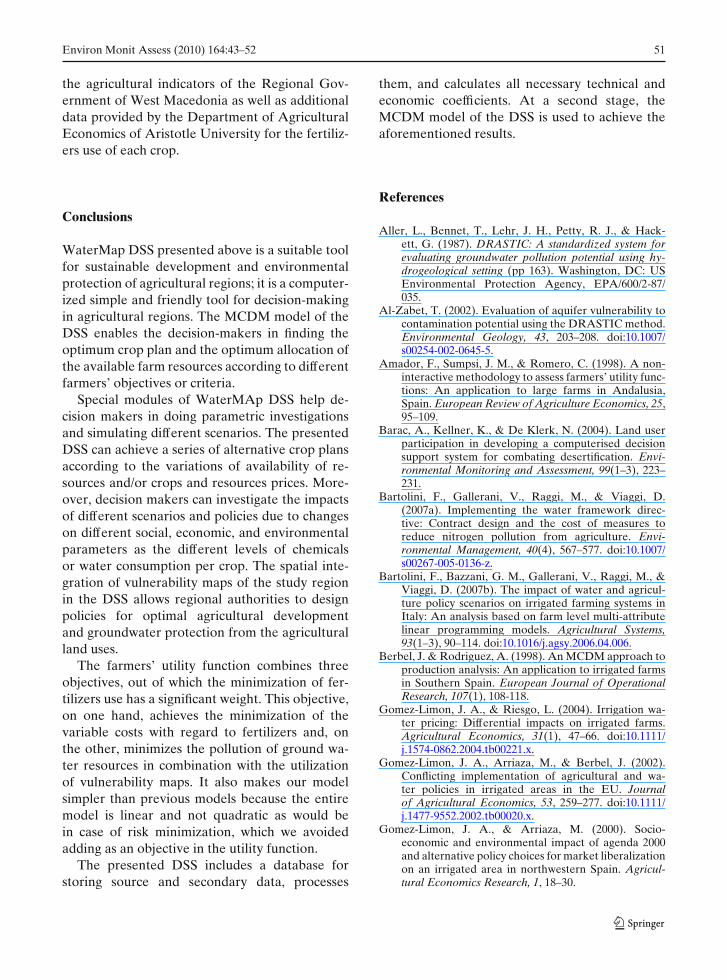
WaterMap DSS have been applied to a part of theSarigkiol basin in the region of West Macedonia inNorthwestern Greece (Fig. 6). Some results fromthis application have already been shown in Figs.2, 4, and 5 above. All results can be found inManos et al. (2008a, b).
Sarigkiol basin is one of the main basins in theregion of West Macedonia covering an area of407 km2. The alluvial aquifer covers an area aboutof 60 km2 with a mean altitude of 665 m. Souloutorrent, which intersects the basin, was artificiallyopened up in 1954. The area is characterized by asemi-arid, Mediterranean climate, with an annualtemperature of 12.96◦C and an annual rainfallof 643 mm. The groundwater in Sarigkiol basin
is under many pressures, e.g., overexploitation,nitrate pollution from agricultural activities, etc.The irrigation in the area relies on groundwaterfrom the alluvial aquifer of the basin. In addition,irrigation waters in the area are supplementedby groundwater produced from different privatewells in Sarigkiol aquifer. The depth to watertable in the alluvial aquifer ranges from 7 to 75 mbelow ground surface. A part of Sarigkiol basinconstituted from the irrigated agricultural area oftwo municipalities of Kozani prefecture was usedfor the application of the DSS.
Technical and economic data concerning theagricultural land use and other socioeconomic andenvironmental information were gathered fromthis area necessary for the DSS. We also used
Fig. 6 Topographic map of the study area
Environ Monit Assess (2010) 164:43–52 51
the agricultural indicators of the Regional Gov-ernment of West Macedonia as well as additionaldata provided by the Department of AgriculturalEconomics of Aristotle University for the fertiliz-ers use of each crop.
Conclusions
WaterMap DSS presented above is a suitable toolfor sustainable development and environmentalprotection of agricultural regions; it is a computer-ized simple and friendly tool for decision-makingin agricultural regions. The MCDM model of theDSS enables the decision-makers in finding theoptimum crop plan and the optimum allocation ofthe available farm resources according to differentfarmers’ objectives or criteria.
Special modules of WaterMAp DSS help de-cision makers in doing parametric investigationsand simulating different scenarios. The presentedDSS can achieve a series of alternative crop plansaccording to the variations of availability of re-sources and/or crops and resources prices. More-over, decision makers can investigate the impactsof different scenarios and policies due to changeson different social, economic, and environmentalparameters as the different levels of chemicalsor water consumption per crop. The spatial inte-gration of vulnerability maps of the study regionin the DSS allows regional authorities to designpolicies for optimal agricultural developmentand groundwater protection from the agriculturalland uses.
The farmers’ utility function combines threeobjectives, out of which the minimization of fer-tilizers use has a significant weight. This objective,on one hand, achieves the minimization of thevariable costs with regard to fertilizers and, onthe other, minimizes the pollution of ground wa-ter resources in combination with the utilizationof vulnerability maps. It also makes our modelsimpler than previous models because the entiremodel is linear and not quadratic as would bein case of risk minimization, which we avoidedadding as an objective in the utility function.
The presented DSS includes a database forstoring source and secondary data, processes
them, and calculates all necessary technical andeconomic coefficients. At a second stage, theMCDM model of the DSS is used to achieve theaforementioned results.
References
Aller, L., Bennet, T., Lehr, J. H., Petty, R. J., & Hack-ett, G. (1987). DRASTIC: A standardized system forevaluating groundwater pollution potential using hy-drogeological setting (pp 163). Washington, DC: USEnvironmental Protection Agency, EPA/600/2-87/035.
Al-Zabet, T. (2002). Evaluation of aquifer vulnerability tocontamination potential using the DRASTIC method.Environmental Geology, 43, 203–208. doi:10.1007/s00254-002-0645-5.
Amador, F., Sumpsi, J. M., & Romero, C. (1998). A non-interactive methodology to assess farmers’ utility func-tions: An application to large farms in Andalusia,Spain. European Review of Agriculture Economics, 25,95–109.
Barac, A., Kellner, K., & De Klerk, N. (2004). Land userparticipation in developing a computerised decisionsupport system for combating desertification. Envi-ronmental Monitoring and Assessment, 99(1–3), 223–231.
Bartolini, F., Gallerani, V., Raggi, M., & Viaggi, D.(2007a). Implementing the water framework direc-tive: Contract design and the cost of measures toreduce nitrogen pollution from agriculture. Envi-ronmental Management, 40(4), 567–577. doi:10.1007/s00267-005-0136-z.
Bartolini, F., Bazzani, G. M., Gallerani, V., Raggi, M., &Viaggi, D. (2007b). The impact of water and agricul-ture policy scenarios on irrigated farming systems inItaly: An analysis based on farm level multi-attributelinear programming models. Agricultural Systems,93(1–3), 90–114. doi:10.1016/j.agsy.2006.04.006.
Berbel, J. & Rodriguez, A. (1998). An MCDM approach toproduction analysis: An application to irrigated farmsin Southern Spain. European Journal of OperationalResearch, 107(1), 108-118.
Gomez-Limon, J. A., & Riesgo, L. (2004). Irrigation wa-ter pricing: Differential impacts on irrigated farms.Agricultural Economics, 31(1), 47–66. doi:10.1111/j.1574-0862.2004.tb00221.x.
Gomez-Limon, J. A., Arriaza, M., & Berbel, J. (2002).Conflicting implementation of agricultural and wa-ter policies in irrigated areas in the EU. Journalof Agricultural Economics, 53, 259–277. doi:10.1111/j.1477-9552.2002.tb00020.x.
Gomez-Limon, J. A., & Arriaza, M. (2000). Socio-economic and environmental impact of agenda 2000and alternative policy choices for market liberalizationon an irrigated area in northwestern Spain. Agricul-tural Economics Research, 1, 18–30.
52 Environ Monit Assess (2010) 164:43–52
Gomez-Limon, J. A., & Berbel, J. (2000). Multicrite-ria analysis of derived water demand functions: ASpanish case study. Agricultural Systems, 63, 49–72.doi:10.1016/S0308-521X(99)00075-X.
Kaur, R., Paul, M., & Malik, R. (2007). Impact assess-ment and recommendation of alternative conjunc-tive water use strategies for salt affected agriculturallands through a field scale decision support system—A case study. Environmental Monitoring and Assess-ment, 129, 257–270. doi:10.1007/s10661-006-9359-6.
Manos, B., & Voros, M. (1993). A decision support systemfor poultry producers. In Proceedings of 9th worldfarm management congress, invited paper, Budapest(pp. 232–253).
Manos, B., Bournaris, T., Kamruzzaman, M., Nakou, I.,& Tziaka, D. (2004a). Sustainability of European ir-rigated agriculture. In J. Berbel, & C. Gutierez (Eds.),The case of Greece in sustainability of European irri-gated agriculture under water framework directive andagenda 2000. Brussels: European Commission, ISBN92-894-8005-X.
Manos, B., Bournaris, T., Silleos, N., Antonopoulos, V., &Papathanasiou, J. (2004b). A decision support systemapproach for rivers monitoring and sustainable man-agement. Environmental Monitoring and Assessment,96(1–3), 85–98.
Manos, B., Ciani, A., Bournaris, T., Vassiliadou, I., &Papathanasiou, J. (2004c). A taxonomy survey ofdecision support systems in agriculture. AgriculturalEconomics Research, 5(2), 80–94.
Manos, B., Bournaris, T. H., Kamruzzaman, M., Begum.A. A. & Papathanasiou, J. (2006). The regional impactof irrigation water pricing in Greece under alternativescenarios of European policy: A multicriteria analysis.Regional Studies, 39(9), 1055–1068.
Manos, B., Begum, A. A., Kamruzzaman, M., Nakou, I.,& Papathanasiou, J. (2007). Fertilizer price policy, theenvironment and farms behaviour. Journal of PolicyModeling, 29(1), 87–97.
Manos, B., Bournaris, T., & Papathanasiou, J. (2008a).A spatial model—DSS to support the sustainableplanning process in the agricultural sector. Wa-termap project. Project’s report. Aristotle University ofThessaloniki.
Manos, B., Papathanasiou, J., & Bournaris, T. (2008b). Wa-termap DSS guide. Watermap project. Project’s report.Aristotle University of Thessaloniki.
Papathanasiou, J., Manos, B., Vlachopoulou, M., &Vassiliadou, I. (2005). A decision support systemfor farm regional planning. Yugoslav Journal ofOperations Research, 15(1), 109–124. doi:10.2298/YJOR0501109P.
Pujol, J., Raggi, M., & Viaggi, D. (2006). The potential im-pact of markets for irrigation water in Italy and Spain:A comparison of two study areas. The AustralianJournal of Agricultural and Resource Economics,50(3), 361–380. doi:10.1111/j.1467-8489.2006.00352.x.
Romero, C. (1991). Handbook of critical issues in goal pro-gramming. Oxford: Pergamon Press.
Sofios, C., Arabatzis, G., & Baltas, E. (2008). Policyfor management of water resources in Greece. TheEnvironmentalist, 28, 185–194. doi:10.1007/s10669-007-9126-4.
Sprague, R. H., Jr, & Carlson, E. D. (1982). Building effec-tive decision support systems. Englewood Cliffs, NewJersey: Prentice Hall.
Sumpsi, J. M., Amador, F. & Romero C. (1993). A researchon the Andalusian farmers’ objectives: Methodolog-ical aspects and policy implication. In Aspects of thecommon agricultural policy, VIIth EAAE congress,Stresa, Italy.
Sumpsi, J. M., Amador, F., & Romero, C. (1997). Onfarmers’ objectives: A multi-criteria approach. Eu-ropean Journal of Operational Research, 96, 1–8.doi:10.1016/0377-2217(95)00338-X.
Voudouris, K. (2009). Assessing groundwater pollutionrisk in Sarigkiol Basin, NW Greece. In M. Gallo, &M. Herrari (Eds.), River pollution research progress.Nova Science Publishers, Chapter 7, pp 17.
Voudouris, K., Manos, B., Adamidou, K., Patrikaki, O.,Trikilidou, E., Goutzios, B., et al. (2007). Devel-opment and utilization of vulnerability maps forthe monitoring and management of groundwater re-sources in the ARCHIMED areas: Presentation of anINTERREG III B Project. In Proc. of intern. scientificconference “Modern management of mine producing,geology and environmental protection (SGEM 2007),”11–15 June, Varna, Bulgaria.
Related Documents


![Agricultural scenario JRODOS calculations · Agricultural scenario JRODOS calculations C. Turcanu ... 1993]) Radioecological regions ... May 1st and November 20th Three radionuclides:](https://static.cupdf.com/doc/110x72/5b930e4009d3f27f5d8c6e62/agricultural-scenario-jrodos-calculations-agricultural-scenario-jrodos-calculations.jpg)