annual report 2008 EMIRA annual report 2008 A DIVERSIFIED AND BALANCED PORTFOLIO

Welcome message from author
This document is posted to help you gain knowledge. Please leave a comment to let me know what you think about it! Share it to your friends and learn new things together.
Transcript

annual report 2008
EMIRA annual report 2008
A DIVERSIFIED AND BALANCED PORTFOLIO

1 Objectives
2 Portfolio of top ten properties
4 Portfolio summary
6 Manager’s report
20 Directorate
23 Corporate governance
29 Sustainability
33 Annual financial statements
62 Property listing
71 Strategic Real Estate Managers (Pty) Ltd financial statements
86 Administration information
87 Form of proxy
A property fund created under the Emira Property Scheme, registered in terms of the Collective Investment Schemes Control Act
Share code: EMIISIN: ZAE000050712(“Emira”)
www.emira.co.za
>
A Fibonacci spiral is created by drawing arcs connecting the opposite corners of squares.
Leonardo Da Vinci used it for beauty and balance in the design of architecture and for balance in the design of art.
It was used in the design of the Notre Dame Cathedral in Paris.
It also appears in the physical proportions of the human body, movements in the stock market and many other aspects of life and the universe.
The Greeks recognised it as ‘dividing a line in the extreme and mean ratio’. The Renaissance artists knew it as the Divine Proportion.

Distributions per participating interest
92,04 cents annualised growth of 11,8%
Net asset value per participating interest 1 169 cents
an increase of 1,9%
Capital projects completed R330 million
Fuel Group Acsa ParkRandridge Mall Hyde Park CornerWorldWear Fashion Mall

A DIVERSIFIED AND BALANCED PORTFOLIO
Hyde Park Corner Boundary Terrace
A robust portfolio of 164 properties spanning the office, retail and industrial sectors across a wide national footprint, in all the major cities of South Africa.
A broad base of more than 4 000, predominantly blue-chip – tenants, ranging from listed giants and government departments to individual entrepreneurs.
A strong balance sheet with access to funding from the equity and debt capital markets, as well as traditional mortgages and short-term finance.
4 000 TENANTS
R7,8TOTAL ASSETSBILLION
164 PROPERTIES

emira property fund annual report 2008
1
Objectives
Results for the Results for theyear ended year ended %
30 June 2008 30 June 2007 change
FINANCIAL HIGHLIGHTSDistributions per participatory interest (cents) 92,04 82,35 12Headline earnings per participatory interest (cents) 122,12 76,77 59Vacancy factor (%) 6,8 5,9 —
Portfolio valuation analysisMarket value (R’000) 7 491 436 7 314 742 2Net asset value per participatory interest (cents) 1 169 1 148 2Listed market price per participatory interest (cents) 819 1 090 (25)Premium/(discount) to net asset value (%) (30) (5) —
SALIENT FEATURESParticipatory interests in issue 492 818 989 488 514 461 1Market capitalisation (R’000) 4 036 188 5 324 808 (24)Long-term borrowings (R’000) 1 327 204 1 287 050 3Long-term borrowings to total assets (%) 17,0 17,4 —Number of properties 164 168 (2)
The Fund’s principal objective is to grow earnings from a quality-based
property portfolio. Growth will be sought by making strategic investments
where yields are enhancing in the medium to long term. Management will
continually maintain the quality of the portfolio by disposals of assets,
which no longer meet the strategic objectives of the Fund.
THE STRATEGIC objECTIvES oF THE FUNd ARE To:
Optimise net income and growth in distributions;
Apply gearing to the portfolio to the extent that it enhances returns, limited to 60% as provided for in
the Collective Investment Schemes Control Act;
Increase market capitalisation, liquidity and spread of investors through selective acquisitions and
capital raising;
Selectively recycle assets;
Broaden the Fund’s geographic exposure to KwaZulu-Natal, the Western and Eastern Cape;
Maintain a balanced exposure to the retail, office and industrial property sectors, given the relative size
constraints of these sectors;
Dispose of non-performing or potentially under-performing properties;
Reduce vacancies and smooth the lease expiry profile of the portfolio; and
Meet the requirements and deadlines of the Property Sector Charter.
emira property fund annual report 2008
2
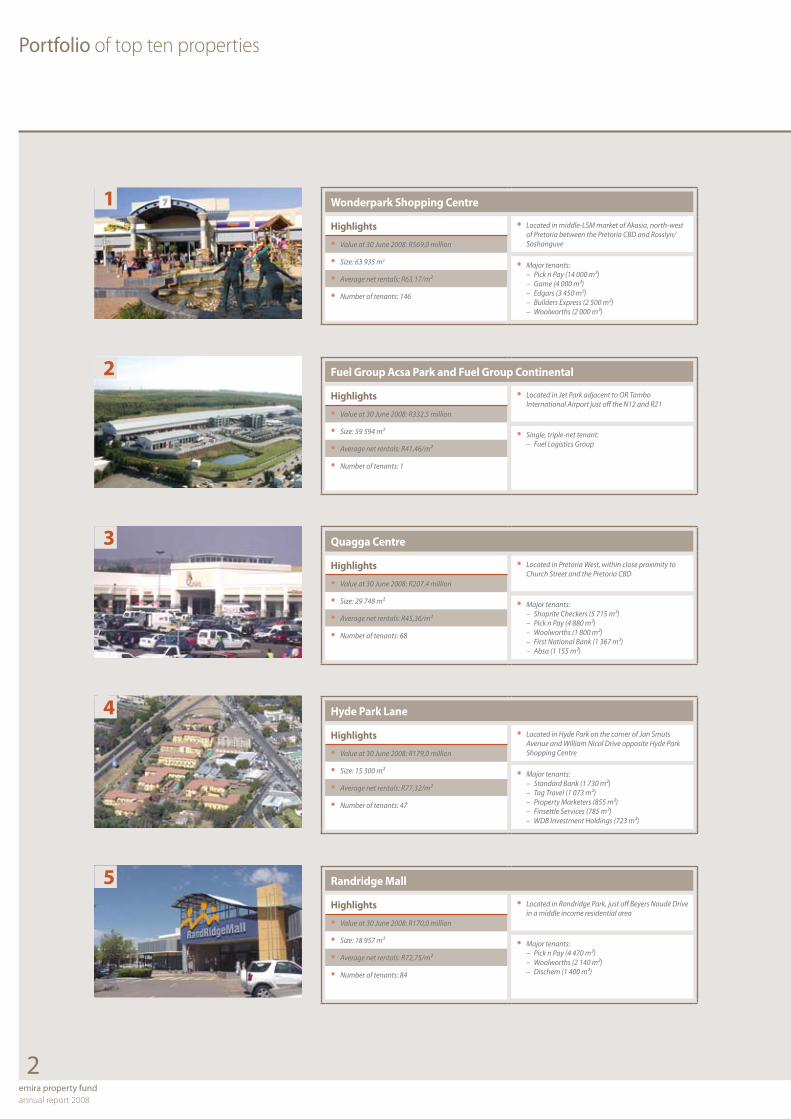
Wonderpark Shopping Centre
Highlights
Value at 30 June 2008: R569,0 million•Size: 63 935 m• 2
Average net rentals: R63,17/m²•Number of tenants: 146•
Located in middle-LSM market of Akasia, north-west •of Pretoria between the Pretoria CBD and Rosslyn/Soshanguve
Major tenants: •Pick n Pay (14 000 m²) –Game (4 000 m²) –Edgars (3 450 m²) –Builders Express (2 500 m²) –Woolworths (2 000 m²) –
Fuel Group Acsa Park and Fuel Group Continental
Highlights
Value at 30 June 2008: R332,5 million•Size: 59 594 m²•Average net rentals: R41,46/m²•Number of tenants: 1•
Located in Jet Park adjacent to OR Tambo •International Airport just off the N12 and R21
Single, triple-net tenant:•Fuel Logistics Group –
Hyde Park Lane
Highlights
Value at 30 June 2008: R179,0 million•Size: 15 300 m²•Average net rentals: R77,32/m²•Number of tenants: 47•
Located in Hyde Park on the corner of Jan Smuts •Avenue and William Nicol Drive opposite Hyde Park Shopping Centre
Major tenants:•Standard Bank (1 730 m²) –Tag Travel (1 073 m²) –Property Marketers (855 m²) –Finsettle Services (785 m²) –WDB Investment Holdings (723 m²) –
Quagga Centre
Highlights
Value at 30 June 2008: R207,4 million•Size: 29 748 m²•Average net rentals: R45,36/m²•Number of tenants: 68•
Located in Pretoria West, within close proximity to •Church Street and the Pretoria CBD
Major tenants:•Shoprite Checkers (5 715 m²) –Pick n Pay (4 880 m²) –Woolworths (1 800 m²) –First National Bank (1 367 m²) –Absa (1 155 m²) –
Randridge Mall
Highlights
Value at 30 June 2008: R170,0 million•Size: 18 957 m²•Average net rentals: R72,75/m²•Number of tenants: 84•
Located in Randridge Park, just off Beyers Naudé Drive •in a middle income residential area
Major tenants:•Pick n Pay (4 470 m²) –Woolworths (2 140 m²) –Dischem (1 400 m²) –
Portfolio of top ten properties
1
2
3
4
5

emira property fund annual report 2008
3
Portfolio of top ten propertiescontinued
WorldWear Fashion Mall
Highlights
Value at 30 June 2008: R159,0 million•Size: 13 629 m²•Average net rentals: R94,79/m²•Number of tenants: 67 •
Located on Beyers Naudé Drive adjacent the •N1 freeway and close to Cresta Shopping Centre
Major tenants: •Mr Price Home (2 500 m²) –The Pro Shop (1 025 m²) –Seemanns (616 m²) –
Lynnridge Mall
Highlights
Value at 30 June 2008: R157,5 million•Size: 14 220 m²•Average net rentals: R88,60/m²•Number of tenants: 57•
Located in Lynnwood Ridge, in the eastern suburbs •of Pretoria
Major tenants:•Pick n Pay (3 930 m²) –Mr Price Home (1 707 m²) –Absa Bank (1 190 m²) –Lion Bridge (915 m²) –
Faerie Glen office Park
Highlights
Value at 30 June 2008: R124,5 million•Size: 10 324 m²•Average net rentals: R76,08/m²•Number of tenants: 9•
Situated east of Pretoria overlooking Atterbury Drive, •a short drive from Menlyn Shopping Centre
Major tenants:•Softline VIP (5 755 m²) –FNB (1 296 m²) –Sanlam (960 m²) –
boundary Terraces
Highlights
Value at 30 June 2008: R130,0 million•Size: 8 205 m²•Average net rentals: R110,74/m²•Number of tenants: 10•
Located on the outskirts of the Claremont CBD, •opposite the Newlands Cricket Stadium
Major tenants:•Coronation Asset Management (3 391 m²) –Citadel Investment Services (1 348 m²) –Pinnacle Point Investments (1 326 m²) –
Woodmead office Park
Highlights
Value at 30 June 2008: R123,1 million•Size: 17 514 m²•Average net rentals: R54,67/m²•Number of tenants: 42•
Located within the Woodmead office node with •exposure to the M1 highway
Major tenants:•DB Thermal (2 755 m²) –Young & Rubicam (1 970 m²) –Regenesys (1 752 m²) –
6
7
8
9
10

4emira property fund annual report 2008
Portfolio summary
Portfolio value by sector
O�ces
Retail
Industrial
46%
36%
18%
Portfolio GLA by sector
O�ces
Retail
Industrial
37%
32%
31%
Portfolio value by region
Gauteng
Western Cape
Free State
KwaZulu-Natal
Eastern Cape73%
10%
4%
12%1%
Portfolio GLA by region
Gauteng
Western Cape
Free State
KwaZulu-Natal
Eastern Cape70%9%
5%
14%
2%
Tenant profile
42%
19%
39%Grade A
Grade B
Grade C
Tenants have been graded as follows:
“A” grade: Large national tenants, large listed
tenants, government and major franchisees.
These include, inter alia, the Department
of Labour, Edgars Consolidated Stores,
FirstRand Bank, Pepkor, Pick n Pay Stores, the
Standard Bank Group, Ster-Kinekor, Truworths
International and Virgin Active.
“B” grade: National tenants, listed tenants,
franchisees and medium to large professional
firms. These include, inter alia, Debonairs
Pizza, Fishaways, John Dory’s, Mikes Kitchen,
Rage Distribution, Torga Optical, UCS Group,
Vodacom and Wimpy.
“C” grade: Other tenants comprise all other
tenants that do not fall into the above two
categories.

emira property fund annual report 2008
5
Portfolio summarycontinued
Lease expiry profile by sector (% of GLA)
1,41,4
12,6 7,3
6,66,9 5,4
4,66,6 5,4
7,64,1 9,3
3,1 3,5 2,7
4,0
7,4
O�ces Retail Industrial
Year 5+
Year 4
Year 3
Year 2
Year 1
Vacant
Lease expiry profile (% of GLA)
Year 5+
Year 4
Year 3
Year 2
Year 1
Vacant
21,0
9,3
16,6
18,9
27,4
6,8
Lease expiry profile by sector (% of revenue)
O�ces Retail Industrial
10,5
8,8
8,2
4,2
8,7
16,5
8,4
8,4
5,2
4,2
5,4
2,8
3,1
1,5
3,9
Year 5 +
Year 4
Year 3
Year 2
Year 1
vacancy profile by sector (% of GLA)
O�ces Retail Industrial
3,1
3,8
4,0
5,6
4,4
9,8
9,8
9,0
10,7
9,6
4,5
2,6
3,1
2,8
4,0
June 2008
March 2008
December 2007
September 2007
June 2007
Weighted average lease escalation by sector (%)
8,0
9,2
9,5
Industrial
Retail
O�ces
vacancy profile (% of GLA)
5,5
6,3
6,8
5,9
5,9
December 2007
March 2008
June 2008
September 2007
June 2007
Average annualised yield achieved by the portfolio was 9,8%
6emira property fund annual report 2008
Manager’s report
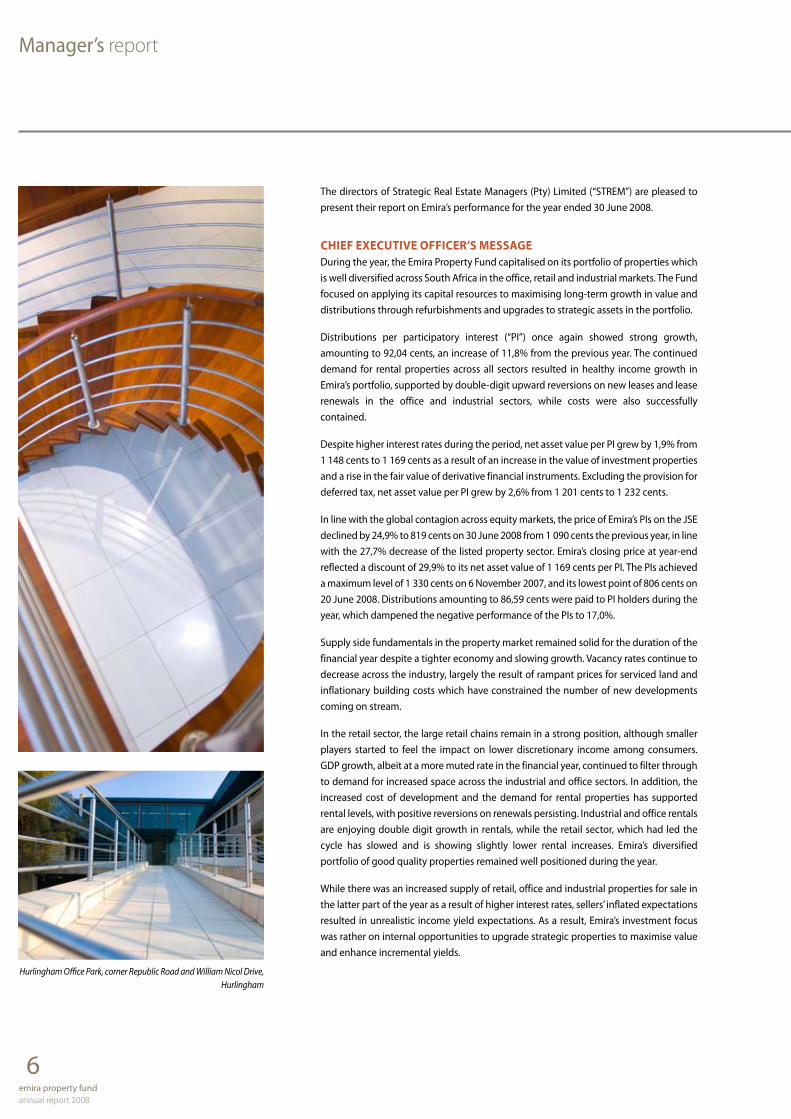
The directors of Strategic Real Estate Managers (Pty) Limited (“STREM”) are pleased to present their report on Emira’s performance for the year ended 30 June 2008.
CHIEF ExECUTIvE oFFICER’S MESSAGEDuring the year, the Emira Property Fund capitalised on its portfolio of properties which is well diversified across South Africa in the office, retail and industrial markets. The Fund focused on applying its capital resources to maximising long-term growth in value and distributions through refurbishments and upgrades to strategic assets in the portfolio.
Distributions per participatory interest (“PI”) once again showed strong growth, amounting to 92,04 cents, an increase of 11,8% from the previous year. The continued demand for rental properties across all sectors resulted in healthy income growth in Emira’s portfolio, supported by double-digit upward reversions on new leases and lease renewals in the office and industrial sectors, while costs were also successfully contained.
Despite higher interest rates during the period, net asset value per PI grew by 1,9% from 1 148 cents to 1 169 cents as a result of an increase in the value of investment properties and a rise in the fair value of derivative financial instruments. Excluding the provision for deferred tax, net asset value per PI grew by 2,6% from 1 201 cents to 1 232 cents.
In line with the global contagion across equity markets, the price of Emira’s PIs on the JSE declined by 24,9% to 819 cents on 30 June 2008 from 1 090 cents the previous year, in line with the 27,7% decrease of the listed property sector. Emira’s closing price at year-end reflected a discount of 29,9% to its net asset value of 1 169 cents per PI. The PIs achieved a maximum level of 1 330 cents on 6 November 2007, and its lowest point of 806 cents on 20 June 2008. Distributions amounting to 86,59 cents were paid to PI holders during the year, which dampened the negative performance of the PIs to 17,0%.
Supply side fundamentals in the property market remained solid for the duration of the financial year despite a tighter economy and slowing growth. Vacancy rates continue to decrease across the industry, largely the result of rampant prices for serviced land and inflationary building costs which have constrained the number of new developments coming on stream.
In the retail sector, the large retail chains remain in a strong position, although smaller players started to feel the impact on lower discretionary income among consumers. GDP growth, albeit at a more muted rate in the financial year, continued to filter through to demand for increased space across the industrial and office sectors. In addition, the increased cost of development and the demand for rental properties has supported rental levels, with positive reversions on renewals persisting. Industrial and office rentals are enjoying double digit growth in rentals, while the retail sector, which had led the cycle has slowed and is showing slightly lower rental increases. Emira’s diversified portfolio of good quality properties remained well positioned during the year.
While there was an increased supply of retail, office and industrial properties for sale in the latter part of the year as a result of higher interest rates, sellers’ inflated expectations resulted in unrealistic income yield expectations. As a result, Emira’s investment focus was rather on internal opportunities to upgrade strategic properties to maximise value and enhance incremental yields.
Hurlingham Office Park, corner Republic Road and William Nicol Drive, Hurlingham

7emira property fund
annual report 2008
Manager’s reportcontinued
Emira invested a total of approximately R330 million in its property portfolio during the financial year, opting to focus on refurbishments and upgrades. Based on the Fund’s well established pool of assets, which are in good locations, Emira chose the route of adding value through reinvestments. Major refurbishments included, among others, Lake Buena Vista in Centurion; the Quagga Shopping Centre in Pretoria West and the Granada Centre in Umhlanga Rocks.
A further highlight of the year under review was Emira’s replacement of R650 million of bank-sourced debt with funds raised in the capital market. With the tangible benefit of a R2 million reduction in annual interest costs to the Fund, the move is strategically significant due to the introduction of an additional source of funding for growth. Emira now has the ability to raise capital through equity markets, traditional mortgages as well as the debt capital market, the first Property Unit Trust (“PUT”) to do so in South Africa. The Fund will therefore better be able to optimise capital raised, depending on prevailing market conditions. Based on the quality of its properties and tenants, as well as the conservative covenants in place, the income streams from the ring-fenced portfolio of 36 properties were independently rated AAA, resulting in the meaningful saving on interest charges for the debt.
PRoSPECTS ANd oUTLookEmira will continue to evaluate investment opportunities as prices in the physical market correct to reflect the underlying fundamentals. Softening property prices could deliver value adding opportunities for the Fund, especially as sellers’ expectations become more realistic. In line with the clearly defined, limited mandate from the board, the managers will also continue to appraise opportunities to invest in vacant land or buildings where returns compensate for inherent risks. As a result of the higher cost of capital and debt, the manager anticipates that earnings enhancing capital projects will be less plentiful than in 2008.
A recent change in legislation pertaining to Collective Investment Schemes in Property has permitted investments in other listed South African property funds. This could present yield enhancing investment opportunities, especially should there be continued pressure on local listed property prices.
The current financial contagion in the developed markets of Western Europe and North America is expected to result in growth in those economies slowing in 2008 and 2009. This is expected to have a lagged impact in the markets in which the fund operates. Nonetheless, growth in the South African economy, although at a more muted rate than in the past few years, continues to provide some support for rental demand, particularly in the office and commercial environments. Simultaneously, the supply side fundamentals of the property market complement Emira’s well established and diversified property portfolio with its extensive tenant base. The manager anticipates that rentals will remain relatively healthy with stable vacancies, although the retail sector could come under further pressure as a result of high interest rates, food and fuel prices. The STREM board remains confident that the Fund will continue to show strong growth in distributions for the forthcoming year ending 30 June 2009.

8emira property fund annual report 2008
Manager’s reportcontinued
1. THE SoUTH AFRICAN PRoPERTY MARkET
1.1 South African listed property sector
1.1.1 Total returns to June 2008 During the 12 months to June 2008, overall equity markets have been volatile,
with total returns of 9,8% for the JSE All Share Index and –8,9% for the JSE FINDI 30 Index.
Compound annual returns to 30 June 2008 (Pre-tax)
Period All Share FINDI 30 PLSs PUTs R 153% % % % %
1 year 9,8 (8,9) (19,1) (23,2) (3,0)
3 year 30,4 18,5 14,7 6,2 2,4
5 year 30,4 25,0 19,9 13,9 5,6
10 year 16,9 9,4 16,9 14,1 9,0
Source: Inet-Bridge
Over the same period the Property Loan Stock (“PLS”) index and Property Unit Trust (“PUT”) decreased by –19,1% and –23,2% respectively.
1.1.2 The listed property and bond yield differential Capital values on the listed property sector showed a negative
performance of (27,7%) during the 12 months ended 30 June 2008. The weakness in the sector since January 2008 wiped out all the gains made since July 2006, with the sector showing a (0,6%) return on a two year time horizon. Listed property funds, on average, showed strong double digit weighted distribution growth for the 12 months ended 30 June 2008. Despite the uncertain local economic outlook, market expectations for listed property sector distribution growth remain at double digits, albeit at slightly lower levels than in 2008.
As a result of uncertainty across financial markets, weakening bond yields and the loss of capital value in the listed property sector, both locally and internationally, the differential between the historic listed property yield and the R157 narrowed to (0,9%) at 30 June 2008, from (2,4%) in July 2007. This weakness suggests that the market is discounting slightly slower growth in listed property distributions as tighter economic conditions take effect.
1.2 South African physical property market The weakness in equity markets and the listed property sector did
not materially filter through to the physical property market due to strong supply side fundamentals and increasing demand for
space. While the retail sector has felt some pressure from the impact of higher interest rates and inflation on consumers, the economy
continues to show growth which is supporting the physical office and industrial markets. The scarcity of vacant serviced land and inflationary pressures on building costs continue to translate into demand for rental space.
Listed property index
150
200
250
300
350
400
450
Apr 2008Jan 2008Oct 2007Jul 2007Apr 2007Jan 2007Oct 2006Jul 2006
Source: Inet-Bridge
The R 157 and the property yield differential
-3%-2%-1%0%1%2%3%4%5%6%
6%7%8%9%10%11%12%13%14%15%
200820072006200520042003200220012000
Di�erential Long bond (R 157)
Source: Inet-Bridge

9emira property fund
annual report 2008
Manager’s reportcontinued
The Investment Property Databank’s (IPD) South Africa Annual Property Index, which measures ungeared total returns to direct property investments, showed a return of 27,7% in 2007, slightly ahead of the 2006 overall property return of 27,1%.
The performance in 2007 reflected the second highest annual return since the index was initiated in 1995. These returns consisted of strong capital growth of 17,7%, from 16,5% in 2006. Net income growth of 17,6% was reported, the highest since 1997. The sharp capital growth resulted in lower net income yields of 7,6% at year-end.
For the second consecutive year, the industrial property sector led the pack with a return of 33,6%, from 31,4% in 2006. The office sector delivered increased returns of 30,8% in 2007 from 25,0% the previous year, while higher interest rates and oil prices impacting consumer demand started to filter into the retail sector whose return slowed to 26,0% from 27,7% a year earlier.
Across all sectors of the property market, income returns continued to trend downwards during 2007, due to the continued high levels of underlying capital growth in property values.
IPD total returns for 2007
Total return
%
Income return(2006)
%
Capital growth(2006)
%
All property 27,7 (27,1) 8,6 (9,2) 17,7 (16,5)
Retail 26,0 (27,7) 8,0 (8,4) 16,8 (17,9)
Offices 30,8 (25,0) 9,6 (10,3) 19,5 (13,4)
Industrial 33,6 (31,4) 10,3 (10,9) 21,3 (18,7)
Other 25,0 (21,9) 10,3 (10,3) 13,5 (10,6)
Source: IPD
Total returns % annualised
PeriodRetail
%Offices
%Industrial
%All property
%
1 year 26,0 30,8 33,6 27,7
3 year 28,8 27,0 32,5 28,3
5 year 25,9 21,0 27,8 24,6
10 year 18,9 13,9 16,8 17,0
13 years 18,9 13,5 16,6 16,7
Source: IPD
Vacancy rates across the property market continued to trend downwards as a result of increasing demand. Overall vacancies reached a low point of 3,1% at the end of 2007 from 4,5% in 2006 and the high of 12,8% in 2002.
From a global perspective, the higher total returns in South Africa in 2007 were in line with current trends in Australia, New Zealand, South Korea and several European countries. Despite these higher returns, South African income yields exceed the global average.
Quagga Centre, cnr Church Street and West Street, Pretoria West
10emira property fund annual report 2008
Manager’s reportcontinued
2. EMIRA’S PERFoRMANCE ANd PRoPERTY PoRTFoLIo
2.1 Emira’s performance and tradeability on the jSE In line with the weakness across both the local and international listed property
markets, during the year ended 30 June 2008, the price of Emira’s PIs declined by 24,9% from 1 090 cents to 819 cents at the end of the period. Total distributions paid during the year, amounting to 86,59 cents, dampened the negative return by 7,9% to 17,0%.
142,7 million PIs traded during the year ended 30 June 2008, representing 29% of the weighted average number of PIs in issue.
2.2 Performance relative to the IPd index According to the 2007 IPD index, which aggregates the capital and income of
listed and unlisted portfolios to provide a measure of total annual performance, Emira achieved a return of 38,9%, representing the third consecutive year for which the Fund has delivered returns in excess of 38%. This reflects a significant outperformance on the 26,9% and 26,7% increase recorded by the IPD South Africa Listed Funds Benchmark and the IPD Universe respectively.
Emira traded at a higher income return of 9,1% compared to its listed benchmark. In addition, the Fund’s capital growth of 27,6% exceeded the listed benchmark’s measure of 17,0% for 2007.
2.3 Portfolio exposure In line with Emira’s strategic objectives to maintain a balanced exposure to retail,
office and industrial properties and to optimise net income and growth in distributions, the assets in the Fund’s portfolio are of a high quality and continue to meet its objectives to deliver sustainable growth in income and to diversify risk. The broad geographic footprint of the portfolio with its base of more than 4 000 tenants provides the Fund with further diversification benefits.
At 30 June 2008, Emira’s property consisted of 164 properties, with a total GLA of 1 188 367 m2, which was valued at R7,5 billion, translating into an average value of R45,7 million per property.
Management is committed to continuously increasing Emira’s investor appeal, and consequently its market capitalisation and liquidity by growing the property portfolio. Maximising returns necessitates active management of the portfolio, acquiring new properties which meet the investment criteria and reinvesting to add value to core properties, while disposing of non-performing or potentially under-performing properties. Five properties were disposed of and transferred out of the Fund during the year for a total consideration of R170,5 million, representing a forward exit yield of 6,5% and a premium of 71% to book value. The Fund has also reached agreement to dispose of a further two non-core properties, one of which has been transferred subsequent to year-end, while the other transaction is still suspensive on certain conditions. Acquisitions totalling R97,1 million in respect of three properties were completed at an average income yield of 9,5%. In addition, total refurbishments of R231,8 million were completed on ten properties at a yield of 11,4% during the year. The board has approved further investments of R75,8 million at an estimated yield of 9,3%.
A detailed breakdown of Emira Property Fund’s portfolio is disclosed on page 62.
Knightsbridge Manor, 33 Sloane Street, Bryanston

11emira property fund
annual report 2008
Manager’s reportcontinued
3. oFFICE PoRTFoLIo
3.1 Market conditions The IPD reported that the office sector, which traditionally
lags retail and industrial performance, showed a total return of 30,8% in 2007, underpinned by record levels of capital growth, at 19,5%.
Increased cyclical output in both financial and business sectors of the economy continues to underpin the performance of the office rental market, driven by expansion of existing companies and demand from new entities for office space. Notably, office vacancy rates, at 5,4% for 2007, were at their lowest levels since the late 1990s and their peak of 23% in 2002. Higher demand was experienced for A-grade office space with vacancy levels below 4,0% in 2007.
In contrast, new office space has been slow in coming onstream despite strong economic demand. Scarcity of vacant land, delays in obtaining regulatory approvals and inflating building costs are impacting decisions to embark on new construction projects.
Developments are concentrated in nodes including Sandton, Centurion, Midrand, Woodmead, Melrose/Waverley, Umhlanga/La Lucia, Highveld Technopark and Pretoria East. Recent years have seen offices outside of Gauteng, Western Cape and KwaZulu-Natal producing very strong returns.
The approval of increased bulk rights close to prospective Gautrain stations is resulting in extensive redevelopment and upgrade opportunities for office developments in Sandton, Rosebank and Centurion.
3.1.1 SAPOA office vacancies and development SAPOA office vacancies continued to show a declining trend, dropping from
6,2% or 778 795 m2 in June 2007 to 4,9% or 642 542 m2 in June 2008.
3.2 Emira’s portfolio
3.2.1 Exposure At 30 June 2008, Emira’s office portfolio was valued at R3,5 billion and comprised
46% of the Fund’s total investment properties by value. The Fund owns 73 office buildings, with total GLA of 444 676 m2 and an average value of R47,5 million.
office vacancy rates and net income growth
-6%
0%
6%
12%
18%
24%
30%
-3%
0%
3%
6%
9%
12%
15%
20072004200119981995
2,5 3,0
10,2
14,016,9
18,8
23,622,2
17,0
7,710,6
5,4
O�ce vacancy rates Net income growth
11,3
Source: IPD
office vacancy rates and total new development
0
200 000
400 000
600 000
800 000
1 000 000m2
0%
3%
6%
9%
12%
15%
2008200720062005200420032002
Total development Total vacancies
Source: SAPOA
12emira property fund annual report 2008
Manager’s reportcontinued
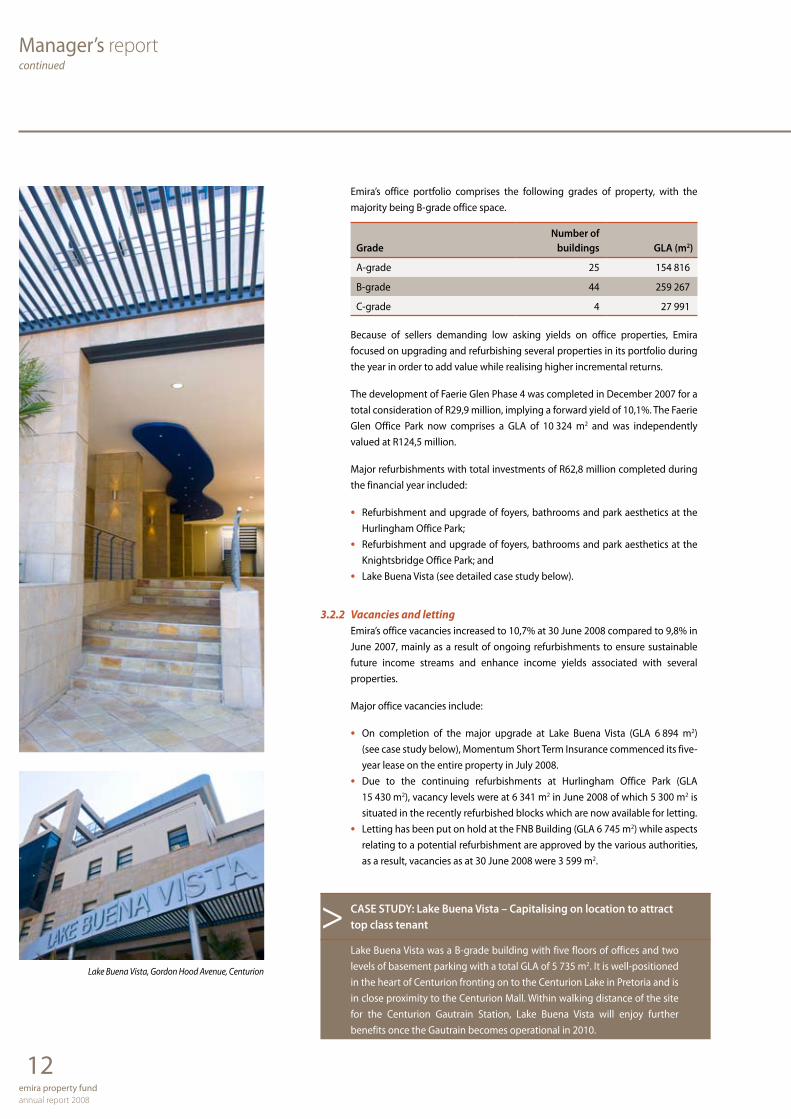
Emira’s office portfolio comprises the following grades of property, with the majority being B-grade office space.
GradeNumber of
buildings GLA (m2)
A-grade 25 154 816
B-grade 44 259 267
C-grade 4 27 991
Because of sellers demanding low asking yields on office properties, Emira focused on upgrading and refurbishing several properties in its portfolio during the year in order to add value while realising higher incremental returns.
The development of Faerie Glen Phase 4 was completed in December 2007 for a total consideration of R29,9 million, implying a forward yield of 10,1%. The Faerie Glen Office Park now comprises a GLA of 10 324 m2 and was independently valued at R124,5 million.
Major refurbishments with total investments of R62,8 million completed during the financial year included:
Refurbishment and upgrade of foyers, bathrooms and park aesthetics at the •Hurlingham Office Park; Refurbishment and upgrade of foyers, bathrooms and park aesthetics at the •Knightsbridge Office Park; and Lake Buena Vista (see detailed case study below).•
3.2.2 Vacancies and letting Emira’s office vacancies increased to 10,7% at 30 June 2008 compared to 9,8% in
June 2007, mainly as a result of ongoing refurbishments to ensure sustainable future income streams and enhance income yields associated with several properties.
Major office vacancies include:
On completion of the major upgrade at Lake Buena Vista (GLA 6 894 m• 2) (see case study below), Momentum Short Term Insurance commenced its five-year lease on the entire property in July 2008. Due to the continuing refurbishments at Hurlingham Office Park (GLA •15 430 m2), vacancy levels were at 6 341 m2 in June 2008 of which 5 300 m2 is situated in the recently refurbished blocks which are now available for letting.Letting has been put on hold at the FNB Building (GLA 6 745 m• 2) while aspects relating to a potential refurbishment are approved by the various authorities, as a result, vacancies as at 30 June 2008 were 3 599 m2.
> CASE STUDY: Lake Buena Vista – Capitalising on location to attract top class tenant
Lake Buena Vista was a B-grade building with five floors of offices and two levels of basement parking with a total GLA of 5 735 m2. It is well-positioned in the heart of Centurion fronting on to the Centurion Lake in Pretoria and is in close proximity to the Centurion Mall. Within walking distance of the site for the Centurion Gautrain Station, Lake Buena Vista will enjoy further benefits once the Gautrain becomes operational in 2010.
Lake Buena Vista, Gordon Hood Avenue, Centurion

13emira property fund
annual report 2008
Manager’s reportcontinued
The previous anchor tenant of the property vacated the premises in April 2007 and Emira was faced with the decision of whether to refurbish the building or let it at a lower rental in its existing condition. No significant improvements had been made to the property since August 2003.
Investigations indicated that with an investment of approximately R30 million, the building could be upgraded to A-grade offices and that by adding parking and other improvements would attract a better quality tenant with the benefit of improved rental rates. While SAPOA statistics indicated a shortage of A-grade offices in the area, an excess supply of B-grade office space existed which strengthened Emira’s case for the investment. Based on the merits of the proposed upgrade and its potential to attract blue-chip tenants, the board of Emira approved the project on risk, that is, without a tenant in hand.
The upgrade, completed in July 2008, increased the total rentable area by 20,2% to 6 894 m2 by converting various balconies to office space and reducing the ratio of common space relative to the usable space of the building. In addition, the parking ratio was improved from 2,3 bays per 100 m2 to 4,4 bays per 100 m2 by converting the ground floor to parking. Double digit incremental returns on the investment were attributable to the combined impact of the office grade enhancement and the increased rentable area. On completion of the upgrade, Emira successfully concluded a five-year lease with Momentum Short Term Insurance for the entire building.
4. RETAIL PoRTFoLIo
4.1 Market conditions Although the retail sector, which generally leads the commercial
property cycle, experienced strong total returns of 26,0% in 2007, these are in a downward trend.
During 2007, the retail sector was particularly influenced by higher interest rates and the introduction of the National Credit Act. Rampant food and fuel prices had a further dampening effect on discretionary income since the beginning of 2008, with retail sales consistently trending down since the beginning of 2007.
Despite this, net income growth for 2007 remained above inflation, supported by decreasing vacancies which reached their lowest levels in 10 years. Vacancy rates for 2007 were 2,3%, equalling levels last seen in 1997.
4.2 Emira’s portfolio
4.2.1 Exposure At 30 June 2008, Emira’s retail portfolio was valued at R2,7 billion and
comprised 36% of the Fund’s total investment properties by value. The Fund owns 41 shopping centres, with total GLA of 378 293 m2 and an average value of R65,8 million.
Retail vacancy rates and net income growth
0%
1%
2%
3%
4%
5%
6%
7%
-5%
0%
5%
10%
15%
20%
25%
20072004200119981995
2,32,9
4,3
5,2
6,25,9
6,5
4,6
3,83,5
2,3
0,60,4
Retail vacancy rates Net income growth
Source: IPD

14emira property fund annual report 2008
Manager’s reportcontinued
Investments made by Emira in its retail portfolio during the year, were focused on improvements rather than the acquisition of new properties, due to purchase prices remaining inflated.
The Fund invested R26,3 million in one completely new development, namely the Wonderpark Builder’s Express with a total GLA of 3 948 m2. It was completed in May 2008 and is located on the same site as the Wonderpark Shopping Centre, north of Pretoria.
Major refurbishments and extensions with total value of R148,5 million were completed during the financial year:
Property LocationValue(Rm) Completion date
Tramshed Pick n Pay Pretoria CBD 10,4 November 2007
Wonderpark Caltex refurbishment Akasia, Pretoria North 6,8 February 2008
Lynnridge Mall Extension
Lynnwood Ridge, Pretoria 17,5 May 2008
Wonderpark upgrade for major tenants Akasia, Pretoria North 9,6 May 2008
Quagga Extensions Pretoria West 91,9 June 2008
Epsom Downs Shopping Centre
William Nicol, Bryanston 11,3 June 2008
4.2.2 Vacancies and letting Emira’s retail vacancies increased to 4,4% at 30 June 2008 compared to 3,1% in
June 2007, as a result of increased refurbishments in progress at year-end.
Major retail vacancies include:
Ongoing construction at the Granada Centre in Umhlanga Rocks (GLA 5 818 m• 2) with completion due in March 2009. Vacancies of 1 301 m• 2 at the WorldWear Fashion Mall (GLA 13 629 m2) resulted during the remodelling and relocation of smaller tenants to accommodate the larger tenancy of Pick n Pay. Vacancies at the Quagga Shopping Centre (GLA 29 748 m• 2) in Pretoria decreased to 969 m2 as the extensions reached completion.
> CASE STUDY: Wonderpark Shopping Centre – Incremental investment to secure blue-chip retailers
Wonderpark Shopping Centre is located in the suburb of Akasia in Pretoria North and services the nodes of Akasia, Soshanguve and Rosslyn.
The centre is the largest property, both by value and GLA, in Emira Property Fund’s portfolio. It was acquired in September 2006, on completion of a significant redevelopment completed by Momentum in 2005. The upgrade entailed increasing the GLA from 36 564 m2 to 59 702 m2 which enabled the total number of tenants at the centre to increase from 68 to 135.
Wonderpark Shopping Centre, corner Brits Road and Heinrich Avenue, Karenpark

15emira property fund
annual report 2008
Manager’s reportcontinued
In June 2007, the Fund was approached by Mr Price Sports to open a store at the centre. At the same time national retailing chains Truworths, Markham and Foschini, requested extensions to their existing stores while increasing their brand exposure in the centre. The long-term benefits included enhancing the appeal of Wonderpark Shopping Centre among consumers.
On evaluation of the opportunity, Emira concluded that with a relatively small investment of R10,0 million for the extensions totalling 3 143 m2, a double digit incremental return would be achieved. In addition, the increased rental income from these national tenants would enhance the quality of the Fund’s income stream.
In addition to the extensions for these national tenants, several smaller stores were relocated to facilitate the upgrade. The extensions were completed in May 2008, with the tangible benefits of these investments including longer term leases to higher quality tenants which will also improve foot traffic.
5. INdUSTRIAL PoRTFoLIo
5.1 Market conditions SAPOA reported that the industrial sector produced the highest
property returns in 2007, with a total return of 33,6%, underpinned by capital growth of 21,3%.
The significant increase in retail sales which brought about greater demand for warehousing and distribution space, as well as increased activity in the manufacturing sector supported the sector’s performance. Income growth remained solid during 2007, as a result of the continued shortage of industrial developments to meet economic demand for both distribution and the manufacturing sector.
Underlying property fundamentals continue to support the industrial sector with vacancies at 2,2%, a ten year low. At the same time, record gross rentals and net income rates per m2 have been reported by IPD.
In 2007 industrial warehouses once again produced the highest returns of the industrial sector at 35,9%. This was followed by high tech industrials and standard industrial units. Light manufacturing lagged the other property types.
5.2 Emira’s portfolio
5.2.1 Exposure At 30 June 2008, Emira’s industrial portfolio was valued at R1,3 billion and
comprised 18% of the Fund’s total investment properties by value. The Fund owns 50 industrial properties, with total GLA of 365 397 m2 and an average value of R26,6 million.
Industrial vacancy rates and net income growth
0%
2%
4%
6%
8%
10%
12%
14%
-6%
-3%
0%
3%
6%
9%
12%
15%
20072004200119981995
5,3
7,9
9,6
10,9
12,3
10,4
6,5
2,63,3
2,23,1
0,70,4
Industrial vacancy rates Net income growth
Source: IPD
16emira property fund annual report 2008
Manager’s reportcontinued
5.2.2 Vacancies and letting Emira’s industrial vacancies increased to 4,5% at 30 June 2008.
Major industrial vacancies include:
Goodyear Tycon (GLA 5 870 m• 2) which was vacated by the single tenant on expiry and negotiations are continuing with prospective tenants to let this space;One Highveld (GLA 6 012 m• 2) is an industrial property with a relatively high proportion of office space which accounts for 1 400 m2 of the total vacancy of 1 815 m2; andCambridge Park (GLA 12 788 m• 2) 1 528 m2 became fully let to Puma from July 2008.
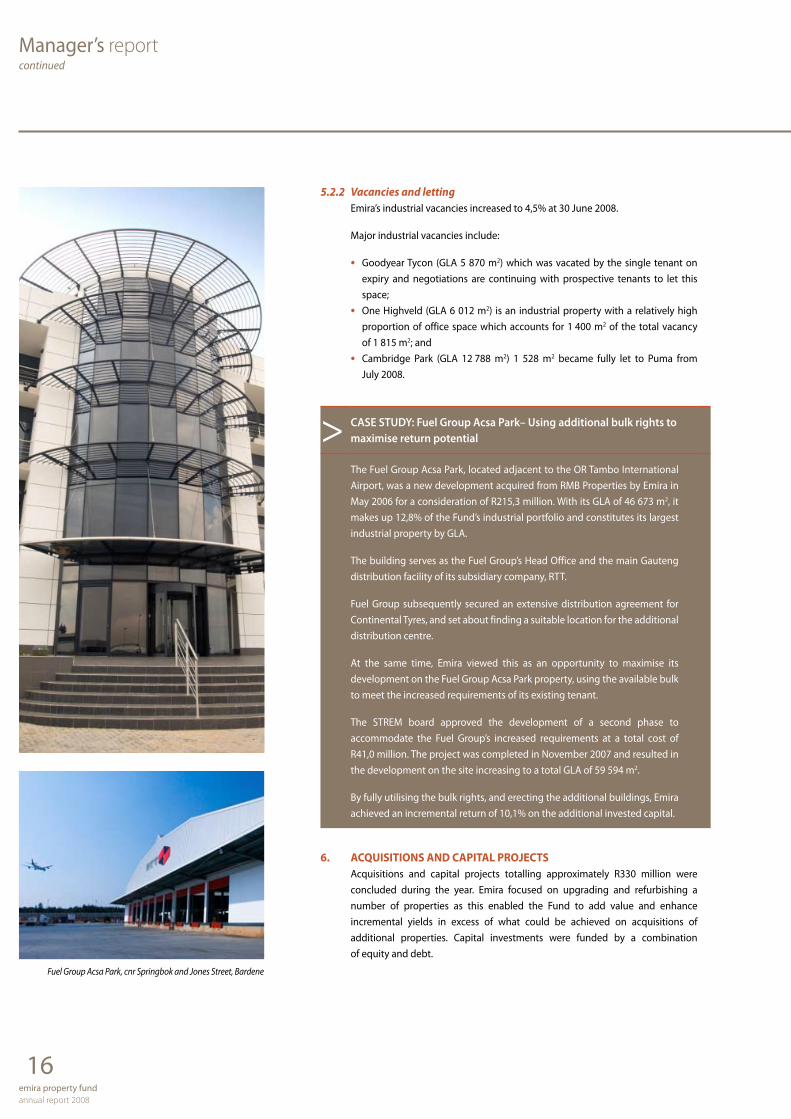
> CASE STUDY: Fuel Group Acsa Park– Using additional bulk rights to maximise return potential
The Fuel Group Acsa Park, located adjacent to the OR Tambo International Airport, was a new development acquired from RMB Properties by Emira in May 2006 for a consideration of R215,3 million. With its GLA of 46 673 m2, it makes up 12,8% of the Fund’s industrial portfolio and constitutes its largest industrial property by GLA.
The building serves as the Fuel Group’s Head Office and the main Gauteng distribution facility of its subsidiary company, RTT.
Fuel Group subsequently secured an extensive distribution agreement for Continental Tyres, and set about finding a suitable location for the additional distribution centre.
At the same time, Emira viewed this as an opportunity to maximise its development on the Fuel Group Acsa Park property, using the available bulk to meet the increased requirements of its existing tenant.
The STREM board approved the development of a second phase to accommodate the Fuel Group’s increased requirements at a total cost of R41,0 million. The project was completed in November 2007 and resulted in the development on the site increasing to a total GLA of 59 594 m2.
By fully utilising the bulk rights, and erecting the additional buildings, Emira achieved an incremental return of 10,1% on the additional invested capital.
6. ACQUISITIoNS ANd CAPITAL PRojECTS Acquisitions and capital projects totalling approximately R330 million were
concluded during the year. Emira focused on upgrading and refurbishing a number of properties as this enabled the Fund to add value and enhance incremental yields in excess of what could be achieved on acquisitions of additional properties. Capital investments were funded by a combination of equity and debt.
Fuel Group Acsa Park, cnr Springbok and Jones Street, Bardene
17emira property fund
annual report 2008
Manager’s reportcontinued
6.1 Acquisitions completed during 2008 financial year but yet to be transferred
Property Sector LocationGLA(m2)
Purchaseprice
(Rm)Forward
yield Effective date Key tenants
TIS Corporate Park Office Midrand 15 184 90,1 8,0% September 2008 TIS
6.2 Developments completed during 2008 financial year
Property Sector LocationGLA(m2)
Purchaseprice
(Rm)Forward
yield Effective date Key tenants
Fuel Group – Phase 2 Industrial Bartlett 12 921 41,0 10,1% November 2007 Fuel Group
Faerie Glen – Phase 4 Office Pretoria 2 046 29,9 10,1% December 2007VIP Payroll
Solutions
Wonderpark – Builders Express Retail Akasia 2 483 25,1 8,1% May 2008
Builders Express
6.3 Capital expenditure projects completed
Property Sector LocationGLA(m2)
Purchaseprice
(Rm) Effective date Key tenants
Fuel Group – Extension to Phase 1 Industrial Centurion 5 624 20,5 July 2007 Fuel Group
Fleetway Refurbishment Office Cape Town CBD 7 111 2,7 October 2007 Various
Tramshed Pick n Pay Retail Pretoria CBD 13 107 9,0 November 2007 Pick n Pay
Wonderpark – Caltex Refurbishment Retail Akasia 422 6,2 January 2008 Chevron
Epsom Downs Re-build Retail Bryanston 6 747 11,3 May 2008 Nedbank
Knightsbridge Office Park Refurbishment Office Bryanston 9 589 8,0 May 2008 Various
Lynnridge Mall Extension Retail Lynnwood Ridge 440 17,5 May 2008 Mr Price
Wonderpark Nationals Retail Akasia 3 143 9,6 May 2008Foschini,
Truworths
Hurlingham Office Park Refurbishment Office Hurlingham 15 430 17,8 June 2008 Various
Lake Buena Vista Refurbishment Office Centurion 6 169 34,3 June 2008 Momentum STI
Quagga Extensions Industrial Pretoria West 9 941 91,9 June 2008 Woolworths
6.4 Capital expenditure projects in progress
Property Sector LocationGLA(m2)
Value(Rm)
Expected completion date Key tenants
Southern Life Plaza – FNB Office Bloemfontein 1 246 3,4 August 2008First National
Bank
WorldWear Pick n Pay Retail Fairlands 450 16,9 September 2008 Pick n Pay
Woodmead Office Park Refurbishment Office Woodmead 17 534 11,2 September 2008 Various
Tramshed Virgin Active Retail Pretoria CBD 13 107 4,5 November 2008 Virgin Active
Granada Centre Refurbishment Retail Umhlanga Rocks 7 318 39,9 March 2009 Various

18emira property fund annual report 2008
Manager’s reportcontinued
7. dISPoSALS Two properties which were considered non-core were sold during the year under
review, but were awaiting transfer at year-end. Kuehne & Nagel was transferred on 15 July 2008 and Barvic House on 30 September 2008.
7.1 Awaiting transfer out of Emira
Property Sector Location GLA (m2)
Valuation on30 December
2007 (Rm)Sale price
(Rm)Yield
(%)
Barvic House Office Randburg, Gauteng 3 322 11,3 10,1 5,2
Kuehne & Nagel Office Berea, Durban 2 140 5,3 8,8 10,4
In addition, five properties which were sold in the previous financial year were transferred out of Emira during the year ended 30 June 2008. The proceeds received from disposals were used to fund capital expenditure and repay debt.
7.2 Transferred out of Emira in 2008 financial year
Property Sector Location GLA (m2)
Valuation on30 December
2006 (Rm)Sale price
(Rm)Yield
(%)
Contact Centre OfficesParktown,
Johannesburg 1 184 6,9 9,0 6,4
Inspectorate OfficesOrmonde,
Johannesburg 2 704 6,2 7,3 9,3
11 Park Lane OfficesParktown,
Johannesburg 3 676 16,4 20,5 7,4
Fourways Game Retail Fourways, Sandton 8 000 58,1 119,7 6,0
Wierda Gables Offices Sandown, Sandton 2 007 11,9 14,0 8,0
* The valuations as at December 2006 have been used to reflect the premium to book value
realised by the Fund on disposal. Valuations as at June 2007 reflected the disposal prices and
therefore no premium to book value would have been evident.
Management continually evaluates properties to ensure that the portfolio is optimised, and buildings are disposed of where these investments are found to fall outside Emira’s investment criteria, risk profile and return requirements.
8. vALUATIoNS ANd NET ASSET vALUE The Fund has elected to have independent valuations of its entire portfolio at
least every three years. To achieve this, independent valuers value approximately one-third of the portfolio each year. These valuations are included as part of the Fund’s overall portfolio movement below.
As a result of advantageous renewals and rising rentals in the office and industrial portfolios, property values rose in both sectors. In contrast, retail properties experienced a mixed performance. The Fund’s smaller properties in outlying areas continued to benefit from good rental growth, the capital expenditure at several of the centres was value enhancing, however, certain of the neighbourhood and convenience centres were impacted by the deteriorating retail conditions.

19emira property fund
annual report 2008
Manager’s reportcontinued
8.1 Total portfolio movement
June 2007 June 2008 Difference Difference
Sector (R’000) R/m2 (R’000) R/m2 (%) (R’000)
Offices 3 317 664 7 409 3 467 316 7 864 4,5 149 652
Retail 2 784 378 7 433 2 695 890 7 126 (3,2) (88 488)
Industrial 1 212 700 3 414 1 328 230 3 635 9,5 115 530
Total 7 314 742 7 491 436 176 694
Net asset value grew from 1 148 cents to 1 169 cents (1 232 cents excluding the deferred tax provision), representing growth of 1,9%. This is the result of growth in the value of the portfolio, as well as gains in the fair value of derivatives.
9. GEARING Emira engaged FirstRand Bank Limited to assist the Fund in accessing the debt capital
markets, thereby reducing its overall cost of funding.
On 28 March 2008, the Fund undertook a commercial mortgage backed securitisation (“CMBS”), whereby it issued five-year notes to Rand Merchant Bank (“RMB”) amounting to R650 million. The proceeds received were used to repay existing loans received from RMB. The securitisation enabled the Fund to reduce the margin payable on these loans from 125 basis points to 93 basis points (including amortised securitisation costs). The notes attract interest at the three-month JIBAR rate. Existing interest rate swaps that were already in place prior to the securitisation have been novated to RMB which has resulted in an average all in fixed rate of 9,78% on this loan. These interest rate swaps revert back to Emira in April 2013, whereafter they will continue until their expiry dates. The weighted average cost of the entire debt of the Fund at 30 June 2008, is 9,67%, as per below.
9.1 Rate % TermAmount
(Rm)%
of debt
1. Debt – Fixed 10,21 November 2008 100,0 7,5 – Swap 9,38 December 2014 — —
2. Preference shares – Floating 10,91* January 2012 90,0 6,7
3. Debt – Swap 9,78 April 2013 650,0 48,5
4. Debt – Swap 9,20 June 2013 500,0 37,3
Total 9,67 1 340,0 100,0
Less: Costs capitalised not yet amortised (12,8)
Per balance sheet 1 327,2
*Using a prime rate of 15,5% per annum.
As at 30 June 2008, 93,3% of the Fund’s debt was fixed by way of interest rate swap agreements.
The Fund had a total debt facility of R1,8 billion as at 30 June 2008. Based on total assets of R7,8 billion at 30 June 2008, Emira could increase its gearing levels to a maximum of R4,7 billion, compared to R1,3 billion or 17% at year-end.
During the first half of 2008, amendments to the Collective Investment Schemes Control Act effectively increased the gearing limits on property unit trusts from 30% to 60%.

emira property fund annual report 2008
20
Directorate
dIRECToRS oF THE MANAGEMENT CoMPANY, STRATEGIC REAL ESTATE MANAGERS (PTY) LIMITEd (STREM)
1. benedict james van der Ross (61)
(Non-executive Chairman)
Qualifications: Dip Law
Occupation: Company Director
Mr Van der Ross was admitted to the Cape Bar as attorney in 1970 and practised law for his own account until 1988. He has served as director of various companies including Executive Director for the Urban Foundation and Independent Development Trust.
He was appointed Commissioner to the First Independent Electoral Commission by the State President on the advice of the Transitional Executive Council and subsequently served as Deputy Chief Executive Officer of the Independent Development Trust and acting Chief Executive Officer of South African Rail Commuter Corporation.
He currently serves on a number of boards including those of FirstRand, Naspers, Momentum Group, and is the Chairman of RMB Asset Management.
2. Warren kirkwood Schultze (48)
(Executive Director)
Qualifications: BCom, BAcc, CA (SA)
Occupation: Chief Executive Officer of Eris Property Group (previously RMB Properties)
Prior to joining RMB Properties, Mr Schultze served his articles with Arthur Young and was later appointed Financial Director for two property financing and property trading companies. During this time he gained extensive experience in property asset management, property financing and property trading activities.
He was appointed Chief Operating Officer of RMB Properties in 2000 and Chief Executive Officer in 2004. He was appointed Chief Executive Officer of Eris Property Group on 1 April 2008.
3. james William Andrew Templeton (35)
(Chief Executive Officer)
Qualifications: BCom (Hons), CFA
Occupation: Chief Executive Officer of Strategic Real Estate Managers (Pty) Ltd
Mr Templeton joined RMB Properties in April 2004 as Business Development Executive. Previously he was employed at Barnard Jacobs Mellet Securities as an Equities Analyst for seven years.
He was the top-ranked analyst in the Real Estate sector according to the Financial Mail in 2002 and 2003 and was appointed CEO of STREM in July 2004. Mr Templeton currently also serves as the Deputy Chairman of the Association of the Property Unit Trusts.

emira property fund annual report 2008
21
Directoratecontinued
4. Peter john Thurling (53)
(Chief Financial Officer)
Qualifications: BCom, BAcc, CA (SA)
Occupation: Chief Financial Officer of Strategic Real Estate Managers (Pty) Ltd
Mr Thurling, a chartered accountant with over 20 years’ experience in the property industry, in particular with listed property vehicles. Previously he was the Financial Director of Corovest Property Group and the Chief Financial Officer of Freestone Property Holdings Limited.
5. Michael Simpson Aitken (51)
(Non-executive Director)
Qualifications: BA, LLB
Occupation: Director
Over 20 years’ experience in property-related activity, with specific expertise in asset and fund management related to directly-held and listed property vehicles. He was previously an Executive Director of Freestone Property Holdings Limited. Currently Managing Director of Corovest Property Group and the non-executive Chairman of Hyprop Investments Limited.
6. Liliane Sylvie barnard (43)
(Independent Non-executive Director)
Qualifications: BCom
Occupation: Consultant
Ms Barnard has 20 years’ experience in the asset management industry. She headed the asset management of Old Mutual Properties (Pty) Ltd and has 11 years experience in managing listed property portfolios for Old Mutual Asset Managers (Pty) Ltd. She is now an independent consultant to the listed property industry and its investors.
She is also an independent non-executive director of Redefine Income Fund.
7. bryan Hugh kent (63)
(Independent Non-executive Director)
Qualifications: BCom, FCMA, CA(SA)
Occupation: Director
Mr Kent was previously a partner at Pricewaterhouse. He is presently a financial business consultant with considerable experience in property matters and financial structuring. He was also previously a non-executive director of Freestone Property Holdings Limited and chairman of its audit and risk committee.
He is currently a non-executive director of Set Point Technology Holdings Limited and non-executive director of Cadiz Holdings Limited and CIC Holdings Limited (Namibia).
He is Chairman of Country Bird Holdings which was recently listed on the JSE.

emira property fund annual report 2008
22
Directoratecontinued
8. Nocawe Eustacia Makiwane (49)
(Non-executive Director)
Qualifications: BSocScience (UCT), BA (Hons) Economics (Wits), Executive Leadership Programme (Wharton Business School), MBA (University of Exeter)
Occupation: Managing Director of Avuka Investments
Ms Makiwane has served on the boards of Sentech, National Electricity Regulator and Blitec, a 100% black-owned IT company. Currently she serves as a non-executive director of National Housing Finance Corporation (“NHFC”), a parastatal specialising in whole financing for low-income housing and Rural Housing Loan Fund, a section 21 company focusing on facilitating housing and finance to rural communities in South Africa.
9. Matthys Stefanus benjamin Neser (51)
(Independent Non-executive Director)
Qualifications: BSc (Building Management), MBA
Occupation: Director
Mr Neser has been involved with the Abcon group of companies since 1981 and has acted as Chief Executive Officer for the various companies in the group since the early 1990s. He is active in the residential and commercial property field as well as in other business ventures.
10. Nkululeko Leonard Sowazi (44)
(Non-executive Director)
Qualifications: MA Planning (UCLA)
Occupation: Deputy Chairman of the Tiso Group
Mr Sowazi is the founding deputy Chairman of the Tiso Group, a black empowerment investment company with interests in natural resources, industrial services and investment banking. He is currently a member of the boards of JSE listed Exxaro Resources, Aveng Limited and is a non-executive director of the boards of Grinaker-LTA, Trident Steel (Pty) Ltd, African Explosives Limited, Alstom SA and Improchem. He is also Chairman of Idwala Industrial Holdings, The Home Loan Guarantee Company and the Financial Markets Trust.
Mr Sowazi was previously Executive Deputy Chairman of African Bank Investments Limited and prior to that Managing Director of the Mortgage Indemnity Fund (Pty) Ltd. He also served on the board of Kagiso Trust Investment Company, Kagiso Media and Development Bank of South Africa.

23emira property fund
annual report 2008
Corporate governance
INTRodUCTIoNThe directors of STREM acknowledge the importance of the principles of good corporate governance and support the Code of Corporate Practices and Conduct contained in the King II report and recognise their responsibility in conducting the affairs of Emira with integrity, openness and accountability in accordance with generally accepted corporate practices.
Although Emira is listed on the JSE Limited (“JSE”) and is therefore subject to the code, it is not a legal entity and is regulated in terms of the Collective Investments Schemes Control Act of 2002 (“CISC Act”). Certain requirements of the code are therefore not directly applicable to the Fund. However, the Managers have adopted the principles of the code, being fairness, accountability, responsibility and transparency.
The Fund has complied with the code, where applicable and to the following extent:
THE boARd oF dIRECToRS
StructureAs at 30 June 2008 the board consisted of ten members:
Director Date appointed
Board of directorsnumber of meetings/
attendance
Audit committeenumber of meetings/
attendance
Executive directors
JWA Templeton* (CEO) July 2004 9/9 4/4
WK Schultze* September 2003 9/9 4/4
PJ Thurling (CFO) April 2007 9/8
Non-executive directors
BJ van der Ross*† (Chairman) September 2003 9/7 4/4
MS Aitken April 2007 9/8
LS Barnard† September 2003 9/8
BH Kent** April 2007 9/8 4/3
NE Makiwane* August 2006 9/9 4/4
MSB Neser September 2003 9/8
NL Sowazi August 2006 9/7
* Audit committee** Audit committee chairman† Remuneration committee
The capacity of the directors may be categorised as follows:Executive directors: Messrs JWA Templeton and PJ Thurling are employed by STREM, and remunerated out of the service charge payable by the Fund to STREM. Mr WK Schultze is employed by Eris Property Group.
Non-executive directors: Mr BJ van der Ross is a director of FirstRand Limited and Momentum Group Limited. Mr MS Aitken is employed by Corovest Property Group Holdings (Pty) Limited. Mr NL Sowazi and Ms NE Makiwane represent Emira’s BEE partners.
Independent non-executive directors: Messrs BH Kent, MSB Neser and Ms LS Barnard are not significant holders of Emira participatory interests, as defined in the Code.
The roles of Chairman and Chief Executive Officer are completely separated. The directors have a wide range of skills. The directors of STREM are appointed at the discretion of STREM shareholders.
The board schedules to meet at least four times per year. In addition, eleven asset performance committee meetings were held during the year and were attended by the executive members of the board.
All directors have unrestricted access to the advice and services of the Fund’s secretary and to the Fund’s records, information, documents and property. Non-executive directors also have unfettered access to management at any time. The fund is in the process of developing and implementing a formal orientation procedure and training for new directors.

24emira property fund annual report 2008
Corporate governancecontinued
The board will ensure that it has the expertise, independence and diversity it needs to function independently. Independence of the board from the management team will be achieved by:
maintaining a non-executive chairperson;•maintaining a balance of executive and non-executive directors;•the remuneration of the non-executive directors being unrelated to the financial performance of Emira; and•all directors being entitled to seek independent professional advice concerning the affairs of Emira at the Fund’s expense.•
The board sets the strategic objectives of the Fund and determines the investment and performance criteria as well as being responsible for the proper management, control compliance and ethical behaviour of the business under its direction.
Committees
Audit committeeDuring the year, the audit committee comprised five members of which the Chairman was non-executive. In August 2008, the audit committee was reconstituted to comprise only independent non-executive directors. Accordingly, Messrs BJ van der Ross, WK Schultze and JWA Templeton stepped down from the audit committee and Ms LS Barnard joined the committee. The committee meets at least four times per year with the Fund’s external auditors and executive management as well as the executives responsible for finance, the compliance officer and internal auditors.
The primary objectives of the committee are to provide the board with additional independent and objective assurance regarding the efficacy and reliability of the financial information used by the directors, to assist them in the discharge of their duties. The audit committee is required to provide reasonable assurance to the board that adequate and appropriate financial and operating controls are in place; that significant business, financial and other risks have been identified and are being suitably managed; and that satisfactory standards of governance, reporting and compliance are in operation. The committee also monitors proposed changes in accounting policies, and discusses and advises the board on the accounting implications of major transactions.
The board is responsible for the group’s system of internal and operational control. The executive directors are charged with the responsibility of ensuring that assets are protected, systems operate effectively and all valid transactions are recorded properly. Comprehensive reviews and testing of the effectiveness of the internal control systems in operation are performed by internal auditors, who report to the audit committee. The internal audit function co-ordinates with other internal and external providers of assurance to ensure proper coverage of financial, operational and compliance controls.
The committee has the co-operation of all directors, management and staff and is satisfied that controls and systems within the Fund have been adhered to and, where necessary, improved during the period under review.
Investment committeeAn investment committee comprises at least two executive directors, and four senior staff employed by STREM with the appropriate skills and experience. The committee meets on an ad hoc basis to assess acquisitions and disposals, and makes recommendations to the board.
Remuneration committeeDuring the year a remuneration committee was established as a sub-committee of the board. The committee comprises the Chairman of the board of directors and an independent non-executive director. The committee considers and recommends the remuneration payable to non-executive directors by the management company.
Management and financial controlDuring the year independent internal auditors performed a management and financial control review. No significant weaknesses were identified and the overall conclusion was that the:
directors had maintained an adequate system of internal controls and accounting records;•the Fund’s assets are safeguarded and appropriately insured;•the Fund should remain a going-concern for the foreseeable future; and•management understood the Fund’s policy and employed the appropriate strategy.•

25emira property fund
annual report 2008
Corporate governancecontinued
directorate
Details of the directors are set out on pages 20 to 22 of this report. According to the articles of association of STREM, one third of the executive and non-executive directors shall retire at the following annual general meeting of STREM and will be eligible for re-election.
Directors of STREM holdings in Participatory Interests
The directors’ holdings in the participatory interests of the Fund as at 30 June 2008 were:
Beneficial Beneficial Held by Beneficial Beneficial Held by direct indirect associates Total direct indirect associates Total 2008 2008 2008 2008 2007 2007 2007 2007
Executive directors
Warren Schultze 391 000 391 000 391 000 391 000
James Templeton 149 800 149 800 89 800 89 800
Peter Thurling 32 000 88 000 120 000 32 000 88 000 120 000
Non-executive directors
Michael Aitken 20 000 288 000 308 000 20 000 288 000 308 000
Liliane Barnard 107 700 107 700 107 700 107 700
Bryan Kent 218 878 218 878 218 878 218 878
Nocawe Makiwane 1 511 133 1 511 133 890 414 890 414
Thys Neser 20 000 20 000 40 000 20 000 20 000 40 000
Nkululeko Sowazi 7 820 221 7 820 221 7 820 221 7 820 221
Ben van der Ross 3 176 915 3 176 915 2 496 377 2 496 377
Totals 201 800 13 226 147 415 700 13 843 647 141 800 11 924 890 415 700 12 482 390
Since the end of the financial year to the date of this report, the interests of directors have remained unchanged.
Directors’ remunerationThe directors of STREM are remunerated from the management fee payable by the Fund.
Directors’ dealingsThe board has adopted policies prohibiting dealings by directors and certain other managers in periods immediately preceding the announcement of its interim and year-end financial results and at any other time deemed necessary by the board or as required in terms of the JSE regulations.
SECRETARY oF THE FUNdDesiree Isserow is the company secretary who was appointed on 1 October 2007. Her business and postal addresses, which are also the Fund’s registered and business addresses, are set out on page 86.
AUdIToRSThe Fund’s auditors are PricewaterhouseCoopers Inc.
MAjoR INTEREST HoLdERMomentum is the majority interest holder in Emira with 34,4% of the participatory interests in issue.
SPECIAL RESoLUTIoNSA full list of the special resolutions passed by the fund during the year will be made available to participatory interest holders on request.

26emira property fund annual report 2008
Corporate governancecontinued
MATERIAL CHANGES ANd SUbSEQUENT EvENTS To THE bALANCE SHEET dATEThe only events which are required to be noted are the disposal of two properties, details of which are noted on page 18.
STRUCTURE oF THE FUNdEmira Property Fund (“the Fund”) is a property unit trust in terms of the Collective Investment Schemes Control Act, No 45 of 2002. The Fund is managed by Strategic Real Estate Managers (Pty) Limited (“STREM”), which is approved by the Registrar of Collective Investment Schemes to manage the Fund.
In terms of the Collective Investment Schemes Control Act, No 45 of 2002 (“CISC Act”) the Fund is obliged to distribute all income earned to its participatory interest holders. As a result of its distribution obligations, no income tax or capital gains tax is payable by the Fund.
Windrifter Share Block (Pty) Limited*
The Colony Centre Share Block (Pty) Limited
Surgate Share Block (Pty) Limited*
Paddy’s Pad (2091) (Pty) Limited
No 9 Sturdee Holdings Share Block (Pty) Limited*
Kenview Share Block (Pty) Limited*
Backbone Investments (Pty) Limited*
Azgold Investments (Pty) Limited
Arnold Properties (Pty) Limited* Freestone Property Investments (Pty) Limited*
Emira Property Fund* 492 818 989 PIs listed on the JSE Limited
Freestone Property Holdings Limited Property Loan Stock Company
Eris Property Group (Pty) Limited • Property Managers
Corovest Property Group Holdings (Pty) Limited 15%
Auditors: PricewaterhouseCoopers Inc. • Report on fair presentation of financial statements
Trustee: Absa Bank Limited • Protects PI holders’ interests • Acts as custodian of Fund’s assets and
securities • Ensures compliance with Trust Deed and
legislation
RMB Properties (Pty) Limited 15%
FirstRand Asset Management (Pty) Limited 70%**
Registrar of Collective Investment Schemes • Ensures compliance with Collective
Investment Schemes Control Act, 2002, and monitors the operation of the collective investment scheme
JSE Limited • Ensures compliance with JSE requirements and provides a market for trading PIs
MANAGEMENT REGULATORY BODIES
Participatory interest (PI) holders Effective ownership in property portfolio
Strategic Real Estate Managers (Pty) Limited • Asset management • Reports to PI holders
* Property owning entities** In the process of being transferred to another FirstRand Group company

27emira property fund
annual report 2008
Corporate governancecontinued
MANAGEMENT oF THE FUNd
STREM – Asset managementSTREM has been approved by the Registrar of Collective Investment Schemes to manage the Emira Property Scheme.
STREM receives an amount equal to 0,5% of the total market capitalisation of the Fund, calculated monthly on the average daily closing price of the Fund as recorded by the JSE Limited, plus total long-term borrowings.
Fees paid for the period amounted to R33,4 million (2007: R21,9 million).
Property managementProperty management of the Fund has been outsourced to RMB Properties (Pty) Limited (“RMB Properties”), a subsidiary company of FirstRand, and Alliance Property Group (Pty) Limited, who managed the group’s rural property portfolio until the end of May 2008. RMB Properties ceded all its property services to a new company named Eris Property Group (Pty) Limited (“Eris”) on 1 April 2008. From 1 June 2008, the entire property portfolio was outsourced to Eris Property Group.
Property management fees and commissions paid for the period were R48,1 million (2007: R55,1 million).
RISk MANAGEMENTThe STREM management philosophy on risk recognises that managing risk is an integral part of generating sustainable PI holder value and enhancing stakeholder interest. It also recognises that an appropriate balance should be struck between entrepreneurial endeavour and sound business practice.
The management of STREM operates a risk management framework, which is based on COSO’s Enterprise Risk Management Framework. The underlying premise of enterprise risk management is that every entity exists to provide value for its stakeholders. All entities face uncertainty, and the challenge for management is to determine how much uncertainty to accept as it strives to grow stakeholder value.
Value is maximised when management sets strategy and objectives to strike an optimal balance between growth and return goals and related risks, and efficiently and effectively deploys resources in pursuit of the entity’s objectives.
Enterprise risk management in STREM encompasses:Aligning risk appetite and strategy which considers the risk appetite in evaluating strategic alternatives, setting related objectives, and •developing mechanisms to manage related risks.Enhancing risk response decisions by selecting alternative risk response, which includes risk avoidance, reduction, sharing or acceptance.•Reducing operational losses by gaining enhanced capabilities to identify potential events and establish responses.•Identifying and managing multiple cross-enterprise risks.•Seizing opportunities by identifying a full range of potential events.•Improving deployment of capital by obtaining robust risk information to allow management to effectively assess overall capital needs and •enhance capital allocation.
These capabilities inherent in enterprise risk management help management achieve the Fund’s performance and profitability targets and prevent loss of resources. Enterprise risk management helps to ensure effective reporting and compliance with laws and regulations, and helps avoid damage to the Fund’s reputation and associated consequences.

28emira property fund annual report 2008
Corporate governancecontinued
Financial risk factorsThe financial instruments of the group consist mainly of deposits with banks, long-term borrowings, derivative instruments, accounts receivable and accounts payable. The Fund issues or purchases financial instruments in order to finance operations and to manage the interest rate risks that arise from these operations.
The Fund’s credit, interest and liquidity risks are continually monitored.
The main objective of using financial instruments is to reduce the uncertainty over future cash flows arising principally as a result of interest rate fluctuations. The Fund finances its operations through the combination of bank borrowings and issue of additional units.
Interest rate risk managementAs at 30 June 2008, approximately 93% of total borrowing facilities were at fixed rates (in terms of the swap contracts).
Credit risk managementThe Fund has no significant concentration of credit risk due to a large number of widespread tenants.
The Fund has policies in place to ensure that lease agreements concluded are with tenants with an appropriate credit history. The Fund has policies that limit the amount of credit exposure to any one financial institution, and cash transactions are limited to high credit quality financial institutions. The debts are monitored on a continual basis in order to maintain a low default rate on trade receivables.
Liquidity risk managementCash flows are monitored on a monthly basis to ensure that cash resources are adequate to meet the funding requirements of the Fund.
29emira property fund
annual report 2008
Sustainability
INTRodUCTIoNThe Emira Property Fund recognises its responsibility to protect the interests of all its stakeholders and believes that good governance is essential to the Fund’s long-term sustainability and functioning. The objective of the Fund is to conform to its stringent requirement for transparency, while operating profitably and remaining accountable to the broader community which it serves and respecting the natural environment.
The Fund has embraced the King II report’s guidelines for socially responsible reporting according to the “triple bottom line” – the economic, social and environmental impacts of its properties.
Going forward, the Fund is formalising its approach in order to reflect its commitment to sustainable business practice, and introduce measurable targets for the future.
STAkEHoLdER ENGAGEMENTThe STREM board considers it a duty to keep all the Fund’s stakeholders informed and up to date with regard to its practices, policies and financial results, while remaining accountable for the sustainability of the Fund to its investors and tenants.
Direct discussions with stakeholders are always welcomed by the Fund. In addition to communication at the annual results presentation which is made to key shareholders and analysts, media releases are published when appropriate as well as ad hoc meetings with interested parties on request.
The Fund meets regularly with its shareholders and recognises its fiduciary duty to maximise the value of its assets for their benefit. In addition, shareholders are encouraged to attend the Fund’s annual general meeting to vote on resolutions and, where appropriate, to enter into discussions with the STREM directors.
The Fund has defined its major stakeholders and communicates with them as follows:Investors•Tenants•Suppliers and property management services providers•Asset managers•Communities•Government•
As part of its duty as a South African corporate citizen, the Fund is committed to its responsibility of engaging with local communities where its operations have a potential environmental impact on their surroundings. The Fund aims to develop a positive working relationship with local communities through organised committees. For example, when the Fund engages in property development, where required, the impacts are fully evaluated with environmental impacts assessments, which involve extensive consultation with the local communities.
Through its property management service provider, RMB Properties/Eris, the Fund engages with its base of more than 4 000 tenants on a daily basis. These tenants range from small owner-run enterprises, to blue chip companies and government departments spanning local, provincial and national government. The Fund also engages with government departments in matters relating to properties, for example zoning, planning permissions and rates.

30emira property fund annual report 2008
Sustainabilitycontinued
ECoNoMIC IMPACT
TransformationThe Fund is committed to empowering historically disadvantaged South Africans and considers this as an imperative to model corporate citizenship.
The underlying principles which define the STREM board’s transformation agenda, and relating specifically to BEE ownership are as follows:transferring ownership of land to people who were previously denied access to land through discriminatory policy and legislation;•empowering previously disadvantaged individuals in order to redress the imbalances of the past; and•achieving a change in the racial and gender composition of ownership, control and management within the property sector.•
The Property Sector Charter entered into between representatives of the South African property industry and the Department of Public Works lists these reasons amongst its objectives and the directors believe that the BEE shareholding is an important step in achieving the targets as set out in the charter.
Emira Property Fund’s BEE holding in its PIs is 11,9% which was initially concluded in August 2006. A further tranche of 2 918 288 PIs were issued late in 2007, bringing the BEE holding to 12,4%. The shareholders include:
The Tiso Group (Pty) LimitedTiso is a leading black-owned, controlled and managed investment company investing in the natural resources, financial services and industrial services, employing in excess of 20 individuals with a diverse but complementary set of business and entrepreneurial skills. Tiso is predominantly controlled (59,4%) by its management and the Tiso Foundation (16%), a registered public benefit organisation created for the purpose of ensuring broad-based equity participation in Tiso beyond that of its employees. Other shareholders include Investec, Standard Bank and RMB (24,6%). Tiso is headed up by Nkululeko Sowazi and David Adomakoh. Tiso is the controlling shareholder of Idwala Industrial Holdings, while strategic partnerships include Aveng, AECI, Exxaro, Alstom and Investec.
The Shalamuka FoundationThe Shalamuka Foundation (“Shalamuka”) is a trust registered to create sustainable long-term funding for the Penreach Whole School Development Programme (“Penreach”). Its inclusion as a BEE shareholder in the Emira Property Fund creates sustainable long-term support and funding for the school-based outreach programme.
For further information relating to Shalamuka see page 31.
Avuka Investments (Pty) LimitedAvuka is a black-controlled company established in 2005. The company is wholly owned by the following black women:
Dr Lulu Gwagwa: ex-Deputy Director General in the Department of Public Works and a non-executive director on the boards of the Airports •Company of South Africa (“ACSA”), FirstRand, the Development Bank of Southern Africa (“DBSA”) and the Mineworkers Investment Company;Mrs Nocawe Makiwane: Managing Director of Avuka Investments and non-executive director of the following companies: National Housing •Finance Corporation (“NHFC”); Rural Housing Loan Fund, Emira Property Fund, Advantage Asset Management, Scientia Financial Services and Eastern Cape Parks Boards; andNhlanhla Mjoli Mncube: Economic adviser to the Deputy President of South Africa and a board member of Pioneer Foods, Capitec Bank, •Cadiz Holdings and the NHFC.
Mr Ben van der RossMr Ben van der Ross is the Chairman of STREM. Mr Van der Ross also serves on the boards of FirstRand, Naspers and Momentum.
31emira property fund
annual report 2008
Sustainabilitycontinued
The RMBP Broad-Based Empowerment TrustIn terms of the existing contracts between STREM and RMB Properties/Eris Property Group, all asset and property management functions are currently outsourced to STREM and RMB Properties/Eris Property group. RMB Properties/Eris and STREM employ approximately 113 black individuals, many of whom are responsible for the administration of the Fund and the day-to-day management of properties owned by Emira. The PIs issued in terms of the BEE transaction have been and will be utilised to retain and incentivise existing black employees and to attract future black executives.
ENvIRoNMENTAL IMPACTNotwithstanding the Emira Property Fund’s classification as having a low environmental impact, the STREM directors acknowledge the importance of adopting sustainable environmental business practices to minimise the impact of the Fund’s activities on all stakeholder groups.
During the year under review, the Green Building Council of South Africa (“GBCSA”) launched its pilot Green Star SA Environmental Rating Tools, whereby developers can voluntarily apply to have their projects rated and certified by GBCSA. Emira recognises the significance of the new rating system and is intent on contributing to it once the tool is formally launched in November 2008. The Fund will make use of the tool to evaluate any new projects while seeking out ways of using it to evaluate the environmental impact of its existing property portfolio. Any future refurbishments and developments will also take cognisance of the council’s recommendations.
Looking forward, Emira is focused on a number of measures to improve the environmental efficiency of its property portfolio, including measures such as rolling out energy efficient light fittings throughout its properties, optimising the use of natural light in future developments as well as increasing the efficiency of any new properties vis-à-vis temperature control including eco-efficient heating and air conditioning.
An environmental policy will be developed during 2009 to define appropriate environmental practices for the Fund. However, with its client base of more than 4 000 tenants nationwide, the Fund leases properties to a number of large, established corporates who themselves engage in environmental best practice. Emira will engage with all of its tenants, and consider environmental improvements to fixed assets and buildings where these are viable.
SoCIAL IMPACT
Health and safetyThe Emira Property Fund’s health and safety policy complies with the Occupational Health and Safety Act 1970 and other relevant legislation, regulations and codes of practice for South Africa. It aims to prevent and minimise work-related and health impairments by applying international best practice and ensuring that all employees are supplied with adequate training and supervision for the role they undertake.
The Fund, through its property management company, Eris, strives to continuously improve its Occupational Health and Safety (“OHS”) standards. All regulatory OHS progress is monitored and reported to the STREM Board of directors. During the year, evacuation drills, which are a high priority nationally, were highlighted to employees to heighten their awareness of risks. Individual and company responsibilities were communicated to avoid and deal with any crises. Tenants are continuously reminded of their OHS responsibilities. All tenants receive an Eris OHS manual, and an updated Eris “House Rule” guide is in progress.
Community involvementAs a Collective Investment Scheme in Property, EMIRA is precluded from making direct corporate social investments by the Collective Investments Schemes Control Act. However, as a shareholder in the Emira Property Fund, Shalamuka supports social development, constituting an indirect CSI initiative.
One of the beneficiaries of Emira’s BEE transactions in 2006 and 2007 is Shalamuka, a trust formed in 2006 to raise long-term, sustainable funding for the highly regarded Penreach.
Penreach is a non-profit skills development programme that improves the teaching skills of qualified and unqualified teachers and their schools in Mpumalanga and the surrounding areas. It has resulted in the upliftment of local communities through improvement in education and the quality of schools, and has been recognised by numerous awards.
Penreach holds weekly workshops that provide skills training to teachers. Workshops are supplemented by daily visits to schools by

32emira property fund annual report 2008
Sustainabilitycontinued
experienced fieldworkers, and tutorial workshops are offered to Mathematics and Science learners and their educators.
Focus areas include:Pre-primary school educators•Primary school educators•High school educators (with focus on Mathematics and Science development)•School governing bodies•School management teams•Tutorial lessons for Grade 10, 11 and 12 Mathematics and Science learners• Early childhood development National Qualifications Framework (“NQF”) courses•
Penreach began working with 40 teachers from 10 schools in 1994. It has grown exponentially since then and now reaches more than 2 200 teachers a year, representing over 900 schools. It is estimated that over 350 000 learners from rural areas benefit from Penreach annually. 100% of the beneficiaries of Penreach are black, rural South Africans, with at least 90% being black rural women.
Shalamuka aims to participate in BEE deals and other investment opportunities in order to create a long-term investment that will provide sufficient funds to sustain Penreach on an annual basis and allow room for planning, growth and important research. This will increase the number of educators, and consequently learners who can be reached, thereby improving their standard of education.
It is the profound belief of the Shalamuka trustees that South Africa will benefit from widespread, improved education.
The Shalamuka trustees are respected members of the business community and have impressive socio-economic development track records. 85% of the trustees are black South Africans and 71% are black women. The Shalamuka trustees are volunteers and do not benefit economically in any way from Shalamuka or Penreach.
Shalamuka has EmpowerDex certification, scoring maximum points. It is 100% compliant as a broad-based organisation as per the 2007 Department of Trade and Industry codes and it significantly enhances the CSI/ BEE scorecard of investee companies.
Shalamuka has successfully participated in a number of BEE transactions to date. These include Emira Property Fund; Hulamin (Pty) Limited; Shalamuka Capital/RMB Corvest; Brimstone Investment Corporation Limited; Sasol Inzalo Transaction; Barloworld; and PPC. Shalamuka has access to funding at favourable rates.
The mission statement of Penreach is “To improve the quality and accessibility of education in under-resourced schools in black rural communities”. Penreach is striving to create functional, efficient schools where future generations of young people can acquire the skills they will need to take South Africa to new heights as a nation.
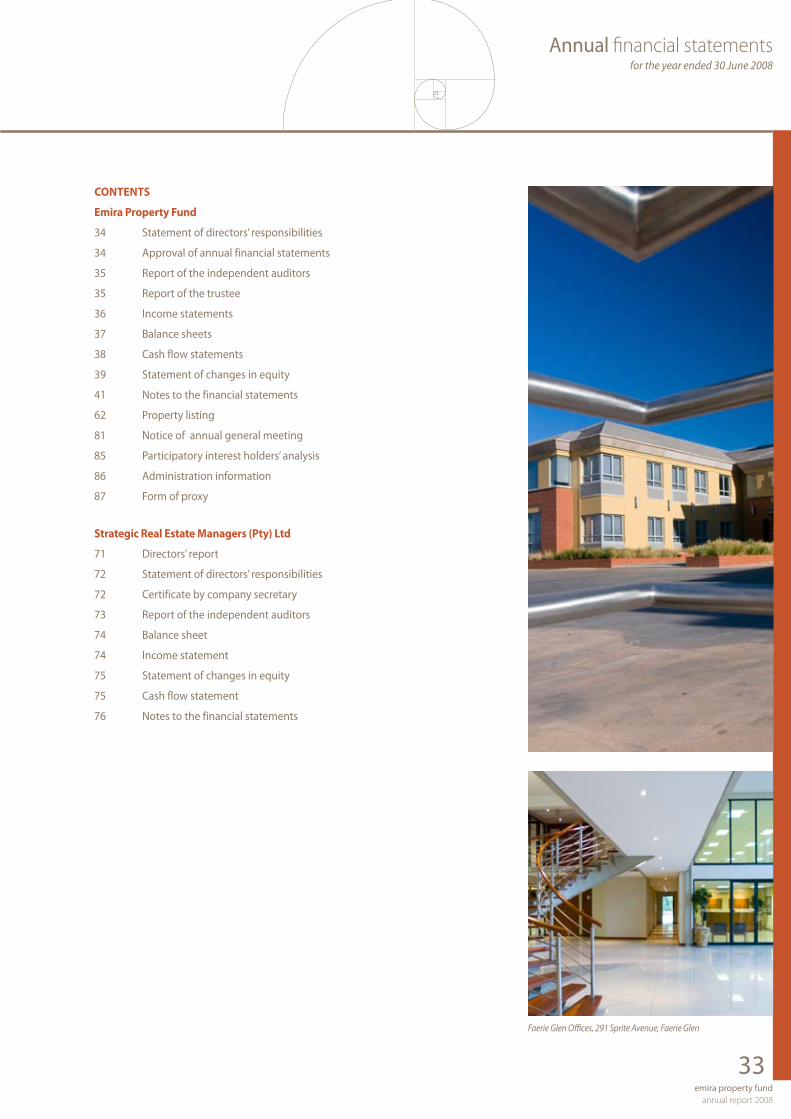
33emira property fund
annual report 2008
contents
emira Property Fund
34 Statement of directors’ responsibilities
34 Approval of annual financial statements
35 Report of the independent auditors
35 Report of the trustee
36 Income statements
37 Balance sheets
38 Cash flow statements
39 Statement of changes in equity
41 Notes to the financial statements
62 Property listing
81 Notice of annual general meeting
85 Participatory interest holders’ analysis
86 Administration information
87 Form of proxy
strategic Real estate Managers (Pty) Ltd
71 Directors’ report
72 Statement of directors’ responsibilities
72 Certificate by company secretary
73 Report of the independent auditors
74 Balance sheet
74 Income statement
75 Statement of changes in equity
75 Cash flow statement
76 Notes to the financial statements
Annual financial statementsfor the year ended 30 June 2008
Faerie Glen Offices, 291 Sprite Avenue, Faerie Glen

34emira property fund annual report 2008
Statement of directors’ responsibilities
The directors of STREM are responsible for the preparation, integrity, and fair presentation of the financial statements of the Fund. The financial statements presented on pages 36 to 61 have been prepared in accordance with International Financial Reporting Standards (“IFRS”), and include amounts based on judgements and estimates made by management.
The directors consider that in preparing the financial statements they have used the most appropriate accounting policies, consistently applied and supported by reasonable and prudent judgements and estimates, and that all statements of International Financial Reporting Standards that they consider to be applicable have been followed.
The directors are satisfied that the information contained in the financial statements fairly presents the results of operations for the period and the financial position of the Fund at year-end. The directors also prepared the other information included in the report and are responsible for both its accuracy and its consistency with the financial statements.
The directors have responsibility for ensuring that accounting records are kept. The accounting records should disclose with reasonable accuracy the financial position of the Fund to enable the directors to ensure that the financial statements comply with the relevant legislation.
The Fund operated in a well-established control environment, which is well documented and regularly reviewed. This incorporates risk management and internal control procedures, which are designed to provide reasonable, but not absolute, assurance that assets are safeguarded and the risks facing the business, are being controlled.
The going-concern basis has been adopted in preparing the financial statements. The directors have no reason to believe that the Fund will not be a going-concern in the foreseeable future, based on forecasts and available cash resources. These financial statements support the viability of the Fund.
The Fund’s external auditors, PricewaterhouseCoopers Incorporated, audited the financial statements, and their report is presented on the next page.
BJ van der Ross JWA TempletonChairman Chief Executive Officer
Approval of annual financial statements
The annual financial statements of the Fund, incorporating statutorily required information in respect of the Fund, for the year ended 30 June 2008 set out on pages 36 to 61 were approved by the board of directors of STREM on 15 October 2008 and are signed on its behalf by:
BJ van der Ross JWA TempletonChairman Chief Executive Officer

35emira property fund
annual report 2008
Report of the independent auditors
InDePenDent AUDItoRs’ RePoRt to tHe PARtIcIPAtoRY InteRest HoLDeRs oF eMIRA PRoPeRtY FUnDWe have audited the group annual financial statements of Emira Property Fund and its subsidiaries, which comprise the balance sheet as at 30 June 2008, and the income statement, statement of changes in equity and cash flow statement for the year then ended, and a summary of significant accounting policies and other explanatory notes, as set out on pages 36 to 61.
Directors’ responsibility for the financial statementsThe directors of Strategic Real Estate Managers (“STREM”) are responsible for the preparation and fair presentation of these financial statements in accordance with statements of International Financial Reporting Standards and in the manner required by the Companies Act of South Africa. This responsibility includes: designing, implementing and maintaining internal control relevant to the preparation and fair presentation of financial statements that are free from material misstatement, whether due to fraud or error; selecting and applying appropriate accounting policies; and making accounting estimates that are reasonable in the circumstances.
Auditors’ responsibilityOur responsibility is to express an opinion on these financial statements based on our audit. We conducted our audit in accordance with International Standards on Auditing. Those standards require that we comply with ethical requirements and plan and perform the audit to obtain reasonable assurance whether the financial statements are free from material misstatement.
An audit involves performing procedures to obtain audit evidence about the amounts and disclosures in the financial statements. The procedures selected depend on the auditor’s judgement, including the assessment of the risks of material misstatement of the financial statements, whether due to fraud or error. In making those risk assessments, the auditor considers internal control relevant to the entity’s preparation and fair presentation of the financial statements in order to design audit procedures that are appropriate in the circumstances, but not for the purpose of expressing an opinion on the effectiveness of the entity’s internal control. An audit also includes evaluating the appropriateness of accounting policies used and the reasonableness of accounting estimates made by management, as well as evaluating the overall presentation of the financial statements.
We believe that the audit evidence we have obtained is sufficient and appropriate to provide a basis for our audit opinion.
opinionIn our opinion, the financial statements present fairly, in all material respects, the financial position of Emira Property Fund and its subsidiaries as of 30 June 2008, and its financial performance and its cash flows for the year then ended in accordance with International Financial Reporting Standards and in the manner required by the Companies Act of South Africa.
PricewaterhouseCoopers Inc.Director: Sakhile MasukuRegistered Auditor
16 October 2008
2 Eglin RoadSunninghillSandton
Report of the trustees
In terms of section 70(I)(f ) of the Collective Investment Schemes Control Act, No 45 of 2002
to tHe PARtIcIPAtoRY InteRest HoLDeRs oF eMIRA PRoPeRtY FUnDDuring the period as set out above during which the Collective Investment Schemes Control Act, No 45 of 2002 has been in effect the Trust has been administered in accordance with
ii. The limitations imposed on the investment and borrowing powers of the Manager by the Act; andii. The provisions of the Act and the deed.
Absa Bank LimitedTrustee
Johannesburg1 October 2008
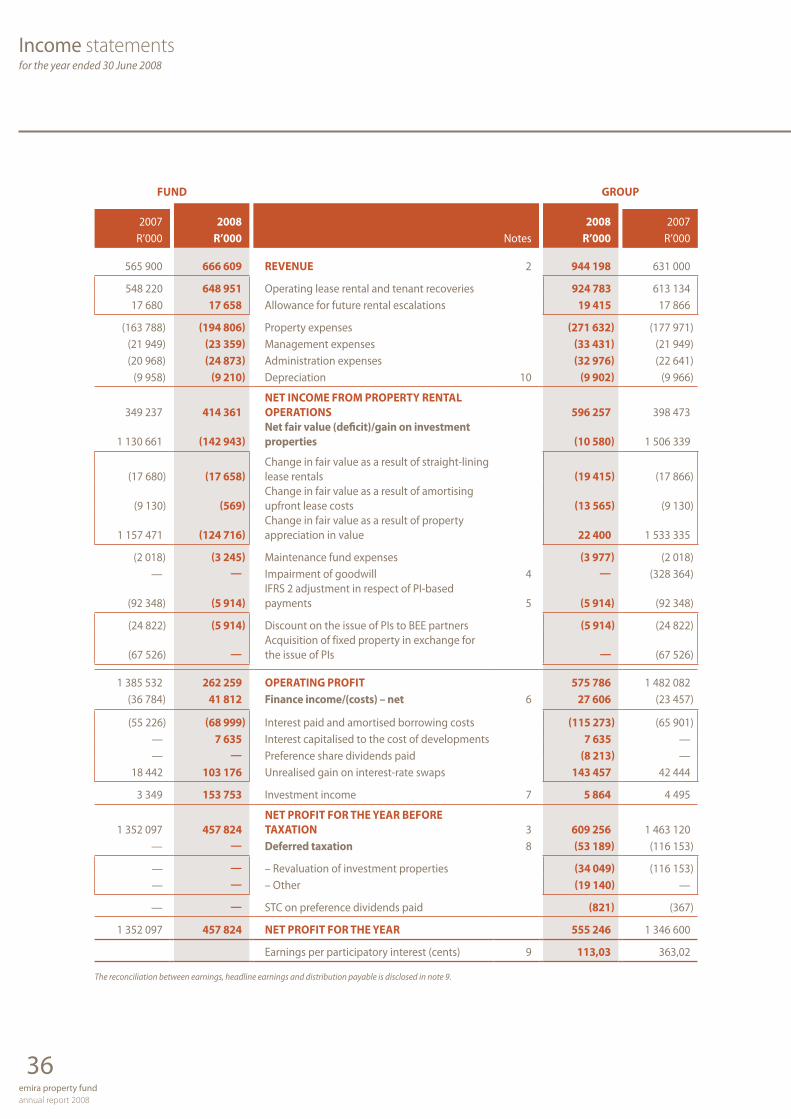
36emira property fund annual report 2008
FUnD GRoUP
2007 2008 2008 2007R’000 R’000 Notes R’000 R’000
565 900 666 609 RevenUe 2 944 198 631 000
548 220 648 951 Operating lease rental and tenant recoveries 924 783 613 13417 680 17 658 Allowance for future rental escalations 19 415 17 866
(163 788) (194 806) Property expenses (271 632) (177 971)(21 949) (23 359) Management expenses (33 431) (21 949)(20 968) (24 873) Administration expenses (32 976) (22 641)
(9 958) (9 210) Depreciation 10 (9 902) (9 966)
349 237 414 361net IncoMe FRoM PRoPeRtY RentAL oPeRAtIons 596 257 398 473
1 130 661 (142 943)net fair value (deficit)/gain on investment properties (10 580) 1 506 339
(17 680) (17 658)Change in fair value as a result of straight-lining lease rentals (19 415) (17 866)
(9 130) (569)Change in fair value as a result of amortising upfront lease costs (13 565) (9 130)
1 157 471 (124 716)Change in fair value as a result of property appreciation in value 22 400 1 533 335
(2 018) (3 245) Maintenance fund expenses (3 977) (2 018)— — Impairment of goodwill 4 — (328 364)
(92 348) (5 914)IFRS 2 adjustment in respect of PI-based payments 5 (5 914) (92 348)
(24 822) (5 914) Discount on the issue of PIs to BEE partners (5 914) (24 822)
(67 526) —Acquisition of fixed property in exchange for the issue of PIs — (67 526)
1 385 532 262 259 oPeRAtInG PRoFIt 575 786 1 482 082(36 784) 41 812 Finance income/(costs) – net 6 27 606 (23 457)
(55 226) (68 999) Interest paid and amortised borrowing costs (115 273) (65 901)— 7 635 Interest capitalised to the cost of developments 7 635 —— — Preference share dividends paid (8 213) —
18 442 103 176 Unrealised gain on interest-rate swaps 143 457 42 444
3 349 153 753 Investment income 7 5 864 4 495
1 352 097 457 824net PRoFIt FoR tHe YeAR beFoRe tAxAtIon 3 609 256 1 463 120
— — Deferred taxation 8 (53 189) (116 153)
— — – Revaluation of investment properties (34 049) (116 153)— — – Other (19 140) —
— — STC on preference dividends paid (821) (367)
1 352 097 457 824 net PRoFIt FoR tHe YeAR 555 246 1 346 600
Earnings per participatory interest (cents) 9 113,03 363,02
The reconciliation between earnings, headline earnings and distribution payable is disclosed in note 9.
Income statementsfor the year ended 30 June 2008

37emira property fund
annual report 2008
FUnD GRoUP
2007 2008 2008 2007R’000 R’000 Notes R’000 R’000
AssetsNon-current assets
4 984 529 5 104 334 Investment properties 10 7 305 166 7 009 58769 132 86 790 Allowance for future rental escalations 11 130 004 110 58924 066 24 635 Unamortised upfront lease costs 12 37 631 24 066
5 077 727 5 215 759 7 472 801 7 144 2421 241 681 1 318 987 Subsidiary companies 13
6 319 408 6 534 746 7 472 801 7 144 242Current assets
24 185 30 630 Accounts receivable and prepayments 14 41 673 35 42218 351 121 527 Derivative financial instruments 15 189 953 46 496
5 181 57 198 Cash and cash equivalents 16 68 825 13 886
47 717 209 355 300 451 95 804156 500 18 635 Non-current assets held for sale 10 18 635 170 500
6 523 625 6 762 736 total assets 7 791 887 7 410 546
eqUItY
5 615 382 5 672 049Participatory interest holders capital and reserves 17, 18 5 761 040 5 606 951Non-current liabilities
— — Redeemable preference shares 19 90 000 90 000702 668 641 418 Interest-bearing debt 19 1 137 204 1 197 050
— — Deferred taxation 312 672 259 483
702 668 641 418 1 539 876 1 546 533Current liabilities
— 100 000 Short-term portion of interest-bearing debt 19 100 000 9 238101 616 114 194 Accounts payable 20 155 896 143 865
103 959 235 075Distributions payable to participatory interest holders 235 075 103 959
205 575 449 269 490 971 257 062
908 243 1 090 687 total liabilities 2 030 847 1 803 595
6 523 625 6 762 736 total equity and liabilities 7 791 887 7 410 546
Balance sheetsas at 30 June 2008

38emira property fund annual report 2008
FUnD GRoUP
2007 2008 2008 2007R’000 R’000 Notes R’000 R’000
cAsH FLoWs FRoM oPeRAtInG ActIvItIes368 953 408 232 Cash generated from operations 21 574 925 449 025
3 349 153 753 Investment income 5 864 4 495(54 788) (68 999) Interest paid 6 (115 273) (65 463)
— — Preference share dividends paid 6 (8 213) (2 934)— — Taxation paid (764) (367)
(312 407) (321 353) Distribution to participatory interest holders 21 (321 353) (312 407)
5 107 171 633 135 186 72 349
cAsH FLoWs FRoM InvestInG ActIvItIes(912 216) (277 348) Acquisition of investment properties (319 939) (915 934)
(8 001) (5 610) Acquisition of furniture and equipment (7 122) (8 299)20 044 155 503 Proceeds on disposal of investment properties 169 503 20 101
— 997 Proceeds on disposal of furniture and equipment
997 —
(1 339 187) — Acquisition of Freestone Property Holdings Limited
4
— — Investment properties — (1 794 982)— — Interest rate swaps — (4 144)— — Preference shares — 90 000— — Long-term borrowings — 533 683— — Deferred taxation — 143 330— — Goodwill — (328 364)
3 225 (77 306) Loan to subsidiary
(2 236 135) (203 764) (156 561) (2 264 609)
cAsH FLoWs FRoM FInAncInG ActIvItIes1 994 881 45 398 Issue of participatory interests 45 398 1 994 881
240 676 38 750 Increase in interest-bearing debt 30 916 210 613
2 235 557 84 148 76 314 2 205 494
4 529 52 017 net IncReAse In cAsH AnD cAsH eqUIvALents
54 939 13 234
652 5 181 Cash and cash equivalents at the beginning of the year 13 886 652
5 181 57 198 cash and cash equivalents at the end of the year 68 825 13 886
Cash flow statementsfor the year ended 30 June 2008

39emira property fund
annual report 2008
GRoUP
Participatory Fair value Other Retainedinterest reserve reserve earnings Total
R’000 R’000 R’000 R’000 R’000
2007Balance at 1 July 2006 1 425 094 1 059 077 — (906) 2 483 265Net profit for the year — — — 1 346 600 1 346 600Distribution to participatory interest holders — — — (307 209) (307 209)Issue of participatory interests 1 994 881 — — — 1 994 881IFRS 2 adjustment in respect of PI-based payments 92 348 — (92 348) 92 348 92 348Preference share dividends paid — — — (2 934) (2 934)Transfer to fair value reserve (net of deferred taxation) — 1 129 244 — (1 129 244) —
Balance at 30 June 2007 3 512 323 2 188 321 (92 348) (1 345) 5 606 951
2008Balance at 1 July 2007 3 512 323 2 188 321 (92 348) (1 345) 5 606 951Net profit for the year — — — 555 246 555 246Distribution to participatory interest holders — — — (452 469) (452 469)Issue of participatory interests 45 398 — — — 45 398IFRS 2 adjustment in respect of PI-based payments 5 914 — (5 914) 5 914 5 914Transfer to fair value reserve (net of deferred taxation) — 108 691 — (108 691) —
balance at 30 June 2008 3 563 635 2 297 012 (98 262) (1 345) 5 761 040
Statement of changes in equityfor the year ended 30 June 2008

40emira property fund annual report 2008
FUnD
Participatory Fair value Other Retainedinterest reserve reserve earnings Total
R’000 R’000 R’000 R’000 R’000
2007Balance at 1 July 2006 1 425 094 1 059 077 — (906) 2 483 265Net profit for the year — — — 1 352 097 1 352 097Distribution to participatory interest holders — — — (307 209) (307 209)Issue of participatory interests 1 994 881 — — — 1 994 881IFRS 2 adjustments in respect of PI-based payments 92 348 — (92 348) 92 348 92 348Transfer to fair value reserve (net of deferred taxation) — 1 173 895 — (1 173 895) —
Balance at 30 June 2007 3 512 323 2 232 972 (92 348) (37 565) 5 615 382
2008Balance at 1 July 2007 3 512 323 2 232 972 (92 348) (37 565) 5 615 382Net profit for the year — — — 457 824 457 824Distribution to participatory interest holders — — — (452 469) (452 469)Issue of participatory interests 45 398 — — — 45 398IFRS 2 adjustments in respect of PI-based payments 5 914 — (5 914) 5 914 5 914Transfer to fair value reserve (net of deferred taxation) — (24 785) — 24 785 —
balance at 30 June 2008 3 563 635 2 208 187 (98 262) (1 511) 5 672 049
Statement of changes in equityfor the year ended 30 June 2008 – continued
41emira property fund
annual report 2008
Notes to the financial statementsfor the year ended 30 June 2008
1 AccoUntInG PoLIcIesbasis of presentationThe financial statements have been prepared in accordance with International Financial Reporting Standards (IFRS) and the Companies Act of South Africa.The following amendments to IFRS standards and interpretations have been issued with an effective date applicable to the current financial year of the group.
IFRs 7 Financial instruments: Disclosure (new) and IAs 1 Presentation of financial statements: Capital disclosures (amended)The adoption of IFRS 7 and the amendment to IAS 1 impacts the disclosures made in these financial statements, but had no impact on the reported profits or financial position of the group, in accordance with the transitional requirements of the standards, the group has provided full comparative information.
Ac 503 Accounting for BEE transactionsThe interpretation applies to accounting for BEE transactions where the fair value of cash and other assets received is less than the fair value of equity instruments granted to the BEE partner, ie. to the BEE equity credentials. The impact of this interpretation on the group is not considered to be significant.
IFRIc 10 Interim Financial Reporting and ImpairmentThe interpretation concludes that an impairment loss recognised in a previous reporting period, in respect of goodwill, investments in equity instruments classified as available-for-sale and investments in financial assets carried at cost, cannot be reversed at a subsequent balance sheet date. The impact of this interpretation on the company is not considered to be significant.The financial statements are prepared on the historical cost basis except for investment properties and certain financial instruments which are carried at fair value, and incorporate the following accounting policies which are consistent with those applied in the previous year.The financial statements are prepared on a going-concern basis. The group financial statements include those of Emira Property Fund and its wholly owned subsidiary, Freestone Property Holdings Ltd and its subsidiaries.
1.1 basis of consolidationSubsidiaries are all entities (including special purpose entities) over which the group has the power to govern the financial and operating policies generally accompanying a shareholding of more than one half of the voting rights.Subsidiaries are fully consolidated from the date on which control is transferred to the group. The group ceases to consolidate on the date on which control ceases.The purchase method of accounting is used to account for the acquisition of subsidiaries by the group. The cost of an acquisition is measured as the fair value of the assets given, equity instruments issued and liabilities incurred or assumed at the date of exchange, plus costs directly attributable to the acquisition. Identifiable assets acquired and liabilities and contingent liabilities assumed in a business combination are measured initially at their fair values at the acquisition date, irrespective of the extent of any minority interest. The excess of the cost of acquisition over the fair value of the group’s share of the identifiable net assets acquired is recorded as goodwill. If the cost of acquisition is less than the fair value of the net assets of the subsidiary acquired, the difference is recognised directly in the income statement.Inter-company transactions, balances and unrealised gains on transactions between group companies are eliminated. Unrealised losses are also eliminated unless the transaction provides evidence of an impairment of the asset transferred. Accounting policies of subsidiaries have been changed where necessary to ensure consistency with the policies adopted by the group.
1.2 Investment propertyInvestment property comprises both freehold and leasehold land and buildings and installed equipment held for the purpose of earning rental income and for capital appreciation.Investment property is treated as a long-term investment and is initially recognised at cost (including related transaction costs) and subsequently carried at fair value. Subsequent additions that produce future economic benefit to the group are capitalised. Investment property under construction is valued at cost.Maintenance and repairs which neither materially add to the value of the properties nor prolong their useful lives are expensed in the income statement.Independent valuations are obtained on a rotational basis so as to ensure that external independent valuation professionals have valued each property every three years. The directors value the remaining properties annually.Investment properties are classified as held for sale when the board has approved the disposal of the properties.

42emira property fund annual report 2008
Notes to the financial statementsfor the year ended 30 June 2008 – continued
The valuation calculations are based on the aggregate of the net annual rents receivable and associated costs, using the discounted cash flow method. The discounted cash flow method takes projected cash flow and discounts it at a rate which is consistent with the comparable market transactions. Any gains or losses arising from changes in fair value are included in the net income or loss for the year. The net gains or losses are transferred to a revaluation reserve and are not available for distribution, as set out in the trust deed of the Fund.Gains or losses arising from the disposal of investment properties, being the difference between the net disposal proceeds and the carrying value, are brought to account in the determination of the net income/loss for the year. The net gains or losses are transferred from retained earnings to a fair value reserve and are not available for distribution in accordance with the Fund’s trust deed.Property located on land that is held under an operating lease is classified as investment property as long as it is held for long-term rental yield. These leases in respect of land are classified as operating leases and have varying expiry dates from 7 to 42 years.
1.3 LeasesLeases in which a significant portion of the risks and rewards of ownership are retained by the lessor are classified as operating leases. The Fund is party to numerous leasing contracts as the lessor of property.
1.4 Furniture and equipmentFurniture and equipment are stated at historical cost less accumulated depreciation and impairment charges. Cost comprises the purchase price as well as all costs incurred in order to bring the asset to a working condition.Depreciation is calculated at cost less accumulated depreciation and any impairment and expected residual value on the straight-line method, which is reviewed annually.The useful lives of furniture and equipment are five years.Repairs and maintenance are charged to the income statement during the financial period in which they are incurred.Furniture and equipment are linked to specific properties. Consequently, any gains or losses on disposal are incorporated with the gains or losses on the disposal of the investment property.
1.5 GoodwillGoodwill represents the excess of the cost of an acquisition over the fair value of the group’s share of the net identifiable assets of the acquired subsidiary at the date of acquisition. Separately recognised goodwill is tested annually for impairment and carried at cost less accumulated impairment losses. Impairment losses on goodwill are not reversed. Gains and losses on the disposal of an entity include the carrying amount of goodwill relating to the entity sold.
1.6 Impairment of assetsThe Fund assesses at each balance sheet date whether there is objective evidence that a financial asset or group of financial assets is impaired. A financial asset or group of financial assets is impaired and impairment losses are incurred only if there is objective evidence of impairment as a result of one or more events that have occurred after the initial recognition of the asset and that loss event has an impact on the estimated future cash flows of the financial asset or group of financial assets that can be reliably estimated.Objective evidence that a financial asset or group of financial assets is impaired includes observable data that comes to the attention of the Fund about the following events:
A breach of contract, such as a default or delinquency in payments.•Significant financial difficulty of the debtor.•The disappearance of an active market for that financial asset because of financial difficulties.•Observable data indicating that there is a measurable decrease in the estimated future cash flow from a group of •financial assets since the initial recognition of those assets.
If any of the above indications exist and where the carrying values exceed the estimated recoverable amount, the assets are written down to their recoverable amount.Impairment losses and reversal of impairment losses are recognised in the income statement.
1.7 Allowance for future rental escalationsAllowance for future rental escalations represents the difference between the actual cash rentals received to date and the rental income recognised on a straight-line basis over the period of the lease contracts.

43emira property fund
annual report 2008
Notes to the financial statementsfor the year ended 30 June 2008 – continued
1.8 Upfront lease costsUpfront lease costs are amortised on a straight-line basis over the lease period to which they relate.
1.9 trade and other receivablesTrade receivables are initially recognised at fair value and subsequently at amortised cost using the effective interest rate method. A provision for impairment of trade receivables is established when there is objective evidence that the Fund will not be able to collect all amounts due according to the original term of the receivables.
1.10 cash and cash equivalentsCash and cash equivalents comprise cash balances and call deposits. For the purposes of the cash flow statement, cash and cash equivalents comprise cash on hand and highly liquid investments that are readily convertible to known amounts of cash which are subject to an insignificant risk of changes in fair value. Cash and cash equivalents are stated at fair value.
1.11 non-current assets held for saleNon-current assets held for sale are assets that will be recovered principally through a sale transaction. These assets are measured at the lower of their carrying amounts and fair value less selling costs.
1.12 borrowings, including redeemable preference sharesBorrowings are recognised initially at fair value net of transaction costs incurred, when the Fund becomes party to the contractual provisions. Borrowings are subsequently stated at amortised cost using the effective interest rate method; any difference between proceeds (net of amortised costs) and the redemption value is recognised in the income statement over the period of the borrowings as interest.Financial liabilities are removed from the balance sheet when the obligation specified in the contract is discharged, cancelled, or has expired.
1.13 Derivative financial instrumentsThe Fund uses derivative financial instruments to hedge its exposure to interest rate risks arising from financing and investment activities. The Fund does not hold or issue derivative financial instruments for trading purposes. However, derivatives that do not qualify for hedge accounting are accounted for as trading instruments.Derivative financial instruments are initially recognised and subsequently stated at fair value. The gain or loss on re-measurement to fair value is taken immediately to profit or loss. The fair value of interest rate swaps is the estimated amount that the group would receive or pay to terminate the swap at the balance sheet date, taking into account current interest rates and the current creditworthiness of the swap counterparties.
1.14 trade and other payablesTrade payables are recognised initially at fair value and subsequently measured at amortised cost using the effective interest rate method. Provisions are recognised when the Fund has a present legal or constructive obligation as a result of the past event and it is probable that an outflow of resources embodying economic benefit will be required to settle the obligation and in addition a reliable estimate of the amount can be made.
1.15 offsettingFinancial assets and financial liabilities are only offset if there is a legally enforceable right to set-off the recognised amounts and there is an intention to either settle on a net basis or to realise the asset and settle the liability simultaneously.
1.16 Revenue and expense recognition1.16.1 RevenueComprises rental income and operating cost recoveries from tenants, but excludes value added tax. Rental income is accounted for on a straight-line basis over the period of the lease contracts.
1.16.2 Investment incomeInvestment income is recognised on a time-proportion basis, taking into account the principal amount outstanding to the effective rate over the period to maturity when it is determined that such income will accrue to the Fund.
1.16.3 Operating leasesLeases under which the lessor effectively retains the risks and benefits of ownership are classified as operating leases. Obligations incurred under operating leases are charged to the income statement in equal instalments over the period of the lease.

44emira property fund annual report 2008
Notes to the financial statementsfor the year ended 30 June 2008 – continued
1.16.4 Management feesManagement fees payable to STREM are equal to 0,5% of the total market capitalisation of the Fund, calculated monthly on the average daily closing price of the Fund as recorded by the JSE Securities Exchange South Africa, plus the total long-term borrowings.
1.16.5 Property management feesProperty management fees payable to RMB Properties/Eris Property Group, and Alliance Property Group are calculated based on the rental collections using market-related rates applicable to the type and occupancy of buildings. The agreement with Alliance Property Group was terminated on 31 May 2008 and transferred to Eris Property Group.
1.17 borrowing costsAll borrowing costs are recognised in the period in which they are incurred using the effective-rate method. In the event that borrowing costs are incurred prior to the qualifying asset being ready for its intended use, such costs will be capitalised until such time as the asset is substantially ready for its intended use. Qualifying assets are those that necessarily take a substantial period of time to prepare for their intended use. Capitalisation is suspended during extended periods in which active development is interrupted. All other borrowing costs are expensed upon recognition.
1.18 Distributions to participatory interest holdersDistributions to participatory interest holders are recognised in the period in which income is earned in accordance with the trust deed of the Fund. The accrued income arising as a result of the difference between actual cash rental received and the amortised amount on a straight-line basis over the periods of the lease contracts is not distributable until realised. The additional profit arising as a result of the Fund amortising upfront lease costs over the period of the lease contracts is not distributable.
1.19 segment reportingA business segment is a group of assets and operations engaged in providing services that are subject to risks and returns that are different from those of other business segments. Geographical segments provide services within a particular economic environment that are subject to risks and returns that are different from those components operating in other economic environments.The major sectoral segments are retail, office and industrial. Properties are classified as retail, office and industrial according to the nature of their tenants. The geographical split is a secondary segment, the major segments are Gauteng, Western and Eastern Cape, KwaZulu-Natal and Free State.All segment revenue and expenses are directly attributable to the segment. Segment assets include all operating assets used by a segment, and consists principally of investment properties and property, furniture and equipment.
1.20 PI-based paymentsFor equity settled PI-based payment transactions, the services acquired and liability incurred are measured at the fair value of the liability. Until the liability is settled, the fair value of the liability is remeasured at each reporting date and at the date of settlement, with any changes in value recognised in the income statement for the period.
1.21 taxationNo taxation is accounted for in the Fund as all distributable income is distributed to participatory interest holders and is taxable in their hands. As a result no deferred taxation has been raised in the Fund.As a result of the acquisition of Freestone Property Holdings Ltd, which is a tax-paying entity, the group is required to account for deferred taxation. Deferred taxation on the fair value adjustment of investment properties held by Freestone Property Holdings Ltd and its subsidiaries, has been provided at a combination of the applicable income tax and capital gains tax rates, based on the manner in which each asset is expected to be realised and only to the extent that there are not sufficient tax losses to shield the charge.
1.22 Key estimates and assumptionsThe preparation of financial statements in conformity with IFRS requires management to make judgements, estimates and assumptions that affect amounts reported in the financial statements. Information on key estimates and assumptions which have the most significant effect on the financial statements are set out in the following notes to the financial statements:
Accounting policies – notes 1.2, 1.5, 1.6, 1.12, 1.15, 1.20•Investment properties – note 10•Receivables – note 14•Deferred taxation – note 8•

45emira property fund
annual report 2008
Notes to the financial statementsfor the year ended 30 June 2008 – continued
1.23 new and amended International Financial Reporting standards not yet adoptedAny changes required will be implemented in the accounting period commencing after the effective date.
IAS I Presentation of Financial Statements: Comprehensive revision requiring a statement of comprehensive incomeEffective date: 1 January 2009The changes made to IAS I require information in financial statements to be aggregated on the basis of shared characteristics and introduce a statement of comprehensive income. The revision includes changes in titles of financial statements to reflect their functions more clearly.The revised standard will affect the disclosures in the financial statements.
IAS 32 and IAS I Presentation of Financial Statements: Amendment relating to disclosure of puttable instruments and obligations arising on liquidationEffective date: 1 January 2009The amendment requires additional information to be presented on puttable instruments that are presented as equity.The amendment will not have any effect as there are no puttable instruments that are presented within equity.
IFRS Share Based Payment: Amendment relating to vesting conditions and cancellationEffective date: 1 January 2009Under IFRS 2, a failure to meet a condition, other than a vesting condition, is treated as a cancellation. IFRS 2 specifies the accounting treatment of cancellations by an entity, but does not give guidance on the treatment of cancellations by a party other than the entity. The amendment requires cancellations by parties other than the entity to be accounted for in the same way as cancellations by the entity.The amendment will not impact on financial statements.
IFRS 3 Business Combinations: Comprehensive revision on applying the acquisition method and consequential amendments to IAS 27 Consolidated and Separate Financial Statements, IAS 28 Investments in Associates and IAS 31 Interest in Joint Ventures.Effective 1 July 2008The revised IFRS 3 retains the basic requirements of IFRS 3 (2004) to apply acquisition accounting to all business combinations within the scope of IFRS3, to identify the acquirer and to determine the acquisition date for every business combination. The most significant change is a move from a purchase price allocation approach to a fair value measurement principle.The revision is applicable prospectively and will not affect past business combinations.
IFRS 8 Operating SystemsEffective date: 1 January 2009IFRS 8 requires identification of operating segments on the basis of internal reports that are regularly reviewed by the “chief operating decision maker” in order to allocate to the segment and assess its performance. A reconciliation of reportable segments to the total reportable IFRS figures is required for the following items:
revenue•profit or loss before (or after; in certain circumstances) income tax expense/income and discontinued operations•assets•liabilities•every other material item of information disclosed as required by IFRS 8•
It is not expected that the implementation of IFRS 8 will have any significant effect on the financial statements.
IAS 23 Borrowing CostsEffective date: 1 January 2009The previous treatment of immediately recognising borrowing costs as an expense has been eliminated. The revision requires that borrowing costs that are directly attributable to the acquisition, construction or production of qualifying assets form part of the costs of that asset. The standard also states a number of exceptions to the above.The revision will not affect results as the current accounting policy is consistent with the revised standard.
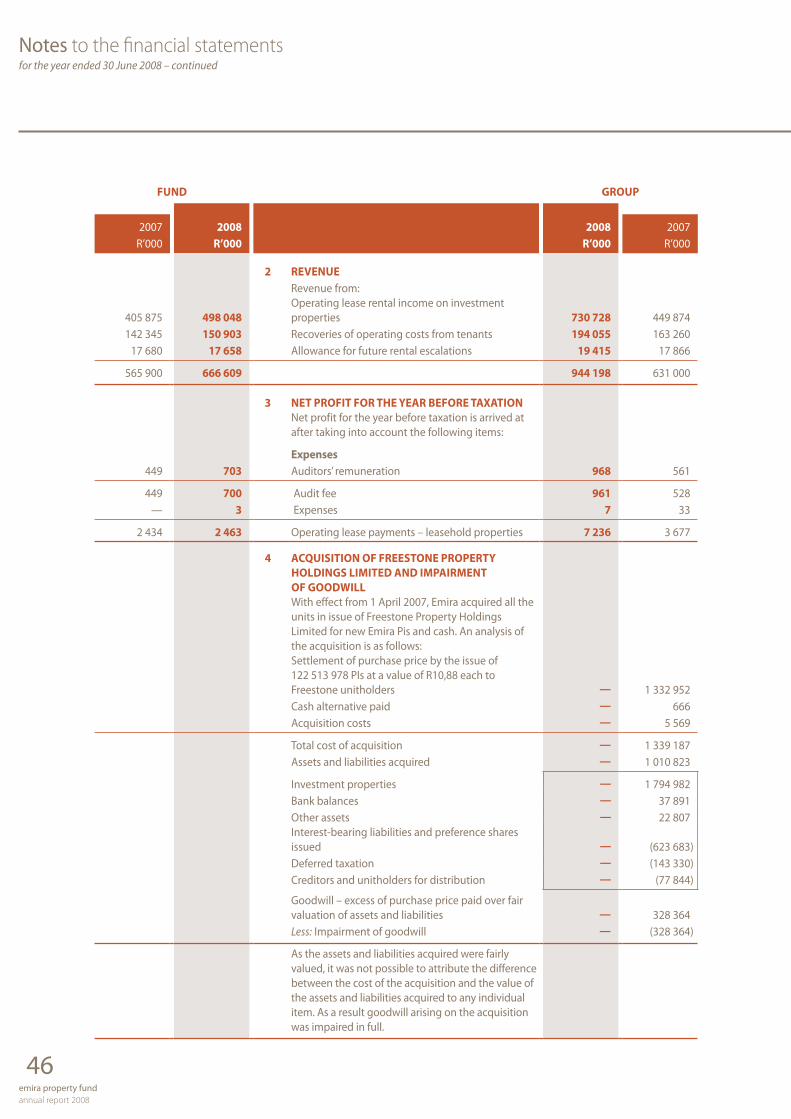
46emira property fund annual report 2008
Notes to the financial statementsfor the year ended 30 June 2008 – continued
FUnD GRoUP
2007 2008 2008 2007R’000 R’000 R’000 R’000
2 RevenUe Revenue from:
405 875 498 048 Operating lease rental income on investment
properties 730 728 449 874142 345 150 903 Recoveries of operating costs from tenants 194 055 163 260
17 680 17 658 Allowance for future rental escalations 19 415 17 866
565 900 666 609 944 198 631 000
3 net PRoFIt FoR tHe YeAR beFoRe tAxAtIon Net profit for the year before taxation is arrived at
after taking into account the following items:
expenses449 703 Auditors’ remuneration 968 561
449 700 Audit fee 961 528— 3 Expenses 7 33
2 434 2 463 Operating lease payments – leasehold properties 7 236 3 677
4 AcqUIsItIon oF FReestone PRoPeRtY HoLDInGs LIMIteD AnD IMPAIRMent oF GooDWILL
With effect from 1 April 2007, Emira acquired all the units in issue of Freestone Property Holdings Limited for new Emira Pis and cash. An analysis of the acquisition is as follows:
Settlement of purchase price by the issue of 122 513 978 PIs at a value of R10,88 each to Freestone unitholders — 1 332 952
Cash alternative paid — 666 Acquisition costs — 5 569
Total cost of acquisition — 1 339 187 Assets and liabilities acquired — 1 010 823
Investment properties — 1 794 982 Bank balances — 37 891 Other assets — 22 807 Interest-bearing liabilities and preference shares
issued — (623 683) Deferred taxation — (143 330) Creditors and unitholders for distribution — (77 844)
Goodwill – excess of purchase price paid over fair valuation of assets and liabilities — 328 364
Less: Impairment of goodwill — (328 364)
As the assets and liabilities acquired were fairly valued, it was not possible to attribute the difference between the cost of the acquisition and the value of the assets and liabilities acquired to any individual item. As a result goodwill arising on the acquisition was impaired in full.

47emira property fund
annual report 2008
Notes to the financial statementsfor the year ended 30 June 2008 – continued
FUnD GRoUP
2007 2008 2008 2007R’000 R’000 R’000 R’000
5 IFRs 2 ADJUstMent In ResPect oF PI-bAseD PAYMents
During the year PIs were issued which required the following IFRS 2 adjustments:
(24 822) (5 914) Discount on the issue of PIs to BEE partners (5 914) (24 822)
(67 526) — Acquisition of fixed property in exchange for the
issue of PIs — (67 526)
(92 348) (5 914) (5 914) (92 348)
6 FInAnce costs(54 788) (68 999) Interest paid on interest-bearing debt (115 273) (65 463)
— 7 635 Interest capitalised to the cost of developments* 7 635 —(438) — Amortised borrowing costs — (438)
— — Preference share dividends paid** (8 213) —18 442 103 176 Unrealised gain on interest-rate swaps 143 457 42 444
(36 784) 41 812 Total finance costs 27 606 (23 457)
* Interest was capitalised at an average rate of 9,78% per annum during the year.
** In 2008 preference share dividends paid have been included in finance costs. In 2007, preference share dividends amounted to R2 934 000 and were included in the statement of changes in equity.
7 InvestMent IncoMe— 150 083 Debenture interest received from subsidiary
3 349 3 670 Interest received on cash balances 5 864 4 495
3 349 153 753 Total interest received 5 864 4 495
8 tAxAtIon— — Deferred taxation 53 189 116 153
— — – Revaluation of investment properties 34 049 116 153— — – Other 19 140 —
— — 53 189 116 153
Reconciliation of the taxation charge392 108 118 096 Net profit before taxation at 28% (2007: 29%) 170 592 424 305
— — Rate change (8 948) —(392 108) (118 096) Exempt income (118 096) (392 108)
— — Non-allowable deductions 2 453 —— — Fair value adjustments 29 095 110 971— — Utilisation of losses (21 907) (27 015)
— — 53 189 116 153

48emira property fund annual report 2008
Notes to the financial statementsfor the year ended 30 June 2008 – continued
FUnD GRoUP
2007 2008 2008 2007R’000 R’000 R’000 R’000
9 eARnInGs PeR PARtIcIPAtoRY InteRest Reconciliation between earnings and headline
earnings and distribution payable: Net profit for the year 555 246 1 346 600 Adjusted for: Net fair value deficit/(gain) on investment properties 10 580 (1 506 339) Change in fair value of investment properties
as a result of straight-lining lease rentals 19 415 17 866 Change in fair value of investment properties
as a result of amortising upfront lease costs 13 565 9 130 Change in fair value as a result of property
appreciation in value (22 400) (1 533 335)
Impairment of goodwill — 328 364 Deferred taxation on revaluation of investment
properties 34 049 116 154
Headline earnings 599 875 284 779 Adjusted for: Allowance for future rental escalations (19 415) (17 866) Amortised upfront lease costs (13 565) (9 130) Unrealised gain on interest-rate swaps (143 457) (42 444) IFRS 2 adjustments in respect of PI-based payments 5 914 92 348 Maintenance fund expenses 3 977 2 018 Amortised borrowing costs — 438 Deferred taxation on revaluation of investment
properties 19 140 — Preference share dividends paid — (2 934)
Distribution payable to participatory interest holders 452 469 307 209
Distribution per participatory interest Interim (cents) 44,34 40,10 Special (cents) — 20,75 Final (cents) 47,70 21,50
92,04 82,35
Number of Pis in issue at the end of the year 492 818 989 488 514 461 Weighted average number of Pis in issue 491 221 327 370 939 438
earnings per participatory interest (cents) 113,03 363,02 The calculation of earnings per participatory interest
is based on net profit for the year of R555,2 million (2007: R1 346,6 million), divided by the weighted average number of participatory interests in issue during the year of 491 221 327 (2007: 370 939 438).
Headline earnings per participatory interest 122,12 76,77 The calculation of headline earnings per participatory
interest is based on net profit for the year, adjusted for the non-trading items, of R599,9 million (2007: R284,8 million), divided by the weighted average number of participatory interests in issue during the year of 491 221 327 (2007: 370 939 438).
Headline earnings for 2007 have been adjusted to comply with SAICA circular 8/2007 which is applicable for financial periods ending on or after 31 August 2007.

49emira property fund
annual report 2008
Notes to the financial statementsfor the year ended 30 June 2008 – continued
FUnD GRoUP
Freehold Freeholdand and
leasehold Furniture leasehold Furnitureland and and land and and
buildings equipment Total buildings equipment TotalR’000 R’000 R’000 R’000 R’000 R’000
10 InvestMent PRoPeRtIes net carrying value at 30 June 2008
3 217 202 64 266 3 281 468 Cost 4 405 858 70 424 4 476 282— (34 751) (34 751) Accumulated depreciation — (35 451) (35 451)
1 876 252 — 1 876 252 Revaluation surplus 2 882 970 — 2 882 970(18 635) — (18 635) Non-current assets held for sale (18 635) — (18 635)
5 074 819 29 515 5 104 334 7 270 193 34 973 7 305 166
Movement for the year4 951 518 33 011 4 984 529 Valuation at the beginning of the year 6 976 286 33 301 7 009 587
284 983 5 610 290 593 Additions 327 574 7 122 334 696(155 503) (2 095) (157 598) Disposals (169 503) (2 095) (171 598)
— 1 098 1 098 Disposals – accumulated depreciation — 1 098 1 098— (9 210) (9 210) Depreciation — (9 902) (9 902)
(1 101) 1 101 — Reclassification (5 449) 5 449 —(142 943) — (142 943) Deficit on revaluation (10 580) — (10 580)
156 500 — 156 500 Non-current assets held for sale
– prior year 170 500 — 170 500
(18 635) — (18 635) Non-current assets held for sale
– current year (18 635) — (18 635)
5 074 819 29 515 5 104 334 valuation at the end of the year 7 270 193 34 973 7 305 166
Reconciliation to independent valuations
5 074 819 29 515 5 104 334 Valuation at the end of the year –
as above 7 270 193 34 973 7 305 16686 790 — 86 790 Allowance for future rental escalations 130 004 — 130 00424 635 — 24 635 Unamortised upfront lease costs 37 631 — 37 63118 635 — 18 635 Non-current assets held for sale 18 635 — 18 635
5 204 879 29 515 5 234 394 Independent valuations
at 30 June 2008 7 456 463 34 973 7 491 436

50emira property fund annual report 2008
Notes to the financial statementsfor the year ended 30 June 2008 – continued
FUnD GRoUP
Freehold Freeholdand and
leasehold Furniture leasehold Furnitureland and and land and and
buildings equipment Total buildings equipment TotalR’000 R’000 R’000 R’000 R’000 R’000
10 InvestMent PRoPeRtIes continued
net carrying value at 30 June 20072 993 559 59 650 3 053 209 Cost 4 151 577 59 947 4 211 524
— (26 639) (26 639) Accumulated depreciation — (26 646) (26 646)2 114 459 — 2 114 459 Revaluation surplus 2 995 209 — 2 995 209
(156 500) — (156 500) Non-current assets held for sale (170 500) — (170 500)
4 951 518 33 011 4 984 529 6 976 286 33 301 7 009 587
Movement for the year2 990 903 34 968 3 025 871 Valuation at the beginning of the year 2 990 903 34 968 3 025 8711 006 498 8 001 1 014 499 Additions 874 663 8 299 882 962
Acquisition of Freestone Property— — — Holdings Limited 1 794 982 — 1 794 982
(23 215) — (23 215) Disposals (23 215) — (23 215)— (9 958) (9 958) Depreciation — (9 966) (9 966)
1 133 832 — 1 133 832 Surplus on revaluation 1 509 453 — 1 509 453
(156 500) — (156 500) Non-current assets held for sale
– current year (170 500) — (170 500)
4 951 518 33 011 4 984 529 valuation at the end of the year 6 976 286 33 301 7 009 587
Reconciliation to independent valuations
4 951 518 33 011 4 984 529 Valuation at the end of the year –
as above 6 976 286 33 301 7 009 58769 132 — 69 132 Allowance for future rental escalations 110 589 — 110 58924 066 — 24 066 Unamortised upfront lease costs 24 066 — 24 066
156 500 — 156 500 Non-current assets held for sale 170 500 — 170 500
5 201 216 33 011 5 234 227 Independent valuations
at 30 June 2007 7 281 441 33 301 7 314 742
Full details of freehold and leasehold investment properties owned by the group are available for inspection at the registered office of the group.In terms of its accounting policy, one third of the group’s property portfolio is valued annually by independent valuers.The properties were valued as at 30 June 2008 using a discounted cash flow approach based on future income streams, applying an appropriate capitalisation rate to each property.Independent valuations were carried out by CB Richard Ellis, Mills Fitchet (Natal) and Old Mutual, all registered valuers in terms of section 19 of the Property Valuers Profession Act (Act No 47 of 2000).The balance of the portfolio was valued by the directors on a similar basis.Investment properties classified as held for sale were valued at the lower of their carrying amount and fair value less costs to sell.Investment properties to the value of R7 305,2 million (2007: R7 009,6 million) have been used to provide security for loans taken out. See note 19.

51emira property fund
annual report 2008
Notes to the financial statementsfor the year ended 30 June 2008 – continued
FUnD GRoUP
2007 2008 2008 2007R’000 R’000 R’000 R’000
11 ALLoWAnce FoR FUtURe RentAL escALAtIons51 452 69 132 Opening balance 110 589 51 452
— — Subsidiary acquired — 41 27117 680 17 658 Income recognised during the year 19 415 17 866
69 132 86 790 Closing balance 130 004 110 589
12 UnAMoRtIseD UPFRont LeAse costs14 936 24 066 Opening balance 24 066 14 936
9 130 569 Expense deferred during the year 13 565 9 130
24 066 24 635 Closing balance 37 631 24 066
13 sUbsIDIARY coMPAnIes1 339 187 1 339 187 Shares at cost
(97 506) (20 200) Amounts owed to subsidiary companies
1 241 681 1 318 987
The group’s shares in Arnold Properties (Pty) Ltd have been pledged to Nedbank Limited as security for the issue of preference shares to them.
The group’s shares in Freestone Property Investments (Pty) Ltd have been pledged to Freestone Mortgage Bond SPV Series 1 (Pty) Ltd as security for the issue of CMBS notes.
14 AccoUnts ReceIvAbLe AnD PRePAYMents12 811 20 328 Trade receivables 26 681 18 006(4 492) (8 038) Less: Provision for non-recoverable receivables (11 146) (7 941)
8 319 12 290 Net trade receivables 15 535 10 0654 683 3 704 Prepayments 6 907 8 557
11 183 14 636 Other receivables 19 231 16 800
24 185 30 630 41 673 35 422
24 185 30 630 Due within one year 41 673 35 422
Ageing of receivables past due but not impaired4 690 2 926 30 days 4 971 6 2631 644 1 569 60 days 2 260 2 147
842 894 90 days 1 309 1 0121 143 6 901 120+ days 6 995 643
8 319 12 290 Total 15 535 10 065
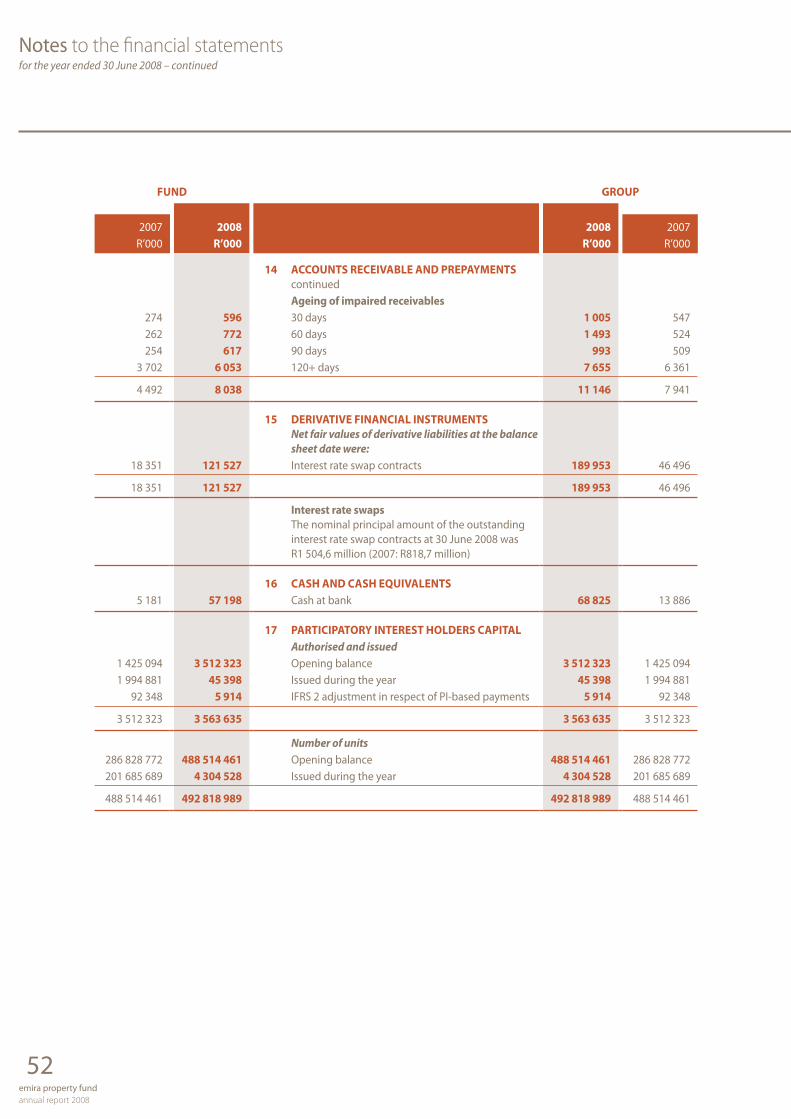
52emira property fund annual report 2008
Notes to the financial statementsfor the year ended 30 June 2008 – continued
FUnD GRoUP
2007 2008 2008 2007R’000 R’000 R’000 R’000
14 AccoUnts ReceIvAbLe AnD PRePAYMents continued
Ageing of impaired receivables274 596 30 days 1 005 547262 772 60 days 1 493 524254 617 90 days 993 509
3 702 6 053 120+ days 7 655 6 361
4 492 8 038 11 146 7 941
15 DeRIvAtIve FInAncIAL InstRUMents Net fair values of derivative liabilities at the balance
sheet date were:18 351 121 527 Interest rate swap contracts 189 953 46 496
18 351 121 527 189 953 46 496
Interest rate swaps The nominal principal amount of the outstanding
interest rate swap contracts at 30 June 2008 was R1 504,6 million (2007: R818,7 million)
16 cAsH AnD cAsH eqUIvALents5 181 57 198 Cash at bank 68 825 13 886
17 PARtIcIPAtoRY InteRest HoLDeRs cAPItAL Authorised and issued
1 425 094 3 512 323 Opening balance 3 512 323 1 425 0941 994 881 45 398 Issued during the year 45 398 1 994 881
92 348 5 914 IFRS 2 adjustment in respect of PI-based payments 5 914 92 348
3 512 323 3 563 635 3 563 635 3 512 323
Number of units286 828 772 488 514 461 Opening balance 488 514 461 286 828 772201 685 689 4 304 528 Issued during the year 4 304 528 201 685 689
488 514 461 492 818 989 492 818 989 488 514 461
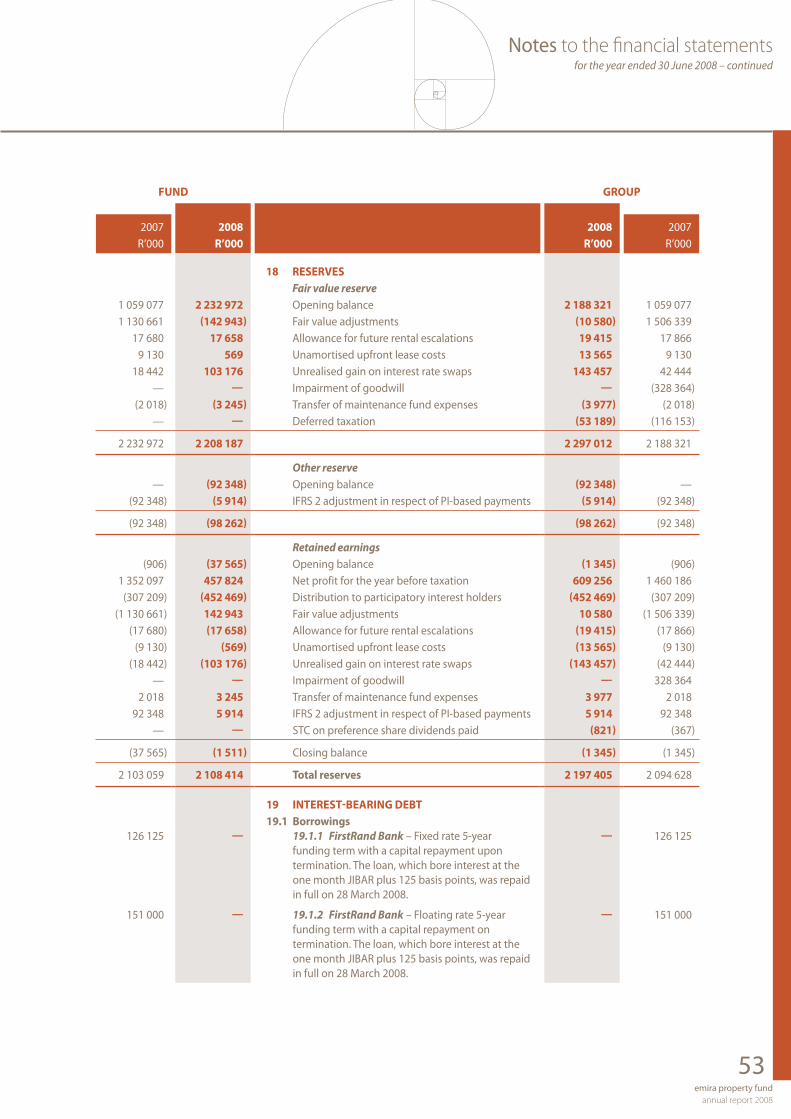
53emira property fund
annual report 2008
Notes to the financial statementsfor the year ended 30 June 2008 – continued
FUnD GRoUP
2007 2008 2008 2007R’000 R’000 R’000 R’000
18 ReseRves Fair value reserve
1 059 077 2 232 972 Opening balance 2 188 321 1 059 0771 130 661 (142 943) Fair value adjustments (10 580) 1 506 339
17 680 17 658 Allowance for future rental escalations 19 415 17 8669 130 569 Unamortised upfront lease costs 13 565 9 130
18 442 103 176 Unrealised gain on interest rate swaps 143 457 42 444— — Impairment of goodwill — (328 364)
(2 018) (3 245) Transfer of maintenance fund expenses (3 977) (2 018)— — Deferred taxation (53 189) (116 153)
2 232 972 2 208 187 2 297 012 2 188 321
Other reserve— (92 348) Opening balance (92 348) —
(92 348) (5 914) IFRS 2 adjustment in respect of PI-based payments (5 914) (92 348)
(92 348) (98 262) (98 262) (92 348)
Retained earnings(906) (37 565) Opening balance (1 345) (906)
1 352 097 457 824 Net profit for the year before taxation 609 256 1 460 186(307 209) (452 469) Distribution to participatory interest holders (452 469) (307 209)
(1 130 661) 142 943 Fair value adjustments 10 580 (1 506 339)(17 680) (17 658) Allowance for future rental escalations (19 415) (17 866)
(9 130) (569) Unamortised upfront lease costs (13 565) (9 130)(18 442) (103 176) Unrealised gain on interest rate swaps (143 457) (42 444)
— — Impairment of goodwill — 328 3642 018 3 245 Transfer of maintenance fund expenses 3 977 2 018
92 348 5 914 IFRS 2 adjustment in respect of PI-based payments 5 914 92 348— — STC on preference share dividends paid (821) (367)
(37 565) (1 511) Closing balance (1 345) (1 345)
2 103 059 2 108 414 total reserves 2 197 405 2 094 628
19 InteRest-beARInG Debt19.1 borrowings
126 125 — 19.1.1 FirstRand Bank – Fixed rate 5-year funding term with a capital repayment upon
— 126 125
termination. The loan, which bore interest at the one month JIBAR plus 125 basis points, was repaid in full on 28 March 2008.
151 000 — 19.1.2 FirstRand Bank – Floating rate 5-year funding term with a capital repayment on
— 151 000
termination. The loan, which bore interest at the one month JIBAR plus 125 basis points, was repaid in full on 28 March 2008.
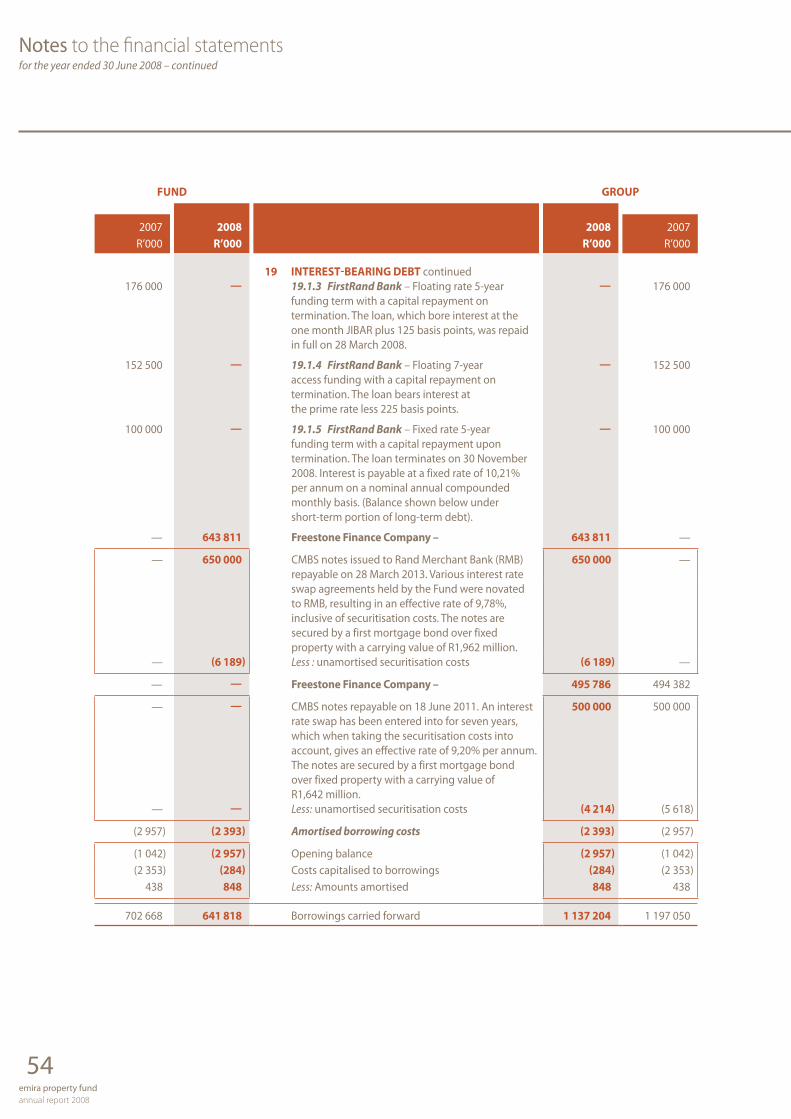
54emira property fund annual report 2008
Notes to the financial statementsfor the year ended 30 June 2008 – continued
FUnD GRoUP
2007 2008 2008 2007R’000 R’000 R’000 R’000
19 InteRest-beARInG Debt continued176 000 — 19.1.3 FirstRand Bank – Floating rate 5-year
funding term with a capital repayment on— 176 000
termination. The loan, which bore interest at the one month JIBAR plus 125 basis points, was repaid in full on 28 March 2008.
152 500 — 19.1.4 FirstRand Bank – Floating 7-year access funding with a capital repayment on
— 152 500
termination. The loan bears interest at the prime rate less 225 basis points.
100 000 — 19.1.5 FirstRand Bank – Fixed rate 5-year funding term with a capital repayment upon
— 100 000
termination. The loan terminates on 30 November 2008. Interest is payable at a fixed rate of 10,21% per annum on a nominal annual compounded monthly basis. (Balance shown below under short-term portion of long-term debt).
— 643 811 Freestone Finance company – 643 811 —
— 650 000 CMBS notes issued to Rand Merchant Bank (RMB) repayable on 28 March 2013. Various interest rate
650 000 —
swap agreements held by the Fund were novated to RMB, resulting in an effective rate of 9,78%, inclusive of securitisation costs. The notes are secured by a first mortgage bond over fixed property with a carrying value of R1,962 million.
— (6 189) Less : unamortised securitisation costs (6 189) —
— — Freestone Finance company – 495 786 494 382
— — CMBS notes repayable on 18 June 2011. An interest rate swap has been entered into for seven years,
500 000 500 000
which when taking the securitisation costs into account, gives an effective rate of 9,20% per annum. The notes are secured by a first mortgage bond over fixed property with a carrying value of R1,642 million.
— — Less: unamortised securitisation costs (4 214) (5 618)
(2 957) (2 393) Amortised borrowing costs (2 393) (2 957)
(1 042) (2 957) Opening balance (2 957) (1 042)(2 353) (284) Costs capitalised to borrowings (284) (2 353)
438 848 Less: Amounts amortised 848 438
702 668 641 818 Borrowings carried forward 1 137 204 1 197 050

55emira property fund
annual report 2008
Notes to the financial statementsfor the year ended 30 June 2008 – continued
FUnD GRoUP
2007 2008 2008 2007R’000 R’000 R’000 R’000
19 InteRest-beARInG Debt continued702 668 641 418 borrowings 1 137 204 1 197 050
— — Preference shares issued to Nedbank Ltd redeemable 3 years after issue ie. on 31 January 2010
90 000 90 000
short-term portion of interest-bearing debt— — Nedbank limited – interest at the prime rate less
175 basis points— 9 238
— 100 000 FirstRand Bank – Fixed rate 5-year funding term with a capital repayment in full due on 30 November 2008.
100 000 —
702 668 741 418 Total borrowings 1 327 204 1 296 288
Debt funding In terms of the trust deed, the fund’s aggregated
indebtedness may not exceed an amount equal to 30% of the gross value of the underlying assets of the Fund. At 30 June 2008, the aggregate indebtedness amounted to 17,2% of the gross value of the underlying assets. As at 30 June 2008 Emira had a total debt facility available of R1,790 million.
Various swaps have been entered into. The breakdown is as follows:
Rate Amount % of (%) Term (Rm) debt
Debt – fixed 10,21 November 2008 100,0 7,5 – swap 9,38 December 2014 — —Preference shares – floating 10,91* January 2010 90,0 6,7Debt – swap 9,78 April 2013 650,0 48,5Debt – swap 9,20 June 2013 500,0 37,3
Total 9,67 1 340,0 100,0
Less: Costs capitalised not yet amortised (12,8)
Per balance sheet 1 327,2* Using a prime rate of 15,5% per annum.
FUnD GRoUP
2007 2008 2008 2007R’000 R’000 R’000 R’000
20 AccoUnts PAYAbLe2 946 7 111 Trade payables 9 843 4 076
24 833 27 135 Tenant deposits 41 093 36 20138 406 36 280 Accrued expenses 54 642 59 444
9 012 20 840 Prepaid debtors 25 451 13 11426 419 22 828 Other payables 24 867 31 030
101 616 114 194 155 896 143 865
101 615 114 194 Due within one year 155 896 143 865

56emira property fund annual report 2008
Notes to the financial statementsfor the year ended 30 June 2008 – continued
FUnD GRoUP
2007 2008 2008 2007R’000 R’000 R’000 R’000
21 notes to tHe cAsH FLoW stAteMent Cash generated from operations
1 352 097 457 824 Net profit for the year adjusted for: 609 256 1 463 120(1 130 661) 142 943 Fair value adjustments 10 580 (1 506 339)
(17 680) (17 658) Allowance for future rental escalations (19 415) (17 866)(9 130) (569) Unamortised upfront lease costs (13 565) (9 130)
— — Impairment of goodwill — 328 36492 348 5 914 IFRS 2 adjustment in respect of PI-based payments 5 914 92 34854 788 68 999 Interest paid 123 486 65 463
— (7 635) Interest capitalised to the cost of developments (7 635) —(18 444) (103 176) Unrealised gain on interest rate swaps (143 457) (42 444)
438 — Amortised borrowing costs — 438(3 349) (153 753) Interest received (5 864) (4 495)9 958 9 210 Depreciation 9 902 9 966
330 365 402 099 Operating profit before working capital changes 569 202 379 425(12 497) (6 445) Increase in accounts receivable and prepayments (6 251) (23 734)51 085 12 578 Increase in accounts payable 11 974 93 334
368 953 408 232 cash generated from operations 574 925 449 025
Distribution to participatory interest holders(109 157) (103 959) Distribution payable at the beginning of the year (103 959) (109 157)(307 209) (452 469) Distribution for the year (452 469) (307 209)103 959 235 075 Distribution payable at the end of the year 235 075 103 959
(312 407) (321 353) Distribution paid to participatory interest holders (321 353) (312 407)
22 ReLAteD PARtIes AnD ReLAteD PARtY tRAnsActIons
Momentum Group (“Momentum”) is the major participatory interest holder. At 30 June 2008, Momentum owned 34,4% of the Fund’s participatory interests and the Fund’s BEE partners – The Tiso Group, The Shalamuka Foundation, Avuka Investments, The RMBP Broad Based Empowerment Trust and Mr B van der Ross- held 12,4%. The remaining 53,2% were widely held.
the following transactions were carried out with related parties:
strategic Real estate Managers (Proprietary) Limited
21 941 33 431 Expenditure comprising asset management fees 33 431 21 941
Relationship: Associated company of the FirstRand Group

57emira property fund
annual report 2008
Notes to the financial statementsfor the year ended 30 June 2008 – continued
FUnD GRoUP
2007 2008 2008 2007R’000 R’000 R’000 R’000
22 ReLAteD PARtIes AnD ReLAteD PARtY tRAnsActIons continued
Rand Merchant bank a division of FirstRand bank Limited
705 625 750 000 Long-term interest bearing debt 750 000 705 625
38 571 68 324 Net finance cost in respect of long-term interest-
bearing debt 68 324 38 217— 39 589 Cash on call 39 589 —— 1 214 Finance income on cash on call 1 214 —
Relationship: Associated company of the FirstRand Group
451 814 232 671 RMb Properties (Proprietary) Limited 248 098 483 099
51 461 32 670 Expenditure comprising: property management
fee and letting commissions 48 097 55 111— 29 897 Purchase consideration of Faerie Glen Phase 4 29 897 —
215 617 25 875 Purchase consideration of RTT Acsa Park 25 875 215 61743 650 — Purchase consideration of Newlands Terraces — 43 650
132 889 — Purchase consideration of Worldwear Fashion Mall — 132 8898 197 144 229 Development expenditure 144 229 35 832
Relationship: Associated company of the FirstRand Group
450 400 26 259 Momentum Limited 26 259 450 400
— 26 259 Purchase consideration of Builders Express 26 259 —
406 400 — Purchase consideration of Wonderpark Shopping
Centre — 406 40044 000 — Purchase consideration of Wesbank House — 44 000
Relationship: Associated company of the FirstRand Group
The above transactions were carried out on commercial terms and conditions no more favourable than those available in similar arm’s length dealings at market-related rates.
23 MInIMUM contRActeD RentAL IncoMe The group has rental income receivable in terms
of operating lease contracts:431 748 487 195 – Due within one year 707 037 602 396868 676 979 240 – Due within two to five years 1 342 394 1 169 807169 256 176 402 – Due beyond five years 217 117 192 913
1 469 680 1 642 837 2 266 548 1 965 116

58emira property fund annual report 2008
Notes to the financial statementsfor the year ended 30 June 2008 – continued
FUnD GRoUP
2007 2008 2008 2007R’000 R’000 R’000 R’000
24 coMMItMents AnD contInGencIes Authorised capital expenditure
237 605 124 794 – Committed 150 112 237 605
operating lease commitments Commitments due in respect of leases entered into
on leasehold properties:5 376 2 289 – Due within one year 7 335 5 376
31 878 11 296 – Due within two to five years 34 259 31 878580 515 1 625 738 – Due beyond five years 2 144 453 580 515
617 769 1 639 323 2 186 047 617 769
contingencies The Fund had no material contingent liabilities
at 30 June 2008.
25 Post bALAnce sHeet events See page 18 of the Manager’s report.
26 seGMent InFoRMAtIon The Fund’s activities are divided into three main categories namely: Retail – Comprises shopping centres Office – Comprises decentralised commercial properties Industrial – Comprises industrial properties
Retail Office Industrial Corporate TotalSectoral segments R’000 R’000 R’000 R’000 R’000
June 2008Revenue 369 742 427 221 147 235 — 944 198
Revenue 365 745 420 881 138 157 — 924 783 Allowance for future rental escalation 3 997 6 340 9 078 — 19 415
segmental result — Net income from property rental operations 243 453 283 169 106 757 (37 122) 596 257 other information — Investment properties 2 695 890 3 448 681 1 328 230 — 7 472 801
June 2007Revenue 251 240 296 850 82 910 — 631 000
Revenue 244 200 288 384 80 550 — 613 134 Allowance for future rental escalation 7 040 8 466 2 360 — 17 866
segmental result — Net income from property rental operations 154 507 184 356 55 845 3 765 398 473 other informationInvestment properties 2 784 378 3 317 664 1 212 700 — 7 314 742
No segment analysis of liabilities and the related interest payable has been presented as liabilities cannot be linked to specific properties.

59emira property fund
annual report 2008
Notes to the financial statementsfor the year ended 30 June 2008 – continued
26 seGMent InFoRMAtIon continued
Retail Office Industrial Corporate TotalGeographical segments R’000 R’000 R’000 R’000 R’000
June 2008Revenue– Gauteng 244 078 312 810 111 880 — 668 768 – Western and Eastern Cape 33 877 59 361 11 405 — 104 643 – KwaZulu-Natal 60 684 40 517 23 950 — 125 151 – Free State 31 103 14 533 — — 45 636
369 742 427 221 147 235 — 944 198
Investment properties– Gauteng 1 885 140 2 529 244 1 023 500 — 5 437 884 – Western and Eastern Cape 246 500 537 232 129 730 — 913 462 – KwaZulu-Natal 399 350 285 980 175 000 — 860 330 – Free State 164 900 96 225 — — 261 125
2 695 890 3 448 681 1 328 230 — 7 472 801
June 2007Revenue– Gauteng 188 766 227 527 52 193 — 468 486 – Western and Eastern Cape 17 514 32 875 11 244 — 61 633 – KwaZulu-Natal 16 154 32 834 19 473 — 68 461 – Free State 28 806 3 614 — — 32 420
251 240 296 850 82 910 — 631 000
Investment properties– Gauteng 2 050 043 2 427 099 928 605 — 5 405 747 – Western and Eastern Cape — 498 725 122 905 — 621 630 – KwaZulu-Natal 504 635 293 910 161 190 — 959 735 – Free State 229 700 97 930 — — 327 630
2 784 378 3 317 664 1 212 700 — 7 314 742
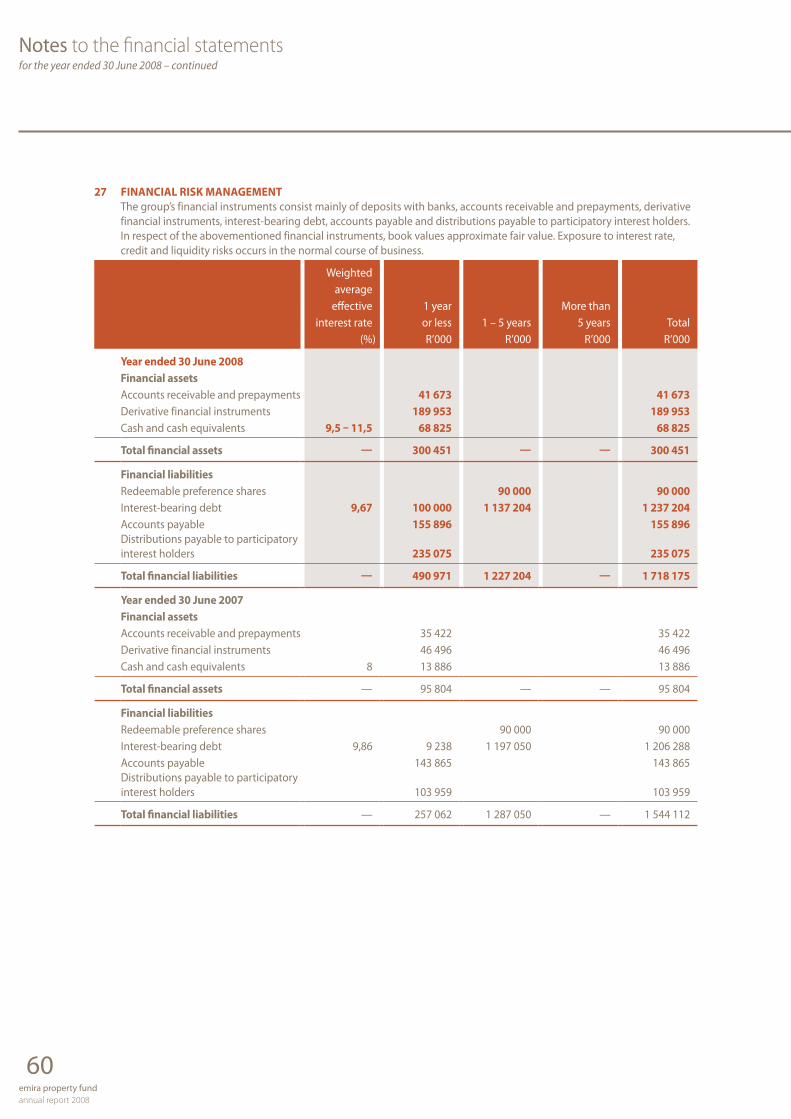
60emira property fund annual report 2008
Notes to the financial statementsfor the year ended 30 June 2008 – continued
27 FInAncIAL RIsK MAnAGeMentThe group’s financial instruments consist mainly of deposits with banks, accounts receivable and prepayments, derivative financial instruments, interest-bearing debt, accounts payable and distributions payable to participatory interest holders. In respect of the abovementioned financial instruments, book values approximate fair value. Exposure to interest rate, credit and liquidity risks occurs in the normal course of business.
Weightedaverage
effective 1 year More thaninterest rate or less 1 – 5 years 5 years Total
(%) R’000 R’000 R’000 R’000
Year ended 30 June 2008Financial assetsAccounts receivable and prepayments 41 673 41 673 Derivative financial instruments 189 953 189 953 Cash and cash equivalents 9,5 – 11,5 68 825 68 825
total financial assets — 300 451 — — 300 451
Financial liabilitiesRedeemable preference shares 90 000 90 000 Interest-bearing debt 9,67 100 000 1 137 204 1 237 204 Accounts payable 155 896 155 896 Distributions payable to participatory interest holders 235 075 235 075
total financial liabilities — 490 971 1 227 204 — 1 718 175
Year ended 30 June 2007Financial assetsAccounts receivable and prepayments 35 422 35 422 Derivative financial instruments 46 496 46 496 Cash and cash equivalents 8 13 886 13 886
total financial assets — 95 804 — — 95 804
Financial liabilitiesRedeemable preference shares 90 000 90 000 Interest-bearing debt 9,86 9 238 1 197 050 1 206 288 Accounts payable 143 865 143 865 Distributions payable to participatory interest holders 103 959 103 959
total financial liabilities — 257 062 1 287 050 — 1 544 112
61emira property fund
annual report 2008
Notes to the financial statementsfor the year ended 30 June 2008 – continued
27 FInAncIAL RIsK MAnAGeMent continuedcash and cash equivalentsIt is the group’s policy to deposit short-term cash investments with reputable financial institutions.
Liquidity risk managementLiquidity risk is the risk that the group will be unable to meet its financial commitments. The risk is minimised by holding cash balances and by a floating loan facility. In addition, the company monitors liquidity risk by regularly monitoring forecast cash flows.The group’s borrowings are limited to 30% of the value of the group’s property portfolio. The company’s utilised borrowing capacity at 30 June 2008 can be summarised as follows:
2008 2007R’000 R’000
Valuation of property portfolio 7 491 436 7 314 742 30% thereof 2 247 431 2 194 423 Total borrowings 1 327 204 1 296 288
Unutilised borrowing capacity 920 227 898 135
Interest rate risk managementThe group‘s exposure to interest rates on financial instruments at balance sheet date is set out on page 55.
Interest rates are constantly monitored and appropriate steps are taken to ensure that Emira’s exposure to interest rate fluctuations is limited. Interest rates have been fixed for extended periods ranging from 2013 to 2018. The average rate of interest at year-end (applicable to the fixed interest rate agreements) was 9,67% (2007: 9,86%). At year-end 6,7% of Emira’s debt was subject to a variable or floating interest rate and was not covered by an interest rate swap agreement. An increase in the prime interest rate of 1% per annum would result in an increase in interest payable, of R633 600 per annum, in respect of the floating portion of the Fund’s debt.
credit risk managementCredit risk is limited to the carrying amount of financial assets at the balance sheet date.
Potential areas of credit risk consist of trade receivables and short-term cash investments. Trade receivables consist of a large, widespread tenant base. All specific doubtful debts have been impaired and at year-end management did not consider there to be any material credit risk exposure that was not already covered by an impairment adjustment.
The impairment adjustment at 30 June 2008 was R11,1 million (2007: R7,9 million) net of tenants’ deposits and guarantees held as security. The company held cash deposits and guarantees with a fair value of R67,1 million at 30 June 2008 (2007: R51,9 million).
The specifically impaired receivables relate to tenants who have either been handed over for non-payment, or have vacated the premises.
It is expected that a portion of the specifically impaired receivables will be recovered.
The allowance for impaired receivables and receivables written off are included in property expenses. Amounts charged to the allowance will be written off when all avenues for recovery have been exhausted and there is no expectation that any further cash will be received.
At balance sheet date no geographic area, rental sector or size of tenant had been identified as a specific credit risk.
Receivables past due but not impairedReceivables are considered to be “past due” when they are uncollected one day or more beyond their contractual due date.
As at 30 June 2008, trade receivables of R15,5 million (2007: R10,1 million) were considered past due but not impaired. These include varied tenants with no recent history of payment default.

62emira property fund annual report 2008
Type Property Location Major Tenant GLA
Jun 08 valuation
(R’000)
Weighted average
rental/m² % of
sector% of
portfolio
Offices 100 on Armstrong 100 Armstrong Avenue, Forest Park, La Lucia Ridge, Durban
SAP Africa (Pty) Ltd, Imperial Bank (Pty) Limited, DBC Woven (Pty) Ltd, Pastel Software (Pty) Ltd, RMB Asset Management (Pty) Ltd
2 871 33 000 111,72 1,0% 0,4%
Offices 1059 Schoeman Street 1059 Schoeman Street, Hatfield
SABC Ltd, United Nations Office for Drug Control & Crime Prevention, The Embassy of Ireland, Khuthele Projects (Pty) Ltd
6 048 52 600 78,52 1,5% 0,7%
Office 12 Baker Street 12 Baker Street, Rosebank Sasol Group Services (Pty) Limited 4 636 44 100 * 1,3% 0,6%
Offices 122 Pybus Road 122 Pybus Road, Sandton Rennies Travel (Pty) Ltd, SBT Juul South Africa, MECS Africa Pty Ltd, Zim Integrated Shipping Services SA (Pty) Ltd, TAS Appointments and Management Services CC
5 299 32 400 68,38 0,9% 0,4%
Office 2 Sturdee Avenue 2 Sturdee Avenue, Rosebank Sasol Group Services (Pty) Limited 5 603 51 500 * 1,5% 0,7%
Offices 267 West 267 West Avenue, Centurion Afgri Capital A Division of Afgri Operations Limited, FirstRand Bank Limited, FNB Life, Momentum Group Limited
9 799 83 400 87,72 2,4% 1,1%
Office Albury Park Magalieszicht Avenue, Dunkeld West
Resolve SA (Pty) Ltd, Front Range Solutions SA (Pty) Ltd, Trilion Video SA (Pty) Ltd, Northam Platinum Limited, Bowers Incorporated
8 152 68 500 77,29 2,0% 0,9%
Offices Bank Forum 337 Bronkhorst Street, New Muckleneuk, Pretoria
Newtons Incorporated, Nedbank Limited, Bild Architects, FirstRand Bank Ltd, Old Mutual Life Assurance Company SA Ltd
7 687 59 600 82,67 1,7% 0,8%
Office Barvic House 4 Burker Street, Kensington B, Randburg
Platinum Reload (Pty) Ltd, PIM Services, Medigroup
3 322 9 860 38,53 0,3% 0,1%
Offices Boundary Terraces 1 Mariendahl Lane, Newlands, Cape Town
Citadel Investment Service Ltd, Pinnacle Point Investments (Pty) Ltd, Saving & Investment Association, Resafrica (Pty) Ltd
8 205 130 000 121,57 3,7% 1,7%
Offices Braamfontein Centre 23 Jorissen Street, Braamfontein
Pick n Pay, CTH Legal Administration Trust, City of Joburg Property Company (Pty) Limited, The Ford Foundation, Open Society Initiative for Southern Africa, Jet Education Services (Pty) Ltd
21 308 121 500 56,33 3,5% 1,6%
Offices Bradenham Hall Mellis Avenue, Rivonia Millward Brown SA (Pty) Ltd, Qad Software South Africa (Pty) Ltd, Strats Solutions CC
4 569 41 800 62,17 1,2% 0,6%
Offices Brooklyn Office Park Nicolson Street, Brooklyn Moores Rowland, Fast Communication Systems (Pty) Ltd, Foundation for Professional Developments (Pty) Ltd, Austrian Embassy, Synovate (Pty) Ltd
5 364 35 000 81,49 1,0% 0,5%
Office CBC House 261 Surrey Avenue, Ferndale Advtech Resourcing (Pty) Ltd 2 516 8 000 41,95 0,2% 0,1%
Offices Century Gate Cnr Century Boulevard & Bosmandam Road, Century City
FirstRand Bank Limited, Afroteq Facilites Management (Pty) Ltd, Sunair Holdings Limited
1 366 11 000 86,66 0,3% 0,1%
Office Chiappini House 26 Chiappini Street, Cape Town
Icicle Investments (Pty) Ltd, Diamond’s Discount Liquor (Pty) Ltd, The Propfin Trading Trust, Diana Christine Davis
1 020 10 000 75,56 0,3% 0,1%
Office Ciros House 41A Homestead Avenue, Edenburg
The Glass Recycling Company (Pty) Ltd 1 838 13 600 54,08 0,4% 0,2%
Office CRB House Cnr Kramer & Desmond Roads, Kramerville
St Leger & Viney (Pty) Ltd, XDSL Trading 561 (Pty) Ltd
5 068 34 600 37,16 1,0% 0,5%
Property listing(including new acquisitions)
*Single tenant – weighted average of all single tenant buildings in office sector – R87,40/m2

63emira property fund
annual report 2008
Type Property Location Major Tenant GLA
Jun 08 valuation
(R’000)
Weighted average
rental/m² % of
sector% of
portfolio
Offices Dalefern 284 Oak Avenue, Ferndale Only the Best (Pty) Ltd, Primedia at Home (Pty) Ltd, Population Council, Health Science Academy (Pty) Ltd
3 792 21 200 53,99 0,6% 0,3%
Offices Deloitte Cnr Fehrsen Street & Waterkloof Road, Brooklyn
Deloitte and Touche 4 094 45 000 * 1,3% 0,6%
Offices Derby Downs 9 Derby Place & 4 Sookhai Place, Derby Downs
Lafarge South Africa (Pty) Ltd, McCarthy Limited, Healthbridge
2 205 18 200 81,93 0,5% 0,2%
Offices Discovery Health 2 Frosterley Crescent, La Lucia Ridge, Umhlanga Rocks, Durban
Discovery Health (Pty) Ltd 2 312 28 920 * 0,8% 0,4%
Offices Dorbyl Parktown 16 Jan Smuts Avenue, Parktown
Pyromet (Pty) Ltd 2 346 25 700 72,46 0,7% 0,3%
Office Dresdner House 2 North Road, Dunkeld West Dresdner Bank, Interact Research Design & Training CC
892 7 300 189,98 0,2% 0,1%
Offices East Coast Radio House 314/7 Umhlanga Rocks Drive, Umhlanga Rocks
East Coast Radio (Pty) Ltd, Strauss Daly Inc, Absa Bank Limited, Seekers World Travel
5 714 55 500 88,59 1,6% 0,7%
Offices East Rand Junction Cnr North & K90, Boksburg Hammond Pole Inc, Afgri Operations Limited, Virtual Card Acquiring (Pty) Limited, Wesbank
6 710 45 200 71,26 1,3% 0,6%
Offices Epsom Downs Office Park 13 Sloane Street, Bryanston Angor Property Specialists (Pty) Ltd, Modernarch Offices (Pty) Ltd, Standard Bank of SA Ltd, Mint Net (Pty) Ltd, WBHO Construction (Pty) Ltd
9 841 83 300 79,67 2,4% 1,1%
Offices Faerie Glen 291 Sprite Avenue, Faerie Glen
VIP Personnel & Payroll Systems (Pty) Ltd, FirstRand Bank Ltd, Sanlam Life Insurance Ltd, Simeka Employee Benefits (Pty) Ltd
10 324 124 500 92,48 3,6% 1,7%
Office Fleetway House 17 Martin Hammerschlag Way, Cape Town
Sea Harvest Corporation Limited, Print Active CC, The Property Administrators (Pty) Ltd, Management Computer Services, Enroute Traders (Pty) Ltd
7 111 44 110 53,60 1,3% 0,6%
Office Fluor Building 1 Kikuyu Street, Sunninghill Fluor SA (Pty) Ltd 7 845 78 500 * 2,3% 1,0%
Office FNB Building 33-39 Heerengracht Street, Cape Town
First National Bank Limited, Mariams Kitchen, School of Shipping CC
6 745 19 182 64,59 0,6% 0,3%
Offices FNB Midrand Cnr 16th & Old Pretoria Road, Midrand
First National Bank of SA Limited, Healthtech Laboratories (Pty) Ltd
2 532 12 200 68,43 0,4% 0,2%
Offices Gateview 3 Sugar Close, Umhlanga Almar Agencies, Private Property Listing, The Internet Solutions (Pty) Ltd, VJV Consultants
2 727 26 140 88,18 0,8% 0,3%
Office Georgian Place 18 Southway Road, Kelvin Sweets From Heaven Franchise (Pty) Ltd, Kwesuba Consulting (Pty) Ltd, JPC Restaurants CC, Infinex Financial Services Pty Ltd, JD Grota
12 477 48 673 40,97 1,4% 0,6%
Office Hamilton House 30 Chiappini Street, Cape Town
BBDO (Pty) Ltd, Chiappini’s Pizza & Pasta 3 449 36 400 70,02 1,0% 0,5%
Office Harbour Place Cnr Oswald Pirow & Martin Hammerschlag Way, Cape Town
Hyundai Automotive South Africa (Pty) Ltd, Raft Holdings, Tracker Network (Pty) Ltd, Metal & Engineering Industries Bargaining Council
5 395 43 300 60,51 1,2% 0,6%
Office Harrogate Park Pretorius Street, Hatfield, Pretoria
Family Trust Management Services (Pty) Ltd, Strachan & Crouse, Affirmative Portfolio, KPMG Services (Pty) Ltd
1 711 13 100 68,74 0,4% 0,2%
Property listing(including new acquisitions) – continued
*Single tenant – weighted average of all single tenant buildings in office sector – R87,40/m2

64emira property fund annual report 2008
Type Property Location Major Tenant GLA
Jun 08 valuation
(R’000)
Weighted average
rental/m² % of
sector% of
portfolio
Office Herdbuoys Building 6 Kikuyu Road, Sunninghill, Sandton
Herdbuoys McCann-Erickson Pty Ltd 5 370 61 500 * 1,8% 0,8%
Office Howick Gardens Becker Street, Waterfall Park, Midrand
Cipla Medpro Pty Ltd, Minco Mineral Holdings (pty) Ltd, Postilion International Ltd, Inkwali Engineering Services
3 075 19 400 61,62 0,6% 0,3%
Office Hurlingham Office Park Cnr Republic & William Nicol Streets, Hurlingham
Computer Software Consultants (Pty) Ltd, Pambili Document Solutions (Pty) Ltd, consumer Goods Council of SA, Hurlingham Office Suites CC, Tsebo Holdings and Operations (Pty) Ltd
15 430 99 915 78,26 2,9% 1,3%
Office Hyde Park Lane Cnr Jan Smuts & William Nicol Drive, Hyde Park
The Standard Bank of SA, Willis RE (Pty) Ltd, Property Marketers CC, Tag Travel (Pty) Ltd, Dynamic Visual Technologies (Holdings)
15 300 179 000 82,43 5,2% 2,4%
Office Iustitia Building Cnr St Andrews & Aliwal Streets, Bloemfontein
Society of Advocates, Mutual & Federal, Departement van Openbare Werke
5 360 22 200 54,02 0,6% 0,3%
Offices Knightsbridge Manor 33 Sloane Street, Bryanston Ext 4
Afgri Operations Limited, Norilsk Nickel Africa (Pty) Ltd, Dovetail Business Solutions (Pty) Ltd, Motswedi TLC Software (Pty) Ltd,
9 589 68 133 81,80 2,0% 0,9%
Office Kuehne & Nagel House 381 Berea Road, Bulwer, Durban
Kuehne & Nagel (Pty) Ltd, Port Natal Lodge, Small Enterprise Development Agency
2 140 8 775 — 0,3% 0,1%
Offices Lake Buena Vista 1 Gordon Hood Avenue, Centurion
Outsurance 6 894 49 689 — 1,4% 0,7%
Offices Lincoln Wood Office Park Woodlands Drive, Woodmead African legent Indigo (Pty) Ltd, SA Rail Commuter Corporation Ltd, Intertie Property Management Services (Pty) Ltd, ZTE Corporation SA, Reunert Management Services
10 911 102 100 88,90 2,9% 1,4%
Office Linkview 260 kent Avenue, Ferndale, Randburg
Aqua Engineering SA (Pty) Ltd, Ability Financial Advisors (Pty) Ltd, Verify Solutions (Pty) Ltd
1 496 6 800 57,35 0,2% 0,1%
Offices Lone Creek Cnr Mac Mac & Howick Close, Midrand
Cement and Concrete Institute, End User Finance, Hoge Presentation & Graphics, Batseta Consulting CC
5 659 36 500 58,70 1,1% 0,5%
Offices Lynnridge Mews Cnr Hibiscus Street & Jacobsen
Phakama Funeral Society (Pty) Ltd, Freeworld Travel (Pty) Ltd, Defence Dynamics
3 533 16 800 81,27 0,5% 0,2%
Offices Menlyn Cnr Lois & Gobie Streets, Menlyn
Absa Bank Limited, The Standard Bank of South Africa Limited, First National Asset Management and Trust Company, FirstRand Bank Limited, Van Zyl, Le Roux & Hurter Incorporated
9 850 98 500 93,01 2,8% 1,3%
Offices Midrand Business Park 563 Main Road, Halfway House, Midrand
Construction Education & Training Authority, Land Use Transport & Environmental Specialists (Pty) Ltd, Postnet Southern Africa (Pty) Ltd, Ngubane & Co Management Consultants (Pty) Ltd, Celtrac (Pty) Ltd
13 373 56 500 46,73 1,6% 0,8%
Offices Momentum House Cnr Stanger, Prince Albert & Dunford Roads, Kingsmead, Durban
Telesure Group Services (Pty) Ltd, Grafton Everest, Larson Burton & Falconer Inc, Tshwane University of Technology
6 249 49 100 76,18 1,4% 0,7%
Offices Newlands Terraces 8 Boundary Road, Newlands UCS Solutions (Pty) Ltd, The Western Province Rugby Football Union, Taquanta Asset Management (Pty) Ltd
4 251 66 290 88,58 1,9% 0,9%
Property listing(including new acquisitions) – continued
*Single tenant – weighted average of all single tenant buildings in office sector – R87,40/m2

65emira property fund
annual report 2008
Type Property Location Major Tenant GLA
Jun 08 valuation
(R’000)
Weighted average
rental/m² % of
sector% of
portfolio
Offices Nimas House 5 The Boulevard, Westway Office Park, Westville
Metropolitan Health Corporate (Pty) Ltd, Uniclox (Pty) Ltd
1 373 15 000 118,18 0,4% 0,2%
Office Olivedale Office Park Cnr Olive & Lima Street, Olivedale, Randburg
DNA Telesales CC, IDA Biz SA CC, CRS Holdings, Birthday Suit Corporate Gifts CC
3 213 15 500 50,79 0,4% 0,2%
Office Omni Centre 73 Aliwal Street, Bloemfontein
Surveyor General - Dept Public Works, Free State Province - Dept of Education, Agricultural - Dept of Public Works
5 447 15 800 41,37 0,5% 0,2%
Offices Oracle House Smuts Drive, Midrand Oracle Corporation SA (Pty) Ltd 5 202 54 400 * 1,6% 0,7%
Offices Podium House Cnr Atterbury & Lois Avenues, Menlyn
Discovery Health, Equitac Commodity Brokers, Global Television and Communication Services CC, Wendy Machanik Property Holdings
4 832 22 400 73,02 0,6% 0,3%
Offices Rentworks 48 Grosvenor Road, Bryanston Rentworks Africa (Pty) Ltd, Amadeus Global Travel Distribution Southern Africa (Pty) Ltd
3 027 35 000 89,65 1,0% 0,5%
Offices Rigel Park 446 Rigel Avenue, Erasmusrand, Pretoria
Financial Services Board 4 533 40 000 * 1,2% 0,5%
Office Riverworld Park 42 Homestead Road, Edenburg
The Jupiter Drawing Room (Pty) Ltd, Galaxy Holdings (Pty) Ltd, Aptus Integrated Solutions
7 488 36 400 66,96 1,0% 0,5%
Offices Sandgate Park 16 Desmond Street, Eastgate Griffiths & Griffiths CC, Four Moons Trading CC, GE Sapani & S Brook, Jaycor International (Pty) Ltd, Symetric Information Technologies (Pty) Ltd, Nicci Boutiques CC
12 120 64 600 48,46 1,9% 0,9%
Office Southern Life Plaza 41 Maitland Street, Bloemfontein
Free State Legislature, FirstRand Bank Limited 10 566 58 225 61,63 1,7% 0,8%
Offices Strathmore Park 305 Musgrave Road, Durban Orion Telecom South Africa (Pty) Ltd, Adcorp Holdings Limited, Citigate South Africa (Pty) Ltd, Kayser, Baird & Associates, SA Biomedical (Pty) Ltd
3 727 32 300 91,15 0,9% 0,4%
Office Sturdee House 9 Sturdee Avenue, Rosebank Netcare Hospitals (Pty) Ltd, RA Hellman & Company
1 695 15 000 86,15 0,4% 0,2%
Office The Avenues North Mellis Road, Edenburg, Sandton
Connection Group Holdings Limited, Skeeme Designs CC, Brand Soldiers CC
3 471 33 800 70,87 1,0% 0,5%
Offices The Gables 1209 Schoeman Street, Hatfield
Securicor, The Centre for Development Population Activities Incorporated
2 851 24 200 74,38 0,7% 0,3%
Office The Pinnacle 2 Burg Street, Cape Town Grant Thornton, Frater Asset Management (Pty) Ltd, Logical Options (Pty) Ltd, Marais Muller Management Trust, independent Development Trust
11 368 102 460 81,30 3,0% 1,4%
Offices Tuinhof 265 West Avenue, Centurion Trans Caledon Tunnel Authority, Internex Engineering & Management Consulting (Pty) Ltd, FirstRand Bank Limited, Quality Business Consultants
9 042 79 700 80,67 2,3% 1,1%
Office UNDP House Cnr Leeukop & Naivasha Road, Sunninghill, Sandton
United Nations Development Programme 4 350 39 000 * 1,1% 0,5%
Offices Wesbank House 21 Riebeek Street, Cape Town Department of Labour, Wesbank, FNB Commercial Banking, Reuters SA
9 206 74 490 66,02 2,1% 1,0%
Property listing(including new acquisitions) – continued
*Single tenant – weighted average of all single tenant buildings in office sector – R87,40/m2

66emira property fund annual report 2008
Type Property Location Major Tenant GLA
Jun 08 valuation
(R’000)
Weighted average
rental/m² % of
sector% of
portfolio
Offices Westway 17 The Boulevard, Westway Office Park, Westville
First National Asset Management & Trust Company, Emmanuel Staffing Services (Pty) Ltd, Davis Langdon Farrow Laing (Pty) Ltd
2 277 27 820 99,12 0,8% 0,4%
Offices Woodmead Office Park 145 Western Services Road, Woodmead
Young & Rubicam Hedley Byrne (Pty) Ltd, Regenesys Management (Pty) Ltd, ECI Africa Consulting (Pty) Ltd, Zebra Technology Group (Pty) Ltd, Dusty Trax CC
17 514 123 134 72,36 3,6% 1,6%
Subtotal Offices
444 676 3 467 316 74,17 100% 46%
Retail Bizana Shopping Centre Main Road, Bizana Boxer Superstores, Barnetts, Pep, Power Factory Shop, Discom
4 865 14 300 43,31 0,5% 0,2%
Retail Boskruin Shopping Centre
Cnr of President Fouche & Hawken Avenue, Bromhof
Woolworths (Pty) Ltd, Boskruin Village Hardware Centre, Clicks, Luigi’s Pizzeria, Keg & Countryman, Island Fusion Restaurant CC
6 752 94 600 125,29 3,5% 1,3%
Retail Brandwag Melville Drive, Brandwag, Bloemfontein
Pick n Pay Retailers (Pty) Ltd, Engen Petroleum Limited, FNB Learning, First National Bank of SA Ltd, Pepkor Retail Limited
12 207 87 400 83,67 3,2% 1,2%
Retail Central Square Idutywa Cnr Bell & Richardson Streets, Idutywa
Pep Stores, Buzi Cash & Carry, Dunns, Power Factory Shop, Carelishelf Investments
4 024 18 500 48,72 0,7% 0,2%
Retail Centurion Discount Centre
1289 Heuwel Avenue, Centurion
Fabric & Décor, Hikers Paradise CC, Clothing City 2 049 11 800 62,52 0,4% 0,2%
Retail Cofimvaba Shopping Centre
Main Road, Cofimvaba Boxer Superstores (Pty) Ltd, Pep Stores, Lewis Stores, Ellerines Furnishers, Jabula Store
4 938 21 900 47,26 0,8% 0,3%
Retail Cresta Corner Cnr Beyers Naude Drive & Pendoring Street, Cresta
Virgin Active (Pty) Ltd, Audi Centre Northcliff, Hyundai Automotive (Pty) Ltd, Indgro Investments
8 056 59 000 73,62 2,2% 0,8%
Retail Dundee Boulevard Karel Landsman Street, Dundee
Pick ‘n Pay Retailers, Edgars, Woolworths, Clicks, Truworths
6 749 30 800 53,72 1,1% 0,4%
Retail Epsom Downs Shopping Centre
13 Sloane Street, Bryanston Pick ‘n Pay, Woolworths (Pty) Ltd, Nedbank Ltd, Goldex 243 (Pty) Ltd
6 747 62 112 97,67 2,3% 0,8%
Retail Flagstaff Shopping Centre
Main Road, Flagstaff Score Supermarkets, The Standard Bank, Dong Jiawang, Zama Zama Supermarket
2 838 10 400 56,40 0,4% 0,1%
Retail Gateway 1319 Pretoria Street, Hatfield Hatfield Kwikspar, McDonalds SA (Pty) Ltd 1 763 15 200 119,66 0,6% 0,2%
Retail Gift Acres Lynnwood Road, Lynnwood Ridge
Woolworths (Pty) Ltd, Younique (Pty) Limited, FirstRand Bank Limited, Mimmo’s Gift Acres, Solomons, Mr Price Clothing
9 363 99 200 121,22 3,7% 1,3%
Retail Granada Shopping Centre 16 Chartwell Drive, Umhlanga Rocks
Meumann White Attorneys, Cape Project Services (Pty) Ltd, Andritz (Proprietary) Limited, Europa Umhlanga CC, SA Independent Catering Services
5 818 45 000 90,00 1,7% 0,6%
Retail Greytown Centre Bell Street, Greytown U-Save, Pep, Dunn’s, Kentucky Fried Chicken 2 298 9 200 44,98 0,3% 0,1%
Retail Home Centre Springfield Durban B & J Meltz (Proprietary) Limited, Relyant Trading (Pty) Ltd, Fruit and Veg City Holdings (Pty) Ltd, Greg’s Bedding CC, Moresport
17 648 100 960 77,61 3,7% 1,3%
Retail Kokstad Boxers Main Street, Kokstad Boxer Superstores (Pty) Ltd 1 837 5 300 * 0,2% 0,1%
Property listing(including new acquisitions) – continued
*Single tenant – weighted average of all single tenant buildings in retail sector – R54,70/m2

67emira property fund
annual report 2008
Type Property Location Major Tenant GLA
Jun 08 valuation
(R’000)
Weighted average
rental/m² % of
sector% of
portfolio
Retail Kokstad Shopping Centre Main Street, Kokstad Rhino Cash & Carry, Jet Stores, Barnetts, Ackermans Kokstad, Dunns, Jwayelani Butchery
9 196 35 800 51,49 1,3% 0,5%
Retail Linksfield Road Linksfield Road, Linksfield Woolworths (Pty) Ltd, Regal Palace Chinese Restaurant, Edenroc (Pty) Ltd, Canoa Dining CC
4 090 33 300 101,89 1,2% 0,4%
Retail Lynnridge Mall Cnr Freesia & Mayflower, Lynnwood Ridge
Pick ‘n Pay Stores Limited, Mr Price Group Limited, Absa Bank Limited, Kraal Products CC, The Standard Bank of South Africa Limited, Ackermans, Lion Bridge
14 220 157 542 103,53 5,8% 2,1%
Retail Market Square Beacon Way, Plettenberg Bay Pick ‘n Pay Family Store, Woolworths (Pty) Ltd, Ackermans, Mr Price Clothing, Yellow Wood Spur
13 647 115 000 76,91 4,3% 1,5%
Retail Matatiele Centre Station Road, Matatiele Rhino Cash & Carry, Matatiele Power Stores, Pep Stores, Discom, Natal Fashion Wear
7 272 33 700 56,03 1,3% 0,4%
Retail Midrand Motor City Main Road, Midrand Midrand Action Sports CC, Dent Doctor, Midrand Speedy Tyre & Exhaust, Tam Bakery CC
8 402 26 800 39,24 1,0% 0,4%
Retail Montana Value Centre Zambezi Drive, Sinoville, Pretoria North
Bathroom Bizarre (Pty) Ltd, Doxa Deo Congregation North Campus, Relyant Trading (Pty) Ltd, Outdoor Warehouse, Vaal Tyre Centre Holdings (Pty) Ltd
9 717 61 200 53,60 2,3% 0,8%
Retail Mutual Mews 333 Rivonia Boulevard, Edenburg
Glyda Enterprises CC, Lee Chang Export & Import CC, Steers
1 596 11 300 103,36 0,4% 0,2%
Retail Ngwavuma Shopping Centre
Main Road, Ingwavuma Supatrade Spa, Ellerine Furnishers, Pep Stores, Ithala Bank
4 403 23 100 51,13 0,9% 0,3%
Retail Nongoma Centre Sizwe Road, Nongoma King Super Store, Supatrade Spar, Jet Stores, Price ‘n Pride, Pep Stores, Absa Bank
9 061 34 700 43,77 1,3% 0,5%
Retail Nqutu Cnr Manzolwandle & Hlube Roads, Nqutu
Boxer Superstores, Town Talk, Power Group, KFC 3 893 16 300 48,83 0,6% 0,2%
Retail Old Acre Plaza Cnr Victoria & Wilson Streets, Dundee
Pop In Supermarket, Shell SA Marketing (Pty) Ltd, Jet Stores, Ackermans Limited, Discom
6 077 27 800 46,76 1,0% 0,4%
Retail Park Boulevard Retail Centre
11 Brownsdrift Road, Riverside, Durban North
Connoisseur Electronics, Coastal Music (Pty) Ltd, Leeseev CC, SSS Fitness & Nutrition Company, On Tap, The Machine “O”
5 207 25 100 62,91 0,9% 0,3%
Retail Quagga Centre Cnr Church & West Street, Pretoria West
Shoprite Checkers (Pty) Ltd, Pick ‘n Pay Stores Limited, Edgars Consolidated Stores Limited, New Clicks South Africa (Pty) Ltd, Mr Price, Pep Stores, The Standard Bank of SA
29 748 207 386 71,44 7,7% 2,8%
Retail Randridge Mall John Vorster Drive, Randpark Ridge
Pick ‘n Pay Tvl (Pty) Ltd, Woolworths (Pty) Ltd, Dischem, Pepkor Retail Limited, AG Canossa
18 957 170 000 90,51 6,3% 2,3%
Retail Southern Sentrum Benade Drive, Bloemfontein Pick ‘n Pay Stores, Shell SA Marketing (Pty) Ltd, Pepkor Retail Limited, Purchase Milton & Associates, Crazy Store
20 395 77 500 49,80 2,9% 1,0%
Retail Standard Bank Glenwood 88 Brand Street, Glenwood, Durban
Standard Bank of South Africa Limited 368 3 400 * 0,1% 0,0%
Retail The Colony Centre 345 Jan Smuts Avenue, Craighall Park
Baby City, Worldwide Sports Marketing & Advertising, JDI Consultants, Colony Arms, Janes Linen Warehouse
7 273 57 300 95,66 2,1% 0,8%
Property listing(including new acquisitions) – continued
*Single tenant – weighted average of all single tenant buildings in retail sector – R54,70/m2
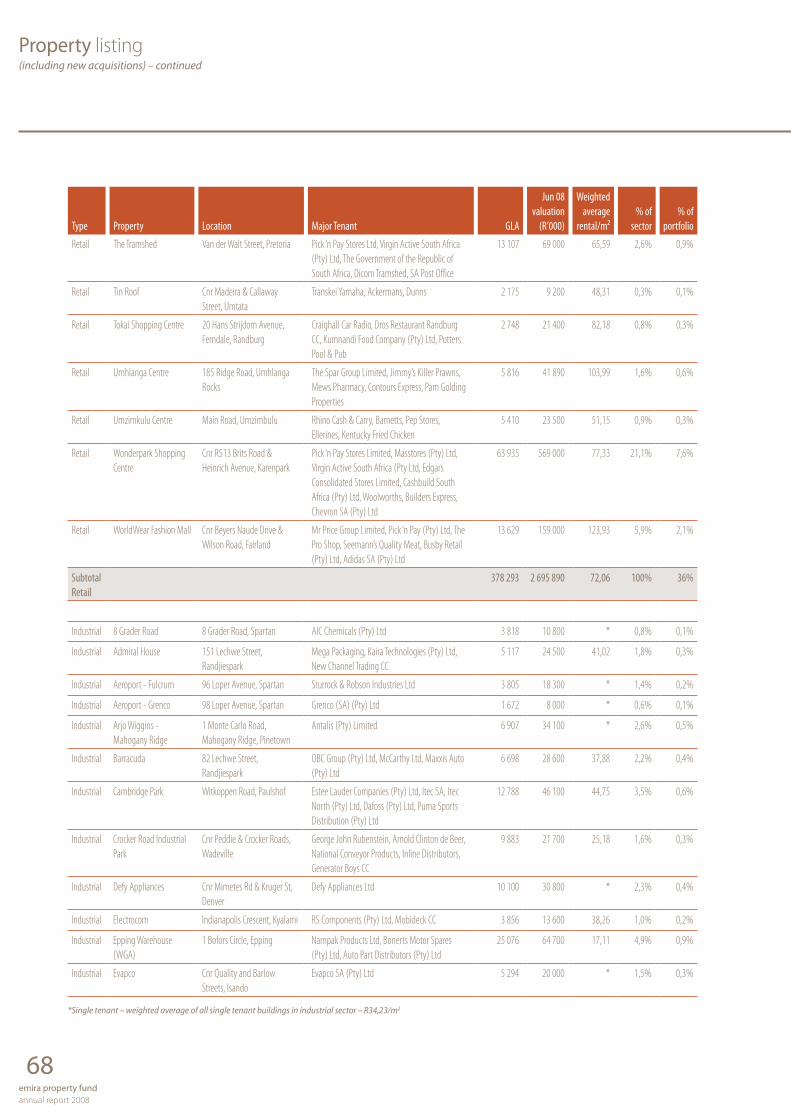
68emira property fund annual report 2008
Type Property Location Major Tenant GLA
Jun 08 valuation
(R’000)
Weighted average
rental/m² % of
sector% of
portfolio
Retail The Tramshed Van der Walt Street, Pretoria Pick ‘n Pay Stores Ltd, Virgin Active South Africa (Pty) Ltd, The Government of the Republic of South Africa, Dicom Tramshed, SA Post Office
13 107 69 000 65,59 2,6% 0,9%
Retail Tin Roof Cnr Madeira & Callaway Street, Umtata
Transkei Yamaha, Ackermans, Dunns 2 175 9 200 48,31 0,3% 0,1%
Retail Tokai Shopping Centre 20 Hans Strijdom Avenue, Ferndale, Randburg
Craighall Car Radio, Dros Restaurant Randburg CC, Kumnandi Food Company (Pty) Ltd, Potters Pool & Pub
2 748 21 400 82,18 0,8% 0,3%
Retail Umhlanga Centre 185 Ridge Road, Umhlanga Rocks
The Spar Group Limited, Jimmy’s Killer Prawns, Mews Pharmacy, Contours Express, Pam Golding Properties
5 816 41 890 103,99 1,6% 0,6%
Retail Umzimkulu Centre Main Road, Umzimbulu Rhino Cash & Carry, Barnetts, Pep Stores, Ellerines, Kentucky Fried Chicken
5 410 23 500 51,15 0,9% 0,3%
Retail Wonderpark Shopping Centre
Cnr R513 Brits Road & Heinrich Avenue, Karenpark
Pick ‘n Pay Stores Limited, Masstores (Pty) Ltd, Virgin Active South Africa (Pty Ltd, Edgars Consolidated Stores Limited, Cashbuild South Africa (Pty) Ltd, Woolworths, Builders Express, Chevron SA (Pty) Ltd
63 935 569 000 77,33 21,1% 7,6%
Retail WorldWear Fashion Mall Cnr Beyers Naude Drive & Wilson Road, Fairland
Mr Price Group Limited, Pick ‘n Pay (Pty) Ltd, The Pro Shop, Seemann’s Quality Meat, Busby Retail (Pty) Ltd, Adidas SA (Pty) Ltd
13 629 159 000 123,93 5,9% 2,1%
Subtotal Retail
378 293 2 695 890 72,06 100% 36%
Industrial 8 Grader Road 8 Grader Road, Spartan AIC Chemicals (Pty) Ltd 3 818 10 800 * 0,8% 0,1%
Industrial Admiral House 151 Lechwe Street, Randjiespark
Mega Packaging, Kaira Technologies (Pty) Ltd, New Channel Trading CC
5 117 24 500 41,02 1,8% 0,3%
Industrial Aeroport - Fulcrum 96 Loper Avenue, Spartan Sturrock & Robson Industries Ltd 3 805 18 300 * 1,4% 0,2%
Industrial Aeroport - Grenco 98 Loper Avenue, Spartan Grenco (SA) (Pty) Ltd 1 672 8 000 * 0,6% 0,1%
Industrial Arjo Wiggins - Mahogany Ridge
1 Monte Carlo Road, Mahogany Ridge, Pinetown
Antalis (Pty) Limited 6 907 34 100 * 2,6% 0,5%
Industrial Barracuda 82 Lechwe Street, Randjiespark
OBC Group (Pty) Ltd, McCarthy Ltd, Maxxis Auto (Pty) Ltd
6 698 28 600 37,88 2,2% 0,4%
Industrial Cambridge Park Witkoppen Road, Paulshof Estee Lauder Companies (Pty) Ltd, Itec SA, Itec North (Pty) Ltd, Dafoss (Pty) Ltd, Puma Sports Distribution (Pty) Ltd
12 788 46 100 44,75 3,5% 0,6%
Industrial Crocker Road Industrial Park
Cnr Peddie & Crocker Roads, Wadeville
George John Rubenstein, Arnold Clinton de Beer, National Conveyor Products, Inline Distributors, Generator Boys CC
9 883 21 700 25,18 1,6% 0,3%
Industrial Defy Appliances Cnr Mimetes Rd & Kruger St, Denver
Defy Appliances Ltd 10 100 30 800 * 2,3% 0,4%
Industrial Electrocom Indianapolis Crescent, Kyalami RS Components (Pty) Ltd, Mobideck CC 3 856 13 600 38,26 1,0% 0,2%
Industrial Epping Warehouse (WGA)
1 Bofors Circle, Epping Nampak Products Ltd, Bonerts Motor Spares (Pty) Ltd, Auto Part Distributors (Pty) Ltd
25 076 64 700 17,11 4,9% 0,9%
Industrial Evapco Cnr Quality and Barlow Streets, Isando
Evapco SA (Pty) Ltd 5 294 20 000 * 1,5% 0,3%
Property listing(including new acquisitions) – continued
*Single tenant – weighted average of all single tenant buildings in industrial sector – R34,23/m2

69emira property fund
annual report 2008
Type Property Location Major Tenant GLA
Jun 08 valuation
(R’000)
Weighted average
rental/m² % of
sector% of
portfolio
Industrial Executive City 81 Industrial Road, Kya Sands Blue Chip Lubricants (Pty) Ltd, Sensient Colours South Africa (Pty) Ltd, Kitchen Unique CC, Health & Beauty, Shimba Marketing Distribution Promotion CC
4 558 16 900 34,42 1,3% 0,2%
Industrial Flexitainer 59 Lechwe Street, Randjiespark
Bridging Technologies South Africa (Pty) Ltd 1 714 6 300 32,61 0,5% 0,1%
Industrial Fosa Park 570 Inanda Road, Durban Adcock Ingram Healthcare (Pty) Ltd 4 200 14 100 * 1,1% 0,2%
Industrial Freeway Park Cnr Barkley & Camp Roads, Maitland
Torga Optical (Pty) Ltd, Armageddon Security Guarding Company CC, Advanced Material Technology, X International (Pty) Ltd, Inhep Electronics Holdings (Pty) Ltd
7 935 43 530 55,46 3,3% 0,6%
Industrial Goodyear Tycon Cochrane Avenue, Epping Goodyear South Africa (Pty) Ltd 5 870 21 500 * 1,6% 0,3%
Industrial Greenfields 1455 North Coast Road, Durban North
Newsstand Investments, A & B Movers KZN CC, Media Film Services SA (Pty) Ltd, Alvin Dudley Meyer, Longlife Tyres (Pty) Ltd
9 398 31 540 33,27 2,4% 0,4%
Industrial Highway Business Park-IST
36 Park Avenue North, Old Johannesburg Rd, Centurion
Westinghouse Electric South Africa (Pty) Ltd 2 362 19 100 * 1,4% 0,3%
Industrial Highway-Ceramic World 95 Park Avenue North, Rooihuiskraal, Centurion
Ceramic World 2 369 9 100 * 0,7% 0,1%
Industrial Highway-National TT 95 Park Avenue North, Rooihuiskraal, Centurion
National Tile Traders (Pty) Ltd 1 616 6 900 * 0,5% 0,1%
Industrial Highway-Outdoor Warehouse
95 Park Avenue North, Rooihuiskraal, Centurion
Patels Ceramics (Potchefstroom) (Pty) Ltd 1 253 6 800 * 0,5% 0,1%
Industrial Highway-Productive Systems
95 Park Avenue North, Rooihuiskraal, Centurion
Productive Systems (Pty) Ltd 2 093 10 000 * 0,8% 0,1%
Industrial Industrial Village Jet Park Cnr Kelly Street and Ackerman Road, Jet Park
Universal Church of the Kingdom of God, CSE Equipment Company (Pty) Limited, Siemag Blanes (Pty) Limited, Rene Turck & Associates (Pty) Ltd, New Deal Trading 11 (Pty) Ltd
11 613 40 000 29,51 3,0% 0,5%
Industrial Industrial Village Kya Sands
Cnr Elsecar & Bernie Streets, Kya Sands
Aqua-Touch (Pty) Ltd, LGB Distributors CC, Poli-Film South Africa (Pty) Ltd, Group Africa Marketing (Pty) Ltd, Rolands Building & Roofing Specialists CC
16 659 54 500 31,46 4,1% 0,7%
Industrial Industrial Village Rustivia 6 Rover Street, Elandsfontein Major Tech (Pty) Ltd, Johnson Access (SA) (Pty) Ltd, ISO Bearings CC, In Line Trading 112 (Pty) Ltd
9 854 23 900 24,35 1,8% 0,3%
Industrial Isando - Unitrans 20 Anvil Road, Isando, Kempton park
GMG Power SA, Joshua Doore Warehouse 12 250 29 600 20,27 2,2% 0,4%
Industrial Johnson & Johnson 1 Medical Road, Midrand Johnson & Johnson Medical (Pty) Ltd 3 561 13 400 * 1,0% 0,2%
Industrial Midline Business Park Cnr Richards Drive & Le Roux Road, Midrand
Sil Farming CC, Coated Fabrics (SA) (Pty) Limited, Amandla Coupter & Machine Moving CC, Niser Composites SA (Pty) Ltd, Zenith (Africa) Rollers (Pty) Ltd
12 573 47 200 36,02 3,6% 0,6%
Industrial Mitek South Africa 16th Street, Midrand Mitek South Africa Pty Ltd 6 604 30 700 * 2,3% 0,4%
Industrial Morgan Creek 38 Mahogany Road, Mahogany Ridge, Pinetown
Simba (Pty) Ltd 4 644 21 200 * 1,6% 0,3%
Property listing(including new acquisitions) – continued
*Single tenant – weighted average of all single tenant buildings in industrial sector – R34,23/m2

70emira property fund annual report 2008
Type Property Location Major Tenant GLA
Jun 08 valuation
(R’000)
Weighted average
rental/m² % of
sector% of
portfolio
Industrial Nampak Building Nicolson Street, Denver Nampak Cartons & Labels Limited 24 880 21 900 * 1,6% 0,3%
Industrial New Zealand Milk Products
Cnr 16th and Douglas Roads, Midrand
Ceva Animal Health (Pty) Ltd 2 756 13 400 * 1,0% 0,2%
Industrial One Highveld 5 Bellingham Street, Centurion
V-Custom Cycles, S & J Office Furniture CC, Eclipse Infrastructure Solutions (Pty) Ltd, Pro Angling Equipment CC
6 012 23 200 54,94 1,7% 0,3%
Industrial Portion 130 Spartan 34-36 Director Road, Aeroport, Spartan
Elanco - Eli Lily (SA) (Pty) Ltd, Bearing Man Ltd 1 715 7 000 43,54 0,5% 0,1%
Industrial QD House 91-94 Silverstone Crescent, Kyalami
QD Group (Pty) Ltd 3 470 13 700 * 1,0% 0,2%
Industrial Rep-Props 12-14 Winnipeg Avenue, Aeroport
Applied Coating Technologies (S.A) (Pty) Ltd, Masterguard Fabric Protection Africa (Pty) Ltd, Freight-X Cargo Solutions CC, General Pneumatics Natal (Pty) Ltd, Espadon Logistics (Pty) Ltd
1 640 6 900 34,03 0,5% 0,1%
Industrial Rinaldo Park 50 Moreland Road, Redhill Industrial Park
Blaizing Sun Investments S44 (Pty) Ltd 1 650 5 500 * 0,4% 0,1%
Industrial RTT Acsa Park Cnr Springbok & Jones Street, Bardene
Fuel Logistics Group (Pty) Ltd 46 673 283 000 * 21,3% 3,8%
Industrial RTT Continental Cnr Springbok & Jones Street, Bardene
Fuel Logistics Group (Pty) Ltd 12 921 49 500 * 3,7% 0,7%
Industrial Siliconics Cnr Precision & Silicon Streets, Kya Sands
Control Techniques SA (Pty) Ltd 1 452 5 200 * 0,4% 0,1%
Industrial Starsky House 9 Dartfield Street, Kramerville Christ Embassy (Pty) Limited, Grove 239 (Pty) Ltd
2 450 6 500 26,75 0,5% 0,1%
Industrial Steiner Services Loper Road, Aeroport, Kempton Park
Steiner Services (Pty) Ltd 4 804 17 500 * 1,3% 0,2%
Industrial The Wolds A 82 Intersite Avenue, Umgeni Business Park
Clipsal SA (Pty) Ltd, TNT Express Worldwide SA (Pty) Ltd
1 770 6 730 48,95 0,5% 0,1%
Industrial The Wolds B 56 Intersite Avenue, Umgeni Business Park
Heidelberg Graphic Systems SA (Pty) Limited, Optiplan (Pty) Ltd
830 3 350 51,30 0,3% 0,0%
Industrial Umgeni Road A 98-102 Intersite Avenue, Umgeni Business Park
Ubunye Uniforms (Pty) Ltd 1 886 6 530 * 0,5% 0,1%
Industrial Umgeni Road B 19-23 Intersite Avenue, Umgeni Business Park
Pharmaceutical Health Distributors, Sahara Computers, Carters Office Furniture
6 021 19 650 49,82 1,5% 0,3%
Industrial Universal Print House 72 Stanhope Place, Briardene, Durban North
Universal Print Group (Pty) Ltd 12 559 32 300 27,58 2,4% 0,4%
Industrial Wadeville Industrial Village
Cnr Peddie & Crocker Roads, Wadeville
Multisurge CC, Ferobrake Wadeville, Helmut Franz Lehle, AMC CEMA Electric (Pty) Ltd, Aeidel Electronic System CC
13 384 29 200 24,05 2,2% 0,4%
Industrial Xpanda 918 Morkels Close, Halfway House, Midrand
TCS John Huxley Africa (Pty) Ltd, Spray Nozzle (Pty) Ltd
2 384 9 700 44,48 0,7% 0,1%
Subtotal industrial 365 397 1 328 230 35,26 100% 18%
Total investment properties 1 188 367 7 491 436 100%
Property listing(including new acquisitions) – continued
*Single tenant – weighted average of all single tenant buildings in industrial sector – R34,23/m2

71emira property fund
annual report 2008
Strategic Real Estate Managers (Proprietary) Limited (“STREM”)
Director’s reportfor the year ended 30 June 2008
nAtURe oF bUsInessThe company continued with its business as the manager of the Fund in terms of the Collective Investment Schemes Control Act.
GeneRAL RevIeWThe results for the year under review are reflected in the accompanying annual financial statements.
During the year, the company acquired the asset management agreement in respect of the properties held by Freestone Property Holdings Limited (Freestone) and its subsidiaries, for R30 million, from Freestone Management Company (Pty) Limited. The purchase price was settled by the issue of 90 shares in the company at R1 each, at a premium of R29 999 910.
As a result of the acquisition by Emira Property Fund (Emira) of Freestone, the asset management of the properties owned by Freestone was incorporated into the existing asset management agreement between STREM and Emira. Although it was decided to impair the value of the Freestone management agreement in full, the asset management responsibilities of STREM and therefore the value of the company, remain largely unchanged.
sHARe cAPItALDetails of the authorised and issued share capital of the company appear in note 2 to the financial statements.
DIvIDenDsNo dividends were paid by the company during the year under review.
execUtIve DIRectoRsWK SchultzeJWA TempletonPJ Thurling
non-execUtIve DIRectoRsBJ van der Ross (Chairman)MS AitkenLS BarnardBH KentNE MakiwaneMSB NeserNL Sowazi
coMPAnY secRetARYDA Isserow
ReGIsteReD ADDRess3 Gwen LaneSandton Central2196
PostAL ADDRessPO Box 786130Sandton2146
AUDItoRsPricewaterhouseCoopers Inc.
bAnKeRsFirst National Bank Limited
ReGIstRAtIon nUMbeR1997/020911/07

72emira property fund annual report 2008
Strategic Real Estate Managers (Proprietary) Limited (“STREM”)
Statement of directors’ responsibilities
The directors are responsible for the preparation, integrity, and fair presentation of the financial statements of Strategic Real Estate Managers (Proprietary) Limited. The financial statements presented on pages 74 to 80 have been prepared in accordance with International Financial Reporting Standards (“IFRS”), and include amounts based on judgements and estimates made by management.
The directors consider that in preparing the financial statements they have used the most appropriate accounting policies, consistently applied and supported by reasonable and prudent judgements and estimates, and that all statements of International Financial Reporting Standards that they consider to be applicable have been followed.
The directors are satisfied that the information contained in the financial statements fairly presents the results of operations for the year and the financial position of the group at year-end. The directors also prepared the other information included in the annual report and are responsible for both its accuracy and its consistency with the financial statements.
The directors have responsibility for ensuring that accounting records are kept. The accounting records should disclose with reasonable accuracy the financial position of the company to enable the directors to ensure that the financial statements comply with the relevant legislation.
Strategic Real Estate Managers (Proprietary) Limited operated in a well-established control environment, which is well documented and regularly reviewed. This incorporates risk management and internal control procedures, which are designed to provide reasonable, but not absolute, assurance that assets are safeguarded and the risks facing the business are being controlled.
The going-concern basis has been adopted in preparing the financial statements. The directors have no reason to believe that the company will not be a going concern in the foreseeable future, based on forecasts and available cash resources. These financial statements support the viability of the company.
The company’s external auditors, PricewaterhouseCoopers Incorporated, audited the financial statements, and their report is presented on page 73.
The financial statements were approved by the board of directors on 15 October 2008 and are signed on its behalf:
JWA Templeton BJ van der RossChief Executive Officer Director
Certificate by Company Secretary
We declare that to the best of our knowledge, for the year ended 30 June 2008, the company has lodged with the Registrar of Companies all such returns as are required of a public company in terms of section 268G(d) of the Companies Act, 1973, as amended and all such returns are true, correct and up to date.
D IsserowCompany Secretary
73emira property fund
annual report 2008
Report of the independent auditorsStrategic Real Estate Managers (Proprietary) Limited (“STREM”)
InDePenDent AUDItoRs’ RePoRt to tHe sHAReHoLDeR oF stRAteGIc ReAL estAte MAnAGeRs (PRoPRIetARY) LIMIteDWe have audited the annual financial statements of Strategic Real Estate Managers (Proprietary) Limited, which comprise the balance sheet as at 30 June 2008, and the income statement, statement of changes in equity and cash flow statement for the year then ended, and a summary of significant accounting policies and other explanatory notes, as set out on page74 to 80.
Directors’ responsibility for the financial statementsThe company’s directors are responsible for the preparation and fair presentation of these financial statements in accordance with statements of International Financial Reporting Standards and in the manner required by the Companies Act of South Africa. This responsibility includes: designing, implementing and maintaining internal control relevant to the preparation and fair presentation of financial statements that are free from material misstatement, whether due to fraud or error; selecting and applying appropriate accounting policies; and making accounting estimates that are reasonable in the circumstances.
Auditors’ responsibilityOur responsibility is to express an opinion on these financial statements based on our audit. We conducted our audit in accordance with International Standards on Auditing. Those standards require that we comply with ethical requirements and plan and perform the audit to obtain reasonable assurance whether the financial statements are free from material misstatement.
An audit involves performing procedures to obtain audit evidence about the amounts and disclosures in the financial statements. The procedures selected depends on the auditor’s judgement, including the assessment of the risks of material misstatement of the financial statements, whether due to fraud or error. In making those risk assessments, the auditor considers internal control relevant to the entity’s preparation and fair presentation of the financial statements in order to design audit procedures that are appropriate in the circumstances, but not for the purpose of expressing an opinion on the effectiveness of the entity’s internal control. An audit also includes evaluating the appropriateness of accounting policies used and the reasonableness of accounting estimates made by management, as well as evaluating the overall presentation of the financial statements.
We believe that the audit evidence we have obtained is sufficient and appropriate to provide a basis for our audit opinion.
opinionIn our opinion, the financial statements present fairly, in all material respects, the financial position of Strategic Real Estate Managers (Proprietary) Limited as of 30 June 2008, and its financial performance and its cash flows for the year then ended in accordance with International Financial Reporting Standards and in the manner required by the Companies Act of South Africa.
PricewaterhouseCoopers Inc.Director: Sakhile MasukuRegistered Auditor
16 October 2008
2 Eglin RoadSunninghillSandton
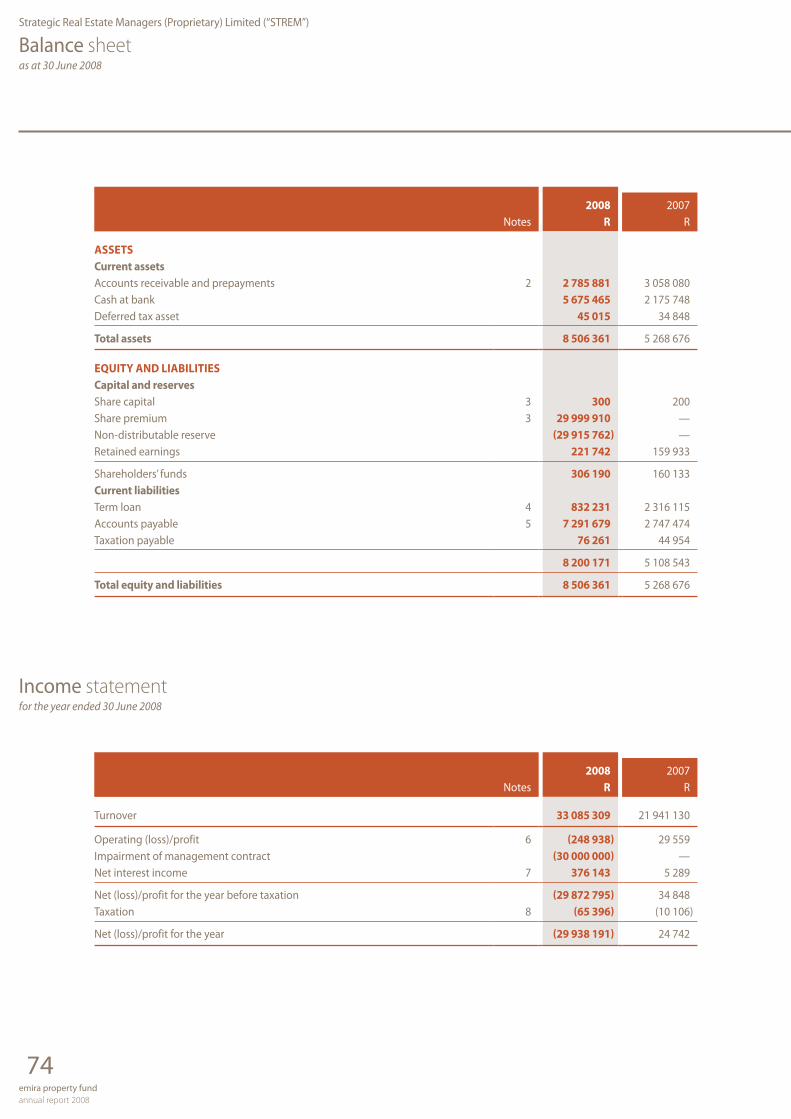
74emira property fund annual report 2008
2008 2007Notes R R
Assetscurrent assetsAccounts receivable and prepayments 2 2 785 881 3 058 080 Cash at bank 5 675 465 2 175 748 Deferred tax asset 45 015 34 848
total assets 8 506 361 5 268 676
eqUItY AnD LIAbILItIescapital and reservesShare capital 3 300 200 Share premium 3 29 999 910 — Non-distributable reserve (29 915 762) — Retained earnings 221 742 159 933
Shareholders’ funds 306 190 160 133 current liabilitiesTerm loan 4 832 231 2 316 115 Accounts payable 5 7 291 679 2 747 474 Taxation payable 76 261 44 954
8 200 171 5 108 543
total equity and liabilities 8 506 361 5 268 676
2008 2007Notes R R
Turnover 33 085 309 21 941 130
Operating (loss)/profit 6 (248 938) 29 559 Impairment of management contract (30 000 000) —Net interest income 7 376 143 5 289
Net (loss)/profit for the year before taxation (29 872 795) 34 848 Taxation 8 (65 396) (10 106)
Net (loss)/profit for the year (29 938 191) 24 742
Balance sheetas at 30 June 2008
Income statementfor the year ended 30 June 2008
Strategic Real Estate Managers (Proprietary) Limited (“STREM”)

75emira property fund
annual report 2008
2008 2007R R
share capitalOrdinary sharesBalance at the beginning of the year 200 200 Shares issued during the year 100 —
Balance at the end of the year 300 200
Share premiumBalance at the beginning of the year — — Shares issued during the year 29 999 910 —
Balance at the end of the year 29 999 910 —
Share capital and share premium at the end of the year 30 000 210 200
ReservesNon-distributable reserveBalance at the beginning of the year — — Share option expenditure reserve 84 238 —Transfer from retained earnings (30 000 000) —
Balance at the end of the year (29 915 762) —
Retained earningsBalance at the beginning of the year 159 933 135 191 Net (loss)/profit for the year (29 938 191) 24 742Transfer to non-distributable reserve 30 000 000 —
Balance at the end of the year 221 742 159 933
Total reserves at the end of the year (29 694 020) 159 933
2008 2007Notes R R
cash flow from operating activitiesCash flows from operating activities 9 4 651 704 (121 716)Net interest income 376 143 5 289 Taxation paid 10 (44 256) (10 807)
Net cash utilised in operating activities 4 983 591 (127 234)
cash flows from financing activitiesShares issued during the year 10 — Loan from fellow subsidiary (1 483 884) 1 613 098
Net cash generated by financing activities (1 483 874) 1 613 098
net increase in cash and cash equivalents 3 499 717 1 485 864 Cash and cash equivalents at beginning of year 2 175 748 689 884
cash and cash equivalents at end of year 5 675 465 2 175 748
Statement of changes in equityfor the year ended 30 June 2008
Cash flow statementfor the year ended 30 June 2008
Strategic Real Estate Managers (Proprietary) Limited (“STREM”)

76emira property fund annual report 2008
Notes to the financial statementsfor the year ended 30 June 2008
Strategic Real Estate Managers (Proprietary) Limited (“STREM”)
1 AccoUntInG PoLIcIesThe principal accounting policies adopted in the presentation of these financial statements are set out below. These policies have been consistently applied to all years presented.
The financial statements were prepared in accordance with International Financial Reporting Standards (IFRS).1.1 turnover
Turnover comprises management fees received from Emira Property Fund accounted for on the accrual basis as services are performed. The fees are based on the substance of the management agreement.
1.2 trade and other payablesTrade payables are carried at the fair value of the consideration to be paid in future for goods or services that have been received.
1.3 cash and cash equivalentsCash and cash equivalents are carried in the balance sheet at cost. For the purposes of the cash flow statement, cash and cash equivalents comprise cash on hand and deposits held at call with banks.
1.4 Accounts receivableTrade receivables are initially recognised at fair value and subsequently at amortised cost. A provision for impairment of trade receivables is established when there is objective evidence that the company will not be able to collect all amounts due according to the original term of the receivables. The amount of the provision is the difference between the carrying amount and the recoverable amount, being the present value of the expected cash flows, discounted at the market rate of interest for similar borrowers.
1.5 taxationTaxation is provided at current rates on net income before tax for the year after taking into account income and expenditure, which is not subject to taxation.
1.6 Intangible assets and impairment lossesIntangible assets are initially measured at cost if acquired separately or at fair value if acquired as part of a business combination. Intangible assets are amortised over their estimated useful life on a straight-line basis. The estimated useful lives and residual values are reviewed annually. Impairment losses are recognised as an expense in the income statement.
1.7 borrowingsInterest-bearing borrowings are recognised initially at fair value, less attributable transaction costs. Subsequent to initial recognition, they are measured at amortised cost using the effective interest rate method.
77emira property fund
annual report 2008
Notes to the financial statementsfor the year ended 30 June 2008 – continued
Strategic Real Estate Managers (Proprietary) Limited (“STREM”)
2008 2007R R
2 AccoUnts ReceIvAbLeTrade receivables 2 780 978 3 058 080Other receivables 4 903 —
2 785 881 3 058 080
Due within one year 2 785 881 3 058 080
3 sHARe cAPItALAuthorisedOrdinary shares4 000 ordinary shares of R1 each 4 000 4 000
IssuedOrdinary shares300 shares of R1 each (2007: 200 shares of R1 each) 300 200Share premium 29 999 910 —
30 000 210 200
4 teRM LoAnOwing to:RMB Properties (Proprietary) Limited 832 231 2 316 115
832 231 2 316 115
The loan is unsecured and has no fixed terms of repayment and bears interest at rates agreed from time to time.
5 AccoUnt PAYAbLeTrade payables 462 881 731 662Accrued expenses 6 828 816 2 015 812
7 291 697 2 747 474
Due within one year 7 291 697 2 747 474
6 oPeRAtInG Loss/PRoFItThe following items have been charged in arriving at operating loss/profit:Management fee paid to RMB Properties (Pty) Ltd/Eris Property Group 15 631 000 18 115 328Management fee paid to Corovest Property Group Holdings (Pty) Ltd 2 730 000 723 550Audit fees – current year 50 400 46 753Staff costs 1 437 337– Number of staff at the end of the year 9 10Operating lease expense — 144 458Directors’ emolumentsRemuneration (executive directors) 4 262 575 925 000Directors’ fees (non-executive directors) 980 000 525 459
The fees paid to non-executive directors for the year ended 30 June 2008, were paid on the following basis, as approved by the remuneration committee:Members of the board – R110 000 per annum (Chairman – R140 000 per annum)Members of the audit committee – R50 000 per annum (Chairman – R60 000 per annum)Members of the remuneration committee – R10 000 per annum

78emira property fund annual report 2008
Notes to the financial statementsfor the year ended 30 June 2008 – continued
Strategic Real Estate Managers (Proprietary) Limited (“STREM”)
2008 2007R R
7 net InteRest IncoMeInterest received 447 282 57 680Interest paid (71 139) (52 391)
376 143 5 289
8 tAxAtIonSouth African normal taxation – current 75 563 44 954Deferred taxation (10 167) (34 848)
65 396 10 106
tax rate reconciliation % %Standard rate 28,00 29,00Timing differences – rate change (0,01) —Permanent differences (28,21) —
Effective rate of taxation (0,22) 29,00
9 notes to tHe cAsH FLoW stAteMentCash generated from operationsNet (loss)/profit for the year before taxation (29 872 795) 34 848Net interest income (376 143) (5 289)Impairment of management contract 30 000 000 —Share option expenditure reserve 84 238 —
Operating (loss)/profit before working capital changes (164 700) 29 559Decrease/(increase) in receivables and prepayments 455 011 (1 544 216)Increase in trade and other payables 4 361 393 1 392 941
4 651 704 (121 716)
10 tAxAtIon PAIDBalance owing at the beginning of the year (44 954) (10 807)Taxation charge for the year (75 563) (44 954)Balance owing at the end of the year 76 261 44 954
(44 256) (10 807)

79emira property fund
annual report 2008
11 FInAncIAL RIsK MAnAGeMentThe company‘s financial instruments consist mainly of deposits with a bank, accounts receivable and prepayments, a term loan from a shareholder and accounts payable. In respect of the abovementioned financial instruments, book values approximate fair value. Exposure to interest rate, credit and liquidity risks occurs in the normal course of business.
Weightedaverage
effective 1 year More thaninterest rate or less 1 – 5 years 5 years Total
% R000 R000 R000 R000
Year ended 30 June 2008Financial assetsAccounts receivable and prepayments 2 786 2 786 Cash at bank 10,6 5 675 5 675
total financial assets 8 461 8 461
Financial liabilitiesTerm loan 10,6 832 832Accounts payable 7 292 7 292
total financial liabilities 7 292 832 8 124
Year ended 30 June 2007Financial assetsAccounts receivable and prepayments 3 058 3 058Cash at bank 5,6 2 176 2 176
total financial assets 5 234 5 234
Financial liabilitiesTerm loan 5,6 2 316 2 316Accounts payable 2 747 2 747
total financial liabilities 2 747 2 316 5 063
Interest rate risk managementExposure to interest risk is considered minimal. Interest paid on the term loan from a shareholder is equivalent to the interest earned on the call deposit at Rand Merchant Bank.
credit risk managementCredit risk is considered to be minimal. Trade receivables consist of the asset management fee due by Emira Property Fund.
Liquidity risk managementCash flows are monitored on a monthly basis to ensure that cash resources are adequate to meet funding requirements.
Notes to the financial statementsfor the year ended 30 June 2008 – continued
Strategic Real Estate Managers (Proprietary) Limited (“STREM”)

80emira property fund annual report 2008
Notes to the financial statementsfor the year ended 30 June 2008 – continued
Strategic Real Estate Managers (Proprietary) Limited (“STREM”)
2008 2007R R
12 ReLAteD PARtY tRAnsActIonsThe company is controlled by FirstRand Asset Management (Proprietary) Limited, which owns 70% of the company’s shares, the other 30% being owned by Freestone Management Company (Proprietary) Limited. The ultimate parent of the group is FirstRand Limited.Income received from group companiesEmira Property Fund (associate of parent) – asset management fees 33 085 309 21 941 130FirstRand Bank Limited (parent) – interest received 447 282 57 680
33 532 591 21 998 810
expenses paid to group companiesRMB Properties (Proprietary) Limited (associate of shareholder) – management fees 15 631 000 18 405 606– interest paid 71 139 52 391Corovest Property Group Holdings (Proprietary) Limited (associate of shareholder) – management fees 2 730 000 —
18 432 139 18 457 997
Inter-group balancesRMB Properties (Proprietary) Limited (shareholder) – term loan (832 231) (2 316 115)FirstRand Bank Limited (parent) – bank balances 5 675 465 2 175 748
Acquisition of management agreementFreestone Management Company (Proprietary) Limited (associate of RMB Properties (Proprietary) Limited and Corovest Property Group Holdings (Proprietary) Limited)
30 000 000 —

81emira property fund
annual report 2008
eMIRA PRoPeRtY FUnD
(Participatory interest code: EMI, ISIN: ZAE000050712)
(“Emira” or “the Fund”)
Notice is hereby given that the fifth annual general meeting of the members of Emira will be held in the Boardroom, Third Floor, 3 Gwen Lane, Sandton at 14:00 on Tuesday 18 November 2008 for the purposes of considering, and if deemed fit, passing with or without modification the resolutions set out below:
1 oRDInARY ResoLUtIons1.1 ordinary resolution number 1 ”Resolved that the annual financial statements for the financial year ended 30 June 2008 including the management
company’s report and the report of the auditors thereon be received, considered and approved.”
1.2 To reappoint PricewaterhouseCoopers Inc. as auditors of the Fund and N Mtetwa as the individual designated auditor of the Fund for the 2009 financial year until the next annual general meeting.
1.3 ordinary resolution number 2 “Resolved that the directors of Strategic Real Estate Managers (Proprietary) Limited, the manager of Emira, are hereby
authorised, by way of a renewable general authority, to issue participatory interests in the authorised but unissued capital of the Fund for cash, as and when they in their discretion deem fit, subject to the trust deed of the Fund and the Listing Requirements of the JSE Limited (“JSE”), when applicable provided that:
this general authority shall be valid until the Fund’s next annual general meeting or for 15 months from the date of this •resolution, whichever period is the shorter;the participatory interests must be of a class already in issue, or where this is not the case, must be limited to such •securities or rights that are convertible into a class already in issue;that a press announcement giving full details, in accordance with the Listing Requirements of the JSE including the •impact on net asset value and earnings per participatory interest, will be published at the time of any issue representing, on a cumulative basis within one financial year, 5% or more of the number of participatory interests prior to the issue;that issues in the aggregate in terms of this authority will not exceed 15% of the number of the Fund’s participatory •interests already in issue in any one financial year;in determining the price at which an issue of participatory interests will be made in terms of this general authority, the •maximum discount permitted will be 10% of the weighted average traded price of the participatory interests measured over the 30 business days prior to the date that the price of the participatory interests are agreed between Emira and the party subscribing for the securities; andany such issue will only be made to public participatory interest holders as defined in the Listing Requirements of the JSE •and not to related parties.
The approval of a 75% majority of the votes cast in favour of such resolution by participatory interest holders present or represented by proxy at this annual general meeting is required for this ordinary resolution to become effective.
Notice of annual general meetingStrategic Real Estate Managers (Proprietary) Limited (“STREM”)

82emira property fund annual report 2008
Notice of annual general meetingcontinued
Strategic Real Estate Managers (Proprietary) Limited (“STREM”)
2 sPecIAL ResoLUtIon2.1 special resolution number 1 “Resolved that the directors of Strategic Real Estate Managers (Proprietary) Limited, the manager of Emira, be hereby
authorised by way of a renewable general authority, to approve the repurchase of its own participatory interests by the Fund, subject to the trust deed of the Fund and the JSE Listing Requirements, when applicable, provided that:
this general authority shall be valid until the Fund’s next annual general meeting or for 15 months from the date of the •passing of this resolution, whichever period is shorter;the repurchase of participatory interests will be effected through the order book operated by the JSE trading system and •done without any prior understanding or arrangement between the Fund and the counterparty (reported trades are prohibited);an announcement complying with the Listing Requirements of the JSE be published by the Fund when (i) the Fund has •cumulatively repurchased 3% of the participatory interests in issue as at the time the general authority was given (“the initial number”) and (ii) for each 3% in aggregate of the initial number of participatory interests acquired thereafter by the Fund;the general repurchase by the Fund of its own participatory interests shall not in the aggregate in any one financial year •exceed 20% of the Fund’s issued capital of that class as at the beginning of the financial year;repurchases must not be made at a price more than 10% above the weighted average of the market value of the •participatory interests for the five business days immediately preceding the date on which the transaction is effected;at any point in time the Fund may only appoint one agent to effect any repurchase on the Fund’s behalf;•the Fund will, after a repurchase, still comply with the provisions of the Listing Requirements of the JSE regarding •participatory interest spread;the Fund will not repurchase participatory interests during a prohibited period as defined in paragraph 3.67 unless Emira •has in place a repurchase programme where the dates and quantities of securities to be traded during the relevant period are fixed (not subject to any variation) and full details of the programme have been disclosed in an announcement over SENS prior to the commencement of the prohibited period; andsuch repurchases shall be subject to the trust deed of the Fund, the provisions of the Collective Investment Schemes Act •and the JSE Listing Requirements, where applicable.
It is the intention of the directors of Strategic Real Estate Managers (Proprietary) Limited, the manager of Emira, that they use such general authority should prevailing circumstances in their opinion warrant it.
The directors of Strategic Real Estate Managers (Proprietary) Limited, the manager of Emira, undertake that they will not implement any such repurchases while this general authority is valid, unless:
the Fund and the group will be able, in the ordinary course of business, to pay its debts for a period of 12 months after •the date of the general repurchase;the assets of the Fund and the group will exceed the liabilities of the Fund and the group for a period of 12 months after •the date of the general repurchase. For this purpose, the assets and liabilities will be recognised and measured in accordance with the accounting policies used in the Fund’s latest audited annual group financial statements;the Fund and the group will have adequate participatory interest capital and reserves for ordinary business purposes for •a period of 12 months after the date of the general repurchase;the available working capital of the Fund and the group will be adequate for ordinary business purposes for a period of •12 months after the date of the notice of the general repurchase; andupon entering the market to proceed with the repurchase, the Fund’s sponsor will confirm the adequacy of Emira’s •working capital for the purposes of undertaking a repurchase of participatory interests in writing to the JSE.

83emira property fund
annual report 2008
Notice of annual general meetingcontinued
Reason for and effect of the special resolutionThe reason for and effect of the special resolution is to grant the Fund’s directors a general authority to approve the Fund’s repurchase of its participatory interests in itself.
For the purposes of considering special resolution number 1 and in compliance with the JSE Listing Requirements, the information listed below has been included in the annual report, to which this notice forms part, on the pages indicated:
Directors and management (page 20)•Major participatory interest holder’s details (page 85)•Directors’ interests (page 25)•Participatory interest capital of the Fund (page 52)•
Directors’ responsibility statementThe directors, whose names are set out in this report, collectively and individually accept full responsibility for the accuracy of the information contained in this special resolution number 1 and certify that, to the best of their knowledge and belief, there are no other facts, the omission of which would make any statement false or misleading and that they have made all reasonable enquiries in this regard and that the notice contains all information required by law and the JSE Listing Requirements.
• Litigation statementThere are no legal or arbitration proceedings (including any such proceedings that are pending or threatened of which the Fund is aware), which may have or have had a material effect on Emira’s financial position over the last 12 months.
• Material changesThere have been no material changes in the financial or trading position of the Fund and its subsidiaries since the date of signature of the audit report and up to the date of this notice.
3 to tRAnsAct AnY otHeR bUsIness WHIcH MAY be tRAnsActeD At An AnnUAL GeneRAL MeetInG Strategic Real Estate Managers (Proprietary) LimitedDesiree Isserow
Company Secretary
15 October 2008
Strategic Real Estate Managers (Proprietary) Limited (“STREM”)

84emira property fund annual report 2008
Voting and proxies
Participatory interest holders who have not dematerialised their participatory interests or who have dematerialised their participatory interests with “own name” registration are entitled to attend and vote at the meeting and are entitled to appoint a proxy or proxies to attend, speak and vote in their stead. The person appointed need not be a participatory interest holder.
Proxy forms must be forwarded to reach the Fund’s transfer secretaries, Computershare Investor Services (Proprietary) Limited , Ground Floor, 70 Marshall Street, Johannesburg, 2001 (PO Box 61051, Marshalltown, 2107) by no later than 14:00 on Friday, 14 November 2008.
Proxy forms must only be completed by members who have not dematerialised their participatory interests or who have dematerialised their participatory interests with “own name” registration.
On a show of hands, every participatory interest holder of the Fund present in person or represented by proxy shall have one vote only. On a poll, every participatory interest holder of the Fund shall have one vote for every participatory interest held in the company by such participatory interest holder.
Participatory interest holders who have dematerialised their participatory interests, other than those participatory interest holders who have dematerialised their participatory interests with “own name” registration, should contact their Central Securities Depository Participant (CSDP) or broker in the manner and time stipulated in their agreement:
to furnish them with their voting instructions; and•in the event that they wish to attend the meeting, to obtain the necessary authority to do so.•
PO Box 786130Sandton2146
Tel: (011) 775 1000/1217

85emira property fund
annual report 2008
Participatory interest holders’ analysis
PARtIcIPAtoRY InteRest (PI) HoLDeRs’ PRoFILe AnD Jse InFoRMAtIon At 30 JUne 2008
Number ofNumber % of participatory % of
of holders holders interests capital
Directors’ holdings 10 0,36 13 843 647 2,81Strategic holdings (more than 10%) 1 0,04 169 606 515 34,42Empowerment partners (excluding directors’ holdings) 5 0,18 48 372 686 9,81
Non-public 16 0,58 231 822 848 47,04Public 2 726 99,42 260 996 141 52,96
Totals 2 742 100,00 492 818 989 100,00
Distribution of PI holdersEmpowerment partners 5 0,18 60 880 955 12,35Insurance companies 37 1,35 169 815 530 34,46Investment companies 29 1,06 25 636 553 5,20Retirement funds 124 4,52 62 568 319 12,70Mutual funds 116 4,23 132 743 717 26,94Other 2 431 88,66 41 173 915 8,35
Totals 2 742 100,00 492 818 989 100,00
Range analysis at 30 June 20081 – 1 000 234 8,53 126 236 0,031 001 – 10 000 1 536 56,02 7 389 802 1,5010 001 – 100 000 751 27,39 22 581 501 4,58100 001 – 1 000 000 163 5,94 51 440 264 10,44Over 1 000 000 58 2,12 411 281 186 83,45
Totals 2 742 100,00 492 818 989 100,00
The following holders of PIs hold, beneficially directly or indirectly, at 30 June 2008, in excess of 5% of the ordinary issued capital:
HolderMomentum Group 169 606 515 34,42Tiso Group 42 271 468 8,58
List of managers managing in excess of 5% of the ordinary issued capital:
ManagerStanlib 41 023 113 8,32
No other PI holder held a beneficial interest of more than 5% in the PI capital of the Fund at 30 June 2008.

86emira property fund annual report 2008
Administration information
ReGIsteReD ADDRess3 Gwen LaneSandtonPO Box 786130, Sandton, 2146
Asset MAnAGeRStrategic Real Estate Managers (Pty) Limited3 Gwen LaneSandtonPO Box 786130, Sandton, 2146
PRoPeRtY MAnAGeRsRMB Properties (Pty) LimitedEris Property Group (Pty) Limited3 Gwen LaneSandtonPO Box 786130, Sandton, 2146
tRUsteesAbsa Bank Ltd2nd Floor, Block EFlora Park Office BlockCorner of Ontdekkers and Conrad RoadsFlorida, 1709PO Box 1132,Johannesburg, 2000
MeRcHAnt bAnK AnD sPonsoRRand Merchant Bank, a division ofFirstRand Bank Ltd1 Merchant PlaceFredman DriveSandtonPO Box 786273, Sandton, 2146
tRAnsFeR secRetARIesComputershare InvestorServices 2004 (Pty) Limited70 Marshall Street,Johannesburg, 2001PO Box 61051, Marshalltown, 2107
AUDItoRsPricewaterhouseCoopers Inc.2 Eglin RoadSunninghill2157Private Bag X36, Sunninghill, 2157
bAnKeRsFirstRand Bank Ltd t/a First National BankWierda Valley Sandton OutletWierda ValleyPO Box 787428, Sandton, 2146
AttoRneYsHofmeyr Herbstein & Gihwala Inc6 Sandown Valley CrescentSandownSandtonPrivate Bag X40, Benmore, 2010

87emira property fund
annual report 2008
eMIRA PRoPeRtY FUnD(Participatory interest code: EMI
ISIN: ZAE000050712)
(“Emira” or “the Fund”)
FoRM oF PRoxY
tHIs FoRM oF PRoxY Is onLY FoR Use bY:
– registered members who have not yet dematerialised their Emira participatory interests; and
– registered members who have already dematerialised their Emira participatory interests and are registered in their own names in the Fund’s sub-register.
For completion by the aforesaid registered members of Emira and who are unable to attend the 2008 annual general meeting of the Fund to be held in the boardroom, Third Floor, 3 Gwen Lane, Sandton at 14:00 on, Tuesday 18 November 2008 (“the annual general meeting”).
I/We (name/s in block letters)
Of (address)
Being the registered holder/s of units in Emira, as at
Hereby appoint (see instruction 1 overleaf )1. or failing him/her,
2. or failing him/her
3. the Chairman of the annual general meeting, as my/our proxy to attend, speak and vote for me/us and on my behalf or abstain from voting at the annual general meeting of the Fund and at any adjournment thereof, as follows (see note 2 and instruction 2 overleaf ):
oRDInARY ResoLUtIons FoR AGAInst AbstAIn
1.1 To receive, consider and adopt the annual financial statements for the financial year ended 30 June 2008
1.2 To reappoint PricewaterhouseCoopers Inc. as auditors of the Fund and N Mtetwa as the individual designated auditor of the Fund
1.3 To vote on a general authority to issue participatory interests for cash
sPecIAL ResoLUtIon nUMbeR 1
2.1 To vote on a general authority to repurchase participatory interests
Signed at on 2008
Signature(s)
Assisted by (where applicable)
Please read notes and instructions overleaf
Form of proxy

88emira property fund annual report 2008
1. A participatory interest holder entitled to attend and vote at the meeting may appoint a proxy to speak and vote in this capacity. A proxy need not be a participatory interest holder of the Fund. Proxy forms should be forwarded to reach the Fund’s transfer secretary Computershare Investor Services 2004 (Proprietary) Limited, Ground Floor, 70 Marshall Street, Johannesburg, 2001 (PO Box 61051, Marshalltown, 2107) by no later than 14:00 on Friday 14 November 2008. The appointment of a proxy will not preclude a participatory interest holder from attending the meeting.
2. A participatory interest holder may insert the name of a proxy or alternative proxy of the ordinary participatory interest holder’s choice in the space provided with or without deleting “the Chairman of the annual general meeting”. The participatory interest holder must initial any such deletion. The person whose name appears first on the form of proxy and has not been deleted will be entitled to act as a proxy to the exclusion of those whose names follow.
3. A participatory interest holder’s instructions to the proxy must be indicated by the insertion of the relevant number of votes exercisable by that participatory interest holder in the appropriate space provided. Failure to comply with the above will be deemed to authorise the Chairman of the annual general meeting, if he/she is an authorised proxy, to vote in favour of the resolutions, or any other proxy to vote or abstain from voting at the annual general meeting as he/she deems fit, in respect of the participatory interest holder’s vote exercisable thereat. A participatory interest holder or his/her proxy is not obliged to use all the votes exercisable by the participatory interest holder or by his/her proxy, but the total of votes cast and in respect whereof abstention is recorded may not exceed the total of the votes exercisable by the participatory interest holder or his/her proxy.
4. An alteration or correction must be initialled by the signatory/ies.
5. Documentary evidence establishing the authority of a person signing this form of proxy in a representative capacity must be attached to this form unless previously recorded by the transfer secretaries of the Fund or waived by the Chairman of the annual general meeting.
6. His/her parent or guardian, as applicable, must assist a minor or any other persona under legal incapacity unless the relevant documents establishing his/her capacity are produced or have been registered by the Fund.
7. The completion and lodging of this form will not preclude the relevant ordinary participatory interest holder from attending the annual general meeting and speaking and voting in person thereat to the exclusion of any proxy appointed in terms hereof, should such participatory interest holder wish to do so.
8. The Chairman of the annual general meeting may accept or reject a proxy which is completed and/or received other than in accordance with the instructions, provided that he/she shall not accept a proxy unless he/she is satisfied as to the manner in which a participatory interest holder wishes to vote.
9. If participatory interest holders have dematerialised their participatory interests with a CSDP or broker, other than own name dematerialised participatory interest holders, they must arrange with the CSDP or broker concerned to provide them with the necessary authorisation to attend the general meeting and vote thereat, or the participatory interest holders concerned must instruct their CSDP or broker as to how they wish to vote in this regard. This must be done in terms of the agreement entered into between the participatory interest holders and the CSDP or broker concerned.
Notes

BASTION GRAPHICS

EMIRA annual report 2008
Related Documents


