EARLY ONLINE RELEASE This is a provisional PDF of the author-produced electronic version of a manuscript that has been accepted for publication. Although this article has been peer-reviewed, it was posted immediately upon acceptance and has not been copyedited, formatted, or proofread. Feel free to download, use, distribute, reproduce, and cite this provisional manuscript, but please be aware that there will be significant differences between the provisional version and the final published version. A Digital Atlas to Characterize the Mouse Brain Transcriptome PLoS Computational Biology (2005) James P. Carson, Tao Ju, Hui-Chen Lu, Christina Thaller, Mei Xu, Sarah L. Pallas, Michael C. Crair, Joe Warren, Wah Chiu, Gregor Eichele Corresponding Author: James P. Carson ([email protected]) Received: June 9, 2005; Accepted: August 16, 2005 Provisional DOI: 10.1371/journal.pcbi.0010041.eor Copyright: © 2005 Carson et al. This is an open-access article distributed under the terms of the Creative Commons Attribution License, which permits unrestricted use, distribution, and reproduction in any medium, provided the original author and source are credited. Citation: Carson JP, Ju T, Lu H, Thaller C, Xu M et al. (2005) A digital atlas to characterize the mouse brain transcriptome. PLoS Comput Biol. In press. DOI: 10.1371/journal.pcbi.0010041.eor Future Article URL: http://dx.doi.org/10.1371/journal.pcbi.0010041

Welcome message from author
This document is posted to help you gain knowledge. Please leave a comment to let me know what you think about it! Share it to your friends and learn new things together.
Transcript
EARLY ONLINE RELEASE
This is a provisional PDF of the author-produced electronic version of a
manuscript that has been accepted for publication. Although this article
has been peer-reviewed, it was posted immediately upon acceptance and
has not been copyedited, formatted, or proofread. Feel free to download,
use, distribute, reproduce, and cite this provisional manuscript, but
please be aware that there will be significant differences between the
provisional version and the final published version.
A Digital Atlas to Characterize
the Mouse Brain Transcriptome
PLoS Computational Biology (2005)
James P. Carson, Tao Ju,
Hui-Chen Lu, Christina Thaller,
Mei Xu, Sarah L. Pallas,
Michael C. Crair, Joe Warren,
Wah Chiu, Gregor Eichele
Corresponding Author: James P. Carson ([email protected])
Received: June 9, 2005; Accepted: August 16, 2005
Provisional DOI: 10.1371/journal.pcbi.0010041.eor
Copyright: © 2005 Carson et al. This is an open-access article distributed under the terms
of the Creative Commons Attribution License, which permits unrestricted use,
distribution, and reproduction in any medium, provided the original author and source are
credited.
Citation: Carson JP, Ju T, Lu H, Thaller C, Xu M et al. (2005) A digital atlas to
characterize the mouse brain transcriptome. PLoS Comput Biol. In press. DOI:
10.1371/journal.pcbi.0010041.eor
Future Article URL: http://dx.doi.org/10.1371/journal.pcbi.0010041
Carson et al. A Digital Atlas for the Mouse Brain Transcriptome
1
A Digital Atlas to Characterize the Mouse Brain
Transcriptome
James P. Carson1,2*, Tao Ju3, Hui-Chen Lu4¤, Christina Thaller2, Mei Xu5,
Sarah L. Pallas5, Michael C. Crair4, Joe Warren3, Wah Chiu1,2, Gregor Eichele6
1Program in Structural and Computational Biology and Molecular Biophysics, National Center for Macromolecular Imaging, 2Verna and Marrs McLean Department of Biochemistry and Molecular Biology, Baylor College of Medicine, Houston, Texas, United States of America. 3Department of Computer Science, Rice University, Houston, Texas, United States of America. 4Division of Neuroscience and Program in Developmental Biology, Baylor College of Medicine, Houston, Texas, United States of America. 5Department of Biology, Georgia State University, Atlanta, Georgia, United States of America. 6Max Planck Institute of Experimental Endocrinology, Hanover, Germany. Massive amounts of data are being generated in an effort to represent for the
brain the expression of all genes at cellular resolution. Critical to exploiting this
effort is the ability to place this data into a common frame of reference. Here we
have developed a computational method for annotating gene expression patterns
in the context of a digital atlas to facilitate custom user-queries and comparisons
of this type of data. This procedure has been applied to 200 genes in the
postnatal mouse brain. As an illustration of utility, we identify candidate genes
that may be related to Parkinson’s disease by using the expression of a
dopamine transporter in the substantia nigra as a search query pattern. In
addition, we discover that transcription factor Rorb is down-regulated in the
barrelless mutant relative to control mice by quantitative comparison of
expression patterns in layer IV somatosensory cortex. The semi-automated
annotation method developed here is applicable to a broad spectrum of complex
tissues and data modalities.
* To whom correspondence should be addressed. E-mail: [email protected]
¤ Current address: The Cain Foundation Laboratories, Department of Pediatrics, Division of Neuroscience and Program in Developmental Biology, Baylor College of Medicine, Houston, Texas, United States of America.
Carson et al. A Digital Atlas for the Mouse Brain Transcriptome
2
Synopsis
The mammalian brain is a complex organ with hundreds of functional parts. Describing
when and where genes are expressed in the brain is thus a potentially powerful method
for understanding the function of gene products. In recent years, several mammalian
genomes including human and mouse have been characterized. There are now efforts
around the world that aim to determine the expression patterns for all genes in the mouse
brain. To search this expression data readily, it must be placed into an atlas.
The authors propose a new method for bringing such genetic data into a common spatial
framework so that one can perform spatial searches and comparisons of gene expression
patterns. To create this atlas, the authors developed a series of maps of the brain using a
graphical modeling method called subdivision. These maps were deformed to match the
shape of tissue sections, and genetic activity information was associated with the
appropriate coordinates on the map.
After placing 200 genes into the context of this atlas, the authors illustrate its application
in discovering genes potentially involved in diseases and brain development.
Introduction
High-resolution maps of gene expression provide important information about
how genes regulate biological processes at cellular and molecular levels. Therefore a
multitude of efforts are in progress to depict gene expression at single cell resolution in
specimens ranging from organs to embryos (http://mamep.molgen.mpg.de[1];
Carson et al. A Digital Atlas for the Mouse Brain Transcriptome
3
http://genepaint.org/[2]; http://brainatlas.org/[3]; http://mahoney.chip.org/mahoney/[4];
http://www.ncbi.nlm.nih.gov/projects/gensat/[5]). Common to these genome-scale
projects is that they generate vast numbers of images of expression patterns that reveal
the presence of transcripts or proteins in a particular cell or group of cells within a natural
context. However, large collections of images are of limited usefulness per se without
efficient means to characterize, compare and mine expression patterns. In analogy to the
requirements for mining genomic sequence information, meaningful retrieval of
expression patterns requires suitable annotation. By annotation, we mean associating sites
and strengths of expression with a digital representation of the anatomy of a specimen.
The annotation approach taken by the Gene Expression Database[6] is to hand-
curate published gene expression patterns using an extensive dictionary of anatomical
terms. This annotation is facilitated by the Edinburgh Mouse Atlas Project (EMAP),
which provides anatomical ontology relationships using a hierarchical tree[7].
Visualization is achieved by associating these terms with locations in a volumetric
model[8]. EMAP also provides tools to map ISH images directly into a 3D atlas[7].
Although hand-curation is an effective method for annotation, it is not an efficient means
for handling the large-scale datasets systematically collected by robotic ISH[9]. In
addition, if future changes are made to anatomical designations, updating the annotation
may require a laborious review of previously annotated data.
Here we present a completely novel approach that uses a geometric modeling
technique to create a digital atlas of the postnatal day 7 (P7) mouse brain. This
deformable atlas can then be adjusted to match the major anatomical structures present in
P7 mouse brain tissue sections, accurately define the boundaries between structures, and
Carson et al. A Digital Atlas for the Mouse Brain Transcriptome
4
provide a smooth multi-resolution coordinate representation of small structures. When
combining this technique with a method for detecting strength of gene expression, one
can efficiently and automatically annotate a large number of gene expression patterns in a
way that subsequently allows queries and comparisons of expression patterns in user-
defined regions of interest.
P7 mouse brain was selected as the specimen because at this developmental stage,
many complex brain functions begin to be established yet the existing information on
underlying molecular mechanisms is still relatively limited. We describe here the creation
of a prototype 200 gene dataset generated using robotic in situ hybridization (ISH), and
the application of our deformable atlas-based annotation method to this dataset. We then
demonstrate the utility of the approach with two examples: searching for genes expressed
in the substantia nigra, and identifying genes potentially involved in functional
regionalization of the cortex.
Results
Construction of an Atlas Using a Subdivision Mesh Technique.
In building the atlas of the P7 mouse brain, we first selected a set of eleven cresyl
violet-stained standard sagittal brain sections that approximate the eleven sagittal
sections in Valverde’s atlas of the postnatal mouse brain[10]. These standard sections
exhibit the hemi-brain by spanning from lateral (section 1) to paramedial (section 11).
The boundaries of fifteen major brain structures (amygdala, basal forebrain, cerebellum,
cortex, globus pallidus, hippocampus, hypothalamus, medulla, midbrain, olfactory bulb,
pons, septum, striatum, thalamus, and ventral striatum) were then delineated on each of

Carson et al. A Digital Atlas for the Mouse Brain Transcriptome
5
the eleven standard sections. The boundaries for standard section 4 are shown in Figure
1a. For each of these major structures in a standard section, we next created a
representation using a coarse quadrilateral mesh. Figure 1b shows an example of creating
a coarse mesh for the thalamus in standard section 4. The subdivision algorithm applies
an iterative refinement of this coarse mesh resulting in a fine mesh that both smoothly
overlays internal regions of the thalamus and explicitly defines its boundary (Figure 1c).
The complete mesh across an entire section is an accurate map representing all major
anatomical structures (Figure 1d). Performing the described process (Figure 1b, d) for all
11 standard sections resulted in 11 maps, which together constitute an atlas of the P7
mouse brain (Figure S1).
Each of the 11 maps is deformable and hence can be fitted to an anatomically
appropriate experimental sagittal brain section. To do this, one first identifies the
experimental section (i.e. Figure 1e) out of the ~24 in our dataset that is most similar to
the selected map (Figure 1d) based on general appearance and the presence of key
anatomical features. The shape of the fine mesh is controlled by repositioning the vertices
of the coarse mesh (indicated by black squares in Figure 1b-d). An automated global fit
of the map can be used for an initial approximation of the related map to the experimental
section[11]. A manual adjustment by dragging vertices into new positions then allows the
map to fit the boundaries of the anatomical structures in the experimental section
accurately (Figure 1f).
Anatomical substructures in the mouse brain maintain a consistent spatial relationship
with neighboring structures when specimen age and strain do not change. Thus, the
location of any given substructure should be consistently represented by a set of
Carson et al. A Digital Atlas for the Mouse Brain Transcriptome
6
quadrilaterals in the fitted map. This important property was examined by fitting standard
map 6 to 59 different experimental sections and then determining which quadrilaterals
contained the dentate gyrus (DG), a substructure of the hippocampus. Although the shape
of the DG and its relative position within the hippocampus varied to some extent (e.g.
because of tissue compression/stretching in the sectioning process), the same four
quadrilaterals always contained most of the DG, with adjacent quadrilaterals sometimes
containing the edge of the DG (Figure 1g). This suggests that the subdivision mesh-based
atlas not only explicitly delineates the boundaries between major structures, but can also
be used to define the location of internal substructures such as the DG.
Establishment of Annotated Gene Expression Patterns
Non-radioactive in situ hybridization data
We have assessed the subdivision atlas with a comprehensive test dataset of ~5000
images of entire sagittal sections from P7 mouse brain produced using robotic ISH for
200 different genes (Table S1). Each gene expression image set spans the left half of the
brain and consists of at least 24 sections spaced a maximum of 200µm apart. Digital
images were captured in a bright field microscope at 1.6µm per pixel resolution. This
resolution is sufficient to view individual cell bodies and estimate the strength of
expression as reflected by the amount of precipitate in each cell using a previously
reported quantification algorithm, Celldetekt[12]. Figure 2 illustrates the type of data—
diverse expression patterns and with cellular resolution (insets of Figure 2c, d)—that
were subjected to annotation by subdivision mesh fittings.
Carson et al. A Digital Atlas for the Mouse Brain Transcriptome
7
Linking expression levels to locations in the atlas
From the 24 sections for each gene, we identified the sections that best matched the
anatomy represented by standard maps 2, 4, 6, 9 and 11, which collectively are sufficient
to characterize all 15 different major anatomical structures in the atlas. The standard
maps were deformed to fit appropriate tissue sections (e.g. Figure 1d-f). We applied
Celldetekt to classify the expression levels for cells in the tissue sections, and associated
the local levels of expression with the overlying quadrilaterals in the finely subdivided
mesh (e.g. Figure 1f). This created a digital dataset of cellular expression levels at all
locations across 1000 mesh-fitted experimental sections representing 200 different genes.
Knowledge Discovery using the P7 Mouse Brain Gene Expression Patterns
Homologous pattern query
Within the context of an anatomical atlas, comparison of expression patterns in a region
of interest provides a mechanism for identifying candidate genes involved in regionalized
biological or pathological processes. Idiopathic Parkinson's disease (IPD) is a progressive
neurodegenerative disorder characterized in part by the loss of dopaminergic neurons in
the substantia nigra resulting in decreased dopamine release in the striatum and severe
impairment of motor function. To search for genes potentially involved in IPD, we
performed a homologous pattern query for genes in the dataset that best match the
expression pattern of dopamine transporter 1 (Slc6a3, NM_010020), a marker for
dopaminergic neurons, in the substantia nigra (Figure 3a). Genes in the dataset were
ranked by their similarity to this query pattern, calculated as the weighted sum of
differences in detected cellular expression strengths across all selected quadrilaterals. The
Carson et al. A Digital Atlas for the Mouse Brain Transcriptome
8
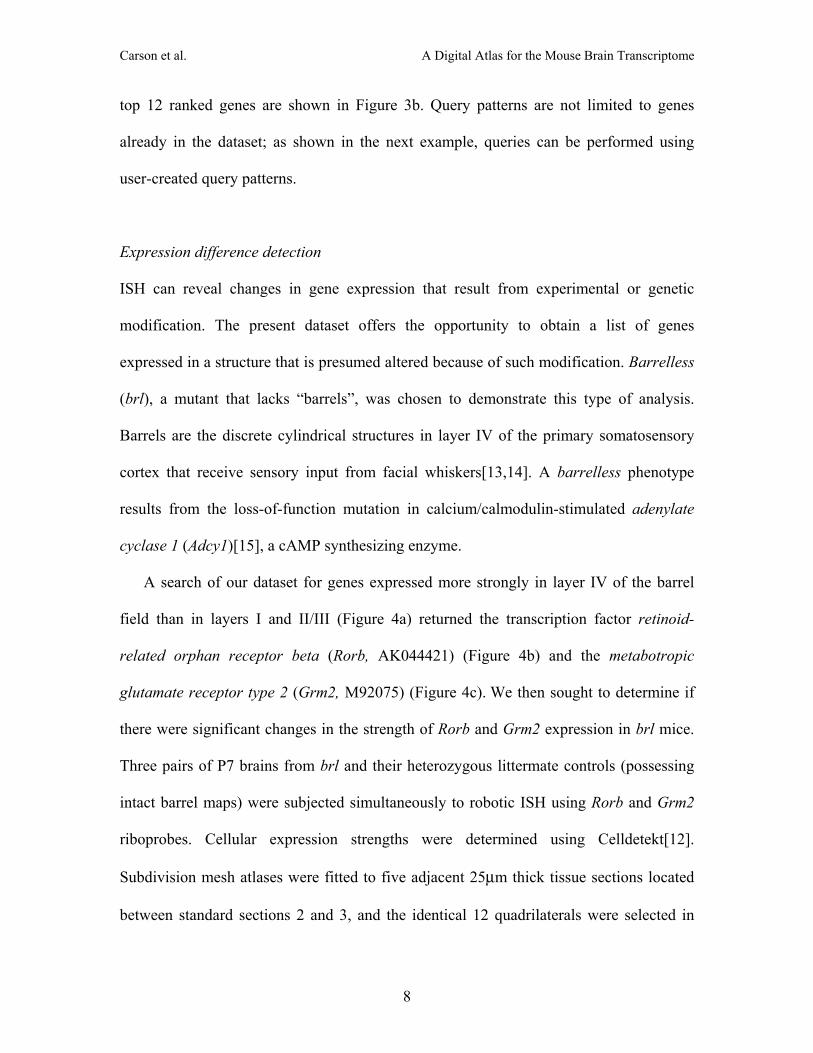
top 12 ranked genes are shown in Figure 3b. Query patterns are not limited to genes
already in the dataset; as shown in the next example, queries can be performed using
user-created query patterns.
Expression difference detection
ISH can reveal changes in gene expression that result from experimental or genetic
modification. The present dataset offers the opportunity to obtain a list of genes
expressed in a structure that is presumed altered because of such modification. Barrelless
(brl), a mutant that lacks “barrels”, was chosen to demonstrate this type of analysis.
Barrels are the discrete cylindrical structures in layer IV of the primary somatosensory
cortex that receive sensory input from facial whiskers[13,14]. A barrelless phenotype
results from the loss-of-function mutation in calcium/calmodulin-stimulated adenylate
cyclase 1 (Adcy1)[15], a cAMP synthesizing enzyme.
A search of our dataset for genes expressed more strongly in layer IV of the barrel
field than in layers I and II/III (Figure 4a) returned the transcription factor retinoid-
related orphan receptor beta (Rorb, AK044421) (Figure 4b) and the metabotropic
glutamate receptor type 2 (Grm2, M92075) (Figure 4c). We then sought to determine if
there were significant changes in the strength of Rorb and Grm2 expression in brl mice.
Three pairs of P7 brains from brl and their heterozygous littermate controls (possessing
intact barrel maps) were subjected simultaneously to robotic ISH using Rorb and Grm2
riboprobes. Cellular expression strengths were determined using Celldetekt[12].
Subdivision mesh atlases were fitted to five adjacent 25µm thick tissue sections located
between standard sections 2 and 3, and the identical 12 quadrilaterals were selected in

Carson et al. A Digital Atlas for the Mouse Brain Transcriptome
9
each mesh to define a common region of comparison in the barrel field. Although the
percentage of cells expressing Rorb was similar in control and brl tissue (brl 96±17% of
control), we found in the brl brains a significant (P = 0.02) decrease in the relative
percentage of cells expressing strongly (brl 51±7% of control) (Figure 4d). By contrast,
an identical analysis of Grm2 expression did not reveal differences in either total
expression (brl 113±14% of control) or strong expression (brl 111±35% of control).
To validate the results of our novel method for difference detection, we performed
quantitative real-time PCR, a technique that uses a standardization protocol to quantify
the number of copies of mRNA per quantity of cDNA. Brl homozygous mice were paired
with their heterozygous littermates for Rorb expression analysis of the somatosensory
cortex containing the barrel region (Figure 4e). We found that Rorb expression in the brl
mice was consistently and significantly lower (P<0.01) than that in the control mice (brl
79±4% of control) (Figure 4f).
Resources Available
To facilitate distribution and application of the novel methods of this project, we have
made the atlas, dataset, and demonstration queries publicly available online at
http://www.geneatlas.org/. The atlas resources consist of the 11 Nissl-stained standard
sagittal section images with the major anatomical regions labeled, and the corresponding
11 standard subdivision mesh maps. We also provide an interactive demonstration that
allows visitors to deform a map onto an experimental section (as in Figure 1d-f). All 1000
reduced resolution images produced by Celldetekt for this project are available at this
website. In addition, most of the ~5000 images of raw ISH data are available and
Carson et al. A Digital Atlas for the Mouse Brain Transcriptome
10
viewable at http://www.genepaint.org/. The 1000 images of gene expression patterns can
be queried using a graphical search tool that allows users to duplicate the searches in
Figure 3 and Figure 4a, as well as to specify different regions of interest and query
patterns for their own customized queries.
Discussion
In this study, we have constructed and applied a subdivision mesh-based atlas to
sagittal mouse brain section revealing the localization of transcripts visualized by ISH.
Expression patterns revealed with bacterial artificial chromosome vectors[16],
radioactive ISH[17], or immunohistochemistry can readily be subjected to subdivision
mesh fitting and thus be represented in the atlas shown here. In addition, it may be
possible to capture the architecture of fiber tract connectivity[10], micro MRI data[18]
and “tissue voxel-based” microarray-based expression profiles[19] in our subdivision
maps. Such multimodality will greatly enhance the discovery power of such an atlas. The
subdivision mesh-based atlas can also be used to create tables with sites, levels, and
patterns of expression and thus can emulate a text-based annotation procedure[20].
Generating unbiased portraits of gene expression patterns and placing these into a
common spatial framework greatly facilitates the discovery of biologically important
information. In the case of the brl mice, we first searched our 200-gene dataset for genes
that are expressed in the developing barrel field region (Figure 4a). The subsequent
detection of down-regulation of the transcription factor gene Rorb in brl cortex (Figure
4d) raises the possibility that activity-controlled signaling, mediated by Adcy1 in cortical
map formation, converges on gene transcription. This discovery also establishes that our
Carson et al. A Digital Atlas for the Mouse Brain Transcriptome
11
annotation can both identify cortical layer-specific marker genes and estimate
quantitative differences in the level of gene expression. Differences in expression levels
were more dramatic when using the histology-based method, which accurately delineated
the region of interest, than when using quantitative real-time PCR on RNA isolated from
a block of cortical tissue (Figure 4d-f).
The ability to align multiple known expression patterns is the strength of the method
described here. We exploited this by searching for genes expressed in a similar pattern to
that of Slc6a3, which encodes a dopamine transporter, and is transcribed in the substantia
nigra (Figure 3). Twelve genes were identified with our homologous pattern search.
Seven of these have been previously connected to IPD. Alpha synuclein (Snca,
AF033261) and a nuclear orphan receptor (Nr4a2, S53744) are causative genes in some
forms of familial IPD[21,22]. Dopamine receptor 2 (Drd2, NM_010077) and tyrosine
hydroxylase (Th, NM_009377) have been implicated in IPD on the basis of
polymorphisms[23,24]. LIM homeobox transcription factor 1 beta (Lmx1b,
NM_010725) regulates domamineric neurogenesis[25]. Expression of aldehyde
dehydrogenase (Aldh1a1, NM_013467) has been shown recently to be decreased
markedly in IPD[26]. One gene, vesicular monoamine transporter 2 (Slc18a2,
XM_140760), is similar to the gene used as the query pattern in that they both are
involved in monoamine transport.
The five other identified genes have not been previously connected to IPD. Synaptic
vesicle glycoprotein 2c (Sv2c, AK015921) regulates synaptic vesicle exocytosis and has a
particularly restricted expression pattern in comparison to other genes in its family,
suggesting a potential relationship to the substantia nigra and IPD[27]. The product of
Carson et al. A Digital Atlas for the Mouse Brain Transcriptome
12
chaperonin subunit 8 (Cct8, NM_009840) is involved in protein folding and
assembly[28]. This biochemical property may be a link to IPD because one aspect of this
disorder is protein aggregation, mostly Snca in Lewy bodies, a characteristic of IPD.
Ptprl (NM_011214) encodes a transmembrane receptor with tyrosine phosphatase
activity that has been implicated in cell-cell contact[29]. Limb expression 1 homolog
(Lix1, AF351204) and transmembrane protein 1 (Tmem1, XM_125775) are genes with
completely unknown functions. Lix1 is initially expressed in the precursor cells of the
substantia nigra and later in its pars compacta[30]. These results suggest that it is worth
considering Sv2c, Cct8, Ptprl, Tmem1, and Lix1 as candidates for further investigation
into their relationship with IPD. This prototype dataset demonstrates the usefulness of
this approach even with a dataset of 200 genes. By extending this dataset to thousands of
genes, our approach would yield a more comprehensive set of candidate genes involved
in brain functions and disease mechanisms.
Although the atlas can reliably detect expression in substructures such as the
substantia nigra (Figure 3), cortical layers (Figure 4a, b), and the dentate gyrus (Figure
1g), there are limitations in how small a structure the subdivision mesh can consistently
locate. This can be addressed by increasing the complexity of the mesh through
additional control points. The disadvantage of increased complexity is that fitting the
mesh to experimental sections will become more time-consuming. This can be alleviated
by focusing on specific anatomical substructures (e.g just the thalamus), for which new
specialized maps could be created.
One of the greatest strengths of the subdivision-based atlas is the ability to fit the
maps efficiently and accurately to tissue sections, despite the varying section-to-section
Carson et al. A Digital Atlas for the Mouse Brain Transcriptome
13
deformations introduced by tissue fixation, sectioning, and transfer of sections to slides.
By applying this mesh-fitting process, an individual can easily map the expression
patterns of 10-20 genes per day. For application of the method to the entire transcriptome,
future development efforts should focus on reducing the time involved in the mesh fitting
process, e.g., automated fitting based on associating anatomical landmarks with each
mesh vertex[31]. In addition, the subdivision method can be extended to create a 3D
volumetric subdivision atlas. When coupled with a robust method to stack tissue sections
into a 3D volume of gene expression patterns, a 3D subdivision atlas may allow more
efficient alignments of expression patterns than a set of 2D maps.
Materials and Methods
Non-radioactive in situ hybridization. Tissue preparation, riboprobe
preparation, automated in situ hybridization, and digitization were performed as
described[9,32-34] and online in the “Manual of Genepaint” at www.genepaint.org.
Briefly, brains were embedded in OCT and fresh frozen in a chamber that allows
stereotaxic alignment of the specimen. Serial sagittal sections at 25µm thickness were cut
with a cryostat through the left half of the brain to just past the midline. Sections from a
single specimen were alternately distributed into 8 different sets, resulting in a spacing of
200µm between sections within a set. Each set consisted of approximately 24 sections (4
per slide, 6 slides). Slides were assembled into a flow-through hybridization chamber and
placed into position in a Tecan Genesis liquid handling robot, which performs ISH on
192 slides in less than 24 hours. Digoxygenin-tagged riboprobes were produced by in
Carson et al. A Digital Atlas for the Mouse Brain Transcriptome
14
vitro-transcription from PCR-generated DNA templates using bacteriophage RNA
polymerases. Probes were detected by a dual amplification procedure[35].
Microscopy. After ISH, slides were cover-slipped and digitally scanned at
1.6µm/pixel using a custom-made automated Leica microscope[9]. Images were cropped
and stored in TIFF format with LWZ lossless compression.
Atlas creation. Each standard cross-section was modeled using a Catmull-Clark
subdivision mesh[36] partitioned by a network of crease curves. Our subdivision
method[37] consisted of two simple transformations: bi-linear subdivision that splits each
quadrilateral into four sub-quadrilaterals followed by centroid averaging to reposition
vertices (Figure S2). Each quadrilateral in the coarsest mesh was associated with the
appropriate anatomical structure. This association is maintained during subdivision.
Atlas fitting. ISH sections most similar to the selected maps were visually
selected. This was a rapid step requiring less than one minute for each gene. Standard
atlas meshes were then deformed to fit ISH sections using a semi-automated process of
computing an affine fit using principal component analysis, performing a local fit using
iterated least squares, and verifying visually[11]. Due to the intuitive flexibility of the
subdivision meshes, any necessary manual corrections of the mesh fitting were simple
and could be performed in two to five minutes per ISH section.
Pattern query scoring. As part of an expression pattern similarity query, a total
difference score in relation to the query pattern is calculated for each pattern in the
dataset. This score, S, is the sum of the individual differences, d, for each quadrilateral
pair within the region of the search, j: ∑=j
jdS . Each d is calculated as a weighted L1
norm between the vector of the number of cells at different Celldetekt-calculated
Carson et al. A Digital Atlas for the Mouse Brain Transcriptome
15
expression strength levels, c = [strong, moderate, weak, none] for the query pattern
quadrilateral, q, and the current dataset pattern quadrilateral, p. Specifically:
)( pq ccwd −•= , with weights w=[9,4,1,0].
Rorb and Grm2 analysis. Each brl and littermate control mouse brain pair was
subjected to ISH simultaneously. Prior to Celldetekt analysis, image intensity level
adjustment was performed on pairs so that the percentage of strong expressing cells was
approximately equivalent from pair to pair. All P values were calculated using two-tailed
paired t-tests that compared brl brain section sets in relation to their control pairs.
RNA extraction and cDNA generation. The somatosensory cortex was isolated
from brl mice (n=16) and their heterozygous littermate control mice (n=22) in a total of
six group pairs as previously described[38]. Total RNA was extracted, cleaned with
DNase I, and then reverse transcribed. Conventional PCR for Rorb was performed in
samples from heterozygous control and homozygous brl animals. The PCR amplicons
were sequenced to confirm their identity across control and brl samples. The resulting
sequences were used for the design of TaqMan™ primers and probes for quantitative real-
time.
Quantitative real-time PCR. The TaqMan™ probe and primer pair for
Rorb were chosen as follows:
TaqMan™ Probe: 5’-FAM TCAGAAGAACCACCTGGATGATGAGACCC TAMRA-3’
Forward primer: GATTTATTTTGCACTGCAACATGTG
Reverse primer: ACTGCCGTGATAGTTGGTATCTTG
Relative quantification of Rorb expression was performed with 18S rRNA as an
endogenous control. Each sample was run in triplicate to reduce pipetting error and
Carson et al. A Digital Atlas for the Mouse Brain Transcriptome
16
increase consistency of the results. PCR was carried out at 50°C for 2min, 95°C for
10min, followed by 40 cycles of 95°C for 15sec and 60°C for 1 min. The expected size
of the PCR products was confirmed by gel electrophoresis. In addition, a conventional
PCR omitting the hybridization probe was run in parallel on a thermocycler to verify
PCR specificity. Equal amplification efficiency of Rorb to 18S rRNA was achieved,
validating the relative quantification.
Animals. C57BL/6 wild type mice from Jackson Laboratories were the source of
the line of mice used for all 200 genes. The discovery of brl mice resulted from a
spontaneous mutation in a line from ICR stock at Université de Lausanne[39]. Brl mice
used in our experiments were from the eighth backcross generation of the incipient
C57BL/6J-brl congenic inbred strain. Genotypes were determined by genomic PCR as
described[38]. Data analysis was performed blind to genotype. All animals were treated
in compliance with the guidelines of both the U.S. Department of Health and Human
Services and Baylor College of Medicine’s Animal Care and Use Committee.
Supporting Information
Figure S1. The subdivision-based anatomical atlas of the postnatal mouse brain
11 sagittal maps comprise this subdivision-based postnatal mouse brain atlas. The 15
major anatomical structures are color-coded as indicated by the labels.
Figure S2. Subdivision mesh
(A) An initial coarse mesh (left). The two transformations of subdivision: bi-linear
subdivision (middle) and then centroid averaging (right). (B) The mesh subdivided twice
(left), thrice (middle), and four times (right).
Carson et al. A Digital Atlas for the Mouse Brain Transcriptome
17
Table S1. List of 200 riboprobes used.
Acknowledgments
We thank G. Alvarez-Bolado, M. Chen, A. Liang, A. Visel, and M. Yaylaoglu for
technical assistance, and D. Armstrong, M. Bello, I. Kakadiaris, and J. Maunsell for
advice and discussions. This research was supported by a fellowship (NLM Grant No.
5T15LM07093) from the Keck Center for Computational and Structural Biology of the
Gulf Coast Consortia, the Burroughs Welcome Fund, National Institutes of Health
(P41RR02250; EY-12696; R01 MH62639; F32 NS11034) and National Science
Foundation (IBN-0078110; EIA-0325004).
Conflicts of Interest. The authors have declared that no conflicts of interest exist.
References
1. Neidhardt L, Gasca S, Wertz K, Obermayr F, Worpenberg S, et al. (2000) Large-scale screen for genes controlling mammalian embryogenesis, using high-throughput gene expression analysis in mouse embryos. Mech Dev 98: 77-94.
2. Visel A, Thaller C, Eichele G (2004) GenePaint.org: an atlas of gene expression patterns in the mouse embryo. Nucleic Acids Res 32: D552-556.
3. Boguski MS, Jones AR (2004) Neurogenomics: at the intersection of neurobiology and genome sciences. Nat Neurosci 7: 429-433.
4. Gray PA, Fu H, Luo P, Zhao Q, Yu J, et al. (2004) Mouse brain organization revealed through direct genome-scale TF expression analysis. Science 306: 2255-2257.
5. Gong S, Zheng C, Doughty ML, Losos K, Didkovsky N, et al. (2003) A gene expression atlas of the central nervous system based on bacterial artificial chromosomes. Nature 425: 917-925.
6. Hill DP, Begley DA, Finger JH, Hayamizu TF, McCright IJ, et al. (2004) The mouse Gene Expression Database (GXD): updates and enhancements. Nucleic Acids Res 32: D568-571.
Carson et al. A Digital Atlas for the Mouse Brain Transcriptome
18
7. Baldock RA, Bard JB, Burger A, Burton N, Christiansen J, et al. (2003) EMAP and EMAGE: a framework for understanding spatially organized data. Neuroinformatics 1: 309-325.
8. Brune RM, Bard JB, Dubreuil C, Guest E, Hill W, et al. (1999) A three-dimensional model of the mouse at embryonic day 9. Dev Biol 216: 457-468.
9. Carson JP, Thaller C, Eichele G (2002) A transcriptome atlas of the mouse brain at cellular resolution. Curr Opin Neurobiol 12: 562-565.
10. Valverde F (1998) Golgi atlas of the postnatal mouse brain. Wien ; New York: Springer-Verlag.
11. Ju T, Warren J, Eichele G, Thaller C, Chiu W, et al. A geometric database for gene expression data. In: Kobbelt L, Schröder P, Hoppe H, editors; 2003; Aachen, Germany. Eurographics Association. pp. 166-176.
12. Carson JP, Eichele G, Chiu W (2005) A method for automated detection of gene expression required for the establishment of a digital transcriptome-wide gene expression atlas. J Microsc 217: 275-281.
13. Fukuchi-Shimogori T, Grove EA (2001) Neocortex patterning by the secreted signaling molecule FGF8. Science 294: 1071-1074.
14. Woolsey TA, Van der Loos H (1970) The structural organization of layer IV in the somatosensory region of mouse cerebral cortex: The description of a cortical field composed of discrete cytoarchitectonic units. Brain Research 17: 205-242.
15. Abdel-Majid RM, Leong WL, Schalkwyk LC, Smallman DS, Wong ST, et al. (1998) Loss of adenylyl cyclase I activity disrupts patterning of mouse somatosensory cortex. Nat Genet 19: 289-291.
16. Heintz N (2004) Gene expression nervous system atlas (GENSAT). Nat Neurosci 7: 483.
17. Lein ES, Zhao X, Gage FH (2004) Defining a molecular atlas of the hippocampus using DNA microarrays and high-throughput in situ hybridization. J Neurosci 24: 3879-3889.
18. Sadowski M, Tang CY, Aguinaldo JG, Carp R, Meeker HC, et al. (2003) In vivo micro magnetic resonance imaging signal changes in scrapie infected mice. Neurosci Lett 345: 1-4.
19. Barlow C, Lockhart DJ (2002) DNA arrays and neurobiology--what's new and what's next? Curr Opin Neurobiol 12: 554-561.
20. Carson JP, Ju T, Thaller C, Warren J, Bello M, et al. Automated Characterization of Gene Expression Patterns with an Atlas of the Mouse Brain; 2004 September 1st-5th; San Francisco, CA. Omnipress.
21. Le WD, Xu P, Jankovic J, Jiang H, Appel SH, et al. (2003) Mutations in NR4A2 associated with familial Parkinson disease. Nat Genet 33: 85-89.
22. Polymeropoulos MH, Higgins JJ, Golbe LI, Johnson WG, Ide SE, et al. (1996) Mapping of a gene for Parkinson's disease to chromosome 4q21-q23. Science 274: 1197-1199.
23. Plante-Bordeneuve V, Taussig D, Thomas F, Said G, Wood NW, et al. (1997) Evaluation of four candidate genes encoding proteins of the dopamine pathway in familial and sporadic Parkinson's disease: evidence for association of a DRD2 allele. Neurology 48: 1589-1593.
Carson et al. A Digital Atlas for the Mouse Brain Transcriptome
19
24. Haavik J, Toska K (1998) Tyrosine hydroxylase and Parkinson's disease. Mol Neurobiol 16: 285-309.
25. Smidt MP, Asbreuk CH, Cox JJ, Chen H, Johnson RL, et al. (2000) A second independent pathway for development of mesencephalic dopaminergic neurons requires Lmx1b. Nat Neurosci 3: 337-341.
26. Galter D, Buervenich S, Carmine A, Anvret M, Olson L (2003) ALDH1 mRNA: presence in human dopamine neurons and decreases in substantia nigra in Parkinson's disease and in the ventral tegmental area in schizophrenia. Neurobiol Dis 14: 637-647.
27. Janz R, Sudhof TC (1999) SV2C is a synaptic vesicle protein with an unusually restricted localization: anatomy of a synaptic vesicle protein family. Neuroscience 94: 1279-1290.
28. Stoldt V, Rademacher F, Kehren V, Ernst JF, Pearce DA, et al. (1996) Review: the Cct eukaryotic chaperonin subunits of Saccharomyces cerevisiae and other yeasts. Yeast 12: 523-529.
29. Yan HX, He YQ, Dong H, Zhang P, Zeng JZ, et al. (2002) Physical and functional interaction between receptor-like protein tyrosine phosphatase PCP-2 and beta-catenin. Biochemistry 41: 15854-15860.
30. Moeller C, Yaylaoglu MB, Alvarez-Bolado G, Thaller C, Eichele G (2002) Murine Lix1, a novel marker for substantia nigra, cortical layer 5, and hindbrain structures. Brain Res Gene Expr Patterns 1: 199-203.
31. Kakadiaris I, Bello M, Arunachalam S, Kang W, Ju T, et al. Landmark-driven, Atlas-based Segmentation of Mouse Brain Tissue Slices Containing Gene Expression Data; 2004; Rennes, France.
32. Visel A, Ahdidan J, Eichele G (2002) A gene expression map of the mouse brain. In: Kotter R, editor. A practical guide to neuroscience databases and associated tools: Kluwer Academic Publishers.
33. Herzig U, Cadenas C, Sieckmann F, Sierralta W, Thaller C, et al. (2001) Development of high-throughput tools to unravel the complexity of gene expression patterns in the mammalian brain. In: Bock G, Goode J, editors. Novartis Foundation Symposium : Complexity in Biological Information Processing. Chicester: John Wiley & Sons. pp. 129-149.
34. Yaylaoglu MB, Titmus A, Visel A, Alvarez-Bolado G, Thaller C, et al. (2005, in press) A comprehensive expression atlas of fibroblast growth factors and their receptors generated by a novel robotic in situ hybridization platform. Developmental Dynamics.
35. Reymond A, Marigo V, Yaylaoglu MB, Leoni A, Ucla C, et al. (2002) Human chromosome 21 gene expression atlas in the mouse. Nature 420: 582-586.
36. Catmull E, Clark J (1978) Recursively generated B-spline surfaces on arbitrary topological meshes. Computer-Aided Design 16: 350-355.
37. Warren J, Weimer H (2002) Subdivision methods for geometric design : a constructive approach. San Francisco: Morgan Kaufmann.
38. Lu HC, She WC, Plas DT, Neumann PE, Janz R, et al. (2003) Adenylyl cyclase I regulates AMPA receptor trafficking during mouse cortical 'barrel' map development. Nat Neurosci 6: 939-947.

Carson et al. A Digital Atlas for the Mouse Brain Transcriptome
20
39. Van der Loos H, Welker E, Dorfl J, Rumo G (1986) Selective breeding for variations in patterns of mystacial vibrissae of mice. Bilaterally symmetrical strains derived from ICR stock. J Hered 77: 66-82.
Carson et al. A Digital Atlas for the Mouse Brain Transcriptome
21
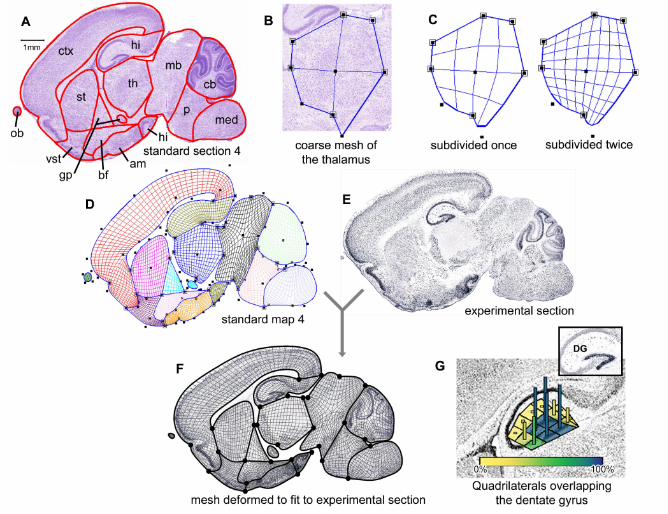
Figure 1. Postnatal day 7 (P7) mouse brain atlas construction and application
(A) Standard Nissl-stained P7 sagittal standard section number 4 with major anatomical
boundaries drawn in red: amygdala (am), basal forebrain (bf), cerebellum (cb), cortex
(ctx), globus pallidus (gp), hippocampus (hi), medulla (med), midbrain (mb), olfactory
bulb (ob), pons (p), striatum (st), thalamus (th), and ventral striatum (vst). (B) The coarse
mesh, shown here for the thalamus, is constructed by defining vertices of quadrilaterals.
(C) Iterative application of subdivision generates smooth boundary curves and a smooth
internal representation of smaller quadrilaterals. Fixed vertices (large squares) allow
crease angles to be added to the otherwise smooth boundary curve. (D) The atlas for
standard section number 4. Each coarse quadrilateral is associated with a particular
anatomical structure, an association inherited during subdivision. (E) Expression pattern
of Cannabinoid receptor 1 (Cnr1, Y18374) in a section similar to standard map 4. (F)
The atlas (D) is deformed by moving vertices so that the anatomical boundaries match
those in the Cnr1 section (E). (G) Quadrilaterals overlying the dentate gyrus (DG, insert)
were marked in 59 fitted maps using a mesh generated after two rounds of subdivision. In
every section, the same four quadrilaterals were found to overlap the bulk of the DG.
Carson et al. A Digital Atlas for the Mouse Brain Transcriptome
22
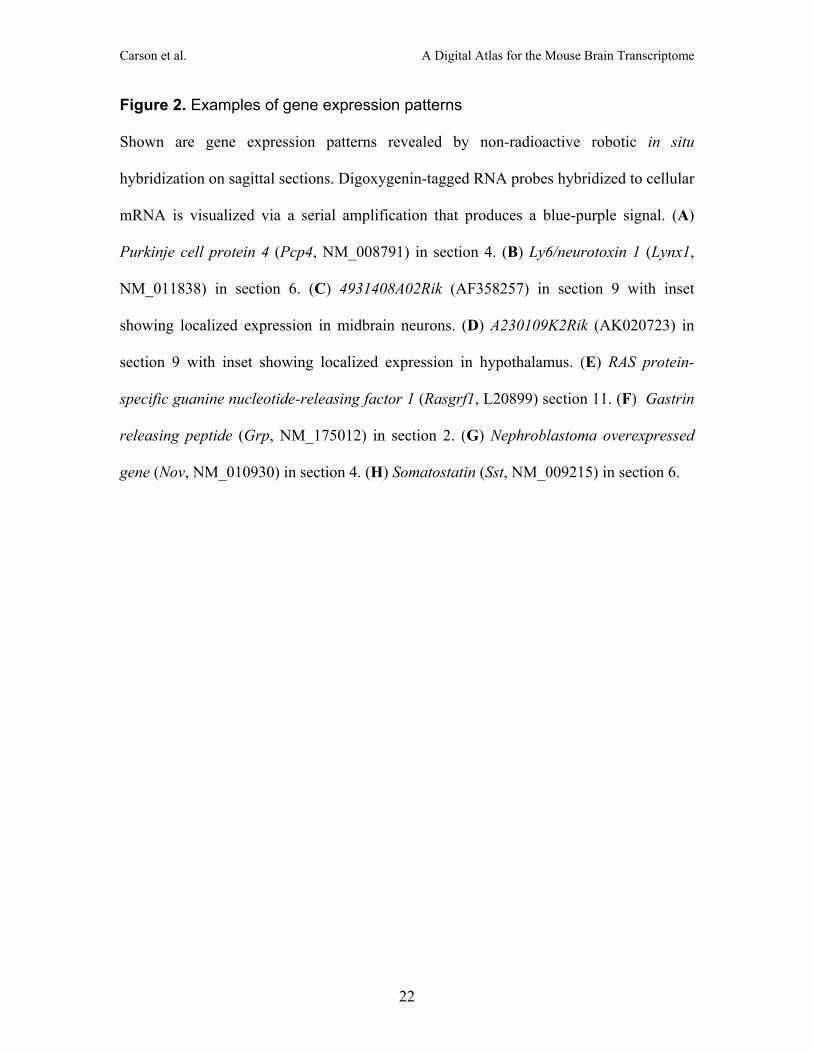
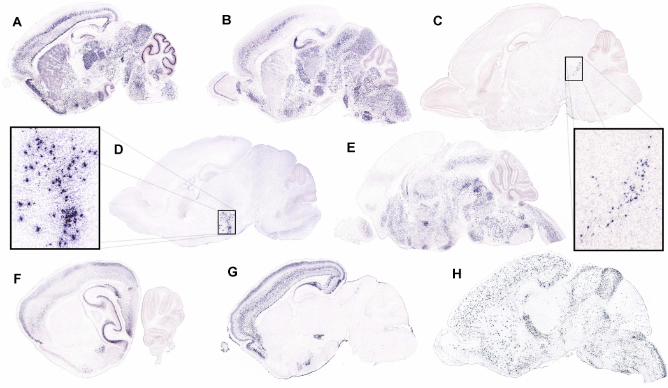
Figure 2. Examples of gene expression patterns
Shown are gene expression patterns revealed by non-radioactive robotic in situ
hybridization on sagittal sections. Digoxygenin-tagged RNA probes hybridized to cellular
mRNA is visualized via a serial amplification that produces a blue-purple signal. (A)
Purkinje cell protein 4 (Pcp4, NM_008791) in section 4. (B) Ly6/neurotoxin 1 (Lynx1,
NM_011838) in section 6. (C) 4931408A02Rik (AF358257) in section 9 with inset
showing localized expression in midbrain neurons. (D) A230109K2Rik (AK020723) in
section 9 with inset showing localized expression in hypothalamus. (E) RAS protein-
specific guanine nucleotide-releasing factor 1 (Rasgrf1, L20899) section 11. (F) Gastrin
releasing peptide (Grp, NM_175012) in section 2. (G) Nephroblastoma overexpressed
gene (Nov, NM_010930) in section 4. (H) Somatostatin (Sst, NM_009215) in section 6.
Carson et al. A Digital Atlas for the Mouse Brain Transcriptome
23
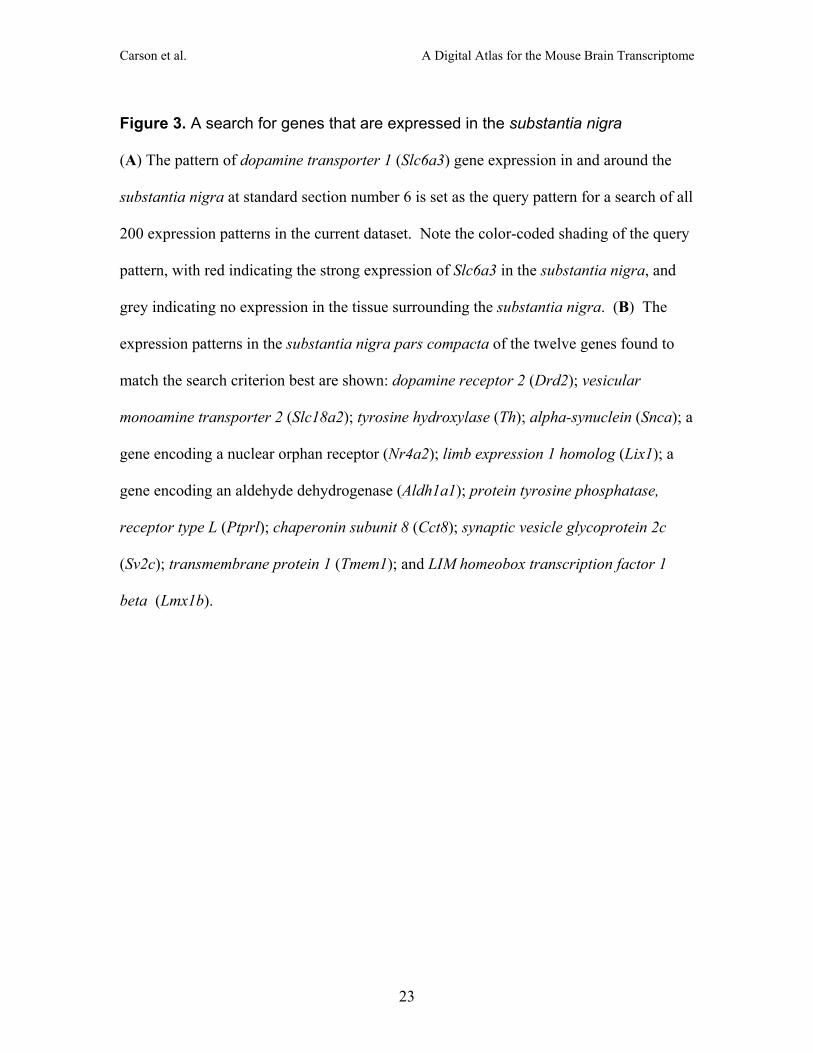
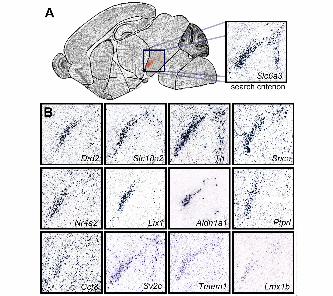
Figure 3. A search for genes that are expressed in the substantia nigra
(A) The pattern of dopamine transporter 1 (Slc6a3) gene expression in and around the
substantia nigra at standard section number 6 is set as the query pattern for a search of all
200 expression patterns in the current dataset. Note the color-coded shading of the query
pattern, with red indicating the strong expression of Slc6a3 in the substantia nigra, and
grey indicating no expression in the tissue surrounding the substantia nigra. (B) The
expression patterns in the substantia nigra pars compacta of the twelve genes found to
match the search criterion best are shown: dopamine receptor 2 (Drd2); vesicular
monoamine transporter 2 (Slc18a2); tyrosine hydroxylase (Th); alpha-synuclein (Snca); a
gene encoding a nuclear orphan receptor (Nr4a2); limb expression 1 homolog (Lix1); a
gene encoding an aldehyde dehydrogenase (Aldh1a1); protein tyrosine phosphatase,
receptor type L (Ptprl); chaperonin subunit 8 (Cct8); synaptic vesicle glycoprotein 2c
(Sv2c); transmembrane protein 1 (Tmem1); and LIM homeobox transcription factor 1
beta (Lmx1b).

Carson et al. A Digital Atlas for the Mouse Brain Transcriptome
24
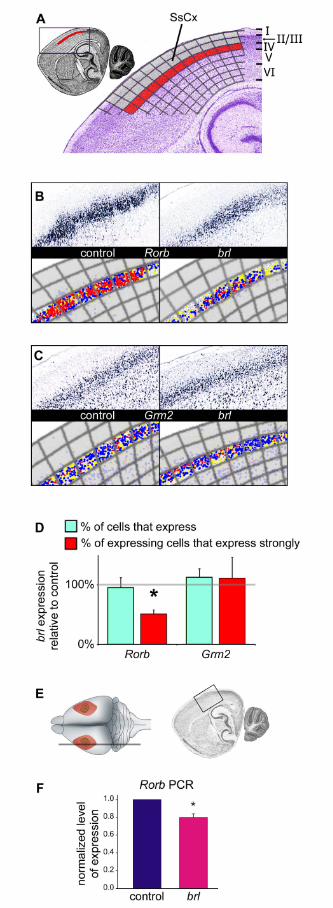
Figure 4. Quantitative analysis of Rorb and Grm2 expression in control and brl
P7 brains
(A) The dataset of 200 genes was searched using a query pattern defined as strong
expression in layer IV of the somatosensory cortex (SsCx) (red) and no expression in
layers I and II/III SsCx (grey) for standard section 2. Rorb and Grm2 were two of the top
matches returned. (B) The strong expression Rorb in control SsCx layer IV coincides
with the anatomical shape of the barrels which are absent in the brl mouse. For both
genotypes, cellular expression was detected and color-coded by signal strength using the
Celldetekt software, followed by fitting of the appropriate subdivision mesh to the shape
of the cortex. A row of 12 quadrilaterals in the subdivision mesh defines the area of
comparison in the SsCx layer IV. Note the greater prevalence of strongly expressing
cells (red) in the control tissue. Moderately expressing cells and weakly expressing cells
are indicated by blue and yellow respectively. (C) Quantification of Grm2 expression in
SsCx layer IV as described for Rorb showed no difference in expression strength
distribution between control and brl. (D) Statistical comparisons between control and brl
revealed no significant changes in the percentage of SsCx layer IV cells expressing either
Rorb (P = 0.8) or Grm2 (P = 0.5). However, a significant decrease in the percentage of
strongly expressing cells was found for Rorb in brl (P = 0.02), but not for Grm2 (P =
0.8). (E) The SsCx containing the barrel region was dissected as indicated (highlighted
and boxed) and used for quantitative RT-PCR analysis. (F) Consistent with the ISH data,
a statistically significant decrease in Rorb expression was found in brl by quantitative
RT-PCR (P = 0.008).
Related Documents