A strategy for a developmental green economy for Gauteng Final Report January 2010 Report prepared for the Gauteng Province Department of Economic Development By: Frank Spencer, G-Tech Energy Prof Mark Swilling, Sustainability Institute Prof David Everatt, Gauteng City Region Observatory Prof Mike Muller, Graduate School of P&DM, Wits University Jess Schulschenk, Sustainability Institute Jaco du Toit, Sustainability Institute Riaan Meyer, Centre for Renewable and Sustainable Energy Studies Warrick Pierce, Centre for Renewable and Sustainable Energy Studies

Welcome message from author
This document is posted to help you gain knowledge. Please leave a comment to let me know what you think about it! Share it to your friends and learn new things together.
Transcript

A strategy for a developmental green economy for Gauteng
Final Report
January 2010
Report prepared for the Gauteng Province Department of Economic Development
By:
Frank Spencer, G-Tech Energy
Prof Mark Swilling, Sustainability Institute
Prof David Everatt, Gauteng City Region Observatory
Prof Mike Muller, Graduate School of P&DM, Wits University
Jess Schulschenk, Sustainability Institute
Jaco du Toit, Sustainability Institute
Riaan Meyer, Centre for Renewable and Sustainable Energy Studies
Warrick Pierce, Centre for Renewable and Sustainable Energy Studies
Strategy for a Developmental Green Economy for Gauteng
2
Table of Contents
Table of Contents ................................................ 2
This document ..................................................... 5
The strategy ......................................................... 6
1.1 Strategic agenda for 2010 ...................... 6
Key initiatives .................................................. 6
Implementation and DED ................................ 6
Food security ................................................... 7
2 Energy security ............................................. 7
Solar water heating industry ........................... 7
Energy Efficiency ............................................. 8
Concentrated solar power (CSP) ..................... 8
3. Water Security ............................................ 9
Long-Term Water Supply ................................ 9
Water Demand Management ......................... 9
Pollution Reversal ........................................... 9
Sanitation 10
4. Sustainable Mobility ................................. 10
Strategy for a developmental Green Gauteng
(summary) ............................................... 11
1.2 Introduction to the Green Economy .... 11
1.3 Green Economy Benefits ...................... 13
1.4 Gauteng Macro-Economic Challenges . 13
1.5 Measuring Success ............................... 13
1.6 Key Policies ........................................... 15
1.7 Summary of Proposed Initiatives ......... 16
1.7.1 Local Food Production...................... 16
1.7.2 Solar Water Heaters ......................... 17
1.7.3 Energy Efficiency .............................. 18
1.7.4 Concentrated Solar Power Industry . 19
1.7.5 Water & Sanitation .......................... 19
1.7.6 Waste Management ......................... 20
1.7.7 Transport .......................................... 21
1.8 Other Initiatives.................................... 22
1.9 Conclusions .......................................... 25
2 Introduction to the Green Economy ........... 25
3 Green Economy Benefits ............................. 29
4 Measuring Success ...................................... 35
5 Gauteng Macro-Economic Challenges ........ 36
5.1 Food ...................................................... 36
5.2 Energy ................................................... 37
5.3 Water & Sanitation ............................... 37
5.4 Waste.................................................... 37
5.5 Poverty & Inequality ............................. 38
6 Policy Framework for Action ....................... 39
6.1 Drivers .................................................. 39
6.2 Recommendations ............................... 39
7 Proposed Initiatives ..................................... 42
7.1 Local Food Production .......................... 42
7.1.1 Summary of findings ......................... 42
7.1.2 Introduction ...................................... 42
7.1.3 Gauteng in Perspective ..................... 43
7.1.4 Recommendations ............................ 46
7.1.5 Summary of Policy Recommendations
................................................... 54
7.1.6 References ........................................ 57
7.2 Solar Water Heating ............................. 60
7.2.1 Summary of findings ......................... 60
7.2.2 Introduction ...................................... 60
7.2.3 Installation Targets ........................... 61
7.2.4 Installation Requirements and savings
................................................... 62
7.2.5 Economic Payback Period ................. 63
7.2.6 Job Creation Potential ...................... 64
7.2.7 Potential of Carbon Financing .......... 65
7.2.8 Recommendations ............................ 66
7.2.9 Proposed Rollout Strategy ................ 66
7.2.10 Policy Recommendations ............... 69
7.2.11 References ...................................... 69
7.3 Energy Efficiency .................................. 70
7.3.1 Summary of findings ......................... 70
7.3.2 Introduction ...................................... 70
7.3.3 Energy Intensity ................................ 71
7.3.4 Gauteng Targets ............................... 73
7.3.5 Calculations ...................................... 74
7.3.6 Economic Interventions .................... 74

Strategy for a Developmental Green Economy for Gauteng
3
7.3.7 Specific Energy Efficiency Interventions
................................................... 74
7.4 Concentrated Solar Power Industry ..... 76
7.4.1 Summary of Findings ........................ 76
7.4.2 Introduction and potential of CSP
within the Gauteng Province ..... 76
7.4.3 The potential of importing CSP energy
................................................... 77
7.4.4 Current and projected (2025)
provincial electricity demand in
Gauteng ..................................... 77
7.4.5 Plan to achieve 16% power from
Renewables................................ 78
7.4.6 Cost of CSP vs Coal fired power
stations ...................................... 79
7.4.7 Job creation / protection potential .. 79
7.4.8 Benefits of CSP compared to current
energy generation technologies 80
7.4.9 Job Creation ..................................... 81
7.4.10 References...................................... 83
7.5 Water & Sanitation .............................. 84
7.5.1 Introduction ..................................... 84
7.5.2 Context ............................................. 84
7.5.3 Water resources situation ................ 86
7.5.4 Overview of water quality status ..... 89
7.5.5 Strategic issues ................................. 91
7.5.6 Strategic opportunities .................... 93
7.5.7 Recommendations ........................... 96
7.6 Waste Management ............................. 97
7.6.1 Summary of findings ........................ 97
7.6.2 Introduction ..................................... 97
7.6.3 Current Gauteng Figures .................. 98
7.6.4 Job creation potential ...................... 99
7.6.5 Recommendations & benefits ........ 100
7.7 Transport ............................................ 103
7.7.1 Summary of findings ...................... 103
7.7.2 Introduction ................................... 103
7.7.3 Possible economic benefits and job
creation potential .................... 104
7.7.4 Recommendations ......................... 106
8 Other Suggested Initiatives ....................... 107
8.1 Short-term .......................................... 107
8.2 Medium-term ..................................... 108
8.3 Long-term ........................................... 108
8.4 Summary ............................................ 109
9 Conclusions ................................................ 110
10 Appendix A: Bibliography ........................ 112
11 Appendix B: Additional Comments on the
Economic Crisis and Ecological Limits ... 114
11.1.1 Climate Change ............................. 116
11.1.2 Peak Oil & Coal ............................. 118
11.1.3 Soils............................................... 121
11.1.4 Biodiversity and Ecosystem Services
................................................. 124
12 Appendix C: International Responses to the
Economic Crisis ...................................... 127
12.1 International Summary .................... 127
12.2 Australia ........................................... 127
12.3 China ................................................. 127
12.4 Germany ........................................... 128
12.5 India .................................................. 128
12.6 Nigeria .............................................. 128
12.7 South Korea ...................................... 128
12.8 United Kingdom ................................ 128
12.9 USA ................................................... 128
13 Appendix D: Existing Policy & Commitments
– National, Provincial & Local ................ 131
13.1 National Government ....................... 131
13.2 Business ............................................ 132
13.3 Gauteng Province ............................. 132
13.3.1 Integrated Waste Management Policy
(2006) ....................................... 132
13.3.2 Gauteng’s Response to the Economic
Crisis, Draft Strategy (2009) ..... 132
13.3.3 The Gauteng Employment Growth
and Development Strategy 2009 –
2014 (2009 Draft) ..................... 133
13.3.4 Gauteng Integrated Energy Strategy
(Nov 2009 Draft) ...................... 133
Strategy for a Developmental Green Economy for Gauteng
4
13.3.5 Gauteng Province Air Quality
Management Plan (Aug 2009) . 134
14 Appendix E: Funding Options .................. 135
14.1 World Bank ....................................... 135
14.2 Carbon Finance ................................ 135
15 Appendix E: Additional information on Local
Food Production .................................... 136
15.1 Case Study: The Cuba Experience ... 136
15.2 Environmental Benefits of Food System
Regionalisation............................... 139
15.3 Social Benefits of Food System
Regionalisation............................... 140
15.4 Building Knowledge Networks ......... 141
16 Appendix F: Water Demand Management
Project ................................................... 142
Strategy for a Developmental Green Economy for Gauteng
5
1 This document
During 2009, the Gauteng City-region Observatory (GCRO) undertook a study of how sub-national units
across the world were responding to the global financial crisis, commissioned by the Gauteng Department
for Economic Development. A key finding of that study was the many cities, city-regions and other similar
areas were investing heavily in ‘green’ technologies, creating green jobs, and preparing for a post-crisis
context where sustainable growth – low carbon economies, ‘green’ jobs, enhanced quality of life – were
the norm; and where there was a need to avoid environmental taxes and penalties.
Late in 2009, the MEC for Economic Development in Gauteng, Hon Firoz Cachalia, approached the GCRO to
develop a ‘green economy’ strategy for the province, as part of a broader Gauteng Growth Employment
and Development Strategy (GGEDS). This created considerable logistical challenges, given that the GGEDS
was due in late January, and the team convened by GCRO had some 6 weeks to develop this strategy
document; to do so, the team had to work through the December holidays. Frank Spencer in particular
worked beyond the call of duty in putting this document together on time and within budget.
Although colloquially referred to as the ‘green jobs’ strategy, this is really about sustainable development.
Gauteng cannot adopt some green options here and leave dirty options elsewhere; green jobs are an
output of a broader decision to embrace a low carbon future, with all the implications that entails – many
of which are spelled out in the second part of this document.
The strategy is a first draft, written in some haste, and with the best data available to the authors. The
authors are drawn from various institutions, many are leaders in their fields, and we thank them for making
their time available at such short notice.
The strategy is summarised up front, in some 20 pages of key points, economic impact, job creation, and
related data. Thereafter, each key initiative is developed in greater detail, and the reader can follow the
argument, modelling and outputs in greater detail. The strategy also summarises South Africa’s ‘green’
commitments – the policy framework within which the document has been written – and ends with both
some international comparative examples, and alternative funding options available to support the green
strategy.
Two points need to be made:
1. Firstly, this document sets out a broad range of policy options from which the Gauteng Provincial
Government (GPG) may select those it feels most appropriate. In some instances, those policy
options have themselves been broken down by scale, providing a suite of options for GPG. Once
GPG makes its policy choices, the options it selects will have to be properly modelled, design and
rolled out. This strategy provides an overview, albeit with considerable detail; but it is not a
programme design document, which will have to follow later in the process.
2. Secondly, taking up the options proposed here would put Gauteng at the cutting edge of green and
sustainable economic development worldwide.
Sustainable economic development makes social and economic sense. Economic growth is boosted,
and on a viable ecological and social footing. Green jobs thus become the norm, not an ‘add-on’. This is
the future for Gauteng proposed in this strategy.
Strategy for a Developmental Green Economy for Gauteng
6
The strategy
Strategic agenda for 2010
Over the next 15 years, the Gauteng Provincial Government will design, manage and implement a
systematic programme aimed at building a low carbon, resource-productive economy that creates new
‘green’ jobs and reduces environmental impacts.
The overall strategic goal is sustainable economic growth and sustainable job creation for
Gauteng.
The Department of Economic Development (DED) will lead this programme, given its mandate of both
growth and job creation – this strategy is based on sustainable growth where the purpose of growth is job
creation. The DED will work with other provincial departments, as well as the local and national spheres,
the private sector, civil society, labour and the universities, which have a key role to play in the strategy.
The DED will act in different ways depending on the strategic objective and context. In addition to funding
and implementing its own initiatives, it will also play various roles such as facilitator, catalyst, partner, and
regulator.
Key initiatives Greening he economy will be achieved by pursuing the following overarching programmes, with more to
follow over time:
• Food security: reducing food imports and (vastly) increasing local food production
• Energy security: reducing dependence on oil and coal-based sources of energy by increasing the supply of renewable energy and improving energy efficiency
• Water security: reducing total water consumption by 15% by improving efficiencies, introducing recycling, increased public education, and reversing pollution via more effective management of Gauteng’s water resources and associated eco-system services
• Zero waste: by seeing all waste outputs as potential productive inputs, measures will be introduced to reduce, recycle and re-use
• Sustainable mobility: to reduce dependence on oil and limit carbon emissions, investments in public transport systems will be accelerated so that the number of trips in private vehicles can be reduced by 15%
Provincial government as a whole will drive two over-arching programmes:
• Sustainable human settlements: building socially integrated human settlements that are designed to reduce distances between home and work, generate more energy than they use, recycle waste, use less water and are built from the most sustainable building materials
• Efficiency: a cross-cutting programme aimed at maximising resource efficiency in all the above resource use areas (water, energy, etc.)
Implementation and DED
To ensure implementation of these programmes, DED will play the following roles in the different areas.
Strategy for a Developmental Green Economy for Gauteng
7
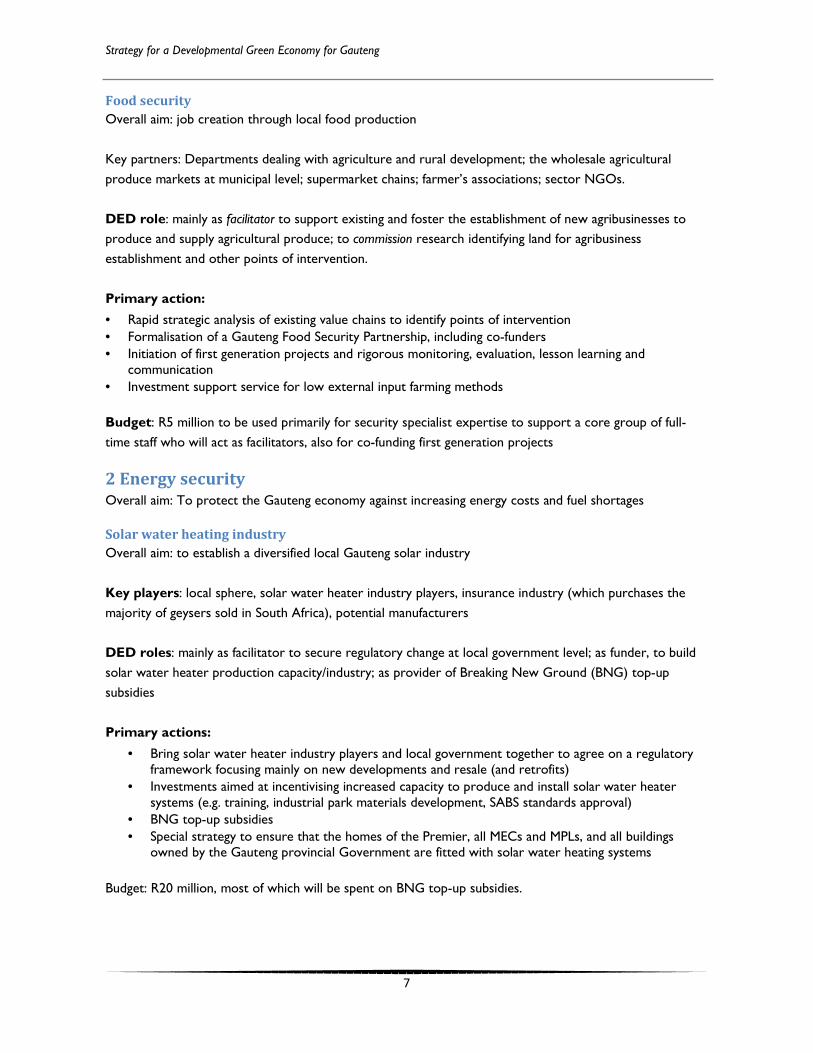
Food security
Overall aim: job creation through local food production
Key partners: Departments dealing with agriculture and rural development; the wholesale agricultural
produce markets at municipal level; supermarket chains; farmer’s associations; sector NGOs.
DED role: mainly as facilitator to support existing and foster the establishment of new agribusinesses to
produce and supply agricultural produce; to commission research identifying land for agribusiness
establishment and other points of intervention.
Primary action:
• Rapid strategic analysis of existing value chains to identify points of intervention
• Formalisation of a Gauteng Food Security Partnership, including co-funders
• Initiation of first generation projects and rigorous monitoring, evaluation, lesson learning and communication
• Investment support service for low external input farming methods
Budget: R5 million to be used primarily for security specialist expertise to support a core group of full-
time staff who will act as facilitators, also for co-funding first generation projects
2 Energy security Overall aim: To protect the Gauteng economy against increasing energy costs and fuel shortages
Solar water heating industry
Overall aim: to establish a diversified local Gauteng solar industry
Key players: local sphere, solar water heater industry players, insurance industry (which purchases the
majority of geysers sold in South Africa), potential manufacturers
DED roles: mainly as facilitator to secure regulatory change at local government level; as funder, to build
solar water heater production capacity/industry; as provider of Breaking New Ground (BNG) top-up
subsidies
Primary actions:
• Bring solar water heater industry players and local government together to agree on a regulatory framework focusing mainly on new developments and resale (and retrofits)
• Investments aimed at incentivising increased capacity to produce and install solar water heater systems (e.g. training, industrial park materials development, SABS standards approval)
• BNG top-up subsidies
• Special strategy to ensure that the homes of the Premier, all MECs and MPLs, and all buildings owned by the Gauteng provincial Government are fitted with solar water heating systems
Budget: R20 million, most of which will be spent on BNG top-up subsidies.
Strategy for a Developmental Green Economy for Gauteng
8
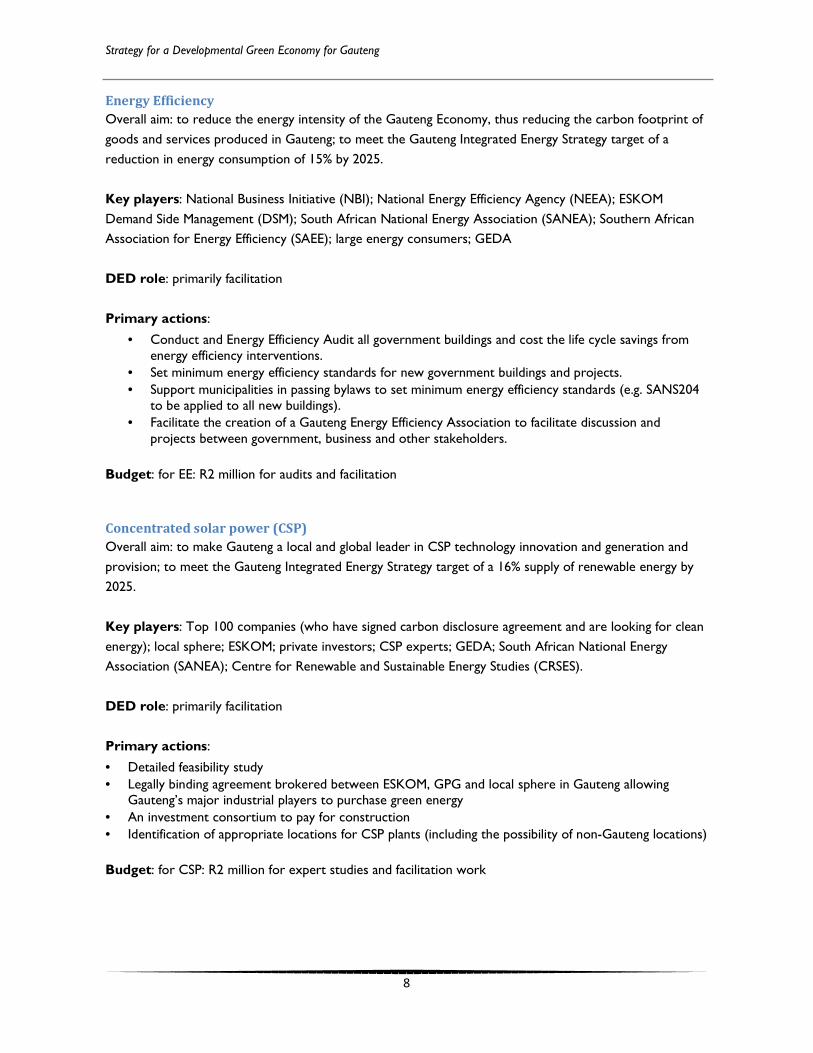
Energy Efficiency
Overall aim: to reduce the energy intensity of the Gauteng Economy, thus reducing the carbon footprint of
goods and services produced in Gauteng; to meet the Gauteng Integrated Energy Strategy target of a
reduction in energy consumption of 15% by 2025.
Key players: National Business Initiative (NBI); National Energy Efficiency Agency (NEEA); ESKOM
Demand Side Management (DSM); South African National Energy Association (SANEA); Southern African
Association for Energy Efficiency (SAEE); large energy consumers; GEDA
DED role: primarily facilitation
Primary actions:
• Conduct and Energy Efficiency Audit all government buildings and cost the life cycle savings from energy efficiency interventions.
• Set minimum energy efficiency standards for new government buildings and projects.
• Support municipalities in passing bylaws to set minimum energy efficiency standards (e.g. SANS204 to be applied to all new buildings).
• Facilitate the creation of a Gauteng Energy Efficiency Association to facilitate discussion and projects between government, business and other stakeholders.
Budget: for EE: R2 million for audits and facilitation
Concentrated solar power (CSP)
Overall aim: to make Gauteng a local and global leader in CSP technology innovation and generation and
provision; to meet the Gauteng Integrated Energy Strategy target of a 16% supply of renewable energy by
2025.
Key players: Top 100 companies (who have signed carbon disclosure agreement and are looking for clean
energy); local sphere; ESKOM; private investors; CSP experts; GEDA; South African National Energy
Association (SANEA); Centre for Renewable and Sustainable Energy Studies (CRSES).
DED role: primarily facilitation
Primary actions:
• Detailed feasibility study
• Legally binding agreement brokered between ESKOM, GPG and local sphere in Gauteng allowing Gauteng’s major industrial players to purchase green energy
• An investment consortium to pay for construction
• Identification of appropriate locations for CSP plants (including the possibility of non-Gauteng locations)
Budget: for CSP: R2 million for expert studies and facilitation work

Strategy for a Developmental Green Economy for Gauteng
9
3. Water Security
Overall aim: to empower DED to actively prevent water services and water supply from undermining
future economic growth in Gauteng. This can only be achieved by decreasing total consumption of water by
15% which, in turn, can only be achieved by reducing the water intensity of the Gauteng economy,
improving efficiencies and reversing the high levels of pollution of water resources and associated eco-
system services.
3 Long-Term Water Supply Key players: Rand Water Board, ERWAT, local governments, Department of Water Affairs, potential
private sector players, Universities, CSIR, DBSA and Water Research Commission.
DED role: primarily as facilitator
Primary actions:
• Establish the Gauteng Water Resources Group (GWARG) to review the adequacy of long-term water supply planning and the actions required now to prepare for this
• Identify a programme of projects to be implemented over next 5 to 10 years with associated funding sources with major job creation potential
Budget: R1.5 million mainly for the establishment of the Gauteng Water Resources Group and the
commissioning of the review document
Water Demand Management
Key players: Rand Water Board, ERWAT, local governments, Department of Water Affairs, potential
private sector players, Universities, CSIR, DBSA and Water Research Commission.
DED role: primarily as facilitator
Primary actions:
• Under the auspices of the GWARG review the current already approved water demand targets that have already been set and the level of non-compliance
• Agree on key interventions with local governments, in particular with respect to the reduction of Unaccounted for Water
• Focus on mining and major industrial establishments and on how they can become more self-sufficient via water recycling
Budget: R1.5 million for review and strategic interventions – a larger capital budget may be required in
2010 to supplement local government budgets for funding key capital interventions.
Pollution Reversal
Key players: Rand Water Board, ERWAT, local governments, Department of Water Affairs, potential
private sector players, Universities, CSIR, DBSA and Water Research Commission, plus the Gauteng
Department responsible for the environment.
DED role: primarily as facilitator
Strategy for a Developmental Green Economy for Gauteng
10
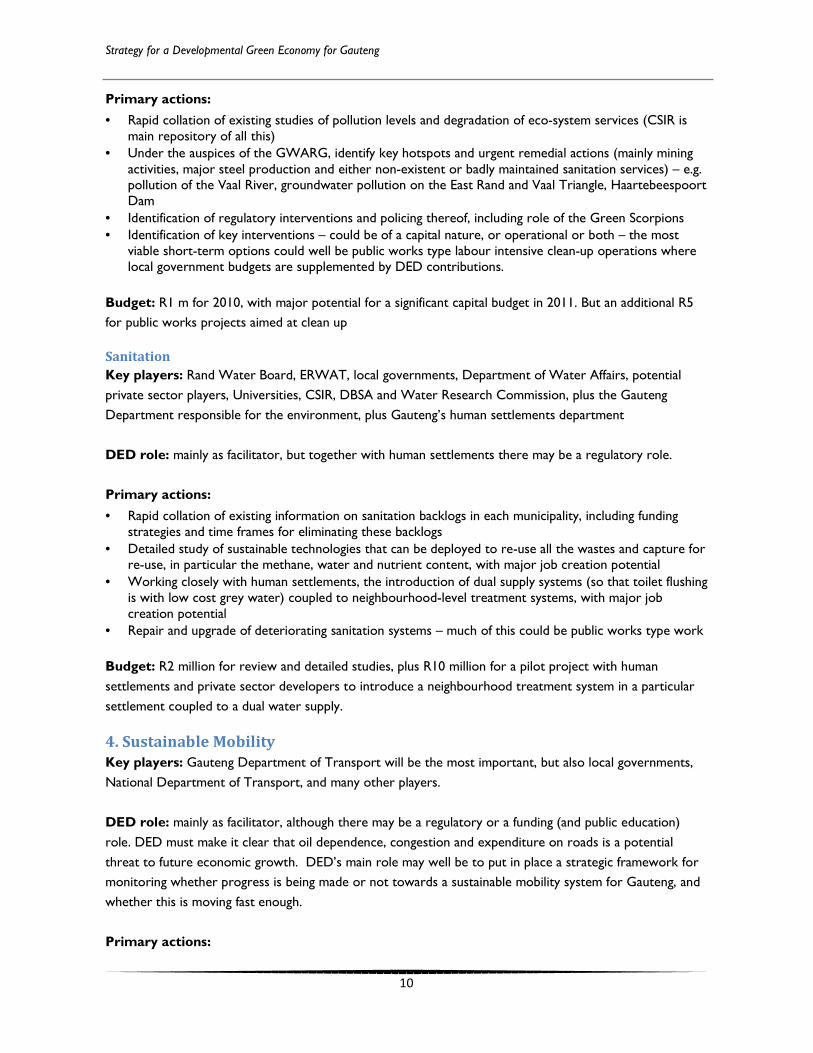
Primary actions:
• Rapid collation of existing studies of pollution levels and degradation of eco-system services (CSIR is main repository of all this)
• Under the auspices of the GWARG, identify key hotspots and urgent remedial actions (mainly mining activities, major steel production and either non-existent or badly maintained sanitation services) – e.g. pollution of the Vaal River, groundwater pollution on the East Rand and Vaal Triangle, Haartebeespoort Dam
• Identification of regulatory interventions and policing thereof, including role of the Green Scorpions
• Identification of key interventions – could be of a capital nature, or operational or both – the most viable short-term options could well be public works type labour intensive clean-up operations where local government budgets are supplemented by DED contributions.
Budget: R1 m for 2010, with major potential for a significant capital budget in 2011. But an additional R5
for public works projects aimed at clean up
Sanitation
Key players: Rand Water Board, ERWAT, local governments, Department of Water Affairs, potential
private sector players, Universities, CSIR, DBSA and Water Research Commission, plus the Gauteng
Department responsible for the environment, plus Gauteng’s human settlements department
DED role: mainly as facilitator, but together with human settlements there may be a regulatory role.
Primary actions:
• Rapid collation of existing information on sanitation backlogs in each municipality, including funding strategies and time frames for eliminating these backlogs
• Detailed study of sustainable technologies that can be deployed to re-use all the wastes and capture for re-use, in particular the methane, water and nutrient content, with major job creation potential
• Working closely with human settlements, the introduction of dual supply systems (so that toilet flushing is with low cost grey water) coupled to neighbourhood-level treatment systems, with major job creation potential
• Repair and upgrade of deteriorating sanitation systems – much of this could be public works type work
Budget: R2 million for review and detailed studies, plus R10 million for a pilot project with human
settlements and private sector developers to introduce a neighbourhood treatment system in a particular
settlement coupled to a dual water supply.
4. Sustainable Mobility
Key players: Gauteng Department of Transport will be the most important, but also local governments,
National Department of Transport, and many other players.
DED role: mainly as facilitator, although there may be a regulatory or a funding (and public education)
role. DED must make it clear that oil dependence, congestion and expenditure on roads is a potential
threat to future economic growth. DED’s main role may well be to put in place a strategic framework for
monitoring whether progress is being made or not towards a sustainable mobility system for Gauteng, and
whether this is moving fast enough.
Primary actions:

Strategy for a Developmental Green Economy for Gauteng
11
• Reach agreement with Department of Transport on the most constructive role that DED could play, taking into account the resources such as GEDA and Blue IQ that DED can bring into the process
• Review and establish targets for Gauteng, and assess whether current investment strategies to increase the supply of public transport are adequate (e.g. BRT, Gautrain etc.)
• Public communication and education about the need to shift to low carbon transport and away from private vehicular travel as the primary means
Budget: R1.5 million
Strategy for a developmental Green Gauteng (summary)
“Climate change is a practical matter for the developing world, especially Africa... For countries
such as South Africa, weather patterns in coastal provinces are already wreaking havoc on the
lives of our people, which makes this challenge a reality that we are already confronting... We,
the leaders of the world, need to seize our historical opportunity to act now to safeguard the
future of humanity and the planet it inhabits. We owe it to current and future generations.”
Pres. Zuma, COP15 Copenhagen, December 18th
, 2009
"We have an opportunity over the decade ahead to shift the structure of our economy towards
greater energy efficiency, and more responsible use of our natural resources and relevant
resource-based knowledge and expertise. Our economic growth over the next decade and
beyond cannot be built on the same principles and technologies, the same energy systems and
the same transport modes, that we are familiar with today."
South African Finance Minister Trevor Manual, Budget speech, Parliament February 20th, 2008
1.1 Introduction to the Green Economy
Global economic thinking is currently experiencing a paradigm shift from the current capital-focussed
resource-intensive development towards what is being called the “Green Economy”. A Green Economy is
one in which business processes are infrastructure reconfigured “to deliver better returns on natural,
human and economic capital investments, while at the same time reducing greenhouse gas emissions,
extracting and using fewer natural resources, creating less waste and reducing social disparities.”1 Thus a
Green Economy “grows by reducing rather than increasing resource consumption”2,3
. These economies
have also been termed low-carbon economies.
For South Africa, this issue has been raised in the Cabinet-approved Long Term Mitigation Strategy for
Climate Change:
1 UNEP, Global Green New Deal: An Update for the G20 Pittsburgh Summit, ii.
2 Swilling, Growth, Resource Use and Decoupling: Towards a ‘Green New Deal’ for South Africa, 5.
3 This process is also known as “dematerialisation”.

Strategy for a Developmental Green Economy for Gauteng
12
“Growing without carbon constraints may be good for South Africa’s economic growth, but it
will result in rapidly increasing emissions. A four-fold increase in emissions by 2050 is likely to
be unacceptable to the international community. It is also a high-risk approach on other
grounds, such as rising oil prices, carbon constraints in trade, and advancing impacts. If all
countries, including high emitters in the developing world, adopted a Growth without
Constraints approach, climate change impacts in South Africa would be extensive. A massive
effort would be needed by South Africa to achieve emissions reduction sufficient to meet the
“Required by Science” target. The gap between where South Africa’s emissions are going and
where they need to go is large (1300 Mt CO2-eq, more than three times South Africa’s annual
emissions of 446 Mt in 2003)” (LTMS 2008 pg 27).
This shift to low-carbon economies has intensified due to the recent economic crisis, inspiring organisations
to direct programmes to create green jobs, which is “work in agricultural, manufacturing, research and
development (R&D), administrative, and service activities that contribute substantially to preserving or
restoring environmental quality.”4
At an international level this led to South Africa joining with the other G20 nations to make a number of
recent commitments in this space:
o “We will make the transition towards clean, innovative, resource efficient, low carbon
technologies and infrastructure.”5
o “As leaders of the world’s major economies, we are working for a resilient, sustainable
and green economy.”6
The change in thinking that is required to achieve these goals includes:
• Environmental protection must no longer be viewed as a constraint to economic growth, but as a
driver of growth and essential for long-term economic sustainability7.
• Production and consumption must no longer be viewed as “linear” processes, but must be thought
of and consciously designed using holistic life cycle/circular concepts8.
• A shift from capital-focussed investment to strategic investments in knowledge capital and the
systems that create innovation.
It will be up to Gauteng as the economic heart of South Africa to drive these goals and create sustainable
jobs through a sustainable use of resources and a reduction in carbon intensity. Adopting the measures
proposed here would catapult Gauteng to the cutting edge of green economies world-wide.
4 UNEP, Green Jobs: Towards decent work in a sustainable, low-carbon world, 3.
5 G20, London, 2 April 2009
6 G20, Pittsburgh, 24-25 Sept 2009
7 UNESCAP, Green Growth at a Glance, 13.
8 Ibid.
Strategy for a Developmental Green Economy for Gauteng
13
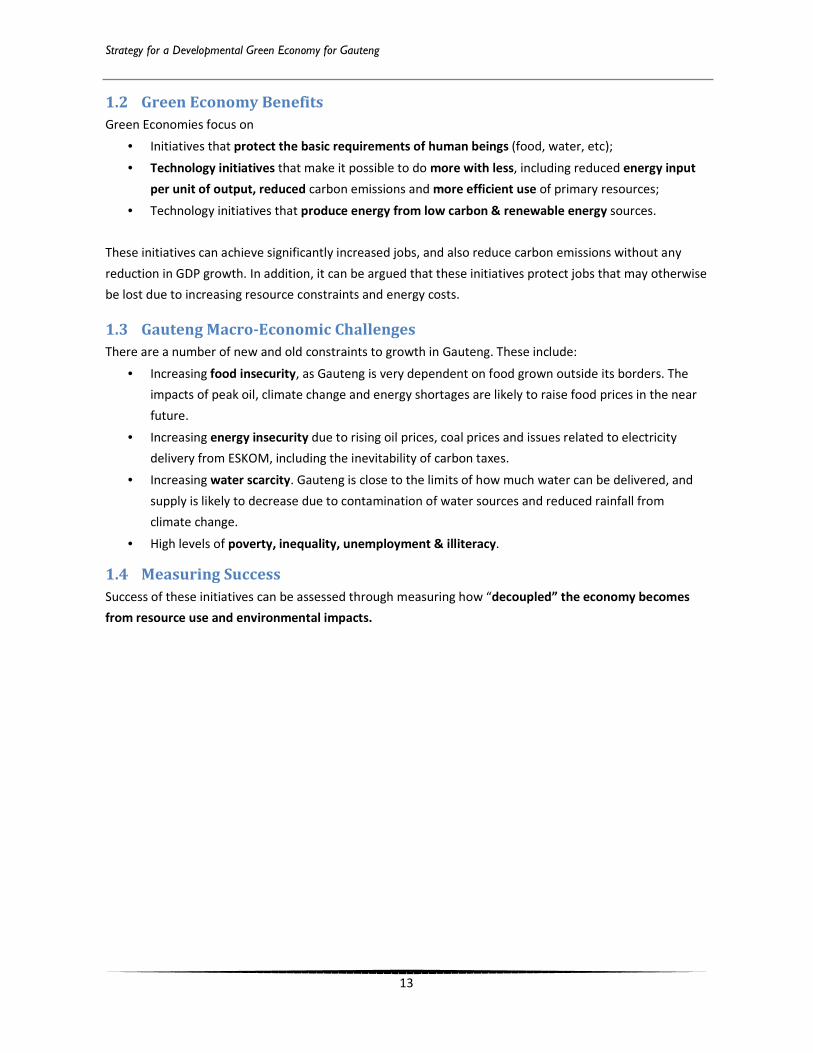
1.2 Green Economy Benefits
Green Economies focus on
• Initiatives that protect the basic requirements of human beings (food, water, etc);
• Technology initiatives that make it possible to do more with less, including reduced energy input
per unit of output, reduced carbon emissions and more efficient use of primary resources;
• Technology initiatives that produce energy from low carbon & renewable energy sources.
These initiatives can achieve significantly increased jobs, and also reduce carbon emissions without any
reduction in GDP growth. In addition, it can be argued that these initiatives protect jobs that may otherwise
be lost due to increasing resource constraints and energy costs.
1.3 Gauteng Macro-Economic Challenges
There are a number of new and old constraints to growth in Gauteng. These include:
• Increasing food insecurity, as Gauteng is very dependent on food grown outside its borders. The
impacts of peak oil, climate change and energy shortages are likely to raise food prices in the near
future.
• Increasing energy insecurity due to rising oil prices, coal prices and issues related to electricity
delivery from ESKOM, including the inevitability of carbon taxes.
• Increasing water scarcity. Gauteng is close to the limits of how much water can be delivered, and
supply is likely to decrease due to contamination of water sources and reduced rainfall from
climate change.
• High levels of poverty, inequality, unemployment & illiteracy.
1.4 Measuring Success
Success of these initiatives can be assessed through measuring how “decoupled” the economy becomes
from resource use and environmental impacts.

Strategy for a Developmental Green Economy for Gauteng
14
Resource decoupling refers to decoupling the rate of consumption of (primary) resources from economic
activity, which is equivalent to “dematerialization”. It implies using less material, energy, water and land
resources for the same economic output. If there is resource decoupling, there is an increase in resource
productivity or, in other words, an increase in the efficiency with which resources are used. Resource
productivity can usually be measured unequivocally: it can be expressed for a national economy or for an
economic sector or even for a certain economic process or production chain by dividing added value by
resource input (e.g. GDP/Domestic Material Consumption). If this quotient increases with time, resource
productivity is rising. Another way to demonstrate resource decoupling is comparing the gradient of
economic output across time with the gradient of resource input: if the latter is smaller, there is resource
decoupling.
Impact decoupling, by contrast, refers to the relation between economic output and (various)
environmental impacts. There are environmental impacts associated with the extraction of resources
required (such as groundwater pollution due to mining or agriculture), environmental impacts from
production (such as land degradation, wastes and emissions), environmental impacts associated with the
use phase of commodities (for example mobility resulting in CO2 emissions), and there are end-of-pipe
environmental impacts (again wastes and emissions). Methodologically, these impacts can be estimated by
life cycle analysis (LCA) in combination with various input-output techniques. If environmental impacts
become dissociated from added value in economic terms, there is impact decoupling. On aggregate
system levels such as a national economy or an economic sector, it is methodologically very demanding to
measure impact decoupling, because there is a whole number of environmental impacts to be considered,
their trends may be quite different, and system boundaries as well as weighting procedures are contested.9
9 Swilling, M. And Fischer-Kowalski, M. 2010. Decoupling and Sustainable Resource Management: Towards a
Conceptual Framework. Paris: International Panel for Sustainable Resource management, United Nations Environment
Programme.
Strategy for a Developmental Green Economy for Gauteng
15
1.5 Key Policies
Policy interventions to enable a Green Economy should revolve around the following core drivers:
1) Creation of both new skills and jobs in new green-driven industries;
2) Promote innovation in existing processes and new technologies;
3) Promote both local and foreign investment into Gauteng;
4) Decouple growth from resource consumption, especially dependency on fossil fuels;
5) Improve efficiency in energy and resource consumption;
6) Promote energy security and reduce dependency on crucial imports (e.g. oil);
7) Respect ecological limits;
8) Design for virtuous circles i.e. cradle-to-cradle economies, reduce-recycle-reuse;
9) Promote equity & fairness to both people and the environment;
10) Shift energy supply from Centralised Fossil Fuel systems to Decentralised Renewable Energy
Systems;
11) Create food security and alleviate poverty.
Some of the core policies that could be addressed include
1) Energy
a. Allow entities to generate their own energy and sell excess into the grid
b. Set binding renewable energy targets with strong regulatory certainty
c. Remove subsidies for high-carbon fuels and penalise inefficiency
d. Promote stringent energy efficiency standards for all sectors
e. Fast tracked skills training in energy efficiency
f. Public education programs on energy efficiency and renewable energy
g. Promote strong demand-side management programmes
2) Climate Change
a. Set emission reduction targets to keep global warming below 2 degrees C
3) Resources
a. Promote large scale local food production
b. Establish an ecological accounting system to monitor the state of environmental services
c. Establish a water management programme
d. Promote waste management programmes, especially recycling & reuse of building
materials.
4) Transportation
a. Promote low carbon transportation systems
b. Remove subsidies for fossil fuel and penalise inefficiency (high fuel consumption)
c. Establish a long-term strategic shift away from private car use and support for mass transit,
public transport, rail, etc.
Strategy for a Developmental Green Economy for Gauteng
16
5) Social
a. Measure Gross National Happiness
b. Prioritization of eco-efficiency indicators as measurements for benchmarking development
progress
c. Run public awareness raising campaigns about the significance of climate change, resource
scarcity and Low Carbon Green Growth
6) Financial
a. Establish green taxes (e.g. carbon and energy taxes, fuel charges, congestion pricing)
b. Invest in sustainable green infrastructure
c. Government-backed financing for new green business initiatives
d. Promotion of eco-industrial parks and smart growth zones (e.g. zero carbon/zero waste
IDZ)
7) Economic
a. Promote growth through innovation and skills in green technologies
b. Government funded technical vocational and educational training (TVET) for developing
new green skills, especially for small and medium-sized enterprises and in innovation.
1.6 Summary of Proposed Initiatives
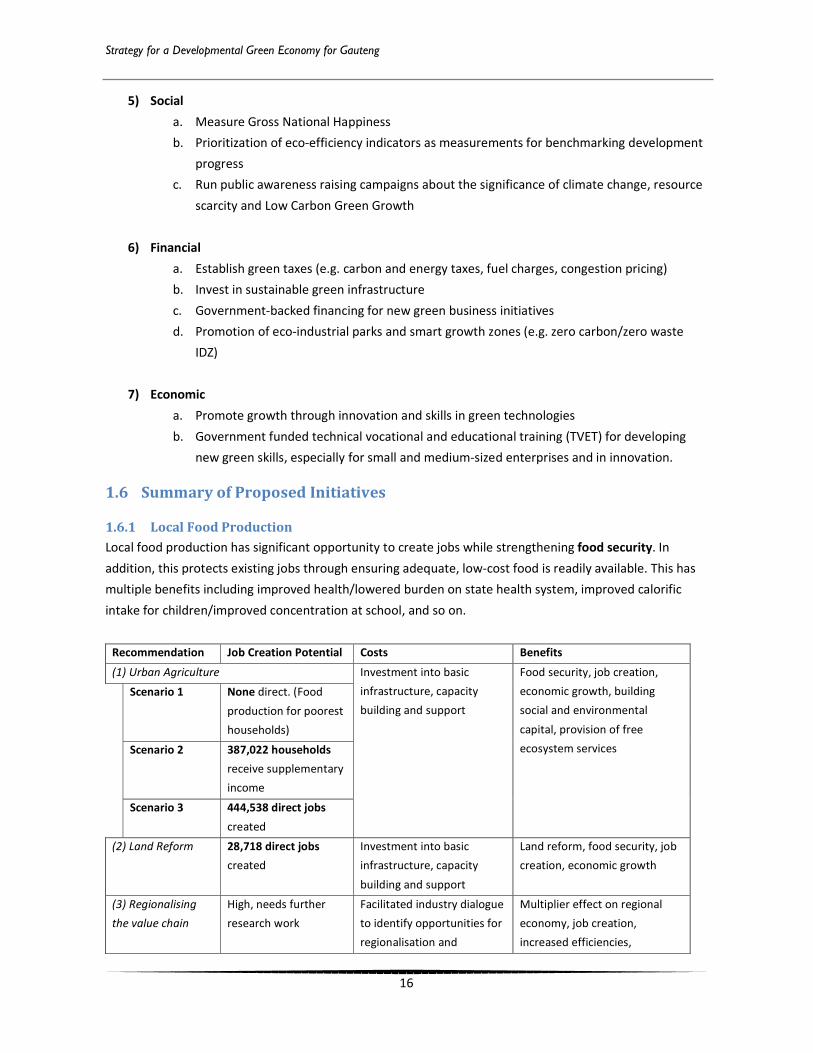
1.6.1 Local Food Production
Local food production has significant opportunity to create jobs while strengthening food security. In
addition, this protects existing jobs through ensuring adequate, low-cost food is readily available. This has
multiple benefits including improved health/lowered burden on state health system, improved calorific
intake for children/improved concentration at school, and so on.
Recommendation Job Creation Potential Costs Benefits
(1) Urban Agriculture Investment into basic
infrastructure, capacity
building and support
Food security, job creation,
economic growth, building
social and environmental
capital, provision of free
ecosystem services
Scenario 1 None direct. (Food
production for poorest
households)
Scenario 2 387,022 households
receive supplementary
income
Scenario 3 444,538 direct jobs
created
(2) Land Reform 28,718 direct jobs
created
Investment into basic
infrastructure, capacity
building and support
Land reform, food security, job
creation, economic growth
(3) Regionalising
the value chain
High, needs further
research work
Facilitated industry dialogue
to identify opportunities for
regionalisation and
Multiplier effect on regional
economy, job creation,
increased efficiencies,

Strategy for a Developmental Green Economy for Gauteng
17
increasing efficiencies economic growth, promoting
sustainable best practice
The following key steps would be needed:
• Ensuring access to social grants for all eligible households;
• Implementing measures to improve dietary diversity, food safety and food quality;
• Implementing a provincial urban agriculture policy, and incorporating food security into integrated
development plans;
• Strengthening and supporting the role of the private sector in food security initiatives;
• Focussing on opportunities for small food producers, manufacturers, distributors and retailers to
access markets;
• A provincial commitment to a regional procurement programme.
To achieve this level of food production and security, the DED will need to lobby others to work with them,
especially the Departments of Agriculture, Social Development, and Land. Much of this could be
implemented as a public works programme, with for example the Community Employment Programme
providing training, support, aftercare and so on.
1.6.2 Solar Water Heaters
Based on the proposed Gauteng 2025 target of 95% penetration into mid- to high-income houses and 50%
into low-income houses, more than 6,700 jobs can be created.
Total number of high-income sector systems to be installed 1.3 million
Total cost to consumers to install all high-income sector systems (discounted
(10%) to 2009 Rand for later installations)[1] R 6.7 billion
Total electricity saved per year when all high-income sector systems installed 2,413 GWh
Estimate of annual electricity bill savings per high-income household per year10 R 1,143
Carbon emissions averted per year when all high-income sector systems
installed (metric ton) 2,109,635 tons
Total number of low income sector systems to be installed 666 thousand
Total cost to install low-income sector systems R 1.2 billion
Total electricity saved per year when all low-income sector systems installed 543 GWh
Estimate of annual electricity bill savings per household per year11
R 651
Carbon emissions averted per year when all low-income sector systems
installed (metric ton) 712,215 tons
Carbon Credit revenue per year when all low income sector systems installed
(discounted (10%) to 2009 Rand) (mil Rand) R 11.7 million
10
2009 CoJ tariffs 11
ibid
Strategy for a Developmental Green Economy for Gauteng
18
Total jobs created to achieve all high and low income installation targets with
maximum local content 6,707
What the market requires to grow is regulatory certainty. We would recommend the following policy
interventions to enable the market in Gauteng:
. New build: Mandatory installation at time of building.
. For High-income houses: Mandatory installation. This can be on sale of the house or within a
certain timeframe. Alternatively, a levy can be charged on houses that do not have SWH and used to
subsidise low-income SWH.
. Low-income houses: 50% subsidy, 50% recovered on loan basis
. Subsidy value (low-income): R 39 million per year for 15 years
. Possible Carbon revenue of up to R 12 million per year
So in the high-Income bracket, the consumer bears the cost (less the ESKOM subsidy). In the low-income
bracket, a 50% subsidy, 50% loan (recoverable) is offered – R39/year for 15 years – the loan can be
recovered via rates or as a small cost on electricity billing, and possible carbon credits of up to R12 million
PA will be available.
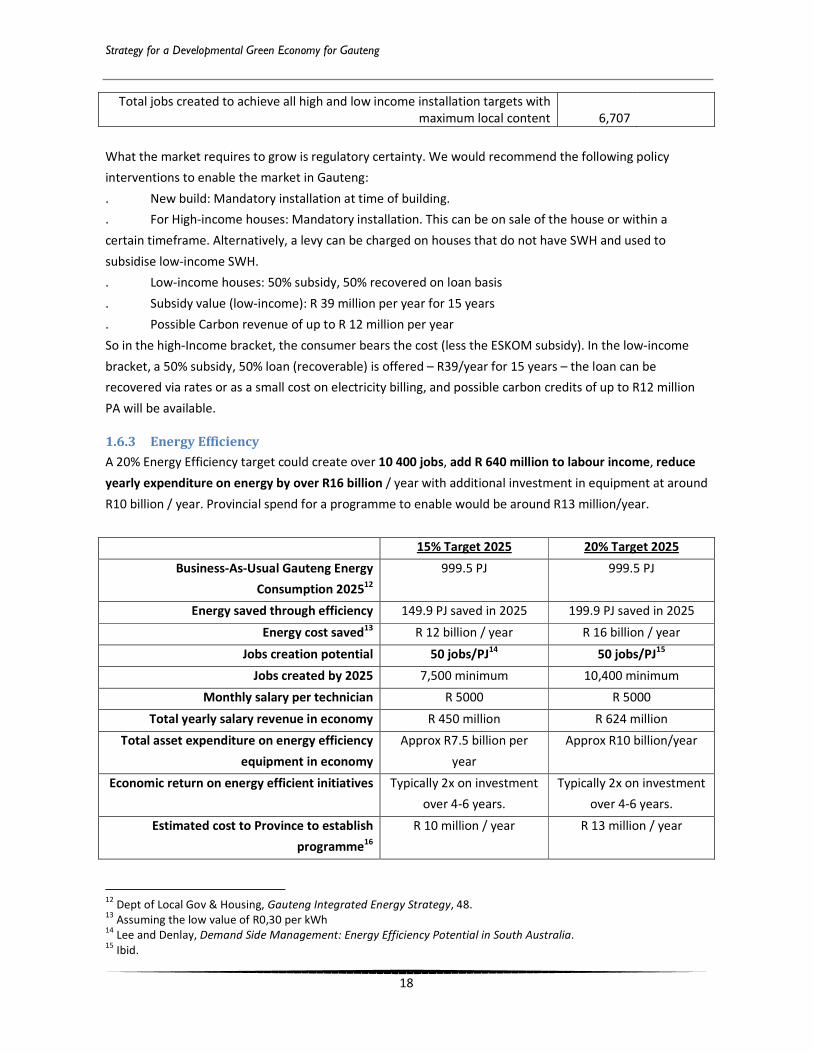
1.6.3 Energy Efficiency
A 20% Energy Efficiency target could create over 10 400 jobs, add R 640 million to labour income, reduce
yearly expenditure on energy by over R16 billion / year with additional investment in equipment at around
R10 billion / year. Provincial spend for a programme to enable would be around R13 million/year.
15% Target 2025 20% Target 2025
Business-As-Usual Gauteng Energy
Consumption 202512
999.5 PJ 999.5 PJ
Energy saved through efficiency 149.9 PJ saved in 2025 199.9 PJ saved in 2025
Energy cost saved13 R 12 billion / year R 16 billion / year
Jobs creation potential 50 jobs/PJ14
50 jobs/PJ15
Jobs created by 2025 7,500 minimum 10,400 minimum
Monthly salary per technician R 5000 R 5000
Total yearly salary revenue in economy R 450 million R 624 million
Total asset expenditure on energy efficiency
equipment in economy
Approx R7.5 billion per
year
Approx R10 billion/year
Economic return on energy efficient initiatives Typically 2x on investment
over 4-6 years.
Typically 2x on investment
over 4-6 years.
Estimated cost to Province to establish
programme16
R 10 million / year R 13 million / year
12
Dept of Local Gov & Housing, Gauteng Integrated Energy Strategy, 48. 13
Assuming the low value of R0,30 per kWh 14
Lee and Denlay, Demand Side Management: Energy Efficiency Potential in South Australia. 15
Ibid.
Strategy for a Developmental Green Economy for Gauteng
19
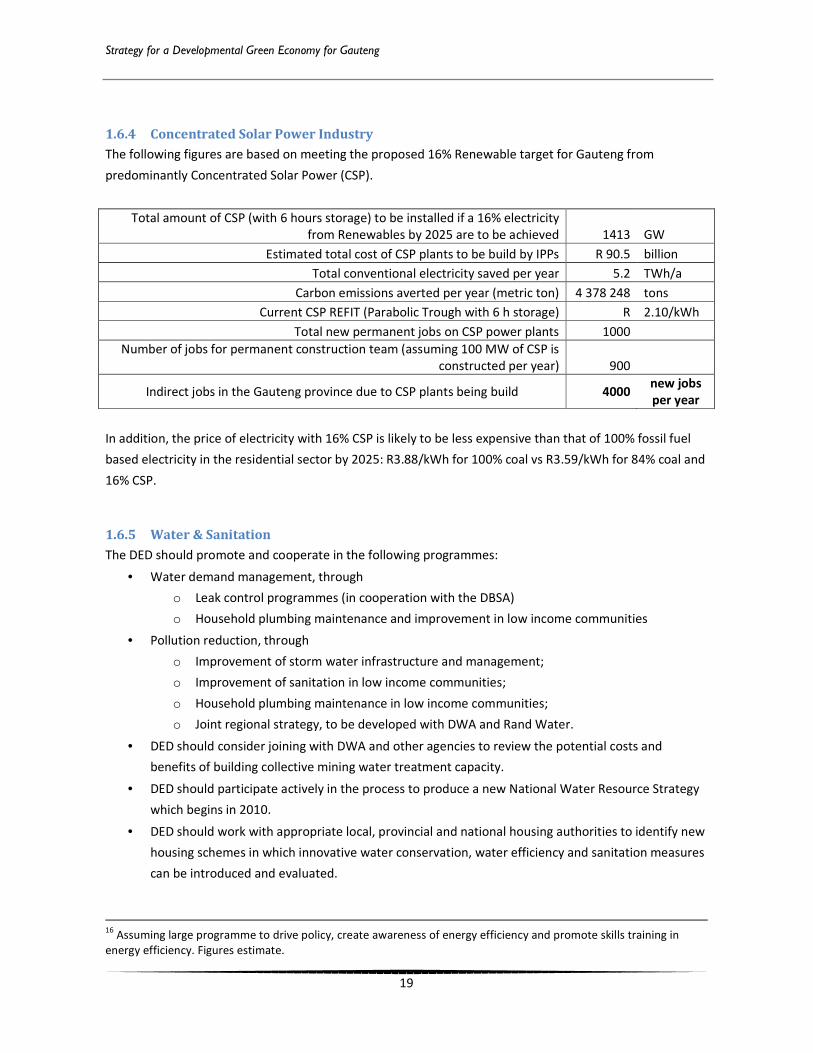
1.6.4 Concentrated Solar Power Industry
The following figures are based on meeting the proposed 16% Renewable target for Gauteng from
predominantly Concentrated Solar Power (CSP).
Total amount of CSP (with 6 hours storage) to be installed if a 16% electricity
from Renewables by 2025 are to be achieved 1413 GW
Estimated total cost of CSP plants to be build by IPPs R 90.5 billion
Total conventional electricity saved per year 5.2 TWh/a
Carbon emissions averted per year (metric ton) 4 378 248 tons
Current CSP REFIT (Parabolic Trough with 6 h storage) R 2.10/kWh
Total new permanent jobs on CSP power plants 1000
Number of jobs for permanent construction team (assuming 100 MW of CSP is
constructed per year) 900
Indirect jobs in the Gauteng province due to CSP plants being build 4000 new jobs
per year
In addition, the price of electricity with 16% CSP is likely to be less expensive than that of 100% fossil fuel
based electricity in the residential sector by 2025: R3.88/kWh for 100% coal vs R3.59/kWh for 84% coal and
16% CSP.
1.6.5 Water & Sanitation
The DED should promote and cooperate in the following programmes:
• Water demand management, through
o Leak control programmes (in cooperation with the DBSA)
o Household plumbing maintenance and improvement in low income communities
• Pollution reduction, through
o Improvement of storm water infrastructure and management;
o Improvement of sanitation in low income communities;
o Household plumbing maintenance in low income communities;
o Joint regional strategy, to be developed with DWA and Rand Water.
• DED should consider joining with DWA and other agencies to review the potential costs and
benefits of building collective mining water treatment capacity.
• DED should participate actively in the process to produce a new National Water Resource Strategy
which begins in 2010.
• DED should work with appropriate local, provincial and national housing authorities to identify new
housing schemes in which innovative water conservation, water efficiency and sanitation measures
can be introduced and evaluated.
16
Assuming large programme to drive policy, create awareness of energy efficiency and promote skills training in
energy efficiency. Figures estimate.

Strategy for a Developmental Green Economy for Gauteng
20
1.6.6 Waste Management
Waste to landfills can be reduced by up to 60% (3,885,702 tons / year) and over 19,400 jobs can be
created.
Estimated job creation potential in each waste sector is shown by the following table:
Key drivers:
• Mandatory Recycling Efforts;
• Development of Composting Initiatives to create compost from organic waste;
• Waste Minimization Clubs to help waste producers reduce or share reusable waste;
• Waste to Energy programme to convert gas from landfills or organic waste into electricity;
• Green Procurement with low waste results;
• Multi-faceted Landfill Sites with low-carbon delivery infrastructure,
Strategy for a Developmental Green Economy for Gauteng
21
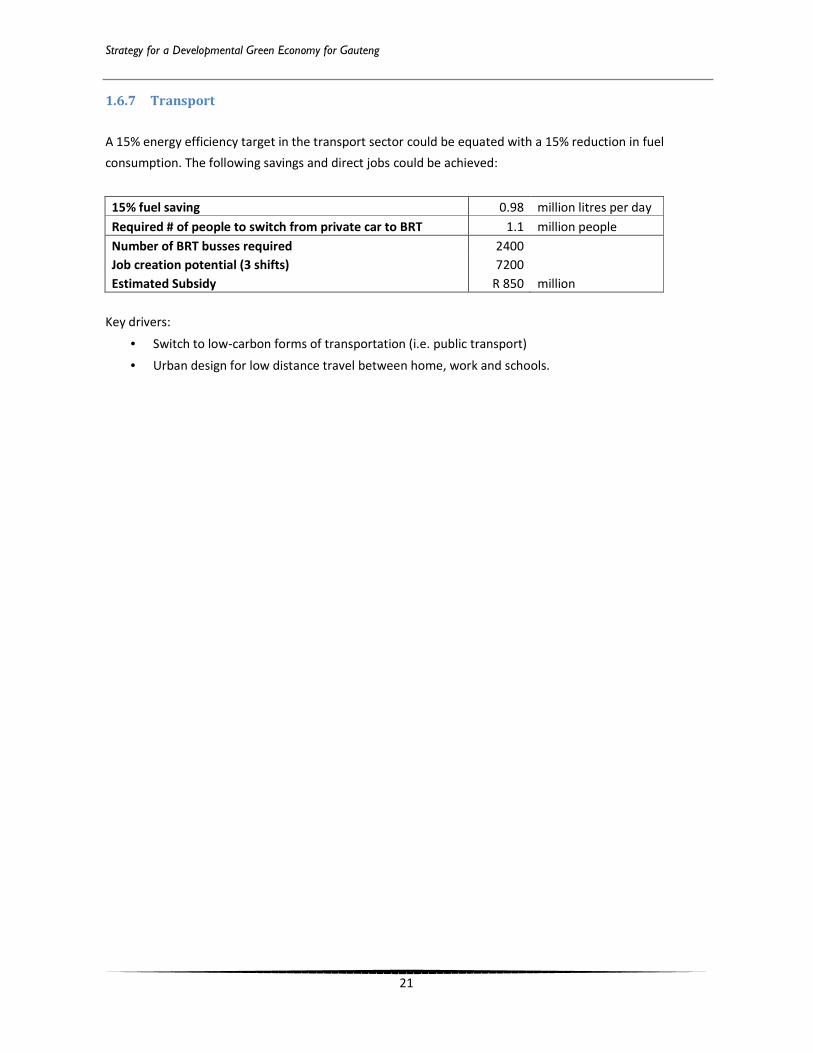
1.6.7 Transport
A 15% energy efficiency target in the transport sector could be equated with a 15% reduction in fuel
consumption. The following savings and direct jobs could be achieved:
15% fuel saving 0.98 million litres per day
Required # of people to switch from private car to BRT 1.1 million people
Number of BRT busses required 2400
Job creation potential (3 shifts) 7200
Estimated Subsidy R 850 million
Key drivers:
• Switch to low-carbon forms of transportation (i.e. public transport)
• Urban design for low distance travel between home, work and schools.
Strategy for a Developmental Green Economy for Gauteng
22
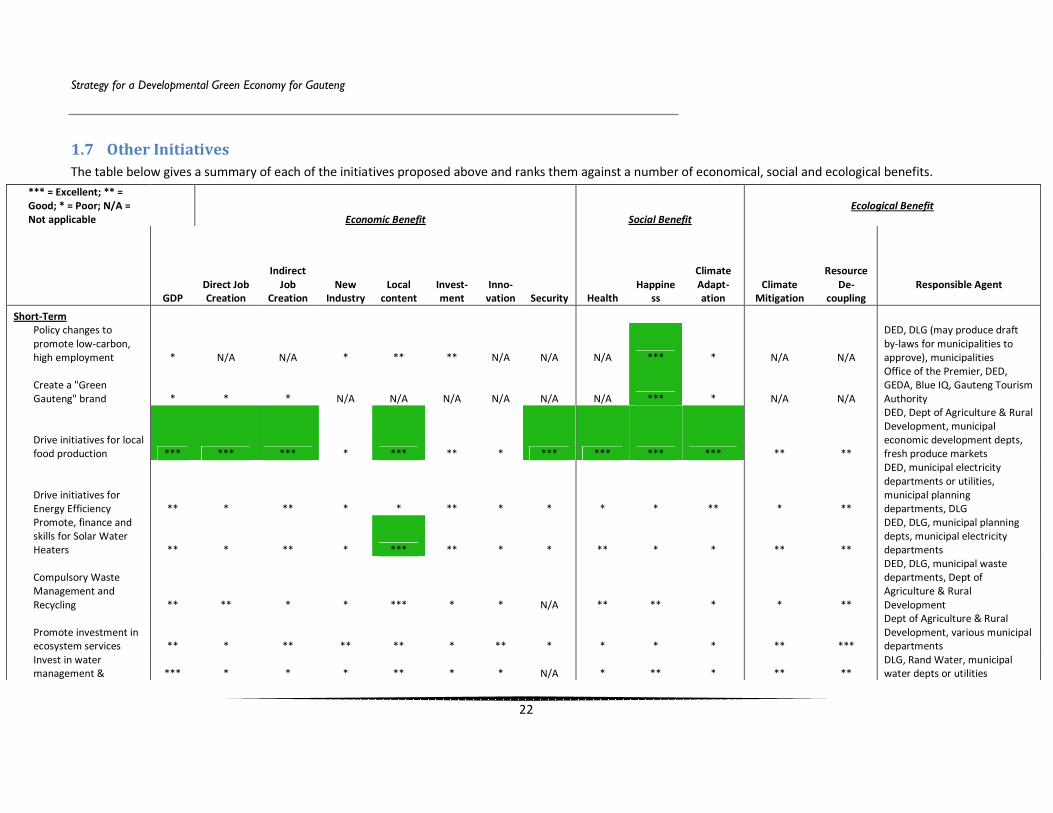
1.7 Other Initiatives
The table below gives a summary of each of the initiatives proposed above and ranks them against a number of economical, social and ecological benefits.
*** = Excellent; ** =
Good; * = Poor; N/A =
Not applicable Economic Benefit Social Benefit
Ecological Benefit
GDP
Direct Job
Creation
Indirect
Job
Creation
New
Industry
Local
content
Invest-
ment
Inno-
vation Security Health
Happine
ss
Climate
Adapt-
ation
Climate
Mitigation
Resource
De-
coupling
Responsible Agent
Short-Term
Policy changes to
promote low-carbon,
high employment * N/A N/A * ** ** N/A N/A N/A *** * N/A N/A
DED, DLG (may produce draft
by-laws for municipalities to
approve), municipalities
Create a "Green
Gauteng" brand * * * N/A N/A N/A N/A N/A N/A *** * N/A N/A
Office of the Premier, DED,
GEDA, Blue IQ, Gauteng Tourism
Authority
Drive initiatives for local
food production *** *** *** * *** ** * *** *** *** *** ** **
DED, Dept of Agriculture & Rural
Development, municipal
economic development depts,
fresh produce markets
Drive initiatives for
Energy Efficiency ** * ** * * ** * * * * ** * **
DED, municipal electricity
departments or utilities,
municipal planning
departments, DLG
Promote, finance and
skills for Solar Water
Heaters ** * ** * *** ** * * ** * * ** **
DED, DLG, municipal planning
depts, municipal electricity
departments
Compulsory Waste
Management and
Recycling ** ** * * *** * * N/A ** ** * * **
DED, DLG, municipal waste
departments, Dept of
Agriculture & Rural
Development
Promote investment in
ecosystem services ** * ** ** ** * ** * * * * ** ***
Dept of Agriculture & Rural
Development, various municipal
departments
Invest in water
management & *** * * * ** * * N/A * ** * ** **
DLG, Rand Water, municipal
water depts or utilities

Strategy for a Developmental Green Economy for Gauteng
23
recovery
Forestry & Agriculture * * ** * ** * * N/A * * * * * GDACE
Switch from electricity
to LPG for
cooking/heating * * N/A N/A * * * * * ** * * *
DLG, municipal planning
departments, iGoli Gas
Smart Metering * * N/A *** ** * *** * N/A N/A N/A * N/A
DED, municipal electricity /
water depts or utilities, Eskom,
Rand Water
New Battery and
Storage technologies ** * * *** * ** *** * N/A N/A N/A * N/A DED
Indoor building air
quality * * * * * * N/A N/A ** N/A N/A N/A
Dept of Agriculture & Rural
Development, municipal
planning depts
Public open space /
"greening" * * ** *** * * N/A ** *** ** * N/A
Municipal planning depts,
municipal parks / environment
depts
Renewable Energy
projects * ** *** ** * *** *** ** * ** * *** **
DED, municipal electricity depts
or utilities, Eskom
Medium-term
Concentrated solar
plant industry ** * ** *** *** *** *** *** * * * *** ** DED, GEDA, Blue IQ
Green Integrated
Development Zone ** * ** ** *** ** ** N/A * * ** * ***
DED, municipal economic
development departments
Transportation ** ** ** * * * ** N/A * ** ** ** **
GPG Dept of Roads & Transport,
National Dept of Transport,
municipal depts of transport &
bus services
Sewerage reduction
and sewerage-to-
energy * * N/A N/A ** * * ** * * * ** *
DED, municipal departments of
water
Large scale Urban
food production ** *** *** * *** ** * *** ** *** *** ** **
DED, Dept of Agriculture & Rural
Development, municipal
economic development depts,
fresh produce markets
Smart Grids
Infrastructure * * * ** * * ** ** * * * N/A
DED, municipal electricity depts
or utilities, Eskom
Compulsory Green
Building standards * ** * *** * * * ** ** * * N/A
DED, DLG, municipal planning
depts

Strategy for a Developmental Green Economy for Gauteng
24
Mining
Sustainability
Programme ** ** * ** * ** * * ** ** * ** *
DED, national Dept of Mineral
Resources, municipal planning
depts, private sector
Long-term
Cities as net
ecological service
providers ** ** *** *** *** ** *** *** ** *** *** * ***
Dept of Agriculture & Rural
Development, DLG,
municipalities
Major Renewable
Energy
Manufacturing
Infrastructure *** * * *** *** ** *** *** * ** * *** **
DED, municipal departments of
economic development, GEDA,
Blue IQ, national DTI, national
EDD
Figure 1: Table of Possible Initiatives and Ratings

Strategy for a Developmental Green Economy for Gauteng
25
1.8 Conclusions
“There can be little doubt that the economy of the 21st century will be low-carbon. What has
become clear is that the push toward decarbonisation will be one of the major drivers of global
and national economic growth over the next decade. And the economies that embrace the
green revolution earliest will reap the greatest economic rewards.”
Gordon Brown, Newsweek, 28 September 2009
There are significant new challenges arising from ecological constraints to the business-as-usual approach
to growing economies. To realign economies to focus not only on GDP, but also on long-term
sustainability, job creation and “happiness” will require a shift from capital-focussed investment to
strategic investments in knowledge capital and innovation systems. New skills will need to be developed in
the areas of solar water heaters, local food production, urban agriculture, energy audits, and new
investments will need to take place into infrastructure and planning around water, transportation, building
systems and renewable energy production, especially solar.
Additional research is needed to flesh out what a broad green economy could look like for Gauteng. This
would require a number of additional processes, including:
• Interaction with a visits to regions and cities that are currently implementing green economy
strategies, especially South Korea;
• Further research work into the items proposed, particularly around the inter-linkages of challenges
(such as food and water);
• Inter-departmental and cross-cutting initiatives in green strategy;
• Promoting a change in thinking that puts the poor and most vulnerable first while addressing the
ecological challenges the face us. This will need to be communicated across all departments, all
levels of government, and to business and trade-unions;
• DED will need to consider marshalling intellectual and communication resources to take this
process further. Once policy choices have been made, specific interventions need to be properly
researched and designed; and the MEC will need support in winning hearts and minds – and
winning battles over economics and numbers. This can be done through the creation of a green
unit in DED, or by continuing the relationship with GCRO.
These challenges that face us are immense but not unconquerable. It will take much hard work and co-
operation across the spheres of governments to solve them. The alternative in the long run is that the poor
with suffer and growth will falter, whereas if action is taken now, the economy will grow, but using less
resources and with less environmental impact.
2 Introduction to the Green Economy
Global economic thinking is current experiencing a paradigm shift from the current capital-focussed
resource-intensive development towards what is being called the “Green Economy”. A Green Economy is
one in which business processes are infrastructure reconfigured “to deliver better returns on natural,
Strategy for a Developmental Green Economy for Gauteng
26
human and economic capital investments, while at the same time reducing greenhouse gas emissions,
extracting and using fewer natural resources, creating less waste and reducing social disparities.”17
Thus a
Green Economy “grows by reducing rather than increasing resource consumption”18,19. These economies
have also been termed low-carbon economies.
“The dominant economic growth and development paradigm fails to address a wide range of underlying
resource constraints that can rapidly undermine the preconditions for the kind of developmental growth
that is required to reduce inequalities and poverty over time.”20
This shift has been intensified due to the recent economic crisis, inspiring organisations such as the United
Nations Environmental Program to promote such concepts as the Global Green New Deal21
where the focus
of the economy is directed towards programmes to create green jobs. Green jobs are defined as “work in
agricultural, manufacturing, research and development (R&D), administrative, and service activities that
contribute substantially to preserving or restoring environmental quality.”22
Within this movement, cities and city regions are playing a major role. Cities now house more than 50% of
the world’s population, and consume a significant portion of the world’s resources, especially in the
construction industry which has become a key driver of growth. The construction industry worldwide is
responsible for 10% of global GDP, employs over 100 million people globally, uses up around 50% of global
resources, uses 45% of global energy (5% during construction), 40% of water globally and 70% of all
timber products.
In addition, city regions and countries are starting to come up against ecological resource constraints that
prevent business as usual. For example, water supplies in the Gauteng region are increasingly becoming
constrained, as is the ability to absorb waste and supply food. In the medium to long term, climate change
is likely to have a devastating effect on food and job security unless the issue is addressed in the short
term.
London City has a plan to get 100000 electric cars on the roads, with 25000 electric charging stations and at
least 1000 of the cities fleet to be electric, by 201523
.
17
UNEP, Global Green New Deal: An Update for the G20 Pittsburgh Summit, ii. 18
Swilling, Growth, Resource Use and Decoupling: Towards a ‘Green New Deal’ for South Africa, 5. 19
This process is also known as “dematerialisation”. 20
Ibid., 1. 21
See www.unep.org/greeneconomy 22
UNEP, Green Jobs: Towards decent work in a sustainable, low-carbon world, 3. 23
London City, “Electric vehicles.”

Strategy for a Developmental Green Economy for Gauteng
27
Western Harbour, Malmö, Sweden runs on 100% renewable energy from the sun, wind, hydropower and
biofuels. 40% of all commuters travel by bike. Augustenborg, Malmö has a large green roofing program and
recycles 70% of its waste.
Copenhagen, Denmark won the European Environmental Award in 2006 for its work in clean waterways
and environmental planning.
The change in thinking that is required to achieve these goals includes:
• Environmental protection must no longer be viewed as a constraint to economic growth, but as a
driver of growth and essential for long-term economic sustainability24. The alternative is that
growth falters as South Africa bangs up against ecological limits and becomes penalised by the
international community for its carbon emissions and related energy intensity (see Appendix B:
Additional Comments on the Economic Crisis and Ecological Limits for more on this topic).
• Production and consumption must no longer be viewed as “linear” processes, but must be thought
of and consciously designed using holistic life cycle/circular concepts25
.
• A shift from capital-focussed investment to strategic investments in knowledge capital and the
systems that create innovation.
Figure 2: The virtuous cycle vs. the vicious cycle
26
This change in thinking has been termed eco-efficiency.
“Eco-efficiency is achieved by the delivery of competitively priced goods and services that
satisfy human needs and bring quality of life, while progressively reducing ecological
24
UNESCAP, Green Growth at a Glance, 13. 25
Ibid. 26
Green Growth, “Green Growth.”
Strategy for a Developmental Green Economy for Gauteng
28
impacts and resource intensity throughout the life cycle, to a level at least in line with the
Earth’s estimated carrying capacity.”
Source: World Business Council on Sustainable Development, 2000, p. 4
One of the key measures being used around climate change is that of greenhouse gas emissions, measured
in tons of carbon-dioxide equivalent (CO2e). South Africa is a large emitter, of which a significant portion is
situated in the economic capital of the Gauteng region.
In the South African context, this issue has been clearly raised and documented in the Long Term Mitigation
Strategy (LTMS) for Climate Change.
“Growing without carbon constraints may be good for South Africa’s economic growth, but
it will result in rapidly increasing emissions. A four-fold increase in emissions by 2050 is likely
to be unacceptable to the international community. It is also a high-risk approach on other
grounds, such as rising oil prices, carbon constraints in trade, and advancing impacts. If all
countries, including high emitters in the developing world, adopted a Growth without
Constraints approach, climate change impacts in South Africa would be extensive. A massive
effort would be needed by South Africa to achieve emissions reduction sufficient to meet the
“Required by Science” target. The gap between where South Africa’s emissions are going and
where they need to go is large (1300 Mt CO2-eq, more than three times South Africa’s annual
emissions of 446 Mt in 2003)” (LTMS 2008 pg 27, emphasis added).
At an international level this lead to South Africa joining with the other G20 nations to make a number of
recent commitments in this space:
o “We will make the transition towards clean, innovative, resource efficient, low carbon
technologies and infrastructure.”27
o “As leaders of the world’s major economies, we are working for a resilient, sustainable and
green economy.”28
Green economies not only create direct and indirect employment opportunities, they also protect
existing jobs by addressing the increasing costs and challenges that undermine traditional economic
growth, such as increasing food and energy prices.
It will be up to Gauteng as the economic heart of South Africa to drive these goals and create sustainable
jobs through a sustainable use of resources and a reduction in carbon intensity.
To achieve these goals, the economic focus needs to be on creating institutions that are able to foster the
evolution of new technologies and processes. These institutions are the key to unlocking green potential,
by creating skills and programmes that drive a low-carbon agenda.
27
G20, London, 2 April 2009 28
G20, Pittsburgh, 24-25 Sept 2009
Strategy for a Developmental Green Economy for Gauteng
29
3 Green Economy Benefits
“The market for clean technologies is booming, and was in 2007 larger than the pharmaceutical industry. It
will be the 3rd industrial sector in the world in 2020 (EUR 1600 billion)”29
There are a number of key sectors within the green economy, but there are perhaps two broad themes that
draw the spaces together.
The first is those initiatives that act to protect the basic requirements of human beings. These focus on
protecting that which sustains us (our planet and its resources) while providing our basic needs (food &
water). As will be shown, there are significant job creation opportunities in this space.
The second is in the area of technology. This area can be classified into the following two spaces:
• Reduced energy consumption/carbon emissions/resource consumption for the same service
delivered (e.g. efficient motors, green buildings, etc).
• Low carbon energy generation technologies (e.g. solar water heaters and other renewable energy
technologies).
“The exit from the crisis should be the point of entry into a new sustainable social market economy, a
smarter, greener economy, where our prosperity will come from innovation and from using resources
better, and where the key input will be knowledge. These new drivers should help us tap into new sources
of sustainable growth and create new jobs to offset the higher level of unemployment our societies are
likely to face in the coming years. However, we will only succeed if we design and implement a bold policy
response. Otherwise the risk is a period of low growth which can only make it harder ... to tackle the major
challenges we face today.”30
“Sustainable resource management offers new opportunities for investments in innovations that could
stimulate endogenous growth strategies in developing economies that could be more effective in
eradicating poverty than traditional strategies that depend on primary exports or exports of cheap
manufactured goods underpinned in both cases by resource depletion and/or environmental
degradation.”31
29
WWF-Netherlands, Clean Economy, Living Planet - Building strong clean energy technology industries, 2. 30
COMMISSION OF THE EUROPEAN COMMUNITIES, “COMMISSION WORKING DOCUMENT: CONSULTATION ON THE
FUTURE "EU 2020" STRATEGY,” 2. 31
Swilling, Growth, Resource Use and Decoupling: Towards a ‘Green New Deal’ for South Africa, 6.
Strategy for a Developmental Green Economy for Gauteng
30
Recent work by McKinsey (on a global scale) and the Energy Research Centre (ERC) at UCT (for South Africa)
indicate that there are number of initiatives that address the ecological issues (especially carbon
emissions) and in the process create jobs and increase GDP, and others that also reduce carbon emissions
and create jobs, but may have a negative impact GDP in the short term.32
It should be noted that the costs
due to over-use of environmental services WILL be absorbed in the economy at some point, whether or
now in the future. What is important to note that it is significantly cheaper to absorb the costs now than to
wait until there are major failures in the economy (as was experienced in the financial sector last year). This
argument (that it is cheaper to act now than to act later) has been well made by Sir Nicholas Stern in the UK
funded Stern Review.
The green economic initiatives available are summarised in the two graphs that follow. The McKinsey graph
expresses the economic benefit in terms of the price of carbon, while the ERC graph expresses it in terms of
GDP.
The McKinsey graph below (Figure 3) shows the amount of carbon emissions that can be saved (abatement
potential) along the x-axis, and the cost implications of doing these things in terms of a cost of tCO2. There
are two key areas, one circled in green and one circled in red. The area in green shows those items that
would still be worth doing, even if you were paid to emit carbon dioxide, hence the NEGTIVE cost for
carbon on the y-axis for these items. Then the area in red shows those items that would require some cost
for carbon (i.e. a carbon tax) before these items would be cost effective. One can note that the area under
the bars in the green section is not significantly less than the area under the bars in the red section. The
implication is that almost all of these initiatives can be undertaken without a carbon tax required, and the
result would be a massive reduction in carbon emissions (and also a huge increase in jobs due to all the
new economic activities).
The LTMS graph below (Figure 4) similarly shows which initiatives would lead to an increase in GDP and
reduce carbon, and which initiatives would decrease GDP and reduce carbon. The x-axis shows the
reduction in carbon emissions, while the y-axis shows the COST as a percentage of GDP. Thus a NEGATIVE
value on the y-axis represents an INCREASE in GDP, while a POSTIVE value on the y-axis represents a
DECREASE in GDP.
Again, it must be noted that economic activity (and thus GDP) WILL be impacted by climate change as some
stage, and all of these initiatives will be cost the economy less now than later. The secondary benefits of
these initiatives (increased employment, food, energy security, “happiness” etc) also need to be
considered.
32
The work done by the ERC lays the foundation for the LTMS.

Strategy for a Developmental Green Economy for Gauteng
31
Figure 3: McKinsey Global GHG abatement
33
33
McKinsey & Co, Pathways to a low-carbon economy, 7.

Strategy for a Developmental Green Economy for Gauteng
32
Figure 4:Long Term Mitigation costs as a percentage of GDP.
In April 2006 the National Treasury published for comment a remarkable document entitled A Framework
for Considering Market-Based Instruments to Support Environmental Fiscal Reform in South Africa. The
document defines an environmental tax as a “tax on an environmentally-harmful tax base” (Republic of
South Africa. National Treasury 2006ii (emphasis in original)) and examines all existing environmental taxes,
charges and levies, which combined account for approximately 2% of GDP and just under 10% of total tax
revenue. The report suggests that in light of the sustainable development challenge, tax shifting is required
so that taxes levied on “bads” (such as pollution) can be increased and taxes on “goods” (such as labour)
reduced. This, the report argues, is the “double-dividend hypothesis” – “minimising the burden of
Strategy for a Developmental Green Economy for Gauteng
33
environmentally-related taxes on the affected sectors, whilst creating the required behavioural incentives
to achieve certain environmental outcomes” (Republic of South Africa. National Treasury 2006). Put
differently, taxes from unsustainable practices should increase, and be re-invested in more sustainable
practices.
The LTMS graph above shows that the following green interventions increase GDP by about 2% (and
increase jobs as well) while reducing carbon emissions by over 6000 MtCO2e by 2050:
• Change Vehicles
o Limit low efficiency vehicles
o Improve vehicle efficiency
• Passenger modal shift from cars to mass transportation
• Energy Efficiency
o Industrial
o Commercial
o Residential
• Solar Water Heaters
In addition, the LTMS argues that the following green interventions, when added to the above
interventions, lead to a net zero impact on GDP, but significantly increase jobs & reduce carbon emissions
to a cumulative 18000 MtCO2e by 2050:
• CO2 Tax
• Renewable Energy Electricity Generation
• Subsidy for Renewables
• Biofuels (very small benefit)
• Clean Coal Technology (very small benefit)
• Nuclear (very small benefit)
Other research conducted in 2003 showed that34:
• The large-scale deployment of renewable energy technologies will sustain and substantially boost
the number of jobs in the energy sector, particularly because of the development of local
manufacturing industries.
• Job creation in renewable energy is only possible when progressive national deployment targets
are set, due to the attendant manufacturing, installation and O&M capacity that are initiated.
• Massive employment gains can be achieved quickly and easily in the SWH and biofuels sectors,
while showing good returns on a limited investment by government.
• Renewable Energy Technologies provide significantly more jobs than new coal based generation,
but require greater investment both in money and skills training.
34
AGAMA Energy, Employment Potential of Renewable Energy In South Africa, 17.
Strategy for a Developmental Green Economy for Gauteng
34
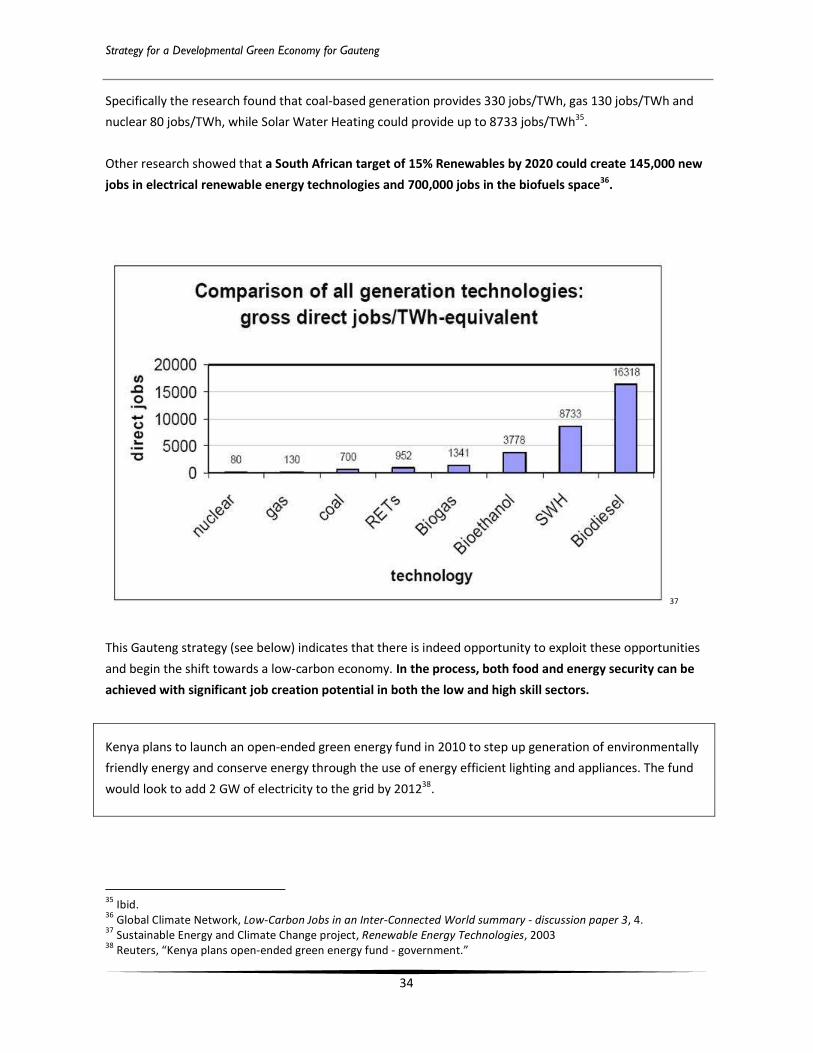
Specifically the research found that coal-based generation provides 330 jobs/TWh, gas 130 jobs/TWh and
nuclear 80 jobs/TWh, while Solar Water Heating could provide up to 8733 jobs/TWh35.
Other research showed that a South African target of 15% Renewables by 2020 could create 145,000 new
jobs in electrical renewable energy technologies and 700,000 jobs in the biofuels space36.
37
This Gauteng strategy (see below) indicates that there is indeed opportunity to exploit these opportunities
and begin the shift towards a low-carbon economy. In the process, both food and energy security can be
achieved with significant job creation potential in both the low and high skill sectors.
Kenya plans to launch an open-ended green energy fund in 2010 to step up generation of environmentally
friendly energy and conserve energy through the use of energy efficient lighting and appliances. The fund
would look to add 2 GW of electricity to the grid by 201238
.
35
Ibid. 36
Global Climate Network, Low-Carbon Jobs in an Inter-Connected World summary - discussion paper 3, 4. 37
Sustainable Energy and Climate Change project, Renewable Energy Technologies, 2003 38
Reuters, “Kenya plans open-ended green energy fund - government.”
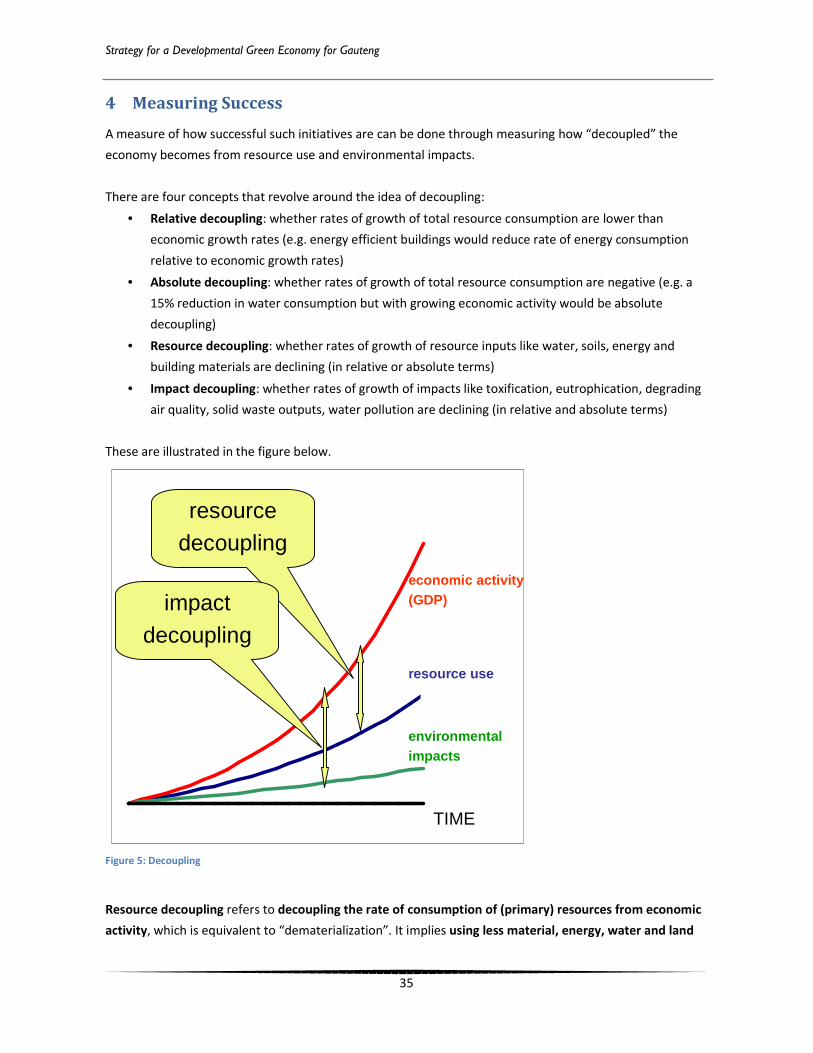
Strategy for a Developmental Green Economy for Gauteng
35
4 Measuring Success
A measure of how successful such initiatives are can be done through measuring how “decoupled” the
economy becomes from resource use and environmental impacts.
There are four concepts that revolve around the idea of decoupling:
• Relative decoupling: whether rates of growth of total resource consumption are lower than
economic growth rates (e.g. energy efficient buildings would reduce rate of energy consumption
relative to economic growth rates)
• Absolute decoupling: whether rates of growth of total resource consumption are negative (e.g. a
15% reduction in water consumption but with growing economic activity would be absolute
decoupling)
• Resource decoupling: whether rates of growth of resource inputs like water, soils, energy and
building materials are declining (in relative or absolute terms)
• Impact decoupling: whether rates of growth of impacts like toxification, eutrophication, degrading
air quality, solid waste outputs, water pollution are declining (in relative and absolute terms)
These are illustrated in the figure below.
Figure 5: Decoupling
Resource decoupling refers to decoupling the rate of consumption of (primary) resources from economic
activity, which is equivalent to “dematerialization”. It implies using less material, energy, water and land
Reihe1
economic activity (GDP)
resource use
environmental impacts
resource decoupling
impact decoupling
TIME
Strategy for a Developmental Green Economy for Gauteng
36
resources for the same economic output. If there is resource decoupling, there is an increase in resource
productivity or, in other words, an increase in the efficiency with which resources are used. Resource
productivity can usually be measured unequivocally: it can be expressed for a national economy or for an
economic sector or even for a certain economic process or production chain by dividing added value by
resource input (e.g. GDP/Domestic Material Consumption). If this quotient increases with time, resource
productivity is rising. Another way to demonstrate resource decoupling is comparing the gradient of
economic output across time with the gradient of resource input: if the latter is smaller, there is resource
decoupling.
Impact decoupling, by contrast, refers to the relation between economic output and (various)
environmental impacts. There are environmental impacts associated with the extraction of resources
required (such as groundwater pollution due to mining or agriculture), environmental impacts from
production (such as land degradation, wastes and emissions), environmental impacts associated with the
use phase of commodities (for example mobility resulting in CO2 emissions), and there are end-of-pipe
environmental impacts (again wastes and emissions). Methodologically, these impacts can be estimated by
life cycle analysis (LCA) in combination with various input-output techniques. If environmental impacts
become dissociated from added value in economic terms, there is impact decoupling. On aggregate
system levels such as a national economy or an economic sector, it is methodologically very demanding to
measure impact decoupling, because there is a whole number of environmental impacts to be considered,
their trends may be quite different, and system boundaries as well as weighting procedures are
contested.39
Countries such as Germany, China and Japan use such methods to evaluate their sustainability. China in
particular is driving this agenda very hard with regulations, incentives for innovation and investments.
Gauteng could consider using a similar methodology to measure the “greenness” of its economy and
become the leader in these systems in Africa.
5 Gauteng Macro-Economic Challenges
Some of the key Macro-Economic weaknesses from a “Green” perspective are discussed below. Further
information can be found in Appendix B: Additional Comments on the Economic Crisis and Ecological Limits.
5.1 Food
Supply of sufficient reasonably priced food is a fundamental underlying requirement for economies to
grow. However, the price of food has already been under significant pressure, and this is likely to continue
faced with the challenges of:
• Rising oil prices, and thus fertilizer prices;
• Use of arable land for biofuels;
39
Swilling, M. And Fischer-Kowalski, M. 2010. Decoupling and Sustainable Resource Management: Towards a
Conceptual Framework. Paris: International Panel for Sustainable Resource management, United Nations Environment
Programme.
Strategy for a Developmental Green Economy for Gauteng
37
• Degradation of soils due to water erosion and other factors.
• Over-use of soils until they become unproductive.
5.2 Energy
Gauteng is heavily reliant of fossil fuels for energy, and is responsible for about one third of South Africa’s
energy consumption and carbon emissions. As such, it is a significant consumer of electricity,
predominantly from Eskom’s coal fired power stations in Mpumalanga. Nevertheless, many industries
generate their own energy using coal as a primary energy source. As low-grade coal is used in these
operations and in the power stations, Gauteng’s carbon emissions load is extremely high.
The combined issues of Peak Oil, supply & delivery issues with electricity on the Gauteng region40
, and high
carbon emissions seriously impact upon energy security and jobs in the region. The price of oil escalated to
almost US$ 150/barrel in 200841
and oil scarcity is likely to become a significant issue over the next
decade42
. The coal price has also risen significantly in the last few years. In addition, regions with high
carbon emissions & high energy intensity are becoming unattractive for economic investment. The current
international trend is to move to low carbon economies where energy consumption is decoupled from
growth.
5.3 Water & Sanitation
With an average annual rainfall of 497mm South Africa is a dry country. More problematic is that 98% of
available water resources have already been allocated. This means that that all future growth will be
constrained by the lack of this resource.
In addition, the country has no further “dilution capacity” when it comes to absorbing effluents in its water.
The Gauteng region is located on a watershed which means that outflows of waste water pollute the
water resources it depends on. After China, South Africa’s national water resources contain some of the
highest toxin levels in the world.
In short, the combination of low average rainfall, over-exploitation and re-engineered spatial flows have led
South Africa to an imminent water crisis in quantity as well as quality.
5.4 Waste
Solid Waste quantities are growing faster than the economy of many cities43. The typical daily average of 2
kg/person is 3-4 times that in many European cities. Both the quantity and nature of solid waste differs
considerably across the socio-economic spectrum. People in informal settlements generate on average
0,16kg per day, whereas over 2 kg per day is not unusual in affluent areas.
40
Such as overloaded transformers 41
UNEP (March, 2009): Global Green New Deal – A Policy Brief 42
Jackson, T. (2009) Prosperity without growth: The transition to a sustainable economy. Sustainable Development Commission,
UK pp.122 43
For example, in Cape Town MSW is growing by 7% per annum.

Strategy for a Developmental Green Economy for Gauteng
38
While many countries have moved away from ‘disposal-to-landfill’ as the primary means of solid waste
management, in South Africa the large bulk of solid waste is disposed of in landfill sites spread out across
the country. The cost of operating these sites is increasing rapidly.
5.5 Poverty & Inequality
According to figures published by the Presidency, South Africa is still faced with significant development
challenges largely as a consequence of the legacy left by apartheid44. These include:
• High levels of poverty, inequality and unemployment (23.5% in March, 2009)
• Around 24% of households still live in informal settlements or traditional structures
• 8% of people do not have access to potable water
• 23% do not have access to sanitation
• 27% do not have access to electricity (2008 figure)
• Increasing maternal deaths (probably as a consequence of the prevalence of HIV-AIDS – over 10%
of the population)
• Adult illiteracy of 25.9% (2007 figure).
44
2009 Development Indicators published by the Presidency

Strategy for a Developmental Green Economy for Gauteng
39
6 Policy Framework for Action
Below is a list of key drivers that promote the development of a Green Economy for Gauteng Province, as
well as a list of recommendations for places where policy could be used to re-orientate towards this type of
economy.
6.1 Drivers
Policy to enable a Green Economy should revolve around the following core drivers:
12) Creation of both new skills and jobs in new green driven industries;
13) Promote innovation in existing processes and new technologies;
14) Promote both local and foreign investment into Gauteng;
15) Decouple growth from resource consumption, especially dependency on fossil fuels;
16) Improve efficiency in energy and resource consumption;
17) Promote energy security and reduce dependency on crucial imports (e.g. oil);
18) Respect ecological limits;
19) Design for virtuous circles i.e. cradle-to-cradle economies, reduce-recycle-reuse;
20) Promote equity & fairness to both people and the environment;
21) Shift energy supply from Centralised Fossil Fuel systems to Decentralised Renewable Energy
Systems;
22) Create food security and alleviate poverty.
6.2 Recommendations
8) Energy
a. Enable local government and companies/individuals/schools/public entities to generate
their own energy and sell excess into the grid
i. Enable a framework for Power Purchase Agreements – those agreements that
allow private companies to sell energy to a buyer such as City Power or a private
entity.
ii. Combined heat and power
b. Remove subsidies, penalise inefficiency and incentivise low-carbon initiatives
c. Stringent energy efficiency standards for all sectors
d. Binding renewable energy targets with strong regulatory certainty
e. Fast tracked skills training in energy efficiency
f. Public education programs on energy efficiency and renewable energy
g. Demand-side management
h. Upgrading/enforcing of efficiency standards (e.g. building codes and energy efficiency of
appliances)
9) Climate Change
a. Emission reduction targets to keep global warming below 2 degrees C
b. Local emissions trading system – create an enabling environment to allow companies to
voluntary set carbon emission targets and then buy and sell their carbon emission
reductions.

Strategy for a Developmental Green Economy for Gauteng
40
c. Subsidizing research on climate change impacts in and across specific sectors and individual
regions
d. Funding of research on the effects of climate change and techniques for adaptation within
and across industries, sectors and regions
10) Resources
a. Promote large scale local food production
b. Ecological accounting system
i. Mandatory measurement of consumption of ecological services – water, travel,
electricity, CO2
ii. Carbon and energy registries/energy and water Auditing
iii. Mandating the use of sustainability impact assessments on the policy and project
level and adoption of integrated sustainability assessment for long-term, national
development strategy
c. Public sector green procurement
d. Promote zero waste systems and products (cradle-to-cradle)
e. Water management programme
f. Land use and urban policy changes
g. Promote local beneficiation of materials for local use – don’t export for beneficiation and
then import
h. Strict Mine Opening, Running & Closure Management
i. Extended producer responsibility
j. Promote waste management programmes, especially recycling
k. Waste exchange programmes
l. Sustainable building materials and systems
11) Transportation
a. Low carbon transportation systems
i. Mass transport
ii. Electric vehicles
b. Remove subsidies for fossil fuel and penalise inefficiency (high fuel consumption)
c. Long-term strategic shift away from private car use and support for mass transit, public
transport, rail, etc.
d. Work closely with Transnet to significantly improve Spoornet
12) Social
a. Measure Gross National Happiness
b. Prioritization of eco-efficiency indicators as measurements for benchmarking development
progress
c. Public awareness raising campaigns about the significance of climate change, resource
scarcity and Low Carbon Green Growth
d. Eco-labelling of products (i.e. carbon footprint)
13) Financial
a. Green taxation (e.g. carbon and energy taxes, fuel charges, congestion pricing)
Strategy for a Developmental Green Economy for Gauteng
41
b. Green subsidy reform & incentives
c. Investment in sustainable infrastructure
d. Payment for environmental services (PES)
e. Government-backed financing for new green business initiatives
f. Promotion of eco-industrial parks and smart growth zones (e.g. zero carbon/zero waste
IDZ)
14) Economic
a. Promote growth through innovation and skills in green technologies
b. Government funded technical vocational and educational training (TVET) for developing
new green skills, especially for small and medium-sized enterprises and in innovation.
c. Green Growth capacity building for public administrators and policy makers
d. Government support for the adoption and transfer of environmentally sound technologies
(ESTs)
e. Voluntary and mandatory environmental agreements (between governments and the
private sector)
f. Urban growth boundaries
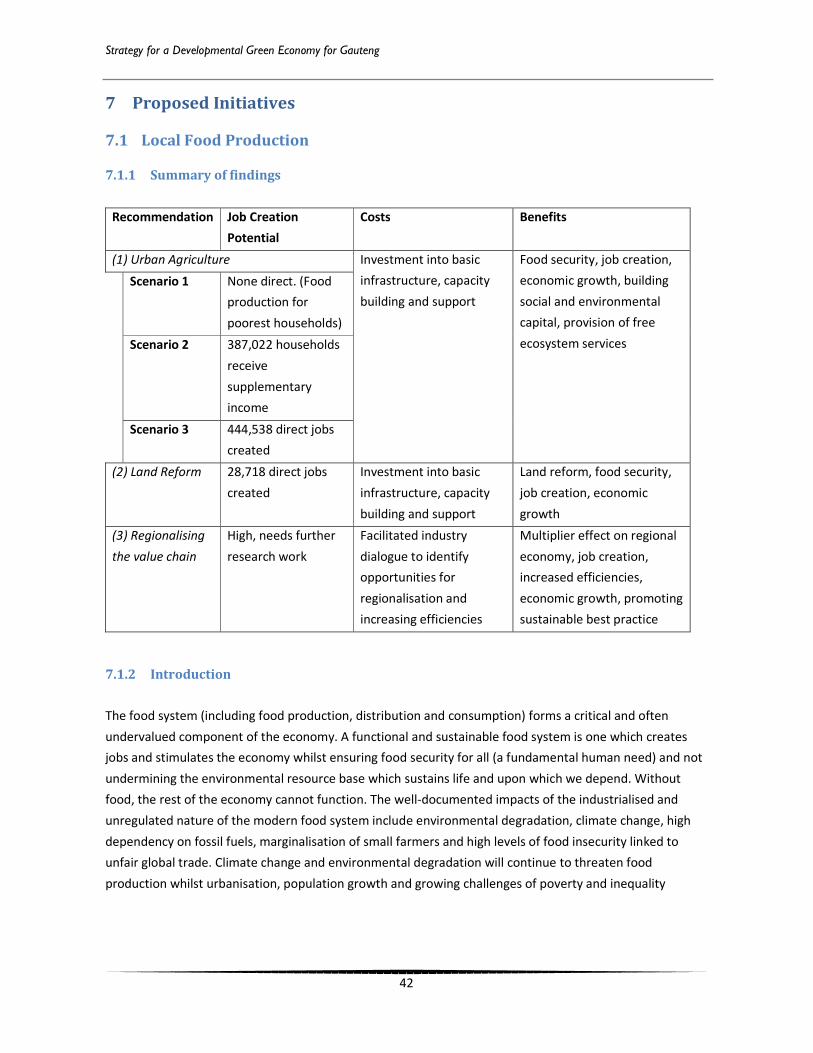
Strategy for a Developmental Green Economy for Gauteng
42
7 Proposed Initiatives
7.1 Local Food Production
7.1.1 Summary of findings
Recommendation Job Creation
Potential
Costs Benefits
(1) Urban Agriculture Investment into basic
infrastructure, capacity
building and support
Food security, job creation,
economic growth, building
social and environmental
capital, provision of free
ecosystem services
Scenario 1 None direct. (Food
production for
poorest households)
Scenario 2 387,022 households
receive
supplementary
income
Scenario 3 444,538 direct jobs
created
(2) Land Reform 28,718 direct jobs
created
Investment into basic
infrastructure, capacity
building and support
Land reform, food security,
job creation, economic
growth
(3) Regionalising
the value chain
High, needs further
research work
Facilitated industry
dialogue to identify
opportunities for
regionalisation and
increasing efficiencies
Multiplier effect on regional
economy, job creation,
increased efficiencies,
economic growth, promoting
sustainable best practice
7.1.2 Introduction
The food system (including food production, distribution and consumption) forms a critical and often
undervalued component of the economy. A functional and sustainable food system is one which creates
jobs and stimulates the economy whilst ensuring food security for all (a fundamental human need) and not
undermining the environmental resource base which sustains life and upon which we depend. Without
food, the rest of the economy cannot function. The well-documented impacts of the industrialised and
unregulated nature of the modern food system include environmental degradation, climate change, high
dependency on fossil fuels, marginalisation of small farmers and high levels of food insecurity linked to
unfair global trade. Climate change and environmental degradation will continue to threaten food
production whilst urbanisation, population growth and growing challenges of poverty and inequality

Strategy for a Developmental Green Economy for Gauteng
43
further undermine food security. Rising oil prices45
are set to steadily increase the price of food (as
experienced during the 2008 Food Crisis) and measures should be taken to reduce dependency on
imported food produce.
In light of these challenges, it is key that regions should shift towards a focus on food sovereignty46 in order
to protect the supply of and access to sufficient food for all residents. This in turn promotes job creation
and economic development through investment in the regional47
food system. “Development led by
import-replacement rather than export promotion diversifies, stabilizes, and strengthens the regional
economy” (Shuman, 1997:56).
This is not uncomplicated. Since 1994, many interventions have been undertaken nationally, provincially
and locally, aimed at encouraging small-scale production of food, goods or services for both consumption
and profit; many have failed. We must learn from this well-documented past, and ensure that this
intervention is based on a robust appreciation of the risks – and an appropriate selection of the model
being used, the agencies involved (government, non-government, etc.), and the extent and duration of
support for actors involved. The risk is dependency; the aim is food security, food production and sale, and
green jobs.
The key sustainability objectives promoted through a regional food system include (1) community resilience
and food security, (2) increasing ecosystem services and environmental capital through sustainable
production methods and (3) potential for reduced greenhouse gas emissions through reducing food miles.
7.1.3 Gauteng in Perspective
A review of the Commercial Agriculture Census Data (Statistics South Africa, 2006) in comparison with
current national consumption trends48
applied to the Gauteng population by age group suggests that
Gauteng is currently consuming far more food than it is producing and therefore heavily dependent on
imported food produce. Table 1 below indicates that a total of 618,000 tons of food are produced per
annum in Gauteng in comparison with 5,193,260 tons of total food consumed. A recent study found that
42% of households in the City of Johannesburg were classified as food insecure (Frayne, Battersby-Lennard,
Fincham & Haysom, 2009:01). Food insecurity critically undermines the capacity of households to ensure
their own livelihood security and is an immediate impediment to poverty alleviation as well as the
development and growth of any region.
45
Demand for oil is set to increase by a further 45 percent by 2030 with prices expected to reach $180 per barrel (IEA,
2008:04). 46
Food sovereignty can be defined as “the right of each nation to maintain and develop their own capacity to produce
foods that are crucial to national and community food security, respecting cultural diversity and diversity of
production methods” (Pimbert, 2008:43). 47
For the purposes of this report, the term ‘regional’ refers to Gauteng Province and ‘local’ to municipal areas within
Gauteng.
48
Derived from the National Food Consumption Report (Nel & Steyn, 2002).
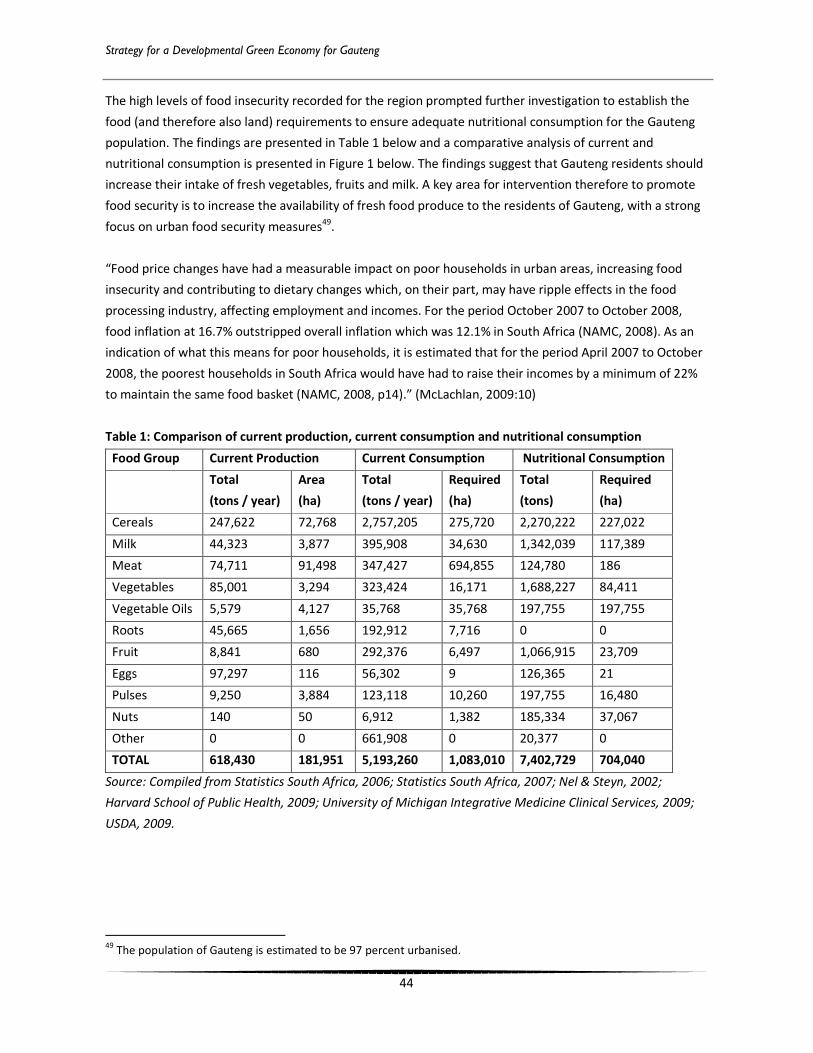
Strategy for a Developmental Green Economy for Gauteng
44
The high levels of food insecurity recorded for the region prompted further investigation to establish the
food (and therefore also land) requirements to ensure adequate nutritional consumption for the Gauteng
population. The findings are presented in Table 1 below and a comparative analysis of current and
nutritional consumption is presented in Figure 1 below. The findings suggest that Gauteng residents should
increase their intake of fresh vegetables, fruits and milk. A key area for intervention therefore to promote
food security is to increase the availability of fresh food produce to the residents of Gauteng, with a strong
focus on urban food security measures49
.
“Food price changes have had a measurable impact on poor households in urban areas, increasing food
insecurity and contributing to dietary changes which, on their part, may have ripple effects in the food
processing industry, affecting employment and incomes. For the period October 2007 to October 2008,
food inflation at 16.7% outstripped overall inflation which was 12.1% in South Africa (NAMC, 2008). As an
indication of what this means for poor households, it is estimated that for the period April 2007 to October
2008, the poorest households in South Africa would have had to raise their incomes by a minimum of 22%
to maintain the same food basket (NAMC, 2008, p14).” (McLachlan, 2009:10)
Table 1: Comparison of current production, current consumption and nutritional consumption
Food Group Current Production Current Consumption Nutritional Consumption
Total
(tons / year)
Area
(ha)
Total
(tons / year)
Required
(ha)
Total
(tons)
Required
(ha)
Cereals 247,622 72,768 2,757,205 275,720 2,270,222 227,022
Milk 44,323 3,877 395,908 34,630 1,342,039 117,389
Meat 74,711 91,498 347,427 694,855 124,780 186
Vegetables 85,001 3,294 323,424 16,171 1,688,227 84,411
Vegetable Oils 5,579 4,127 35,768 35,768 197,755 197,755
Roots 45,665 1,656 192,912 7,716 0 0
Fruit 8,841 680 292,376 6,497 1,066,915 23,709
Eggs 97,297 116 56,302 9 126,365 21
Pulses 9,250 3,884 123,118 10,260 197,755 16,480
Nuts 140 50 6,912 1,382 185,334 37,067
Other 0 0 661,908 0 20,377 0
TOTAL 618,430 181,951 5,193,260 1,083,010 7,402,729 704,040
Source: Compiled from Statistics South Africa, 2006; Statistics South Africa, 2007; Nel & Steyn, 2002;
Harvard School of Public Health, 2009; University of Michigan Integrative Medicine Clinical Services, 2009;
USDA, 2009.
49
The population of Gauteng is estimated to be 97 percent urbanised.
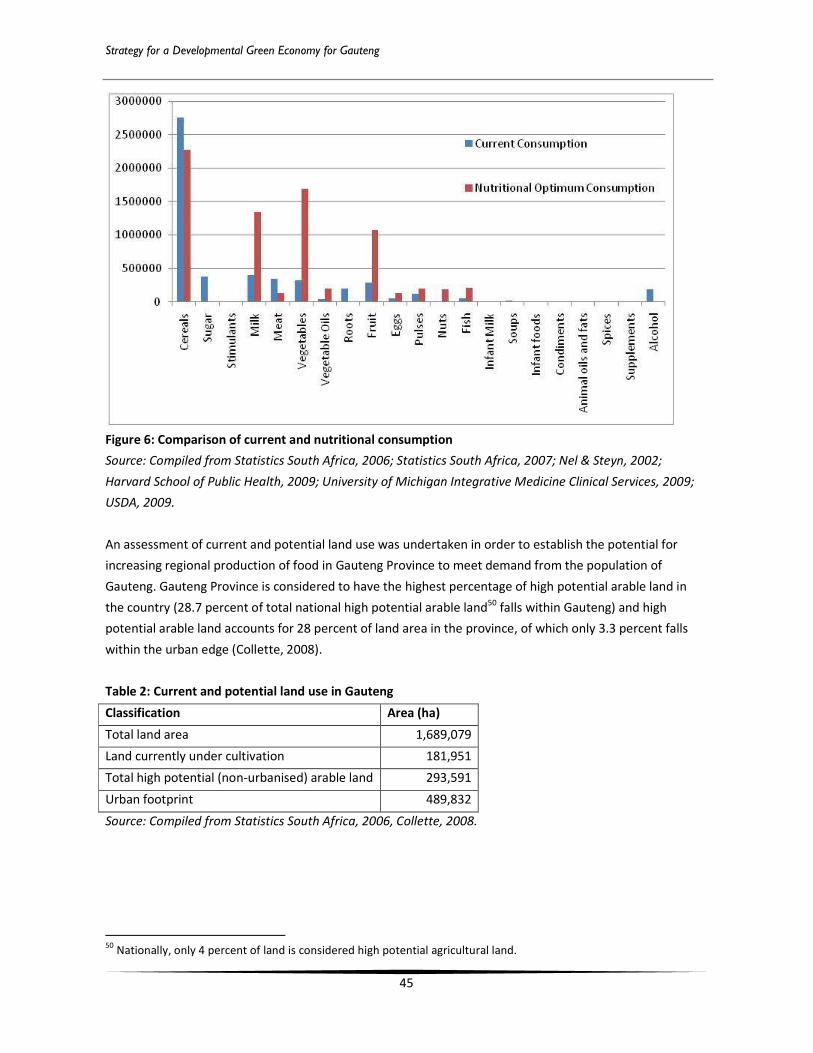
Strategy for a Developmental Green Economy for Gauteng
45
Figure 6: Comparison of current and nutritional consumption
Source: Compiled from Statistics South Africa, 2006; Statistics South Africa, 2007; Nel & Steyn, 2002;
Harvard School of Public Health, 2009; University of Michigan Integrative Medicine Clinical Services, 2009;
USDA, 2009.
An assessment of current and potential land use was undertaken in order to establish the potential for
increasing regional production of food in Gauteng Province to meet demand from the population of
Gauteng. Gauteng Province is considered to have the highest percentage of high potential arable land in
the country (28.7 percent of total national high potential arable land50
falls within Gauteng) and high
potential arable land accounts for 28 percent of land area in the province, of which only 3.3 percent falls
within the urban edge (Collette, 2008).
Table 2: Current and potential land use in Gauteng
Classification Area (ha)
Total land area 1,689,079
Land currently under cultivation 181,951
Total high potential (non-urbanised) arable land 293,591
Urban footprint 489,832
Source: Compiled from Statistics South Africa, 2006, Collette, 2008.
50
Nationally, only 4 percent of land is considered high potential agricultural land.

Strategy for a Developmental Green Economy for Gauteng
46
7.1.4 Recommendations
Gauteng should address food security by increasing the production of food within Gauteng Province
whilst simultaneously generating significant employment and building a stronger regional food economy
through diversification and value-adding initiatives.
The recommendations presented below identify opportunities for promoting food and livelihood security
through food production in cities focussing on the poorest and most vulnerable households on
underutilised land building on existing initiatives and leveraging government support across departments
and through strategic public-private partnerships; a strategic land reform programme for food production
aimed through networks of small and diversified farms and building stronger rural-urban synergistic
linkages and the regionalisation and diversification of the food value chain in order to identify
opportunities for increasing efficiencies, promoting sustainability across the sectors and realising new jobs
through regional investment.
These objectives align with a number of national and regional objectives, including:
• the Integrated Food Security Strategy (IFSS) which aims to increase household food production and
trading;
• improved income generation and job creation opportunities;
• improved nutrition and food safety;
• increased safety nets and food emergency management systems (NDA, 2002).
7.1.4.1 Recommendation 1: Urban Agriculture
Increasing production of key food produce, specifically vegetables, fruit and nuts as well as chicken, fish,
milk and eggs through targeting programmes to assist local communities and emerging farmers with access
to land, resources and support is critical for promoting food security but also presents a significant
employment opportunity. This has tremendous value and potential in the urban context.
Recent research shows that only three percent of households in Johannesburg currently grow their own
food, but of the small number of residents who do participate in urban agriculture, 31 percent are totally
dependent on the food they produce (Rudolph, Kroll, Ruysenaar & Dlamini, 2008). For these households,
urban agriculture is currently a coping mechanism and improved institutional support for urban agriculture
would dramatically assist these and other food insecure households in accessing food for survival.
The Gauteng Department of Agriculture, Conservation and Environment (GDACE) launched a Homestead
Food Security Community Garden Programme in 1996 in response to the identified need for urban food
security. The programme targeted vulnerable groups in urban and peri-urban communities and aimed to
improve household nutrition and available income. An evaluation of this programme in 2007 showed that
the projects have the potential to play an important role in contributing to household food security and
supplementing livelihood security but were fraught with institutional challenges and many of the projects
initially undertaken were no longer running successfully. Key challenges identified included lack of support

Strategy for a Developmental Green Economy for Gauteng
47
systems to successfully establish the projects and the absence of support systems and exit strategies from
the GDACE after the project has been established; not all of the beneficiaries meeting the criteria of
‘vulnerable persons’; low beneficiary retention linked to the lag time between start-up and food production
and low productivity in the gardens linked to insufficient capacity and support.
Investment to support an extensive urban agriculture programme would include ensuring adequate access
to land and water, basic infrastructure for production and market access, training and capacity building and
ongoing support. Key recommendations for government investment to support urban food security from
the findings of the Urban Food Security Study in Johannesburg (Rudolph, Kroll, Ruysenaar & Dlamini, 2008)
include:
• Improving supporting infrastructure and urban form: including local transport networks, central
packaging and distribution facilities for small food producers, support for small vendors of fresh
producers at strategic urban locations, systems of organic waste recycling and composting,
allocation of space for urban food production and retail in spatial planning. Emphasis should be
placed on reducing the running costs for food producers and the total environmental impact of
food production, including consideration of renewable technologies for water storage systems, use
of natural and organic fertilizers and pesticides and efficient localised distribution networks.
• Enhance economic participation: implementing safety measures to reduce or prevent sudden food
price increases, improve skills development, enhance job placement and Expanded Public Works
Programme linkages, support the development of multiple livelihood strategies and protect
consumers from price-fixing, corporate collusion and speculation. Further measures should include
providing access to micro-finance schemes, investment capital for cooperatives and other mutual
aid strategies. Experience from the private sector in supporting emerging farmer’s access markets
should be learnt from and adopted.
• Enhance communication, social capital and social mobilisation: encourage interdepartmental
government collaborations, engage in social conscientisation and mobilisation around food
security, employ appropriate and powerful media to improve public awareness and enhance
mobilisation, collectivise and socialise (e.g., in community food kitchens, community gardens) the
production, processing and consumption of healthy foods to develop greater social capital.
• Improve food availability and accessibility: enhance urban food production / urban agriculture
training and research centres; support the development of more resource-efficient, sustainable and
resilient agricultural practices; enhance and support the informal economy; create linkages
between local producers and markets; develop food aid programmes and community kitchens
accessible to the most vulnerable (elderly, grant recipients) as well as the wider community;
engage in public-relation campaigns that inform people about opportunities and procedures for
accessing social services and food aid; encourage the formation of food cooperatives and mutual
aid strategies.
• Improve food utilisation: enhance the public image of health food culture with a focus on diversity;
develop more effective nutritional education programmes integrated with the empowerment of
informal vendors, community food kitchens and feeding schemes; develop health promotion
Strategy for a Developmental Green Economy for Gauteng
48
programmes; provide households affected by illness and disabilities with additional support (such
as food packages, food coupons, job training and placement); regulate fast-food chain and
consumer brands to adhere to healthy and ethical nutritional business practices; promote research
into food security and poverty eradication; provide training to improve inter-sectoral collaboration
between stakeholder groups
The food system is an incredibly dynamic and complex system that cannot easily be simplified. Job creation
potential from urban agriculture can be estimated based on land availability and demand for fresh produce
is outlined below, but will require in depth research at a municipal level to calculate the specific conditions
and opportunities for urban agriculture in each context. Food production without a corresponding market
for the produce and extensive support in various forms that goes beyond policy commitments will not
realise jobs or food security, and this is perhaps why urban agriculture (and land reform) continue to fail in
so many regions. As outlined above, urban food production is critical and has tremendous potential to
address to promote both food and livelihood security. Increasing food prices, growing food insecurity and
the pressures of urbanisation are strong drivers for urban agriculture going forward and further
investigation into a viable and realistic urban agriculture programme based on empirical research and
detailed budgeting should be considered a priority for the region.
Calculating the total investment required from government to realise a food secure Gauteng will rest on
this research which will give a clearer indication of the types of infrastructural arrangements that need to
be considered and what forms of capacity building and ongoing supported could be implemented, but none
of this can be detailed in numbers without extensive on the ground research as each situation and set of
requirements varies so greatly from community to community.
Abalimi Bezekhaya, an established urban agriculture NGO in Cape Town, has documented that 250 to
500m2 of urban wasteland converted into organic food gardens can sustain one job providing an income of
R1500 per month (after costs) for produce sold at street prices. They have also recorded that a garden of
100m2 has the capacity to provide all the fresh produce needs for a household of 5 to 6 members all year
round (Small, 2005).
The findings of the 2007 Community Survey recorded the annual household income distributions, indicating
that 1,030,872 households (of a total 2,667,231 households) survive off less than R19,200 per annum (or
R1,600 per month). Based on the population distribution by annual household income, three scenarios for
urban agriculture in Gauteng are present below.
The first is based on small plot production for household consumption that would contribute to household
food security and increasing the disposable income of the households in Gauteng earning less than R19,200
per annum. The second scenario is based on slightly medium plots that would contribute to household food
and an additional income generation opportunity for households earning less than R4,800 per annum. The
third scenario is based total demand for fresh produce from the Gauteng population translated into job
creation potential through larger plot production.
Strategy for a Developmental Green Economy for Gauteng
49
The allotments described here range in size from 100m2 up to 600m
2 which can be sourced from a variety
of spaces, including but not limited to backyards, school grounds, church and community centre grounds,
rooftops and parks as well as publicly owned land and underutilised land in residential areas. Green
corridors can also be established as food producing zones through the planting of fruit and nut trees. A
large movement is underway converting residential gardens in wealthier suburbs into ‘kitchen gardens’ and
presents an interesting opportunity for job creation.
Further investigation is required into the availability of land potentially suitable for urban agriculture in
Gauteng and a core recommendation is the establishment of a central coordinating agency to undertake
the investigation and implementation of a comprehensive urban agriculture strategy. Each of the scenarios
below should be phased, targeting vulnerable groups and easily accessible underutilised land first. These
scenarios present estimations of the potential to contribute to food and livelihood security at a household
level through an urban agriculture programme. A more likely scenario would be a combination of the
approaches presented below and a spatial plan for urban agriculture in Gauteng would unfold at a
municipal level based on available land, the needs of the communities and the supporting systems in place.
Further opportunities for food production and higher revenue returns should be investigated, such as light
livestock for eggs, meat and dairy production.
Scenario 1: Household Food Security for Households <R19200 per annum
1,030,872 households cultivate 100m2 per household, thereby reducing expenditure on fresh food
produce by an estimated R50 per household per month. An additional R51,543,600 becomes
available per month as income to be spent on other items and all households earning less than
R19,200 per annum have access to affordable fresh food produce (fruit and vegetables).
Land requirements: 10,308 hectares total (in 100m2 allotments)
Jobs created: None directly
Strategy for a Developmental Green Economy for Gauteng
50
Scenario 2: Household Food and Improved Livelihood Security for Households <R4800 per annum (small
plots)
387,022 households cultivate 300m2 per household, thereby reducing expenditure on fresh food
produce by an estimated R50 per household per month from the 100m2 for household food
production and generating an income of R600 per household from the additional 200m2
An additional R19,351,100 becomes available per month as income to be spent on other items,
and all households earning less than R4,800 per annum have access to affordable fresh food
produce (fruit and vegetables) plus additional production of food for sale to remaining households
earning less than R19,200 per month.
Land requirements: 11,610 hectares total (in 300 m2
allotments)
Jobs created: 387,022 households earn additional R600 per month
Scenario 3: Household Food and Livelihood Security for Households <R19200 per annum (larger plots)
To meet the basic fresh produce requirements of the population of Gauteng, 26,672 hectares need
to be cultivated which can be done by 444,538 people on 600m2 plots.
� 100m2 to meet the needs of their own households, thereby saving R50 minimum per month
and freeing up a total of R22,226,925 per month.
� 500m2 to grow fresh produce for sale, enough to feed a further five households per plot with
nutritious and affordable food, and generate a monthly income of R1500 per grower. Total of
R666,807,000 income generated per month and all households in Gauteng have access to
affordable fresh food produce (fruit and vegetables).
Land requirements: 26,672 hectares total (in 600 m2 allotments)
Jobs created: 444,538 direct jobs
Further investigation into the actual availability of land for urban agriculture and market demand
for fresh produce in Gauteng when coupled with government intervention strategies to promote
food security would provide a clearer indication of the viability of this estimation.
Job creation potential: 444,538 jobs
7.1.4.2 Recommendation 2: Land Reform & Improved Market Access
Land reform to increase regional production in rural and peri-urban areas would also serve to secure food
for regional consumption whilst creating employment and stimulating the regional economy further. Key
produce that could be focussed on for peri-urban and rural farms include grains, vegetable oils and
livestock as well as vegetables, fruit and nuts. Farms producing for regional consumption are typically more
diversified and concentrated in the production of food. “As the economy became more local, local farming
would become more diverse; the farms would become smaller, more complex in structure, more
productive” (Berry, 1993:25-26). Diversification is associated with production for regionally orientated

Strategy for a Developmental Green Economy for Gauteng
51
markets and reducing risk of individual crop failures (Altieri, 2002b:xii-xiii). Diversified farms are typically
more productive per square meter (Rosset, 1999), and tend towards agroecological and sustainable
methods of production (Pretty, 1998:197-198). Networks of smaller, diversified farms are well suited to
regional demand for food and fit the models better suited for land reform initiatives which are a key
national objective for rural development.
Land reform has the potential to create jobs, promote rural development and ensure food security for the
province of Gauteng but this will require extensive support to be successful and investment should be
considered in the context of hidden subsidies that other forms of large scale agriculture currently receive.
Furthermore, “investments in infrastructure and facilitating access to markets and trade opportunities,
occupational education and extension services, capital, credit, insurance and in natural resources such as
land and water” are critical (IAASTD, 2008:11). Further investigation is required into the investment
required to cover land and infrastructure costs as well as ongoing capacity and support. Given the complex
and context specific nature of food production, broad estimates cannot be made without further
investigation.
Key recommendations are put forward to assist small producers in leveraging support structures, accessing
markets and developing the required skills development that are currently lacking in most land reform
programmes:
� The cooperative model has proved successful in many countries for small-scale and emerging farmers
to pool together resources and share support but requires support in the form of building management
capacity.
� Other options that should be considered include micro-finance schemes and building on the success
that the private sector has had in building private sector partnerships with emerging small-scale
farmers for the supply of a variety of fresh and processed food products.
� Centralised packaging and transport nodes should be invested in as public serving infrastructure to
assist emerging farmers in getting their produce to market.
� These could be coupled with learning centres to build new systems of agricultural skills and knowledge.
� Targeted skills development programmes for emerging farmers on agroecological51 methods (thereby
reducing dependency on fossil fuels and building resilience to climate change), marketing skills (to local
markets) and business management are critical, and should be invested in for the development and
security of both the farmers and the wider community (Pretty, 2001:11).
Calculating the job creation potential below is based on availability of high potential arable land in the
region and at commercial agricultural productivity and employment ratios. Further investigation is
warranted into the actual land availability, land values and productivity from site to site based on climate,
soils and water availability, as well as feasibility studies regarding access to land, ownership, and related
matters. The introduction of sustainable production methods that build the integrity of the soils and reduce
51
Agroecological refers to agricultural systems which are assessed and valued from an ecological and socio-economic
perspective; and promote ecological relationships in agriculture in order to develop healthy and sustainable systems
of agricultural production (Goering et al, 2001:62; Pretty, 2002:viii).
Strategy for a Developmental Green Economy for Gauteng
52
dependency on high external outputs (such as fossil fuel based fertilizers and chemicals) will not only
contribute to the environmental capital of the region but also increase the resilience of the farmers
through a reduced dependency on increasingly expensive farm inputs.
Total high potential arable land 293,591 hectares
Food production on arable land at 4 tonnes of food per hectare52
: 1,174,364 tonnes
Job creation potential at 1 job per 20 tonnes of food produced53
: 58 718 jobs
less 30 000 existing jobs
= 28 718 jobs
Current agricultural practice in Gauteng (contributing a total of 30 000 jobs to the region) are not all
situated on high potential arable land. The 30 000 jobs created from agriculture have been subtracted from
the potential job creation figure of 58 718 jobs but given that the land areas of currently farmed land and
potentially arable land do not correspond, the job creation potential may be larger than the 28 718 jobs
identified above.
Job creation potential: 28 718 new jobs
7.1.4.3 Recommendation 3: Value Chain Regionalisation & Diversification
Increasing agricultural production is key to achieving food security but must be coupled with “broader,
more systemic interventions in the value chains linking the production, manufacturing and retail of food.
The private sector faces a compelling business case to resolve the food security situation, including risks of
economic stagnation, social unrest, trade restrictions and impacts on reputation and brand value”
(McLachlan, 2009). Value chain regionalisation and diversification presents an opportunity for promoting
food security through key interventions, but also job creation and economic growth through the
development of the entire regional food industry. A key component of building a strong regional food
economy is the localisation of the entire value chain, from seed and compost production through to value
adding and beneficiation, thereby introducing various system efficiencies and stimulating the regional
economy further. The circulation of resources within the regional context is therefore both the food itself
and the nutrients used in the production of the food as well as payment for the food.
There are several opportunities for stimulating the regional economy beyond supporting regional food
growers (who typically benefit from receiving a greater share of the food dollar and contribute to the
regional economy when encouraged to spend their income on regional produce). Different local food
52
Conservative estimates of food production capacity through diversified production of vegetable, fruits, nuts and
grains as well as livestock at commercial production rates. 53
Conservative ratio of 1 job per 5 hectares at commercial agriculture standards. Whilst Intense organic vegetable and
other field crop production on diversified farms have recorded ratios of 1 job per 1 hectare a standard ratio of 20
tonnes = 1 job has been applied consistent to both commercial and diversified small-scale farms (i.e., small organic
farms are more productive per hectare but generate similar levels of job creation per tonne of produce).
Strategy for a Developmental Green Economy for Gauteng
53
economy initiatives such as Community Supported Agriculture (CSAs), local markets and consumer
cooperatives are critical in supporting regionally grown produce in reaching consumers more directly and
effectively. A local distribution hub for regionally produced foods should be established to assist both
farmers and consumers in connecting more directly and maximising the benefits of central coordination.
Livelihood security of the wider community can be promoted with the production of farm inputs and
micro-enterprises, supporting regional distribution through to value adding industries associated with the
food sector (Shuman, 1997:53). Processing and packaging enterprises that have previously been located
elsewhere can be established in local food sheds, thereby stimulating regional enterprises further (Shuman,
1997:52). “Locally and regionally produced food offers greater security, as well as synergistic linkages to
promote local economic development” (Rosset, 2002:xix).
The multiplier effect of localising the food system both stimulates the regional economy and builds
resilience. A recent study by Sonntag (2008) found that “locally directed spending by consumers more than
doubles the number of dollars circulating among businesses in the community” (Sonntag, 2008:v). Research
by Ward and Lewis (2002:20) found that for every £10 pounds spent with a local producer through an
organic box scheme, the money was circulated within the local economy to make a total contribution of
£25 to the local economy (in comparison with a worth of £14 to the local economy if spent at a local
supermarket). In this way, money spent on locally or regionally produced food generates twice as much
income for the local economy (New Economics Foundation, 2001) and promotes stronger social cohesion
for the entire community (Taylor, Madrick & Collin, 2005:01).
Local economies tend to address inequalities of wealth by spreading their gains evenly through the entire
community whereby “improving the economic welfare of farmers, farm workers, small producers and
shopkeepers benefits entire local economies, providing in turn deep social benefits to communities as a
whole” (Norberg-Hodge, Merrifield & Gorelick, 2002:31). A study by Goldschmidt in the 1940s of two
similar sized towns in rural California found that the town surrounded by small family farms supported
twice as many businesses and generated more than 60 percent retail volume than the industrial farm town,
including a range of secondary industries and supporting community enterprises (Norberg-Hodge,
Merrifield & Gorelick, 2002:31). “Local economic development therefore can provide an effective
counterforce against economic, political and social vulnerability due to the forces of global competition”
(Marsden & Smith, 2005:442).
Building strong regional food systems create opportunities for job creation on a larger scale than one
person per plot as outlined for food production through diversification and growth into sectors such as
manufacturing, distribution and retail. Networks of small and diversified producers, manufacturers and
retailers are key to realising a vibrant regional food economy with strong multiplier effects. Key
interventions are highlighted in the policy recommendations in the section below and include a strong
focus on assisting small farmers, small manufacturers and small retail outlets in competing with the
growing concentration power sitting in the retail sector of the food value chain (McLachlan, 2009).
Dialogue needs to be facilitated across the food industry value chain to identify opportunities for building a
stronger regional food economy and opening opportunities for small producers to enter the market. The

Strategy for a Developmental Green Economy for Gauteng
54
Sustainable Food Lab (http://www.sustainablefoodlab.org/) has had success with facilitating similar
initiatives in other countries with outcomes such as increasing efficiencies and profits as well as overall
sustainability in the sector being stated, though no documented impacts on job creation in specific have
been recorded.
According to the 2005/2006 Income and Expenditure Survey, Gauteng residents spend an average of
R8,486 per annum of food per household. At a total of 2 967 693 households, this amounts to
R251,838,842,798 per annum spent on food from the Gauteng region.
Breaking this down further for fresh fruit (R262 per household per annum) and vegetables (R808 per
household per annum) alone, this amounts to over R3 billion in total expenditure per annum on produce
that could be sourced from within the province and mostly even within the urban zones. Thus a multiplier
effect of 2.5 would have a total contribution of over R7 billion to the regional economy of Gauteng if the
focus of fruit and vegetable production were directed towards networks of small and diversified food
producers and distributors.
Job creation potential: High, requires further research
7.1.5 Summary of Policy Recommendations
McLachlan (2009:40-42) summarises the following key policy recommendations based on a compilation of
several recent studies on the state of agriculture and food security in South Africa in the move towards a
renewal in the South Africa food system:
“With regard to urban food security, the following issues require priority attention:
� Ensuring access to social grants for all eligible households: Measures should be taken to strengthen
local capacity at all levels to improve the take-up rate of grants. In addition, direct food grants, food
production for own use or for sale, and support to community service organizations to provide food-
related services should be considered.
� Implementing measures to improve dietary diversity, food safety and food quality: Education on
dietary and life-style choices at schools and in the community deserves more attention, as do measures
to limit advertising of non-nutritious food to children. The quality and safety of foods provided through
vendors and informal shops, should be improved through education and incentives. Improving
infrastructure, particularly in informal settlements, can contribute significantly to improving health, and
should therefore continue to be a priority.
� Implementing a provincial urban agriculture policy, and incorporating food security into integrated
development plans: Local municipalities should be assisted to incorporate food security into local
planning processes, within the framework of a national urban agriculture and food security policy.
� Strengthening and supporting the role of the private sector in food security initiatives: The role of the
private sector in developing a bridge between the formal market system and food aid activities also
deserves more attention.”

Strategy for a Developmental Green Economy for Gauteng
55
� Furthermore, focussing on opportunities for small food producers, manufacturers, distributors and
retailers to access the market, including value chain wide facilitated dialogue to indentify blockages
and opportunities for job creation. A provincial commitment to a regional procurement programme,
supporting regionally produced food products where possible and actively encouraging the building of
a strong regional food economy.
McLachlan (2009:40-42) further identifies “with regard to agriculture and the food system, the following
issues require priority attention:
� Accelerating land reform and affording greater priority to currently successful small farmers as
beneficiaries.
� Targeting farmer support services at those who need it most, especially farmers in remote rural areas.
This will include assistance in accessing commercial supply chains, which currently favour large-scale
farmers. Such assistance should include support for collective action, as well as support for access to
alternative markets where commercial processors and supermarkets play a less prominent role.
� Improving the efficiency of the supply chains that bring farm inputs to the farm and that take farm
products to the final consumer, whether domestically or internationally.
� Developing a thoroughgoing understanding of the food pricing mechanisms, including benefits and
costs to farmers, input suppliers, and small and large operators in the supply chain.
� Continuing with diligent application of competition policy along the supply chain, as has been
accomplished over the past few years.
� Developing and implementing a research and action agenda to promote sustainable agriculture
development across the range of farming types in South Africa.
� In the context of the developmental state approach, broadening the definition of infrastructure to
include soil as part of infrastructure that attracts investment
With regard to institutional arrangements, leadership and capacity to address food security, the following
issues require priority attention.
� Focusing on strengthening local municipalities in rural and urban areas to develop and implement food
security strategies, including measures to address food emergencies, and collaborative strategies to
harmonize the efforts of the public and private sector and civil society.
� At all levels, developing a cadre of outstanding food security leaders, by implementing a management
and leadership development programme for the sector, in collaboration with leading management and
leadership institutions in the country.”
Key sustainability policies need to be incorporated into the food system, including reducing dependency
on non-renewable (and increasingly expensive) resources, minimisation of environmental degradation to
avoid impacting on the provision of key life-sustaining eco-system services and addressing challenges of
poverty and inequality through positive development and building of social and environmental capital as
well as realising economic growth and development.
Strategy for a Developmental Green Economy for Gauteng
56
To achieve this level of food production and security, the DED will need to lobby others to work with them,
especially the Depts. of Agriculture, Social Development, and Land.
The large scale job creation programme could be run through Community Driven Development and a
Community Employment Programme i.e. job creation and training under a public works programme guise.
Note: The linkages with water have not been explored. This needs to be done in a further study.
Green Economy for Gauteng
57
7.1.6 References
1. Armstrong, D. (2000) A Survey of Community Gardens in Upstate New York: Implications for Health
Promotion and Community Development. Health and Place. December 2000, pp 319 – 327.
2. Berry, W. (1993) Sex, Economy, Freedom, and Community. San Francisco: Pantheon Avon.
3. Berry, W. (2000) A Return to the Local: You Stay Home Too. World Watch. pp 33, September / October.
4. Collett, A. (2008) The determination, protection and management of high potential agricultural land in
South Africa with special reference to Gauteng, MSc dissertation, University of Pretoria, Pretoria,
viewed 12 January 2010. Available online http://upetd.up.ac.za/thesis/available/etd-08042009-171427.
5. Companioni, N., Hernandez, Y. O., Paez, E. & Murphy, C. (2002) The Growth of Urban Agriculture. In
Funes, F., Garcia, L., Bourgue, M., Perez, N. & Rosset, P. (2002) Sustainable Agriculture and Resistance:
Transforming Food Production in Cuba. Havana: Asociacion Cubana de Tecnicos Agricolas y Forestales
(ACTAF).
6. Department of Agriculture (DoA), (2006). Strategic Plan for the Department of Agriculture 2006.
Pretoria: Department of Agriculture.
7. Drimie, S. & Garrett, J. (2009) Aligning and Transforming institutions to Safeguard Food Security in
South Africa: Concepts and Critique. Pretioria: IFPRI. [Internal document]
8. Duenas, F., Plana, D., Salcines, I., Benitez, B., Medina, L. R. & Domini, M. E. (2009) Cuba’s success story,
further developed. LEISA Magazine.25(3):31–33.
9. Feenstra, G. W. (1997) Local food systems and sustainable communities. American Journal of
Alternative Agriculture. 1291):28–36.
10. Francis, C., Koehler-Cole, K., Hansen, T. & Skelton, P. (2008) Science-Based Organic Farming 2008:
Toward Local and Secure Food Systems. [Online] Available:
http://www.nlc.state.ne.us/epubs/U2250/H110-2008.pdf [accessed 03 July 2009]
11. Frayne, B., Battersby-Lennard, J., Fincham, R. & Haysom, G. (2009) Urban Food Security in South Africa:
Case Study of Cape Town, Msunduzi & Johannesburg.
12. Goering, P., Norberg-Hodge, H. and Page, J. (1993) From the Ground Up: Rethinking Industrial
Agriculture. London: Zed Press.
13. Halweil, B. (2004) Eat here: Reclaiming homegrown pleasures in a global supermarket. New York: WW
Norton & Company.
14. Hamman, R. (2009) The Role of Business and Cross-Sector Collaboration in Food Security in South Africa:
Notes on an Action-Research Project. Cape Town: UCT. [Internal document]
15. Harvard School of Public Health (2009) The Nutrition Source: The Healthy Eating Pyramid. [Online]
Available: http://www.hsph.harvard.edu/nutritionsource/what-should-you-eat/pyramid/ [01 August
2009].
16. Harvard School of Public Health (2009) The Nutrition Source: The Healthy Eating Pyramid. [Online]
Available: http://www.hsph.harvard.edu/nutritionsource/what-should-you-eat/pyramid/ [01 August
2009].
17. Hinrichs, C. C. (2000) Embeddedness and local food systems: notes on two types of direct agricultural
market. Journal of Rural Studies. 16:295–303.

Green Economy for Gauteng
58
18. Hinrichs, C. C. (2003) The practice and politics of food system localisation. Journal of Rural Studies.
19:33–45.
19. International Assessment of Agricultural Knowledge, Science and Technology (IAASTD). (2008)
Executive Summary of the Synthesis Report of the International Assessment of Agricultural Knowledge,
Science and Technology for Development Programme. [Online] Available:
http://www.agaassessment.org/ [03 June 2008]
20. International Energy Agency (IEA). (2008) World Energy Outlook 2008: Executive Summary. [Online]
Available: http://www.worldenergyoutlook.org/2008.asp 27 September 2009 [27 September 2009]
21. Kelly, C., Kate, T. & Haysom, G. (2009) Food Security in South Africa: Alternative Agricultural Options –
towards agro-ecological sustainable production and access. [Internal document]
22. Levins, R. (2002) The Unique Pathway of Cuban Development in Funes, F., Garcia, L., Bourgue, M.,
Perez, N. & Rosset, P. (2002) Sustainable Agriculture and Resistance: Transforming Food Production in
Cuba. Havana: Asociacion Cubana de Tecnicos Agricolas y Forestales (ACTAF).
23. Louv, R. (2007) Leave no child inside: The growing movement to reconnect children and nature, and to
battle "nature deficit disorder". Orion Magazine. March / April 2007.
24. Marsden, T. & Smith, E. (2005) Ecological entrepreneurship: sustainable development in local
communities through quality food production and local branding. Geoforum. 36:440–451.
25. McLachlan, M. (2009) Seeding Change: A proposal for Renewal in the South African Food System. Draft
report to the Development Bank of Southern Africa: Food Security Research Initiative [Internal
document].
26. National Department of Agriculture (NDA). (2002) The Integrated Food Security Strategy for South
Africa. Pretoria.
27. Nel, J. H. & Steyn, N. P. (2002) Report on South African food consumption studies undertaken amongst
differetion population groups (1983 – 2000): Average intakes of foodsmost commonly consumed.
Department of Health: Pretoria.
28. New Economics Foundation (2001) Local Food Better for Rural Economy than Supermarket Shoppping
(press release), London, United Kingdom, 7 August 2001.
29. Nieto, M. & Delgado, R. (2002) Cuban Agriculture and Food Security. In Funes, F., Garcia, L., Bourgue,
M., Perez, N. & Rosset, P. (2002) Sustainable Agriculture and Resistance: Transforming Food Production
in Cuba. Havana: Asociacion Cubana de Tecnicos Agricolas y Forestales (ACTAF).
30. Norberg-Hodge, H. (2009a) The Case for Local Food. [Online] Available: www.isec.org [16 July 2009]
31. Norberg-Hodge, H. (2009b) Globalisation versus community. [Online] Available: www.isec.org [16 July
2009]
32. Norberg-Hodge, H., Merrifield, T. & Gorelick, S. (2002) Bringing the Food Economy Home: the social,
ecological and economic benefits of local food. Devon: International Society for Ecology and Culture.
33. Peters, C. J., Bills, N. L., Wilkins, J. L. and Fick, G. W. (2008) Foodshed analysis and its relevance to
sustainability. Renewable Agriculture and Food Systems, 24(1):1–7.
34. Pimbert, M. (2008) Towards food sovereignty: reclaiming autonomous food systems. London: IIED.
35. Pinkerton, T. & Hopkins, R. (2009) Local Food: How to make it happen in your community. Greenbooks:
Devon.

Green Economy for Gauteng
59
36. Pretty, J. (1995) Regeneration Agriculture: The Agro-Ecology of Low-External Input, in Kirkby, J., et al.
(1995) Sustainable Development, The Earthscan Reader. London: Earthscan.
37. Pretty, J. (1998) The Living Land: Agriculture, Food and Community Regeneration in Rural Europe.
London: Earthscan.
38. Pretty, J. (2001) Some benefits and drawbacks of local food systems. Briefing note for TUV/Sustain
AgriFood Network, November 2.
39. Pretty, J. (2002) Agri-culture: Reconnecting People, Land and Nature. Earthscan: Landon.
40. Rosset, P. M. (1999) The Multiple Functions and Benefits of Small Farm Agriculturein the Context of
Global Trade Negotiations. Poicy Brief No. 4. Oakland: Institute for Food and Development Policy.
41. Rosset, P. M. (2000) Cuba: A successful case study of Sustainable Agriculture. In Magdoff, F., Foster, B.
and Buttel, F. H. (2000) Hungry for Profit: The Agribusiness threat to farmers, food and the environment.
New York: Monthly Review Press.
42. Rosset, P. M. (2002) Lessons of Cuban Resistance in Funes, F., Garcia, L., Bourgue, M., Perez, N. &
Rosset, P. (2002) Sustainable Agriculture and Resistance: Transforming Food Production in Cuba.
Havana: Asociacion Cubana de Tecnicos Agricolas y Forestales (ACTAF).
43. Rudolph, M., Kroll, F., Ruysenaar, S. & Dlamini, T. (2008) Urban Food Security Johannesburg: A report of
food security, poverty and health in three study areas in Johannesburg, December 2008.
44. Shuman, M. (1997) Going Local: Creating self reliant communities in a Global Age. New York: The Free
Press.
45. Small, R. (2005) The Urban Agriculture Programme of Abalimi Bezekhaya in Proceedings of the study
visit to Johannesburg and Cape Town, South Africa (17-25 August 2005) Leusden, the Netherlands:
Resource Centre on Urban Agriculture and Food Security (RUAF), ETC Urban Agriculture.
46. Sonntag, V. (2008) Why Local Linkages Matter: Findings from the Local Food Economy Study. Seattle:
Sustainable Seattle.
47. Statistics South Africa (2006) Report on the survey of large and small scale agriculture. Pretoria: Statistic
South Africa.
48. Statistics South Africa (2007) Findings of Community Survey, 2007. Pretoria: South Africa.
49. Statistics South Africa (2009) Mid year population estimates 2009. Pretoria: Statistics South Africa.
50. Taylor, J., Madrick, M. & Collin, S. (2005) Trading places: the local economic impact of street produce
and farmers' markets. London: New Economics Foundation.
51. United States Department of Agriculture (USDA). (2009) MyPyramid.gov [Online]. Available:
http://www.mypyramid.gov/index.html [01 August 2009]
52. University of Michigan Integrative Medicine Clinical Services (2009) About Healing Foods Pyramid.
[Online]. Available: http://www.med.umich.edu/UMIM/food-pyramid/about.htm [01 August 2009]
53. Vink, N. & Van Rooyen, J. (2009) The economic performance of agriculture in South Africa since 1994:
Implications for Food Security. Stellenbosch: University of Stellenbosch. [Internal document]
54. Ward, B. & Lewis, J. (2002) Plugging the Leaks: Making the most out of every pound that enters your
local economy. New Economics Foundation: London.
55. World Wildlife Fund (WWF). (2006) Living Planet Report 2006. [Online] Available:
http://www.panda.org/about_our_earth/all_publications/living_planet_report/ [27 September 2009]
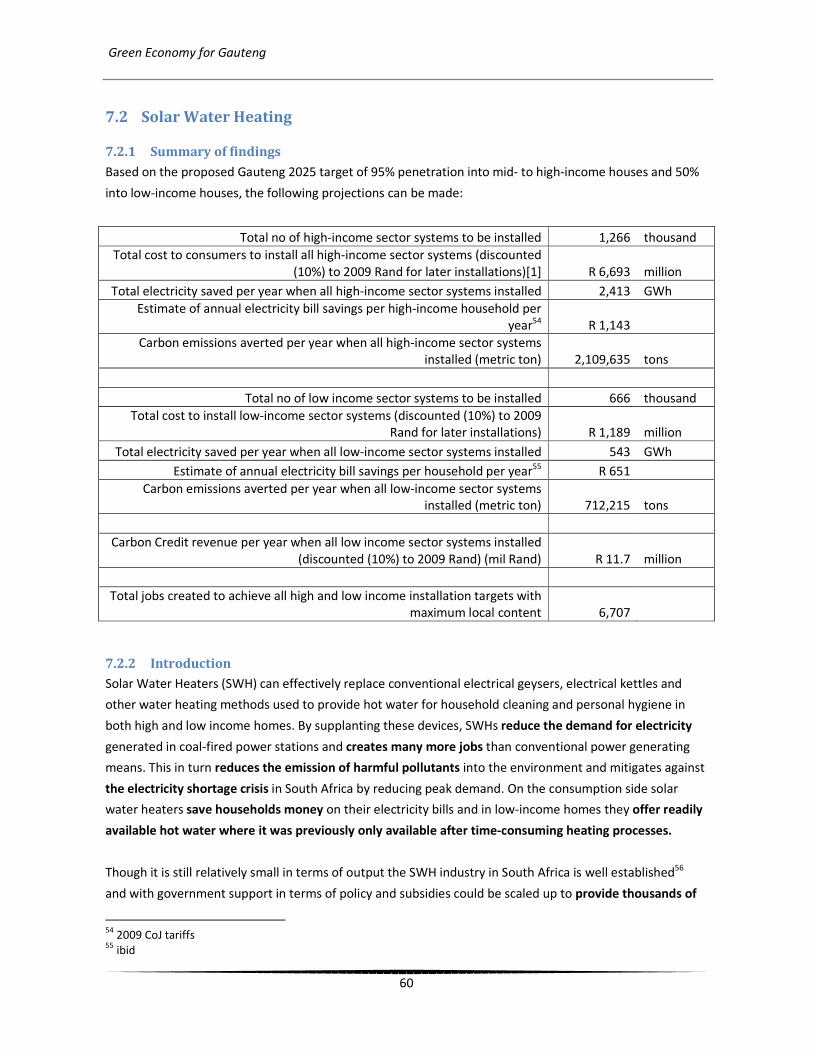
Green Economy for Gauteng
60
7.2 Solar Water Heating
7.2.1 Summary of findings
Based on the proposed Gauteng 2025 target of 95% penetration into mid- to high-income houses and 50%
into low-income houses, the following projections can be made:
Total no of high-income sector systems to be installed 1,266 thousand
Total cost to consumers to install all high-income sector systems (discounted
(10%) to 2009 Rand for later installations)[1] R 6,693 million
Total electricity saved per year when all high-income sector systems installed 2,413 GWh
Estimate of annual electricity bill savings per high-income household per
year54 R 1,143
Carbon emissions averted per year when all high-income sector systems
installed (metric ton) 2,109,635 tons
Total no of low income sector systems to be installed 666 thousand
Total cost to install low-income sector systems (discounted (10%) to 2009
Rand for later installations) R 1,189 million
Total electricity saved per year when all low-income sector systems installed 543 GWh
Estimate of annual electricity bill savings per household per year55
R 651
Carbon emissions averted per year when all low-income sector systems
installed (metric ton) 712,215 tons
Carbon Credit revenue per year when all low income sector systems installed
(discounted (10%) to 2009 Rand) (mil Rand) R 11.7 million
Total jobs created to achieve all high and low income installation targets with
maximum local content 6,707
7.2.2 Introduction
Solar Water Heaters (SWH) can effectively replace conventional electrical geysers, electrical kettles and
other water heating methods used to provide hot water for household cleaning and personal hygiene in
both high and low income homes. By supplanting these devices, SWHs reduce the demand for electricity
generated in coal-fired power stations and creates many more jobs than conventional power generating
means. This in turn reduces the emission of harmful pollutants into the environment and mitigates against
the electricity shortage crisis in South Africa by reducing peak demand. On the consumption side solar
water heaters save households money on their electricity bills and in low-income homes they offer readily
available hot water where it was previously only available after time-consuming heating processes.
Though it is still relatively small in terms of output the SWH industry in South Africa is well established56
and with government support in terms of policy and subsidies could be scaled up to provide thousands of
54
2009 CoJ tariffs 55
ibid

Green Economy for Gauteng
61
jobs, especially to semi-skilled workers who generally struggle to find employment opportunities.
Unfortunately the up-front costs of installing a solar water heater remains too high for most households,
especially in the low-income bracket, even though the life cycle costs of SWH are less than that of
conventional heating means. Government support is necessary to ensure that the technology is successfully
rolled out and creates the maximum amount of employment opportunities.
By integrating environmental and developmental concerns to achieve the fulfilment of human needs solar
water heating presents a key entry point for the development of a green economy in Gauteng.
SWH offers Government the opportunity to achieve its electrification targets with much smaller increases
in electricity supply required as they supplant 30-40% of electricity required in low-income households.
There is a also a moral and political imperative to ensure that a SWH initiative does not exclude low-income
communities and worsen inequality in the Gauteng province. In high-income groups SWH offers long-term
savings and environmental benefits without contributing to quality of life, in low-income communities
similar benefits are achieved whilst quality of life is also drastically improved. The technology provides an
opportunity for socio-economic upliftment that cannot be ignored.
7.2.3 Installation Targets
Gauteng’s proposed 2025 SWH targets57
are as follows:
95% of mid to high income households (based on 0.8% population growth) 58
1 266 393 systems installed
50% of low income households (based on 0.8% population growth)59 666 522 systems installed
It is estimated that less than 0.1% of Gauteng residents currently use a Solar Water Heater60
.
Though the argument for SWH makes more sense for high-income consumers from an environmental and
economic perspective, it is imperative that the low-income market sector should be included in a rollout
strategy. SWHs offer an important developmental service that can improve the quality of life of poor
households without harming the environment. Politically it is critical to demonstrate that renewable energy
technologies do not just offer benefits to the rich but that they can be a powerful agent to reduce
inequality in society.
The insurance industry are the largest procurers of electric geysers (I think it is 250 000). The author is
aware that both Santam and Hollard have initiated studies to determine how they can use this leverage to
increase supply of SWH. There are the multiple benefits for them to do this, including:
• Reduces their risk (i.e. the geyser is on the roof, not underneath),
56
SWHs have been commercially available in South Africa since the 1970s 57
Dept of Local Gov & Housing, Gauteng Integrated Energy Strategy. 58
City of Johannesburg, Spatial Development Framework 2007 59
58% of the households in the province are classed in LSM 1-6 (Holm 2005) and the assumption is that this figure will
fall to around 50% by 2025 if development targets are achieved. 60
GCRO Survey undertaken 2009
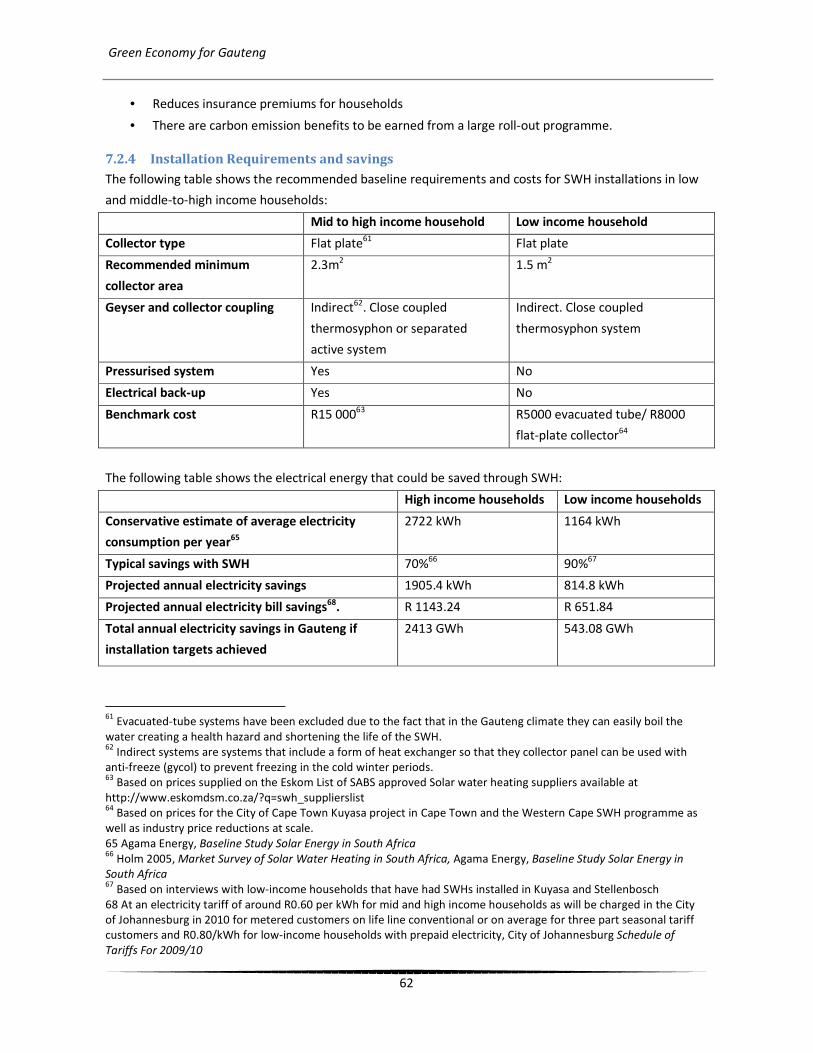
Green Economy for Gauteng
62
• Reduces insurance premiums for households
• There are carbon emission benefits to be earned from a large roll-out programme.
7.2.4 Installation Requirements and savings
The following table shows the recommended baseline requirements and costs for SWH installations in low
and middle-to-high income households:
Mid to high income household Low income household
Collector type Flat plate61
Flat plate
Recommended minimum
collector area
2.3m2 1.5 m2
Geyser and collector coupling Indirect62. Close coupled
thermosyphon or separated
active system
Indirect. Close coupled
thermosyphon system
Pressurised system Yes No
Electrical back-up Yes No
Benchmark cost R15 00063
R5000 evacuated tube/ R8000
flat-plate collector64
The following table shows the electrical energy that could be saved through SWH:
High income households Low income households
Conservative estimate of average electricity
consumption per year65
2722 kWh 1164 kWh
Typical savings with SWH 70%66
90%67
Projected annual electricity savings 1905.4 kWh 814.8 kWh
Projected annual electricity bill savings68. R 1143.24 R 651.84
Total annual electricity savings in Gauteng if
installation targets achieved
2413 GWh 543.08 GWh
61
Evacuated-tube systems have been excluded due to the fact that in the Gauteng climate they can easily boil the
water creating a health hazard and shortening the life of the SWH. 62
Indirect systems are systems that include a form of heat exchanger so that they collector panel can be used with
anti-freeze (gycol) to prevent freezing in the cold winter periods. 63
Based on prices supplied on the Eskom List of SABS approved Solar water heating suppliers available at
http://www.eskomdsm.co.za/?q=swh_supplierslist 64
Based on prices for the City of Cape Town Kuyasa project in Cape Town and the Western Cape SWH programme as
well as industry price reductions at scale.
65 Agama Energy, Baseline Study Solar Energy in South Africa 66
Holm 2005, Market Survey of Solar Water Heating in South Africa, Agama Energy, Baseline Study Solar Energy in
South Africa 67
Based on interviews with low-income households that have had SWHs installed in Kuyasa and Stellenbosch
68 At an electricity tariff of around R0.60 per kWh for mid and high income households as will be charged in the City
of Johannesburg in 2010 for metered customers on life line conventional or on average for three part seasonal tariff
customers and R0.80/kWh for low-income households with prepaid electricity, City of Johannesburg Schedule of
Tariffs For 2009/10
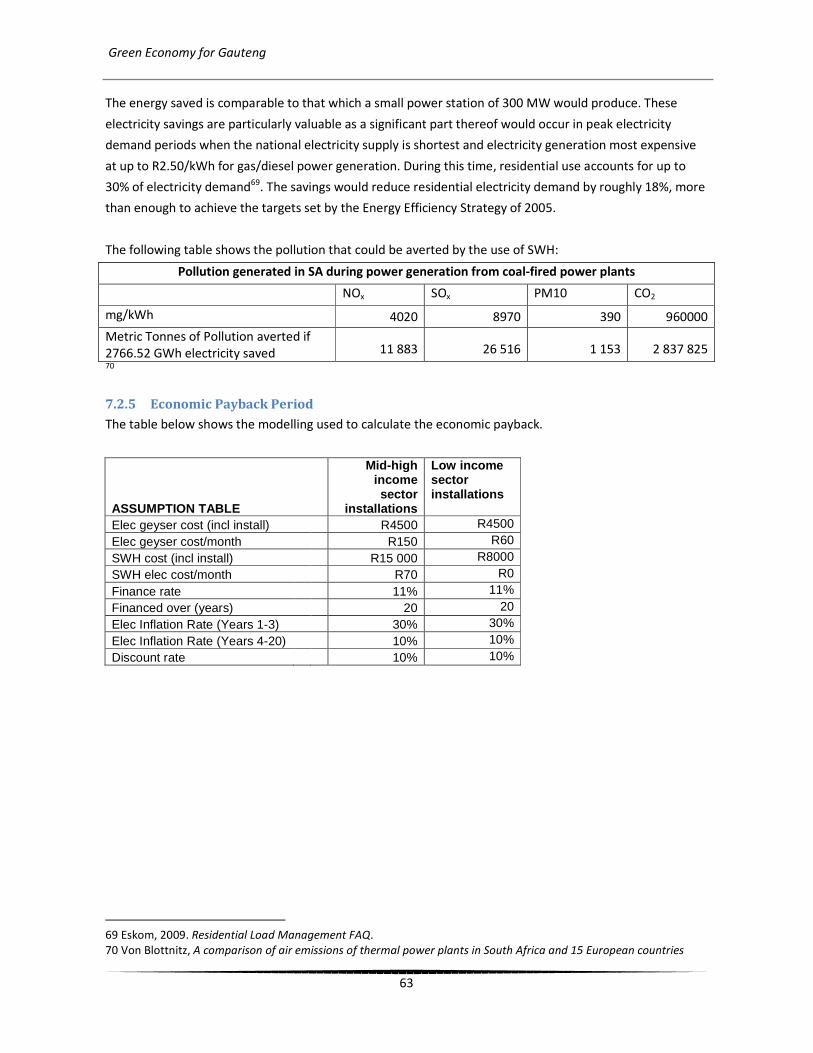
Green Economy for Gauteng
63
The energy saved is comparable to that which a small power station of 300 MW would produce. These
electricity savings are particularly valuable as a significant part thereof would occur in peak electricity
demand periods when the national electricity supply is shortest and electricity generation most expensive
at up to R2.50/kWh for gas/diesel power generation. During this time, residential use accounts for up to
30% of electricity demand69. The savings would reduce residential electricity demand by roughly 18%, more
than enough to achieve the targets set by the Energy Efficiency Strategy of 2005.
The following table shows the pollution that could be averted by the use of SWH:
Pollution generated in SA during power generation from coal-fired power plants
NOx SOx PM10 CO2
mg/kWh 4020 8970 390 960000
Metric Tonnes of Pollution averted if
2766.52 GWh electricity saved 11 883 26 516 1 153 2 837 825 70
7.2.5 Economic Payback Period
The table below shows the modelling used to calculate the economic payback.
ASSUMPTION TABLE
Mid-high income sector
installations
Low income sector installations
Elec geyser cost (incl install) R4500 R4500
Elec geyser cost/month R150 R60
SWH cost (incl install) R15 000 R8000
SWH elec cost/month R70 R0
Finance rate 11% 11%
Financed over (years) 20 20
Elec Inflation Rate (Years 1-3) 30% 30%
Elec Inflation Rate (Years 4-20) 10% 10%
Discount rate 10% 10%
69 Eskom, 2009. Residential Load Management FAQ.
70 Von Blottnitz, A comparison of air emissions of thermal power plants in South Africa and 15 European countries
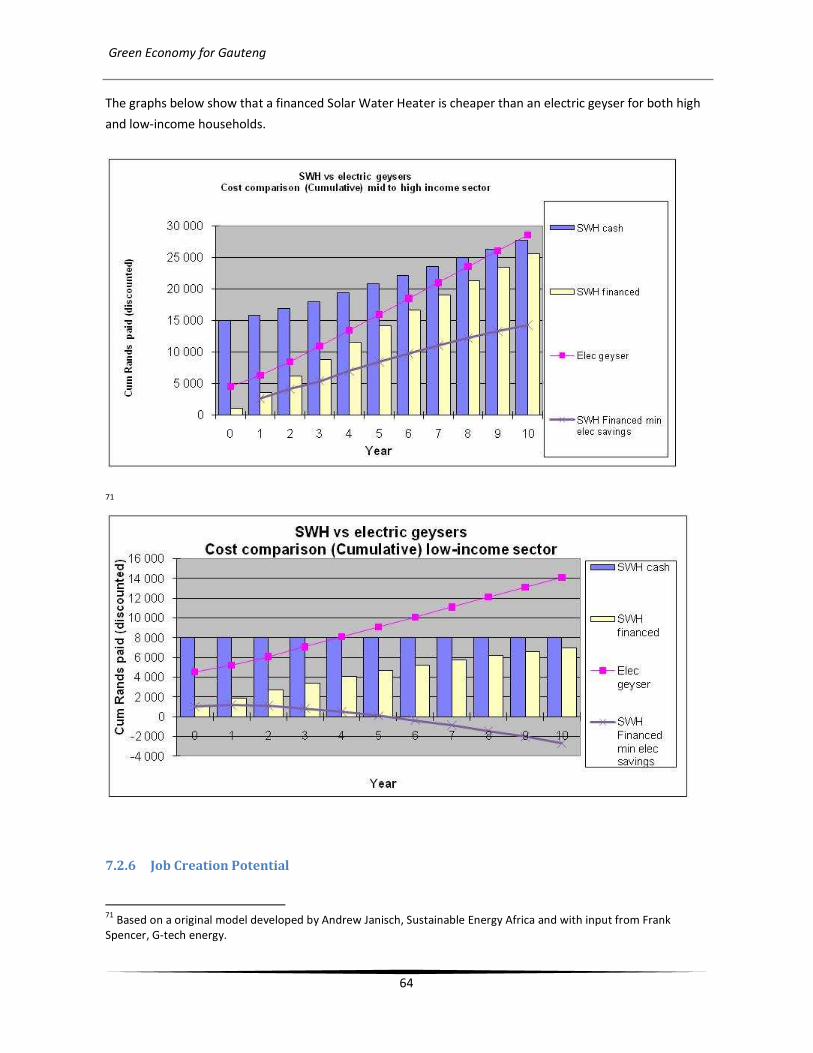
Green Economy for Gauteng
64
The graphs below show that a financed Solar Water Heater is cheaper than an electric geyser for both high
and low-income households.
71
7.2.6 Job Creation Potential
71
Based on a original model developed by Andrew Janisch, Sustainable Energy Africa and with input from Frank
Spencer, G-tech energy.

Green Economy for Gauteng
65
The SWH industry can provide 15 jobs/MWth of installed nominal capacity for locally manufactured
systems and 8 jobs/MWth of installed nominal capacity for imported systems72
. The nominal capacity of
SWHs in South Africa is taken as73 0.7 kWth/m2. In his Market Survey of Solar Water Heating in South Africa
Holm finds that the SWH industry can potentially grow at 26% per annum.
Based on these assumptions supporting the development of the SWH industry in Gauteng has the
potential to create up to 6700 jobs if the largest possible portion of systems is sourced locally. Refer to
the table at the end of this section for a proposed rollout strategy that would maximise the number of jobs
created whilst still achieving the rollout targets. In terms of creating a green economy and achieving
maximum economic potential it is essential that the local industry be supported as imported systems
create almost 50% less direct jobs. With sustained government support local production costs can be
expected to fall by 20-30% for each doubling of output74
and the industry could eventually become a major
export industry catering primarily for the low-income market in Southern Africa. As local production
capacity and the domestic and export markets grow the industry could generate valuable revenue for
Gauteng province and create more jobs.
7.2.7 Potential of Carbon Financing
The sale of avoided CO2 emissions through Certified Emission Reduction Certificates (CERs) provides a
potential additional source of funding for SWH rollout programmes in the low-income sector. Due to
uncertainty after the Copenhagen climate change conference the price of CER credits has fallen to around
€8/tonne75 of CO2 on European markets. The table below provides a breakdown of the possible discounted
value of income that could be received from the sale of carbon credits through a SWH initiative in low-
income communities.
Potential carbon credit revenue from low-income sector installations
Year 2010 2011 2012 2013 2014 2015 2016 2017
Cumulative nr of
Installations 0 13333 28400 45651 65653 88775 109947 136624
MWh of electricity
saved per annum 0 10864 23140 37196 53494 72334 89585 111321
Potential carbon credit
revenue discounted
(mil Rand)76
R 0.0 R 0.9 R 1.7 R 2.5 R 3.3 R 4.0 R 4.5 R 5.1
Year 2018 2019 2020 2021 2022 2023 2024 2025
Cumulative nr of
Installations 170236 212588 265952 333190 416523 499856 583190 666523
72
Based on data provided by Agama Energy, Employment Potential of Renewable Energy In South Africa 73
Figure provided by The European Solar Thermal Industry Federation (ESTIF) and the IEA SHC Programme in Holm, Market Survey of Solar Water Heating in South Africa 74
Holm, Market Survey of Solar Water Heating in South Africa
Carbon Positive, Carbon markets 2010: Modest hopes for recovery 76
Based on an exchange rate of R11/€1
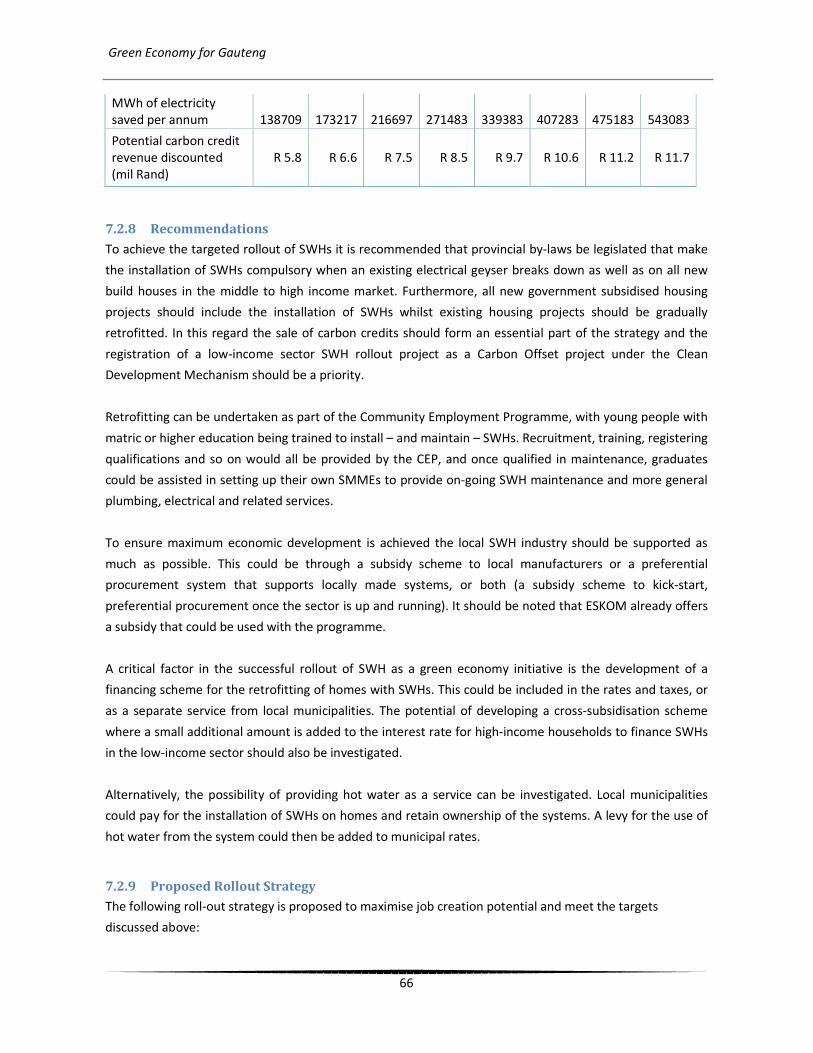
Green Economy for Gauteng
66
MWh of electricity
saved per annum 138709 173217 216697 271483 339383 407283 475183 543083
Potential carbon credit
revenue discounted
(mil Rand)
R 5.8 R 6.6 R 7.5 R 8.5 R 9.7 R 10.6 R 11.2 R 11.7
7.2.8 Recommendations
To achieve the targeted rollout of SWHs it is recommended that provincial by-laws be legislated that make
the installation of SWHs compulsory when an existing electrical geyser breaks down as well as on all new
build houses in the middle to high income market. Furthermore, all new government subsidised housing
projects should include the installation of SWHs whilst existing housing projects should be gradually
retrofitted. In this regard the sale of carbon credits should form an essential part of the strategy and the
registration of a low-income sector SWH rollout project as a Carbon Offset project under the Clean
Development Mechanism should be a priority.
Retrofitting can be undertaken as part of the Community Employment Programme, with young people with
matric or higher education being trained to install – and maintain – SWHs. Recruitment, training, registering
qualifications and so on would all be provided by the CEP, and once qualified in maintenance, graduates
could be assisted in setting up their own SMMEs to provide on-going SWH maintenance and more general
plumbing, electrical and related services.
To ensure maximum economic development is achieved the local SWH industry should be supported as
much as possible. This could be through a subsidy scheme to local manufacturers or a preferential
procurement system that supports locally made systems, or both (a subsidy scheme to kick-start,
preferential procurement once the sector is up and running). It should be noted that ESKOM already offers
a subsidy that could be used with the programme.
A critical factor in the successful rollout of SWH as a green economy initiative is the development of a
financing scheme for the retrofitting of homes with SWHs. This could be included in the rates and taxes, or
as a separate service from local municipalities. The potential of developing a cross-subsidisation scheme
where a small additional amount is added to the interest rate for high-income households to finance SWHs
in the low-income sector should also be investigated.
Alternatively, the possibility of providing hot water as a service can be investigated. Local municipalities
could pay for the installation of SWHs on homes and retain ownership of the systems. A levy for the use of
hot water from the system could then be added to municipal rates.
7.2.9 Proposed Rollout Strategy
The following roll-out strategy is proposed to maximise job creation potential and meet the targets
discussed above:

Green Economy for Gauteng
67
Assumption Table
Average collector size for high income households 2.3m2
Average collector size for low income households 1.5 m2
Nominal Power capacity of SWHs in South Africa per m2
collector area77
0.7 kWth/ m2
Jobs created by locally manufactured SWH systems per MW capacity78 15/MWth
Jobs created by imported SWH systems per MW capacity79
8/MWth
Existing maximum manufacturing and installation capacity of South African SWH
industry80
50 000m2/annum
Potential growth rate of SWH industry81
26%
77
Figure provided by The European Solar Thermal Industry Federation (ESTIF) and the IEA SHC Programme in Holm,
Market Survey of Solar Water Heating in South Africa 78
Based on data provided by Agama Energy, Employment Potential of Renewable Energy In South Africa 79
ibid 80
Based on data provided in the Draft South African National Solar Water Heating Framework and Implementation
Plan and on the research findings of Holm, Market Survey of Solar Water Heating in South Africa, that there exists
significant excess capacity amongst South African SWH manufacturers 81
Holm, Market Survey of Solar Water Heating in South Africa
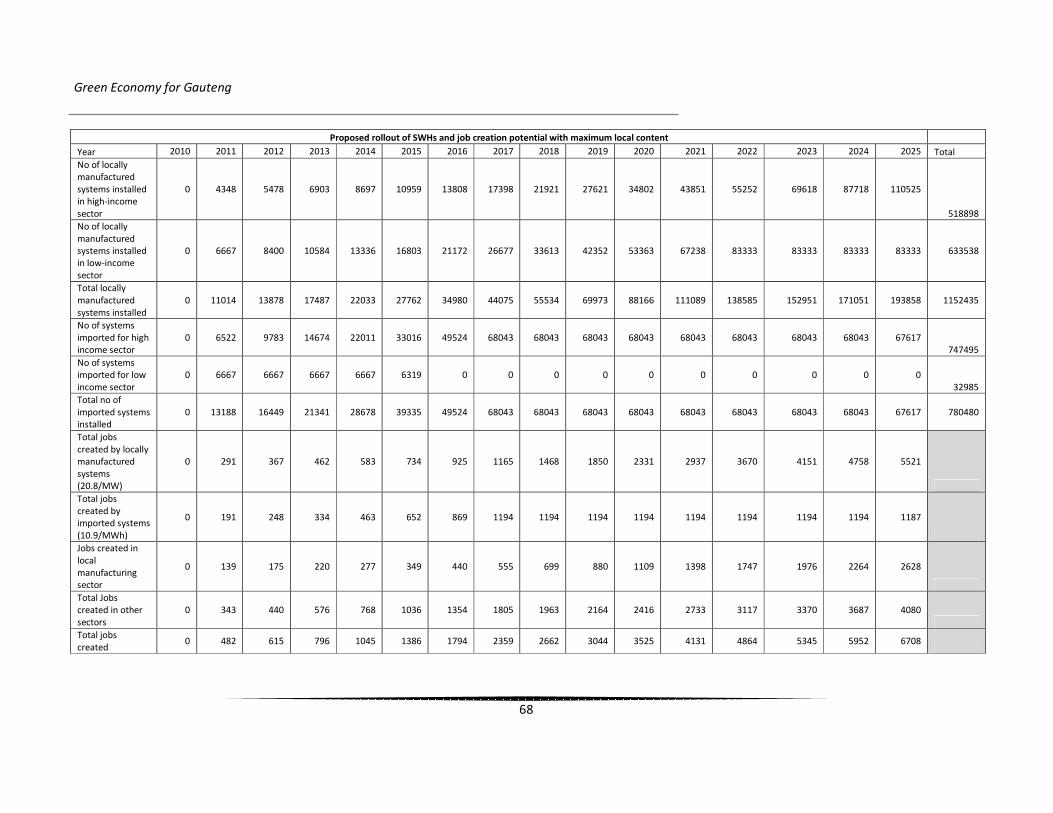
Green Economy for Gauteng
68
Proposed rollout of SWHs and job creation potential with maximum local content
Year 2010 2011 2012 2013 2014 2015 2016 2017 2018 2019 2020 2021 2022 2023 2024 2025 Total
No of locally
manufactured
systems installed
in high-income
sector
0 4348 5478 6903 8697 10959 13808 17398 21921 27621 34802 43851 55252 69618 87718 110525
518898
No of locally
manufactured
systems installed
in low-income
sector
0 6667 8400 10584 13336 16803 21172 26677 33613 42352 53363 67238 83333 83333 83333 83333 633538
Total locally
manufactured
systems installed
0 11014 13878 17487 22033 27762 34980 44075 55534 69973 88166 111089 138585 152951 171051 193858 1152435
No of systems
imported for high
income sector
0 6522 9783 14674 22011 33016 49524 68043 68043 68043 68043 68043 68043 68043 68043 67617
747495
No of systems
imported for low
income sector
0 6667 6667 6667 6667 6319 0 0 0 0 0 0 0 0 0 0
32985
Total no of
imported systems
installed
0 13188 16449 21341 28678 39335 49524 68043 68043 68043 68043 68043 68043 68043 68043 67617 780480
Total jobs
created by locally
manufactured
systems
(20.8/MW)
0 291 367 462 583 734 925 1165 1468 1850 2331 2937 3670 4151 4758 5521
Total jobs
created by
imported systems
(10.9/MWh)
0 191 248 334 463 652 869 1194 1194 1194 1194 1194 1194 1194 1194 1187
Jobs created in
local
manufacturing
sector
0 139 175 220 277 349 440 555 699 880 1109 1398 1747 1976 2264 2628
Total Jobs
created in other
sectors
0 343 440 576 768 1036 1354 1805 1963 2164 2416 2733 3117 3370 3687 4080
Total jobs
created 0 482 615 796 1045 1386 1794 2359 2662 3044 3525 4131 4864 5345 5952 6708
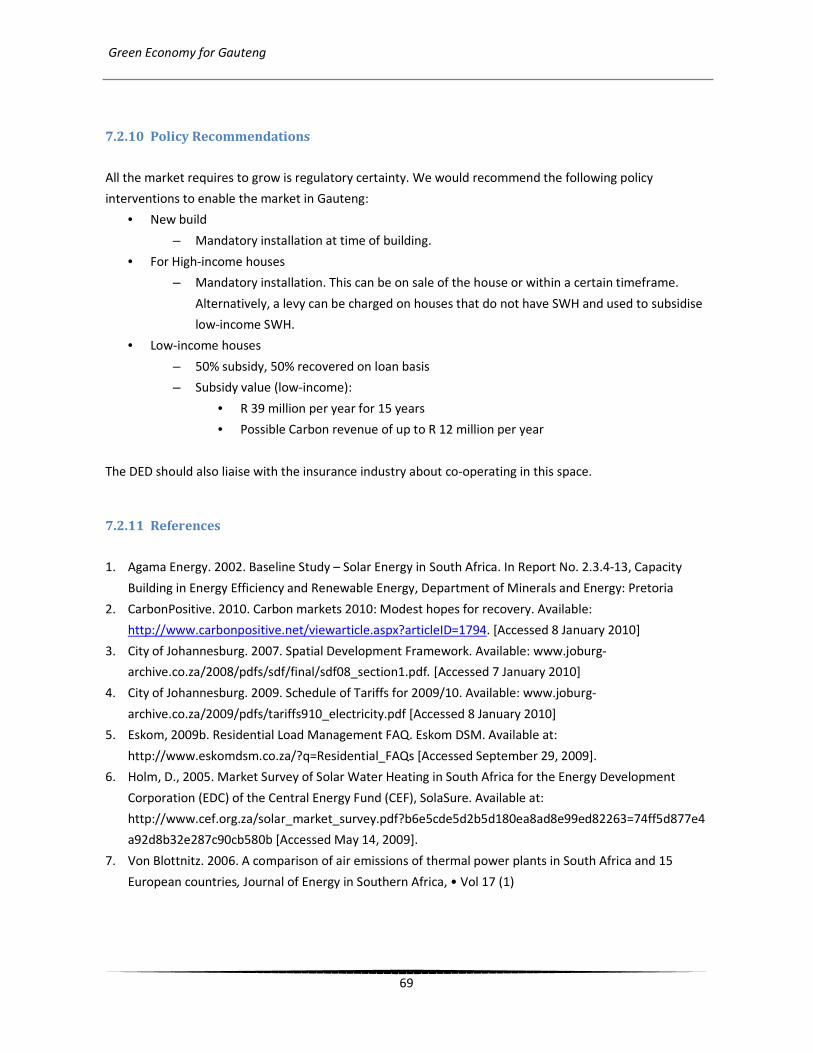
Green Economy for Gauteng
69
7.2.10 Policy Recommendations
All the market requires to grow is regulatory certainty. We would recommend the following policy
interventions to enable the market in Gauteng:
• New build
– Mandatory installation at time of building.
• For High-income houses
– Mandatory installation. This can be on sale of the house or within a certain timeframe.
Alternatively, a levy can be charged on houses that do not have SWH and used to subsidise
low-income SWH.
• Low-income houses
– 50% subsidy, 50% recovered on loan basis
– Subsidy value (low-income):
• R 39 million per year for 15 years
• Possible Carbon revenue of up to R 12 million per year
The DED should also liaise with the insurance industry about co-operating in this space.
7.2.11 References
1. Agama Energy. 2002. Baseline Study – Solar Energy in South Africa. In Report No. 2.3.4-13, Capacity
Building in Energy Efficiency and Renewable Energy, Department of Minerals and Energy: Pretoria
2. CarbonPositive. 2010. Carbon markets 2010: Modest hopes for recovery. Available:
http://www.carbonpositive.net/viewarticle.aspx?articleID=1794. [Accessed 8 January 2010]
3. City of Johannesburg. 2007. Spatial Development Framework. Available: www.joburg-
archive.co.za/2008/pdfs/sdf/final/sdf08_section1.pdf. [Accessed 7 January 2010]
4. City of Johannesburg. 2009. Schedule of Tariffs for 2009/10. Available: www.joburg-
archive.co.za/2009/pdfs/tariffs910_electricity.pdf [Accessed 8 January 2010]
5. Eskom, 2009b. Residential Load Management FAQ. Eskom DSM. Available at:
http://www.eskomdsm.co.za/?q=Residential_FAQs [Accessed September 29, 2009].
6. Holm, D., 2005. Market Survey of Solar Water Heating in South Africa for the Energy Development
Corporation (EDC) of the Central Energy Fund (CEF), SolaSure. Available at:
http://www.cef.org.za/solar_market_survey.pdf?b6e5cde5d2b5d180ea8ad8e99ed82263=74ff5d877e4
a92d8b32e287c90cb580b [Accessed May 14, 2009].
7. Von Blottnitz. 2006. A comparison of air emissions of thermal power plants in South Africa and 15
European countries, Journal of Energy in Southern Africa, • Vol 17 (1)

Green Economy for Gauteng
70
7.3 Energy Efficiency
7.3.1 Summary of findings
A 20% Energy Efficiency target could create over 10400 jobs, add R 640 million to labour income, reduce
yearly expenditure on energy by over R16 billion / year with additional investment in equipment at around
R10 billion / year. Provincial spend for a programme to enable would be around R13 million/year.
7.3.2 Introduction
Between 1973 and 2005 energy efficiency has already saved up to 58% of what was actually consumed, as
illustrated in the following graph. There are still tremendous improvements that can be achieved in this
space. “Energy efficiency may be the farthest-reaching, certainly the least-polluting, and clearly the fastest-
growing energy success story of the last 40 years. The irony is that it is also the most invisible, the least
understood, and in serious danger of being overlooked as the most cost-effective and economically viable
opportunity for addressing the challenges of climate change and maintaining a strong economy”82
Figure 7: Long Term Energy Savings from Improvements in Energy Efficiency
832
“The benefits of more efficient use of energy are well known and include reduced investments in energy
infrastructure, lower fossil fuel dependency, increased competitiveness and improved consumer welfare.
Efficiency gains can also deliver environmental benefits by reducing greenhouse gas emissions and local air
pollution.”84
82
Laitner, “Understanding the size of the energy efficiency resource,” 351. 83
IEA, Worldwide Trends in Energy Use and Efficiency, 26. 84
Ibid., 3.

Green Economy for Gauteng
71
Case study: USD654,350 investment in energy efficiency programs by the City of San Jose stimulated
USD8.5 million in private sector investment. The City estimated that over an 11-year period, this would
increase net employment by 1753 jobs, generate USD33 million incremental wages and salaries, and
increase local spending by USD20.8 million.85
The traditional way of creating energy capacity is to create more supply. However, this can also be achieved
by reducing demand. If the two options are compared, then energy efficiency compared to conventional
energy86
:
• Costs les per MWh
• Creates more jobs at less cost
• Stimulates more economic activity (Oil = 1.5x, Electricity 1.75x Energy Efficiency = 2.25x)
• Energy intensity is the measure of energy consumption per unit of GDP and is an indicator of
energy efficiency.
7.3.3 Energy Intensity
The graph alongside shows that while many countries
are reducing their energy intensity – China and India
massively so –the energy intensity of South Africa
actually increased between 2000 and 2005. In the
graph, low scores are good, high scores (which equate
with high intensity) are not good.
Thus there is tremendous potential in South Africa to
create jobs and stimulate the economy through
Energy Efficiency. A South African study showed “a 5%
increase in electricity efficiency in 2010 would lead to
a net increase of some 39 000 jobs and labour income
of about R 624 million.”87
“The benefits of industrial energy efficiency in South
Africa include significant reductions in local air
pollutants; improved environmental health; creation
of additional jobs; reduced electricity demand; and
85
Lee and Denlay, Demand Side Management: Energy Efficiency Potential in South Australia. 86
Ibid., 16-17. 87
Winkler, “Energy policies for sustainable development in South Africa’s residential and electricity sectors,” 76.
Figure 8: Energy Intensity as a function of GDP
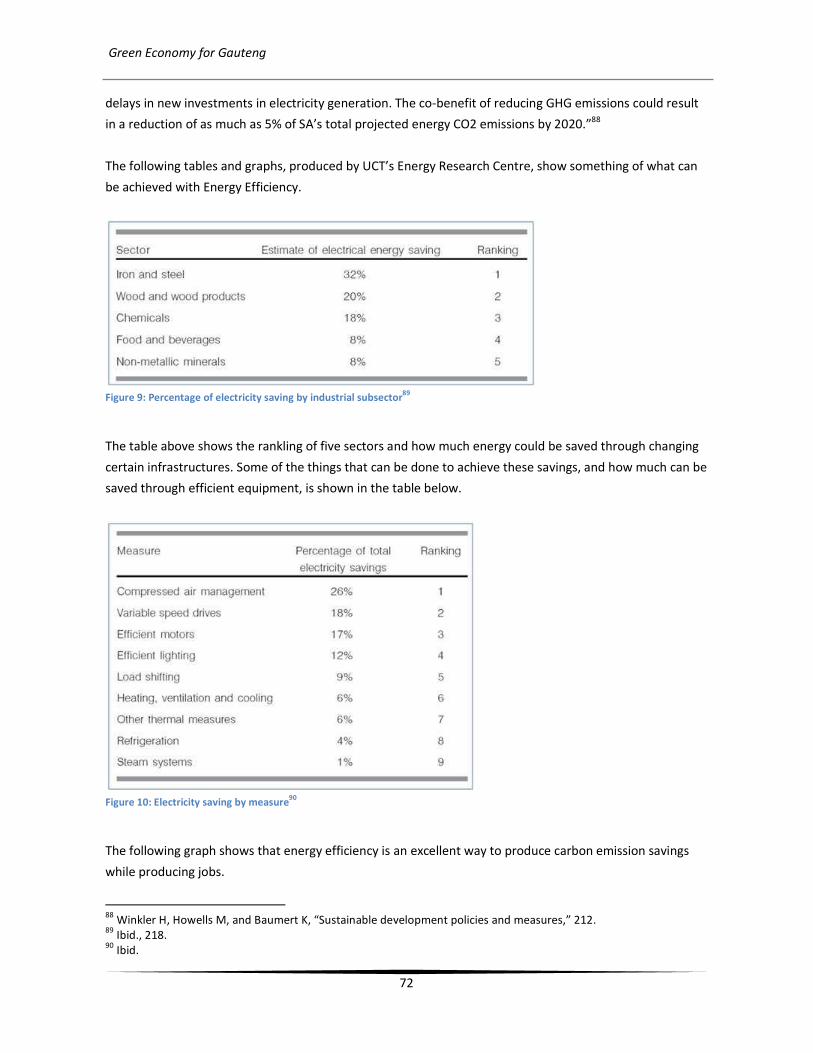
Green Economy for Gauteng
72
delays in new investments in electricity generation. The co-benefit of reducing GHG emissions could result
in a reduction of as much as 5% of SA’s total projected energy CO2 emissions by 2020.”88
The following tables and graphs, produced by UCT’s Energy Research Centre, show something of what can
be achieved with Energy Efficiency.
Figure 9: Percentage of electricity saving by industrial subsector
89
The table above shows the rankling of five sectors and how much energy could be saved through changing
certain infrastructures. Some of the things that can be done to achieve these savings, and how much can be
saved through efficient equipment, is shown in the table below.
Figure 10: Electricity saving by measure
90
The following graph shows that energy efficiency is an excellent way to produce carbon emission savings
while producing jobs.
88
Winkler H, Howells M, and Baumert K, “Sustainable development policies and measures,” 212. 89
Ibid., 218. 90
Ibid.
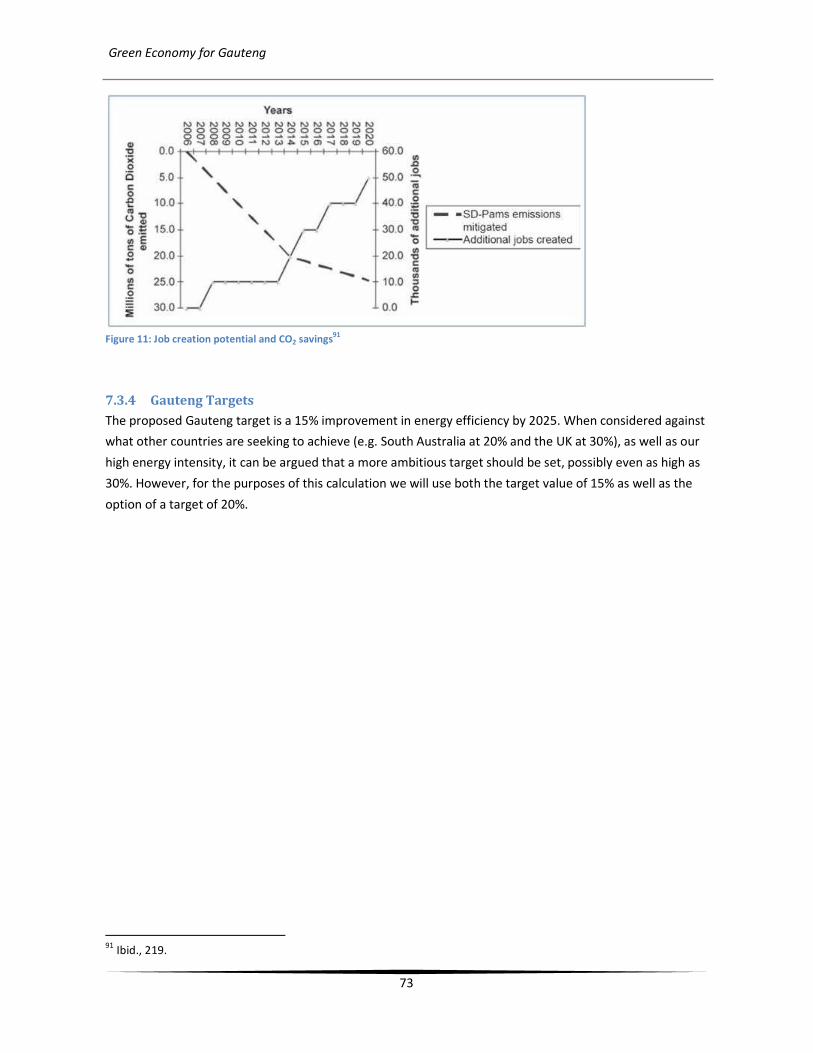
Green Economy for Gauteng
73
Figure 11: Job creation potential and CO2 savings
91
7.3.4 Gauteng Targets
The proposed Gauteng target is a 15% improvement in energy efficiency by 2025. When considered against
what other countries are seeking to achieve (e.g. South Australia at 20% and the UK at 30%), as well as our
high energy intensity, it can be argued that a more ambitious target should be set, possibly even as high as
30%. However, for the purposes of this calculation we will use both the target value of 15% as well as the
option of a target of 20%.
91
Ibid., 219.

Green Economy for Gauteng
74
7.3.5 Calculations
The table below shows what can be achieved in terms of growth through energy efficiency.
15% Target 2025 20% Target 2025
Business-As-Usual Gauteng Energy
Consumption 202592
999.5 PJ 999.5 PJ
Energy saved through efficiency 149.9 PJ saved in 2025 199.9 PJ saved in 2025
Energy cost saved93 R 12 billion / year R 16 billion / year
Jobs creation potential 50 jobs/PJ94
50 jobs/PJ95
Jobs created by 2025 7,500 minimum 10,400 minimum
Monthly salary per technician R 5000 R 5000
Total yearly salary revenue in economy R 450 million R 624 million
Total asset expenditure on energy
efficiency equipment in economy
Approx R7.5 billion per year Approx R10 billion/year
Economic return on energy efficient
initiatives
Typically 2x on investment over
4-6 years.
Typically 2x on investment
over 4-6 years.
Estimated cost to Province to establish
programme96
R 10 million / year R 13 million / year
7.3.6 Economic Interventions
Possible interventions in the Energy Efficiency space include:
• Enable municipalities to be rewarded for driving energy reduction rather than for sales of
electricity. This model has been successfully applied in California.
• Educating energy users to the savings that can be achieved through energy efficiency.
• Implementing compulsory Energy Efficiency Standards.
• Providing access to finance for energy efficient equipment.
7.3.7 Specific Energy Efficiency Interventions
92
Dept of Local Gov & Housing, Gauteng Integrated Energy Strategy, 48. 93
Assuming the low value of R0,30 per kWh 94
Lee and Denlay, Demand Side Management: Energy Efficiency Potential in South Australia. 95
Ibid. 96
Assuming a large programme to drive policy, create awareness of energy efficiency and promote skills training in
energy efficiency. Figures estimate.
Green Economy for Gauteng
75
The following specific energy efficiency interventions in various sectors could be promoted:
• Industrial sector97
:
o Variable speed drives: These drives reduce unnecessary power consumption in electrical
motors with varying loads
o Efficient motors: These motors are available at higher cost. Efficient motors can reduce
power consumption, but may require modifications because running speeds are generally
higher than for inefficient motors.
o Compressed air management: This measure is easily achieved and often results in
significant savings at low cost.
o Efficient lighting: These measures take advantage of natural lighting, more efficient light
bulbs and appropriate task lighting
o Heating, ventilation and cooling: These measures are for maintaining good air quality and
temperature and can commonly be improved through better maintenance and the
installation of appropriate equipment.
o Thermal saving: Thermal saving refers to more efficient use and production of heat. For
steam systems in particular we consider condensate recovery and improved maintenance.
• Commercial sector
o Energy efficient windows
o Insulation
o Better managed air infiltration and cool -> hot air heat exchange.
o Advanced air-conditioning and HVAC systems
o Efficient Lighting
o Green IT
• Residential sector
o Supply & install energy efficient lights ( e.g. CFLs) to replace incandescent bulbs;
o Installing ceilings and other no-cost measures to improve the thermal efficiency of the
buildings (e.g. proper orientation on the site);
o Promote more efficient appliances (e.g. refrigerators);
o Switch from electricity and/or paraffin to LPG for cooking;
o Energy efficient water heating (low-pressure solar water heaters).
• Transport Sector
o Switch from cars to mass transport systems (rail, bus rapid)
Each of these initiatives usually has commercially viable paybacks. What is needed is business education
about this as well as the right financing infrastructure for the asset equipment.
97
Howells and Lainter, Industrial Efficiency as an Economic Development Strategy for South Africa, 51.

Green Economy for Gauteng
76
7.4 Concentrated Solar Power Industry
7.4.1 Summary of Findings
The following figures are based on meeting the proposed 16% Renewable target for Gauteng from
predominantly Concentrated Solar Power (CSP).
Total amount of CSP (with 6 hours storage) to be installed if a 16% electricity
from Renewables by 2025 are to be achieved 1413 GW
Estimated total cost of CSP plants to be build by IPPs R 90.5 billion
Total conventional electricity saved per year 5.2 TWh/a
Carbon emissions averted per year (metric ton) 4 378 248 tons
Current CSP REFIT (Parabolic Trough with 6 h storage) R 2.10/kWh
Total new permanent jobs on CSP power plants 1000
Number of jobs for permanent construction team (assuming 100 MW of CSP
is constructed per year) 900
Indirect jobs in the Gauteng province due to CSP plants being build 4000 new jobs
per year Figure 12: Summary of CSP Industry
In addition, the price of electricity with 16% CSP is likely to be less expensive than that of 100% fossil fuel
based electricity in the residential sector by 2025: R3.88/kWh for 100% coal vs R3.59/kWh for 84% coal and
16% CSP98.
7.4.2 Introduction and potential of CSP within the Gauteng Province
Concentrated Solar Power (CSP) refers to the method of generating electricity by concentrating the power
of the sun. A typical CSP plant is 50 MW or above in size. Storage of up to 7.5 full load hours has been
proved commercially in Europe in the past few years. Most CSP technologies incorporate a certain
percentage (up to 15 % is allowed under the SA REFIT) of backup fuel for overcast periods. Combining
storage with backup fuel results in CSP becoming a dispatchable source of green electricity.
In two recent reports (Energy Research Centre, 2007; Banks and Schäffler, 2005) the implementation of
large concentrating solar power (CSP) plants has been proposed as one of the main contributors to
greenhouse gas emission reductions in South Africa.
Fluri (2009) identified provinces in South Africa with good potential for the implementation of large-scale
concentrating solar power plants using geographic information systems. The following criteria were taken
into account: solar resource, proximity to transmission lines, land use profile and slope. The potential sites
identified are located in the Northern Cape, the Free State, the Western Cape and, to a minor degree, the
98
It should be noted that an accelerated CSP programme with a larger portion of Renewables could be even cheaper
than this.
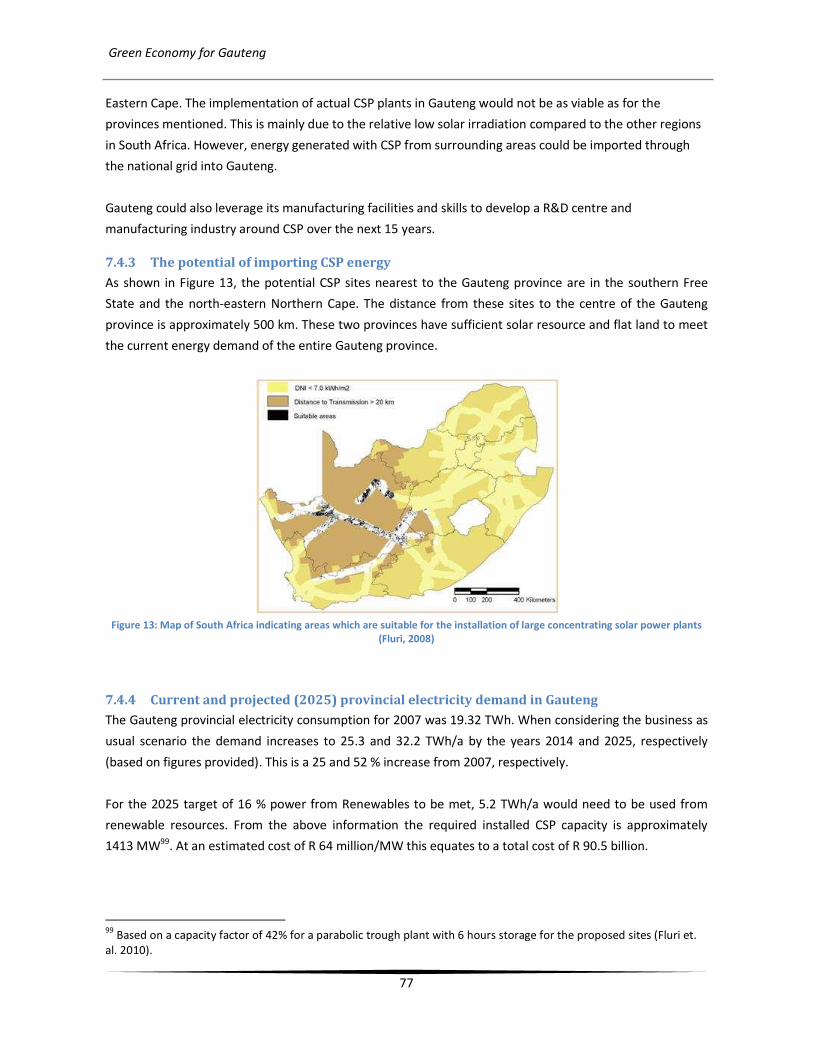
Green Economy for Gauteng
77
Eastern Cape. The implementation of actual CSP plants in Gauteng would not be as viable as for the
provinces mentioned. This is mainly due to the relative low solar irradiation compared to the other regions
in South Africa. However, energy generated with CSP from surrounding areas could be imported through
the national grid into Gauteng.
Gauteng could also leverage its manufacturing facilities and skills to develop a R&D centre and
manufacturing industry around CSP over the next 15 years.
7.4.3 The potential of importing CSP energy
As shown in Figure 13, the potential CSP sites nearest to the Gauteng province are in the southern Free
State and the north-eastern Northern Cape. The distance from these sites to the centre of the Gauteng
province is approximately 500 km. These two provinces have sufficient solar resource and flat land to meet
the current energy demand of the entire Gauteng province.
Figure 13: Map of South Africa indicating areas which are suitable for the installation of large concentrating solar power plants
(Fluri, 2008)
7.4.4 Current and projected (2025) provincial electricity demand in Gauteng
The Gauteng provincial electricity consumption for 2007 was 19.32 TWh. When considering the business as
usual scenario the demand increases to 25.3 and 32.2 TWh/a by the years 2014 and 2025, respectively
(based on figures provided). This is a 25 and 52 % increase from 2007, respectively.
For the 2025 target of 16 % power from Renewables to be met, 5.2 TWh/a would need to be used from
renewable resources. From the above information the required installed CSP capacity is approximately
1413 MW99. At an estimated cost of R 64 million/MW this equates to a total cost of R 90.5 billion.
99
Based on a capacity factor of 42% for a parabolic trough plant with 6 hours storage for the proposed sites (Fluri et.
al. 2010).
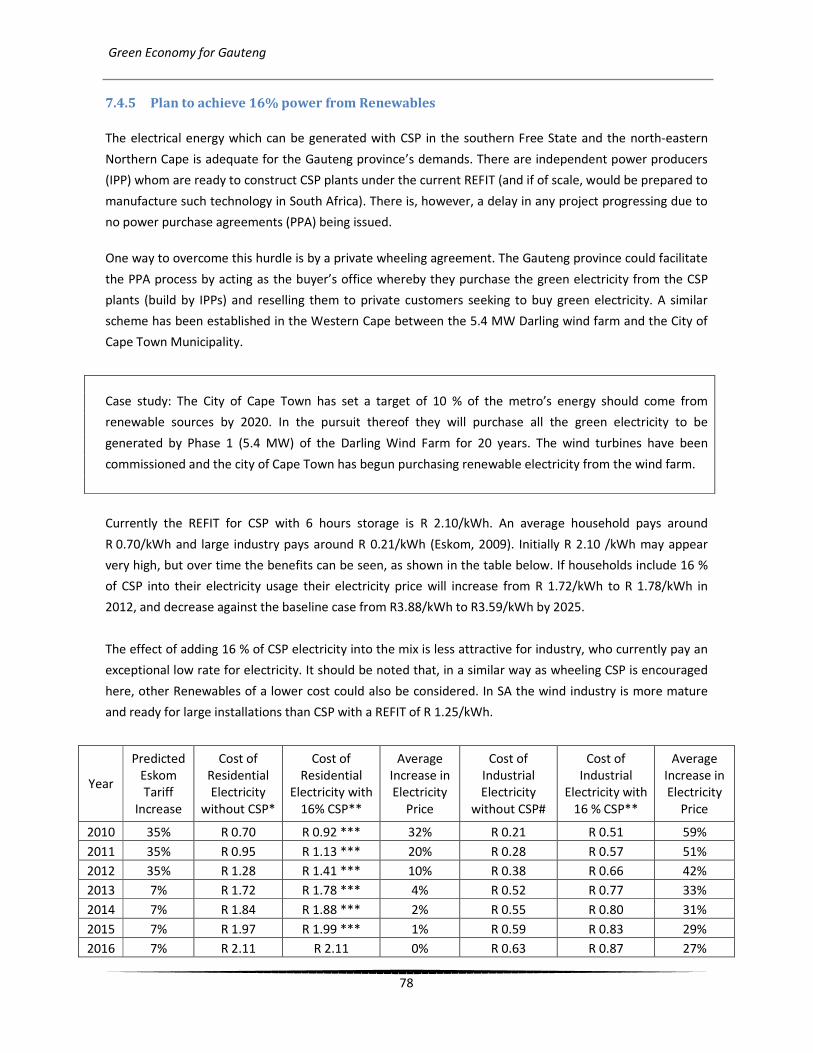
Green Economy for Gauteng
78
7.4.5 Plan to achieve 16% power from Renewables
The electrical energy which can be generated with CSP in the southern Free State and the north-eastern
Northern Cape is adequate for the Gauteng province’s demands. There are independent power producers
(IPP) whom are ready to construct CSP plants under the current REFIT (and if of scale, would be prepared to
manufacture such technology in South Africa). There is, however, a delay in any project progressing due to
no power purchase agreements (PPA) being issued.
One way to overcome this hurdle is by a private wheeling agreement. The Gauteng province could facilitate
the PPA process by acting as the buyer’s office whereby they purchase the green electricity from the CSP
plants (build by IPPs) and reselling them to private customers seeking to buy green electricity. A similar
scheme has been established in the Western Cape between the 5.4 MW Darling wind farm and the City of
Cape Town Municipality.
Case study: The City of Cape Town has set a target of 10 % of the metro’s energy should come from
renewable sources by 2020. In the pursuit thereof they will purchase all the green electricity to be
generated by Phase 1 (5.4 MW) of the Darling Wind Farm for 20 years. The wind turbines have been
commissioned and the city of Cape Town has begun purchasing renewable electricity from the wind farm.
Currently the REFIT for CSP with 6 hours storage is R 2.10/kWh. An average household pays around
R 0.70/kWh and large industry pays around R 0.21/kWh (Eskom, 2009). Initially R 2.10 /kWh may appear
very high, but over time the benefits can be seen, as shown in the table below. If households include 16 %
of CSP into their electricity usage their electricity price will increase from R 1.72/kWh to R 1.78/kWh in
2012, and decrease against the baseline case from R3.88/kWh to R3.59/kWh by 2025.
The effect of adding 16 % of CSP electricity into the mix is less attractive for industry, who currently pay an
exceptional low rate for electricity. It should be noted that, in a similar way as wheeling CSP is encouraged
here, other Renewables of a lower cost could also be considered. In SA the wind industry is more mature
and ready for large installations than CSP with a REFIT of R 1.25/kWh.
Year
Predicted
Eskom
Tariff
Increase
Cost of
Residential
Electricity
without CSP*
Cost of
Residential
Electricity with
16% CSP**
Average
Increase in
Electricity
Price
Cost of
Industrial
Electricity
without CSP#
Cost of
Industrial
Electricity with
16 % CSP**
Average
Increase in
Electricity
Price
2010 35% R 0.70 R 0.92 *** 32% R 0.21 R 0.51 59%
2011 35% R 0.95 R 1.13 *** 20% R 0.28 R 0.57 51%
2012 35% R 1.28 R 1.41 *** 10% R 0.38 R 0.66 42%
2013 7% R 1.72 R 1.78 *** 4% R 0.52 R 0.77 33%
2014 7% R 1.84 R 1.88 *** 2% R 0.55 R 0.80 31%
2015 7% R 1.97 R 1.99 *** 1% R 0.59 R 0.83 29%
2016 7% R 2.11 R 2.11 0% R 0.63 R 0.87 27%

Green Economy for Gauteng
79
2017 7% R 2.26 R 2.23 -1% R 0.68 R 0.90 25%
2018 7% R 2.42 R 2.37 -2% R 0.72 R 0.94 23%
2019 7% R 2.58 R 2.51 -3% R 0.78 R 0.99 21%
2020 7% R 2.77 R 2.66 -4% R 0.83 R 1.03 20%
2021 7% R 2.96 R 2.82 -5% R 0.89 R 1.08 18%
2022 7% R 3.17 R 3.00 -5% R 0.95 R 1.13 16%
2023 7% R 3.39 R 3.18 -6% R 1.02 R 1.19 15%
2024 7% R 3.63 R 3.38 -7% R 1.09 R 1.25 13%
2025 7% R 3.88 R 3.59 -7% R 1.16 R 1.31 11% Figure 14: Effect of adding 16 % of CSP power into residential and industrial electricity usage
* Based on the assumption that Municipalities will increase the residential electricity rate with a similar increase as the Eskom tariff
increases, as has been the case in the past few years
# Based on the 2009/2010 Eskom’s Night Save Urban (Large) Tariff
** Based on the REFIT of R 2.10/kWh for all years (no decrease due to increase of global installed capacity no increase due to
inflation)
*** Note that for the first six years CSP power is MORE expensive. This is because of the cost to amortise the investment in asset
infrastructure required.
7.4.6 Cost of CSP vs Coal fired power stations
The cost of Eskom’s 4800 MW Medupi power station has an estimated cost of R 124 billion (Engineering
New, 2009a). This equates to an installed cost of R 25.8 million/MW. The cost for the second new Eskom
power station, Kusile, is likely to be higher. The LEC of new coal is estimated at R 0.48/kWh (Meyer, 2010).
The installed cost for a new 50 MW CSP plant with 6 hours storage is estimated at R 3.2 billion Rand (based
on figures for CSP plants recently constructed in Spain). This equates to R 64 million/MW installed. This
figure is likely to decrease with larger CSP plants and as the total installed capacity of CSP increase over the
next decade. Currently the REFIT for this technology is R 2.10/kWh. It is likely that the REFIT will be adjusted
downwards in the future if the LEC cost of CSP power plants drop.
However, with the escalating prices for fossil fuels and the diminishing LEC for Renewables, specifically CSP,
grid parity (point at which renewable electricity is equal to or cheaper than grid power) will be reached in
the near future. The addition of carbon tax will shorten the time to grid parity. From predicted trends grid
parity for CSP in South Africa is expected by 2016 (Heun et. al., 2010).
7.4.7 Job creation / protection potential
The main conclusion of Fluri’s study (2009) is that there is indeed a huge potential for CSP in the South
Africa. It was also shown that the Gauteng province does not possess significant viable sites for CSP plants
(according to the criteria stipulated in the study). However, Gauteng has the manufacturing capabilities to
have a major share in the local manufacturing of CSP plant components. This could lead to a new industrial
sector which will require human capital ranging from basic labour to highly skilled personnel.
Green Economy for Gauteng
80
In addition to manufacturing, Gauteng could become the hub for CSP in South Africa by stimulating growth.
This could be achieved with the development of specialised institutes and collaboration with local and
international institutes in both the academic and commercial industries.
Initially existing manufacturing capabilities in the province could be utilised to manufacture CSP
components locally e.g. steel structures for the troughs, steam and oil pipes, pumps, molten salt, heat
exchangers, etc. This would only be for components that can currently be manufactured.
As the number of installed CSP plants in SA grew, it would justify the establishing of certain key component
manufacturing in SA. E.g. curves mirror and collector tubes. The province should make it attractive for such
manufacturing facilities to be located within the province. One method of achieving this is through a
dedicated “green” industrial development zone. Such a zone would have incentives like low rent for an
initial period, easy access to transport (e.g. rail), electricity, water and other services. Tax reductions and
lower levies would also be incentives.
Initially such an IDZ would focus on manufacturing but should be grown into a R&D centre. The R&D centre
would then attract additional manufacturing.
At this stage it is difficult to predict the number of jobs such an IDZ would create. As an indication we look
at the CSP industry in the US. A 100 MW CSP planned for Nevada in the US is predicted to create as many as
450 construction jobs for Nevada during the two-year construction period. It will employ 45 permanent
operations staff. It will have an annual operating budget of more than $5.0 million. In addition, up to 4,000
indirect jobs would be created through the use of locally based suppliers and service providers (Renewable
Energy World, 2009).
If we draw in these figures, and we estimate that 100 MW of CSP constructed per year will have their base
in the Gauteng’s Green IDZ, the we can assume the following:
• A team of construction workers of 900 staff will be required in a construction team
• Each year 45 new staff will be appointed on CSP plants
• $ 5 million (About R 40 million) will be budgeted per plant for O&M. This will go to salaries,
consumables (water, backup fuel) and maintenance (spare parts).
• Each new 100 MW plant would attract an investment of R 6.4 billion
7.4.8 Benefits of CSP compared to current energy generation technologies
7.4.8.1 Pollution & carbon-emissions
Currently, South Africa is predominantly dependent on coal as fuel for electricity generation. Approximately
92 % of electricity is generated with coal fired power stations.
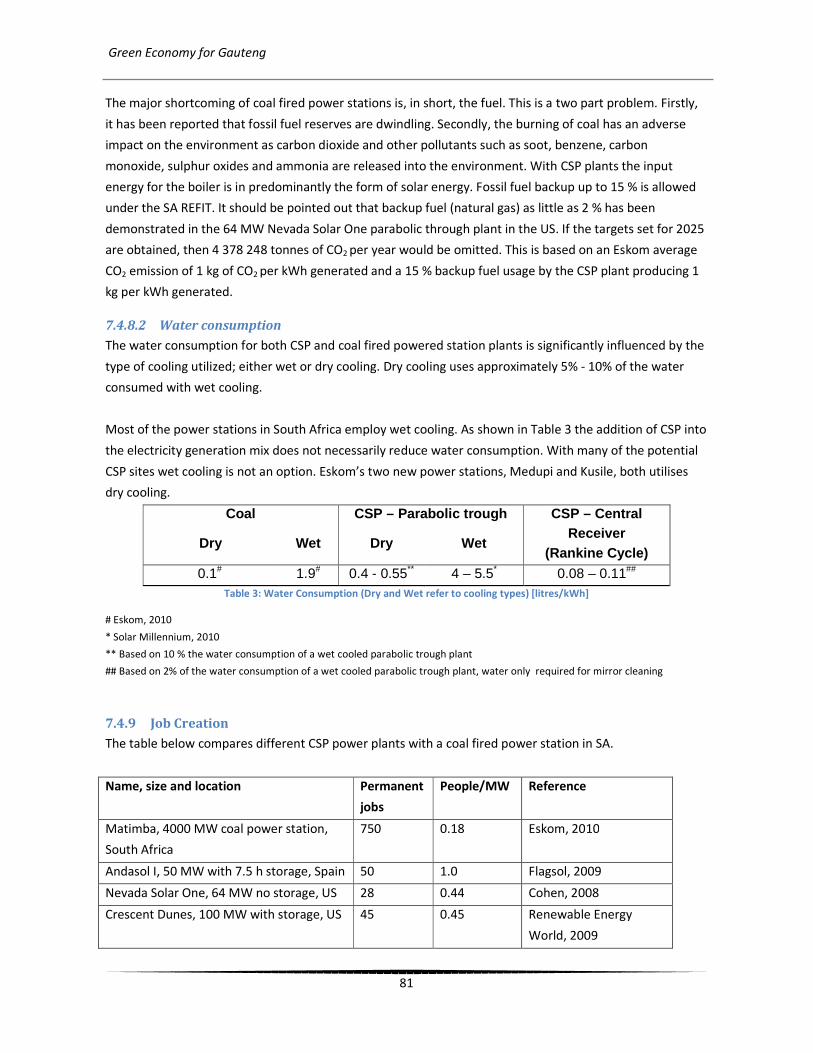
Green Economy for Gauteng
81
The major shortcoming of coal fired power stations is, in short, the fuel. This is a two part problem. Firstly,
it has been reported that fossil fuel reserves are dwindling. Secondly, the burning of coal has an adverse
impact on the environment as carbon dioxide and other pollutants such as soot, benzene, carbon
monoxide, sulphur oxides and ammonia are released into the environment. With CSP plants the input
energy for the boiler is in predominantly the form of solar energy. Fossil fuel backup up to 15 % is allowed
under the SA REFIT. It should be pointed out that backup fuel (natural gas) as little as 2 % has been
demonstrated in the 64 MW Nevada Solar One parabolic through plant in the US. If the targets set for 2025
are obtained, then 4 378 248 tonnes of CO2 per year would be omitted. This is based on an Eskom average
CO2 emission of 1 kg of CO2 per kWh generated and a 15 % backup fuel usage by the CSP plant producing 1
kg per kWh generated.
7.4.8.2 Water consumption
The water consumption for both CSP and coal fired powered station plants is significantly influenced by the
type of cooling utilized; either wet or dry cooling. Dry cooling uses approximately 5% - 10% of the water
consumed with wet cooling.
Most of the power stations in South Africa employ wet cooling. As shown in Table 3 the addition of CSP into
the electricity generation mix does not necessarily reduce water consumption. With many of the potential
CSP sites wet cooling is not an option. Eskom’s two new power stations, Medupi and Kusile, both utilises
dry cooling.
Coal CSP – Parabolic trough CSP – Central Receiver
(Rankine Cycle) Dry Wet Dry Wet
0.1# 1.9# 0.4 - 0.55** 4 – 5.5* 0.08 – 0.11## Table 3: Water Consumption (Dry and Wet refer to cooling types) [litres/kWh]
# Eskom, 2010
* Solar Millennium, 2010
** Based on 10 % the water consumption of a wet cooled parabolic trough plant
## Based on 2% of the water consumption of a wet cooled parabolic trough plant, water only required for mirror cleaning
7.4.9 Job Creation
The table below compares different CSP power plants with a coal fired power station in SA.
Name, size and location Permanent
jobs
People/MW Reference
Matimba, 4000 MW coal power station,
South Africa
750 0.18 Eskom, 2010
Andasol I, 50 MW with 7.5 h storage, Spain 50 1.0 Flagsol, 2009
Nevada Solar One, 64 MW no storage, US 28 0.44 Cohen, 2008
Crescent Dunes, 100 MW with storage, US 45 0.45 Renewable Energy
World, 2009

Green Economy for Gauteng
82
Study, 100 MW plant 94 0.94 Stoddard, 2004
Table 7-4 Permanent jobs in power stations
From these figures it can be seen that CSP plants employ more people per MW than coal fired power
station. It could be argued that a smaller power plant will employ more people per MW, but CSP plants are
smaller in size compared to coal power plants. The largest CSP plant in operation is currently a 80 MW
parabolic through plant in the US.
Based on the figures above it is estimated the 1413 MW CSP required will employ about 1000 permanent
people.
Green Economy for Gauteng
83
7.4.10 References
Banks,D.,Schäffler,J.,2005, The Potential contribution of Renewable Energy in South Africa, Earth life Africa,
Johannesburg, South Africa
Cohen, GE, 2008, Solar Steam at Nevada Solar One, SolarPaces 2008, Las Vegas,NV
Eskom, 2010, data downloaded from the Eskom website: www.eskom.co.za
Energy Research Centre, 2007. Long Term Mitigation Scenarios: Technical Report, Prepared by H. Winkler,
Department of Environment Affairs and Tourism, Pretoria, South Africa.
Engineering News, 2009a, R124bn Medupi price tag another indication of Kusile’s vulnerability as Eskom
finalises tariff request, 27 November 2009, Available online:
www.engineeringnews.co.za/article/r124bn-medupi-price-tag-another-indication-of-kusiles-
vulnerability-as-eskom-finalises-tariff-request-2009-11-27
Flagsol, 2009, data downloaded from the Flagsol website: http://www.flagsol-gmbh.com
Fluri, TP, 2009, The potential of concentrating solar power in South Africa, Energy Policy 37 (2009) p 5075–
5080
Fluri, TP, Palmer, D, Meyer, AJ, van Nieker, JL and von Backstrom, TW, 2010, CSP for MeerKAT/SKA
Technology Review and Outlook, Centre for Renewable and Sustainable Energy Studies, Stellenbosch
University
Heun, M, Meyer, AJ, Fluri, TP, 2010, Solar Power for MeerKAT/SKA - Economics Modeling, Centre for
Renewable and Sustainable Energy Studies, Stellenbosch University
Meyer, 2010, Simple model to predict electricity cost for Eskom’s Medupi power station, Centre for
Renewable and Sustainable Energy Studies, Stellenbosch University
Solar Millenium, 2010, The parabolic trough power plants Andasol 1 to 3, The largest solar power plants in
the world – Technology premiere in Europe, Available Online:
http://www.solarmillennium.de/upload/Download/Technologie/eng/Andasol1-3engl.pdf
Stoddard, L, Abiecunas, J, O'Connell , R, 2006, Economic, Energy, and Environmental Benefits of
Concentrating Solar Power in California, Subcontract Report NREL/SR-550-39291, April 2006
Renewable Energy World, 2009, SolarReserve & NV Energy Sign 100-MW CSP Deal, 23 December 2009,
Available online: www.renewableenergyworld.com/rea/news/article/2009/12/solarreserve-nv-energy-
sign-100-mw-csp-deal

Green Economy for Gauteng
84
7.5 Water & Sanitation
7.5.1 Introduction
This review of water related issues aims to identify strategic areas in which Gauteng DED, as part of its
green agenda, can engage to mobilise activities that:
• Enhance sustainability
• Promote economic development, including, specifically
• Create jobs; and
• Support effective service provision.
For the purposes of the review, a distinction is made between the water services (water supply and
sanitation) and water resources (water found in rivers, reservoirs and underground).
The situation in each of these domains is reviewed, institutional responsibility and current programmes of
activity and intervention delineated and specific challenges and opportunities identified.
7.5.2 Context
Gauteng is responsible for a high proportion of South Africa’s economic product and home to more
than 20% of the country’s population but generates only a small proportion of the country’s water
resources. Total estimated “runoff” from the province is less than current piped water use.
An important initial consideration is that of existing mandates.
Water services (water supply and sanitation – water in pipes) are mainly the responsibility of municipalities.
The province is fortunate in having two regional water service organisations (Rand Water and the East Rand
Water Care Company ERWAT) which provide high quality bulk services. The implications of the recent
transfer of responsibilities for sanitation to the National Department of Human Settlements are not yet
clear. However, the expressed intention of this Department to ensure that a sustainable water approach
built into every new housing projects that receives housing subsidies may create useful opportunities for
innovation.
Water resource management (water in rivers, dams and underground), including the allocation of water,
licensing of discharge and regulation of quality is the responsibility of the national Department of Water
Affairs.
Provincial government currently has a limited direct role, related to the housing function (see above) and
some environmental functions which impact on pollution. However, development strategy for which the
province is responsible has a significant impact on the water environment and water management.
There is worldwide interest in the identification of appropriate strategies for countries an communities to
meet their water challenges. A report recently prepared by the McKinsey consultancy for the IFC and a
group of multinational companies detailed some of these. In general, it found that there were many
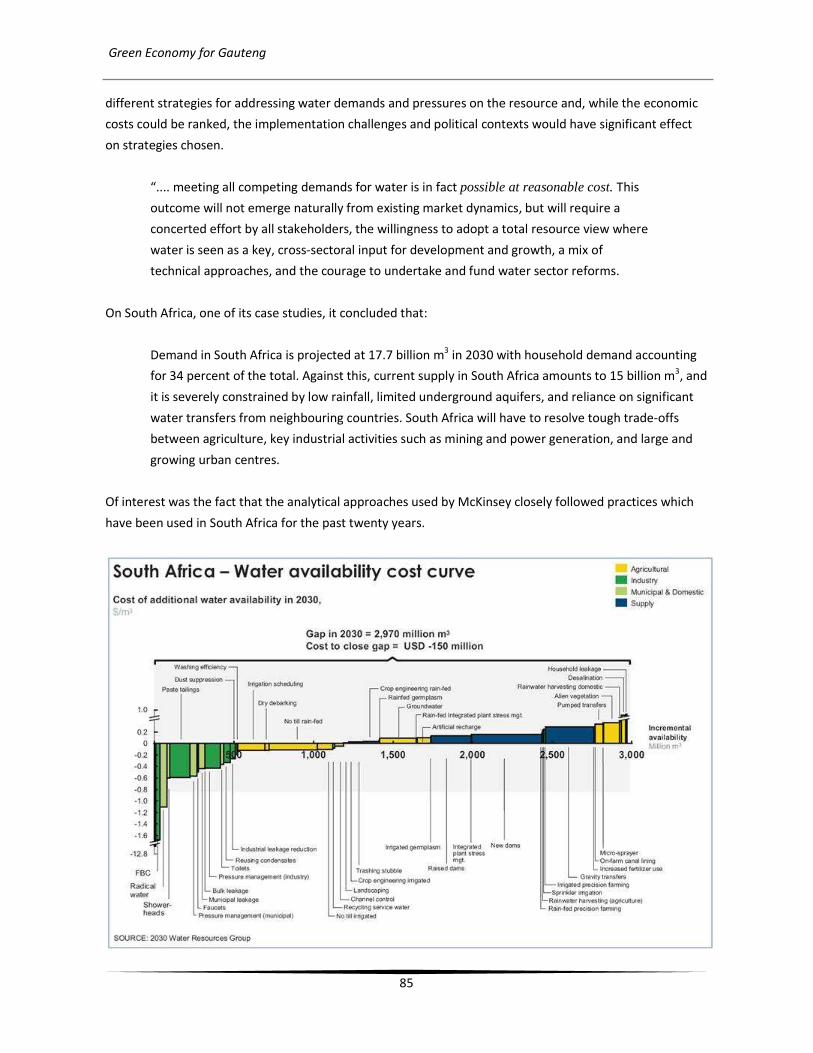
Green Economy for Gauteng
85
different strategies for addressing water demands and pressures on the resource and, while the economic
costs could be ranked, the implementation challenges and political contexts would have significant effect
on strategies chosen.
“.... meeting all competing demands for water is in fact possible at reasonable cost. This
outcome will not emerge naturally from existing market dynamics, but will require a
concerted effort by all stakeholders, the willingness to adopt a total resource view where
water is seen as a key, cross-sectoral input for development and growth, a mix of
technical approaches, and the courage to undertake and fund water sector reforms.
On South Africa, one of its case studies, it concluded that:
Demand in South Africa is projected at 17.7 billion m3 in 2030 with household demand accounting
for 34 percent of the total. Against this, current supply in South Africa amounts to 15 billion m3, and
it is severely constrained by low rainfall, limited underground aquifers, and reliance on significant
water transfers from neighbouring countries. South Africa will have to resolve tough trade-offs
between agriculture, key industrial activities such as mining and power generation, and large and
growing urban centres.
Of interest was the fact that the analytical approaches used by McKinsey closely followed practices which
have been used in South Africa for the past twenty years.
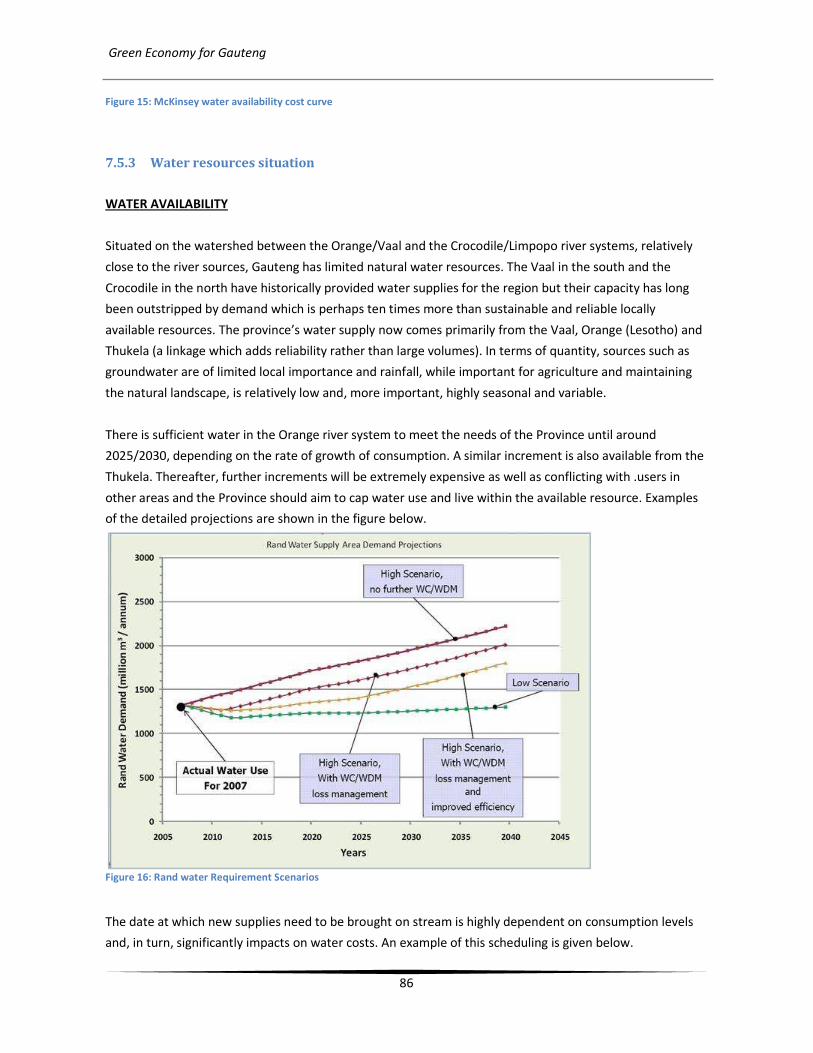
Green Economy for Gauteng
86
Figure 15: McKinsey water availability cost curve
7.5.3 Water resources situation
WATER AVAILABILITY
Situated on the watershed between the Orange/Vaal and the Crocodile/Limpopo river systems, relatively
close to the river sources, Gauteng has limited natural water resources. The Vaal in the south and the
Crocodile in the north have historically provided water supplies for the region but their capacity has long
been outstripped by demand which is perhaps ten times more than sustainable and reliable locally
available resources. The province’s water supply now comes primarily from the Vaal, Orange (Lesotho) and
Thukela (a linkage which adds reliability rather than large volumes). In terms of quantity, sources such as
groundwater are of limited local importance and rainfall, while important for agriculture and maintaining
the natural landscape, is relatively low and, more important, highly seasonal and variable.
There is sufficient water in the Orange river system to meet the needs of the Province until around
2025/2030, depending on the rate of growth of consumption. A similar increment is also available from the
Thukela. Thereafter, further increments will be extremely expensive as well as conflicting with .users in
other areas and the Province should aim to cap water use and live within the available resource. Examples
of the detailed projections are shown in the figure below.
Figure 16: Rand water Requirement Scenarios
The date at which new supplies need to be brought on stream is highly dependent on consumption levels
and, in turn, significantly impacts on water costs. An example of this scheduling is given below.

Green Economy for Gauteng
87
Figure 17: New water supply scheduling
Much of the water imported into the province is treated and discharged to neighbouring provinces where it
is reused.. The major part of the flow in the Crocodile river, a tributary to the Limpopo derives from water
used in Gauteng. Additional quantities of wastewater are earmarked for the expansion of the coal-based
industries of north west Limpopo Province. Current perspectives on the two sub-catchments in which
Gauteng falls (Crocodile River West and Upper Vaal) are contained in the DWA’s National Water Resource
Strategy (2004) which is scheduled to be revised in 2010.
WATER QUALITY
The quality of water resources in the Province is generally poor in all areas downstream of the Vaal Dam as
well as in the Crocodile river catchment. This is a function of the low volumes of water, the high levels of
urban, industrial and mining activity and poor management of some urban services. Key quality challenges
are:
• biological pollution (largely sewage from domestic services) which has health impacts but also
causes algae growth and “eutrophication” of rivers and dams
• chemical pollution (from mines and other industries) primarily that leading to overall high water
salinity that, if it reaches excessive levels, renders water unusable without desalination
“Water quality in the Vaal River and in some tributaries downstream of Vaal Dam is seriously
affected by urban and industrial and mining return flows and the intensive mining activity. The
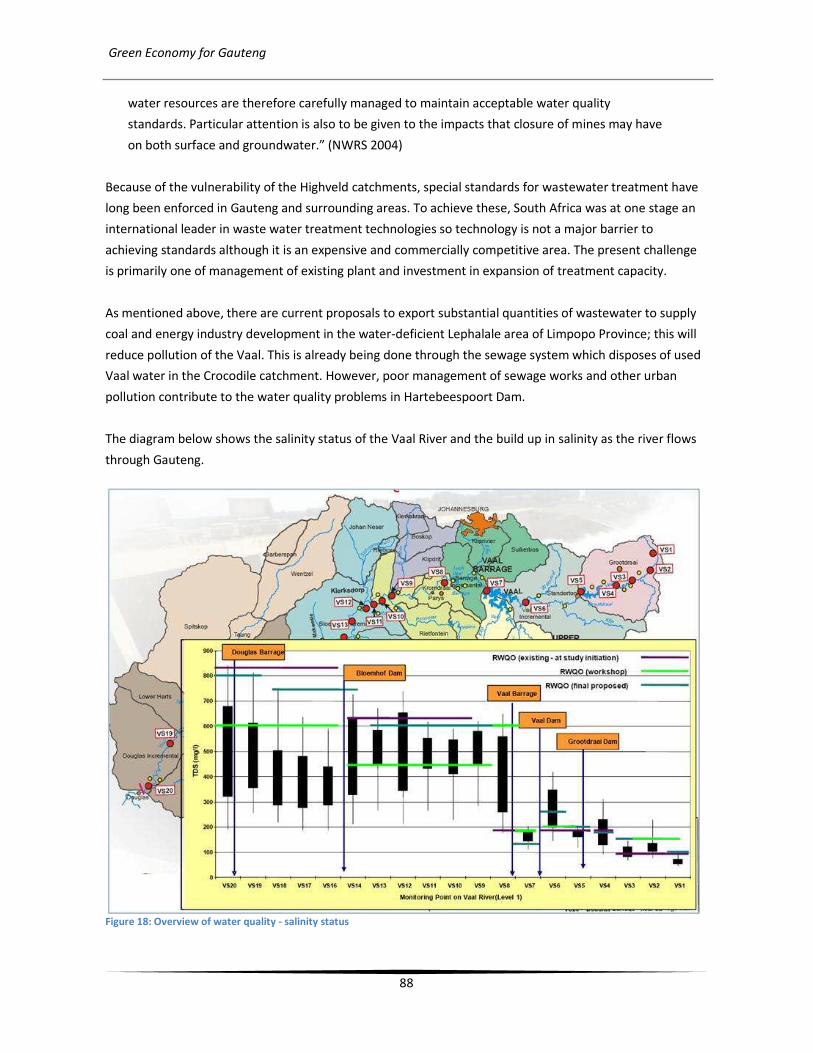
Green Economy for Gauteng
88
water resources are therefore carefully managed to maintain acceptable water quality
standards. Particular attention is also to be given to the impacts that closure of mines may have
on both surface and groundwater.” (NWRS 2004)
Because of the vulnerability of the Highveld catchments, special standards for wastewater treatment have
long been enforced in Gauteng and surrounding areas. To achieve these, South Africa was at one stage an
international leader in waste water treatment technologies so technology is not a major barrier to
achieving standards although it is an expensive and commercially competitive area. The present challenge
is primarily one of management of existing plant and investment in expansion of treatment capacity.
As mentioned above, there are current proposals to export substantial quantities of wastewater to supply
coal and energy industry development in the water-deficient Lephalale area of Limpopo Province; this will
reduce pollution of the Vaal. This is already being done through the sewage system which disposes of used
Vaal water in the Crocodile catchment. However, poor management of sewage works and other urban
pollution contribute to the water quality problems in Hartebeespoort Dam.
The diagram below shows the salinity status of the Vaal River and the build up in salinity as the river flows
through Gauteng.
Figure 18: Overview of water quality - salinity status

Green Economy for Gauteng
89
7.5.4 Overview of water quality status
IMPLICATIONS FOR ECONOMIC DEVELOPMENT
At a strategic level, it is critical that water constraints are recognised by all sectors and guide the economic
and social development of the Province. “Wet” and polluting industries should be discouraged and
emphasis placed on low water intensity/high productivity knowledge and service industries. The
recreational, tourism and property value of clean water resources should be recognised as well as the
impact of economic and social activities in the province on neighbouring communities.
Water services situation
WATER SUPPLY
The Province has high levels of coverage with water supply which meet basic standards. According to the
department of water affairs, which regulates water services, in April 2009, only 30212 people (9622
households) were reported to have no water supply infrastructure, out of a population of 10 900 000
people (3410 000 households).
190 500 people (60 100 households) were reported to be with access below basic minimum standards
which were set at the basic level of the RDP. These were mainly in Johannesburg (83 000 / 27320) and
Ekurhuleni (69 000 / 21 810).
In terms of the affordability of access, free basic water is in place in all the municipalities of Gauteng,
operating in parallel with indigency systems.
Traditional definitions of unaccounted for water include:
• water taken and used but not metered or paid for,
o including leaks and waste on unmetered private properties
• leakage from the public distribution system
UAW levels vary greatly from municipality to municipality and between areas within municipalities.
Estimates range from 19% in Ekurhuleni (although it is not clear whether all losses are included) to 33.6% in
Johannesburg (where the Phiri Constitutional Court challenge to the municipality’s approach to metering
was blamed for a 2% deterioration in the UAW levels). Effective and sustained reduction of UAW depends
on the implementation of management systems which can monitor and respond to consumption patterns.
All municipalities are required to have water conservation/demand management programmes but these
have generally not achieved the targets set.
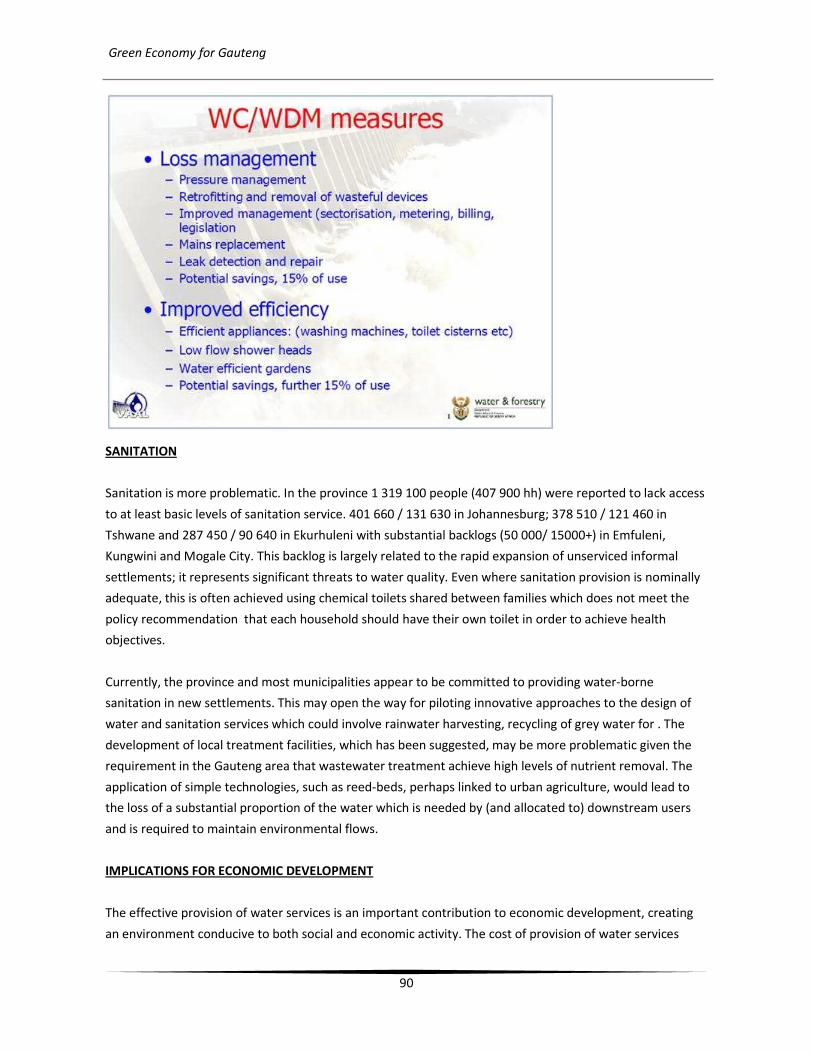
Green Economy for Gauteng
90
SANITATION
Sanitation is more problematic. In the province 1 319 100 people (407 900 hh) were reported to lack access
to at least basic levels of sanitation service. 401 660 / 131 630 in Johannesburg; 378 510 / 121 460 in
Tshwane and 287 450 / 90 640 in Ekurhuleni with substantial backlogs (50 000/ 15000+) in Emfuleni,
Kungwini and Mogale City. This backlog is largely related to the rapid expansion of unserviced informal
settlements; it represents significant threats to water quality. Even where sanitation provision is nominally
adequate, this is often achieved using chemical toilets shared between families which does not meet the
policy recommendation that each household should have their own toilet in order to achieve health
objectives.
Currently, the province and most municipalities appear to be committed to providing water-borne
sanitation in new settlements. This may open the way for piloting innovative approaches to the design of
water and sanitation services which could involve rainwater harvesting, recycling of grey water for . The
development of local treatment facilities, which has been suggested, may be more problematic given the
requirement in the Gauteng area that wastewater treatment achieve high levels of nutrient removal. The
application of simple technologies, such as reed-beds, perhaps linked to urban agriculture, would lead to
the loss of a substantial proportion of the water which is needed by (and allocated to) downstream users
and is required to maintain environmental flows.
IMPLICATIONS FOR ECONOMIC DEVELOPMENT
The effective provision of water services is an important contribution to economic development, creating
an environment conducive to both social and economic activity. The cost of provision of water services

Green Economy for Gauteng
91
represents a substantial proportion of municipal budgets and is thus a determinant of municipal viability.
Two linked threats to ongoing service provision are the extent to which services are subsidised and the
pace of ongoing system investment and replacement. If funding for social provision undermines investment
budgets, the ongoing ability of systems to provide reliable services will be compromised.
7.5.5 Strategic issues
Although they are all linked, a distinction continues to be made between water supply and waste water
disposal; as well as the water resource and water-related areas where failure to act will prejudice (or where
action could benefit) the people of the Province.
Water resource issues
Economic development focal points.
• Assured supply of adequate bulk water is critical for the development of the Province. This requires
action on the demand side as well as on the supply side. While the supply side has been
successfully managed to date by DWA in cooperation with Rand Water and TCTA, the water
conservation/demand management activities, the responsibility of the municipalities, have
generally failed to achieve their targets.
• Recreational use of water is an important economic opportunity that is being lost at present
o International sporting competitions at a purpose-built site on Roodeplaat dam outside
Pretoria were cancelled, due to pollution. This also impacts on the Province’s efforts to
develop the Dinokeng leisure and tourism opportunities;
o recreational use and real estate potential of the Vaal in Emfuleni is recognised as a
significant opportunity; it is severely constrained by the fact that water in the Vaal river
between the barrage and Vaal Dam is often not safe for use.
o Recreational use of Hartebeespoort dam is impacted upon by pollution from Gauteng.
• In general, water pollution increases costs for other users. This principally affects users
downstream of Gauteng but their constrained development may impact on the province.
• Pollution from mining sources is a complex problem. Although related to the closure of old mines,
much of the pollution is currently “mobilised” by ongoing mining activities – pumping of surplus
water to enable mining to take place generates substantial flows through old workings. The
profitability of marginal mining companies is closely linked to their pumping and treatment costs.
While significant volumes of pollution originate inside Gauteng, its impact is primarily on
neighbouring provinces. An exception is the growing pollution from coal mining in Mpumalanga
which is impacting on quality in the Upper Vaal catchment.
• In the south east of the province, extensive wetlands (some artificially created by mining activity)
perform an important function in mitigating pollution from urban and mining activities. They also
represent a natural attraction and some are formally declared nature reserves and need to be
protected from development.

Green Economy for Gauteng
92
DED would have a clear mandate to promote remedial action in these areas.
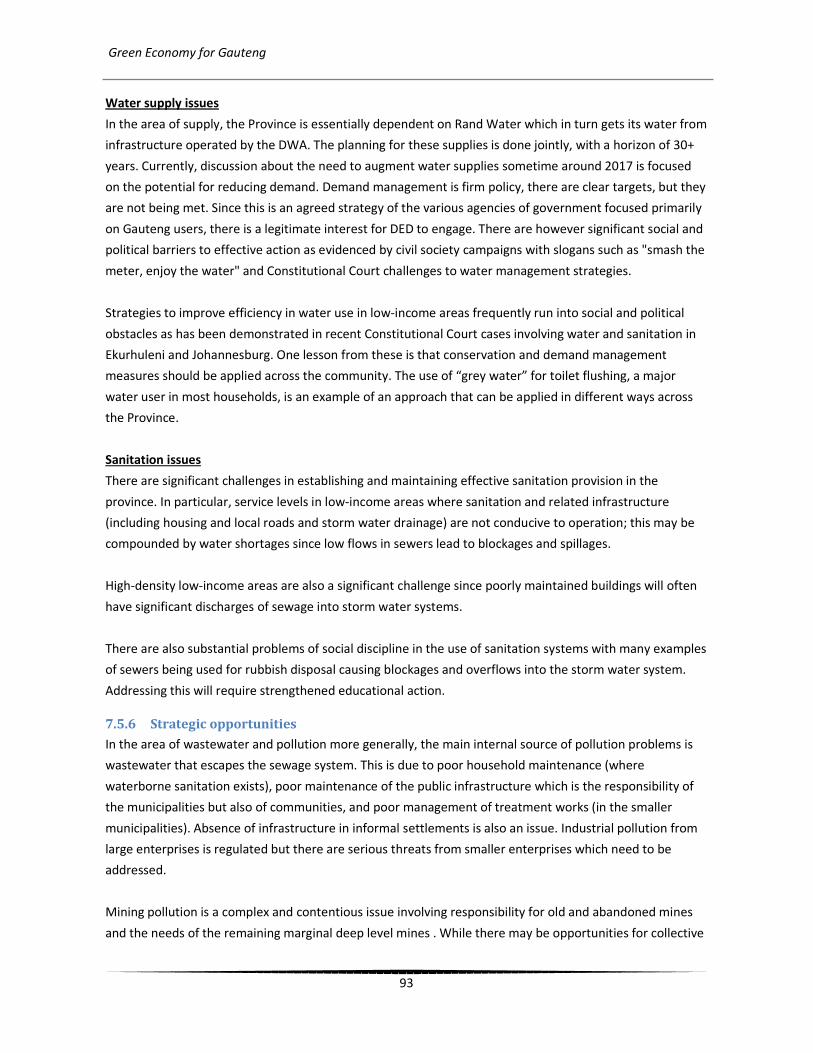
Green Economy for Gauteng
93
Water supply issues
In the area of supply, the Province is essentially dependent on Rand Water which in turn gets its water from
infrastructure operated by the DWA. The planning for these supplies is done jointly, with a horizon of 30+
years. Currently, discussion about the need to augment water supplies sometime around 2017 is focused
on the potential for reducing demand. Demand management is firm policy, there are clear targets, but they
are not being met. Since this is an agreed strategy of the various agencies of government focused primarily
on Gauteng users, there is a legitimate interest for DED to engage. There are however significant social and
political barriers to effective action as evidenced by civil society campaigns with slogans such as "smash the
meter, enjoy the water" and Constitutional Court challenges to water management strategies.
Strategies to improve efficiency in water use in low-income areas frequently run into social and political
obstacles as has been demonstrated in recent Constitutional Court cases involving water and sanitation in
Ekurhuleni and Johannesburg. One lesson from these is that conservation and demand management
measures should be applied across the community. The use of “grey water” for toilet flushing, a major
water user in most households, is an example of an approach that can be applied in different ways across
the Province.
Sanitation issues
There are significant challenges in establishing and maintaining effective sanitation provision in the
province. In particular, service levels in low-income areas where sanitation and related infrastructure
(including housing and local roads and storm water drainage) are not conducive to operation; this may be
compounded by water shortages since low flows in sewers lead to blockages and spillages.
High-density low-income areas are also a significant challenge since poorly maintained buildings will often
have significant discharges of sewage into storm water systems.
There are also substantial problems of social discipline in the use of sanitation systems with many examples
of sewers being used for rubbish disposal causing blockages and overflows into the storm water system.
Addressing this will require strengthened educational action.
7.5.6 Strategic opportunities
In the area of wastewater and pollution more generally, the main internal source of pollution problems is
wastewater that escapes the sewage system. This is due to poor household maintenance (where
waterborne sanitation exists), poor maintenance of the public infrastructure which is the responsibility of
the municipalities but also of communities, and poor management of treatment works (in the smaller
municipalities). Absence of infrastructure in informal settlements is also an issue. Industrial pollution from
large enterprises is regulated but there are serious threats from smaller enterprises which need to be
addressed.
Mining pollution is a complex and contentious issue involving responsibility for old and abandoned mines
and the needs of the remaining marginal deep level mines . While there may be opportunities for collective

Green Economy for Gauteng
94
action to address the problem (as opposed to more rigorous regulation of existing polluters) this needs to
be carefully and objectively assessed, bearing in mind the short remaining life of existing mines.
The challenge is to identify the many different impactors on water resources and prioritise interventions to
address them in terms of cost, feasibility and overall impact.
Environment
The objective should be to get dams and rivers usable for recreation again, amongst them Roodeplaat, the
Vaal Barrage as well as Hartebeespoort.
Water supply A key strategic objective for the Province must be to collaborate with national and local institutions to
achieve the objective of a 15% reduction in water use in the Province. This will delay the development of
new infrastructure to augment supplies and thereby make more financial resources available for the
operation, maintenance and expansion of municipal systems.
The Metros and Rand Water have water conservation and demand management programmes but these
have not achieved the targeted savings and coordinated support from DED might contribute to improved
performance. Resources are available through the DBSA which is managing a funded demand management
programme for municipal implementation (details annexed). Water pricing is an important instrument in
the promotion of efficient use and it is important that the price of water to large users (both domestic and
industrial) should reflect the long run marginal costs of augmenting supplies so that appropriate investment
and consumption decisions are taken. While domestic rising block tariffs and industrial tariffs have tended
to these levels, this needs to be continuously reviewed and DED can play an important role in countering
pressure for “moderate” price increases.
A longer term project with the potential to save significant energy as well as to reduce treatment costs and
pollution risks is a proposal to build a pipeline to link the Ash river outfall to Rand Water’s works on the
Vaal through which water would flow under gravity and arrive with residual pressure whose energy could
be captured. This was studied and rejected as not cost-effective but changing energy costs and the
availability of CO2 mitigation funding suggest that it may be appropriate to review it.
Sanitation
A key strategic objective is to reduce pollution by getting wastewater into the right pipes and keeping it
there. Although the sanitation backlog is relatively small, poor sanitation results in “diffuse pollution” when
waste from residential areas is washed into streams by storm water.
A further major problem is poor management of infrastructure from the level of the household to
wastewater treatment plant level. Some streams in Johannesburg which would normally be dry in the
winter dry season have strong flows throughout the year, indicative of sewage flows entering the storm
water drainage system (see picture). This is due to household and building level plumbing failures in
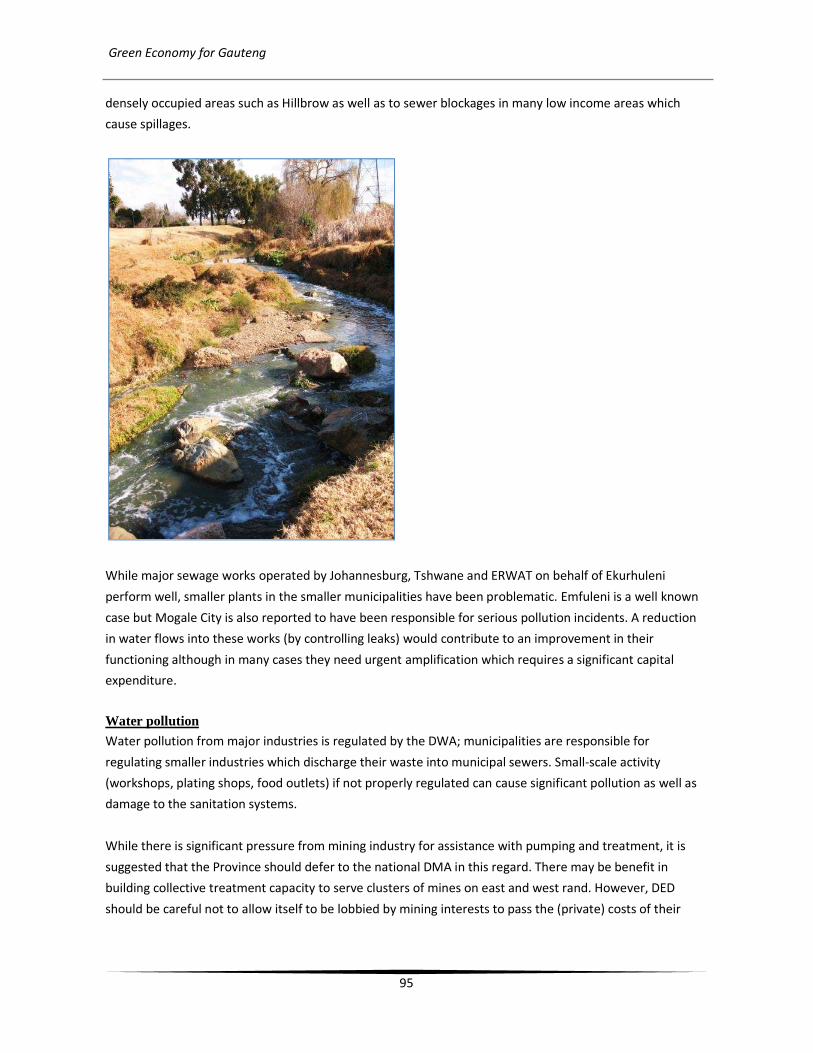
Green Economy for Gauteng
95
densely occupied areas such as Hillbrow as well as to sewer blockages in many low income areas which
cause spillages.
While major sewage works operated by Johannesburg, Tshwane and ERWAT on behalf of Ekurhuleni
perform well, smaller plants in the smaller municipalities have been problematic. Emfuleni is a well known
case but Mogale City is also reported to have been responsible for serious pollution incidents. A reduction
in water flows into these works (by controlling leaks) would contribute to an improvement in their
functioning although in many cases they need urgent amplification which requires a significant capital
expenditure.
Water pollution
Water pollution from major industries is regulated by the DWA; municipalities are responsible for
regulating smaller industries which discharge their waste into municipal sewers. Small-scale activity
(workshops, plating shops, food outlets) if not properly regulated can cause significant pollution as well as
damage to the sanitation systems.
While there is significant pressure from mining industry for assistance with pumping and treatment, it is
suggested that the Province should defer to the national DMA in this regard. There may be benefit in
building collective treatment capacity to serve clusters of mines on east and west rand. However, DED
should be careful not to allow itself to be lobbied by mining interests to pass the (private) costs of their
Green Economy for Gauteng
96
waste management and closure to the public. Proposals to contract section 21 companies to undertake
such work, as part of closure certification, may have that result.
(Of interest are the cost estimates produced by the McKinsey report for South Africa – see Figure 15 above.
Although only indicative, they suggest that “cost-negative” interventions to meet 2030 water demand
would include fitting efficient shower heads and improving operational efficiency in municipal networks
(pressure management and leakage). Cost positive interventions identified included new dams, which were
reported to be significantly cheaper than domestic rain water harvesting and fixing household leaks
although the sanitation and educational benefits from such programmes were not costed.)
7.5.7 Recommendations
On the basis of these considerations, the main recommendations for water supply and sanitation are that
DED should promote and cooperate in the following programmes:
• Water demand management, through
o Leak control programmes, in cooperation with the DBSA managed water conservation and
demand management programme
o Household plumbing maintenance and improvement in low income communities
• Pollution reduction, through
o Improvement of storm water infrastructure and management, including community
education
o Improvement of sanitation in low income communities
o Household plumbing maintenance in low income communities to reduce flows into
wastewater works
o Joint regional strategy, to be developed with DWA and Rand Water, to review options
including utility based treatment, export to water-short catchments, more rigorous control
of existing mines etc.
• DED should consider joining with DWA and other agencies to review the potential costs and
benefits of building collective mining water treatment capacity.
• DED should participate actively in the process to produce a new National Water Resource Strategy
which begins in 2010 and focus, in particular, on mechanisms to encourage greater efficiency in
industry.
• DED should work with appropriate local, provincial and national housing authorities to identify new
housing schemes in which innovative water conservation, water efficiency and sanitation measures
can be introduced and evaluated.
Once options have been chosen, the activities and projects should be outlined in more detail and their
costs and potential benefits calculated.

Green Economy for Gauteng
97
7.6 Waste Management
7.6.1 Summary of findings
Waste to landfills can be reduced by up to 60% (3,885,702 tons / year) and over 19,400 jobs can be created.
7.6.2 Introduction
Gauteng is the largest waste producer in South Africa, currently producing over 5,7 million tons of waster
per year. The average amount of waste generated in Johannesburg is approximately 1.2 kg per person per
day.
Figure 19: Provincial per capita generation of general waste (Adapted from: Gauteng State of the Environment Report, 2004)
Issues around waste in Gauteng include100:
• Increasing urbanisation of Gauteng is leading to increasing waste generation.
• Increasing commercial and industrial development translates to more waste being generated by
the residential, industrial and commercial sectors.
• Limited waste collection in poor areas (20% of households within the Gauteng Province do not have
access to weekly refuse removal services).
• Poor enforcement of national, provincial and municipal laws and regulations.
• Lack of encouragement and awareness of waste avoidance, minimisation and recycling.
• The rising oil price increases the cost of waste transportation to landfills
This results in problems such as:
• Pollutants entering the surface or groundwater resources, air and soil.
• Leachate generation, odours, noxious airborne emissions (volatile organic compounds) from
mismanaged landfill and dump sites, as well as incineration and illegal burning.
• Landfills attract vermin and harbour disease spreading vectors that pose health risks.
100
The two lists below are from the “GAUTENG 2055 LONG TERM DEVELOPMENT STRATEGY” for Waste Management
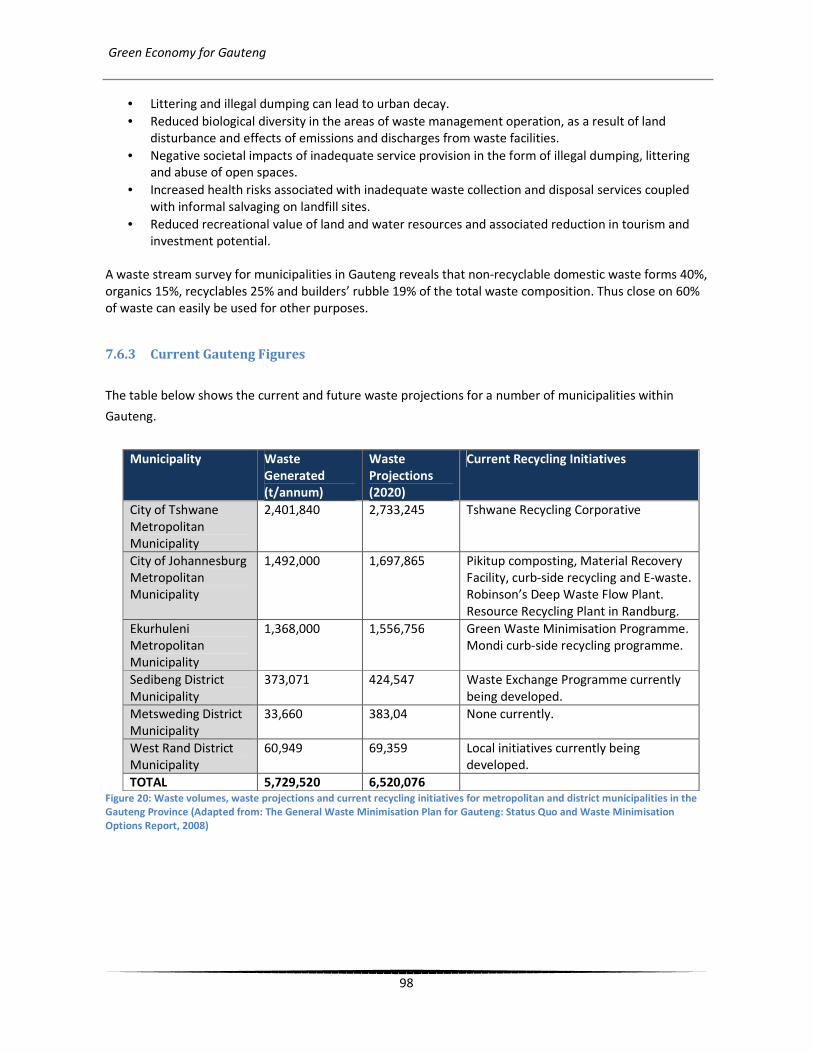
Green Economy for Gauteng
98
• Littering and illegal dumping can lead to urban decay.
• Reduced biological diversity in the areas of waste management operation, as a result of land
disturbance and effects of emissions and discharges from waste facilities.
• Negative societal impacts of inadequate service provision in the form of illegal dumping, littering
and abuse of open spaces.
• Increased health risks associated with inadequate waste collection and disposal services coupled
with informal salvaging on landfill sites.
• Reduced recreational value of land and water resources and associated reduction in tourism and
investment potential.
A waste stream survey for municipalities in Gauteng reveals that non-recyclable domestic waste forms 40%,
organics 15%, recyclables 25% and builders’ rubble 19% of the total waste composition. Thus close on 60%
of waste can easily be used for other purposes.
7.6.3 Current Gauteng Figures
The table below shows the current and future waste projections for a number of municipalities within
Gauteng.
Municipality Waste
Generated
(t/annum)
Waste
Projections
(2020)
Current Recycling Initiatives
City of Tshwane
Metropolitan
Municipality
2,401,840 2,733,245 Tshwane Recycling Corporative
City of Johannesburg
Metropolitan
Municipality
1,492,000 1,697,865 Pikitup composting, Material Recovery
Facility, curb-side recycling and E-waste.
Robinson’s Deep Waste Flow Plant.
Resource Recycling Plant in Randburg.
Ekurhuleni
Metropolitan
Municipality
1,368,000 1,556,756 Green Waste Minimisation Programme.
Mondi curb-side recycling programme.
Sedibeng District
Municipality
373,071 424,547 Waste Exchange Programme currently
being developed.
Metsweding District
Municipality
33,660 383,04 None currently.
West Rand District
Municipality
60,949 69,359 Local initiatives currently being
developed.
TOTAL 5,729,520 6,520,076 Figure 20: Waste volumes, waste projections and current recycling initiatives for metropolitan and district municipalities in the
Gauteng Province (Adapted from: The General Waste Minimisation Plan for Gauteng: Status Quo and Waste Minimisation
Options Report, 2008)

Green Economy for Gauteng
99
7.6.4 Job creation potential
The following table shows the job creation potential of various processes:
Proposed 2020 Target for waste recovery: 3,885,702 tons / year (60%)
Job creation potential: assume conservative average of 50 jobs per 10000 tons waste / year
Total job creation potential: minimum 19,400 direct jobs
The PET Recycling Company (Pty) Ltd recycled over 20,000 tons of PET bottles in 2007, or 22% of beverage
PET sales. This created in excess of 10,000 informal jobs101.
101
“Development of a general waste minimisation plan for Gauteng: Status Quo and Waste Minimisation Options
Report, Draft Final v3.1”, 23 Feb 2009

Green Economy for Gauteng
100
7.6.5 Recommendations & benefits
It is our recommendation that Gauteng focus on putting in place both policies and Focus on programmes to
both minimise waste at point-of consumption, reuse waste where possible, and recycle all recyclables.
• Mandatory Recycling Efforts
o By the year 2020 it is estimated that 6,520,076 t/annum of waste will be produced and that
3,885,702 t/annum could be recovered through recycling initiatives (GDACE, 2008). This
represents 60% of the projected volumes of waste for the long-term planning horizon thus
indicating the positive effect that reuse, reduction and recycling can have on waste
minimization. Informal reclamation of recyclable waste under unhealthy and unsafe
conditions on landfill sites is the only form of recycling currently undertaken in many areas
(Metsweding District Municipality IWMP, 2005).
Figure 21: Recycling - The 12 Master Categories
o Currently recycling is done on a voluntary bases, the Province plans to formalize efforts to
ensure that separation at source becomes mandatory. By formalizing these initiatives the
amount of waste sent to landfills will be reduced which will ultimately save in high disposal
costs. Furthermore, formalizing will stop current informal recycling activities. This is
necessary due to the associated health risks and undignified lifestyle of informal recyclers
(Z Smale 2008, pers. comm., 10 September). No formal research has been conducted
regarding the number of people that are involved in informal recycling. It is essential that
research generating data quantities takes place to initiate the formalization of these
activities.
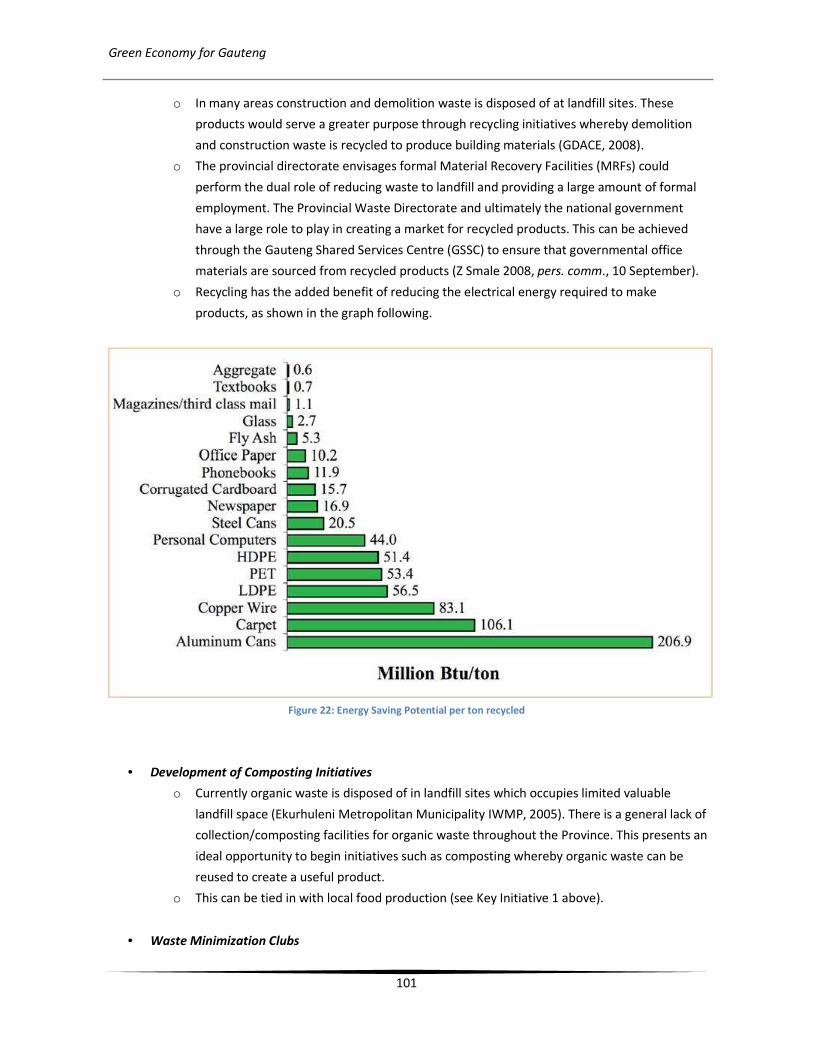
Green Economy for Gauteng
101
o In many areas construction and demolition waste is disposed of at landfill sites. These
products would serve a greater purpose through recycling initiatives whereby demolition
and construction waste is recycled to produce building materials (GDACE, 2008).
o The provincial directorate envisages formal Material Recovery Facilities (MRFs) could
perform the dual role of reducing waste to landfill and providing a large amount of formal
employment. The Provincial Waste Directorate and ultimately the national government
have a large role to play in creating a market for recycled products. This can be achieved
through the Gauteng Shared Services Centre (GSSC) to ensure that governmental office
materials are sourced from recycled products (Z Smale 2008, pers. comm., 10 September).
o Recycling has the added benefit of reducing the electrical energy required to make
products, as shown in the graph following.
Figure 22: Energy Saving Potential per ton recycled
• Development of Composting Initiatives
o Currently organic waste is disposed of in landfill sites which occupies limited valuable
landfill space (Ekurhuleni Metropolitan Municipality IWMP, 2005). There is a general lack of
collection/composting facilities for organic waste throughout the Province. This presents an
ideal opportunity to begin initiatives such as composting whereby organic waste can be
reused to create a useful product.
o This can be tied in with local food production (see Key Initiative 1 above).
• Waste Minimization Clubs
Green Economy for Gauteng
102
o This refers to initiatives whereby businesses in a particular geographic area, group together
to negotiate better terms or services from waste contractors (GDACE, 2006a). The club may
also share facilities and equipment and exchange waste items that may be of use to
another business (GDACE, 2006a). These initiatives can eventually lead to waste
minimization efforts being instigated.
• Waste to Energy
o The conversion of municipal solid waste to energy is an alternative energy is considered a
viable option to generate clean energy.
o There are developers already investigating such projects under the proposed Feed-In
Tariffs. These developers should be supported in their initiatives.
• Green Procurement
o Green procurement is rooted in the principle of pollution prevention, and generally
involves products that are easily recycled, last longer or produce less waste (GDACE,
2006a). If all levels of government follow the principles of green procurement they will
produce positive repercussions in industry as their suppliers will need to follow the
principles of green procurement. Furthermore, municipalities can offer the benefit of green
procurement to the general public.
• Multi-faceted Landfill Sites
o Landfills take up a large amount of valuable land, thus these sites need to become multi-
faceted to ensure efficient use of all land resources. These sites provide an ideal
opportunity for Eco-Parks, Landscape design features and educational facilities (Z Smale
2008, pers. comm., 10 September) in terms of their end uses.
o Landfill site selection will need to be optimized such that rail can be used to move the
waste to the site and thus reduce transportation costs.

Green Economy for Gauteng
103
7.7 Transport
7.7.1 Summary of findings
A 15% energy efficiency target in the transport sector could be equated with a 15% reduction in fuel
consumption, and thus the following can be calculated:
15% fuel saving 0.98 million litres per day
Required # of people to switch
from private car to BRT 1.1 million people
Number of BRT busses required 2400
Job creation potential (3 shifts) 7200
Estimated Subsidy R 850 million
7.7.2 Introduction
The growth constraints and sustainability challenges in the transport sector include:
• Transport is a major contributor to energy and carbon emissions in the region e.g. Liquid fuels
associated with transport contributed some 31% to the total City of Johannesburg Carbon
footprint, and almost 62% of its overall energy usage102
.
• There is a growing tendency to move away from train and bus transport in favour of private
vehicles103
.
• The number of peak hour private vehicle trips is increasing.
• The number of vehicle-kilometres travelled is increasing, implying that people are living further
away from work and schools.
• A result of the above behaviour is that congestion is increasing.
In addition, the majority of public transport commuters has concerns that:
• Public transport is not readily available or is too far;
• Public transport is too expensive;
• Vehicles are not safety and drivers drive poorly
For example more than half of taxi users are dissatisfied with taxi service overall, compared to 45% of train
and only 23% of bus users.
Thus to re-orientate transportation in a green economy, transportation should be:
• Affordable & safe;
• Job-creating;
• Promote short distance trips;
• Be low in carbon emissions.
102
Mercer, City of Johannesburg State of Energy Report. 103
Ibid.

Green Economy for Gauteng
104
7.7.3 Possible economic benefits and job creation potential
The current proposed target for “Transport Energy Efficiency” is a reduction of 15% by 2025 104. Simplistic
view of this would be to argue for a 15% reduction in fuel consumption in the province.
Here a scenario is proposed in which there is a 15% reduction in fuel consumption in Gauteng due to a
major shift from private transport to public transport, and a reduction in private kilometres driven. The
savings to the economy and reduced carbon, increased energy security and job creation will be discussed.
The table below shows the 2007 fuel consumption in Gauteng. The graph following illustrates that by far
the largest consumer of fuels in Gauteng is in the Private Vehicles sector.
Diesel
litres
(millions)
Petrol litres
(millions)
Energy
(TJ)
Private Vehicles 680.7 1699.5 84060 93.4%
Private Haulage 62.9 2.5 2483 2.8%
Non-COJ Public Transport 21.1 0.3 814 0.9%
National Government 1.3 0.4 64 0.1%
CoJ Bus Fleet 6.8 0.0 259 0.3%
Industry & Commerce 48.0 0.4 1843 2.0%
CoJ UACs 8.9 3.7 469 0.5%
In private vehicles, this equates to approximately 6.5 million litres of fuel per day.
To table below shows the average fuel consumption per person per 100 km travelled105.
104
Dept of Local Gov & Housing, Gauteng Integrated Energy Strategy. 105
Mohammed and Venter, Analysing Passenger Transport Energy Consumption from Travel Survey Data.
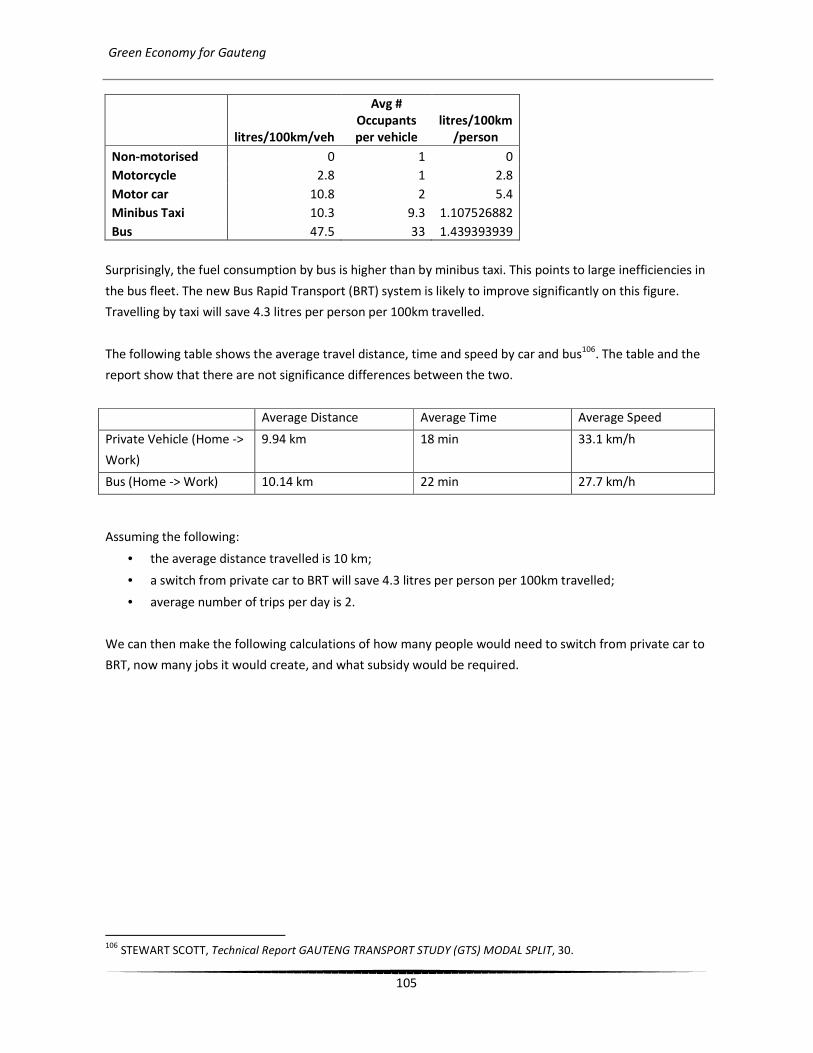
Green Economy for Gauteng
105
litres/100km/veh
Avg #
Occupants
per vehicle
litres/100km
/person
Non-motorised 0 1 0
Motorcycle 2.8 1 2.8
Motor car 10.8 2 5.4
Minibus Taxi 10.3 9.3 1.107526882
Bus 47.5 33 1.439393939
Surprisingly, the fuel consumption by bus is higher than by minibus taxi. This points to large inefficiencies in
the bus fleet. The new Bus Rapid Transport (BRT) system is likely to improve significantly on this figure.
Travelling by taxi will save 4.3 litres per person per 100km travelled.
The following table shows the average travel distance, time and speed by car and bus106
. The table and the
report show that there are not significance differences between the two.
Average Distance Average Time Average Speed
Private Vehicle (Home ->
Work)
9.94 km 18 min 33.1 km/h
Bus (Home -> Work) 10.14 km 22 min 27.7 km/h
Assuming the following:
• the average distance travelled is 10 km;
• a switch from private car to BRT will save 4.3 litres per person per 100km travelled;
• average number of trips per day is 2.
We can then make the following calculations of how many people would need to switch from private car to
BRT, now many jobs it would create, and what subsidy would be required.
106
STEWART SCOTT, Technical Report GAUTENG TRANSPORT STUDY (GTS) MODAL SPLIT, 30.
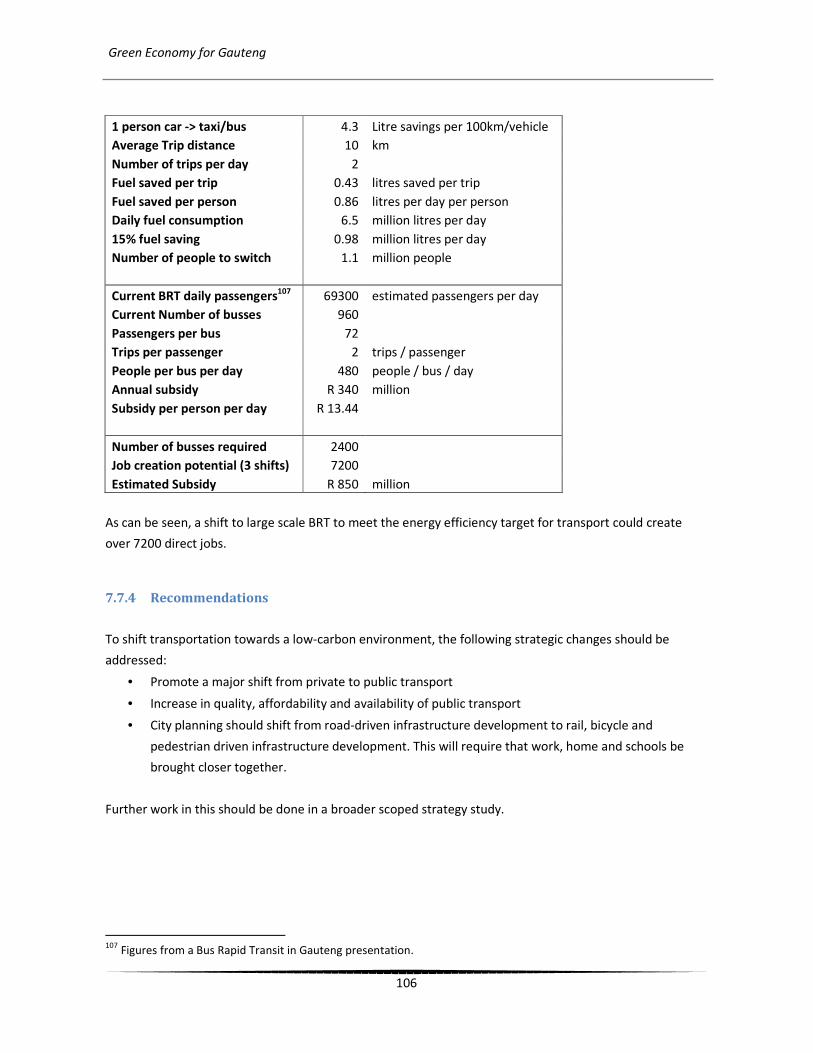
Green Economy for Gauteng
106
1 person car -> taxi/bus 4.3 Litre savings per 100km/vehicle
Average Trip distance 10 km
Number of trips per day 2
Fuel saved per trip 0.43 litres saved per trip
Fuel saved per person 0.86 litres per day per person
Daily fuel consumption 6.5 million litres per day
15% fuel saving 0.98 million litres per day
Number of people to switch 1.1 million people
Current BRT daily passengers107
69300 estimated passengers per day
Current Number of busses 960
Passengers per bus 72
Trips per passenger 2 trips / passenger
People per bus per day 480 people / bus / day
Annual subsidy R 340 million
Subsidy per person per day R 13.44
Number of busses required 2400
Job creation potential (3 shifts) 7200
Estimated Subsidy R 850 million
As can be seen, a shift to large scale BRT to meet the energy efficiency target for transport could create
over 7200 direct jobs.
7.7.4 Recommendations
To shift transportation towards a low-carbon environment, the following strategic changes should be
addressed:
• Promote a major shift from private to public transport
• Increase in quality, affordability and availability of public transport
• City planning should shift from road-driven infrastructure development to rail, bicycle and
pedestrian driven infrastructure development. This will require that work, home and schools be
brought closer together.
Further work in this should be done in a broader scoped strategy study.
107
Figures from a Bus Rapid Transit in Gauteng presentation.
Green Economy for Gauteng
107
8 Other Suggested Initiatives
Some options that are considered to have good job creation potential have been explored above. A number
of other short, medium and long-term options are included in a more detailed list of options below. It is
recommended that the other items be explored in due course. We have proposed a wide range of possible
approaches: the task of government is to assess these, select and prioritise its policy choices, after which
detailed research, planning, programme design and implementation will follow.
8.1 Short-term
• Policy changes to promote low-carbon, high employment;
• Create a “Green Gauteng” brand to attract investment;
• Drive initiatives for local food production;
• Drive initiatives for Energy Efficiency;
o Residential, Commercial, Industrial;
o Public lighting – road lights, traffic lights;
o Minimum efficiency standards.
• Promote and assist with finance and skills for Solar Water Heaters;
• Compulsory Waste Management and Recycling108;
• Promote investment in ecosystem services – water, food, forests, parks, etc. ;
• Invest in water management & recovery;
o Water loss reduction;
o Grey Water systems;
o Mines water management and clean-up.
• Forestry & Agriculture;
o Promote planting of trees;
o Use of organic or low-fossil fuel content fertilisers.
• Fuel switch from electricity to Liquid Petroleum Gas (LPG) for cooking/heating;
• Promote Smart Metering in building to assist with Demand Side Management;
• Promote investment into local development of new Battery and Storage technologies109;
• Indoor building air quality = improved worker health and productivity;
• Public open space / “greening”;
• Energy projects;
o Landfill Gas;
o Waste-to-energy;
o Biogas;
o Sustainable Biofuels.
108
See http://www.izwa.org.za/ 109
Venter, “SA is gearing up to produce batteries for electric vehicles.”

Green Economy for Gauteng
108
8.2 Medium-term
• Concentrated solar plant industry;
o R&D;
o Component Manufacturing;
o Attract foreign technology companies.
• Green Integrated Development Zone;
o For Concentrated Solar Power and/or other green technologies.
• Transportation;
o Shift to rail, BRT, low carbon vehicles;
o Fewer highways;
o Penalise/tax private car use.
• Sewerage reduction and sewerage-to-energy;
• Large scale Urban food production;
• Smart Grids Infrastructure;
• Compulsory Green Building standards;
• Mining Sustainability Programme, incorporating:
o R&D into clean mining technology;
o Restoration on damage ecosystems;
o Water management;
o Solar Water Heaters;
o Energy Efficiency;
o Renewable Energy generation.
8.3 Long-term
• Cities as net ecological service providers reducing the need for imported services like food and
water;
• Major Renewable Energy Manufacturing Infrastructure, especially Concentrated Solar Power (CSP).
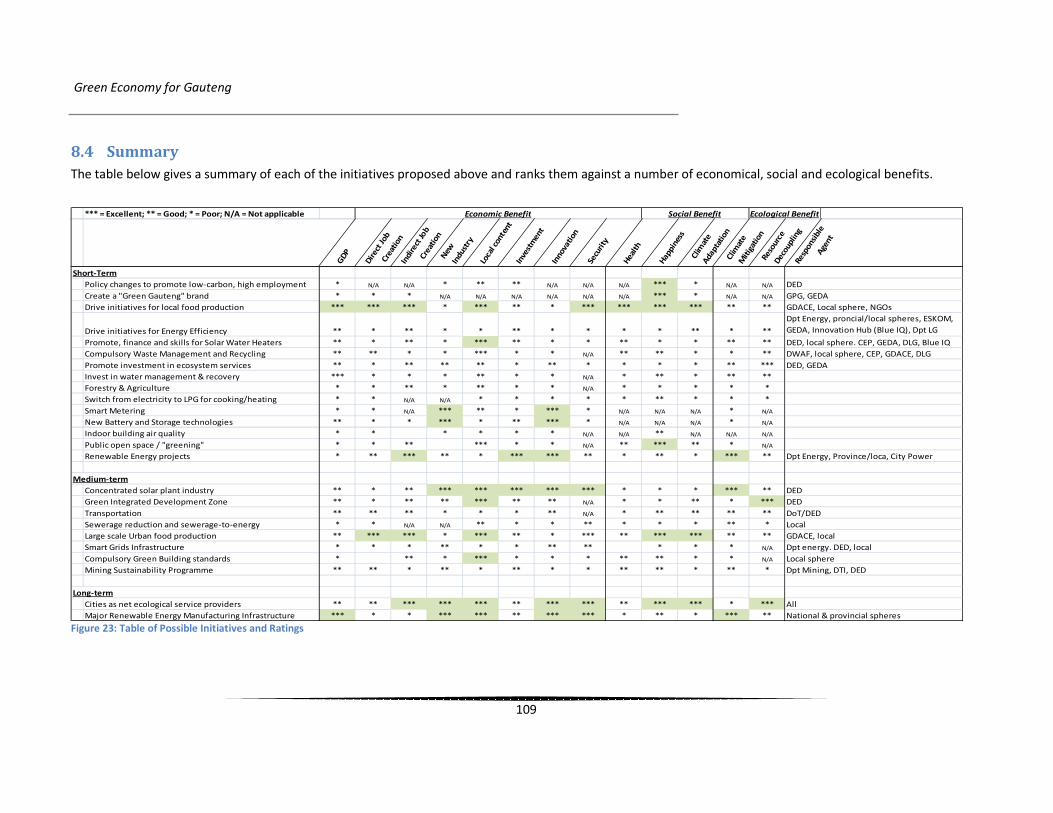
Green Economy for Gauteng
109
8.4 Summary
The table below gives a summary of each of the initiatives proposed above and ranks them against a number of economical, social and ecological benefits.
*** = Excellent; ** = Good; * = Poor; N/A = Not applicable Economic Benefit Social Benefit Ecological Benefit
GD
P
Dir
ect
Job
Crea
tion
Indi
rect
Job
Crea
tion
New
In
dust
ry
Loca
l con
tent
Inve
stm
ent
Inno
vati
on
Secu
rity
Hea
lth
Hap
pin
ess
Clim
ate
Ada
pta
tion
Clim
ate
Mit
igat
ion
Reso
urce
D
ecou
plin
gRe
spons
ible
A
gent
Short-Term
Policy changes to promote low-carbon, high employment * N/A N/A * ** ** N/A N/A N/A *** * N/A N/A
Create a "Green Gauteng" brand * * * N/A N/A N/A N/A N/A N/A *** * N/A N/A
Drive initiatives for local food production *** *** *** * *** ** * *** *** *** *** ** **
Drive initiatives for Energy Efficiency ** * ** * * ** * * * * ** * **
Promote, finance and skills for Solar Water Heaters ** * ** * *** ** * * ** * * ** **
Compulsory Waste Management and Recycling ** ** * * *** * * N/A ** ** * * **
Promote investment in ecosystem services ** * ** ** ** * ** * * * * ** ***
Invest in water management & recovery *** * * * ** * * N/A * ** * ** **
Forestry & Agriculture * * ** * ** * * N/A * * * * *
Switch from electricity to LPG for cooking/heating * * N/A N/A * * * * * ** * * *
Smart Metering * * N/A *** ** * *** * N/A N/A N/A * N/A
New Battery and Storage technologies ** * * *** * ** *** * N/A N/A N/A * N/A
Indoor building air quality * * * * * * N/A N/A ** N/A N/A N/A
Public open space / "greening" * * ** *** * * N/A ** *** ** * N/A
Renewable Energy projects * ** *** ** * *** *** ** * ** * *** **
Medium-term
Concentrated solar plant industry ** * ** *** *** *** *** *** * * * *** **
Green Integrated Development Zone ** * ** ** *** ** ** N/A * * ** * ***
Transportation ** ** ** * * * ** N/A * ** ** ** **
Sewerage reduction and sewerage-to-energy * * N/A N/A ** * * ** * * * ** *
Large scale Urban food production ** *** *** * *** ** * *** ** *** *** ** **
Smart Grids Infrastructure * * * ** * * ** ** * * * N/A
Compulsory Green Building standards * ** * *** * * * ** ** * * N/A
Mining Sustainability Programme ** ** * ** * ** * * ** ** * ** *
Long-term
Cities as net ecological service providers ** ** *** *** *** ** *** *** ** *** *** * ***
Major Renewable Energy Manufacturing Infrastructure *** * * *** *** ** *** *** * ** * *** **
DED
GPG, GEDA
GDACE, Local sphere, NGOs
Dpt Energy, proncial/local spheres, ESKOM,
GEDA, Innovation Hub (Blue IQ), Dpt LG
DED, local sphere. CEP, GEDA, DLG, Blue IQ
DWAF, local sphere, CEP, GDACE, DLG
DED, GEDA
Dpt Energy, Province/loca, City Power
DED
DED
DoT/DED
Local
All
National & provincial spheres
GDACE, local
Dpt energy. DED, local
Local sphere
Dpt Mining, DTI, DED
Figure 23: Table of Possible Initiatives and Ratings

Green Economy for Gauteng
110
9 Conclusions
“There can be little doubt that the economy of the 21st century will be low-carbon. What has
become clear is that the push toward decarbonisation will be one of the major drivers of global
and national economic growth over the next decade. And the economies that embrace the
green revolution earliest will reap the greatest economic rewards. ... Just as the revolution in
information and communication technologies provided a major motor of growth over the past
30 years, the transformation to low-carbon technologies will do so over the next. It is
unsurprising, therefore, that over the past year governments across the world have made green
investment a major part of their economic stimulus packages. They have recognised the vital
role that spending on energy efficiency and infrastructure can have on demand and
employment in the short term, while also laying the foundations for future growth.” Gordon
Brown, Time Magazine, 28 September 2009
In this preliminary strategy document, the need for a green low-carbon economy has been introduced.
There are significant new challenges arising from ecological constraints to the business-as-usual approach
to growing economies. To realign economies to focus not only on GDP, but also long-term sustainability,
job creation and “happiness” will require a shift capital-focussed investment to strategic investments in
knowledge capital and innovation systems. New skills will need to be developed in the areas of solar water
heaters, local food production, urban agriculture, energy audits, and new investments will need to take
place into infrastructure and planning around water, transportation and renewable energy production,
especially solar.
Gauteng can play two main roles in this space:
1. “A facilitator role for information sharing, through the support to formal inter-organizational
networks, and through the facilitation of informal knowledge spillovers, and
2. An enabler role, through the identification of priority areas for investment in science, technology
and development and well-designed support for R&D and education.”110
Additional research is needed to flesh out what a broad green economy could look like for Gauteng. This
would require a number of additional processes, including:
• Interaction with a visits to regions and cities that are currently implementing green economy
strategies, especially South Korea;
• Further research work into the items proposed, particularly around the inter-linkages of challenges
(such as food and water);
• Inter-departmental and cross-cutting initiatives in green strategy;
110
Kamal-Chaoui and Robert, Competitive Cities and Climate Change - Regional Development Working Papers N° 2,
155.

Green Economy for Gauteng
111
• Promoting a change in thinking that puts the poor and most vulnerable first while addressing the
ecological challenges the face us. This will need to be communicated across all departments, all
levels of government, and to business and trade-unions.
These challenges that face us are immense but not unconquerable. It will take much hard work and co-
operation across the spheres of governments to solve them. The alternative in the long run is that the poor
with suffer and growth will falter, whereas if action is taken now, the economy will grow, but using less
resources and with less environmental impact.
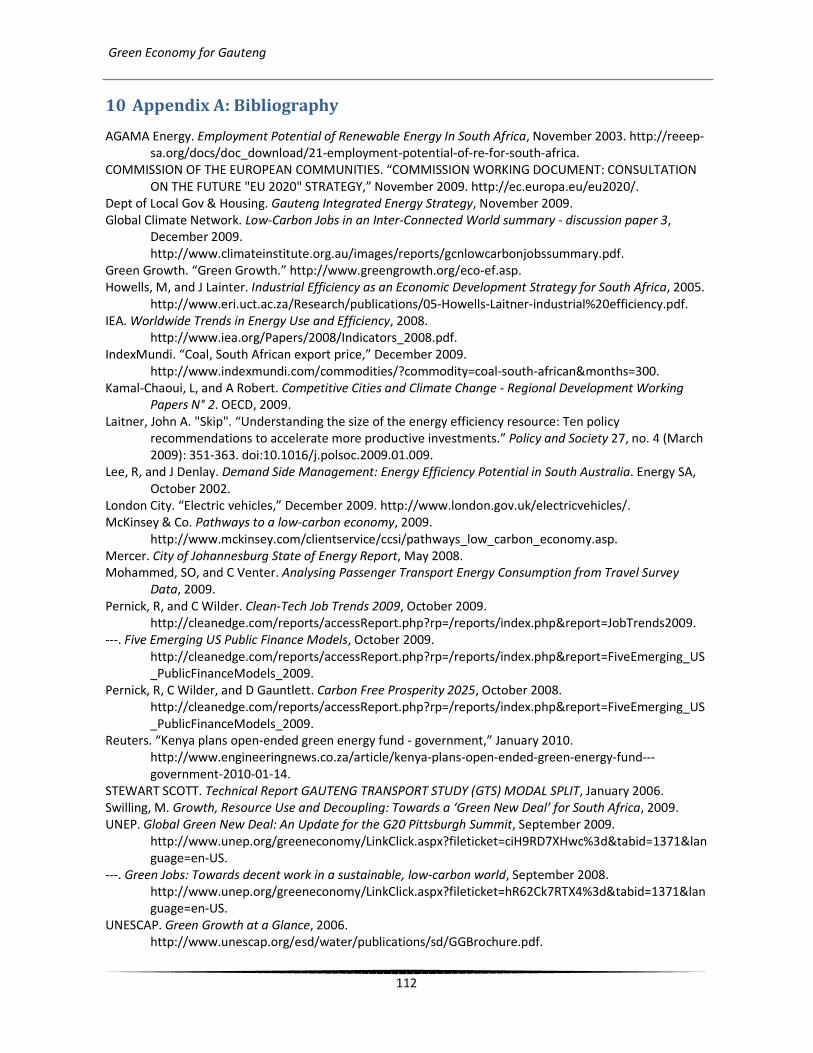
Green Economy for Gauteng
112
10 Appendix A: Bibliography
AGAMA Energy. Employment Potential of Renewable Energy In South Africa, November 2003. http://reeep-
sa.org/docs/doc_download/21-employment-potential-of-re-for-south-africa.
COMMISSION OF THE EUROPEAN COMMUNITIES. “COMMISSION WORKING DOCUMENT: CONSULTATION
ON THE FUTURE "EU 2020" STRATEGY,” November 2009. http://ec.europa.eu/eu2020/.
Dept of Local Gov & Housing. Gauteng Integrated Energy Strategy, November 2009.
Global Climate Network. Low-Carbon Jobs in an Inter-Connected World summary - discussion paper 3,
December 2009.
http://www.climateinstitute.org.au/images/reports/gcnlowcarbonjobssummary.pdf.
Green Growth. “Green Growth.” http://www.greengrowth.org/eco-ef.asp.
Howells, M, and J Lainter. Industrial Efficiency as an Economic Development Strategy for South Africa, 2005.
http://www.eri.uct.ac.za/Research/publications/05-Howells-Laitner-industrial%20efficiency.pdf.
IEA. Worldwide Trends in Energy Use and Efficiency, 2008.
http://www.iea.org/Papers/2008/Indicators_2008.pdf.
IndexMundi. “Coal, South African export price,” December 2009.
http://www.indexmundi.com/commodities/?commodity=coal-south-african&months=300.
Kamal-Chaoui, L, and A Robert. Competitive Cities and Climate Change - Regional Development Working
Papers N° 2. OECD, 2009.
Laitner, John A. "Skip". “Understanding the size of the energy efficiency resource: Ten policy
recommendations to accelerate more productive investments.” Policy and Society 27, no. 4 (March
2009): 351-363. doi:10.1016/j.polsoc.2009.01.009.
Lee, R, and J Denlay. Demand Side Management: Energy Efficiency Potential in South Australia. Energy SA,
October 2002.
London City. “Electric vehicles,” December 2009. http://www.london.gov.uk/electricvehicles/.
McKinsey & Co. Pathways to a low-carbon economy, 2009.
http://www.mckinsey.com/clientservice/ccsi/pathways_low_carbon_economy.asp.
Mercer. City of Johannesburg State of Energy Report, May 2008.
Mohammed, SO, and C Venter. Analysing Passenger Transport Energy Consumption from Travel Survey
Data, 2009.
Pernick, R, and C Wilder. Clean-Tech Job Trends 2009, October 2009.
http://cleanedge.com/reports/accessReport.php?rp=/reports/index.php&report=JobTrends2009.
---. Five Emerging US Public Finance Models, October 2009.
http://cleanedge.com/reports/accessReport.php?rp=/reports/index.php&report=FiveEmerging_US
_PublicFinanceModels_2009.
Pernick, R, C Wilder, and D Gauntlett. Carbon Free Prosperity 2025, October 2008.
http://cleanedge.com/reports/accessReport.php?rp=/reports/index.php&report=FiveEmerging_US
_PublicFinanceModels_2009.
Reuters. “Kenya plans open-ended green energy fund - government,” January 2010.
http://www.engineeringnews.co.za/article/kenya-plans-open-ended-green-energy-fund---
government-2010-01-14.
STEWART SCOTT. Technical Report GAUTENG TRANSPORT STUDY (GTS) MODAL SPLIT, January 2006.
Swilling, M. Growth, Resource Use and Decoupling: Towards a ‘Green New Deal’ for South Africa, 2009.
UNEP. Global Green New Deal: An Update for the G20 Pittsburgh Summit, September 2009.
http://www.unep.org/greeneconomy/LinkClick.aspx?fileticket=ciH9RD7XHwc%3d&tabid=1371&lan
guage=en-US.
---. Green Jobs: Towards decent work in a sustainable, low-carbon world, September 2008.
http://www.unep.org/greeneconomy/LinkClick.aspx?fileticket=hR62Ck7RTX4%3d&tabid=1371&lan
guage=en-US.
UNESCAP. Green Growth at a Glance, 2006.
http://www.unescap.org/esd/water/publications/sd/GGBrochure.pdf.

Green Economy for Gauteng
113
Venter. “SA is gearing up to produce batteries for electric vehicles,” December 2009.
http://www.engineeringnews.co.za/article/sa-is-gearing-up-to-produce-batteries-for-electric-
vehicles-2009-12-11.
Winkler H, Howells M, and Baumert K. “Sustainable development policies and measures: institutional issues
and electrical efficiency in South Africa,” January 1, 2007.
http://www.earthscanjournals.com/cp/007/cp0070212.htm.
Winkler, H. “Energy policies for sustainable development in South Africa’s residential and electricity
sectors,” 2006. http://www.erc.uct.ac.za/Research/publications/06WInkler%20PhD.pdf.
WWF-Netherlands. Clean Economy, Living Planet - Building strong clean energy technology industries,
November 2009.
http://assets.panda.org/downloads/rapport_wwf_cleaneconomy_international_def.pdf.
Green Economy for Gauteng
114
11 Appendix B: Additional Comments on the Economic Crisis and
Ecological Limits
“There is a broad global consensus that we face the unprecedented twin challenge created by inter-linked
economic and environmental crises”111
One of the root causes of the economic crisis was that financial risk was not correctly priced by banks,
especially in the US housing market. When the economy slowed, these risks came back to bite not only the
bankers who were profiteering off the low priced risk, but the entire economy that the banks supported.
Likewise the ecological risks that face us both in the short and long term are not being factored into the
way we conduct business and will indeed come back to bite us in due course.
“The ruin of the financial markets and economy can, even with great difficulty, be overcome - a planet
ruined by climate change cannot.” Prof. Klaus Töpfer, member of the German Council for Sustainable
Development & Former Executive Director of the UNEP.
In a country and province facing severe challenges of poverty coupled to growing levels of protest
regarding access to basic services – clean water, sewerage, refuse removal and so on, on top of the lack of
jobs – the political costs of the ecological crisis should not be under-estimated. Those costs will be far
higher than any possible resistance from (dirty) sectors of the economy that may feel threatened by
greening.
111
Swilling, Growth, Resource Use and Decoupling: Towards a ‘Green New Deal’ for South Africa, 1.

Green Economy for Gauteng
115
Figure 24: Ecological footprint vs biocapacity
Figure 25: Ecological Footprint by country compared to world and sustainable average
The risks associated with the degradation of the ecological systems that support us must be addressed. We
should be as clear about the social and political risks, as we are about the ecological and economic risks. It
Green Economy for Gauteng
116
requires us to decouple economic growth from resource consumption. This simple-sounding phrase is at
the heart of the mindset change that is required. Some of these risks are discussed briefly below.
11.1.1 Climate Change
The Fourth Assessment Report (4th AR) of the Intergovernmental Panel on Climate Change (IPCC) published
in 2007112 basically confirmed the general trends of the previous Assessment reports, namely that global
temperatures are rising, and that these temperature increases are due to an increase in concentrations of
greenhouse gases in the atmosphere caused by human activities (Intergovernmental Panel on Climate
Change 2007). The International Energy Agency forecasts that if policies remain unchanged, world energy
demand is set to increase by 45% by 2030 (International Energy Agency 2008). At the same time, the IPCC
has warned since 1988 that nations need to stabilise their concentrations of CO2 equivalent emissions,
requiring significant reductions in the order of 60 percent or more by 2050. In the latest 4th
Assessment, the
IPCC argues that dangerous climate change global emissions need to start to decline no later than 2012-13
and that by 2020 global cuts of 25-40 per cent are needed. By 2050, at least 80 per cent cuts are needed.
The main human activities that have resulted in a 70% increase in greenhouse gas emissions since 1970 are
the burning of fossil fuels, deforestation, and agricultural production. The projections for the future suggest
that even if we act now to build low-carbon economies, temperatures will still rise by 2 degrees (blue line in
Table below). If we make moderate changes along the lines envisaged by the Kyoto Protocol, we could face
runaway global warming with devastating consequences (green line, and possibly the red line, in the Table
below). Either way, it may be worth quoting a conservative source on the impact on the poor, namely Sir
Nicholas Stern113 who wrote in his report to the UK Government:
“All countries will be affected. The most vulnerable – the poorest countries and populations – will suffer
earliest and most, even though they have contributed least to the causes of climate change.” (Stern 2007)
112
. 4th
Assessment Report was awarded the Nobel Peace Prize in 2007, together with Al Gore for his documentary
The Inconvenient Truth 113
. Sir Nicholas Stern is a former Chief Economist of the World Bank, and was commissioned to write this report on
the economics of global warming by Gordon Brown when he was still Chancellor of the Exchequer.
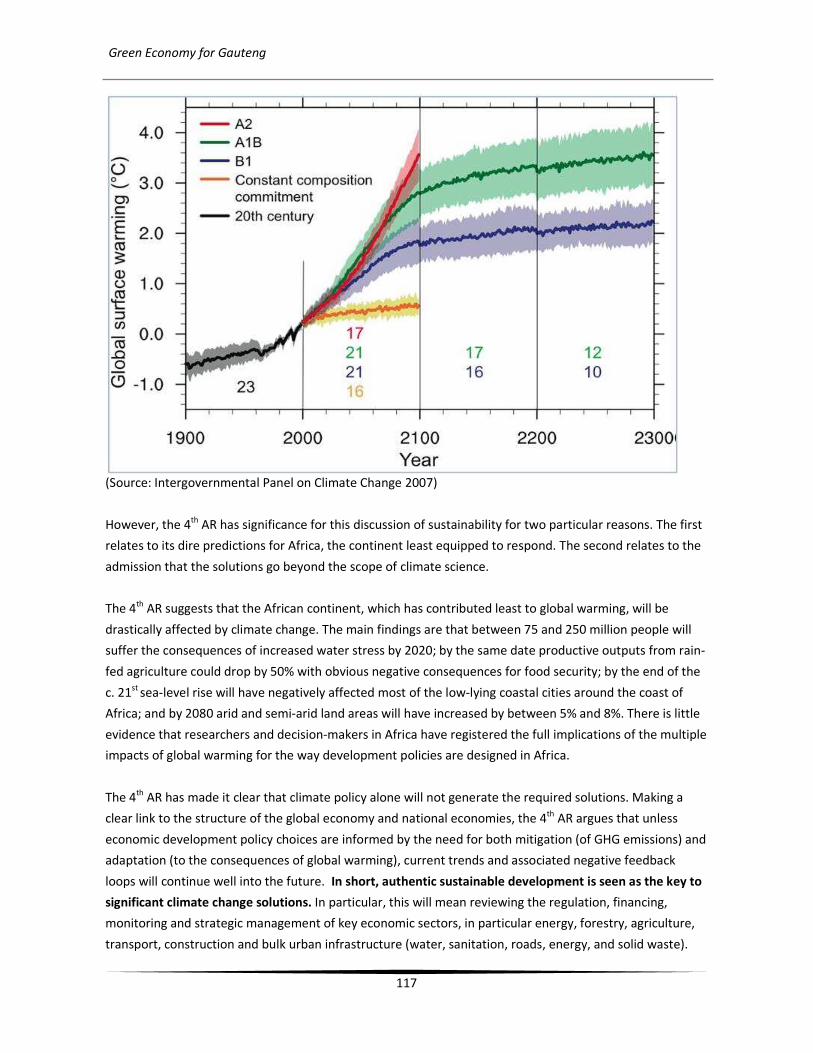
Green Economy for Gauteng
117
(Source: Intergovernmental Panel on Climate Change 2007)
However, the 4th
AR has significance for this discussion of sustainability for two particular reasons. The first
relates to its dire predictions for Africa, the continent least equipped to respond. The second relates to the
admission that the solutions go beyond the scope of climate science.
The 4th AR suggests that the African continent, which has contributed least to global warming, will be
drastically affected by climate change. The main findings are that between 75 and 250 million people will
suffer the consequences of increased water stress by 2020; by the same date productive outputs from rain-
fed agriculture could drop by 50% with obvious negative consequences for food security; by the end of the
c. 21st
sea-level rise will have negatively affected most of the low-lying coastal cities around the coast of
Africa; and by 2080 arid and semi-arid land areas will have increased by between 5% and 8%. There is little
evidence that researchers and decision-makers in Africa have registered the full implications of the multiple
impacts of global warming for the way development policies are designed in Africa.
The 4th
AR has made it clear that climate policy alone will not generate the required solutions. Making a
clear link to the structure of the global economy and national economies, the 4th AR argues that unless
economic development policy choices are informed by the need for both mitigation (of GHG emissions) and
adaptation (to the consequences of global warming), current trends and associated negative feedback
loops will continue well into the future. In short, authentic sustainable development is seen as the key to
significant climate change solutions. In particular, this will mean reviewing the regulation, financing,
monitoring and strategic management of key economic sectors, in particular energy, forestry, agriculture,
transport, construction and bulk urban infrastructure (water, sanitation, roads, energy, and solid waste).

Green Economy for Gauteng
118
Once again, these sectors are dominated by large corporates configured as a set of value chains that are
designed, specified, financed and managed by people trained to think in ways that reinforce the logic of
these value chains, and their personal material interests are tied to tried and tested technologies
embedded in these systems. Changing these sectors is, therefore, far easier said than done. Change, when
it comes, will be the outcome of some intense power struggles waged by a wide range of socially,
economically and spatially constituted interests who will all be differentially affected by the increasingly
serious ecological crises the will unfold as they discuss and negotiate. Sedate roundtable stakeholder
discussions will play a role, but the real action will lie in other terrains of contestation and competition.
Although the Stern Report already cited preceded the 4th AR, it introduced a new principle into the
discourse on sustainability. Basically, the Stern Report argued that it will be cheaper to fix the problems
now rather than later because the later they are addressed, the greater the scale and complexity of the
problems that will require remediation. The Report recommended a commitment of 1% of global GDP to
finance the changes that are required. Although this is substantial, the Report argued that this is preferable
to losing between 5% and 20% of global GDP if nothing is done. This may be why global elites and climate
scientists talk about an annual expenditure of $200 billion to finance mitigation.
11.1.2 Peak Oil & Coal
Although roundly criticised by the climate change community who argue we will run out of atmosphere
before we run out of oil, the so-called “peak oil” community are convinced that we either have already - or
will soon - hit what they define as peak oil production (Aleklett and Campbell 2003; Campbell 1997; Darley
2005; Deffreys 2001; Goodstein 2005; Heinberg 2003; Kunstler 2005; Roberts 2005; Strahan 2007).
The notion that there is a point in the cycle of oil discovery and production that can be defined as a “peak”
is derived primarily from the experience of oil discovery and production in the US context, but also other
national contexts (e.g. the Russian and North Sea oil fields ). Oil discovery in the US peaked in the 1930s
and production peaked 30 to 40 years later. The oil peak protagonists basically use the same time frames to
predict global oil peak. In other words, we know when oil discovery peaked globally (in the 1970s/early
80s), which means the production peak should be some time during the decade after 2005.
What is interesting about peak oil production is that it is only possible to determine whether production
has peaked with hindsight. In other words, in the year that production peaks it is highly unlikely that oil
companies will tend to predict a decline in the following years. Even if production does decline the
following year, this could be seen as a one to three year blip – it has happened before. In 2008 the price of
oil shot up to $140/barrel. Sign of the peak? Another blip? Driven by speculators? The debate goes on, but
while it does higher oil prices make possible the capture of very expensive resources such as residues in old
oil wells (that were too expensive to pump when prices were lower), tar sands, deep sea deposits and, as
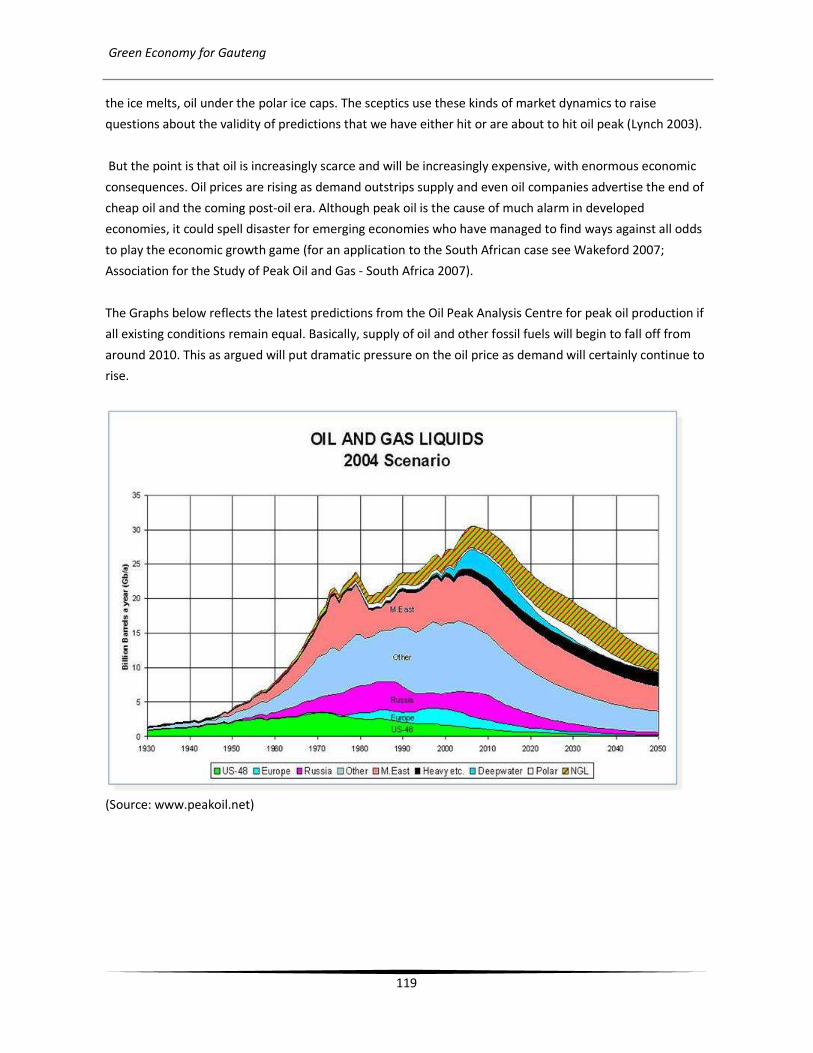
Green Economy for Gauteng
119
the ice melts, oil under the polar ice caps. The sceptics use these kinds of market dynamics to raise
questions about the validity of predictions that we have either hit or are about to hit oil peak (Lynch 2003).
But the point is that oil is increasingly scarce and will be increasingly expensive, with enormous economic
consequences. Oil prices are rising as demand outstrips supply and even oil companies advertise the end of
cheap oil and the coming post-oil era. Although peak oil is the cause of much alarm in developed
economies, it could spell disaster for emerging economies who have managed to find ways against all odds
to play the economic growth game (for an application to the South African case see Wakeford 2007;
Association for the Study of Peak Oil and Gas - South Africa 2007).
The Graphs below reflects the latest predictions from the Oil Peak Analysis Centre for peak oil production if
all existing conditions remain equal. Basically, supply of oil and other fossil fuels will begin to fall off from
around 2010. This as argued will put dramatic pressure on the oil price as demand will certainly continue to
rise.
(Source: www.peakoil.net)
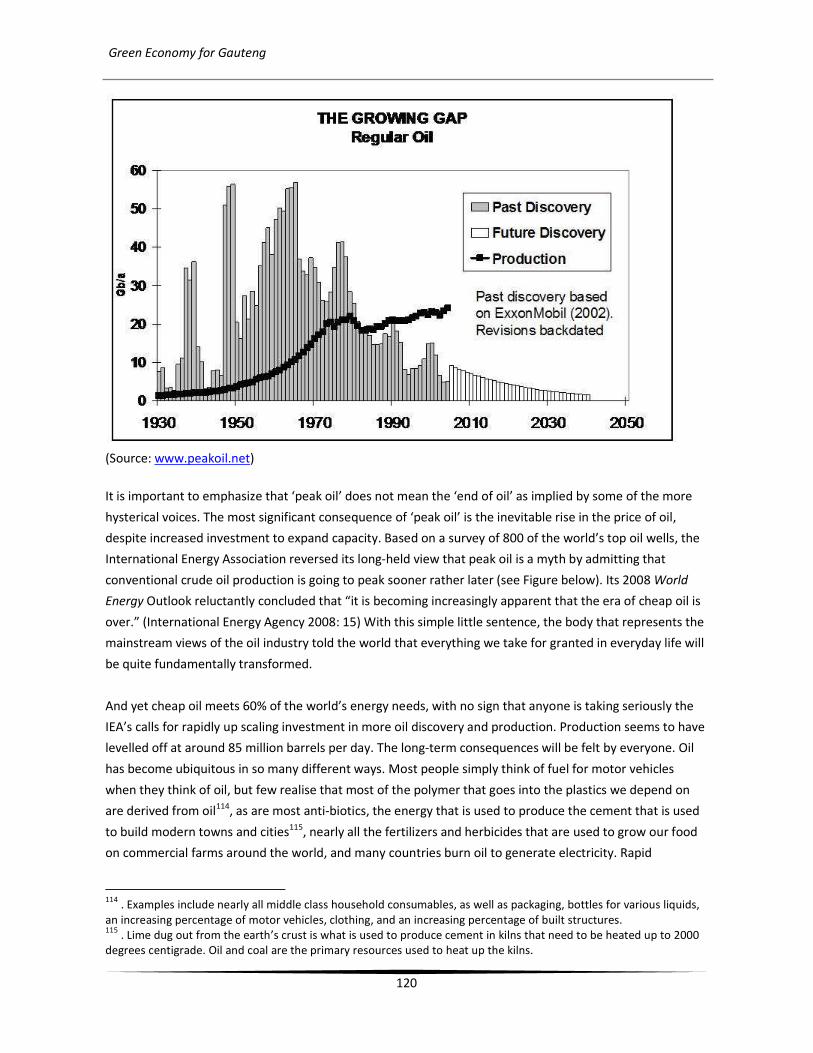
Green Economy for Gauteng
120
(Source: www.peakoil.net)
It is important to emphasize that ‘peak oil’ does not mean the ‘end of oil’ as implied by some of the more
hysterical voices. The most significant consequence of ‘peak oil’ is the inevitable rise in the price of oil,
despite increased investment to expand capacity. Based on a survey of 800 of the world’s top oil wells, the
International Energy Association reversed its long-held view that peak oil is a myth by admitting that
conventional crude oil production is going to peak sooner rather later (see Figure below). Its 2008 World
Energy Outlook reluctantly concluded that “it is becoming increasingly apparent that the era of cheap oil is
over.” (International Energy Agency 2008: 15) With this simple little sentence, the body that represents the
mainstream views of the oil industry told the world that everything we take for granted in everyday life will
be quite fundamentally transformed.
And yet cheap oil meets 60% of the world’s energy needs, with no sign that anyone is taking seriously the
IEA’s calls for rapidly up scaling investment in more oil discovery and production. Production seems to have
levelled off at around 85 million barrels per day. The long-term consequences will be felt by everyone. Oil
has become ubiquitous in so many different ways. Most people simply think of fuel for motor vehicles
when they think of oil, but few realise that most of the polymer that goes into the plastics we depend on
are derived from oil114, as are most anti-biotics, the energy that is used to produce the cement that is used
to build modern towns and cities115
, nearly all the fertilizers and herbicides that are used to grow our food
on commercial farms around the world, and many countries burn oil to generate electricity. Rapid
114
. Examples include nearly all middle class household consumables, as well as packaging, bottles for various liquids,
an increasing percentage of motor vehicles, clothing, and an increasing percentage of built structures. 115
. Lime dug out from the earth’s crust is what is used to produce cement in kilns that need to be heated up to 2000
degrees centigrade. Oil and coal are the primary resources used to heat up the kilns.
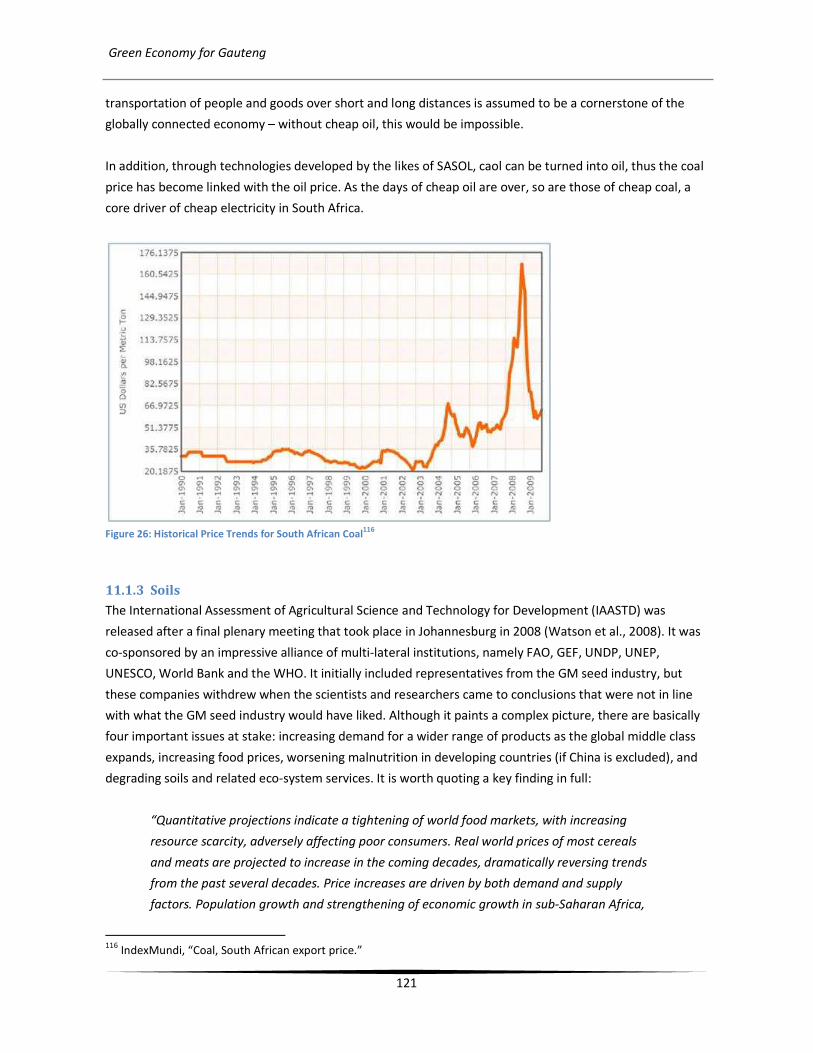
Green Economy for Gauteng
121
transportation of people and goods over short and long distances is assumed to be a cornerstone of the
globally connected economy – without cheap oil, this would be impossible.
In addition, through technologies developed by the likes of SASOL, caol can be turned into oil, thus the coal
price has become linked with the oil price. As the days of cheap oil are over, so are those of cheap coal, a
core driver of cheap electricity in South Africa.
Figure 26: Historical Price Trends for South African Coal
116
11.1.3 Soils
The International Assessment of Agricultural Science and Technology for Development (IAASTD) was
released after a final plenary meeting that took place in Johannesburg in 2008 (Watson et al., 2008). It was
co-sponsored by an impressive alliance of multi-lateral institutions, namely FAO, GEF, UNDP, UNEP,
UNESCO, World Bank and the WHO. It initially included representatives from the GM seed industry, but
these companies withdrew when the scientists and researchers came to conclusions that were not in line
with what the GM seed industry would have liked. Although it paints a complex picture, there are basically
four important issues at stake: increasing demand for a wider range of products as the global middle class
expands, increasing food prices, worsening malnutrition in developing countries (if China is excluded), and
degrading soils and related eco-system services. It is worth quoting a key finding in full:
“Quantitative projections indicate a tightening of world food markets, with increasing
resource scarcity, adversely affecting poor consumers. Real world prices of most cereals
and meats are projected to increase in the coming decades, dramatically reversing trends
from the past several decades. Price increases are driven by both demand and supply
factors. Population growth and strengthening of economic growth in sub-Saharan Africa,
116
IndexMundi, “Coal, South African export price.”
Green Economy for Gauteng
122
together with already high growth in Asia and moderate growth in Latin America drive
increased growth in demand for food. Rapid growth in meat and milk demand is projected
to put pressure on prices for maize and other coarse grains and meals. Bioenergy demand
is projected to compete with land and water resources. Growing scarcities of water and
land are projected to increasingly constraint food production growth, causing adverse
impacts on food security and human well-being goals. Higher prices can benefit surplus
agricultural producers, but can reduce access to food for a larger number of consumers,
including farmers who do not produce a net surplus for the market. As a result, progress in
reducing malnutrition is projected to be slow.”
(Watson et al., 2008: Ch. 5, p.3)
According to the report (Watson et al., 2008: Ch. 3, p.3), over 800 million people are malnourished (and this
is projected to increase) and they live predominantly in developing countries; while 1.6 billion are
overweight, live mainly in developed countries and suffer the consequences of over-eating (diabetes, heart
disease) with major implications for health care expenses in these countries.
As Figure 11.27 reveals, rising oil prices, driven in part by the early effects of the oil peak syndrome, have
been a key driver of rising food prices. The reason for this is that modern agriculture depends heavily on
chemical inputs derived from oil and supplied by a small handful of global chemical companies. This is true
for almost all agriculture in developed countries, and for 40% of the 437 million farms in developing
countries that support the livelihoods of 1.5 billion rural dwellers (Madeley, 2002: 21). Chemical fertilizers,
together with irrigation, hybrid seeds and micro-credit, formed the mainstay of the so-called Green
Revolution that transformed agricultural practices on a global scale (with India leading the way) from the
1960s onwards (but starting off mainly in the USA in the 1930s).

Green Economy for Gauteng
123
Figure 11.27. Commodity prices (US$/ton), January 2000 - September 2007
(Source: Von Braun 2007: 1)
It would, however, be incorrect to focus purely on oil prices and growing consumer demand to explain the
crisis of rising food costs and the related decline in food security. This, indeed, has been the focus of the
global media and policy community during the course of 2008 when this crisis hit headlines as food riots
broke out across the globe. What lacks adequate discussion is the impact that rapidly degrading soils are
having on supply.
It is obvious that if soils are degrading, this must in some way contribute to rising prices because supply is
negatively affected. Despite this logic, this connection is hardly ever mentioned in the recent research and
policy literature on the food crisis. The IAASTD refers to the problem when it points out that “23% of all
used land is degraded to some degree” (2008: Ch.1, 73) and it goes on to suggest that “declining soil
fertility” (2008: Ch. 3, p.4) is the major challenge for agricultural science. The report states that:
“Agricultural use of natural resources (soils, freshwater, air, carbon-derived energy) has, in
some cases, caused significant and widespread degradation of land, freshwater, ocean
and atmospheric resources. Estimates suggest that resource impairment negatively
influences 2.6 billion people.”
(Watson et al., 2008: Ch. 3, p.3 - emphasis added)
Green Economy for Gauteng
124
The notion that “resource impairment” [read: unsustainable resource use] affects 2.6 billion people is a
truly remarkable statement of the immense dimensions of the crisis that the agricultural socioecological
system is actually facing, and puts into perspective the role that degrading ecological resources play in
driving up food prices. According to Scherr (from the Washington-based Institute for Food Policy Research),
although 23% of “all used land” was degraded by the 1990s (using the FAO figures that the IAASTD also
used), 38% of all “agricultural land” was degraded (see Table below). However, conditions are a lot worse in
Africa where 65% of all “agricultural land” was degraded by the 1990s, second only to Central America
where the figure was 74% (Scherr, 1999: 18). This explains why 26 million hectares of land in Africa have
been abandoned by farmers in the thirty years leading up to 2000 as huge quantities of N, P and K have
been stripped from the soils (Gruhn et al., 2000: 11).117 This despite the fact that 50% of all fertilizer in
Africa comes in free of charge as aid and 22 out of 40 countries get all their fertilizer for free (Gruhn et al.,
2000: 12). Maybe it is time to ask whether free fertilizer provision in Africa might actually be one reason
why so much African land is being degraded and abandoned. Now Western Governments via their aid
programmes are punting a new “total solution”, namely GM seed.
11.1.4 Biodiversity and Ecosystem Services
The Millenium Ecosystem Assessment (MEA) referred to at the outset of this chapter is one of the great
iconic documents of our time (this, despite the fact that hardly anyone beyond the environmental sciences
has ever heard of it). The significance of the MEA lies not in its rather weak policy prescriptions118
, but
rather because it is the first comprehensive analysis of the relationship between what it refers to as
“human well-being” and “ecosystem health”. Called for in 2000 by the UN Secretary-General Kofi Annan,
initiated in 2001 and funded by the UN Foundation with a USD24 million grant, it reported in 2005. The
report was a remarkable global collaboration between 1360 experts from 95 countries. The research and
results were peer reviewed by specialists drawn from UN agencies, Universities and research institutes
from across the world. The MEA report used the following graphic to capture the relational
transdisciplinary nature of its analytical focus:
117
To this in perspective, South Africa has a total of 14 million hectares of agricultural land of which only 3% is high
value land. 26 million hectares is therefore nearly twice the land available in South Africa. 118
. Unfortunately, and surprisingly, these prescriptions are informed by a naive form of market economics. It is puzzle
why the more mainstream perspectives of institutional economics were not used to frame the economic policy
proposals.
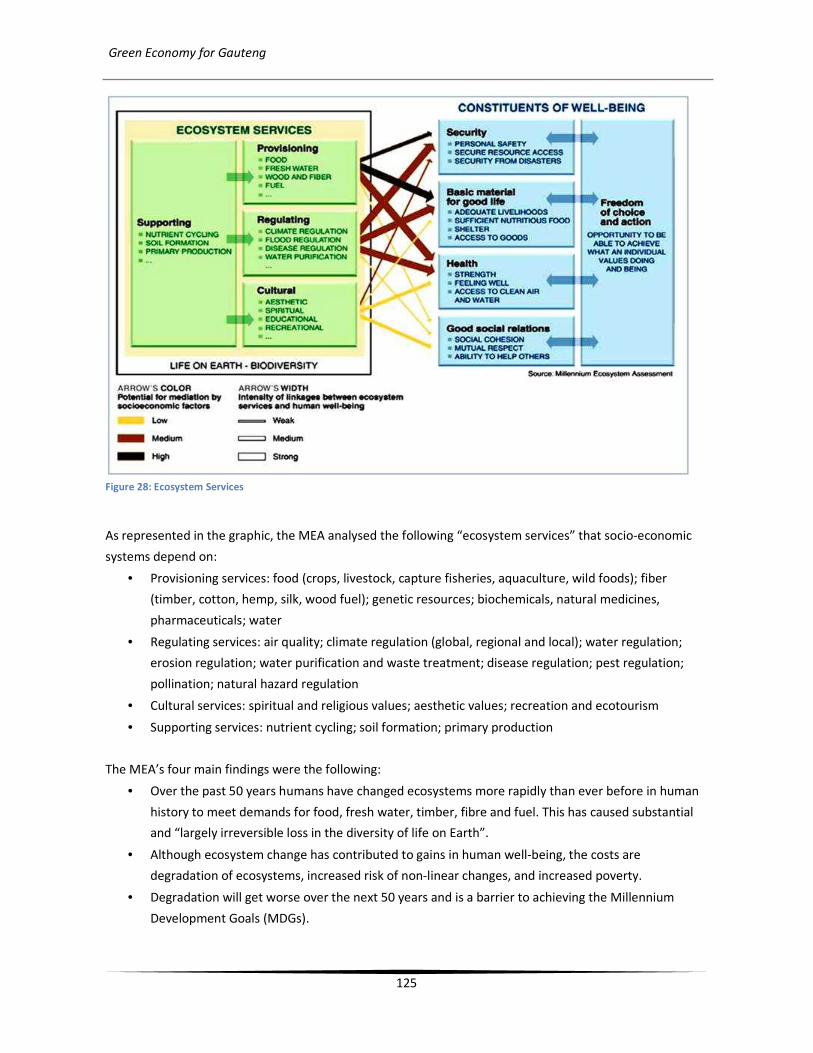
Green Economy for Gauteng
125
Figure 28: Ecosystem Services
As represented in the graphic, the MEA analysed the following “ecosystem services” that socio-economic
systems depend on:
• Provisioning services: food (crops, livestock, capture fisheries, aquaculture, wild foods); fiber
(timber, cotton, hemp, silk, wood fuel); genetic resources; biochemicals, natural medicines,
pharmaceuticals; water
• Regulating services: air quality; climate regulation (global, regional and local); water regulation;
erosion regulation; water purification and waste treatment; disease regulation; pest regulation;
pollination; natural hazard regulation
• Cultural services: spiritual and religious values; aesthetic values; recreation and ecotourism
• Supporting services: nutrient cycling; soil formation; primary production
The MEA’s four main findings were the following:
• Over the past 50 years humans have changed ecosystems more rapidly than ever before in human
history to meet demands for food, fresh water, timber, fibre and fuel. This has caused substantial
and “largely irreversible loss in the diversity of life on Earth”.
• Although ecosystem change has contributed to gains in human well-being, the costs are
degradation of ecosystems, increased risk of non-linear changes, and increased poverty.
• Degradation will get worse over the next 50 years and is a barrier to achieving the Millennium
Development Goals (MDGs).
Green Economy for Gauteng
126
• Reversing ecosystem degradation is possible, but will require “significant changes in policies,
institutions and practices”
Some examples of the conditions referred to in the MEA include:
• 60% (or 16 of the 24) of the world’s ecosystem services have been degraded or are used
unsustainably;
• about a quarter of the Earth's land surface is now cultivated;
• people now use between 40 percent and 50 percent of all available freshwater running off the land
- water withdrawals have doubled over the past 40 years;
• since 1980, about 35 percent of mangroves have been lost;
• about 20% of coral reefs were lost in just 20 years, and 20% degraded;
• nutrient pollution (generated mainly be chemically produced materials) has led to eutrophication
of waters and coastal dead zones;
• species extinction rates are now 100-1,000 times above the so-called background rate.
Based on these and many other findings, the MEA argues:
“The consumption of ecosystem services, which is unsustainable in many cases, will continue
to grow as a consequence of a likely three- to six-fold increase in global GDP by 2050 even
while global population growth is expected to slow and level off in mid-century. … An
effective set of responses to ensure the sustainable management of ecosystems requires
substantial changes in institutions and governance, economic policies and incentives, social
and behaviour factors, technology, and knowledge. … Costs of unsustainable resource use
are rising, but get displaced from one group to another (in particular the poor) and to future
generations.” (United Nations 2005)

Green Economy for Gauteng
127
12 Appendix C: International Responses to the Economic Crisis
“The strategic choice to be made is to use a green recovery programme as a ladder into a new energy
economy -- one based on lesser and lesser reliance on fossil-based fuels. This should be the core reason for
arranging a stimulus package for green programmes, especially in the energy sector.” Saliem Fakir
12.1 International Summary
Recovery packages & green investment119:
12.2 Australia
• 20% of electricity to be from Renewables by 2020.
• Possibility of up to 1.7 million new jobs by 2020120.
12.3 China
10% of its $586 billion stimulus package for sustainable development. Renewable energy target of 15
percent of primary energy consumption by 2020. Could spend up to an additional USD440 billion to USD660
119
UNEP, Global Green New Deal: An Update for the G20 Pittsburgh Summit, 2. 120
Global Climate Network, Low-Carbon Jobs in an Inter-Connected World summary - discussion paper 3, 3.

Green Economy for Gauteng
128
billion in its clean-energy build by 2020121. Wind, solar and hydro power targets could create an additional
6.79 million jobs122
.
“The Chinese model is based on two reinforcing strategies: shift the national economy to a low carbon
footing and use this shift to become a world player in low carbon technologies and goods.” Saliem Fakir
12.4 Germany
Germany: 10% of total recovery funds to energy efficient building retrofits123
.
Currently employ 278,000 workers in renewable energy, more than in conventional energy. By 2020, this.
Could increase to between 353,500 and 400,000 by 2020124.
12.5 India
• National Action Plan on Climate Change.
• Up to an additional 10.5 million jobs in wind, solar and biofuel 125.
12.6 Nigeria
• Renewable Energy Master Plan.
• Small-scale hydro power + gas power could create approximately 670,000 jobs126.
12.7 South Korea
Committed to spend approximately two percent of its GNP (USD 84 billion by 2013), on environmental
projects in a “Green New Deal” to spur economic growth and create a projected 1.5 million new jobs127
12.8 United Kingdom
• Low Carbon Industrial Strategy
• Up to 70,000 UK jobs being created128
12.9 USA
American Recovery and Reinvestment Act (ARRA) of 2009:
• $787 billion total, $100 billion earmarked for clean-tech related projects129
.
• Job creation potential of up to 1.9 million jobs130
.
USA Clean Tech Trends131
• Energy Efficiency
121
Pernick and Wilder, Five Emerging US Public Finance Models, 2-3. 122
Global Climate Network, Low-Carbon Jobs in an Inter-Connected World summary - discussion paper 3, 3. 123
Pernick and Wilder, Clean-Tech Job Trends 2009, 10. 124
Global Climate Network, Low-Carbon Jobs in an Inter-Connected World summary - discussion paper 3, 4. 125
Ibid. 126
Ibid. 127
Pernick and Wilder, Five Emerging US Public Finance Models, 2. 128
Global Climate Network, Low-Carbon Jobs in an Inter-Connected World summary - discussion paper 3, 4. 129
Pernick and Wilder, Five Emerging US Public Finance Models, 2. 130
Global Climate Network, Low-Carbon Jobs in an Inter-Connected World summary - discussion paper 3, 4. 131
Pernick and Wilder, Clean-Tech Job Trends 2009.

Green Economy for Gauteng
129
• Labour transformation towards clean tech – skills & training
• Clean manufacturing situated near end-use markets
• Information Technology growth in smart grid technologies
USA Top Future Industries132
:
• Solar PV Manufacturing
• Green Building Design Services
• Wind Power Development
• Sustainable Bioenergy
• Smart Grid Technologies
USA Green Job sectors133:
• Energy
o Renewable Energy
o Energy Storage
o Energy Conservation and Efficiency
o Smart Grid Devices and Networks
o Electric Transmission and Grid Infrastructure
o Biomass and Sustainable Biofuels
• Water
o Energy Efficient Desalination
o UV Filtration
o Reverse osmosis Filtration
o Membranes
o Automated Metering and Controls
o Water Recovery and Capture
• Transportation
o Hybrid-Electric Vehicles
o All-Electric Vehicles
o Electric Rail
o Hydrogen Fuel Cells for Transport
o Advanced Transport Infrastructure
o Advanced Batteries for Vehicles
• Materials
o Biomimicry
o Bio-based materials
o Reuse and Recycling
o Green Building Materials
132
Pernick, Wilder, and Gauntlett, Carbon Free Prosperity 2025, 5. 133
Pernick and Wilder, Clean-Tech Job Trends 2009, 3.
Green Economy for Gauteng
130
o Cradle-to-cradle systems
o Green Chemistry
USA Public financing models134
:
• Green Bank: ““independent, government-sponsored enterprise to support, via loan guarantees,
debt instruments and equity, the emergence of the U.S. clean-energy industry”
• Clean-energy victory bond e.g. world bank “green bonds”
• Tax Credit Bonds
o Clean Renewable Energy Bonds (CREBs);
o Qualified Energy Conservation Bonds (QECBs)
o Build America Bonds (BABs).
• Federal Loan Guarantees
• City Funds
o Homeowners borrow the funds necessary to pay for a solar array or an energy efficiency
upgrade – then repay the loan (often at below-market rates) over a long-term period
through their property tax or utility bill.
134
Pernick and Wilder, Five Emerging US Public Finance Models.
Green Economy for Gauteng
131
13 Appendix D: Existing Policy & Commitments – National, Provincial &
Local
Although policy in National, Provincial and Local government has not fully integrated the challenges
outlined above, there is an emerging line of thinking that recognises the issues. This strategy for Gauteng is
written within the parameters of existing national and provincial commitments, but turns them into
concrete recommendations for realising commitments while pushing for green jobs and sustainable
growth. The strategy seeks to turn commitments made at the G20, in various national and other
documents, and provide concrete mechanisms and strategies for realising these in practice, all the while
promoting both sustainable growth and job creation.
13.1 National Government
• White Paper on Energy Policy (1998)
o Energy policy must facilitate optimal energy consumption and production to meet social
needs.
o Local & Provincial government have a limited role in energy governance. They are,
however, responsible for economic and physical planning and, as such, are concerned with
the supply and use of energy.
o There is clearly a need for improved communication and co-ordination between national,
provincial and local government. For instance, the implementation of energy policies
should be better integrated with provincial and local economic and physical planning
activities.
• White Paper of Renewable Energy policy (2003)
o 10000 GWh (approx 4%) from Renewables by 2013
• National Environmental Management Air Quality Act (2004)
• National Water Resource Strategy (2004)
o South Africa has allocated around 98% of the national water resource at a high assurance
of supply
• Electrification targets (DME 2004)
o Universal access by 2012
• Energy Efficiency Strategy (2005)
o 12% reduction off the national electricity consumption forecast by 2015.
o 9% reduction in final demand for transport
o Reduction in final energy demand by sector:
� Industrial: 15%
� Commercial: 15%
� Residential: 10%
• Electricity Regulation Act (2006)
• National Energy Bill (2008)
• National Framework for Sustainable Development (2008)
Green Economy for Gauteng
132
• National Integrated Waste Management Act (2009)
• Long Term Mitigation Strategy (2008)
o 30% to 40% reduction in CO2e emissions by 2050 off a 2003 baseline
• Framework for South Africa’s Response to the International Economic Crisis (2009)
o Section 3.6: “The parties recognise the opportunities in industries that combat the negative
effects of climate change and believe that South Africa should develop strong capacity in
these green technologies and industries. Accordingly it is agreed to develop incentives for
investment in a programme to create large numbers of 'green jobs', namely employment in
industries and facilities that are designed to mitigate the effects of climate change.
Government will be asked to develop a proposal for consideration by the parties. This
proposal will, where appropriate, build on current initiatives of greening existing
manufacturing and service activities.”
• Public investments programme
o Approximately R787bn over the three financial years to March 2012
• Treasury
o 2c/kWh levy on coal-based electricity – not allocated to any projects.
o Adjustment of existing ad valorem excise duties on motor vehicles to take CO2 emissions
into account will be implemented on 1 March 2010.
13.2 Business
Business has also established a few initiatives that include:
• Voluntary Energy Efficiency Accord
o In the accord businesses work together to try and achieve South Africa’s Energy Efficiency
targets.
• Carbon Disclosure Project
o In the Carbon Disclosure Project, large corporate have been invited to conduct a carbon
emissions audit of their businesses and make the information public.
13.3 Gauteng Province
13.3.1 Integrated Waste Management Policy (2006)
• Achieve integrated and environmentally sustainable waste management;
• Shift to a complete holistic approach including recycling and reuse.
13.3.2 Gauteng’s Response to the Economic Crisis, Draft Strategy (2009)
• Creation of a renewable energy sector that enhances sustainable green job creation;
• Ensure the promotion and facilitation of investment in local renewable energy technology
manufacturing facilities;
• Ensure increased investment in programmes and projects that will create large numbers of ‘green’
and decent jobs by both the province and municipalities;

Green Economy for Gauteng
133
• Focus on community orientated waste management and recycling programmes; and
• Establishment of green corps that assumes responsibility for management of environmental
rehabilitation programmes.
“Gauteng will be a leading African City region that plays a key role in driving and supporting the boundless
opportunity presented by African economic growth in the 21st Century. It will be the Southern hub of
innovation, sustainable settlement, knowledge and culture on the continent and will be richly integrated
with African cultural, economic and communication networks.” Pg 20
13.3.3 The Gauteng Employment Growth and Development Strategy 2009 – 2014 (2009 Draft)
• Vastly increase opportunities for the unemployed;
• Support labour-absorbing sectors;
• Create 150 000 sustainable, full-time employment opportunities directly by 2015.
13.3.4 Gauteng Integrated Energy Strategy (Nov 2009 Draft)
Energy vision: A Gauteng province that is powered by a low carbon economy with a significant share of
national “green jobs”, and accessible and affordable energy services that do not impact on the health of
people or the environment.
The Premier stated that “we in Gauteng are committed to:
• moving our province to a low-carbon economy;
• ensuring that our carbon emissions peak and start declining by 2030;
• ensuring that we will improve on our record of energy efficiency;
• ensuring that we scale up hugely our renewable energy options; and
• ensuring that we make energy access for the poor a priority.”135
Furthermore, the purpose of the Gauteng Integrated Energy Strategy and Implementation Plan is to “direct
the way that energy is supplied and used within the Gauteng province during the next 5 years (2014); 16
years (2025); 46 years (2055) and beyond, in an integrated and sustainable manner. This will be done by
advancing and driving energy efficiency and supporting an energy supply mix that includes renewable
energy technologies across the province. Within Gauteng, solar energy (solar water heaters) and energy
from landfill gas are the most obvious short term renewable energy sources with the potential to buy
renewable energy from wind and concentrated solar power from outside the provincial boundaries.”136
2025 Targets:
• 15% improvement in energy efficiency across all sectors,
• 16% power from Renewables,
• 27% reduction in carbon emissions,
135
Dept of Local Gov & Housing, Gauteng Integrated Energy Strategy, i. 136
Ibid., 1.

Green Economy for Gauteng
134
• 95% installation of energy efficient water heaters in middle-to-high income homes and 50% in low
income homes.
13.3.5 Gauteng Province Air Quality Management Plan (Aug 2009)
• Proposes Provincial Ambient Air Quality Standards
• Proposes interventions in
o Climate Change and Energy
� To reduce the generation of greenhouse gases
o Domestic Fuel Burning
� To reduce the current air pollution concentrations to acceptable levels in domestic
fuel burning areas
o Industrial Emissions
� To comply with both national emission limits and ambient air quality standards.
o Mine Tailings Dams
� To minimise dust deriving from these sources
o Vehicle Tailpipe Emissions
� To reduce vehicle tailpipe emissions
o Noise Pollution
� To reduce the noise levels to acceptable residential levels at all times.
o Cooperative Governance and Information Management
� To ensure that information is readily available to stakeholders through sufficient
data collection, collation and dissemination

Green Economy for Gauteng
135
14 Appendix E: Funding Options
14.1 World Bank
The World Bank in conjunction with the US government has launched the Renewables and Efficiency
Deployment Initiative (or Climate REDI). This programme includes three new clean energy technology
programs and funding needed to launch a renewable energy program under the World Bank’s Strategic
Climate Fund:
• The Solar and LED Energy Access Program will accelerate deployment of affordable solar home
systems and LED lanterns to those without access to electricity. This program will yield immediate
economic and public health benefits by providing households with low-cost and quality-assured
solar alternatives to expensive and polluting kerosene.
• The Super-efficient Equipment and Appliance Deployment Program will harness the market and
convening power of MEF countries to improve efficiency for appliances traded throughout the
world. A number of MEF countries have implemented, or are exploring, incentive programs for
energy-efficient appliances. Coordinating incentives, standards and labelling systems can create
unprecedented economies of scale for these appliances.
• The Clean Energy Information Platform will establish an online platform for MEF countries to
exchange technical resources, policy experience and the infrastructure to coordinate various
activities in deploying clean energy technologies, and share this information with the world.
• The Scaling-up Renewable Energy Program (S-REP), under the World Bank’s Strategic Climate Fund,
will provide policy support and technical assistance to low-income countries developing national
renewable energy strategies and underwrite additional capital costs associated with renewable
energy investments. Funding through Climate REDI will accelerate the launch of S-REP.
The combined budget for these programs is $350 million over five years
14.2 Carbon Finance
Carbon finance is available to large projects that reduce carbon emissions. There are two options:
• CERs or Certified Emission Reductions through the UN sanctioned Kyoto protocol
• VERs or Voluntary Emission Reductions, of which there are a number of trading schemes
These options should be explored for each project approached.

Green Economy for Gauteng
136
15 Appendix E: Additional information on Local Food Production
15.1 Case Study: The Cuba Experience
The Cuban experience of localising the food system highlights many of the benefits of local food
economies, as well as some of the limitations. Trade embargos from the USA coupled with the collapse of
the Soviet Union in 1991 left the island nation of Cuba without a reliable supply of fossil fuels and imported
food as well as agrochemicals and farm machinery, yields fell dramatically and the country experienced a
food crisis for several years during what was referred to as the Special Period in Peacetime (Rosset,
2002:xvi). “Cuba was forced to turn inward, toward its own natural and human resources, and top both old
and new ways to boost production of basic foods without relying on imports” (Rosset, 2002:xiv). Food
security was declared a national priority (Nieto & Delgado, 2002:40; Levins, 2002:278). Other priorities
relating to the agricultural sector and food production included economic solvency (focussing on
economies aimed at social development and security rather than profit maximisation) and protection of
health (Levins, 2002:278). The government invested heavily into local food production to combat food
shortages premised on organic methods of production, including massive urban agriculture programmes
(Duenas et al., 2009:31). Major changes in the structure of Cuba’s food system as it localised include the
“diversification of channels of food distribution, and the greater variety of income sources for the
population” (Nieto & Delgado, 2002:48).
“The ecological transformation of Cuban agriculture since the early 1990s is overwhelmingly complex,
including changes in agrotechnology, land tenure and use, social organisation of production and research,
education programmes and financial structures” (Levins, 2002:279). Food security has been promoted
through self provisioning programmes (in home gardens, backyards or cooperatives) as well as the
availability of basic food produce at cost (Nieto & Delgado, 2002:48). More vulnerable groups (such as
children, pregnant women and the elderly) are monitored and assisted with special programmes (Nieto &
Delgado, 2002:49) and food directed to those most in need (e.g., when milk was in short supply, it was
prioritised for children first), (Levins, 2002:278).
Urban agriculture in Cuba has been a major part of the agricultural movement with a strong focus on the
productive use of space for food security. The core principles of urban agriculture in Cuba, as identified by
Companioni et al. (2002:220), include “organic methods, which do not contaminate the environment; the
rational use of local resources; and the direct marketing of produce to consumers”. The government
invested heavily into urban agriculture whereby “an extensive network was built up for the provision of
training courses and extension services, and the distribution of seeds and tools” (Duenas et al., 2009:31).
The production methods varied from raised beds and balcony gardens to intensely concentrated
hydroponic farms and other specialised systems, in total creating over 160 000 jobs for people from a
variety of backgrounds (Companioni et al., 2002:221). An estimated 90 percent of fresh produce consumed
in Havana was being produced in and around the city by 2002 (Companioni et al., 2002:235). Today there
are an estimated 350 000 ‘urban farmers’ growing crops on over 700 000 hectares, with production from
Green Economy for Gauteng
137
cities increasing from 4000 tonnes per annum in 1994 to over 400 000 tonnes in the first three months of
2009 (Duenas et al., 2009:31).
Through concentrating on low external input production in the absence of cheap oil, Cuba has created
“highly efficient organic systems” (Duenas et al., 2009:31), ensured food security and created jobs -
showing to the world the possibility of producing sufficient food in a low carbon future. Figure 29 below
highlights how today Cuba is the only country in the world that is living within the world’s biocapacity and
simultaneously promotes a high quality of life137, inferring that it is the only country that has been able to
achieve environmentally sustainable human development. “What if economic development is not a goal in
itself but a means to enriching life and preserving nature, with emphasis on equity, health, education,
culture, recreation, and mutual caring in an environment which is sustainable, diverse and people friendly?
That is the unique path that Cuba has embarked on” (Levins, 2002:276).
137
“Countries’ progress towards sustainable development can be assessed using the United Nations Development
Programme’s (UNDP) Human Development Index (HDI) as an indicator of well-being, and the footprint asa measure of
demand on the biosphere. The HDI is calculated from life expectancy, literacy and education, and per capita GDP.
UNDP considers an HDI value of more than 0.8 to be “high human development”. Meanwhile, a footprint lower than
1.8 global hectares per person, the average biocapacity available per person on the planet, could denote sustainability
at the global level” (WWF, 2006:19).

Green Economy for Gauteng
138
Figure 29: Human Development Index and Ecological Footprint
Source: WWF, 2006
Green Economy for Gauteng
139
15.2 Environmental Benefits of Food System Regionalisation
A key aspect of local food economies, beyond building community resilience through strengthening the
local economy and social networks, is the potential for promoting increased environmental sustainability
through the localisation of the food system. The most published finding is the potential for reduction in
embodied energy associated with the localisation of food production and distribution. Reducing the
distance that food travels unnecessarily offers important savings in the total contribution of the food
system to greenhouse gas emissions. The food miles argument presents one aspect of the total energy
embodied in production but, as has been described, investigation into both what is being produced and
methods of production are almost of more importance. Embodied energy can further be reduced by other
characteristics associated with local food economies including reduced refrigeration (produce is typically
picked on the day of sale) and packaging (as consumers receive produce more directly from the farmers
and do not require excessive packaging).
It appears that the greatest reductions in contributions to climate change, as well as other environmental
challenges, stand to be made from changes of on-farm practices. Research by Pretty (2001:07) suggests
that the greatest externalities of the modern food system lie in on-farm practices (i.e., the impact on the
environment is greater on-farm than as a result of international transport). In this context, the links
between local and the tendency towards agroecological production and ethical consumption become
increasingly important.
Local food economies rest on producers being able to grow a diversity of fresh produce for local
consumption which typically takes place on smaller and more concentrated farms138
. Agroecologically
grown produce requires stronger supporting agricultural knowledge systems but less external inputs, which
in the context of peak oil, is a key feature of local food economies. Furthermore, “organic farming fits
directly into local food systems. Consumers are looking for fresh, high quality, good tasting produce”
(Francis et al., 2008:92). Consumers who actively support local food economies are typically also supportive
of agroecological and environmentally sound methods of production. Experiences with local food
movements have shown that as consumers become increasingly connected with their food system and the
associated impacts thereof, they actively seek healthier and environmentally friendlier food as well
(Hinrichs, 2003:36). Agroecological methods of production reduce dependency of farmers on increasingly
expensive external inputs and improve the long term sustainability of their farming enterprise by building
the integrity of the supporting natural environment (Pretty, 2001:07; Peters et al., 2008:02). In this way,
local and organic is to the benefit of the small-scale farmer as well. A characteristic of local food economies
is the support of a wider diversity of crops contributing to investment in the integrity of supporting
ecosystems critical for building strong local foodsheds. The environmental benefits of agroecological
approaches often linked to local food systems are numerous, and include the protection of watersheds,
encouraging biodiversity and enhancing wildlife habitats (Francis et al., 2008:92).
138
“Small-scale, ‘local’ farmers are not inherently better environmental stewards, although having fewer acres or
stock to care for may make this more likely” (Hinrichs, 2003:35).

Green Economy for Gauteng
140
Furthermore, local food economies are associated with a reduction in waste through the reduction of
packaging. The understanding between producer and consumer allows the producer to sell produce that
does not conform to typical retail standards and thereby reduce food waste of products that would
otherwise not be considered fit for retail sale. For example, farmers wanting to sell zucchinis to pack sheds
to be sent to distribution warehouses to be sold at supermarkets need to ensure that the zucchinis are
within a very limited length range so that they can fit in the standard styrofoam packaging. These standards
can often be prohibitive for small-scale farmers who grow with agroecological methods (Reardon et al,
2002 in Pimbert, 2008:20).
Local food economies further encourage the recycling of nutrients within the local system. Kitchen waste
becomes a nutrient input for backyard and urban food gardens whilst smaller farms associated with local
food systems are better suited to the recycling of nutrients on farm through the diversified range of
activities they are engaged in and by adopting a closed loop or systems approach to the entire local food
economy (Norberg-Hodge, Merrifield & Gorelick, 2002:33). This overcomes some of the major
environmental challenges associated with the modern food system, such as the waste produced by
concentrated animal farm operations or the need for bringing in high external inputs to replenish nutrients
(Halweil, 2004:39).
15.3 Social Benefits of Food System Regionalisation
Fresh organic vegetables are estimated to be on average ten times more nutritious than vegetables
purchased from conventional supermarkets (Norberg-Hodge, 2009:03). Local food systems are also
considered to decrease food safety risks through the decentralisation of food production (Gussow, 1999 in
Peters et al., 2008:03).
Local producers are associated with primary production of a diverse range of fresh produce ranging from
vegetables, fruit, nuts and cereals to meat, milk and eggs which has implications for increasing access to
nutritional fresh produce for local consumers’ part of the local food economy. Furthermore, local food
systems tend to promote the eating of seasonal produce that are adapted to local climates.
Local food economies have important roles to play in building community connections as well. “Not only
does an adequate, varied diet contribute to individual health, but the way food is grown, distributed and
eaten also profoundly affects the environmental, social, spiritual and economic well-being of the
community” (Feenstra, 1997:28).
An important and often difficult to measure benefit from local food economies is the value of reconnecting
with the natural environment and local community through local food initiatives (Pinkerton & Hopkins,
2009:29). Nature deficit disorder (commonly referred to in children who are increasingly disconnected from
the natural world) results not only in poor physical conditions but impacts on mental and spiritual wellbeing
as well, and is an increasing concern for both urban and rural residents alike (Louv, 2007). Children
Green Economy for Gauteng
141
connected to their food systems and natural environments arguably have stronger self-esteem and
healthier identities (Norberg-Hodge, 2009b:05).
15.4 Building Knowledge Networks
Achieving food sovereignty and long term sustainability, which safeguards the livelihoods of the millions of
families relying on agriculture, will require us to transcend modern understanding and approaches to
agriculture. This will only be achieved if we embrace a more transdisciplinary approach which recognises
both the complexity and multiplicity of food systems (IAASTD, 2008). This will rest on valuing agricultural
knowledge systems and technology, and require us to become wiser and more creative in our solutions to
the many challenges presented with navigating a new path towards achieving real development which is
indeed sustainable. A key recommendation in preparing Gauteng for a more sustainable future with a
gentle transition into a low energy future is through building knowledge systems that promote learning for
change (Pretty, 2002). Feenstra (1997:34) identifies leadership, collaboration and civic renewal as crucial in
building stronger local food economies linked to equitable and sustainable communities. Learning through
experience has been highlighted as one of the most meaningful methods of shifting behaviour and again
points to the importance of connections with local food systems that allow opportunities for such
engagement. In this way, local food economies are as much about the flow of knowledge and social capital
as resources, as about the flow of food itself.

Green Economy for Gauteng
142
16 Appendix F: Water Demand Management Project
The Water Demand Management Programme, hosted by the DBSA, and supported by the Swedish
International Development Cooperation Agency (Sida), is a Southern Africa Development Community
(SADC) region Programme. The development objective of the Programme is “to entrench a Water Demand
Management (WDM) culture in Southern Africa that contributes to the SADC goals of regional integration
and poverty alleviation through pro-poor, efficient and sustainable utilisation of water in the SADC region.”
The Programme intends to build on the two previous phases of a Sida financed WDM project, implemented
between 1997 and 2004. The principle objectives of the Programme include: garnering greater acceptance
and consolidation of pro-poor WDM practices in Southern Africa; implementing WDM activities and
creating confidence among credit institutions to finance WDM projects.
All activities the Programme will undertake can be categorised into one, or a combination of three different
types of services: namely, support services, project development service and finance facilitation services.
Support services will assist in promoting a favourable environment in which WDM actions can take place.
Project development services are largely grant-based. It is one of the objectives of the WDM Programme
that services move from being grant-based to loan based.
It is envisaged that the support services will create a well informed demand. The project development and
finance facilitation services will be offered in response to a demand for actual implementation of WDM
practices. In order to find out more about how to request assistance with implementation on WDM
activities through the Demand-Response system, please contact the Project Implementation Unit (PIU)
directly.
WDM Project Contact Details
Dr Themba Gumbo (Project Manager), Joanne Cowell (Communications Specialist), Nontokozo Mhlanga
(Project Administrator).
Tel: +27 11 313 3362
Fax: +27 11 206 3362
Email: [email protected]
Related Documents