Geophys. J. Int. (2010) 182, 1073–1086 doi: 10.1111/j.1365-246X.2010.04675.x GJI Seismology A detailed study of the site effects in the volcanic area of Campi Flegrei using empirical approaches Anna Tramelli, Danilo Galluzzo, Edoardo Del Pezzo and Mauro A. Di Vito Istituto Nazionale di Geofisica e Vulcanologia, Sezione di Napoli – Osservatorio Vesuviano, Via Diocleziano 328, 80124, Napoli, Italy. E-mail: [email protected] Accepted 2010 May 20. Received 2010 May 5; in original form 2009 July 23 SUMMARY Campi Flegrei is a highly populated active caldera in the south of Italy. Several hundred thou- sand people live within this area, which is characterized by seismicity and ground deformation episodes, known as ‘bradyseism’. For this reason, this area falls into a high-risk category and thus the Italian Civil Defence requires a detailed site-effect estimation. To determine the local amplification of the seismic waves for a high number of sites, we have analysed the seismic recordings of three seismic networks that have been deployed in the Campi Flegrei area over different time periods. The first network was deployed during the bradyseismic crisis of 1982–1984. We selected 22 of the highest magnitude earthquakes that were recorded during this crisis. An additional 22 seismic events were selected from those recorded by the mobile seismic network that has been in operation in the Campi Flegrei area since 2006. The third data set comprises noise recorded by 34 seismic stations that were deployed during the active SERAPIS experiment in 2001 September. The generalized inversion technique and the H/V spectral ratio method were applied to the S waves and coda waves of the earthquakes recorded by the first two seismic networks, to determine the site-transfer functions of the recording stations. The seismic noise recorded by the third network was analysed using the Nakamura’s technique. The results show that the high topographical and geological heterogeneity of the sites located inside the caldera has an important influence on the seismic-wave amplification. Consequently, the site-transfer functions can be different even at sites close to each other. The transfer functions of the sites located outside the caldera are much more regular, apparently due to the more regular topography and geology. Key words: Earthquake ground motions; Site effects 1 INTRODUCTION Determination of region-specific ground motion is of great signif- icance for geologically heterogeneous and highly populated areas. As local site effects can have strong influences on both amplitude and duration of recorded ground shaking, a knowledge of the site- transfer functions (STFs) is fundamental to the hazard definition of an area and for the design of seismic safety facilities (Edwards et al. 2008). Campi Flegrei is a densely populated volcanic area in the south of Italy. The seismic hazard of this area is mainly gener- ated by the occurrence of tectonic earthquakes in the Appenines (e.g. M = 6.9, 1980 November 23; Nunziata 2004) and by lo- cal seismicity associated with the bradyseismic phenomena (Aster et al. 1989). Campi Flegrei is a nested caldera that is characterized by a highly complex geological and topographical structure (Di Vito et al. 1999); this complexity can influence the behaviour of seismic waves near the surface (Borcherdt 1970). As was shown for the 1980 November 23, earthquake (Pantosti & Valensise 1993), large differences in the damage to buildings were seen in areas that were relatively close to each other, which were not justified by building construction quality alone (Nunziata 2004). The high volcanic risk associated with possible unrest of the Campi Flegrei area stimulated the Italian Civil Defence (the DPC) to ask for detailed site-effect analyses that can be used for precise estimations of the ground motion caused by local earthquakes. There are several techniques to estimate such site responses, the most common of which is the standard spectral ratio (SSR) method, which was developed by Borcherdt (1970). This method works by dividing the spectrum observed at the analysed site by that observed at a reference site that is characterized by negligible site amplification, and it is based on the assumption that the two stations are close to each other in comparison to the source-to-site distance. This SSR method was recast by Andrews (1986) into the gen- eralized inversion technique (GIT), by simultaneous solving of the data of multiply recorded events. This GIT method allows the de- termination of the source, site and path effects simultaneously. For the GIT, a reference site is necessary to constrain the solu- tion: as a reference, the network average (Phillips & Aki 1986; C 2010 The Authors 1073 Journal compilation C 2010 RAS Geophysical Journal International

Welcome message from author
This document is posted to help you gain knowledge. Please leave a comment to let me know what you think about it! Share it to your friends and learn new things together.
Transcript
Geophys. J. Int. (2010) 182, 1073–1086 doi: 10.1111/j.1365-246X.2010.04675.x
GJI
Sei
smol
ogy
A detailed study of the site effects in the volcanic area of CampiFlegrei using empirical approaches
Anna Tramelli, Danilo Galluzzo, Edoardo Del Pezzo and Mauro A. Di VitoIstituto Nazionale di Geofisica e Vulcanologia, Sezione di Napoli – Osservatorio Vesuviano, Via Diocleziano 328, 80124, Napoli, Italy.E-mail: [email protected]
Accepted 2010 May 20. Received 2010 May 5; in original form 2009 July 23
S U M M A R YCampi Flegrei is a highly populated active caldera in the south of Italy. Several hundred thou-sand people live within this area, which is characterized by seismicity and ground deformationepisodes, known as ‘bradyseism’. For this reason, this area falls into a high-risk categoryand thus the Italian Civil Defence requires a detailed site-effect estimation. To determine thelocal amplification of the seismic waves for a high number of sites, we have analysed theseismic recordings of three seismic networks that have been deployed in the Campi Flegreiarea over different time periods. The first network was deployed during the bradyseismic crisisof 1982–1984. We selected 22 of the highest magnitude earthquakes that were recorded duringthis crisis. An additional 22 seismic events were selected from those recorded by the mobileseismic network that has been in operation in the Campi Flegrei area since 2006. The thirddata set comprises noise recorded by 34 seismic stations that were deployed during the activeSERAPIS experiment in 2001 September. The generalized inversion technique and the H/Vspectral ratio method were applied to the S waves and coda waves of the earthquakes recordedby the first two seismic networks, to determine the site-transfer functions of the recordingstations. The seismic noise recorded by the third network was analysed using the Nakamura’stechnique. The results show that the high topographical and geological heterogeneity of thesites located inside the caldera has an important influence on the seismic-wave amplification.Consequently, the site-transfer functions can be different even at sites close to each other. Thetransfer functions of the sites located outside the caldera are much more regular, apparentlydue to the more regular topography and geology.
Key words: Earthquake ground motions; Site effects
1 I N T RO D U C T I O N
Determination of region-specific ground motion is of great signif-icance for geologically heterogeneous and highly populated areas.As local site effects can have strong influences on both amplitudeand duration of recorded ground shaking, a knowledge of the site-transfer functions (STFs) is fundamental to the hazard definition ofan area and for the design of seismic safety facilities (Edwards et al.2008).
Campi Flegrei is a densely populated volcanic area in thesouth of Italy. The seismic hazard of this area is mainly gener-ated by the occurrence of tectonic earthquakes in the Appenines(e.g. M = 6.9, 1980 November 23; Nunziata 2004) and by lo-cal seismicity associated with the bradyseismic phenomena (Asteret al. 1989).
Campi Flegrei is a nested caldera that is characterized by ahighly complex geological and topographical structure (Di Vitoet al. 1999); this complexity can influence the behaviour of seismicwaves near the surface (Borcherdt 1970). As was shown for the1980 November 23, earthquake (Pantosti & Valensise 1993), large
differences in the damage to buildings were seen in areas that wererelatively close to each other, which were not justified by buildingconstruction quality alone (Nunziata 2004).
The high volcanic risk associated with possible unrest of theCampi Flegrei area stimulated the Italian Civil Defence (the DPC)to ask for detailed site-effect analyses that can be used for preciseestimations of the ground motion caused by local earthquakes. Thereare several techniques to estimate such site responses, the mostcommon of which is the standard spectral ratio (SSR) method, whichwas developed by Borcherdt (1970). This method works by dividingthe spectrum observed at the analysed site by that observed at areference site that is characterized by negligible site amplification,and it is based on the assumption that the two stations are close toeach other in comparison to the source-to-site distance.
This SSR method was recast by Andrews (1986) into the gen-eralized inversion technique (GIT), by simultaneous solving of thedata of multiply recorded events. This GIT method allows the de-termination of the source, site and path effects simultaneously.For the GIT, a reference site is necessary to constrain the solu-tion: as a reference, the network average (Phillips & Aki 1986;
C© 2010 The Authors 1073Journal compilation C© 2010 RAS
Geophysical Journal International
1074 A. Tramelli et al.
Galluzzo et al. 2009), a bedrock station (Hartzell 1992), or theaverage over several rock stations (Bonilla et al. 1997) can bechosen.
A non-reference-site-dependent technique was then introducedby Nakamura (1989), using the noise spectral ratio between the hor-izontal and vertical components. Lermo & Chavez-Garcia (1993)calculated the direct S-wave horizontal-to-vertical spectral ratios(HVSRs). These two procedures assume that the shear-wave verti-cal component recorded at the surface is not influenced by the localsite conditions.
All of the methods described above were extensively analysedand compared by Field & Jacob (1995). The SSR and GIT methodsare based on similar hypothesis, but the GIT approach is more effi-cient when not all of the events are recorded at some sites. Further-more, the GIT method allows the estimation of useful informationabout the source spectrum of the selected earthquakes. The HVSRapproach is particularly fast and can measure the fundamental fre-quency, not the peak amplitude, especially when the topography iscomplex (Lee et al. 2009) or when the site is located inside a basin(Bindi et al. 2009).
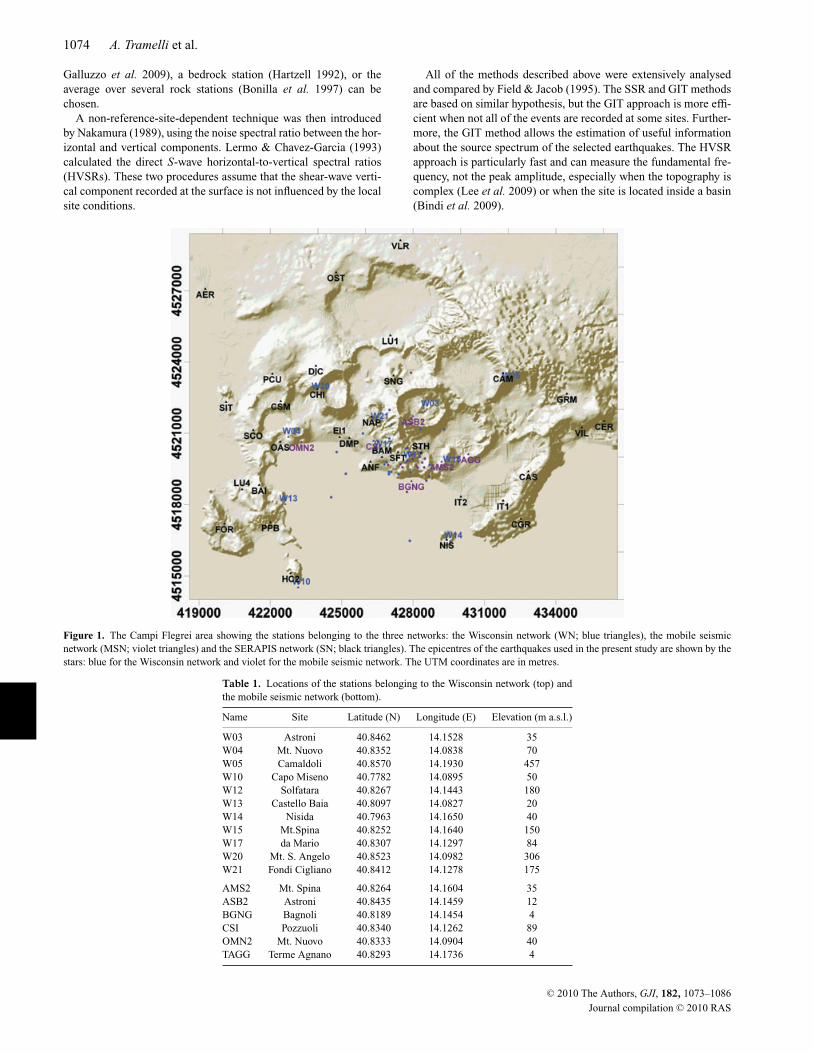
Figure 1. The Campi Flegrei area showing the stations belonging to the three networks: the Wisconsin network (WN; blue triangles), the mobile seismicnetwork (MSN; violet triangles) and the SERAPIS network (SN; black triangles). The epicentres of the earthquakes used in the present study are shown by thestars: blue for the Wisconsin network and violet for the mobile seismic network. The UTM coordinates are in metres.
Table 1. Locations of the stations belonging to the Wisconsin network (top) andthe mobile seismic network (bottom).
Name Site Latitude (N) Longitude (E) Elevation (m a.s.l.)
W03 Astroni 40.8462 14.1528 35W04 Mt. Nuovo 40.8352 14.0838 70W05 Camaldoli 40.8570 14.1930 457W10 Capo Miseno 40.7782 14.0895 50W12 Solfatara 40.8267 14.1443 180W13 Castello Baia 40.8097 14.0827 20W14 Nisida 40.7963 14.1650 40W15 Mt.Spina 40.8252 14.1640 150W17 da Mario 40.8307 14.1297 84W20 Mt. S. Angelo 40.8523 14.0982 306W21 Fondi Cigliano 40.8412 14.1278 175
AMS2 Mt. Spina 40.8264 14.1604 35ASB2 Astroni 40.8435 14.1459 12BGNG Bagnoli 40.8189 14.1454 4CSI Pozzuoli 40.8340 14.1262 89OMN2 Mt. Nuovo 40.8333 14.0904 40TAGG Terme Agnano 40.8293 14.1736 4
C© 2010 The Authors, GJI, 182, 1073–1086
Journal compilation C© 2010 RAS
Site effects at Campi Flegrei 1075
The SSR method was applied in the area of Campi Flegrei usingthe S waves and coda waves of the local earthquakes recorded duringthe bradyseismic crisis of 1982–1984 (Del Pezzo et al. 1993). In thisanalysis the reference station was chosen as the one that recordedthe highest number of earthquakes. This choice was justified by theabsence of a bedrock site.
Other considerations concerning the seismic ground motion ofthe Campi Flegrei area were performed by Nunziata (2007) forthe section that is included in the Neapolitanian municipality.Nunziata et al. (2004) estimated the seismic ground motion in theurban area of Naples due to the 1980 Irpinia earthquake, and cor-related this with the geological setting of each district. Nunziata(2007) compared the same geological setting with the STFs calcu-lated using seismic noise measurements. Petrosino et al. (2008a)arranged a field experiment in the Solfatara crater (in the middleof the Campi Flegrei area) to record the seismic noise for analysis
according to the Nakamura’s method. All of these studies carriedout for the Campi Flegrei area have revealed the great complex-ity of the site, which is due to its geological and topographicalproperties. Here, we aimed to define a complete microzonationof the area using most of the seismic data that have been col-lected, starting from the local earthquakes that occurred during thebradyseismic crisis of 1982–1984. We applied both the HVSR andthe GIT methods, and we have compared these results with eachother and with previously reported results. This analysis was com-pleted by applying HVSR to the seismic-noise data recorded duringthe SEismic Reflection/Refraction Acquisition Project for Imagingcomplex volcanic Structures (SERAPIS) experiment, which wasperformed in 2001 September (Judenherc & Zollo 2005). The fi-nal results are compared to the theoretical HVSR STFs that wereobtained for the sites where the detailed geological structure isavailable.
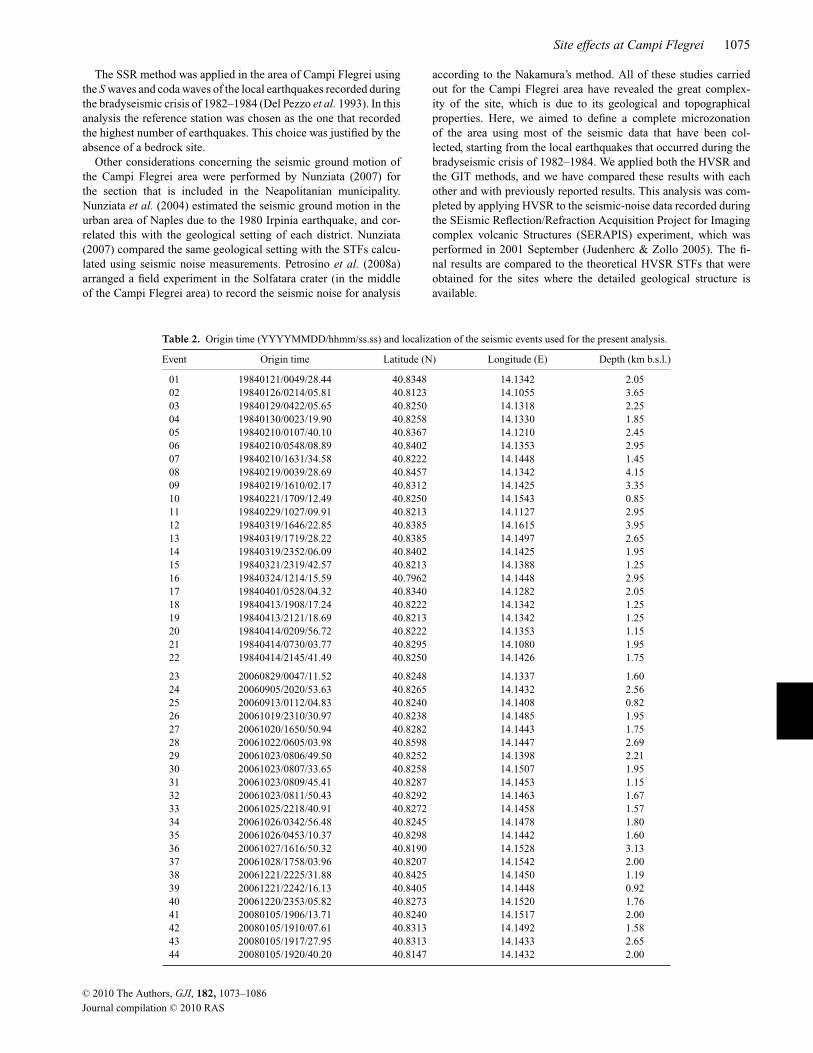
Table 2. Origin time (YYYYMMDD/hhmm/ss.ss) and localization of the seismic events used for the present analysis.
Event Origin time Latitude (N) Longitude (E) Depth (km b.s.l.)
01 19840121/0049/28.44 40.8348 14.1342 2.0502 19840126/0214/05.81 40.8123 14.1055 3.6503 19840129/0422/05.65 40.8250 14.1318 2.2504 19840130/0023/19.90 40.8258 14.1330 1.8505 19840210/0107/40.10 40.8367 14.1210 2.4506 19840210/0548/08.89 40.8402 14.1353 2.9507 19840210/1631/34.58 40.8222 14.1448 1.4508 19840219/0039/28.69 40.8457 14.1342 4.1509 19840219/1610/02.17 40.8312 14.1425 3.3510 19840221/1709/12.49 40.8250 14.1543 0.8511 19840229/1027/09.91 40.8213 14.1127 2.9512 19840319/1646/22.85 40.8385 14.1615 3.9513 19840319/1719/28.22 40.8385 14.1497 2.6514 19840319/2352/06.09 40.8402 14.1425 1.9515 19840321/2319/42.57 40.8213 14.1388 1.2516 19840324/1214/15.59 40.7962 14.1448 2.9517 19840401/0528/04.32 40.8340 14.1282 2.0518 19840413/1908/17.24 40.8222 14.1342 1.2519 19840413/2121/18.69 40.8213 14.1342 1.2520 19840414/0209/56.72 40.8222 14.1353 1.1521 19840414/0730/03.77 40.8295 14.1080 1.9522 19840414/2145/41.49 40.8250 14.1426 1.75
23 20060829/0047/11.52 40.8248 14.1337 1.6024 20060905/2020/53.63 40.8265 14.1432 2.5625 20060913/0112/04.83 40.8240 14.1408 0.8226 20061019/2310/30.97 40.8238 14.1485 1.9527 20061020/1650/50.94 40.8282 14.1443 1.7528 20061022/0605/03.98 40.8598 14.1447 2.6929 20061023/0806/49.50 40.8252 14.1398 2.2130 20061023/0807/33.65 40.8258 14.1507 1.9531 20061023/0809/45.41 40.8287 14.1453 1.1532 20061023/0811/50.43 40.8292 14.1463 1.6733 20061025/2218/40.91 40.8272 14.1458 1.5734 20061026/0342/56.48 40.8245 14.1478 1.8035 20061026/0453/10.37 40.8298 14.1442 1.6036 20061027/1616/50.32 40.8190 14.1528 3.1337 20061028/1758/03.96 40.8207 14.1542 2.0038 20061221/2225/31.88 40.8425 14.1450 1.1939 20061221/2242/16.13 40.8405 14.1448 0.9240 20061220/2353/05.82 40.8273 14.1520 1.7641 20080105/1906/13.71 40.8240 14.1517 2.0042 20080105/1910/07.61 40.8313 14.1492 1.5843 20080105/1917/27.95 40.8313 14.1433 2.6544 20080105/1920/40.20 40.8147 14.1432 2.00
C© 2010 The Authors, GJI, 182, 1073–1086
Journal compilation C© 2010 RAS
1076 A. Tramelli et al.
2 T H E DATA S E T
To obtain a detailed site-effect estimation of the Campi Flegrei area,the data recorded by most of the seismic stations operating in thearea since 1982 were collected and analysed. The data set used forthis site-effect evaluation in the Campi Flegrei area can be dividedinto the following three groups.
(1) Data recorded by the seismic network of the Univer-sity of Wisconsin, Wisconsin, USA (the Wisconsin network;WN).
(2) Data recorded by the mobile seismic network of the NationalInstitute of Geophysics and Volcanology (INGV), Vesuvian Obser-vatory (the mobile seismic network; MSN).
(3) Data collected during the active SERAPIS experiment (theSERAPIS network; SN).
2.1 The Wisconsin network
The data belonging to the WN group were recorded during the1982–1984 bradyseismic crisis at Campi Flegrei. This crisis wascharacterized by a total ground uplift of more than 1.7 m (Asteret al. 1989). During this crisis, thousands of shallow (depth <3 km),low magnitude (Md ≤ 4.0) earthquakes were recorded. The seismicactivity became more intense during 1984 March and April, with alarge swarm on 1984 April 1. The seismic events were recorded bythe WN that was deployed in the Campi Flegrei area by the Univer-sity of Wisconsin, USA. This was composed of short-period, three-component, high-dynamic-range (106 dB) digital stations, with alocal recording system. In Fig. 1, the station positions are indicatedby blue triangles, and Table 1 gives the station coordinates.
The data were recorded with different sampling rates, which weresometimes changed during the field surveys. To provide a uniform
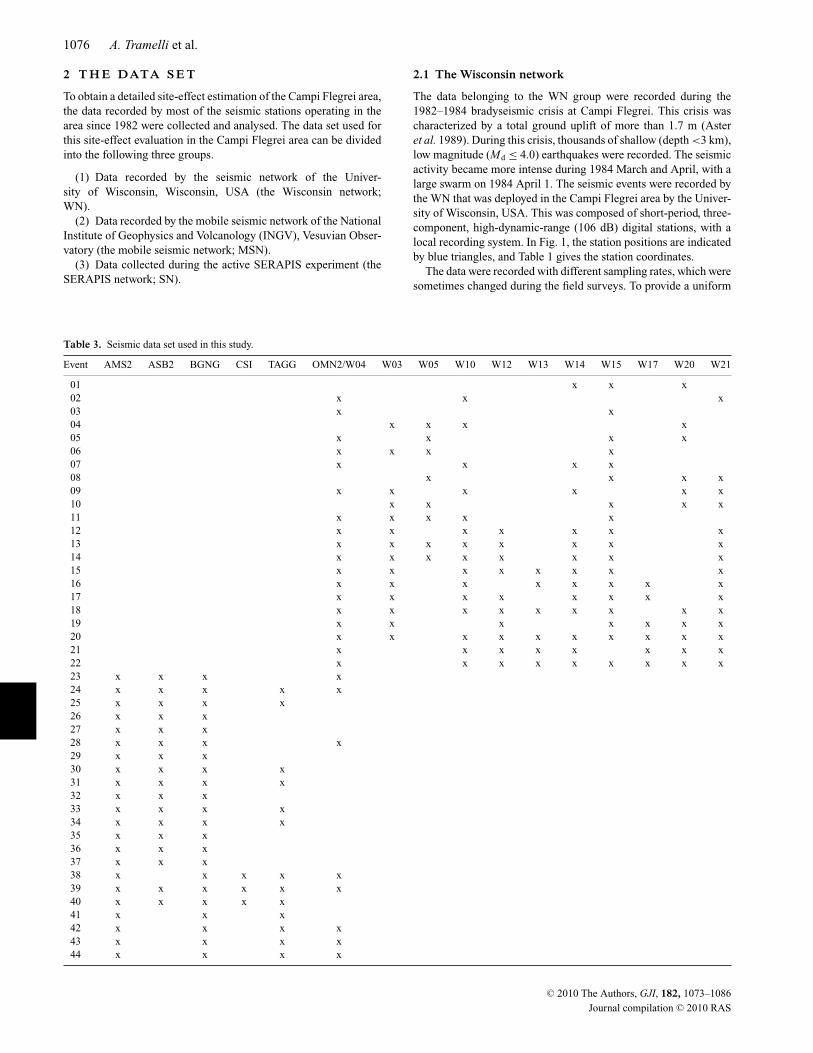
Table 3. Seismic data set used in this study.
Event AMS2 ASB2 BGNG CSI TAGG OMN2/W04 W03 W05 W10 W12 W13 W14 W15 W17 W20 W21
01 x x x02 x x x03 x x04 x x x x05 x x x x06 x x x x07 x x x x08 x x x x09 x x x x x x10 x x x x x11 x x x x x12 x x x x x x x13 x x x x x x x x14 x x x x x x x x15 x x x x x x x x16 x x x x x x x x17 x x x x x x x x18 x x x x x x x x x19 x x x x x x x20 x x x x x x x x x x21 x x x x x x x x22 x x x x x x x x x23 x x x x24 x x x x x25 x x x x26 x x x27 x x x28 x x x x29 x x x30 x x x x31 x x x x32 x x x33 x x x x34 x x x x35 x x x36 x x x37 x x x38 x x x x x39 x x x x x x40 x x x x x41 x x x42 x x x x43 x x x x44 x x x x
C© 2010 The Authors, GJI, 182, 1073–1086
Journal compilation C© 2010 RAS
Site effects at Campi Flegrei 1077
data set, we resampled all of the records at 100 sps, the lowestsampling rate. We select 22 earthquakes (see Table 2) with highsignal-to-noise ratios that were uniformly spread in the area. InFig. 1, the epicentres of these selected earthquakes are shown withblue stars, and Table 3 indicates the recording stations.
2.2 The mobile seismic network
The second data set comprises 22 earthquakes that were recordedby the MSN, which occurred during the years 2006 and 2008 (seeTable 2). The magnitudes of these earthquakes were relatively low(Md ≤ 2), and their epicentre locations were limited to a narrowarea (Fig. 1, violet stars). We selected six high dynamics (24 bit)digital stations of the MSN located in the Campi Flegrei area, fiveof which were equipped with broad-band sensors, and one with ashort-period sensor (CSI). Fig. 1 shows the station locations (violettriangles), and Table 1 gives their coordinates. The timing signalwas synchronized using external GPS, and the sampling rates wereset to 100 or 125 sps. As before, all of the signals were resampledat 100 sps. Most of these stations are still working in the CampiFlegrei area.
2.3 The SERAPIS network
The SERAPIS temporary network was deployed in the area ofCampi Flegrei during the SERAPIS experiment that was carriedout in 2001 September. The seismometer network covered an areaof more than 50 × 50 km2, which included the bays of Naplesand Pozzuoli (Judenherc & Zollo 2005). For two weeks, the shipLe Nadir produced source shots with an air gun inside PozzuoliBay, following a grid pattern along N–S and E–W lines. The on-land acquisition array was designed to provide very high data den-sity, and comprised 18 vertical and 66 three-component sensorsthat continuously recorded during the experiment. We selected 33three-component stations located in the Campi Flegrei area (seeTable 4), and we have analysed the seismic noise recorded duringthe experiment; Fig. 1 shows the stations used for this site analy-sis (black triangles). As the signal-to-noise ratios of the shots werelow, we decided to analyse the whole seismograms, including thetransient signals (Parolai & Galiana-Merino 2006). The data set ofthe SERAPIS network selected for this analysis comprises 100 minof recordings of the seismic noise (and shots) for each of the stationsselected.
2.4 Earthquake location
The seismic events used for the STF analysis (from the WN andMSN groups) were picked manually for both the P and S-wave firstarrivals. The events recorded by the MSN were of lower magni-tude than those recorded by the WN. Sometimes the S-wave onsetwas difficult to pick; in these cases, we chose an S-wave onset at1.7 times the P-wave traveltime. We selected earthquakes recordedby at least three of the stations, with high signal-to-noise ratios. Thelocations were obtained using the NonLinLoc programme (Lomaxet al. 2000), which determines the hypocentre location within a 3-Dgrid using a systematic grid search. The velocity model developedby Judenherc & Zollo (2005) was used. Fig. 1 shows the locations ofthe earthquakes (WN, blue stars; MSN, violet stars). Table 2 givesthe hypocentre coordinates.
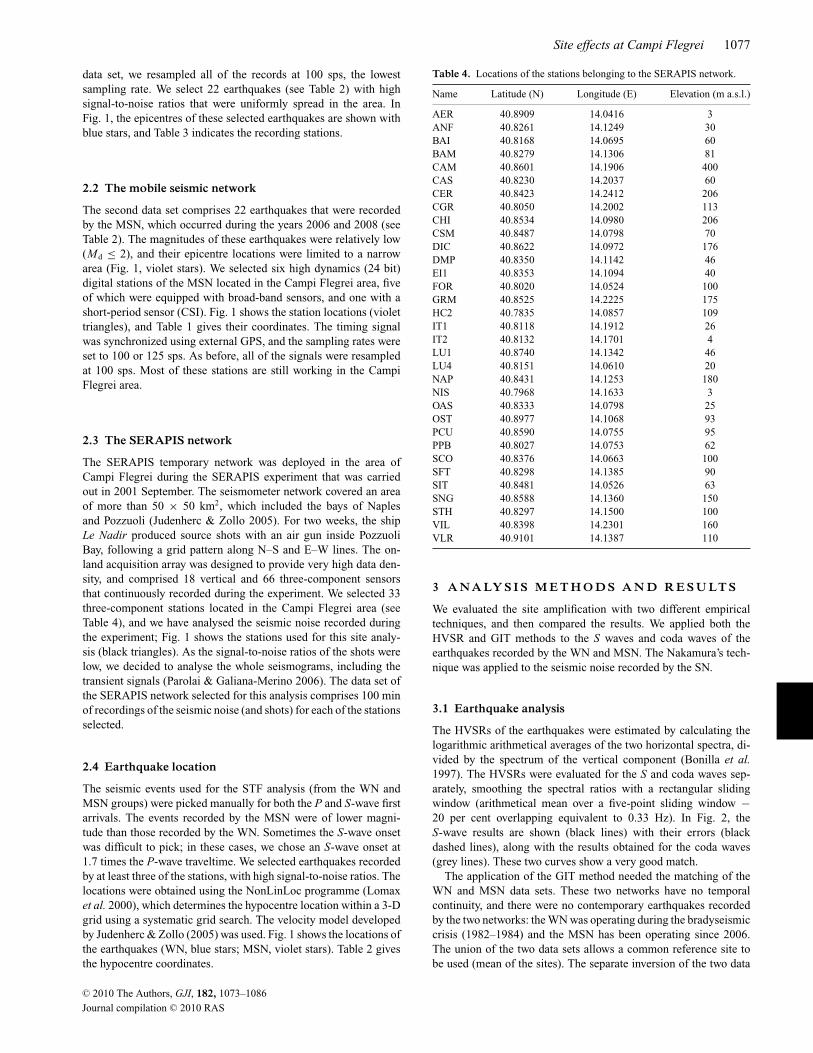
Table 4. Locations of the stations belonging to the SERAPIS network.
Name Latitude (N) Longitude (E) Elevation (m a.s.l.)
AER 40.8909 14.0416 3ANF 40.8261 14.1249 30BAI 40.8168 14.0695 60BAM 40.8279 14.1306 81CAM 40.8601 14.1906 400CAS 40.8230 14.2037 60CER 40.8423 14.2412 206CGR 40.8050 14.2002 113CHI 40.8534 14.0980 206CSM 40.8487 14.0798 70DIC 40.8622 14.0972 176DMP 40.8350 14.1142 46EI1 40.8353 14.1094 40FOR 40.8020 14.0524 100GRM 40.8525 14.2225 175HC2 40.7835 14.0857 109IT1 40.8118 14.1912 26IT2 40.8132 14.1701 4LU1 40.8740 14.1342 46LU4 40.8151 14.0610 20NAP 40.8431 14.1253 180NIS 40.7968 14.1633 3OAS 40.8333 14.0798 25OST 40.8977 14.1068 93PCU 40.8590 14.0755 95PPB 40.8027 14.0753 62SCO 40.8376 14.0663 100SFT 40.8298 14.1385 90SIT 40.8481 14.0526 63SNG 40.8588 14.1360 150STH 40.8297 14.1500 100VIL 40.8398 14.2301 160VLR 40.9101 14.1387 110
3 A NA LY S I S M E T H O D S A N D R E S U LT S
We evaluated the site amplification with two different empiricaltechniques, and then compared the results. We applied both theHVSR and GIT methods to the S waves and coda waves of theearthquakes recorded by the WN and MSN. The Nakamura’s tech-nique was applied to the seismic noise recorded by the SN.
3.1 Earthquake analysis
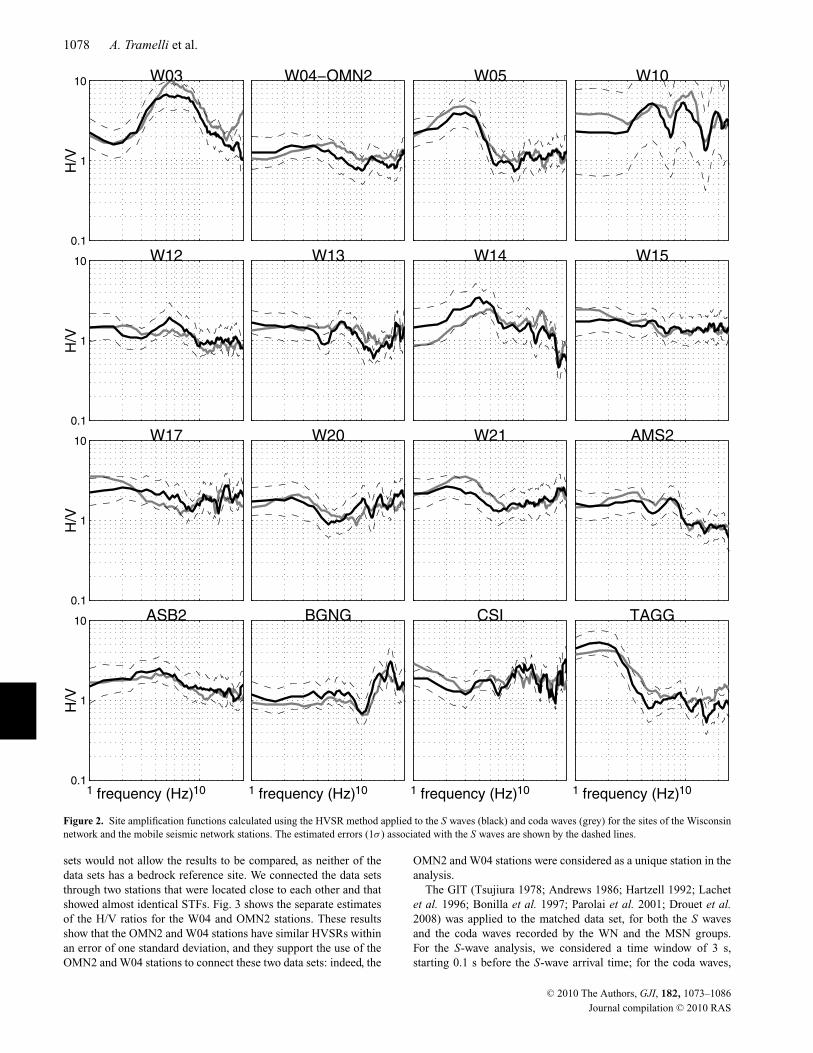
The HVSRs of the earthquakes were estimated by calculating thelogarithmic arithmetical averages of the two horizontal spectra, di-vided by the spectrum of the vertical component (Bonilla et al.1997). The HVSRs were evaluated for the S and coda waves sep-arately, smoothing the spectral ratios with a rectangular slidingwindow (arithmetical mean over a five-point sliding window −20 per cent overlapping equivalent to 0.33 Hz). In Fig. 2, theS-wave results are shown (black lines) with their errors (blackdashed lines), along with the results obtained for the coda waves(grey lines). These two curves show a very good match.
The application of the GIT method needed the matching of theWN and MSN data sets. These two networks have no temporalcontinuity, and there were no contemporary earthquakes recordedby the two networks: the WN was operating during the bradyseismiccrisis (1982–1984) and the MSN has been operating since 2006.The union of the two data sets allows a common reference site tobe used (mean of the sites). The separate inversion of the two data
C© 2010 The Authors, GJI, 182, 1073–1086
Journal compilation C© 2010 RAS
1078 A. Tramelli et al.
Figure 2. Site amplification functions calculated using the HVSR method applied to the S waves (black) and coda waves (grey) for the sites of the Wisconsinnetwork and the mobile seismic network stations. The estimated errors (1σ ) associated with the S waves are shown by the dashed lines.
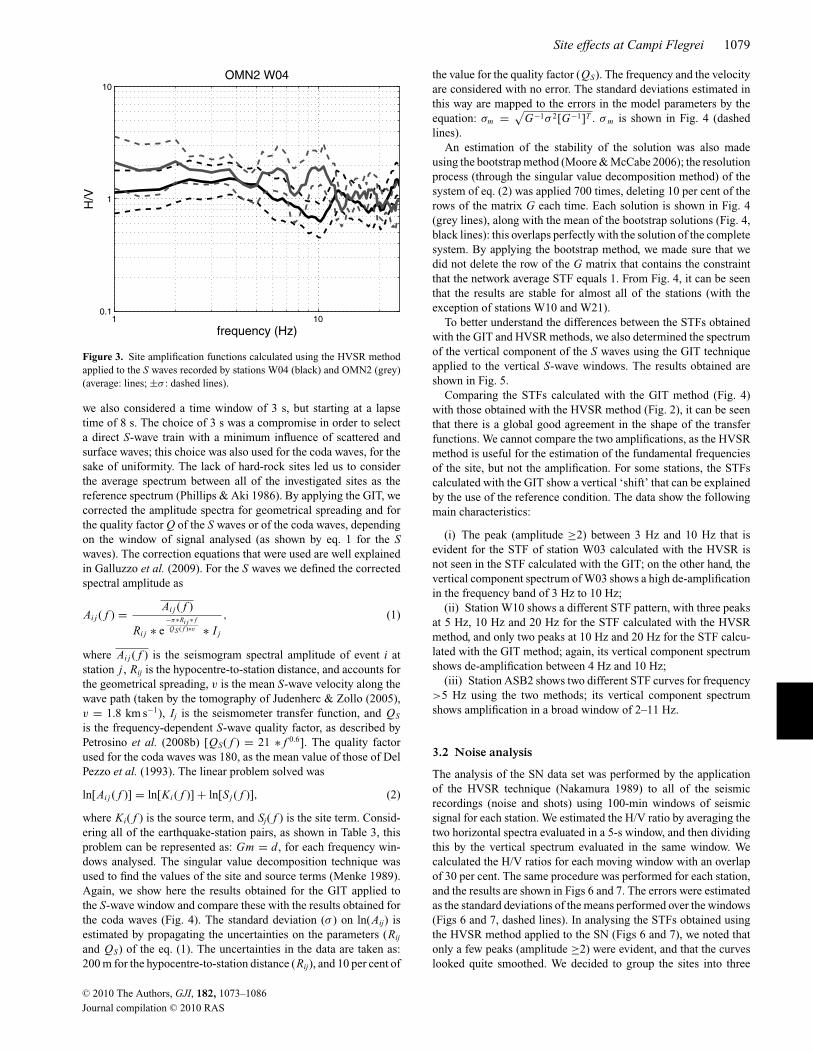
sets would not allow the results to be compared, as neither of thedata sets has a bedrock reference site. We connected the data setsthrough two stations that were located close to each other and thatshowed almost identical STFs. Fig. 3 shows the separate estimatesof the H/V ratios for the W04 and OMN2 stations. These resultsshow that the OMN2 and W04 stations have similar HVSRs withinan error of one standard deviation, and they support the use of theOMN2 and W04 stations to connect these two data sets: indeed, the
OMN2 and W04 stations were considered as a unique station in theanalysis.
The GIT (Tsujiura 1978; Andrews 1986; Hartzell 1992; Lachetet al. 1996; Bonilla et al. 1997; Parolai et al. 2001; Drouet et al.2008) was applied to the matched data set, for both the S wavesand the coda waves recorded by the WN and the MSN groups.For the S-wave analysis, we considered a time window of 3 s,starting 0.1 s before the S-wave arrival time; for the coda waves,
C© 2010 The Authors, GJI, 182, 1073–1086
Journal compilation C© 2010 RAS
Site effects at Campi Flegrei 1079
Figure 3. Site amplification functions calculated using the HVSR methodapplied to the S waves recorded by stations W04 (black) and OMN2 (grey)(average: lines; ±σ : dashed lines).
we also considered a time window of 3 s, but starting at a lapsetime of 8 s. The choice of 3 s was a compromise in order to selecta direct S-wave train with a minimum influence of scattered andsurface waves; this choice was also used for the coda waves, for thesake of uniformity. The lack of hard-rock sites led us to considerthe average spectrum between all of the investigated sites as thereference spectrum (Phillips & Aki 1986). By applying the GIT, wecorrected the amplitude spectra for geometrical spreading and forthe quality factor Q of the S waves or of the coda waves, dependingon the window of signal analysed (as shown by eq. 1 for the Swaves). The correction equations that were used are well explainedin Galluzzo et al. (2009). For the S waves we defined the correctedspectral amplitude as
Ai j ( f ) = Ai j ( f )
Ri j ∗ e−π∗Ri j ∗ f
QS ( f )∗v ∗ I j
, (1)
where Ai j ( f ) is the seismogram spectral amplitude of event i atstation j , Rij is the hypocentre-to-station distance, and accounts forthe geometrical spreading, v is the mean S-wave velocity along thewave path (taken by the tomography of Judenherc & Zollo (2005),v = 1.8 km s−1), Ij is the seismometer transfer function, and QS
is the frequency-dependent S-wave quality factor, as described byPetrosino et al. (2008b) [QS( f ) = 21 ∗ f 0.6]. The quality factorused for the coda waves was 180, as the mean value of those of DelPezzo et al. (1993). The linear problem solved was
ln[Ai j ( f )] = ln[Ki ( f )] + ln[Sj ( f )], (2)
where Ki( f ) is the source term, and Sj( f ) is the site term. Consid-ering all of the earthquake-station pairs, as shown in Table 3, thisproblem can be represented as: Gm = d , for each frequency win-dows analysed. The singular value decomposition technique wasused to find the values of the site and source terms (Menke 1989).Again, we show here the results obtained for the GIT applied tothe S-wave window and compare these with the results obtained forthe coda waves (Fig. 4). The standard deviation (σ ) on ln(Aij) isestimated by propagating the uncertainties on the parameters (Rij
and QS) of the eq. (1). The uncertainties in the data are taken as:200 m for the hypocentre-to-station distance (Rij), and 10 per cent of
the value for the quality factor (QS). The frequency and the velocityare considered with no error. The standard deviations estimated inthis way are mapped to the errors in the model parameters by theequation: σm =
√G−1σ 2[G−1]T . σ m is shown in Fig. 4 (dashed
lines).An estimation of the stability of the solution was also made
using the bootstrap method (Moore & McCabe 2006); the resolutionprocess (through the singular value decomposition method) of thesystem of eq. (2) was applied 700 times, deleting 10 per cent of therows of the matrix G each time. Each solution is shown in Fig. 4(grey lines), along with the mean of the bootstrap solutions (Fig. 4,black lines): this overlaps perfectly with the solution of the completesystem. By applying the bootstrap method, we made sure that wedid not delete the row of the G matrix that contains the constraintthat the network average STF equals 1. From Fig. 4, it can be seenthat the results are stable for almost all of the stations (with theexception of stations W10 and W21).
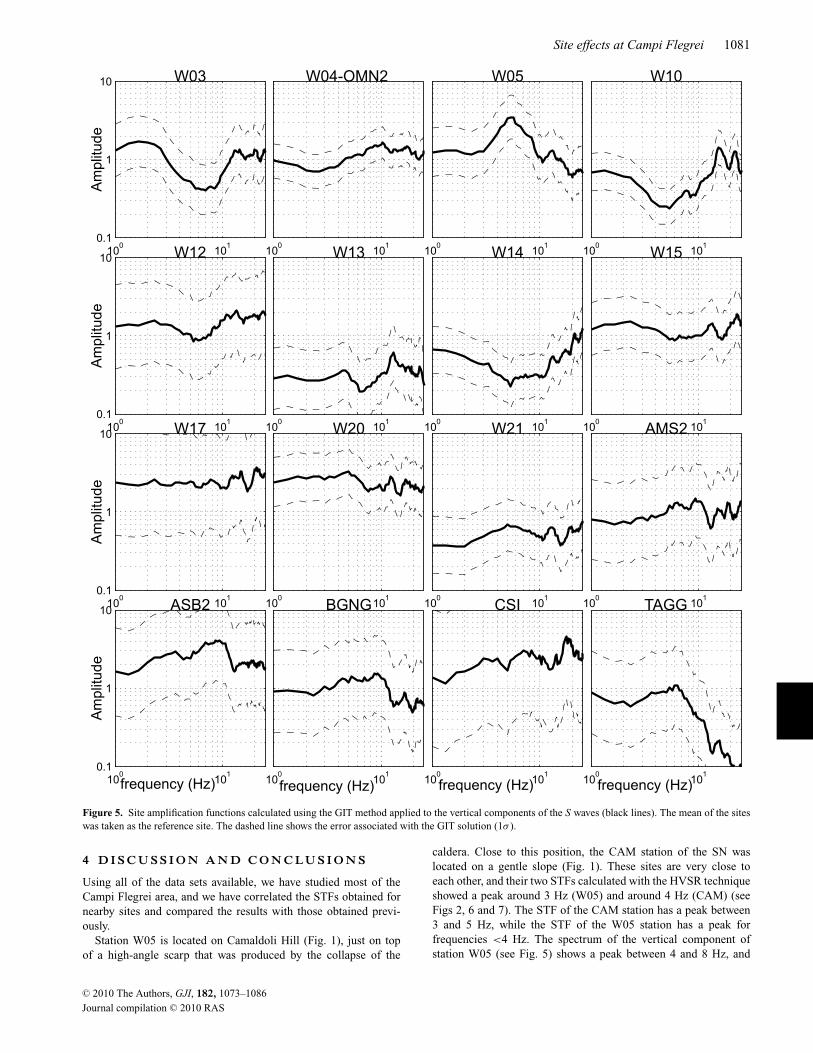
To better understand the differences between the STFs obtainedwith the GIT and HVSR methods, we also determined the spectrumof the vertical component of the S waves using the GIT techniqueapplied to the vertical S-wave windows. The results obtained areshown in Fig. 5.
Comparing the STFs calculated with the GIT method (Fig. 4)with those obtained with the HVSR method (Fig. 2), it can be seenthat there is a global good agreement in the shape of the transferfunctions. We cannot compare the two amplifications, as the HVSRmethod is useful for the estimation of the fundamental frequenciesof the site, but not the amplification. For some stations, the STFscalculated with the GIT show a vertical ‘shift’ that can be explainedby the use of the reference condition. The data show the followingmain characteristics:
(i) The peak (amplitude ≥2) between 3 Hz and 10 Hz that isevident for the STF of station W03 calculated with the HVSR isnot seen in the STF calculated with the GIT; on the other hand, thevertical component spectrum of W03 shows a high de-amplificationin the frequency band of 3 Hz to 10 Hz;
(ii) Station W10 shows a different STF pattern, with three peaksat 5 Hz, 10 Hz and 20 Hz for the STF calculated with the HVSRmethod, and only two peaks at 10 Hz and 20 Hz for the STF calcu-lated with the GIT method; again, its vertical component spectrumshows de-amplification between 4 Hz and 10 Hz;
(iii) Station ASB2 shows two different STF curves for frequency>5 Hz using the two methods; its vertical component spectrumshows amplification in a broad window of 2–11 Hz.
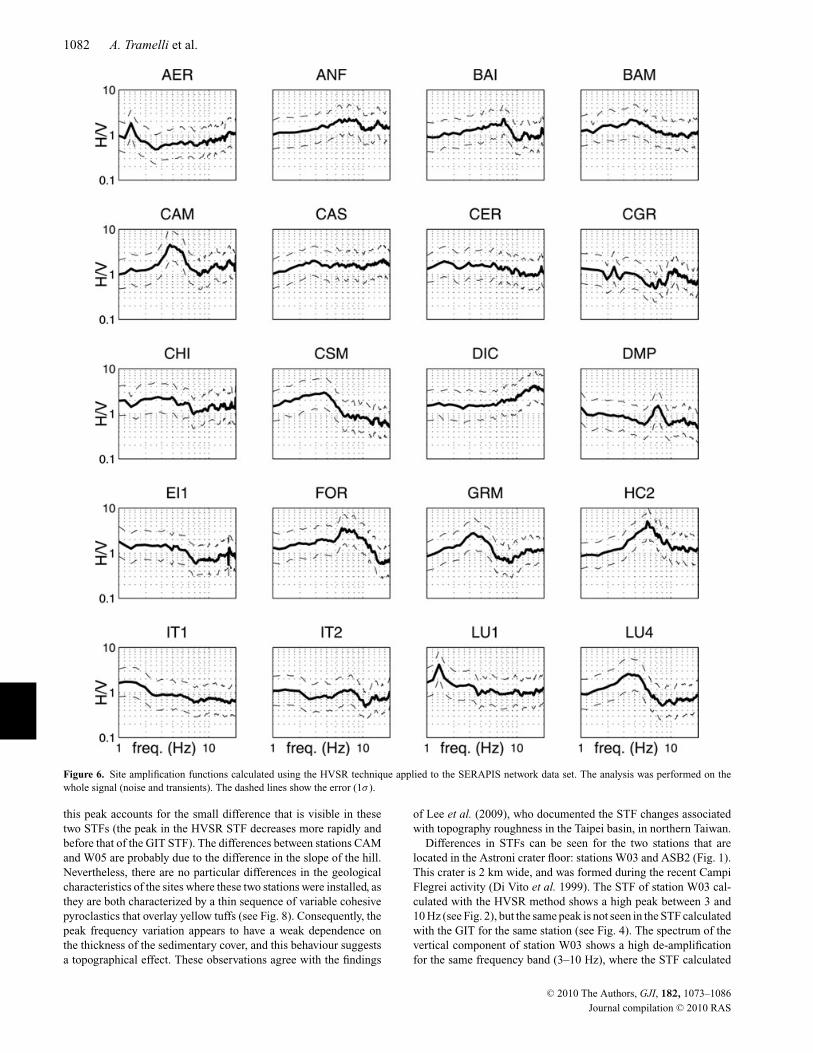
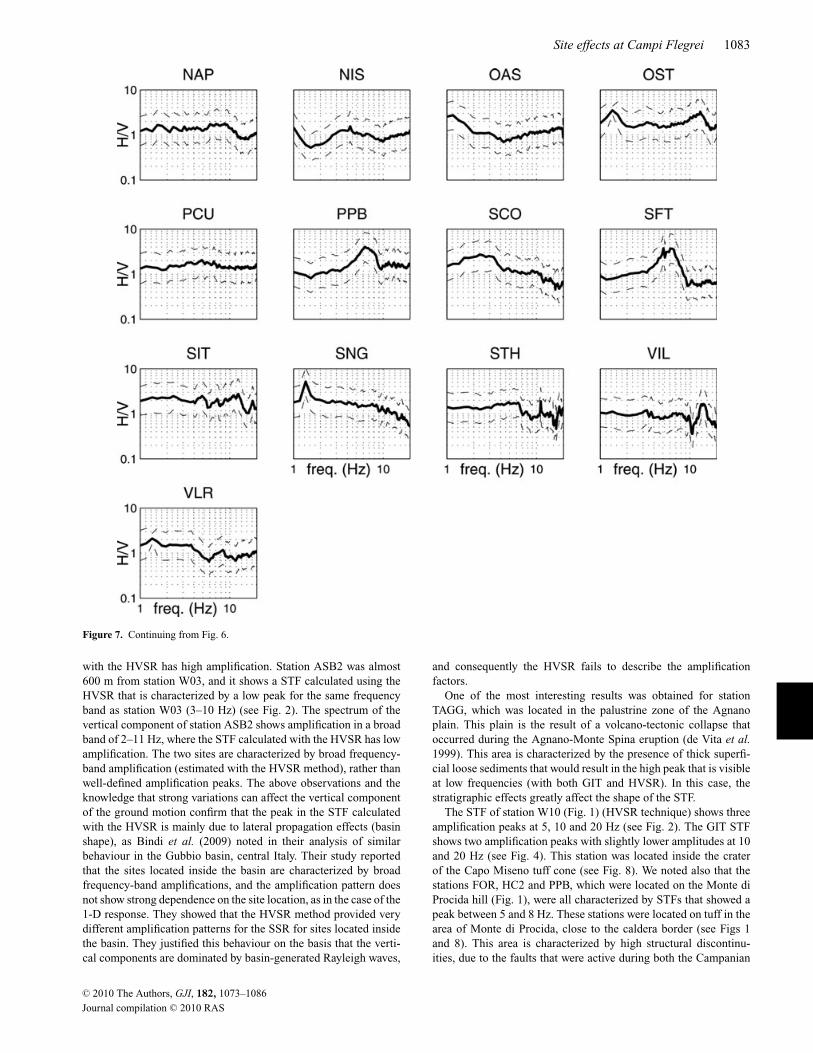
3.2 Noise analysis
The analysis of the SN data set was performed by the applicationof the HVSR technique (Nakamura 1989) to all of the seismicrecordings (noise and shots) using 100-min windows of seismicsignal for each station. We estimated the H/V ratio by averaging thetwo horizontal spectra evaluated in a 5-s window, and then dividingthis by the vertical spectrum evaluated in the same window. Wecalculated the H/V ratios for each moving window with an overlapof 30 per cent. The same procedure was performed for each station,and the results are shown in Figs 6 and 7. The errors were estimatedas the standard deviations of the means performed over the windows(Figs 6 and 7, dashed lines). In analysing the STFs obtained usingthe HVSR method applied to the SN (Figs 6 and 7), we noted thatonly a few peaks (amplitude ≥2) were evident, and that the curveslooked quite smoothed. We decided to group the sites into three
C© 2010 The Authors, GJI, 182, 1073–1086
Journal compilation C© 2010 RAS
1080 A. Tramelli et al.
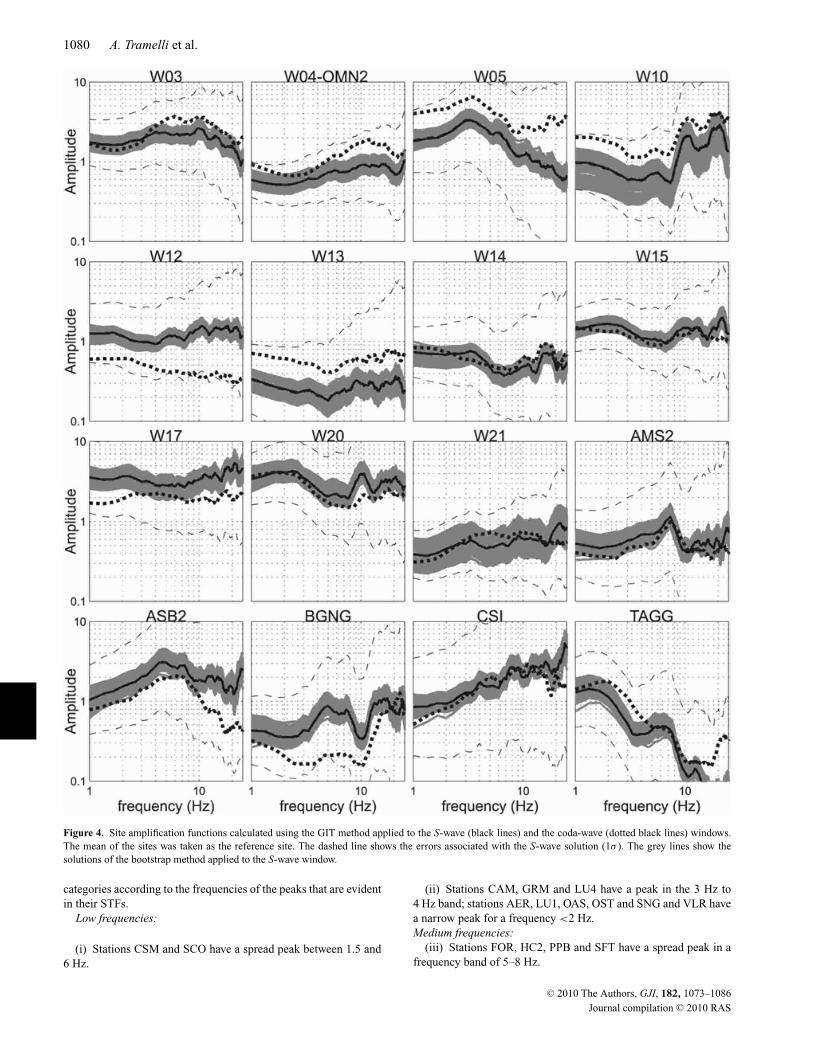
Figure 4. Site amplification functions calculated using the GIT method applied to the S-wave (black lines) and the coda-wave (dotted black lines) windows.The mean of the sites was taken as the reference site. The dashed line shows the errors associated with the S-wave solution (1σ ). The grey lines show thesolutions of the bootstrap method applied to the S-wave window.
categories according to the frequencies of the peaks that are evidentin their STFs.
Low frequencies:
(i) Stations CSM and SCO have a spread peak between 1.5 and6 Hz.
(ii) Stations CAM, GRM and LU4 have a peak in the 3 Hz to4 Hz band; stations AER, LU1, OAS, OST and SNG and VLR havea narrow peak for a frequency <2 Hz.Medium frequencies:
(iii) Stations FOR, HC2, PPB and SFT have a spread peak in afrequency band of 5–8 Hz.
C© 2010 The Authors, GJI, 182, 1073–1086
Journal compilation C© 2010 RAS
Site effects at Campi Flegrei 1081
Figure 5. Site amplification functions calculated using the GIT method applied to the vertical components of the S waves (black lines). The mean of the siteswas taken as the reference site. The dashed line shows the error associated with the GIT solution (1σ ).
4 D I S C U S S I O N A N D C O N C LU S I O N S
Using all of the data sets available, we have studied most of theCampi Flegrei area, and we have correlated the STFs obtained fornearby sites and compared the results with those obtained previ-ously.
Station W05 is located on Camaldoli Hill (Fig. 1), just on topof a high-angle scarp that was produced by the collapse of the
caldera. Close to this position, the CAM station of the SN waslocated on a gentle slope (Fig. 1). These sites are very close toeach other, and their two STFs calculated with the HVSR techniqueshowed a peak around 3 Hz (W05) and around 4 Hz (CAM) (seeFigs 2, 6 and 7). The STF of the CAM station has a peak between3 and 5 Hz, while the STF of the W05 station has a peak forfrequencies <4 Hz. The spectrum of the vertical component ofstation W05 (see Fig. 5) shows a peak between 4 and 8 Hz, and
C© 2010 The Authors, GJI, 182, 1073–1086
Journal compilation C© 2010 RAS
1082 A. Tramelli et al.
Figure 6. Site amplification functions calculated using the HVSR technique applied to the SERAPIS network data set. The analysis was performed on thewhole signal (noise and transients). The dashed lines show the error (1σ ).
this peak accounts for the small difference that is visible in thesetwo STFs (the peak in the HVSR STF decreases more rapidly andbefore that of the GIT STF). The differences between stations CAMand W05 are probably due to the difference in the slope of the hill.Nevertheless, there are no particular differences in the geologicalcharacteristics of the sites where these two stations were installed, asthey are both characterized by a thin sequence of variable cohesivepyroclastics that overlay yellow tuffs (see Fig. 8). Consequently, thepeak frequency variation appears to have a weak dependence onthe thickness of the sedimentary cover, and this behaviour suggestsa topographical effect. These observations agree with the findings
of Lee et al. (2009), who documented the STF changes associatedwith topography roughness in the Taipei basin, in northern Taiwan.
Differences in STFs can be seen for the two stations that arelocated in the Astroni crater floor: stations W03 and ASB2 (Fig. 1).This crater is 2 km wide, and was formed during the recent CampiFlegrei activity (Di Vito et al. 1999). The STF of station W03 cal-culated with the HVSR method shows a high peak between 3 and10 Hz (see Fig. 2), but the same peak is not seen in the STF calculatedwith the GIT for the same station (see Fig. 4). The spectrum of thevertical component of station W03 shows a high de-amplificationfor the same frequency band (3–10 Hz), where the STF calculated
C© 2010 The Authors, GJI, 182, 1073–1086
Journal compilation C© 2010 RAS
Site effects at Campi Flegrei 1083
Figure 7. Continuing from Fig. 6.
with the HVSR has high amplification. Station ASB2 was almost600 m from station W03, and it shows a STF calculated using theHVSR that is characterized by a low peak for the same frequencyband as station W03 (3–10 Hz) (see Fig. 2). The spectrum of thevertical component of station ASB2 shows amplification in a broadband of 2–11 Hz, where the STF calculated with the HVSR has lowamplification. The two sites are characterized by broad frequency-band amplification (estimated with the HVSR method), rather thanwell-defined amplification peaks. The above observations and theknowledge that strong variations can affect the vertical componentof the ground motion confirm that the peak in the STF calculatedwith the HVSR is mainly due to lateral propagation effects (basinshape), as Bindi et al. (2009) noted in their analysis of similarbehaviour in the Gubbio basin, central Italy. Their study reportedthat the sites located inside the basin are characterized by broadfrequency-band amplifications, and the amplification pattern doesnot show strong dependence on the site location, as in the case of the1-D response. They showed that the HVSR method provided verydifferent amplification patterns for the SSR for sites located insidethe basin. They justified this behaviour on the basis that the verti-cal components are dominated by basin-generated Rayleigh waves,
and consequently the HVSR fails to describe the amplificationfactors.
One of the most interesting results was obtained for stationTAGG, which was located in the palustrine zone of the Agnanoplain. This plain is the result of a volcano-tectonic collapse thatoccurred during the Agnano-Monte Spina eruption (de Vita et al.1999). This area is characterized by the presence of thick superfi-cial loose sediments that would result in the high peak that is visibleat low frequencies (with both GIT and HVSR). In this case, thestratigraphic effects greatly affect the shape of the STF.
The STF of station W10 (Fig. 1) (HVSR technique) shows threeamplification peaks at 5, 10 and 20 Hz (see Fig. 2). The GIT STFshows two amplification peaks with slightly lower amplitudes at 10and 20 Hz (see Fig. 4). This station was located inside the craterof the Capo Miseno tuff cone (see Fig. 8). We noted also that thestations FOR, HC2 and PPB, which were located on the Monte diProcida hill (Fig. 1), were all characterized by STFs that showed apeak between 5 and 8 Hz. These stations were located on tuff in thearea of Monte di Procida, close to the caldera border (see Figs 1and 8). This area is characterized by high structural discontinu-ities, due to the faults that were active during both the Campanian
C© 2010 The Authors, GJI, 182, 1073–1086
Journal compilation C© 2010 RAS
1084 A. Tramelli et al.
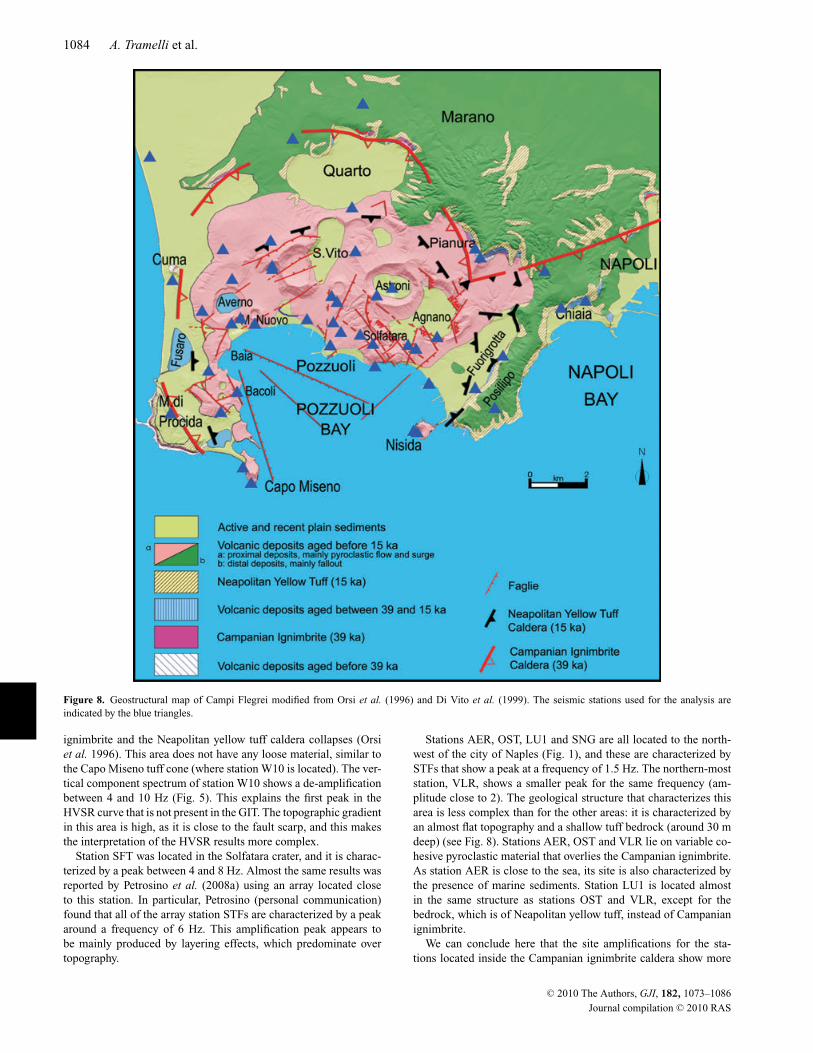
Figure 8. Geostructural map of Campi Flegrei modified from Orsi et al. (1996) and Di Vito et al. (1999). The seismic stations used for the analysis areindicated by the blue triangles.
ignimbrite and the Neapolitan yellow tuff caldera collapses (Orsiet al. 1996). This area does not have any loose material, similar tothe Capo Miseno tuff cone (where station W10 is located). The ver-tical component spectrum of station W10 shows a de-amplificationbetween 4 and 10 Hz (Fig. 5). This explains the first peak in theHVSR curve that is not present in the GIT. The topographic gradientin this area is high, as it is close to the fault scarp, and this makesthe interpretation of the HVSR results more complex.
Station SFT was located in the Solfatara crater, and it is charac-terized by a peak between 4 and 8 Hz. Almost the same results wasreported by Petrosino et al. (2008a) using an array located closeto this station. In particular, Petrosino (personal communication)found that all of the array station STFs are characterized by a peakaround a frequency of 6 Hz. This amplification peak appears tobe mainly produced by layering effects, which predominate overtopography.
Stations AER, OST, LU1 and SNG are all located to the north-west of the city of Naples (Fig. 1), and these are characterized bySTFs that show a peak at a frequency of 1.5 Hz. The northern-moststation, VLR, shows a smaller peak for the same frequency (am-plitude close to 2). The geological structure that characterizes thisarea is less complex than for the other areas: it is characterized byan almost flat topography and a shallow tuff bedrock (around 30 mdeep) (see Fig. 8). Stations AER, OST and VLR lie on variable co-hesive pyroclastic material that overlies the Campanian ignimbrite.As station AER is close to the sea, its site is also characterized bythe presence of marine sediments. Station LU1 is located almostin the same structure as stations OST and VLR, except for thebedrock, which is of Neapolitan yellow tuff, instead of Campanianignimbrite.
We can conclude here that the site amplifications for the sta-tions located inside the Campanian ignimbrite caldera show more
C© 2010 The Authors, GJI, 182, 1073–1086
Journal compilation C© 2010 RAS
Site effects at Campi Flegrei 1085
Table 5. The parameters used for the theoretical H/V curves estimations for the sites relative to stationsASB2, W03, W05 and TAGG.
Site VS (m s−1) ρ (g cm−3) h (m) Sequences
200 1.10 10.0 Watered and reworked depositsASB2 200 1.50 90.0 Partially lithified pyroclastics
500 1.80 Lithified tuff bedrock
200 1.10 25.0 Watered and reworked depositsW03 200 1.50 75.0 Partially lithified pyroclastics
500 1.80 Lithified tuff bedrock
W05 250 1.20 30.0 Partially lithified pyroclastics600 1.80 Lithified tuff bedrock
90 0.9 12.0 Palustrine depositsTAGG 311 1.50 145.0 Loose pyroclastics
500 1.70 Lithified tuff bedrock
Notes: The values are extrapolated by Comune di Napoli, Servizio Urbanistica, commissario ad acta L.R.9/83 (1992), Orsi et al. (1996) and Di Vito et al. (1999).
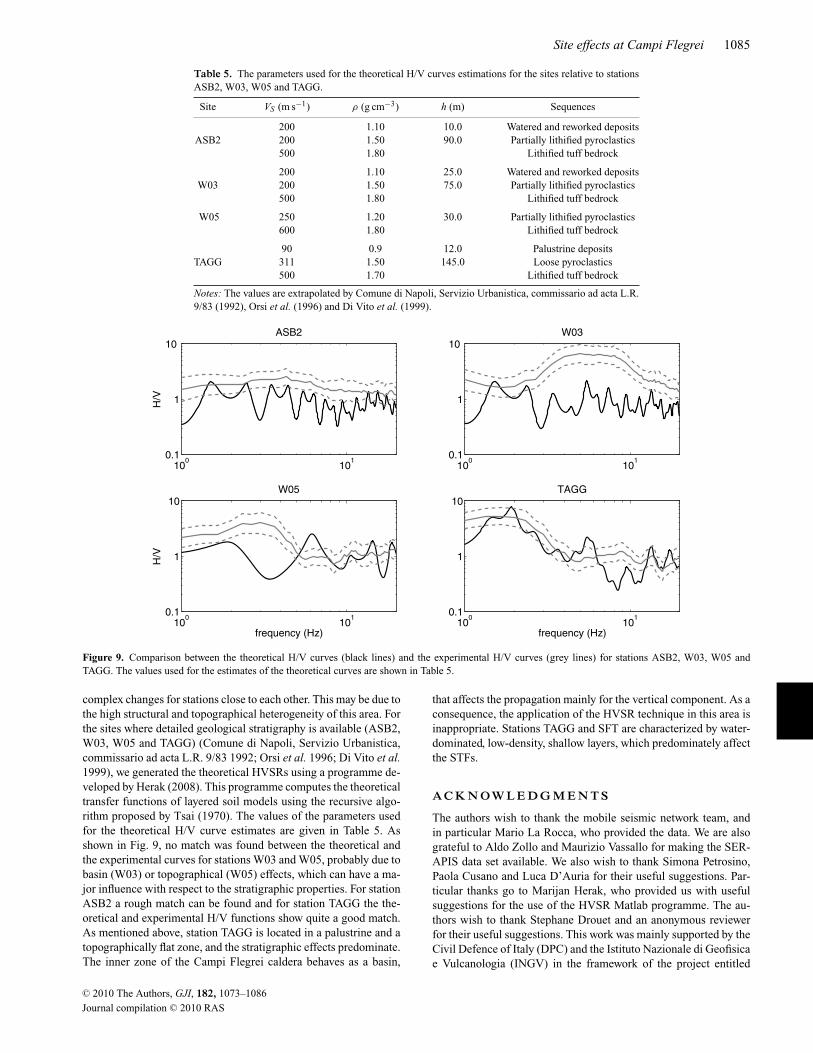
Figure 9. Comparison between the theoretical H/V curves (black lines) and the experimental H/V curves (grey lines) for stations ASB2, W03, W05 andTAGG. The values used for the estimates of the theoretical curves are shown in Table 5.
complex changes for stations close to each other. This may be due tothe high structural and topographical heterogeneity of this area. Forthe sites where detailed geological stratigraphy is available (ASB2,W03, W05 and TAGG) (Comune di Napoli, Servizio Urbanistica,commissario ad acta L.R. 9/83 1992; Orsi et al. 1996; Di Vito et al.1999), we generated the theoretical HVSRs using a programme de-veloped by Herak (2008). This programme computes the theoreticaltransfer functions of layered soil models using the recursive algo-rithm proposed by Tsai (1970). The values of the parameters usedfor the theoretical H/V curve estimates are given in Table 5. Asshown in Fig. 9, no match was found between the theoretical andthe experimental curves for stations W03 and W05, probably due tobasin (W03) or topographical (W05) effects, which can have a ma-jor influence with respect to the stratigraphic properties. For stationASB2 a rough match can be found and for station TAGG the the-oretical and experimental H/V functions show quite a good match.As mentioned above, station TAGG is located in a palustrine and atopographically flat zone, and the stratigraphic effects predominate.The inner zone of the Campi Flegrei caldera behaves as a basin,
that affects the propagation mainly for the vertical component. As aconsequence, the application of the HVSR technique in this area isinappropriate. Stations TAGG and SFT are characterized by water-dominated, low-density, shallow layers, which predominately affectthe STFs.
A C K N OW L E D G M E N T S
The authors wish to thank the mobile seismic network team, andin particular Mario La Rocca, who provided the data. We are alsograteful to Aldo Zollo and Maurizio Vassallo for making the SER-APIS data set available. We also wish to thank Simona Petrosino,Paola Cusano and Luca D’Auria for their useful suggestions. Par-ticular thanks go to Marijan Herak, who provided us with usefulsuggestions for the use of the HVSR Matlab programme. The au-thors wish to thank Stephane Drouet and an anonymous reviewerfor their useful suggestions. This work was mainly supported by theCivil Defence of Italy (DPC) and the Istituto Nazionale di Geofisicae Vulcanologia (INGV) in the framework of the project entitled
C© 2010 The Authors, GJI, 182, 1073–1086
Journal compilation C© 2010 RAS
1086 A. Tramelli et al.
‘SPeeD’. A partial contribution also come from the Italian Ministryof Education PRIN Project entitled ‘Array analysis of seismic noiseand coda waves to monitor the space variation of the stress field’and by the DPC project ‘UNREST’.
R E F E R E N C E S
Andrews, D.J., 1986. Objective determination of source parameters and sim-ilarity of earthquakes of different size, in Earthquake Source Mechanics.American Geophysical Union, Washington.
Aster, R., Meyer, R., De Natale, G., Martini, M., Del Pezzo, E., Iannaccone,G. & Scarpa, R., 1989. Seismic investigation of the Campi Flegrei: asynthesis and summary of results, in Volcanic Seismology, Proc. Volc.series III, pp. 462–483, eds Aki, K. and Gasparini, P. and Scarpa, R.,Springer-Verlag, San Francisco.
Bindi, D. et al., 2009. Site amplifications observed in the Gubbio Basin,Central Italy: hints for lateral propagation effects, Bull. seism. Soc. Am.,99, 741–760.
Bonilla, L.F., Steidl, J.H., Lindley, G.T., Tumarkin, A.G. & Archuleta, R.J.,1997. Site amplification in the San Fernando Valley, California: variabilityof site effect estimation using the S-Wave, Coda and H/V methods, Bull.seism. Soc. Am., 87(3), 710–730.
Borcherdt, R.D., 1970. Effects of local geology on ground motion near SanFrancisco Bay, Bull. seism. Soc. Am., 60, 29–61.
Comune di Napoli, Servizio Urbanistica, commissario ad acta L.R. 9/83,1992. Indagini geologiche per l’adeguamento del P.R.G. alla legge re-gionale 7-1-1983 n.9 in difesa del territorio dal rischio sismico. Comunedi Napoli, Napoli.
de Vita, S. et al., 1999. The Agnano-Monte Spina eruption (4100 years BP)in the restless Campi Flegrei caldera (Italy), J. Volc. Geotherm. Res., 91,269–301.
Del Pezzo, E., De Martino, S., Parrinello, M. & Sabbarese, C., 1993. Seismicsite amplification factors in Campi Flegrei, Southern Italy, Phys. Earthplanet. Inter., 78, 105–117.
Di Vito, M., Isaia, R., Orsi, G., Southon, J., de Vita, S., D’Antonio, M.,Pappalardo, L. & Piochi, M., 1999. Volcanism and deformation since12.000 years at the Campi Flegrei caldera (Italy), J. Volc. Geotherm. Res.,91, 221–246.
Drouet, S., Triantafyllidis, P., Savvaidis, A. & Theodulidis, N., 2008. Com-parison of site-effects estimation methods using the Lefkas, Greece, 2003earthquake aftershocks, Bull. seism. Soc. Am., 98, 2349–2363.
Edwards, B., Rietbrock, A., Bommer, J.J. & Baptie, B., 2008. The acquisitionof source, path, and site effects from microearthquake recordings using Qtomography: application to the United Kingdom, Bull. seism. Soc. Am.,98(4), 1915–1935.
Field, E.H. & Jacob, K.H., 1995. A comparison and test of various site-response estimation techniques, including three that are not reference-sitedependent, Bull. seism. Soc. Am., 85(4), 1127–1143.
Galluzzo, D., Del Pezzo, E., La Rocca, M., Castellano, M. & Bianco, F.,2009. Site effects at the Vesuvius volcano: a comparison of techniquesand inferences as the scaling of law of the seismic spectrum, Bull. seism.Soc. Am., 99(3), 1705–1719.
Hartzell, S.H., 1992. Site response estimation from earthquake data, Bull.seism. Soc. Am., 82, 2308–2327.
Herak, M., 2008. ModelHVSR—a Matlab tool to model horizontal-to-vertical spectral ratio of ambient noise, Comput. Geosci., 34, 1514–1526.
Judenherc, S. & Zollo, A., 2005. The bay of Naples (Southern Italy): con-straints on the volcanic structures inferred from a dense seismic survey,J. geophys. Res., 109, doi:10.129/2003JB002876.
Lachet, D., Hatzfeld, C., Bard, P., Theodulis, N., Papaioannou, C. &Savvaidis, A., 1996. Site effects and microzonation in the city ofThessaloniki (Greece), comparison of different approaches, Bull. seism.Soc. Am., 86, 1692–1703.
Lee, S.-J., Komatitsch, D., Huang, B. & Tromp, J., 2009. Effects of realisticsurface topography on seismic ground motion in the Yangminshan Regionof Taiwan based upon the spectral-element method and LiDAR DTM,Bull. seism. Soc. Am., 99(1), 314–325.
Lermo, J.F. & Chavez-Garcia, F.J., 1993. Site effect evaluation using spec-tral ratios with only one station, Bull. seism. Soc. Am., 83, 1574–1594.
Lomax, A., Virieux, J., Volant, P. & Berge, C., 2000. Probabilistic earthquakelocation in 3D and layered models: introduction of a Metropolis-Gibbsmethod and comparison with linear locations, in Advances in SeismicEvent Location, edsThurber, C.H. and Rabinowitz, N., Springer, Kluwer,Amsterdam.
Menke, W., 1989. Geophysical Data Analysis: Discrete Inverse Theory.International Geophysics Series, Vol. 45, Academic Press, San Diego.
Moore, D.S. & McCabe, G.P., 2006. Introduction to the Practice of Statistics,Chapter 14, W.H. Freeman and Company, New York.
Nakamura, Y., 1989. A method for dynamic characteristics estimation ofsubsurface using microtremor on the ground surface, Quart. Rep. RailwayTech. Res. Inst. (RTRI) 30, 25–33.
Nunziata, C., 2004. Seismic ground motion in Napoli for the 1980 IrpiniaEarthquake, Pure appl. Geophys., 161, 1239–1264.
Nunziata, C., 2007. A physically sound way of using noise measurements inseismic microzonation, applied to the urban area of Napoli, Eng. Geol.,93, 17–30.
Nunziata, C., Natale, M. & Panza, G., 2004. Seismic characterization ofNapolitanian soil, Pure appl. Geophys., 161, 1285–1300.
Orsi, G., De Vita, S. & Di Vito, M., 1996. The restless resurgent CampiFlegrei caldera (Italy): constraints on its evolution and configuration, J.Volc. Geotherm. Res., 74, 179–214.
Pantosti, D. & Valensise, G., 1993. Source geometry and long-term behaviorof the 1980, irpinia earthquake fault based on field geologic observations,Annali di Geofisica, XXXVI, 41–49.
Parolai, S. & Galiana-Merino, J.J., 2006. Effect of the transient seismic noiseon estimates of H/V spectral ratios, Bull. seism. Soc. Am., 96(1), 228–236.
Parolai, S., Bindi, D. & Troiani, L., 2001. Site response for the RSM seismicnetwork and source parameters in the Central Appenines (Italy), Pureappl. Geophys., 158, 695–715.
Petrosino, S., Damiano, N., Cusano, P., Veneruso, M., Zaccarelli, L., Torello,V. & Del Pezzo, E., 2008a. Seismic noise at Solfatara volcano (Campi Fle-grei, Italy): acquisition techniques and first results, Quaderni di Geofisica51.
Petrosino, S., De Siena, L. & Del Pezzo, E., 2008b. Re-calibration of themagnitude scales at Campi Flegrei, Italy, on the basis of measured pathand site and transfer functions, Bull. seism. Soc. Am., 98(4), 1964–1974.
Phillips, W.S. & Aki, K., 1986. Site amplification of coda waves from localearthquakes in central California, Bull. seism. Soc. Am., 76, 627–648.
Tsai, N.C., 1970. A note on the steady state response of an elastic half-space,Bull. seism. Soc. Am., 60(3), 795–808.
Tsujiura, M., 1978. Spectral analysis of the coda waves from local earth-quakes, Bull. Earthquake Res. Inst., Tokyo Univ., 53, 1–48.
C© 2010 The Authors, GJI, 182, 1073–1086
Journal compilation C© 2010 RAS
Related Documents


