A Descriptive Study of South Carolina’s Gifted and Talented Program June 2005

Welcome message from author
This document is posted to help you gain knowledge. Please leave a comment to let me know what you think about it! Share it to your friends and learn new things together.
Transcript
A Descriptive Study of South Carolina’s Gifted and Talented Program
June 2005
A Descriptive Study of South Carolina’s Gifted and Talented Program
Diane M. Monrad Patricia L. McGuiness
Dan Chandler Dorinda J. Gallant
Sarah J. Gareau Anita M. Rawls
South Carolina Educational Policy Center College of Education
University of South Carolina
June 2005
Table of Contents
I. Executive Summary vi
II. Introduction 1
III. Overview of South Carolina’s Gifted and Talented Program 1
Background 1
IV. Description of South Carolina’s Gifted and Talented Program 2
Program for Academically Gifted Students 3
Program for Artistically Gifted Students 5
V. Comparison of South Carolina’s Program with Other State Programs 6
State Definitions of Giftedness 7
State Identification and Selection Criteria 9
Profile of Students Served 10
Program Models 12
Profile of Teachers of Gifted and Talented Students 14
Funding of Gifted and Talented Programs 16
VI. South Carolina’s Program Participants and Program Expenditures 17
Participants in South Carolina’s Gifted and Talented Program 17
Expenditures for South Carolina’s Gifted and Talented Program 18
VII. Results form the District Coordinator’s Questionnaire 22
Student Identification and Selection 22
Student Profile 26
Program Models 27
Teachers of Gifted and Talented Students 34
Funding 38
Views of the District Coordinators 41
VIII. Discussion and Recommendations 44
Instructional Services for Gifted Students 44
Professional Preparation 45
Program Services and Expenditures for the Education of Gifted and Talented Students
46
i
Table of Contents
ii
IX. References 48
X. Appendices
Appendix A. Summary of Budget Provisos Relating to the Gifted and Talented
Program from 2000-2005
A1
Appendix B. Characteristics of the Gifted and Talented Program in Selected
States
A2
Appendix C. South Carolina Gifted and Talented Disaggregated Student
Counts by District and Year
A21
Appendix D. Academic Gifted and Talented 2003-2004 Enrollment as
Percentage of District Enrollment for Grades 3-12
A31
Appendix E. South Carolina Gifted and Talented Funding Allocations and
Expenditures by Year and District
A35
Appendix F. Expenditures for the Academic and Artistic Gifted and Talented
Program from General Funds, Special Revenue Accounts and
EIA Funds for Fiscal Years 2002-2004
A41
Appendix G. Total Expenditures, Percentage of Total Expenditures from EIA
Funds, Number of Students, and Per Pupil Expenditures By
District for the Academically Gifted Program in 2003-2004
A51
Appendix H. Additional Roles, Departments, and Program of District
Coordinators of Gifted and Talented Programs
A54
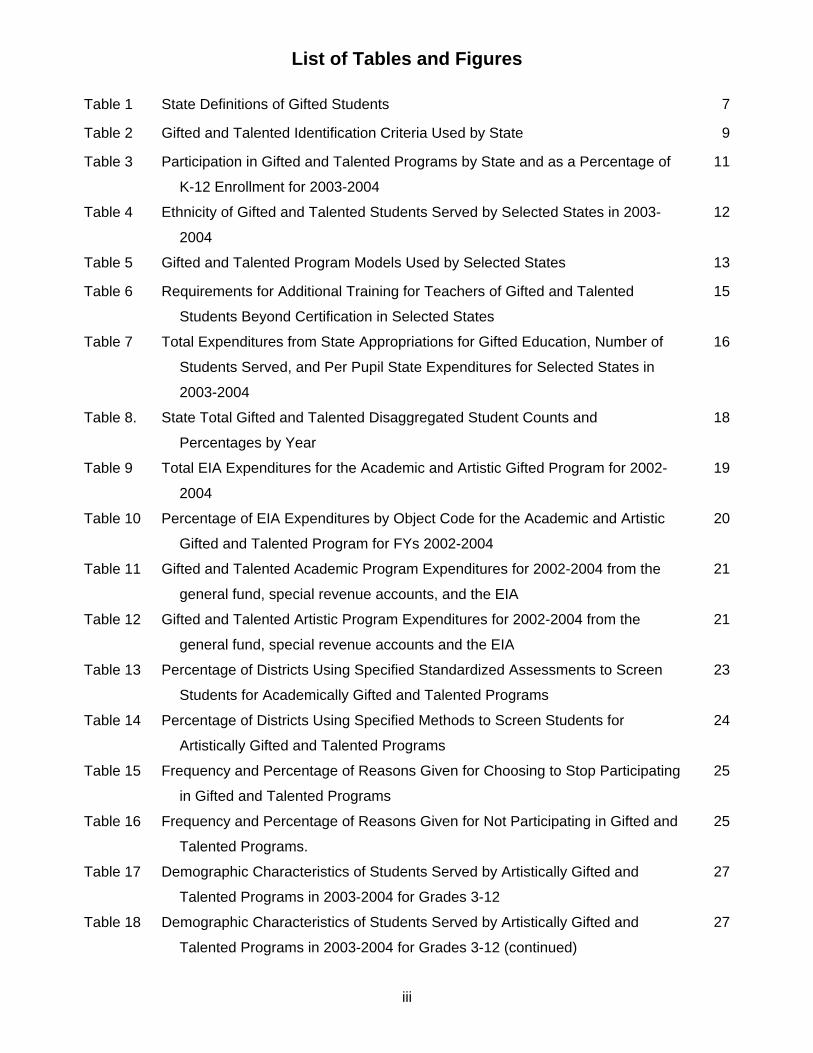
List of Tables and Figures
iii
Table 1 State Definitions of Gifted Students 7
Table 2 Gifted and Talented Identification Criteria Used by State 9
Table 3 Participation in Gifted and Talented Programs by State and as a Percentage of
K-12 Enrollment for 2003-2004
11
Table 4 Ethnicity of Gifted and Talented Students Served by Selected States in 2003-
2004
12
Table 5 Gifted and Talented Program Models Used by Selected States 13
Table 6 Requirements for Additional Training for Teachers of Gifted and Talented
Students Beyond Certification in Selected States
15
Table 7 Total Expenditures from State Appropriations for Gifted Education, Number of
Students Served, and Per Pupil State Expenditures for Selected States in
2003-2004
16
Table 8. State Total Gifted and Talented Disaggregated Student Counts and
Percentages by Year
18
Table 9 Total EIA Expenditures for the Academic and Artistic Gifted Program for 2002-
2004
19
Table 10 Percentage of EIA Expenditures by Object Code for the Academic and Artistic
Gifted and Talented Program for FYs 2002-2004
20
Table 11 Gifted and Talented Academic Program Expenditures for 2002-2004 from the
general fund, special revenue accounts, and the EIA
21
Table 12 Gifted and Talented Artistic Program Expenditures for 2002-2004 from the
general fund, special revenue accounts and the EIA
21
Table 13 Percentage of Districts Using Specified Standardized Assessments to Screen
Students for Academically Gifted and Talented Programs
23
Table 14 Percentage of Districts Using Specified Methods to Screen Students for
Artistically Gifted and Talented Programs
24
Table 15 Frequency and Percentage of Reasons Given for Choosing to Stop Participating
in Gifted and Talented Programs
25
Table 16 Frequency and Percentage of Reasons Given for Not Participating in Gifted and
Talented Programs.
25
Table 17 Demographic Characteristics of Students Served by Artistically Gifted and
Talented Programs in 2003-2004 for Grades 3-12
27
Table 18 Demographic Characteristics of Students Served by Artistically Gifted and
Talented Programs in 2003-2004 for Grades 3-12 (continued)
27
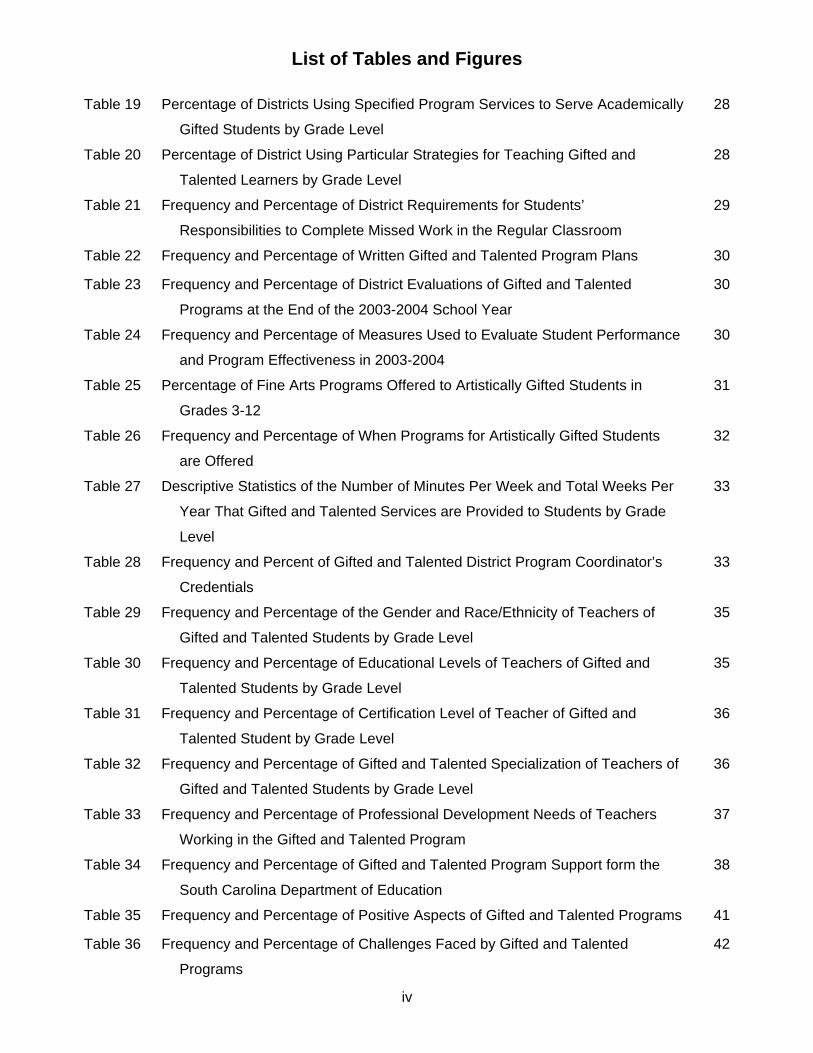
List of Tables and Figures
iv
Table 19 Percentage of Districts Using Specified Program Services to Serve Academically
Gifted Students by Grade Level
28
Table 20 Percentage of District Using Particular Strategies for Teaching Gifted and
Talented Learners by Grade Level
28
Table 21 Frequency and Percentage of District Requirements for Students’
Responsibilities to Complete Missed Work in the Regular Classroom
29
Table 22 Frequency and Percentage of Written Gifted and Talented Program Plans 30
Table 23 Frequency and Percentage of District Evaluations of Gifted and Talented
Programs at the End of the 2003-2004 School Year
30
Table 24 Frequency and Percentage of Measures Used to Evaluate Student Performance
and Program Effectiveness in 2003-2004
30
Table 25 Percentage of Fine Arts Programs Offered to Artistically Gifted Students in
Grades 3-12
31
Table 26 Frequency and Percentage of When Programs for Artistically Gifted Students
are Offered
32
Table 27 Descriptive Statistics of the Number of Minutes Per Week and Total Weeks Per
Year That Gifted and Talented Services are Provided to Students by Grade
Level
33
Table 28 Frequency and Percent of Gifted and Talented District Program Coordinator’s
Credentials
33
Table 29 Frequency and Percentage of the Gender and Race/Ethnicity of Teachers of
Gifted and Talented Students by Grade Level
35
Table 30 Frequency and Percentage of Educational Levels of Teachers of Gifted and
Talented Students by Grade Level
35
Table 31 Frequency and Percentage of Certification Level of Teacher of Gifted and
Talented Student by Grade Level
36
Table 32 Frequency and Percentage of Gifted and Talented Specialization of Teachers of
Gifted and Talented Students by Grade Level
36
Table 33 Frequency and Percentage of Professional Development Needs of Teachers
Working in the Gifted and Talented Program
37
Table 34 Frequency and Percentage of Gifted and Talented Program Support form the
South Carolina Department of Education
38
Table 35 Frequency and Percentage of Positive Aspects of Gifted and Talented Programs 41
Table 36 Frequency and Percentage of Challenges Faced by Gifted and Talented
Programs
42

List of Tables and Figures
v
Table 37 Frequency and Percentage of Changes Needed to Improve the Gifted and
Talented Programs
43
Figure 1 Academic gifted and talented program expenditures for 2003-2004 21
Figure 2 Artistic gifted and talented program expenditures for 2003-2004 21
Figure 3 Percentage of Grade Levels Served by State Gifted and Talented Funds 39
vi
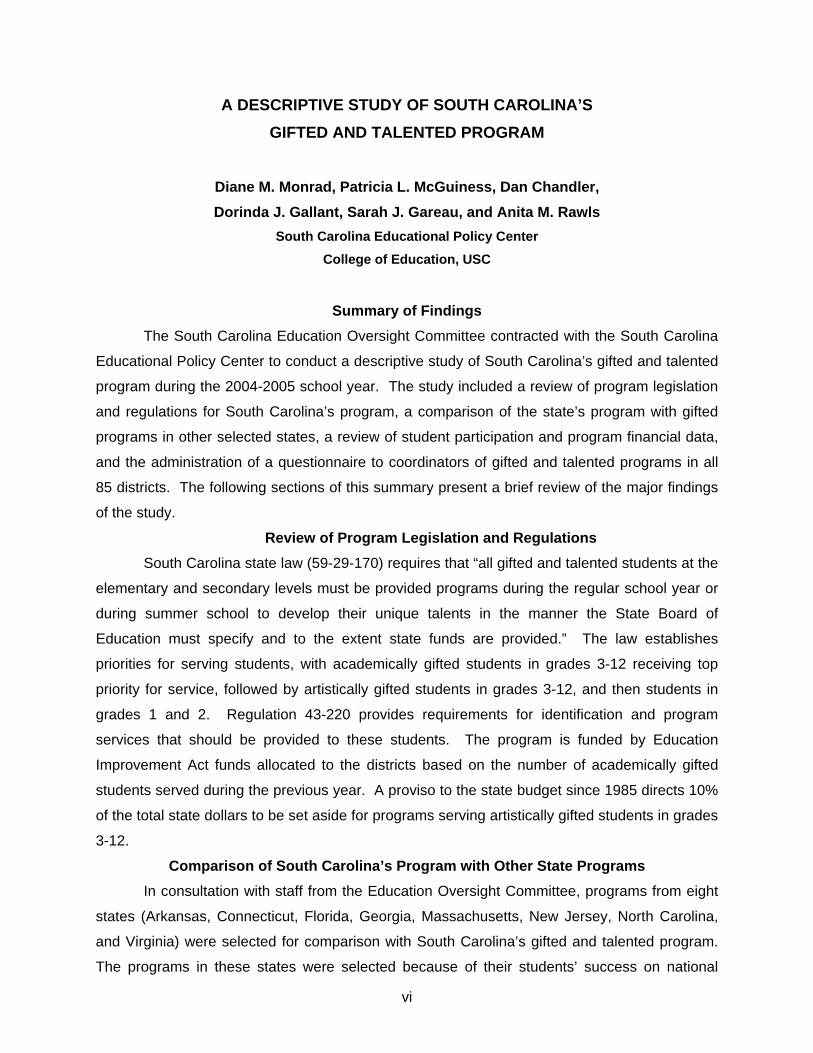
A DESCRIPTIVE STUDY OF SOUTH CAROLINA’S GIFTED AND TALENTED PROGRAM
Diane M. Monrad, Patricia L. McGuiness, Dan Chandler, Dorinda J. Gallant, Sarah J. Gareau, and Anita M. Rawls
South Carolina Educational Policy Center College of Education, USC
Summary of Findings
The South Carolina Education Oversight Committee contracted with the South Carolina
Educational Policy Center to conduct a descriptive study of South Carolina’s gifted and talented
program during the 2004-2005 school year. The study included a review of program legislation
and regulations for South Carolina’s program, a comparison of the state’s program with gifted
programs in other selected states, a review of student participation and program financial data,
and the administration of a questionnaire to coordinators of gifted and talented programs in all
85 districts. The following sections of this summary present a brief review of the major findings
of the study.
Review of Program Legislation and Regulations South Carolina state law (59-29-170) requires that “all gifted and talented students at the
elementary and secondary levels must be provided programs during the regular school year or
during summer school to develop their unique talents in the manner the State Board of
Education must specify and to the extent state funds are provided.” The law establishes
priorities for serving students, with academically gifted students in grades 3-12 receiving top
priority for service, followed by artistically gifted students in grades 3-12, and then students in
grades 1 and 2. Regulation 43-220 provides requirements for identification and program
services that should be provided to these students. The program is funded by Education
Improvement Act funds allocated to the districts based on the number of academically gifted
students served during the previous year. A proviso to the state budget since 1985 directs 10%
of the total state dollars to be set aside for programs serving artistically gifted students in grades
3-12.
Comparison of South Carolina’s Program with Other State Programs In consultation with staff from the Education Oversight Committee, programs from eight
states (Arkansas, Connecticut, Florida, Georgia, Massachusetts, New Jersey, North Carolina,
and Virginia) were selected for comparison with South Carolina’s gifted and talented program.
The programs in these states were selected because of their students’ success on national
vii
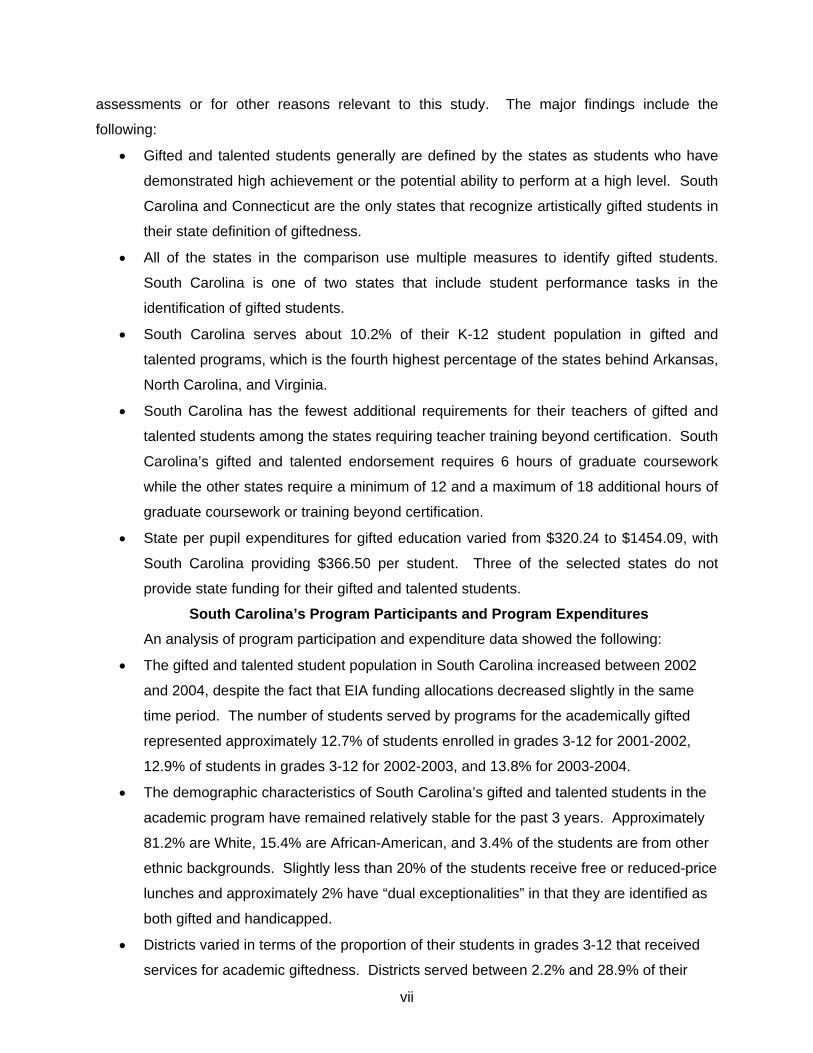
assessments or for other reasons relevant to this study. The major findings include the
following:
• Gifted and talented students generally are defined by the states as students who have
demonstrated high achievement or the potential ability to perform at a high level. South
Carolina and Connecticut are the only states that recognize artistically gifted students in
their state definition of giftedness.
• All of the states in the comparison use multiple measures to identify gifted students.
South Carolina is one of two states that include student performance tasks in the
identification of gifted students.
• South Carolina serves about 10.2% of their K-12 student population in gifted and
talented programs, which is the fourth highest percentage of the states behind Arkansas,
North Carolina, and Virginia.
• South Carolina has the fewest additional requirements for their teachers of gifted and
talented students among the states requiring teacher training beyond certification. South
Carolina’s gifted and talented endorsement requires 6 hours of graduate coursework
while the other states require a minimum of 12 and a maximum of 18 additional hours of
graduate coursework or training beyond certification.
• State per pupil expenditures for gifted education varied from $320.24 to $1454.09, with
South Carolina providing $366.50 per student. Three of the selected states do not
provide state funding for their gifted and talented students.
South Carolina’s Program Participants and Program Expenditures An analysis of program participation and expenditure data showed the following:
• The gifted and talented student population in South Carolina increased between 2002
and 2004, despite the fact that EIA funding allocations decreased slightly in the same
time period. The number of students served by programs for the academically gifted
represented approximately 12.7% of students enrolled in grades 3-12 for 2001-2002,
12.9% of students in grades 3-12 for 2002-2003, and 13.8% for 2003-2004.
• The demographic characteristics of South Carolina’s gifted and talented students in the
academic program have remained relatively stable for the past 3 years. Approximately
81.2% are White, 15.4% are African-American, and 3.4% of the students are from other
ethnic backgrounds. Slightly less than 20% of the students receive free or reduced-price
lunches and approximately 2% have “dual exceptionalities” in that they are identified as
both gifted and handicapped.
• Districts varied in terms of the proportion of their students in grades 3-12 that received
services for academic giftedness. Districts served between 2.2% and 28.9% of their
grade 3-12 population during the 2003-2004 school year. The average percentage of
students served was 11.2%.
• EIA allocations and expenditures for both the academic and artistic gifted programs have
declined since 2001-2002, and the districts have increased the amount of funds from
their general or special revenue funds to supplement funding for their gifted programs.
• For 2003-2004, EIA funds provided 63% of total district expenditures for the
academically gifted program and 62% of total expenditures for the artistically gifted
program. Districts used general funds or special revenue accounts to supplement EIA
funding as shown in Figures 1 and 2.
63%1%
36%General Fund
SpecialRevenueEIA 62%
24%
14%
General Fund
SpecialRevenueEIA
Figure 1. Academic gifted and talented Figure 2. Artistic gifted and talented
program expenditures for 2003-2004 program expenditures for 2003-2004
• Five districts used the flexibility provision to transfer funds allocated to the artistically
gifted program, and one district transferred funds allocated to programs for academically
gifted students.
• Approximately 95% of EIA funds expended for the academic program were spent for
salaries and fringe benefits. For the artistic program, salaries and fringe benefits made
up the largest share of the expenditures, but purchased services and materials/supplies
comprised a larger portion of expenditures for the artistic program.
• When all sources of funds were considered, school districts showed significant variation
in the amount spent per student for the academic gifted program in 2003-2004. District
expenditures ranged from $22.03 to $3,336.80 per student, with the average being
$607.58 per students. These districts expenditure figures should be viewed with
caution, since expenditure data reported by district program coordinators was not always
consistent with data received from the districts and compiled by the Office of Finance in
the Department of Education.
Results from the District Coordinator’s Questionnaire
A questionnaire was developed and sent to the 85 district coordinators of the gifted and
talented program. The questionnaire asked coordinators to provide information on student
viii
ix
identification and selection, students served, program models, teachers of gifted students,
and program funding. Eighty-two of the 85 district coordinators returned the questionnaire
for a response rate of 96.5%. The major results of the questionnaire include the following:
• Approximately 94% of the district coordinators reported using only state criteria for
identification of gifted and talented students.
• Students in all grade levels (3-12) were served by at least 20% of the districts. Students
in grades 3-5 were reportedly served by 98% of the districts. For other grades, the
following percentages of districts reported having programs for gifted students: grade 6-
89%; grade 7-83%; grade 8-76%; grade 9-40%; grade 10-37%; grade 11-26%; and
grade 12-20%.
• Seventy-one of the district coordinators (86.6% of those responding) indicated that their
districts have a program for artistically gifted students. Many of these programs are
provided either after school, on Saturdays, or during the summer.
• Almost 92% of the districts in South Carolina reported being able to serve all of identified
gifted and talented students in their district.
• The most frequently used program model for grades 3-5 was the pullout model (69.5%).
Special classes in English language arts, math, science, or social studies were the most
frequently reported models serving students in grades 6-8. Students in grades 9-12
were most often served in honors classes, followed closely by the special class model.
• Just about 50% of the district coordinators reported directing all aspects of the gifted and
talented program in their district. Other coordinators have a variety of responsibilities in
addition to the gifted and talented program.
• Less than half of the gifted and talented district coordinators reportedly hold the gifted
and talented endorsement, and only 10% have the add-on gifted and talented
certification.
• A reported 94% of the teachers of gifted students have a professional teaching
certificate and almost 57% have a master’s degree. A little more than half (54.4%) of the
teachers of gifted and talented students have the gifted and talented endorsement, and
only 7.6% have the add-on gifted and talented certification.
• A combined 85% of the districts reported a need for professional development in
curriculum, instruction, and differentiation of instruction.
• The district coordinators cited a wide array of support from State Department of
Education staff including the provision of program information, regional and state
meetings, work shops, and other staff development opportunities.
x
• The quality of the curriculum and instruction was the most frequently reported positive
aspect of the gifted and talented program. Other positive aspects frequently noted
include the quality of the teachers, strong community support, and high quality program
structure.
• Insufficient funding was the most commonly reported challenge faced by gifted and
talented programs. Other major challenges were the recruitment and retention of
teachers, the recruitment and retention of students, meeting the needs of the students,
and curriculum.
• Increased funding was the most commonly reported change needed to improve the
gifted and talented program. Other changes that were frequently mentioned include the
need for more professional development and the need to modify curriculum and
instruction.
Recommendations The findings of this study led to the following recommendations about the gifted and
talented program:
• Additional professional training in curriculum development and instruction should be
provided to teachers of gifted students to ensure that students’ individual instructional
needs are met.
• The requirements for the state’s gifted and talented endorsement should be examined to
ensure that teachers receive sufficient training to be successful instructors of students
with diverse areas of giftedness.
• The availability of required coursework for the gifted and talented teacher endorsement
needs to be improved, possibly by providing incentives to institutions of higher education
to offer the necessary graduate courses in gifted education. The possibility of providing
incentives to teachers or district coordinators who earn a gifted and talented
endorsement should be considered.
• Studies should be conducted on the funding mechanisms that support the provision of
services to gifted and talented students in the state to ensure that the EIA’s requirement
to provide programs to all elementary and secondary gifted and talented students is
achieved. An analysis of the necessary level of funding to provide an adequate gifted
and talented program should be part of these studies.
• Clarification should be provided to the districts on whether program services still need to be
delivered to students if the program funds are “flexed” or shifted to another district program
as permitted under proviso to the state budget.
Introduction The Education Oversight Committee contracted with the South Carolina Educational Policy
Center (SCEPC) in the College of Education at the University of South Carolina to conduct a
descriptive study of South Carolina’s gifted and talented program. The purpose of the study was to
describe the operation of the gifted and talented program in the state’s 85 school districts. The
study included the following major tasks:
• A review of program legislation and regulations for South Carolina’s gifted and talented
program;
• A review of gifted and talented programs in selected states for comparison with South
Carolina’s program;
• A review of student participation and financial data on the gifted and talented program; and
• Administration of questionnaires to coordinators of gifted and talented programs in all 85
school districts.
The following sections of this report present the results of this study. The first section provides
an overview of South Carolina’s gifted and talented program. The state’s program is then
compared with gifted and talented programs in a selected sample of other states in the second
section. The third section describes participants in the program and details program costs for fiscal
years 2002, 2003, and 2004. Next, the results from the district coordinators questionnaires are
described in the fourth section, followed by a discussion of major findings and recommendations.
Overview of South Carolina’s Gifted and Talented Program Background
Although a written history of South Carolina’s gifted and talented program is not available,
some background information on the program’s origins was provided in a 2003 interview with Dr.
Stephen Hefner, Superintendent of Richland School District Two. This interview is included as part
of a computer-based graduate course for teachers of gifted and talented students entitled The
Nature and Needs of Gifted and Talented Students (South Carolina Department of Education,
2005). According to Hefner, three school districts, Richland Two, Kershaw, and Spartanburg 7,
were given money to plan programs for gifted and talented (GT) students during the 1973-1974
school year. These districts shared many resources and in-service opportunities, and met with
leading gifted and talented authorities to determine the best practices in gifted and talented
education. Programs began in the 1974-75 school year and were described as a success by
Hefner for two reasons: 1) they were able to recruit extremely bright students in the 98th-99th
percentile and 2) these identified students developed a higher regard for school and each other
and, therefore, began seeking leadership positions within their schools (Hefner, 2003).
1
Hefner (2003) explained that during the beginning stages of the program, districts
established their own criteria for student identification, relying heavily on intelligence tests. It soon
became apparent to school officials that some high achieving/high ability students with other types
of strengths were not being identified through these intelligence tests. Therefore, districts
experimented with other indicators for identification and began adding identification instruments that
assessed student achievement on tests for reading or math, or on performance-based tests. Other
changes for gifted and talented programs came with the Education Improvement Act of 1984, which
provided security in funding for programs that previously struggled to exist from year to year. This
funding led to the development of a broader state definition for gifted and talented, which led to
large growth in the population of gifted students. Increased funding also allowed for identification at
earlier ages leading to more accurate identification and sustained involvement in gifted programs by
high ability students who otherwise would not have been identified (Hefner, 2003). All of these
factors contributed to the development of the current gifted and talented program in South Carolina.
Description of South Carolina’s Gifted and Talented Program
South Carolina state law (59-29-170) requires that “all gifted and talented students at the
elementary and secondary levels must be provided programs during the regular school year or
during summer school to develop their unique talents in the manner the State Board of Education
must specify and to the extent state funds are provided.” The law provides the following order of
priority for serving students:
1. Grade 3-12 academically identified gifted and talented students (excluding Advanced
Placement students in grades 11-12);
2. After all students eligible under priority one are served, students in grades 3-12 identified
in one of the following visual and performing arts areas: dance, drama, music, and
visual arts must be served; and
3. After all students eligible under priorities one and two are served, students in grades 1
and 2 identified as academically or artistically gifted and talented must be served.
If funds are not sufficient to serve all of the students in a given category, the law gives districts the
authority to decide which students to serve. Districts may also use local funds to serve additional
students that cannot be served with available state funds.
Funding for the state’s gifted and talented program is provided through the Education
Improvement Act (EIA). EIA appropriations are allocated to the school districts based on the
number of gifted and talented students served by the district during the previous year. Provisos to
the state’s budget (see Appendix A) have been used to make changes in the operation of the
program or to direct the expenditure of gifted and talented funds in certain ways. Most relevant to
this study, a current proviso (1A.4) of the 2003-2004 budget requires that 10% of the total state
2
dollars appropriated annually for gifted and talented programs “shall be set aside for serving
artistically gifted and talented students in grades 3-12.” This proviso has been included in the
state’s budget since 1985 to ensure that a portion of the EIA funds will be used to support programs
for artistically gifted students (W. Lord, personal communication, May 24, 2005). The districts
receive a proportionate share of the 10% allocation based on their preceding year’s total average
daily membership in grades 3-12. The proviso specifies that “school districts shall service students
identified as artistically gifted and talented in one or more of the following visual and performing arts
areas: dance, drama, music, and visual arts areas.” The proviso also states that the districts shall
include an accelerated component as part of its academically gifted and talented program.
Guidelines for the current operation of the gifted and talented program in South Carolina are
detailed by the State Board of Education in the 2004 Gifted and Talented Regulations (R43-220).
These regulations describe approved student identification procedures, detail the multiple criteria
that can be used to qualify students, provide definitions for program models, specify the training
required for teachers of gifted and talented students, and establish reporting requirements.
South Carolina defines gifted and talented students in Regulation 43-220 as students
who are identified in grades one through twelve as demonstrating high performance ability or
potential in academic and/or artistic areas and, therefore, require an educational program beyond
that normally provided by the general school program in order to achieve their potential (Section
I.A.1.). The identification process consists of several steps, including screening, referral,
assessment and placement. The process applies to both male and female students of any racial,
ethnic, or socioeconomic group, who may have disabilities or behavioral problems. Descriptions of
the state’s program for academically and artistically gifted students are provided in the following
sections.
Program for Academically Gifted Students
Programs for academically gifted and talented students must reflect the following characteristics
(Regulation 43-220, Section II, A.2.):
content, process, and standards that exceed state-adopted standards for students;
goals and indicators that require students to demonstrate depth and complexity of
knowledge and skills;
instructional strategies that require students to demonstrate depth and complexity of
knowledge and skills;
a confluent approach that incorporates acceleration and enrichment;
opportunities for worldwide communication/research; and
evaluation of student performance and program effectiveness.
3
Evaluation/placement teams, which are comprised of teachers, administrators, other
district/school staff, and qualified members of the community, are established within a school or
district to conduct the assessment of students. The evaluation/placement team is responsible for
the review of assessment instruments to ensure that they accurately assess the intended measures
and reflect no bias. It is also the duty of this team to determine whether a student is in need of a
trial placement in the program, and to develop written procedures for the removal of students from
the program.
Within the academic program, students are deemed eligible for services if they meet the
criteria in two out of three dimensions (A-C). Students meet the criteria for Dimension A
(Reasoning Abilities) if they score at or above the 93rd age percentile on an individual or group
aptitude test. Students may score at this level on one or more of the following areas:
verbal/linguistic, quantitative/ mathematical, nonverbal, or a combination of the three. Dimension B
(High Achievement in Reading and/or Mathematical Areas) requires that students demonstrate high
achievement (94th national percentile or above) in reading and/or math areas on nationally normed
assessments or receive a score of “advanced” on South Carolina’s Palmetto Achievement Test
(PACT). Students fulfill the requirements for Dimension C (Intellectual/Academic Performance) by
displaying evidence of interest in or commitment to academics. This criterion is manifest either
through a student’s grade point average (3.75 on a 4.0 scale for grades 7-12) or performance on
the state’s Project STAR assessment (grades 3-6) (Regulation 43-220, Section II, B.7.c.).
Other students may be eligible if they qualified or were served prior to the 1999 regulation
change, were served in one South Carolina school district and move to another, or meet other test
score requirements not described for Dimensions A B, or C. Students are eligible for the program if
they meet the 96th national age percentile on an individual or group aptitude test. In addition,
students may be placed in the program on trial placement if deemed necessary by the
evaluation/placement team. Students can also be removed from the gifted and talented program
according to written procedures established by the evaluation/placement team. Prior to the removal
of a student, the team must provide counseling for the student, and hold conferences with the
student’s parents and teachers.
Students in the academically gifted program are served through a variety of program models
including regular or multiage classrooms, resource rooms/pullout models, special schools, and
special classes during the regular school year. Additional program strategies can be used to
supplement services provided to students through the program models and are detailed in the
comparison of state gifted and talented programs. The program models require appropriate
teacher/pupil ratios, and allow for adequate teacher planning time (a minimum of 250 minutes per
week). In addition, every model must provide sufficient time to assure that the goals and objectives
4
of the program are met. The required minutes per year range from 4,500 to 8,100 depending on the
grade level and program model.
Districts provide a program plan every three years, and report on their progress annually in
order to demonstrate that they are meeting the program requirements. The State Department of
Education (SDE) developed a formal process and recommended format for the local plan. This
plan addresses curriculum, instruction, assessment, support services, program models, teacher-
pupil ratio, and appropriate and sufficient time in instruction. The SDE will review the district plans
annually and provide feedback to the districts. Districts will begin reporting student test score
information to the SDE in 2005 on PACT, Advanced Placement exams, International Baccalaureate
exams, Scholastic Assessment Test (SAT), American College Test (ACT) and similar college
entrance tests. Information also reported to the SDE includes numbers of eligible, screened, and
referred students by specified demographics; performance summaries on a number of
assessments; and enrollment reports.
Teachers of gifted and talented students are required to complete a State Department of
Education approved training program in addition to regular teacher certification. The current
approved program is known as the gifted and talented endorsement and it requires 6 hours of
graduate coursework in gifted education. Exceptions include newly assigned teachers who have
one year to meet training requirements and teachers with a master’s degree or higher in gifted
education who may have this requirement waived upon approval of credentials by the State
Department. Districts are expected to provide professional development activities geared toward
gifted education.
Program for Artistically Gifted Students
The gifted and talented program for artistic students has guidelines similar to the academic
program that highlight the unique needs of artistic students. In particular, these regulations specify
that:
a written plan should be developed detailing artistic requirements (Regulation 43-220,
Section III, A.1);
artistic programs should be developed with specific curriculum, instruction, and assessment
characteristics (Regulation 43-220, Section III, A.2); and
programs should focus on creative expression in one or more of the following areas: dance,
drama, music, and/or visual arts (Regulation 43-220, Section III, A.3.).
A review team, like that in the academic program, is established for the artistic program,
consisting of teachers of the arts, administrators and qualified community members. Referrals for
the artistic program are used to identify students who have an aptitude for the arts and may benefit
from intense exploration and in-depth study in one or more of the arts. As in the academic
5
program, the identification process applies to both male and female students of any racial, ethnic, or
socioeconomic group, who may have disabilities or behavioral problems. The referral process
begins when a teacher of the arts completes a recommendation and/or referral form, specifying the
areas of a student’s giftedness. The evaluation/placement team then conducts assessments based
on student demonstrations/auditions, and either a student interview or questionnaire.
Eligible artistically gifted students are also served through a variety of program models
including in-school, after-school, summer, Saturday, and consortium programs. These program
models must provide sufficient time to assure that the goals and objectives of the program are met.
The required minutes per year range from 4,500 to 8,100 depending on the grade level and
program model. Summer programs must be 30 days in length, and Saturday programs must be a
minimum of 30 Saturdays with between 2.5 and 5 hours per day depending on the student’s grade
level. Teachers of artistically gifted and talented students must hold a valid teaching certificate, with
the exception of visual or performing arts professionals hired by the district. These teachers must
receive appropriate district-level supervision. Districts are expected to provide professional
development activities geared toward gifted education for these teachers.
Following this in-depth description of the programs provided to South Carolina’s academically and
artistically gifted and talented students, is a comparison of the major components of the state’s
program, to those programs of other select states.
Comparison of South Carolina’s Program with Other State Programs
Since there is no federal legislation that requires states to provide services to gifted and talented
students, individual states develop their own programs with their own definitions of “gifted” students. One
of the tasks in this study was to compare South Carolina’s gifted and talented programs with programs in
other selected states. In consultation with staff from the Education Oversight Committee, eight states
(Arkansas, Connecticut, Florida, Georgia, Massachusetts, New Jersey, North Carolina, and Virginia)
were selected. These states were selected because their students have been successful on
standardized assessments such as the National Assessment of Educational Progress (NAEP) or the
Scholastic Assessment Test (SAT), or their gifted programs are reported to be successful, serving
populations of students in the Southeast similar to those students served in South Carolina. Among the
states in this analysis, Connecticut, Massachusetts, and New Jersey do not have state-funded gifted
programs. The program in Connecticut is “permissive” in that the districts choose whether to have a
gifted program or not (J. Purcell, personal communication, May 18, 2005). The state provides guidelines
for various aspects of the program, but does not require district participation. In New Jersey, local boards
of education must identify gifted students and provide them with appropriate instructional services, but
the state does not provide state-level criteria for giftedness or specify measures to be used for student
identification. Massachusetts is in the process of developing policies and program definitions. Recently,
6
Massachusetts funded a summit conference on gifted education and will provide $500,000 next year for
various state initiatives in gifted education (D. Modest, personal communication, May 18, 2005).
The following data was gathered from each state: definition of a gifted and talented student,
identification and selection criteria used for gifted and talented students, profile of the gifted and talented
students served, program models used, profile of teachers of gifted and talented students, and
information on program funding. The following sections compare and contrast these major
characteristics of the selected states’ gifted and talented programs. Details of the state comparisons for
each of these characteristics can be found in Appendix B.
State Definitions of Giftedness
Gifted and talented students are defined by the states included in this comparison as
students who have demonstrated high academic achievement or the potential ability to perform at a
high level and need differentiated instruction that is not provided by education in the regular
classroom (Education Commission of the States, 2004). Table 1 presents the various definitions of
giftedness used in the states under study. South Carolina and Virginia are the only states that
define gifted and talented students as those in grades 1 – 12, pre-K – 12, and kindergarten through
graduation, respectively (Education Commission of the States, 2004). South Carolina and
Connecticut are the only states that recognize artistically gifted and talented students in their
definition (Education Commission of the States, 2004), although Virginia identifies students for
program services who are artistically gifted. South Carolina also provides for the possibility that the
student is gifted in one or more fine arts areas (Education Commission of the States, 2004).
Table 1
State Definitions of Gifted Students
State Gifted Definition
South Carolina 1) Gifted and talented students are those who are identified in grades
1– 12 as demonstrating high performance ability or potential in
academic and/or artistic areas and therefore require an educational
program beyond that normally provided by the general school
program in order to achieve their potential.
2) Gifted and talented abilities for these regulations include:
a) Academic and Intellectual Ability: Students who have the
academic and/or intellectual potential to function at a high level in
one or more academic areas.
Visual and Performing Arts: Students who have the artistic potential to
function at a high performance level in one or more of the fine arts (South
7
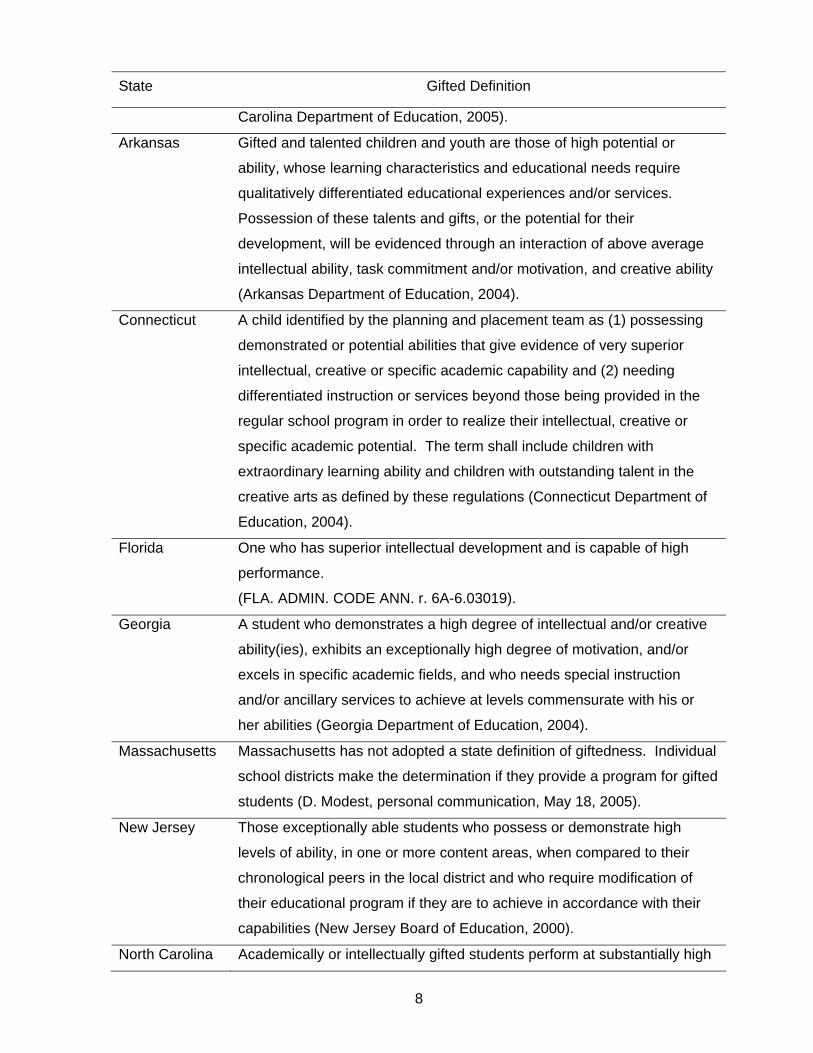
State Gifted Definition
Carolina Department of Education, 2005).
Arkansas Gifted and talented children and youth are those of high potential or
ability, whose learning characteristics and educational needs require
qualitatively differentiated educational experiences and/or services.
Possession of these talents and gifts, or the potential for their
development, will be evidenced through an interaction of above average
intellectual ability, task commitment and/or motivation, and creative ability
(Arkansas Department of Education, 2004).
Connecticut A child identified by the planning and placement team as (1) possessing
demonstrated or potential abilities that give evidence of very superior
intellectual, creative or specific academic capability and (2) needing
differentiated instruction or services beyond those being provided in the
regular school program in order to realize their intellectual, creative or
specific academic potential. The term shall include children with
extraordinary learning ability and children with outstanding talent in the
creative arts as defined by these regulations (Connecticut Department of
Education, 2004).
Florida One who has superior intellectual development and is capable of high
performance.
(FLA. ADMIN. CODE ANN. r. 6A-6.03019).
Georgia A student who demonstrates a high degree of intellectual and/or creative
ability(ies), exhibits an exceptionally high degree of motivation, and/or
excels in specific academic fields, and who needs special instruction
and/or ancillary services to achieve at levels commensurate with his or
her abilities (Georgia Department of Education, 2004).
Massachusetts Massachusetts has not adopted a state definition of giftedness. Individual
school districts make the determination if they provide a program for gifted
students (D. Modest, personal communication, May 18, 2005).
New Jersey Those exceptionally able students who possess or demonstrate high
levels of ability, in one or more content areas, when compared to their
chronological peers in the local district and who require modification of
their educational program if they are to achieve in accordance with their
capabilities (New Jersey Board of Education, 2000).
North Carolina Academically or intellectually gifted students perform at substantially high
8
State Gifted Definition
levels of accomplishments when compared with others of their age,
experience, or environment. Academically or intellectually gifted (AIG)
students exhibit high performance capability in intellectual areas, specific
academic fields, or in both intellectual areas and specific academic fields.
Academically or intellectually gifted students require differentiated
education services beyond those ordinarily provided by the regular
educational program. Outstanding abilities are present in students from
all cultural groups, across all economic strata, and in all areas of human
behavior (North Carolina Department of Public Instruction, 2003).
Virginia Gifted students mean those students in public elementary and secondary
schools beginning with kindergarten through graduation whose abilities
and potential for accomplishment are so outstanding that they require
special programs to meet their educational needs (Virginia Department of
Education, 2005).
State Identification and Selection Criteria
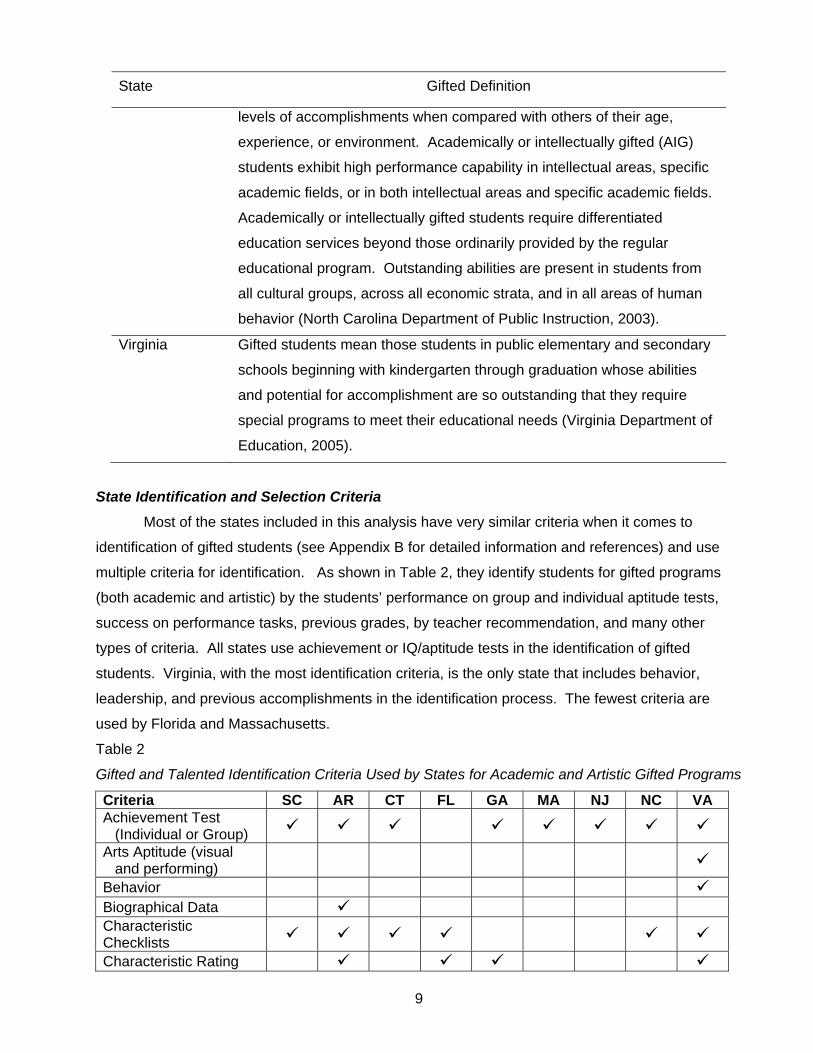
Most of the states included in this analysis have very similar criteria when it comes to
identification of gifted students (see Appendix B for detailed information and references) and use
multiple criteria for identification. As shown in Table 2, they identify students for gifted programs
(both academic and artistic) by the students’ performance on group and individual aptitude tests,
success on performance tasks, previous grades, by teacher recommendation, and many other
types of criteria. All states use achievement or IQ/aptitude tests in the identification of gifted
students. Virginia, with the most identification criteria, is the only state that includes behavior,
leadership, and previous accomplishments in the identification process. The fewest criteria are
used by Florida and Massachusetts.
Table 2
Gifted and Talented Identification Criteria Used by States for Academic and Artistic Gifted Programs
Criteria SC AR CT FL GA MA NJ NC VA Achievement Test
(Individual or Group)
Arts Aptitude (visual and performing)
Behavior Biographical Data Characteristic Checklists
Characteristic Rating
9
Scales Creativity Test IQ/Aptitude Test
(Individual or Group)
Leadership Nominations/Referrals Previous
Accomplishments (Awards, Honors)
Questionnaires Scholastic Performance
(Grades/GPA)
Structured Observation (Audition, Interview)
Student Generated Product/Portfolio
Student Interest/Motivation
Student Performance Tasks
Teacher Evaluation
South Carolina, North Carolina, and Georgia are the only states among those reviewed for
this study that specify required student performance levels in terms of percentiles or other types of
scores in state-wide law or regulation. The major difference between the states is the performance
levels at which students are identified. Other states, with the exception of Massachusetts, establish
guidelines for identification and selection, but allow individual school districts to establish their own
criteria. New Jersey does suggest that the districts’ identification procedures should identify 3-5%
of the school population. Arkansas requires strong parental involvement for identification and
placement procedures (Arkansas Department of Education, 1999). Connecticut provides their local
education agencies (LEA) with requirements for identification instruments, but gives them discretion
over the specific instrument that will be used (Connecticut Department of Education, 2001). Florida
includes specific guidelines for the identification of under-represented groups, but allows each
school district to create a plan that outlines the criteria for increasing the participation of these
groups (Education Commission of the States, 2004). Georgia qualifies students with a combination
of mental ability and achievement test scores, but also allows measures of creativity or motivation
to be used. Both North Carolina and Virginia use multiple measures for identification including
achievement tests, aptitude tests, academic performance, student motivation, and student work. Profile of Students Served
The numbers of students served by the states included in this study, as well as available
information on the ethnicity of these students, are described in Tables 3 and 4 (see Appendix B for
10

references and more detail). As shown in Table 3, the numbers of students served by gifted and
talented programs in the selected states ranged from 4.60% to 12.56% when considered as a
percentage of K-12 enrollments. The six states with state-funded programs serve an average of
8.9% of their K-12 student population in gifted and talented programs. Florida served the smallest
proportion of students at 4.60%, while Virginia served the largest proportion with 12.56% of their K-
12 students receiving services. South Carolina served 10.24% of their K-12 enrollment in 2003-
2004.
Table 3
Participation in Gifted and Talented Programs by State and as a Percentage of K-12 Enrollment for
2003-2004
State # of GT Students K-12 Enrollment Percentage South Carolina 71,095 694,584 10.24%
Arkansas 46,710 452,031 10.33%
Connecticut Not applicable 570,023 Not applicable
Florida 116,880 2,539,929 4.60%
Georgia 106,596 1,496,012 7.13%
Massachusetts Not applicable 982,989 Not applicable
New Jersey Not applicable 1,367,438 Not applicable
North Carolina 146,321 1,325,344 11.04%
Virginia 147,832a 1,177,229 12.56% a2002-2003 data
Table 4 shows the percentage of students, disaggregated by ethnicity, who participated in
state gifted programs for 2003-2004. Current demographic student data, such as ethnicity, was
difficult to find for each of the selected states. For one of the states, data from 2000 (Education
Trust, 2004) was used for comparison purposes because disaggregated data for more recent years
could not be located. With the exception of Connecticut, Massachusetts and New Jersey which do
not have state-funded gifted programs, White students accounted for approximately 63% - 84% of
the gifted population. The next largest ethnic group, African Americans, accounted for
approximately 8% -16% of the gifted population. Latino or Hispanic students made up about 1% to
19.5% of the population of gifted students. Gifted programs served 1% to 9% Asian American
students. Native American groups accounted for less than 1% of students served by gifted
programs in the selected states.
11
Table 4
Ethnicity of Gifted and Talented Students Served by Selected States in 2003-2004
Ethnicity
State
% White
% African American
% Hispanic or Latino
% Asian American
% American Indian/Alas.
% Multi-racial/Other
South Carolina 80.57 15.76 ---- ---- ---- 3.66
Arkansasa 81.00 15.00 2.00 1.00 <.5 ----
Connecticut NA NA NA NA NA ----
Florida 63.17 9.61 19.52 4.23 0.31 3.16
Georgia 74.86 15.21 2.20 5.55 0.15 2.03
Massachusetts NA NA NA NA NA ----
New Jersey NA NA NA NA NA ----
North Carolina 83.78 10.45 1.82 3.16 0.79 ----
Virginiab 76.04 10.51 3.22 8.49 0.23 1.51 a Data provided by Education Trust (2004). b 2002-2003.
Program Models
Table 5 shows the types of program models or strategies used for gifted and talented
education in the states reviewed for this study. More details on the specifics of individual state
models can be found in Appendix B. With the exception of Connecticut, the program models
approved by each of the states are very similar in the elementary and middle grades. These
models include: differentiated instruction in the regular classroom, resource room/pull-out, self-
contained, cluster grouping, consultation and instruction through technology. In addition, South
Carolina and New Jersey offer multi-age classrooms and individual educational plans at this level.
At the high school level, the types of program models expand to include special schools, special
classes, and mentorships/internships. Georgia, New Jersey, and North Carolina offer joint
enrollment/postsecondary options for their gifted high school students. North Carolina and South
Carolina offer summer enrichment for their gifted students. Florida offers the following specialized
models as a part of the Challenge Grant program: brain-compatible learning, student and teacher
centered approach, Environment as the Integrating Context (EIC) Curriculum, Renzulli Enrichment
Triad model, Gardner’s multiple intelligence, and Glasser’s choice theory. Connecticut’s districts
are not mandated to serve or identify students, nor are the school districts required to provide
programming for children identified as gifted and talented (CTDOE, 2001; Connecticut Association
for the Gifted, 2004;). The Connecticut State Board of Education recommends that the public
schools meet the needs of gifted and talented students through differentiation and accommodation
in the regular classroom (Connecticut Association for the Gifted, 2004).
12
Table 5
Gifted and Talented Program Models or Strategies Used by Selected States Model SCa AR CT FL GA MAb NJ NC VA Brain-compatible
learning
Cluster grouping Collaborations with
community resources
Collaborative teaching
Consultation Differentiated
instruction and modification
Distance learning Early admission Early graduation EIC Curriculum Enrichment (after
school, summer, or whole group )
Exchange program Exploratory courses Gardner’s multiple
intelligence
Glasser’s choice theory
Grade/Subject acceleration (Course content)
Honors, Advanced, Pre-advanced placement classes
Independent study Individual educational
plans
Instruction through technology
Joint enrollment/ postsecondary options (International Baccalaureate)
Mentorship/Internship Multi-age classrooms Parent/Training
services
Regular classroom/ Itinerant teacher
Renzulli Enrichment Triad
Resource room/pull-out
13
School-within-a-School
Seminars/Guest speakers
Separate full-day advance academic programs
Special classes/Self-contained
Special school Student and teacher
centered approach a South Carolina’s approved program models include regular classroom (itinerant teacher), resource room/pull out, special
classes, special schools, or multi-age classrooms. Other “strategies” can only be used to supplement services provided with one of the approved models.
b Massachusetts does not provide a state-funded gifted program and does not provide guidelines to districts on preferred models.
Profile of Teachers of Gifted and Talented Students
Information on the characteristics of teachers of gifted programs was difficult to locate, and
often the states could not provide very specific information for current teachers (see Appendix B).
Data on teachers in South Carolina was collected as part of the questionnaire for district
coordinators and is reported in a subsequent section of this report. Teacher profiles were found,
including demographic data for all teachers or all exceptional education teachers, but not
specifically for teachers of gifted and talented students. Requirements for additional training
beyond certification for teachers of gifted students were more readily available. All states require
that the teachers hold a valid teaching certificate or license appropriate to the grade level(s) or
subject area(s) they teach. Gaining a valid teaching certificate or licensure in Connecticut,
Massachusetts, and New Jersey includes studies in meeting the needs of gifted students.
Teachers in these states are not required to complete any additional training or coursework.
However, in 2003 Massachusetts offered a competitive grant program to teachers that focused on
gifted and talented professional development (Driscoll, 2004). As part of a process to develop a
state gifted program in Massachusetts, teachers will be required to have 12 graduate hours in gifted
education for an add-on certification (D. Modest, personal communication, May 18, 2005).
Table 6 shows the requirements for additional training beyond basic certification in other
states studied for this report. In Arkansas, Florida, Georgia, North Carolina, South Carolina, and
Virginia, teachers have to meet additional requirements for gifted endorsement. These states
require from 6 to 18 hours of graduate credit in gifted education to receive endorsements or add-on
certifications. Arkansas requires the most additional coursework with 18 hours, and South Carolina
requires the least hours with 6 hours of coursework. Georgia, North Carolina, and Massachusetts
(beginning in FY 2006) require 12 hours of additional training, while Florida teachers take 15 hours
of coursework. Virginia combines 12 graduate hours of coursework with a 3-hour practicum for a
total of 15 hours.
14

Table 6 Requirements for Additional Training for Teachers of Gifted and Talented Students Beyond
Certification in Selected States
State Requirements for Additional Training Beyond Certification
South Carolina Gifted and talented endorsement requires 6 graduate hours in courses on the
nature and needs of gifted and talented students and introduction to
curriculum and instruction for gifted and talented students. Newly assigned
teachers have one year to meet the requirement. Experienced teachers may
have this requirement waived by the Department of Education.
Arkansas Add-on endorsement in gifted education requires 18 graduate hours with
coursework in the following areas of gifted education: identification and
programming, methods and materials, curriculum and development,
counseling and guidance, testing and evaluation, creativity, supervised
practicum, independent study, and seminar or special topics.
Connecticut None required.
Florida 15 semester hours in gifted education to include 3 hours in each of the
following areas: nature and needs of gifted students, curriculum and
instructional strategies for the gifted, guidance and counseling of the gifted,
educating special populations of gifted students, and theory and
development of creativity.
Georgia Gifted in-field endorsement requires teachers to complete a standards-based
program that may be delivered through university credit courses (equivalent
to 12 credit hours) or approved professional development courses. Required
courses at the University of Georgia include assessment of gifted children
and youth, characteristics of gifted children and youth, strategies and
materials for the gifted, and program and curriculum development for the
gifted.
Massachusetts The gifted program is under development in the state. In preparation for the
program, new licensure rules will require teachers of gifted students to have
an add-on certification that requires 12 hours of graduate credit in gifted
education.
New Jersey None.
North Carolina Add-on certification for academically or intellectually gifted requires 12 hours
of study beyond licensure.
Virginia The endorsement requires 15 graduate hours (12 hours of coursework on
15
the following topics: characteristics and identification of the gifted, teaching
methods and models, socio-emotional needs of the gifted, program
evaluation, and parent/community involvement as well as a 3 hour
practicum). Not all districts require teachers to have an add-on licensure
endorsement.
Funding of Gifted and Talented Programs
Table 7 shows the state funds spent for gifted education, number of gifted students, and the
per student expenditure for the states where this information was available (see Appendix B for the
sources of this data). Connecticut, Massachusetts, and New Jersey do not provide state funding to
gifted and talented programs. Arkansas’ local school districts are mandated to expend for gifted
and talented programs from state and local revenues, not less than the previous year’s average
daily membership (ADM) participating in gifted and talented programs, up to five percent (5%) of the
previous year’s ADM, multiplied by fifteen hundredths (0.15) times the base local revenue per
student (Arkansas Department of Education [ARDOE], 1995). Under the Challenge Grant, Florida
awards each participating school $10,000 (Florida Department of Education [FLDOE] Bureau of
Instructional Support and Community Services, 2004b). Additional funds spent by the districts
come from their appropriation for exceptional student education and the districts determine the
amount of these funds to spend on gifted education. In fiscal year 2004, Georgia spent
$155,000,000 for gifted education. North Carolina’s funding for gifted and talented is allocated as
4% of each LEA’s average daily membership multiplied by $926.57 per student (for 2004). Virginia
provides each district with an apportioned share of state-appropriated funds to support local
program services, and the districts must match the state allocation with local funds, based on the
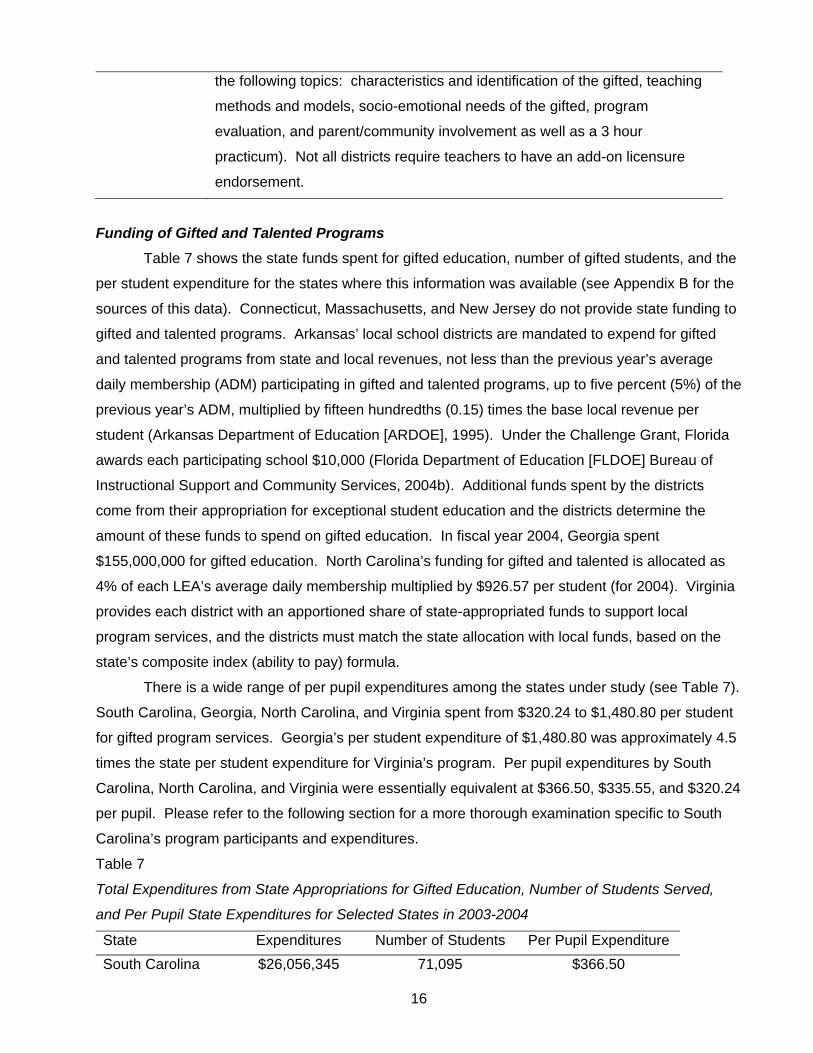
state’s composite index (ability to pay) formula.
There is a wide range of per pupil expenditures among the states under study (see Table 7).
South Carolina, Georgia, North Carolina, and Virginia spent from $320.24 to $1,480.80 per student
for gifted program services. Georgia’s per student expenditure of $1,480.80 was approximately 4.5
times the state per student expenditure for Virginia’s program. Per pupil expenditures by South
Carolina, North Carolina, and Virginia were essentially equivalent at $366.50, $335.55, and $320.24
per pupil. Please refer to the following section for a more thorough examination specific to South
Carolina’s program participants and expenditures.
Table 7 Total Expenditures from State Appropriations for Gifted Education, Number of Students Served,
and Per Pupil State Expenditures for Selected States in 2003-2004
State Expenditures Number of Students Per Pupil Expenditure South Carolina $26,056,345 71,095 $366.50
16
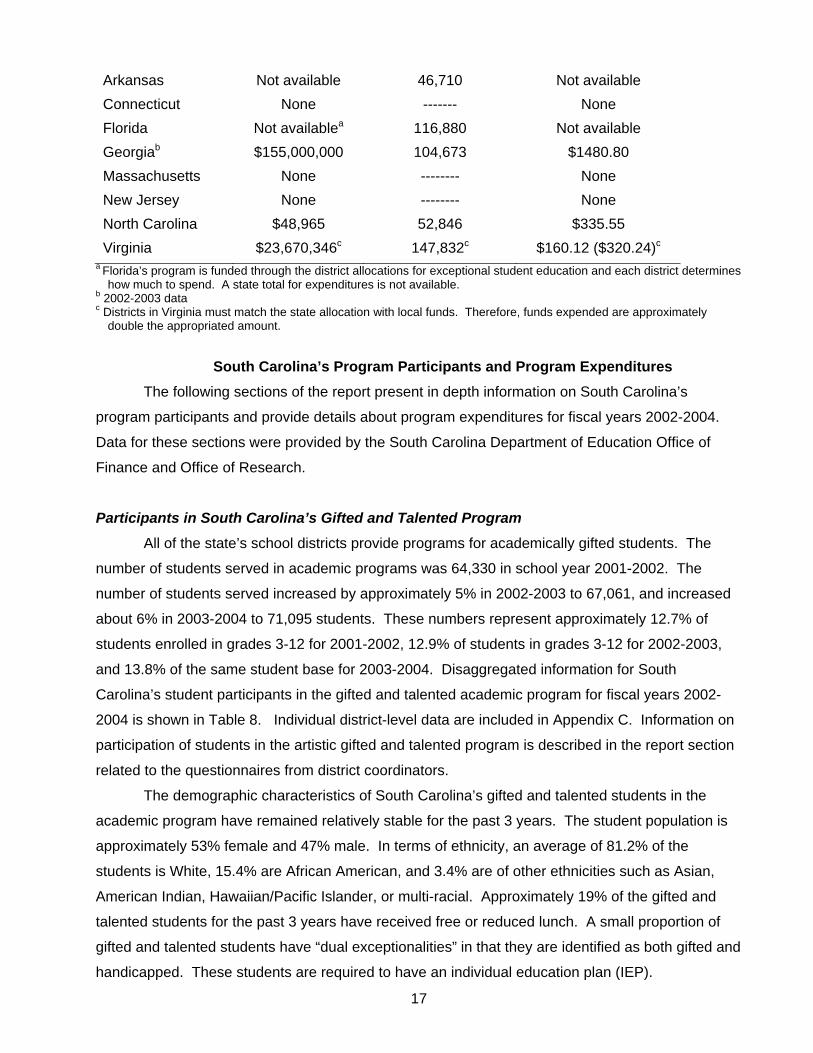
Arkansas Not available 46,710 Not available Connecticut None ------- None Florida Not availablea 116,880 Not available Georgiab $155,000,000 104,673 $1480.80 Massachusetts None -------- None New Jersey None -------- None North Carolina $48,965 52,846 $335.55 Virginia $23,670,346c 147,832c $160.12 ($320.24)c
a Florida’s program is funded through the district allocations for exceptional student education and each district determines how much to spend. A state total for expenditures is not available.
b 2002-2003 data c Districts in Virginia must match the state allocation with local funds. Therefore, funds expended are approximately
double the appropriated amount.
South Carolina’s Program Participants and Program Expenditures The following sections of the report present in depth information on South Carolina’s
program participants and provide details about program expenditures for fiscal years 2002-2004.
Data for these sections were provided by the South Carolina Department of Education Office of
Finance and Office of Research.
Participants in South Carolina’s Gifted and Talented Program
All of the state’s school districts provide programs for academically gifted students. The
number of students served in academic programs was 64,330 in school year 2001-2002. The
number of students served increased by approximately 5% in 2002-2003 to 67,061, and increased
about 6% in 2003-2004 to 71,095 students. These numbers represent approximately 12.7% of
students enrolled in grades 3-12 for 2001-2002, 12.9% of students in grades 3-12 for 2002-2003,
and 13.8% of the same student base for 2003-2004. Disaggregated information for South
Carolina’s student participants in the gifted and talented academic program for fiscal years 2002-
2004 is shown in Table 8. Individual district-level data are included in Appendix C. Information on
participation of students in the artistic gifted and talented program is described in the report section
related to the questionnaires from district coordinators.
The demographic characteristics of South Carolina’s gifted and talented students in the
academic program have remained relatively stable for the past 3 years. The student population is
approximately 53% female and 47% male. In terms of ethnicity, an average of 81.2% of the
students is White, 15.4% are African American, and 3.4% are of other ethnicities such as Asian,
American Indian, Hawaiian/Pacific Islander, or multi-racial. Approximately 19% of the gifted and
talented students for the past 3 years have received free or reduced lunch. A small proportion of
gifted and talented students have “dual exceptionalities” in that they are identified as both gifted and
handicapped. These students are required to have an individual education plan (IEP).
17
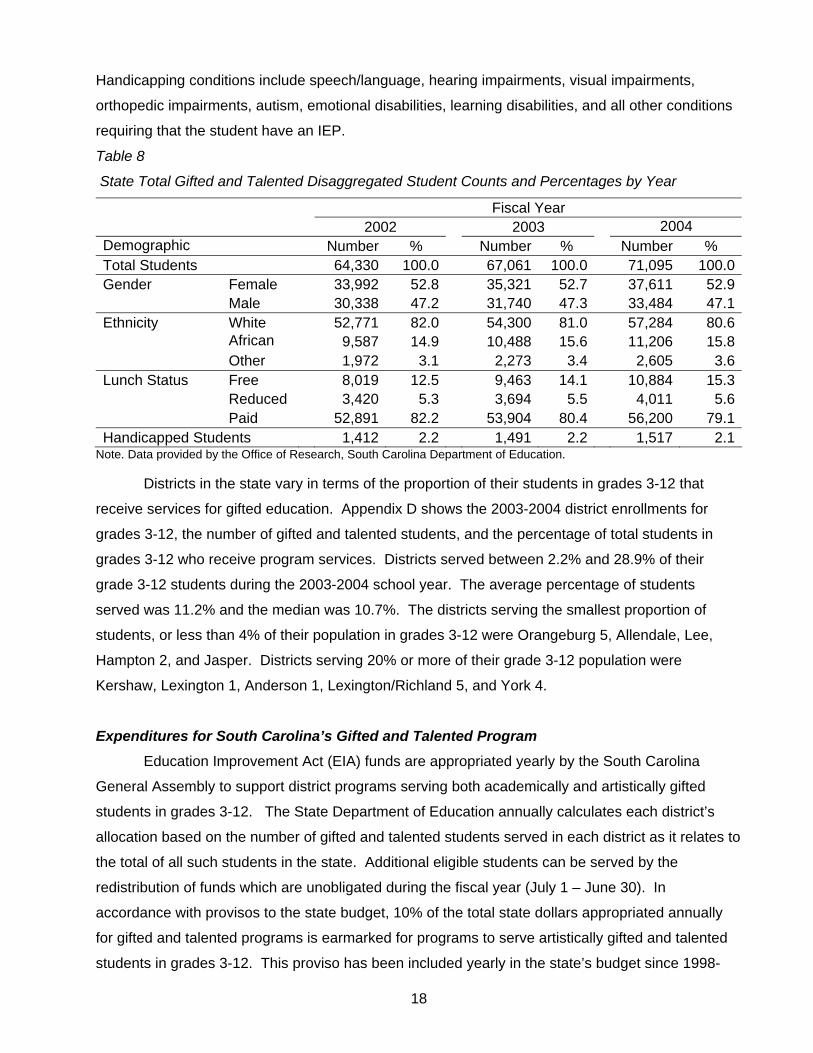
Handicapping conditions include speech/language, hearing impairments, visual impairments,
orthopedic impairments, autism, emotional disabilities, learning disabilities, and all other conditions
requiring that the student have an IEP.
Table 8
State Total Gifted and Talented Disaggregated Student Counts and Percentages by Year
Fiscal Year 2002 2003 2004 Demographic Number % Number % Number % Total Students 64,330 100.0 67,061 100.0 71,095 100.0Gender Female 33,992 52.8 35,321 52.7 37,611 52.9 Male 30,338 47.2 31,740 47.3 33,484 47.1Ethnicity White 52,771 82.0 54,300 81.0 57,284 80.6 African 9,587 14.9 10,488 15.6 11,206 15.8 Other 1,972 3.1 2,273 3.4 2,605 3.6Lunch Status Free 8,019 12.5 9,463 14.1 10,884 15.3 Reduced 3,420 5.3 3,694 5.5 4,011 5.6 Paid 52,891 82.2 53,904 80.4 56,200 79.1Handicapped Students 1,412 2.2 1,491 2.2 1,517 2.1
Note. Data provided by the Office of Research, South Carolina Department of Education. Districts in the state vary in terms of the proportion of their students in grades 3-12 that
receive services for gifted education. Appendix D shows the 2003-2004 district enrollments for
grades 3-12, the number of gifted and talented students, and the percentage of total students in
grades 3-12 who receive program services. Districts served between 2.2% and 28.9% of their
grade 3-12 students during the 2003-2004 school year. The average percentage of students
served was 11.2% and the median was 10.7%. The districts serving the smallest proportion of
students, or less than 4% of their population in grades 3-12 were Orangeburg 5, Allendale, Lee,
Hampton 2, and Jasper. Districts serving 20% or more of their grade 3-12 population were
Kershaw, Lexington 1, Anderson 1, Lexington/Richland 5, and York 4.
Expenditures for South Carolina’s Gifted and Talented Program
Education Improvement Act (EIA) funds are appropriated yearly by the South Carolina
General Assembly to support district programs serving both academically and artistically gifted
students in grades 3-12. The State Department of Education annually calculates each district’s
allocation based on the number of gifted and talented students served in each district as it relates to
the total of all such students in the state. Additional eligible students can be served by the
redistribution of funds which are unobligated during the fiscal year (July 1 – June 30). In
accordance with provisos to the state budget, 10% of the total state dollars appropriated annually
for gifted and talented programs is earmarked for programs to serve artistically gifted and talented
students in grades 3-12. This proviso has been included yearly in the state’s budget since 1998-
18
1999. The districts receive a proportionate share of the 10% allocation based on their preceding
year’s total average daily membership in grades 3-12. School districts are authorized to expend
allocated funds on students meeting the eligibility criteria and being served in approved programs.
According to the State Board of Education Regulations, school districts identifying and serving 40
students or less receive a minimum funding of $15,000 annually for academic programs. State
funds provided for gifted and talented programs must directly impact students served in accordance
with provisions of the State Board of Education regulations.
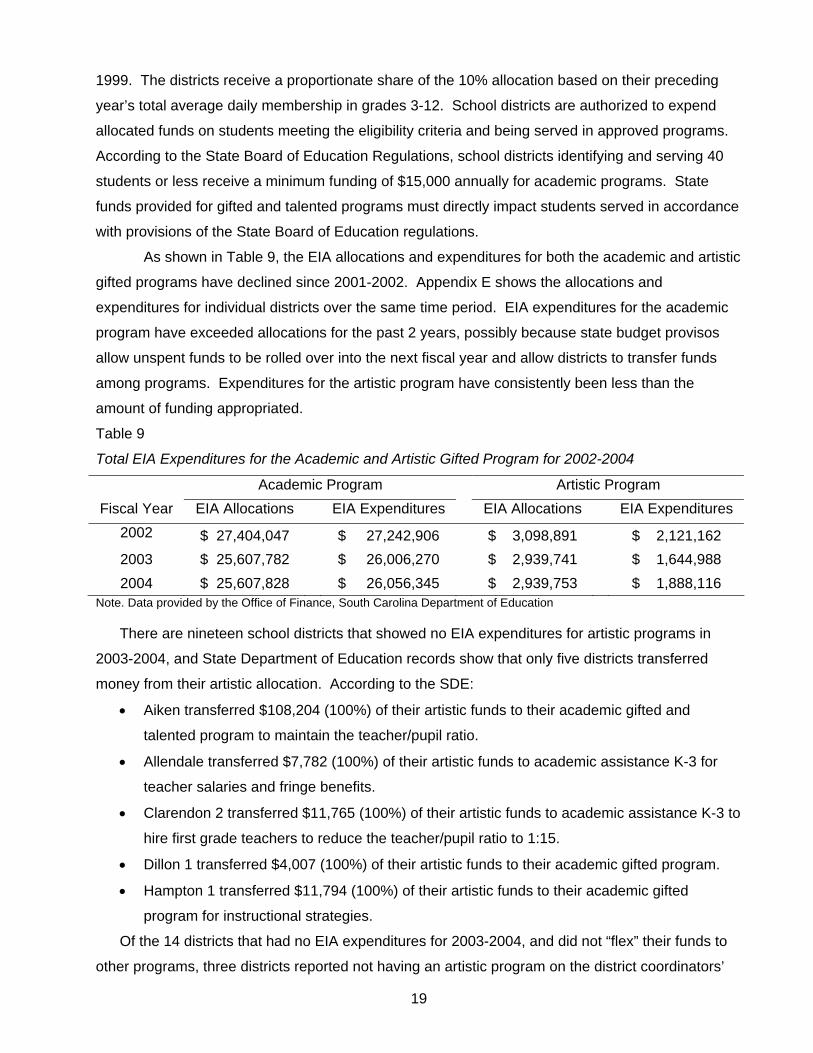
As shown in Table 9, the EIA allocations and expenditures for both the academic and artistic
gifted programs have declined since 2001-2002. Appendix E shows the allocations and
expenditures for individual districts over the same time period. EIA expenditures for the academic
program have exceeded allocations for the past 2 years, possibly because state budget provisos
allow unspent funds to be rolled over into the next fiscal year and allow districts to transfer funds
among programs. Expenditures for the artistic program have consistently been less than the
amount of funding appropriated.
Table 9 Total EIA Expenditures for the Academic and Artistic Gifted Program for 2002-2004
Academic Program Artistic Program Fiscal Year EIA Allocations EIA Expenditures EIA Allocations EIA Expenditures
2002 $ 27,404,047 $ 27,242,906 $ 3,098,891 $ 2,121,162 2003 $ 25,607,782 $ 26,006,270 $ 2,939,741 $ 1,644,988 2004 $ 25,607,828 $ 26,056,345 $ 2,939,753 $ 1,888,116
Note. Data provided by the Office of Finance, South Carolina Department of Education
There are nineteen school districts that showed no EIA expenditures for artistic programs in
2003-2004, and State Department of Education records show that only five districts transferred
money from their artistic allocation. According to the SDE:
• Aiken transferred $108,204 (100%) of their artistic funds to their academic gifted and
talented program to maintain the teacher/pupil ratio.
• Allendale transferred $7,782 (100%) of their artistic funds to academic assistance K-3 for
teacher salaries and fringe benefits.
• Clarendon 2 transferred $11,765 (100%) of their artistic funds to academic assistance K-3 to
hire first grade teachers to reduce the teacher/pupil ratio to 1:15.
• Dillon 1 transferred $4,007 (100%) of their artistic funds to their academic gifted program.
• Hampton 1 transferred $11,794 (100%) of their artistic funds to their academic gifted
program for instructional strategies.
Of the 14 districts that had no EIA expenditures for 2003-2004, and did not “flex” their funds to
other programs, three districts reported not having an artistic program on the district coordinators’
19
questionnaire. Eight districts reported on the district coordinators’ questionnaire that they had an
artistic program and spent EIA funds for that program, often in addition to other funds from grants,
consortium, or tuition charged to parents. One district reported that their program was funded
totally by grants, and information was not provided on the questionnaire for the remaining two
districts.
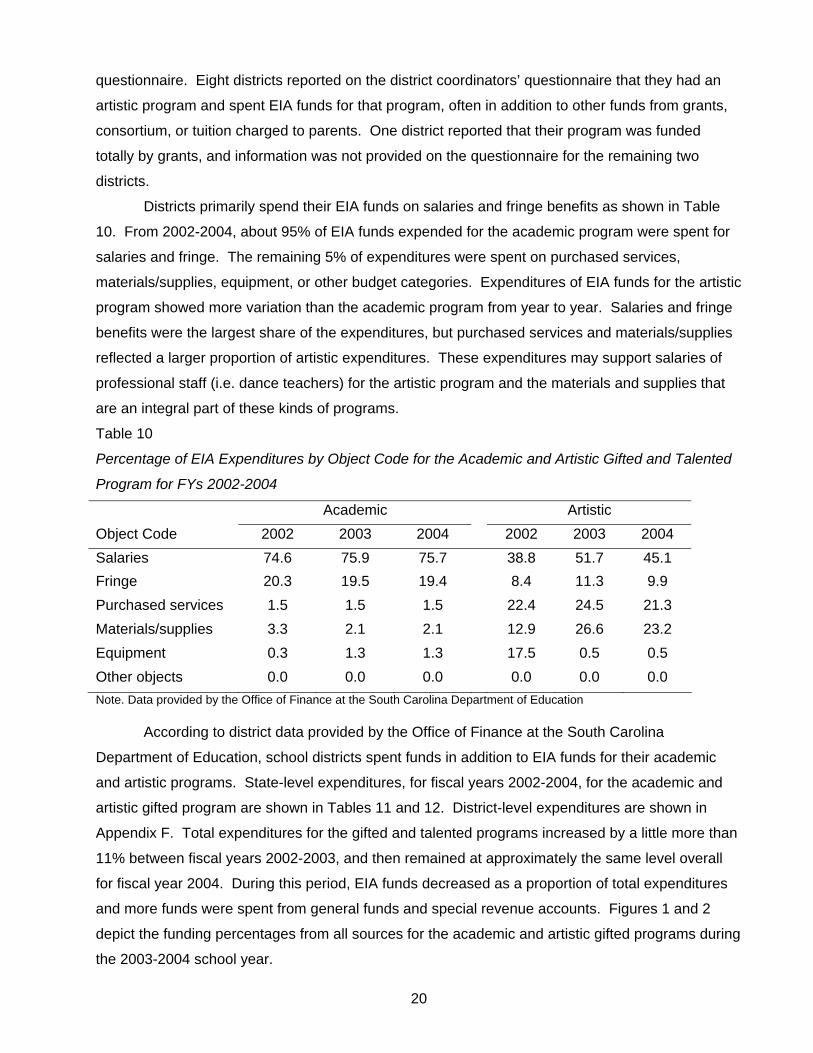
Districts primarily spend their EIA funds on salaries and fringe benefits as shown in Table
10. From 2002-2004, about 95% of EIA funds expended for the academic program were spent for
salaries and fringe. The remaining 5% of expenditures were spent on purchased services,
materials/supplies, equipment, or other budget categories. Expenditures of EIA funds for the artistic
program showed more variation than the academic program from year to year. Salaries and fringe
benefits were the largest share of the expenditures, but purchased services and materials/supplies
reflected a larger proportion of artistic expenditures. These expenditures may support salaries of
professional staff (i.e. dance teachers) for the artistic program and the materials and supplies that
are an integral part of these kinds of programs.
Table 10
Percentage of EIA Expenditures by Object Code for the Academic and Artistic Gifted and Talented
Program for FYs 2002-2004
Academic Artistic Object Code 2002 2003 2004 2002 2003 2004 Salaries 74.6 75.9 75.7 38.8 51.7 45.1 Fringe 20.3 19.5 19.4 8.4 11.3 9.9 Purchased services 1.5 1.5 1.5 22.4 24.5 21.3 Materials/supplies 3.3 2.1 2.1 12.9 26.6 23.2 Equipment 0.3 1.3 1.3 17.5 0.5 0.5 Other objects 0.0 0.0 0.0 0.0 0.0 0.0 Note. Data provided by the Office of Finance at the South Carolina Department of Education
According to district data provided by the Office of Finance at the South Carolina
Department of Education, school districts spent funds in addition to EIA funds for their academic
and artistic programs. State-level expenditures, for fiscal years 2002-2004, for the academic and
artistic gifted program are shown in Tables 11 and 12. District-level expenditures are shown in
Appendix F. Total expenditures for the gifted and talented programs increased by a little more than
11% between fiscal years 2002-2003, and then remained at approximately the same level overall
for fiscal year 2004. During this period, EIA funds decreased as a proportion of total expenditures
and more funds were spent from general funds and special revenue accounts. Figures 1 and 2
depict the funding percentages from all sources for the academic and artistic gifted programs during
the 2003-2004 school year.
20
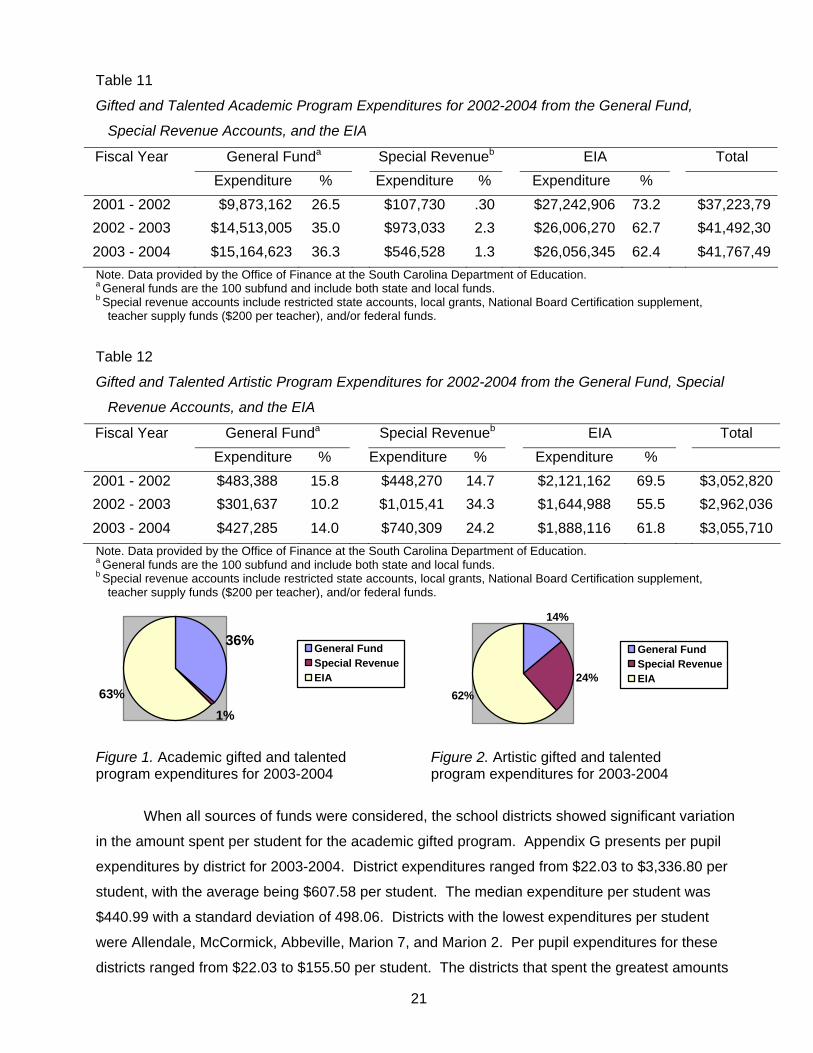
Table 11 Gifted and Talented Academic Program Expenditures for 2002-2004 from the General Fund,
Special Revenue Accounts, and the EIA
Fiscal Year General Funda Special Revenueb EIA Total Expenditure % Expenditure % Expenditure %
2001 - 2002 $9,873,162 26.5 $107,730 .30 $27,242,906 73.2 $37,223,792002 - 2003 $14,513,005 35.0 $973,033 2.3 $26,006,270 62.7 $41,492,302003 - 2004 $15,164,623 36.3 $546,528 1.3 $26,056,345 62.4 $41,767,49Note. Data provided by the Office of Finance at the South Carolina Department of Education. a General funds are the 100 subfund and include both state and local funds. b Special revenue accounts include restricted state accounts, local grants, National Board Certification supplement,
teacher supply funds ($200 per teacher), and/or federal funds.
Table 12
Gifted and Talented Artistic Program Expenditures for 2002-2004 from the General Fund, Special
Revenue Accounts, and the EIA
Fiscal Year General Funda Special Revenueb EIA Total Expenditure % Expenditure % Expenditure %
2001 - 2002 $483,388 15.8 $448,270 14.7 $2,121,162 69.5 $3,052,8202002 - 2003 $301,637 10.2 $1,015,41 34.3 $1,644,988 55.5 $2,962,0362003 - 2004 $427,285 14.0 $740,309 24.2 $1,888,116 61.8 $3,055,710Note. Data provided by the Office of Finance at the South Carolina Department of Education. a General funds are the 100 subfund and include both state and local funds. b Special revenue accounts include restricted state accounts, local grants, National Board Certification supplement,
teacher supply funds ($200 per teacher), and/or federal funds.
63%1%
36% General FundSpecial RevenueEIA
62%24%
14%
General FundSpecial RevenueEIA
Figure 1. Academic gifted and talented Figure 2. Artistic gifted and talented program expenditures for 2003-2004 program expenditures for 2003-2004
When all sources of funds were considered, the school districts showed significant variation
in the amount spent per student for the academic gifted program. Appendix G presents per pupil
expenditures by district for 2003-2004. District expenditures ranged from $22.03 to $3,336.80 per
student, with the average being $607.58 per student. The median expenditure per student was
$440.99 with a standard deviation of 498.06. Districts with the lowest expenditures per student
were Allendale, McCormick, Abbeville, Marion 7, and Marion 2. Per pupil expenditures for these
districts ranged from $22.03 to $155.50 per student. The districts that spent the greatest amounts
21
per student were Marion 1, Richland 2, Calhoun, Marlboro, and Orangeburg 5. Expenditures in
these districts ranged from $1,562.97 to $3,336.80 per student in grades 3-12. These district
expenditure figures should be viewed with some caution, since expenditure data reported by district
coordinators were not always consistent with data compiled by the Office of Finance in the
Department of Education. In some cases, the difference between these two figures was
substantial.
Results from the District Coordinators’ Questionnaire In order to collect descriptive information from South Carolina’s school districts about their
programs serving gifted and talented students, a questionnaire was developed for district
coordinators of the gifted and talented program. The questionnaire was developed in consultation
with staff from the Education Oversight Committee and staff from the Office of Gifted Education at
the South Carolina Department of Education. Research was conducted to identify relevant
variables and interviews were completed with school district staff, members of the South Carolina
Consortium for the Gifted, legislative representatives, teachers of gifted students, and higher
education faculty to further specify areas that should be addressed in the questionnaire.
The questionnaire was organized into five major sections:
• Student identification and selection;
• Student profile;
• Program models;
• Teacher profile; and
• Funding.
The questionnaire contained a mix of open- and closed- response items. The district coordinators
were asked to provide information or opinions on the open items, and to choose from a variety of
options listed on the questionnaire for the closed items. Eighty-two of the 85 district coordinators
returned the questionnaires for a response rate of 96.5%. The results from each part of the
questionnaire are presented in the following sections.
Student Identification and Selection
The first section of the questionnaire addressed student identification and selection criteria,
screening methods, and removal processes. Approximately 94% of the district coordinators
reported using only state criteria for identification of gifted and talented students. The remaining 6%
reported using state and additional district criteria in the identification process. Some of the
additional criteria reported include achievement scores on assessments such as the Cognitive
Abilities Test (CogAT) and the Iowa Tests of Basic Skills (ITBS). High student achievement,
22
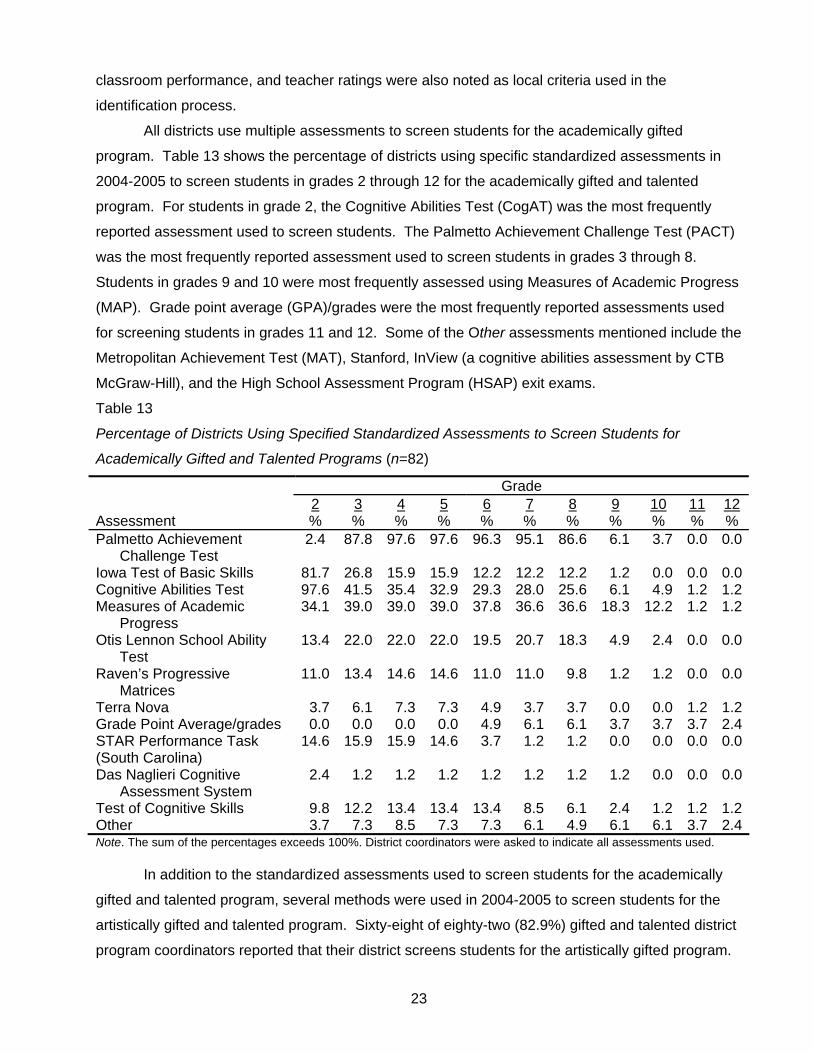
classroom performance, and teacher ratings were also noted as local criteria used in the
identification process.
All districts use multiple assessments to screen students for the academically gifted
program. Table 13 shows the percentage of districts using specific standardized assessments in
2004-2005 to screen students in grades 2 through 12 for the academically gifted and talented
program. For students in grade 2, the Cognitive Abilities Test (CogAT) was the most frequently
reported assessment used to screen students. The Palmetto Achievement Challenge Test (PACT)
was the most frequently reported assessment used to screen students in grades 3 through 8.
Students in grades 9 and 10 were most frequently assessed using Measures of Academic Progress
(MAP). Grade point average (GPA)/grades were the most frequently reported assessments used
for screening students in grades 11 and 12. Some of the Other assessments mentioned include the
Metropolitan Achievement Test (MAT), Stanford, InView (a cognitive abilities assessment by CTB
McGraw-Hill), and the High School Assessment Program (HSAP) exit exams.
Table 13
Percentage of Districts Using Specified Standardized Assessments to Screen Students for
Academically Gifted and Talented Programs (n=82)
Grade 2 3 4 5 6 7 8 9 10 11 12Assessment % % % % % % % % % % % Palmetto Achievement
Challenge Test 2.4 87.8 97.6 97.6 96.3 95.1 86.6 6.1 3.7 0.0 0.0
Iowa Test of Basic Skills 81.7 26.8 15.9 15.9 12.2 12.2 12.2 1.2 0.0 0.0 0.0Cognitive Abilities Test 97.6 41.5 35.4 32.9 29.3 28.0 25.6 6.1 4.9 1.2 1.2Measures of Academic
Progress 34.1 39.0 39.0 39.0 37.8 36.6 36.6 18.3 12.2 1.2 1.2
Otis Lennon School Ability Test
13.4 22.0 22.0 22.0 19.5 20.7 18.3 4.9 2.4 0.0 0.0
Raven’s Progressive Matrices
11.0 13.4 14.6 14.6 11.0 11.0 9.8 1.2 1.2 0.0 0.0
Terra Nova 3.7 6.1 7.3 7.3 4.9 3.7 3.7 0.0 0.0 1.2 1.2Grade Point Average/grades 0.0 0.0 0.0 0.0 4.9 6.1 6.1 3.7 3.7 3.7 2.4STAR Performance Task (South Carolina)
14.6 15.9 15.9 14.6 3.7 1.2 1.2 0.0 0.0 0.0 0.0
Das Naglieri Cognitive Assessment System
2.4 1.2 1.2 1.2 1.2 1.2 1.2 1.2 0.0 0.0 0.0
Test of Cognitive Skills 9.8 12.2 13.4 13.4 13.4 8.5 6.1 2.4 1.2 1.2 1.2Other 3.7 7.3 8.5 7.3 7.3 6.1 4.9 6.1 6.1 3.7 2.4Note. The sum of the percentages exceeds 100%. District coordinators were asked to indicate all assessments used.
In addition to the standardized assessments used to screen students for the academically
gifted and talented program, several methods were used in 2004-2005 to screen students for the
artistically gifted and talented program. Sixty-eight of eighty-two (82.9%) gifted and talented district
program coordinators reported that their district screens students for the artistically gifted program.
23
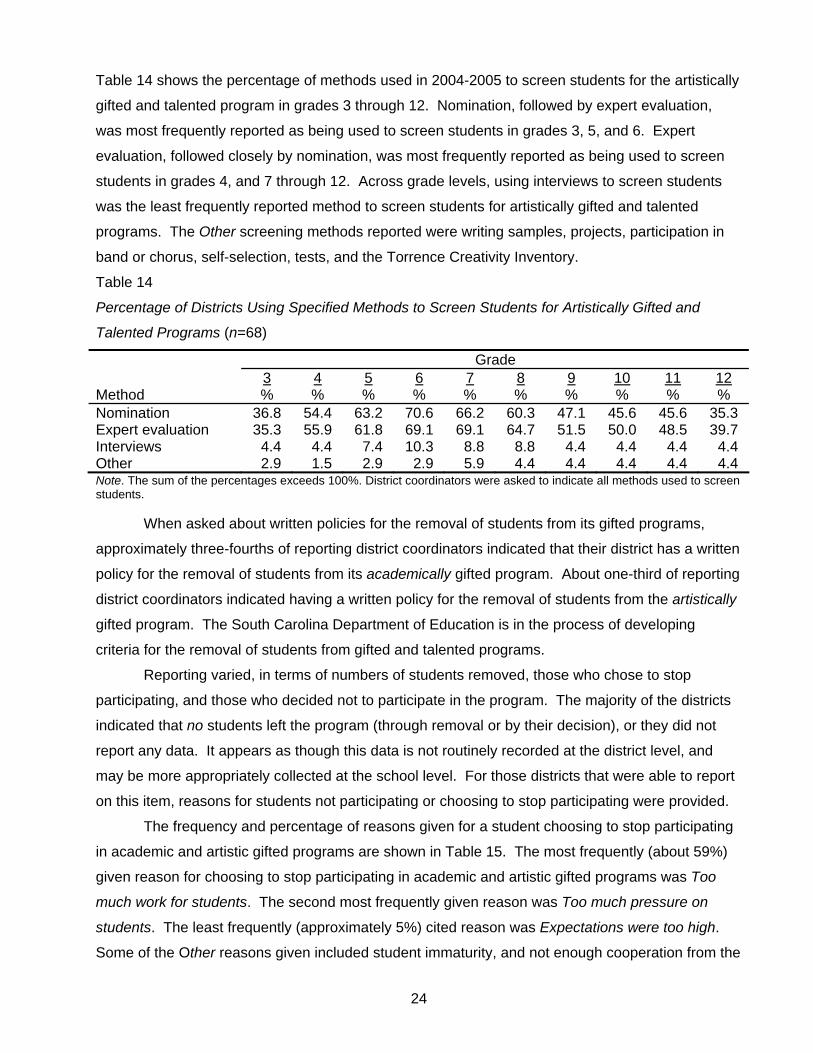
Table 14 shows the percentage of methods used in 2004-2005 to screen students for the artistically
gifted and talented program in grades 3 through 12. Nomination, followed by expert evaluation,
was most frequently reported as being used to screen students in grades 3, 5, and 6. Expert
evaluation, followed closely by nomination, was most frequently reported as being used to screen
students in grades 4, and 7 through 12. Across grade levels, using interviews to screen students
was the least frequently reported method to screen students for artistically gifted and talented
programs. The Other screening methods reported were writing samples, projects, participation in
band or chorus, self-selection, tests, and the Torrence Creativity Inventory.
Table 14
Percentage of Districts Using Specified Methods to Screen Students for Artistically Gifted and
Talented Programs (n=68)
Grade 3 4 5 6 7 8 9 10 11 12Method % % % % % % % % % % Nomination 36.8 54.4 63.2 70.6 66.2 60.3 47.1 45.6 45.6 35.3 Expert evaluation 35.3 55.9 61.8 69.1 69.1 64.7 51.5 50.0 48.5 39.7 Interviews 4.4 4.4 7.4 10.3 8.8 8.8 4.4 4.4 4.4 4.4 Other 2.9 1.5 2.9 2.9 5.9 4.4 4.4 4.4 4.4 4.4 Note. The sum of the percentages exceeds 100%. District coordinators were asked to indicate all methods used to screen students.
When asked about written policies for the removal of students from its gifted programs,
approximately three-fourths of reporting district coordinators indicated that their district has a written
policy for the removal of students from its academically gifted program. About one-third of reporting
district coordinators indicated having a written policy for the removal of students from the artistically
gifted program. The South Carolina Department of Education is in the process of developing
criteria for the removal of students from gifted and talented programs.
Reporting varied, in terms of numbers of students removed, those who chose to stop
participating, and those who decided not to participate in the program. The majority of the districts
indicated that no students left the program (through removal or by their decision), or they did not
report any data. It appears as though this data is not routinely recorded at the district level, and
may be more appropriately collected at the school level. For those districts that were able to report
on this item, reasons for students not participating or choosing to stop participating were provided.
The frequency and percentage of reasons given for a student choosing to stop participating
in academic and artistic gifted programs are shown in Table 15. The most frequently (about 59%)
given reason for choosing to stop participating in academic and artistic gifted programs was Too
much work for students. The second most frequently given reason was Too much pressure on
students. The least frequently (approximately 5%) cited reason was Expectations were too high.
Some of the Other reasons given included student immaturity, and not enough cooperation from the
24
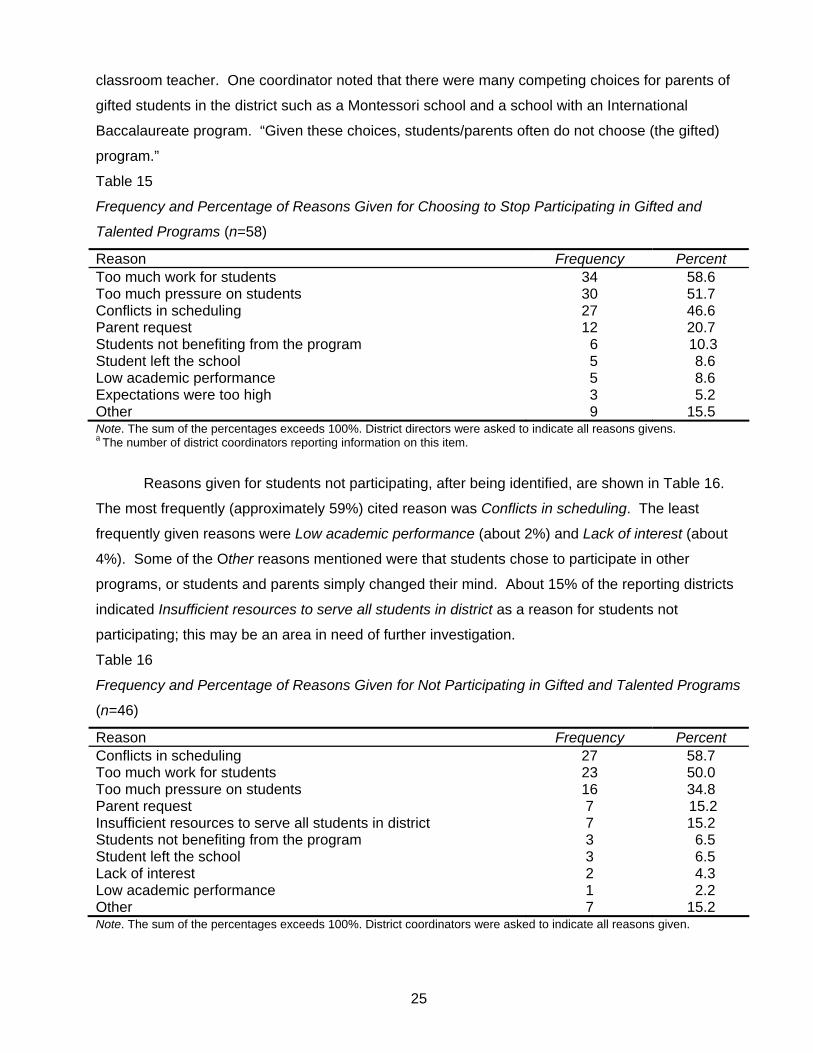
classroom teacher. One coordinator noted that there were many competing choices for parents of
gifted students in the district such as a Montessori school and a school with an International
Baccalaureate program. “Given these choices, students/parents often do not choose (the gifted)
program.”
Table 15
Frequency and Percentage of Reasons Given for Choosing to Stop Participating in Gifted and
Talented Programs (n=58)
Reason Frequency Percent Too much work for students 34 58.6 Too much pressure on students 30 51.7 Conflicts in scheduling 27 46.6 Parent request 12 20.7 Students not benefiting from the program 6 10.3 Student left the school 5 8.6 Low academic performance 5 8.6 Expectations were too high 3 5.2 Other 9 15.5 Note. The sum of the percentages exceeds 100%. District directors were asked to indicate all reasons givens. a The number of district coordinators reporting information on this item.
Reasons given for students not participating, after being identified, are shown in Table 16.
The most frequently (approximately 59%) cited reason was Conflicts in scheduling. The least
frequently given reasons were Low academic performance (about 2%) and Lack of interest (about
4%). Some of the Other reasons mentioned were that students chose to participate in other
programs, or students and parents simply changed their mind. About 15% of the reporting districts
indicated Insufficient resources to serve all students in district as a reason for students not
participating; this may be an area in need of further investigation.
Table 16
Frequency and Percentage of Reasons Given for Not Participating in Gifted and Talented Programs
(n=46)
Reason Frequency Percent Conflicts in scheduling 27 58.7 Too much work for students 23 50.0 Too much pressure on students 16 34.8 Parent request 7 15.2 Insufficient resources to serve all students in district Students not benefiting from the program
7 3
15.2 6.5
Student left the school 3 6.5 Lack of interest 2 4.3 Low academic performance 1 2.2 Other 7 15.2 Note. The sum of the percentages exceeds 100%. District coordinators were asked to indicate all reasons given.
25
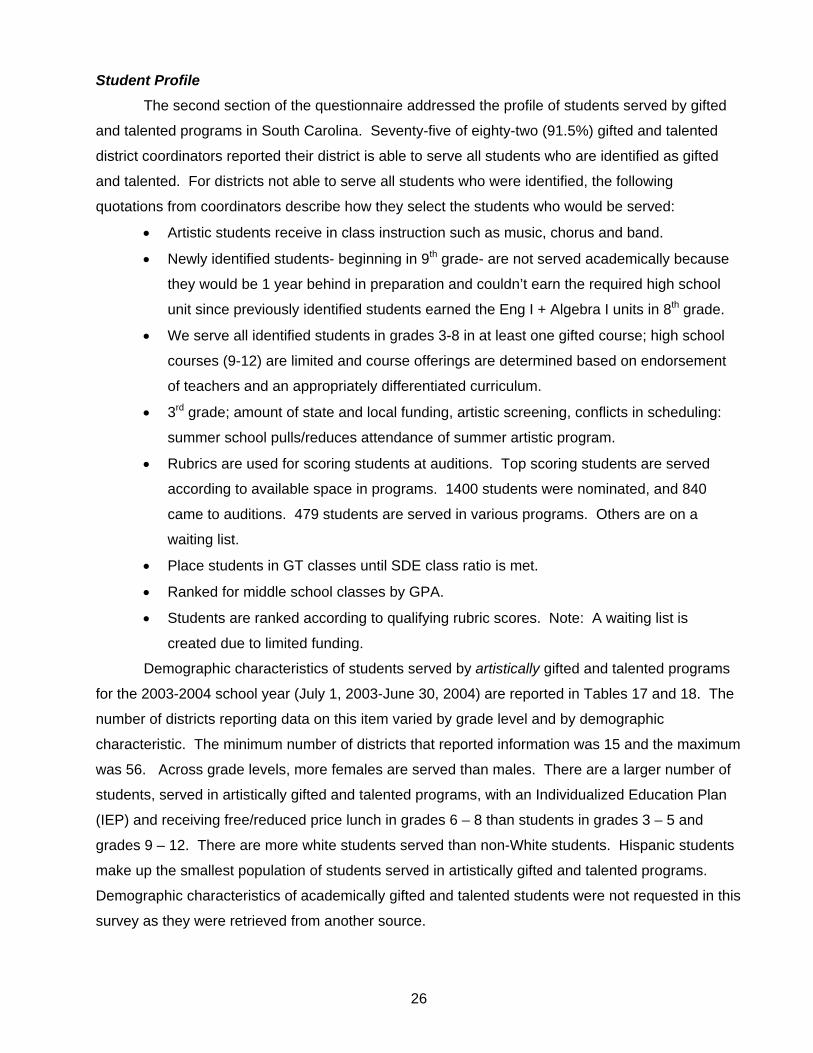
Student Profile
The second section of the questionnaire addressed the profile of students served by gifted
and talented programs in South Carolina. Seventy-five of eighty-two (91.5%) gifted and talented
district coordinators reported their district is able to serve all students who are identified as gifted
and talented. For districts not able to serve all students who were identified, the following
quotations from coordinators describe how they select the students who would be served:
• Artistic students receive in class instruction such as music, chorus and band.
• Newly identified students- beginning in 9th grade- are not served academically because
they would be 1 year behind in preparation and couldn’t earn the required high school
unit since previously identified students earned the Eng I + Algebra I units in 8th grade.
• We serve all identified students in grades 3-8 in at least one gifted course; high school
courses (9-12) are limited and course offerings are determined based on endorsement
of teachers and an appropriately differentiated curriculum.
• 3rd grade; amount of state and local funding, artistic screening, conflicts in scheduling:
summer school pulls/reduces attendance of summer artistic program.
• Rubrics are used for scoring students at auditions. Top scoring students are served
according to available space in programs. 1400 students were nominated, and 840
came to auditions. 479 students are served in various programs. Others are on a
waiting list.
• Place students in GT classes until SDE class ratio is met.
• Ranked for middle school classes by GPA.
• Students are ranked according to qualifying rubric scores. Note: A waiting list is
created due to limited funding.
Demographic characteristics of students served by artistically gifted and talented programs
for the 2003-2004 school year (July 1, 2003-June 30, 2004) are reported in Tables 17 and 18. The
number of districts reporting data on this item varied by grade level and by demographic
characteristic. The minimum number of districts that reported information was 15 and the maximum
was 56. Across grade levels, more females are served than males. There are a larger number of
students, served in artistically gifted and talented programs, with an Individualized Education Plan
(IEP) and receiving free/reduced price lunch in grades 6 – 8 than students in grades 3 – 5 and
grades 9 – 12. There are more white students served than non-White students. Hispanic students
make up the smallest population of students served in artistically gifted and talented programs.
Demographic characteristics of academically gifted and talented students were not requested in this
survey as they were retrieved from another source.
26
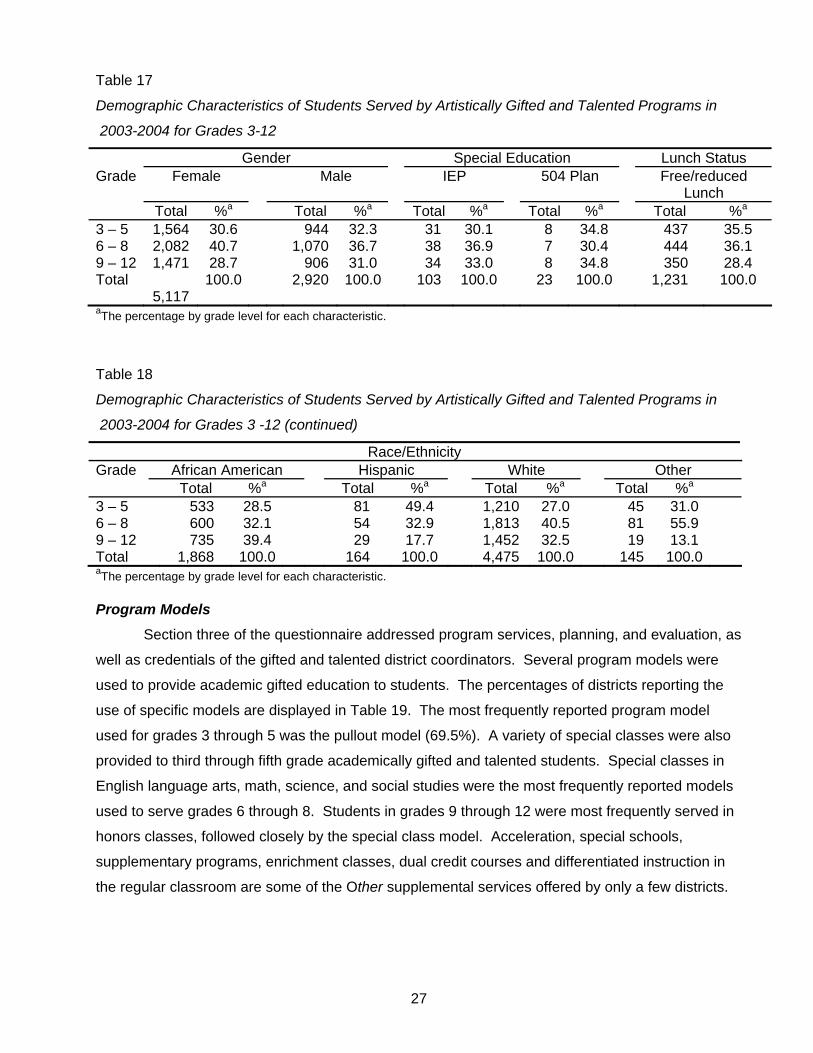
Table 17
Demographic Characteristics of Students Served by Artistically Gifted and Talented Programs in
2003-2004 for Grades 3-12
Gender Special Education Lunch Status Grade Female Male IEP 504 Plan Free/reduced
Lunch Total %a Total %a Total %a Total %a Total %a
3 – 5 1,564 30.6 944 32.3 31 30.1 8 34.8 437 35.5 6 – 8 2,082 40.7 1,070 36.7 38 36.9 7 30.4 444 36.1 9 – 12 1,471 28.7 906 31.0 34 33.0 8 34.8 350 28.4 Total
5,117 100.0 2,920 100.0 103 100.0 23 100.0 1,231 100.0
aThe percentage by grade level for each characteristic.
Table 18
Demographic Characteristics of Students Served by Artistically Gifted and Talented Programs in
2003-2004 for Grades 3 -12 (continued)
Race/Ethnicity Grade African American Hispanic White Other Total %a Total %a Total %a Total %a 3 – 5 533 28.5 81 49.4 1,210 27.0 45 31.0 6 – 8 600 32.1 54 32.9 1,813 40.5 81 55.9 9 – 12 735 39.4 29 17.7 1,452 32.5 19 13.1 Total 1,868 100.0 164 100.0 4,475 100.0 145 100.0 aThe percentage by grade level for each characteristic. Program Models
Section three of the questionnaire addressed program services, planning, and evaluation, as
well as credentials of the gifted and talented district coordinators. Several program models were
used to provide academic gifted education to students. The percentages of districts reporting the
use of specific models are displayed in Table 19. The most frequently reported program model
used for grades 3 through 5 was the pullout model (69.5%). A variety of special classes were also
provided to third through fifth grade academically gifted and talented students. Special classes in
English language arts, math, science, and social studies were the most frequently reported models
used to serve grades 6 through 8. Students in grades 9 through 12 were most frequently served in
honors classes, followed closely by the special class model. Acceleration, special schools,
supplementary programs, enrichment classes, dual credit courses and differentiated instruction in
the regular classroom are some of the Other supplemental services offered by only a few districts.
27
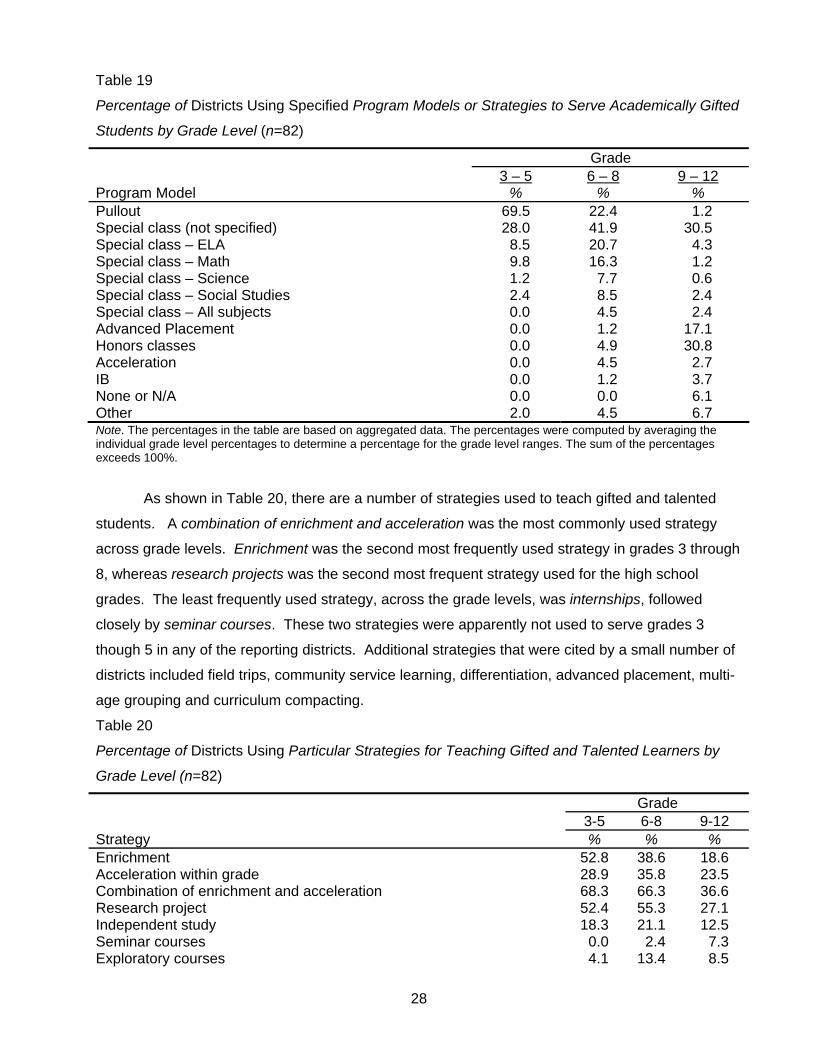
Table 19
Percentage of Districts Using Specified Program Models or Strategies to Serve Academically Gifted
Students by Grade Level (n=82)
Grade 3 – 5 6 – 8 9 – 12Program Model % % % Pullout 69.5 22.4 1.2 Special class (not specified) 28.0 41.9 30.5 Special class – ELA 8.5 20.7 4.3 Special class – Math 9.8 16.3 1.2 Special class – Science 1.2 7.7 0.6 Special class – Social Studies 2.4 8.5 2.4 Special class – All subjects 0.0 4.5 2.4 Advanced Placement 0.0 1.2 17.1 Honors classes 0.0 4.9 30.8 Acceleration 0.0 4.5 2.7 IB 0.0 1.2 3.7 None or N/A 0.0 0.0 6.1 Other 2.0 4.5 6.7 Note. The percentages in the table are based on aggregated data. The percentages were computed by averaging the individual grade level percentages to determine a percentage for the grade level ranges. The sum of the percentages exceeds 100%.
As shown in Table 20, there are a number of strategies used to teach gifted and talented
students. A combination of enrichment and acceleration was the most commonly used strategy
across grade levels. Enrichment was the second most frequently used strategy in grades 3 through
8, whereas research projects was the second most frequent strategy used for the high school
grades. The least frequently used strategy, across the grade levels, was internships, followed
closely by seminar courses. These two strategies were apparently not used to serve grades 3
though 5 in any of the reporting districts. Additional strategies that were cited by a small number of
districts included field trips, community service learning, differentiation, advanced placement, multi-
age grouping and curriculum compacting.
Table 20
Percentage of Districts Using Particular Strategies for Teaching Gifted and Talented Learners by
Grade Level (n=82)
Grade 3-5 6-8 9-12 Strategy % % % Enrichment 52.8 38.6 18.6 Acceleration within grade 28.9 35.8 23.5 Combination of enrichment and acceleration 68.3 66.3 36.6 Research project 52.4 55.3 27.1 Independent study 18.3 21.1 12.5 Seminar courses 0.0 2.4 7.3 Exploratory courses 4.1 13.4 8.5
28
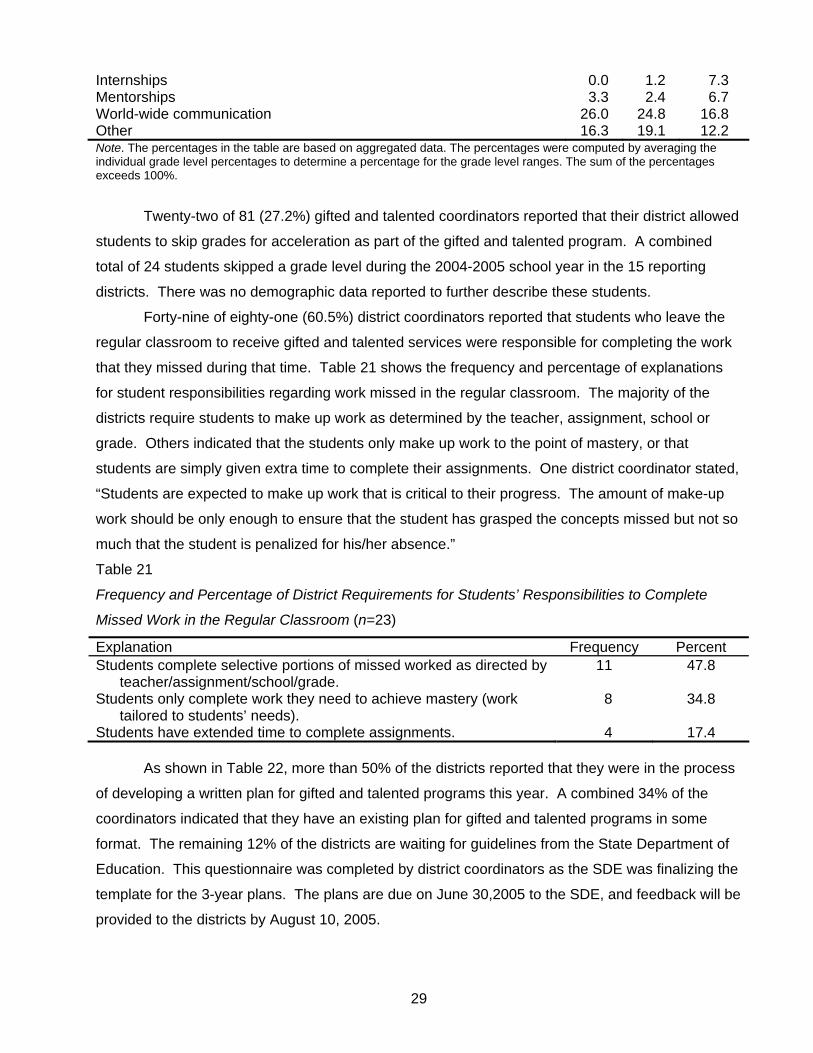
Internships 0.0 1.2 7.3 Mentorships 3.3 2.4 6.7 World-wide communication 26.0 24.8 16.8 Other 16.3 19.1 12.2 Note. The percentages in the table are based on aggregated data. The percentages were computed by averaging the individual grade level percentages to determine a percentage for the grade level ranges. The sum of the percentages exceeds 100%.
Twenty-two of 81 (27.2%) gifted and talented coordinators reported that their district allowed
students to skip grades for acceleration as part of the gifted and talented program. A combined
total of 24 students skipped a grade level during the 2004-2005 school year in the 15 reporting
districts. There was no demographic data reported to further describe these students.
Forty-nine of eighty-one (60.5%) district coordinators reported that students who leave the
regular classroom to receive gifted and talented services were responsible for completing the work
that they missed during that time. Table 21 shows the frequency and percentage of explanations
for student responsibilities regarding work missed in the regular classroom. The majority of the
districts require students to make up work as determined by the teacher, assignment, school or
grade. Others indicated that the students only make up work to the point of mastery, or that
students are simply given extra time to complete their assignments. One district coordinator stated,
“Students are expected to make up work that is critical to their progress. The amount of make-up
work should be only enough to ensure that the student has grasped the concepts missed but not so
much that the student is penalized for his/her absence.”
Table 21
Frequency and Percentage of District Requirements for Students’ Responsibilities to Complete
Missed Work in the Regular Classroom (n=23)
Explanation Frequency Percent Students complete selective portions of missed worked as directed by
teacher/assignment/school/grade. 11 47.8
Students only complete work they need to achieve mastery (work tailored to students’ needs).
8 34.8
Students have extended time to complete assignments. 4 17.4
As shown in Table 22, more than 50% of the districts reported that they were in the process
of developing a written plan for gifted and talented programs this year. A combined 34% of the
coordinators indicated that they have an existing plan for gifted and talented programs in some
format. The remaining 12% of the districts are waiting for guidelines from the State Department of
Education. This questionnaire was completed by district coordinators as the SDE was finalizing the
template for the 3-year plans. The plans are due on June 30,2005 to the SDE, and feedback will be
provided to the districts by August 10, 2005.
29
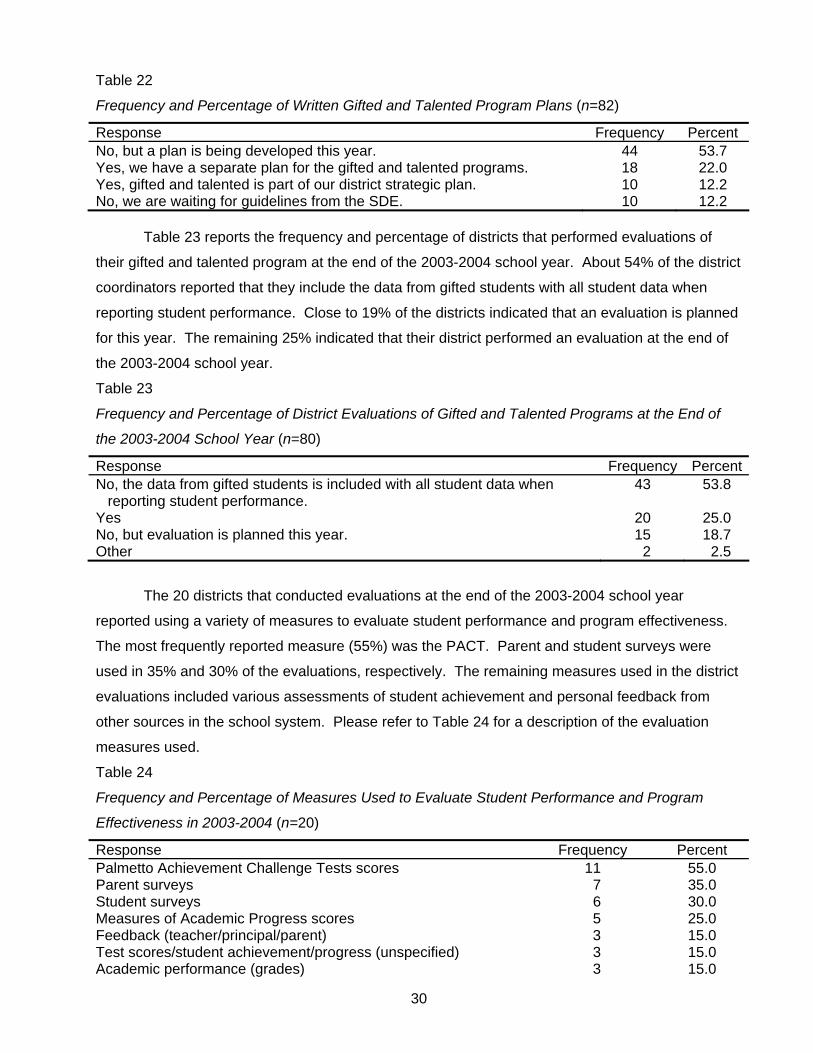
Table 22
Frequency and Percentage of Written Gifted and Talented Program Plans (n=82)
Response Frequency Percent No, but a plan is being developed this year. 44 53.7 Yes, we have a separate plan for the gifted and talented programs. 18 22.0 Yes, gifted and talented is part of our district strategic plan. 10 12.2 No, we are waiting for guidelines from the SDE. 10 12.2
Table 23 reports the frequency and percentage of districts that performed evaluations of
their gifted and talented program at the end of the 2003-2004 school year. About 54% of the district
coordinators reported that they include the data from gifted students with all student data when
reporting student performance. Close to 19% of the districts indicated that an evaluation is planned
for this year. The remaining 25% indicated that their district performed an evaluation at the end of
the 2003-2004 school year.
Table 23
Frequency and Percentage of District Evaluations of Gifted and Talented Programs at the End of
the 2003-2004 School Year (n=80)
Response Frequency PercentNo, the data from gifted students is included with all student data when
reporting student performance. 43 53.8
Yes 20 25.0 No, but evaluation is planned this year. 15 18.7 Other 2 2.5
The 20 districts that conducted evaluations at the end of the 2003-2004 school year
reported using a variety of measures to evaluate student performance and program effectiveness.
The most frequently reported measure (55%) was the PACT. Parent and student surveys were
used in 35% and 30% of the evaluations, respectively. The remaining measures used in the district
evaluations included various assessments of student achievement and personal feedback from
other sources in the school system. Please refer to Table 24 for a description of the evaluation
measures used.
Table 24
Frequency and Percentage of Measures Used to Evaluate Student Performance and Program
Effectiveness in 2003-2004 (n=20)
Response Frequency Percent Palmetto Achievement Challenge Tests scores 11 55.0 Parent surveys 7 35.0 Student surveys 6 30.0 Measures of Academic Progress scores 5 25.0 Feedback (teacher/principal/parent) 3 15.0 Test scores/student achievement/progress (unspecified) 3 15.0 Academic performance (grades) 3 15.0
30
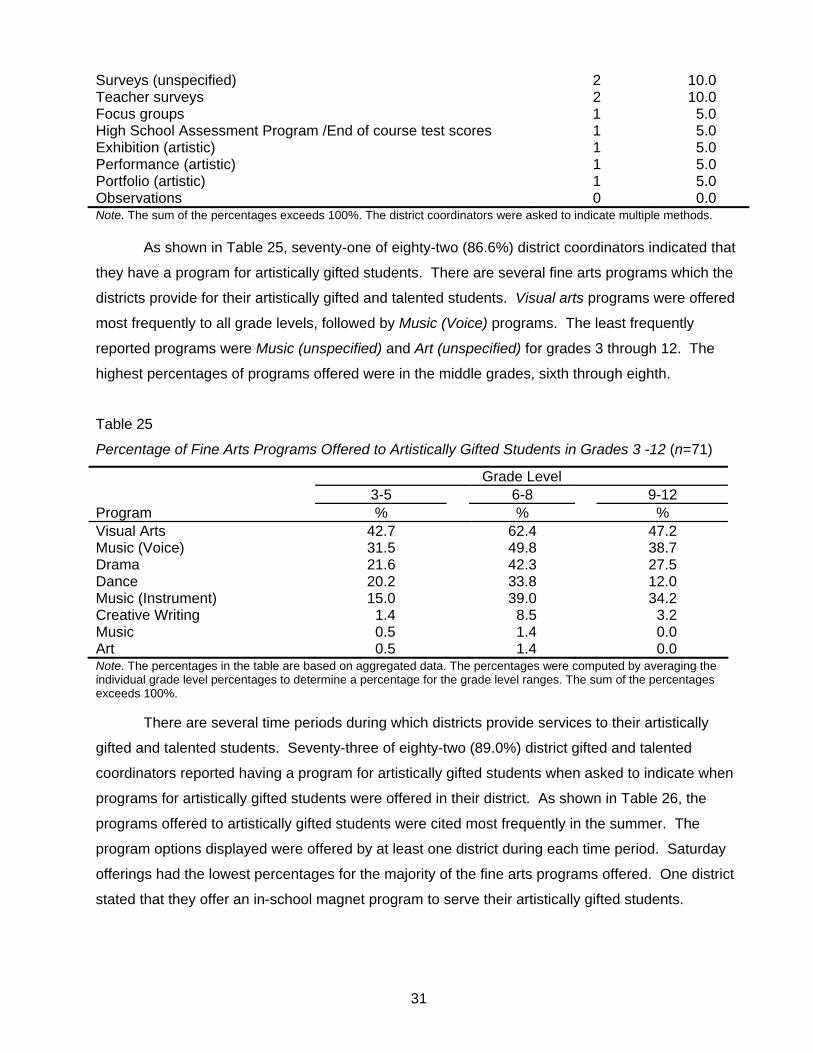
Surveys (unspecified) 2 10.0 Teacher surveys 2 10.0 Focus groups 1 5.0 High School Assessment Program /End of course test scores 1 5.0 Exhibition (artistic) 1 5.0 Performance (artistic) 1 5.0 Portfolio (artistic) 1 5.0 Observations 0 0.0 Note. The sum of the percentages exceeds 100%. The district coordinators were asked to indicate multiple methods.
As shown in Table 25, seventy-one of eighty-two (86.6%) district coordinators indicated that
they have a program for artistically gifted students. There are several fine arts programs which the
districts provide for their artistically gifted and talented students. Visual arts programs were offered
most frequently to all grade levels, followed by Music (Voice) programs. The least frequently
reported programs were Music (unspecified) and Art (unspecified) for grades 3 through 12. The
highest percentages of programs offered were in the middle grades, sixth through eighth.
Table 25
Percentage of Fine Arts Programs Offered to Artistically Gifted Students in Grades 3 -12 (n=71)
Grade Level 3-5 6-8 9-12 Program % % % Visual Arts 42.7 62.4 47.2 Music (Voice) 31.5 49.8 38.7 Drama 21.6 42.3 27.5 Dance 20.2 33.8 12.0 Music (Instrument) 15.0 39.0 34.2 Creative Writing 1.4 8.5 3.2 Music 0.5 1.4 0.0 Art 0.5 1.4 0.0 Note. The percentages in the table are based on aggregated data. The percentages were computed by averaging the individual grade level percentages to determine a percentage for the grade level ranges. The sum of the percentages exceeds 100%.
There are several time periods during which districts provide services to their artistically
gifted and talented students. Seventy-three of eighty-two (89.0%) district gifted and talented
coordinators reported having a program for artistically gifted students when asked to indicate when
programs for artistically gifted students were offered in their district. As shown in Table 26, the
programs offered to artistically gifted students were cited most frequently in the summer. The
program options displayed were offered by at least one district during each time period. Saturday
offerings had the lowest percentages for the majority of the fine arts programs offered. One district
stated that they offer an in-school magnet program to serve their artistically gifted students.
31
Table 26
Frequency and Percentage of When Programs for Artistically Gifted Students are Offered (n=73)
In-School After-School Saturday Summer Frequency % Frequency % Frequency % Frequency % Visual Arts 33 45.2 21 28.8 6 8.2 37 50.7Music (Voice) 22 30.1 21 28.8 6 8.2 33 45.2Music
(Instrument) 17 23.3 17 23.3 6 8.2 28 38.4
Drama 14 19.2 13 17.8 4 5.5 28 38.4Dance 9 12.3 8 11.0 4 5.5 22 30.1Creative Writing 2 2.7 1 1.4 2 2.7 5 6.8Other 1 1.4 0 0.0 0 0.0 0 0.0Note. The sum of the percentages exceeds 100%. District coordinators were asked to select all that apply.
Seventeen of eighty (21.3%) district coordinators indicated that their district participated in a
consortium with other districts to provide services to artistically gifted students. The districts were
asked to describe the consortiums in which their artistically gifted students participated. The major
consortiums identified by the coordinators included the Kershaw County Arts Arising program, the
Tri-Districts Arts Consortium, a program held at Winthrop University, and the Tri-County Arts
Consortium. Artistically gifted and talented students in grades 3-6 participated in the Kershaw
County Arts Arising program. The Tri-District Arts Consortium is held annually on the Columbia
College campus, and provides a 3- week summer arts program for 6th-9th graders. Several
districts partner with Winthrop University to provide summer programs for their artistically gifted
students. The Tri-County Arts Consortium provides a 5-week summer program for students in
grades 4 through 11, and is held on the campus of South Carolina State University. Other districts
reported sharing the cost of hosting visiting artists.
Table 27 shows the descriptive statistics for the number of minutes per week and total
weeks per year that gifted and talented services are provided to students by grade level. The
median number of minutes per week varied by grade level, and met or exceeded program
requirements, with the exception of artistic programs for grades 3 through 5. On average, the
median number of minutes was greater for academic programs than for artistic programs. The 3rd
through 5th grade artistic program had the lowest median number of minutes per week (175.0),
whereas the academic program for grades 9 through 12 reported the highest median (450.0). The
median number of weeks that gifted and talented services were provided was 36 for academic
programs across grade levels. This was also the highest median number of weeks of service. The
median number of weeks of service provided to artistically gifted students was lower than academic
programs, and varied across grade levels. The lowest median number of weeks of service was
provided to students in the artistic program for grades 3 through 5 (6.0).
32
Table 27
Descriptive Statistics of the Number of Minutes Per Week and Total Weeks Per Year That Gifted
and Talented Services are Provided to Students by Grade Level
Minutes Per Week Weeks Per Year Grade Program na nb Median Median 3 – 5 Academic 72 72 250.0 36.0 Artistic 42 41 175.0 6.0 6 – 8 Academic 68 66 287.5 36.0 Artistic 52 53 260.0 18.0 9 – 12 Academic 51 51 450.0 36.0 Artistic 44 44 250.0 19.0
aThe number of district coordinators reporting information on this item for the minutes per week. bThe number of district coordinators reporting information on this item for the total weeks.
Many of the gifted and talented coordinators serve in various roles within their district. Of
the 82 coordinators responding to this item, there are 12 assistant superintendents, 76 gifted and
talented directors/coordinators, 2 principals, and 10 teachers. Fifty-two respondents indicated that
they serve additional roles and responsibilities in their district, with the number of additional
roles/responsibilities ranging from 1 to 27. The majority of the respondents listed only one (46.2%)
or two (26.9%) other roles/responsibilities. Please refer to Appendix H for a list of the roles,
departments and programs in which the coordinators serve, in addition to their role as gifted and
talented district coordinator.
Thirty-seven of seventy-five (49.3%) district coordinators reported directing all aspects of the
gifted and talented program in their district. Forty-two coordinators reported that other district staff
members have responsibilities for coordination or direction of the gifted and talented program. Of
these, 28 (66.7%) of the districts reported having one additional staff member to assist with the
gifted and talented responsibilities. Two additional staff members were reported by six (14.3%)
districts, whereas seven (16.7%) districts reported three. Only one district (2.4%) reported having
four additional staff members sharing in the gifted and talented responsibilities.
The district coordinators possess a variety of credentials. The frequency and percentage of
the reported credentials are shown in Table 28. Seventy-nine of eighty (98.8%) district coordinators
hold a South Carolina Teaching Certificate. About 41% hold a gifted and talented endorsement.
Ten percent of the coordinators have an add-on gifted and talented certification.
Table 28
Frequency and Percent of Gifted and Talented District Program Coordinators’ Credentials (n=80)
SC Teaching Certificate
GT Endorsement Add-on GT Certification
Response Frequency Percent Frequency Percent Frequency Percent Yes 79 98.8 33 41.3 8 10.0 No 1 1.3 42 52.5 63 78.8
33
34
Teachers of Gifted and Talented Students
The fourth section of the questionnaire focused on teachers of gifted and talented students,
including demographics, credentials, selection and training. Tables 29 through 32 present the
reported demographic characteristics of teachers of gifted and talented students. The number of
districts reporting information ranged from 10 to 77 for the different characteristics. According to the
numbers provided by the district coordinators, there were 2,289 teachers of gifted and talented
students. Across grade levels, there are more female (83.5%) teachers than males (16.5%). The
highest number of male teachers was reported in grades 9 through 12. In terms of race/ethnicity,
the majority (approximately 84%) of the teachers are White. Hispanic teachers represent the
smallest racial/ethnic population (less than 1%).
A combined 1,659 (58.6%) teachers for all grade levels have a Masters degree. Teachers
of the middle grades (6th through 8th) represent the largest portion of this group. There are 41.5%
of the teachers with Bachelors degrees, and 4.4% are Educational Specialists. Only about 1% of
the teachers have a Doctorate. In terms of certification, approximately 94% of the teachers of gifted
students have a professional certificate. Another 4% have an initial certification, while the
remaining 1% hold temporary, transitional, special subject, or critical need/PACE certification. A
little more than half of the teachers have the gifted and talented endorsement, while about 8% have
the add-on gifted and talented certification.
Table 29
Frequency and Percentage of the Gender and Race/Ethnicity of Teachers of Gifted and Talented Students by Grade Level
Gender Race/EthnicityGrade Female Male African American Hispanic White Other Frequency % Frequency % Frequency % Frequency % Frequency % Frequency %3 – 5 667 23.6 36 1.3 86 3.0 0 0.0 608 21.5 3 .11 6 – 8 1,100 38.9 183 6.5 208 7.4 7 .25 1,065 37.6 7 .25 9 – 12 595 21.0 248 8.8 103 3.6 11 .39 707 25.0 23 .81 All grades 2,362 83.5 467 16.5 397 14.0 18 .64 2,380 84.1 33 1.2
Total teachers = 2,829 Table 30
Frequency and Percentage of Educational Levels of Teachers of Gifted and Talented Students by Grade Level
Education Bachelor’s Master’s Educational Specialist Doctorate Frequency % Frequency % Frequency % Frequency %3 – 5 269 9.5 409 14.5 31 1.1 7 .25 6 – 8 582 20.6 715 25.3 39 1.4 8 .28 9 – 12 324 11.5 535 18.9 54 1.9 15 .53 Total 1,175 41.5 1,659 58.6 124 4.4 30 1.1
Total teachers = 2,829
35
Certification Grade
Initial Certificate
Professional Certificate
Temporary Certificate
Critical Need/PACE
Special Subject Certificate
Transitional Certificate
Frequency % Frequency % Frequency % Frequency % Frequency % Frequency %3 – 5 39 1.4 652 23.0 3 .11 0 0.0 3 .11 0 0.0 6 – 8 40 1.4 1,228 43.4 4 .14 4 .14 9 .32 0 0.0 9 – 12 44 1.6 784 27.7 0 0.0 5 .18 10 .35 3 .11 All grades 123 4.3 2,664 94.2 7 .32 9 .32 22 .78 3 .11
Total teachers = 2,829
Frequency and Percentage of Gifted and Talented Specialization of Teachers of Gifted and Talented Students by Grade Level
36
Table 31
Frequency and Percentage of Certification Level of Teachers of Gifted and Talented Students by Grade Level
Gifted and Talented Specialization Gifted and Talented Endorsement Gifted and Talented Certification Frequency % Frequency %3 – 5 428 15.1 88 3.1 6 – 8 686 24.2 88 3.1 9 – 12 428 15.1 40 1.4 All grades 1,542 54.5 216 7.6
Total teachers = 2,829
Table 32
The districts reported using a variety of methods in the process of selecting teachers for
their gifted and talented programs. The methods used in the selection process included teacher
qualifications (45.1%), principal selection (36.6%), participation in the regular district hiring
process (32.9%), teacher interest or request (14.6%), and Gifted and Talented Coordinator
selection (8.5%). Another 6.1% of the districts indicated other methods involved in the teacher
selection process.
The district coordinators were asked to provide information related to the professional
development opportunities provided to teachers of gifted and talented students. The number of
professional development activities provided by the districts since July 2004 ranged from one to
13. For the 73 reporting districts, the mean number of activities provided was approximately
three. On average, about 35 teachers of gifted and talented students, and 60 other teachers
attended the professional development opportunities provided. Not all of the professional
development activities described were specific to gifted education.
Information was also provided about the professional development needs of the teachers
of gifted and talented students. Table 33 shows a list of the various professional development
needs reported by the district coordinators. A combined 85% of the reporting districts indicated
that teachers need professional development in curriculum and instruction and differentiated
instruction. This signifies a theme for future professional development opportunities. A small
number of districts listed some Other professional development needs including program
management strategies, structure of the gifted classroom, and training on the new regulations.
Some suggested that the teachers need more opportunities and resources for professional
development. As stated by one district coordinator, “Funding- ability/resources to attend state
sponsored activities-everything available is needed.”
Table 33
Frequency and Percentage of Professional Development Needs of Teachers Working in the
Gifted and Talented Program (n=82)
Professional Development Need Frequency Percent Curriculum and instruction 42 51.2 Differentiation of instruction 28 34.1 Needs of GT students 26 31.7 Endorsement coursework 10 12.2 Technology 9 11.0 Collaboration/Observation 9 11.0 Assessment/analysis 5 6.1 Special education students 4 4.9 Involving other teachers/parents in the program. William and Mary
4 3
4.9 3.7
Recruitment/retention of minority students 2 2.4 Best Practices 2 2.4 Other 7 8.5 Note. The sum of the percentages exceeds 100%. District coordinators were asked to indicate multiple responses.
37
The district coordinators cited a wide array of support from the State Department of
Education. The frequency and percentage of the means of support reported are displayed in
Table 34. When asked to describe the support provided, the most frequently reported method of
support (54.9%) was Support and advice from SDE staff. Regarding the support and advice
received, some of the districts stated, “Outstanding support.”, and “Prompt and expert answers to
questions.” Many of the remaining methods of support described by the district coordinators were
in the form of meetings, workshops, and professional development. About 18% of the districts
noted funding as a support. A few of districts stated that the State Department of Education
provides direction for the gifted and talented programs, and a platform for working with gifted
students.
Table 34
Frequency and Percentage of Gifted and Talented Program Support from the South Carolina
Department of Education (n=82)
Support Frequency Percent Support and advice/information from SDE staff 45 54.9 State meetings 34 41.5 Regional meetings 33 40.2 Workshops/Courses 20 24.4 Professional development 16 19.5 Funding 15 18.3 Technical assistance 11 13.4 GIFT software 6 7.3 Resources 3 3.7 Other 4 4.9 Note. The sum of the percentages exceeds 100%. District coordinators were asked to indicate multiple types of support. Funding
District coordinators were asked to indicate which grade levels their district serves with
state gifted and talented funds. Figure 3 displays the percentage of grade levels served by state
gifted and talented funds. All grade levels (3 – 12) were reportedly served with state funds in at
least 20% of the districts. Gifted and talented programs served by state funds were more
frequently reported in the elementary and middle grades. Grades 3 through 5 were reportedly
served by state funds in approximately 98% of the districts. The grade level served by the lowest
number of districts was grade 12. This item did not reflect a distinction between academically and
artistically gifted and talented programs.
38
Grade 3 98% Grade 4 98% Grade 5 98% Grade 6 89% Grade 7 82% Grade 8 76% 2026
98Grade 9 40% 37
Grade 10 37% 40 Grade 11 26% Grade 12 20%
9876
82 98
89
Figure 3. Percentage of Grade Levels Served by State Gifted and Talented Funds
Note. The sum of the percentages exceeds 100%. District program coordinators were asked to check all grade levels served with state gifted and talented funds.
Gifted and talented programs can be funded through a variety of sources. When asked for the
amount of funds received from other sources, in addition to state, district, and Gifted and Talented
Foundation funds, between July 1, 2003 and June 30, 2004, 22 of 24 coordinators reported dollar
amounts. The remaining two districts reported the source, but did not indicate the amount of
funds received from the additional sources. Approximately $963,242 from additional funding
sources was reported, to fund academically gifted and talented programs. An additional $185,313
was reportedly used to fund artistically gifted and talented programs. The following are the
additional funding sources used by the districts:
Academically Gifted and Talented
• Transfer from Gifted and Talented Artistic program
• Webb Craft Grant
• Community Foundation Grants
• Education Improvement Act (EIA) grants
• Staff Development
• Innovation funds
• K-5 School enhancement
39
• Ed Teach (E2T2) Grant
• Retraining Grant
• Gifted and Talented program fundraiser
• Gifted and Talented Fees
• Title V
• Title I
• Other State funds
• SC Arts Council
• Parent Group-Elementary
Artistically Gifted and Talented
• Student fees
• Arts in Education (AIE) grant
• Other grant funds
• After-school program and donations
• Parents
• Distinguished Arts Program (DAP) grant
• Tri-District Arts Consortium (student paid tuition)
• Consortium for the Arts
• Tuition
• Arts Partnership Grant
• SC Arts Council
• Pupil Activity funds
Sixty-five of eighty-one (80.2%) gifted and talented district program coordinators reported
using funds from sources other than state gifted and talented appropriation to serve gifted and
talented students. The funds from other sources for the gifted and talented program were used
as follows:
• Salaries/benefits (72.3%)
• Supplies (50.8%)
• Professional development (15.4%)
• Travel/transportation (6.2%)
• Field trips (4.6%)
• Assessments/testing materials (1.5%)
• Technology (1.5%)
• Other (16.9%)
40
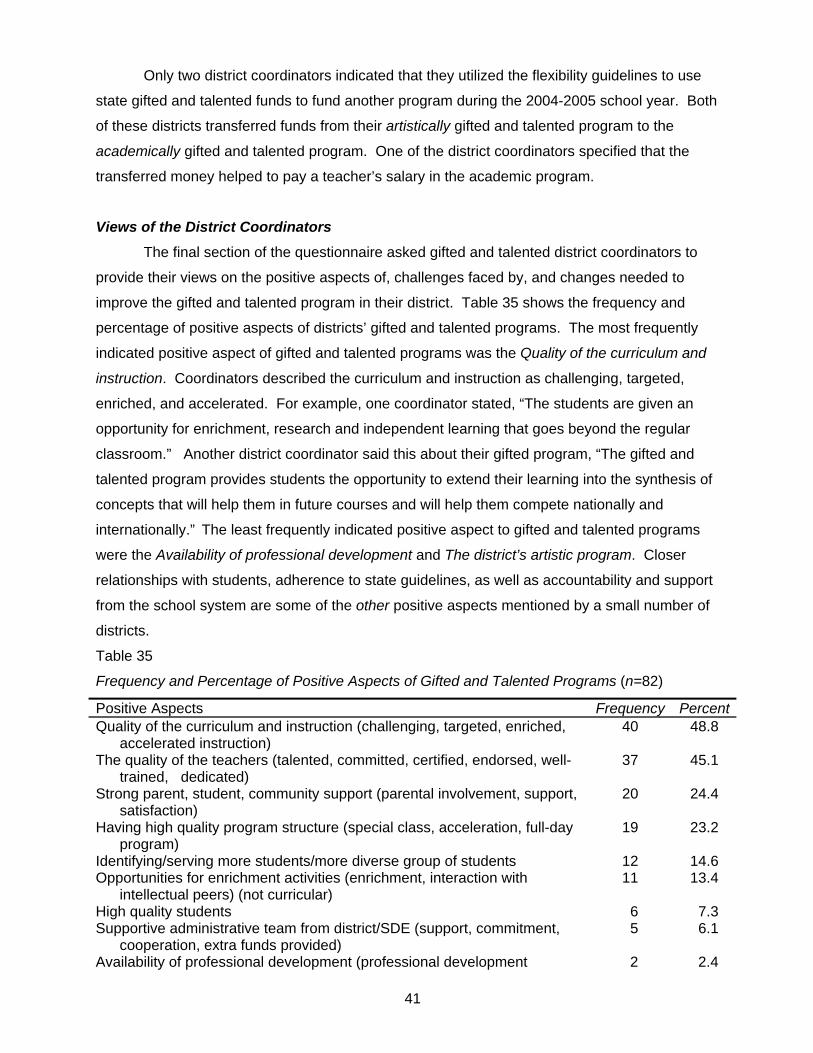
Only two district coordinators indicated that they utilized the flexibility guidelines to use
state gifted and talented funds to fund another program during the 2004-2005 school year. Both
of these districts transferred funds from their artistically gifted and talented program to the
academically gifted and talented program. One of the district coordinators specified that the
transferred money helped to pay a teacher’s salary in the academic program.
Views of the District Coordinators
The final section of the questionnaire asked gifted and talented district coordinators to
provide their views on the positive aspects of, challenges faced by, and changes needed to
improve the gifted and talented program in their district. Table 35 shows the frequency and
percentage of positive aspects of districts’ gifted and talented programs. The most frequently
indicated positive aspect of gifted and talented programs was the Quality of the curriculum and
instruction. Coordinators described the curriculum and instruction as challenging, targeted,
enriched, and accelerated. For example, one coordinator stated, “The students are given an
opportunity for enrichment, research and independent learning that goes beyond the regular
classroom.” Another district coordinator said this about their gifted program, “The gifted and
talented program provides students the opportunity to extend their learning into the synthesis of
concepts that will help them in future courses and will help them compete nationally and
internationally.” The least frequently indicated positive aspect to gifted and talented programs
were the Availability of professional development and The district’s artistic program. Closer
relationships with students, adherence to state guidelines, as well as accountability and support
from the school system are some of the other positive aspects mentioned by a small number of
districts.
Table 35
Frequency and Percentage of Positive Aspects of Gifted and Talented Programs (n=82)
Positive Aspects Frequency PercentQuality of the curriculum and instruction (challenging, targeted, enriched,
accelerated instruction) 40 48.8
The quality of the teachers (talented, committed, certified, endorsed, well-trained, dedicated)
37 45.1
Strong parent, student, community support (parental involvement, support, satisfaction)
20 24.4
Having high quality program structure (special class, acceleration, full-day program)
19 23.2
Identifying/serving more students/more diverse group of students 12 14.6 Opportunities for enrichment activities (enrichment, interaction with
intellectual peers) (not curricular) 11 13.4
High quality students 6 7.3 Supportive administrative team from district/SDE (support, commitment,
cooperation, extra funds provided) 5 6.1
Availability of professional development (professional development 2 2.4
41
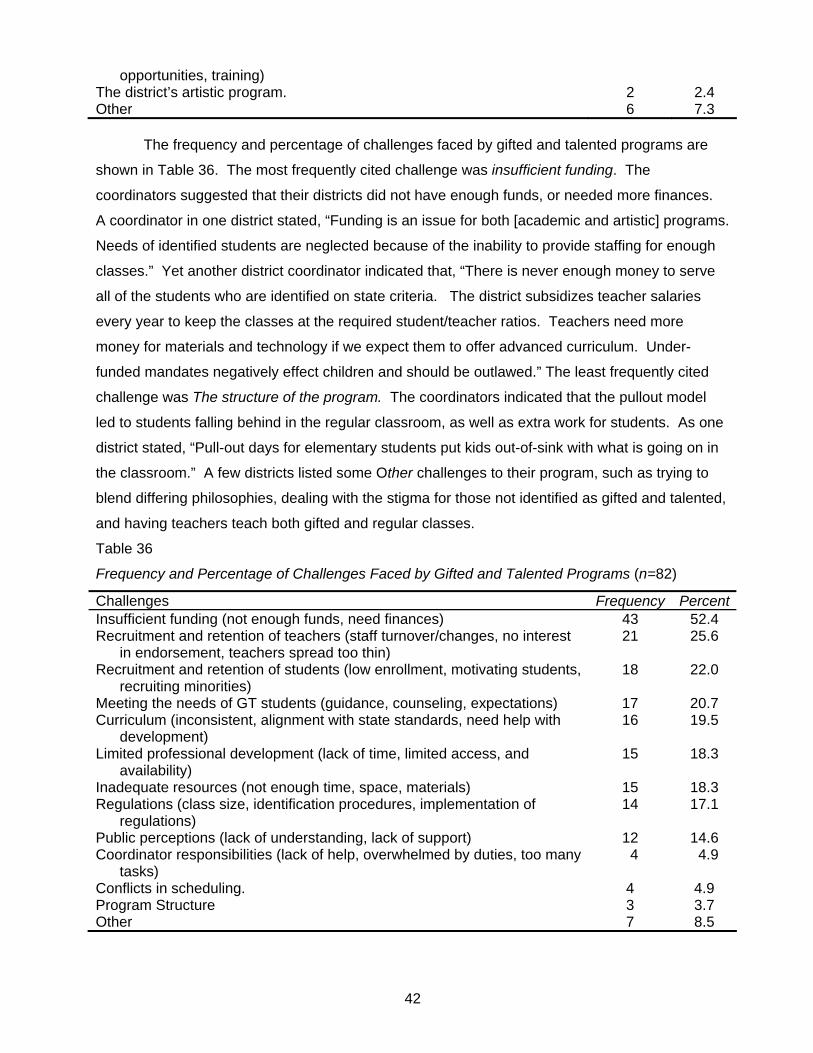
opportunities, training) The district’s artistic program. 2 2.4 Other 6 7.3 The frequency and percentage of challenges faced by gifted and talented programs are
shown in Table 36. The most frequently cited challenge was insufficient funding. The
coordinators suggested that their districts did not have enough funds, or needed more finances.
A coordinator in one district stated, “Funding is an issue for both [academic and artistic] programs.
Needs of identified students are neglected because of the inability to provide staffing for enough
classes.” Yet another district coordinator indicated that, “There is never enough money to serve
all of the students who are identified on state criteria. The district subsidizes teacher salaries
every year to keep the classes at the required student/teacher ratios. Teachers need more
money for materials and technology if we expect them to offer advanced curriculum. Under-
funded mandates negatively effect children and should be outlawed.” The least frequently cited
challenge was The structure of the program. The coordinators indicated that the pullout model
led to students falling behind in the regular classroom, as well as extra work for students. As one
district stated, “Pull-out days for elementary students put kids out-of-sink with what is going on in
the classroom.” A few districts listed some Other challenges to their program, such as trying to
blend differing philosophies, dealing with the stigma for those not identified as gifted and talented,
and having teachers teach both gifted and regular classes.
Table 36
Frequency and Percentage of Challenges Faced by Gifted and Talented Programs (n=82)
Challenges Frequency PercentInsufficient funding (not enough funds, need finances) 43 52.4 Recruitment and retention of teachers (staff turnover/changes, no interest
in endorsement, teachers spread too thin) 21 25.6
Recruitment and retention of students (low enrollment, motivating students, recruiting minorities)
18 22.0
Meeting the needs of GT students (guidance, counseling, expectations) 17 20.7 Curriculum (inconsistent, alignment with state standards, need help with
development) 16 19.5
Limited professional development (lack of time, limited access, and availability)
15 18.3
Inadequate resources (not enough time, space, materials) 15 18.3 Regulations (class size, identification procedures, implementation of
regulations) 14 17.1
Public perceptions (lack of understanding, lack of support) 12 14.6 Coordinator responsibilities (lack of help, overwhelmed by duties, too many
tasks) 4 4.9
Conflicts in scheduling. 4 4.9 Program Structure 3 3.7 Other 7 8.5
42
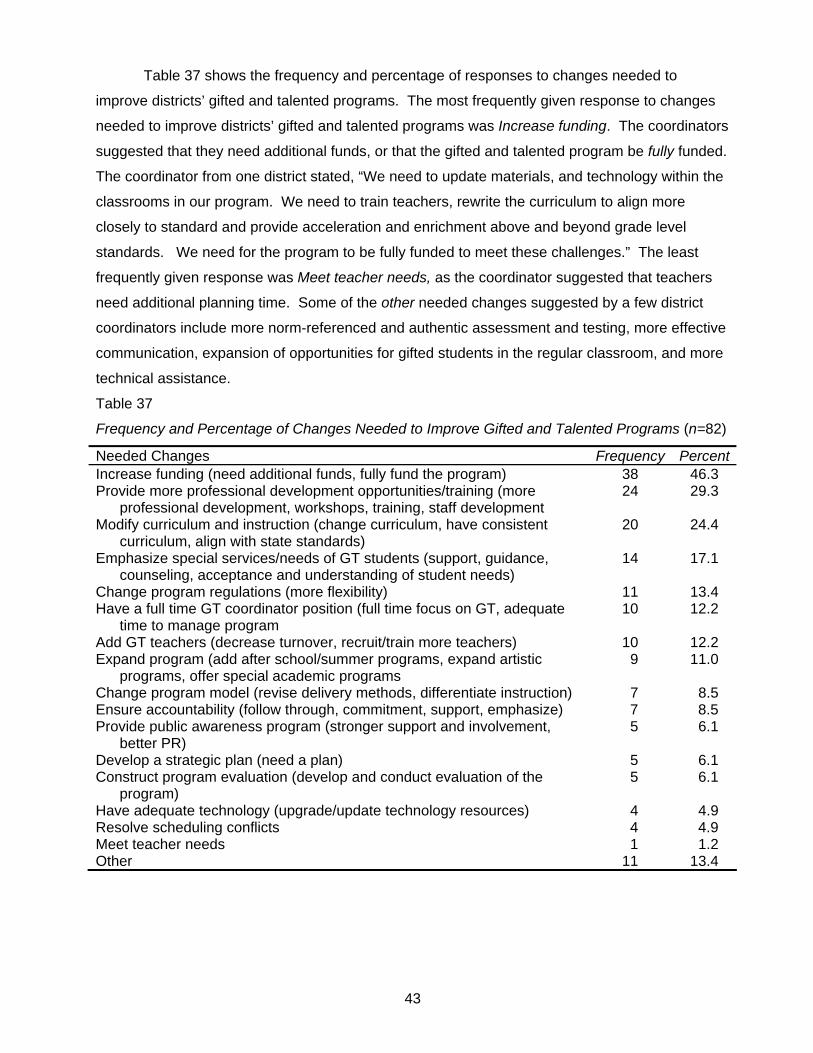
Table 37 shows the frequency and percentage of responses to changes needed to
improve districts’ gifted and talented programs. The most frequently given response to changes
needed to improve districts’ gifted and talented programs was Increase funding. The coordinators
suggested that they need additional funds, or that the gifted and talented program be fully funded.
The coordinator from one district stated, “We need to update materials, and technology within the
classrooms in our program. We need to train teachers, rewrite the curriculum to align more
closely to standard and provide acceleration and enrichment above and beyond grade level
standards. We need for the program to be fully funded to meet these challenges.” The least
frequently given response was Meet teacher needs, as the coordinator suggested that teachers
need additional planning time. Some of the other needed changes suggested by a few district
coordinators include more norm-referenced and authentic assessment and testing, more effective
communication, expansion of opportunities for gifted students in the regular classroom, and more
technical assistance.
Table 37
Frequency and Percentage of Changes Needed to Improve Gifted and Talented Programs (n=82)
Needed Changes Frequency PercentIncrease funding (need additional funds, fully fund the program) 38 46.3 Provide more professional development opportunities/training (more
professional development, workshops, training, staff development 24 29.3
Modify curriculum and instruction (change curriculum, have consistent curriculum, align with state standards)
20 24.4
Emphasize special services/needs of GT students (support, guidance, counseling, acceptance and understanding of student needs)
14 17.1
Change program regulations (more flexibility) 11 13.4 Have a full time GT coordinator position (full time focus on GT, adequate
time to manage program 10 12.2
Add GT teachers (decrease turnover, recruit/train more teachers) 10 12.2 Expand program (add after school/summer programs, expand artistic
programs, offer special academic programs 9 11.0
Change program model (revise delivery methods, differentiate instruction) 7 8.5 Ensure accountability (follow through, commitment, support, emphasize) 7 8.5 Provide public awareness program (stronger support and involvement,
better PR) 5 6.1
Develop a strategic plan (need a plan) 5 6.1 Construct program evaluation (develop and conduct evaluation of the
program) 5 6.1
Have adequate technology (upgrade/update technology resources) 4 4.9 Resolve scheduling conflicts 4 4.9 Meet teacher needs 1 1.2 Other 11 13.4
43
DISCUSSION AND RECOMMENDATIONS The purpose of this study was to provide a description of the operation of the gifted and
talented program in South Carolina school districts. The study included the following major tasks:
• A review of program legislation and regulations for South Carolina’s gifted and talented
program;
• A review of gifted and talented programs in selected states for comparison with South
Carolina’s program;
• A review of student participation and financial data on the gifted and talented program;
and
• Administration of questionnaires to coordinators of gifted and talented programs in all 85
school districts.
This section provides a discussion of the major findings of the study and makes recommendations
for particular aspects of the gifted and talented program.
Instructional Services for Gifted Students
Students are identified for gifted programs in South Carolina with a variety of criteria
including measures of aptitude, achievement, and performance. Students who score at specified
levels on both aptitude and achievement tests are identified for the program. Students who score
well on either the aptitude or the achievement tests must take a performance-based test (grades
1-5) or have their school grades evaluated (grades 6-12) to be further considered for placement in
the gifted program. The addition of the performance-based measures in early 2000, under an
agreement with the United States Office of Civil Rights, was intended to provide greater access to
the gifted program for minority and low-income learners. As a result of the changes in
identification procedures in the past few years, the current population of gifted students is more
diverse in terms of their academic strengths than the students of the past. In addition, students
with “dual exceptionalities” who are identified as gifted and also have an identified handicapping
condition are part of the state’s population of gifted students.
The diversity of the population of gifted students means that instructional services have to
be adapted to the capacities of individual students. One type of program or one standard
curriculum can not be used for all students across the state. District coordinators of gifted
programs repeatedly mentioned that they needed additional assistance with curriculum and
instruction when asked about needed changes in the program. More than three-quarters of the
coordinators asked for help in the development of curriculum and in the differentiation of
instruction for gifted students. Other directors mentioned the need for further work on aligning
curriculum with state standards, and assistance with curriculum compaction and acceleration.
44
Districts receive basic curriculum guidance for their programs from training and materials
provided by the State Department of Education. The South Carolina Gifted Education Best
Practices Manual (State Department of Education, 2001) is a comprehensive guide to gifted
program operation that includes sections addressing curriculum alignment with state standards,
curriculum design, and scope and sequence. Districts rely on the information in the manual to
operate their programs, but have professional development needs that require additional training
and support. For example, acceleration should be part of every state program according to a
proviso to the state budget, but only 4.5% of the district coordinators report using acceleration
within grades as a program strategy for grades 6-8. For grades 9-12, acceleration was used as a
program strategy by 2.7% of the districts. No district reported using this strategy for grades 3-5.
Recommendation: Additional professional training in curriculum development and
instruction should be provided to teachers of gifted students to ensure that students’ individual
instructional needs are met.
Professional Preparation
According to state regulation, teachers of gifted students in South Carolina must have a
gifted and talented endorsement in addition to their teaching certificate. Newly hired teachers
have one year to earn the endorsement, and experienced teachers (such as those with a master’s
degree in gifted education) can have the requirement waived under certain circumstances.
District coordinators provided information on the educational background and qualifications of the
teachers in their districts. Almost 60% of the teachers have a master’s degree and 94% of the
teachers have a professional teaching certificate. Only 4% of the teachers have an initial
teaching certificate and about 1% has other types of teaching certificates such as temporary,
special subject, or PACE (alternative certification program). Slightly more than half of the
teachers (54.5%) have a gifted and talented endorsement, and 7.6% have an add-on certification
in gifted education. Considering both of these avenues of acquiring additional training in gifted
education, approximately 62% of the teachers currently teaching gifted students have the required
credentials. Similarly, although training in gifted education is not required for district directors,
51% of the current directors reported that they had either a gifted and talented endorsement or an
add-on certification in gifted education.
Compared with other states examined for this study, South Carolina has fewer
requirements for a gifted and talented endorsement. South Carolina teachers must take 6 hours
of graduate coursework in specified areas of gifted education to earn their endorsement.
Teachers in other states must take from 12 to 18 hours of additional graduate coursework to
receive endorsement or add-on certification in gifted education. In addition, only three institutions
45
of higher education in South Carolina offer the needed coursework, and only one college in the
state offers a program leading to a master’s in gifted education.
District coordinators expressed concern about the limited availability of courses needed for
endorsement and noted that it was difficult to motivate teachers to enroll in the required courses.
Twenty-six percent of the coordinators stated that the recruitment and retention of qualified
teachers as well as teacher turnover was a challenge faced by their district. When asked about
needed program changes, one coordinator said that the district needed “Teachers committed to
getting the GT endorsement. Right now a game is being played. Teachers are being changed
each year to satisfy the endorsement clause. That is not the way to build a good program. We
need continuity.”
Recommendation: The requirements for the state’s gifted and talented endorsement
should be examined to ensure that teachers receive sufficient training to be successful instructors
of students with diverse areas of giftedness.
Recommendation: The availability of required coursework for the gifted and talented
teacher endorsement needs to be improved, possibly by providing incentives to institutions of
higher education to provide the necessary graduate courses in gifted education. The possibility of
providing incentives to teachers or district coordinators who earn a gifted and talented
endorsement should be considered.
Program Services and Expenditures for the Education of Gifted and Talented Students
The current gifted education program in South Carolina owes its existence to the
Education Improvement Act of 1984 (EIA). The EIA states: "…all gifted and talented students at
the elementary and secondary levels must be provided programs during the regular school year
or during summer school to develop their unique talents in the manner the State Board of
Education shall specify… Monies appropriated for Gifted and Talented Programs under the
Education Improvement Act of 1984 shall be allocated to the school districts of the state on the
basis that the number of such students served in each district bears to the total of all such
students in the state (Section 59-29-170). It is unclear from the findings of this study that all gifted
and talented elementary and secondary students in the state are being provided services as
envisioned in the EIA. Information provided by district coordinators indicates that about 80% of
the districts provide gifted education services to students in grades 3-5, but fewer districts provide
services to students in middle school and high school. Approximately 67% of the districts provide
services to middle school students, and about 25% provide EIA-funded services to gifted high
school students. Other programs such as Advanced Placement offer opportunities to students in
high school, but these types of programs are not typically available to middle school students. In
addition, approximately 16% of the districts do not appear to be providing services to artistically
46
gifted students as required by proviso to the state budget. Some of these districts moved their
allocated EIA funds for artistic programs to other district programs as allowed by provisos to the
state budget allowing funding flexibility. Approximately half of the district coordinators stated that
additional funding was needed to provide the required services to gifted and talented students in
their districts.
Districts also vary in the percentage of their student enrollment served by gifted programs
and in per pupil expenditures for the programs. Districts served from 2.2% to 28.9% of their
grade 3-12 students during the 2003-2004 school year. The average percentage of students
served was 11.2% and the median was 10.7%. District expenditures, as recorded by district
reporting to the State Department of Education, ranged from $22.03 to $3,336.80 per student.
The average per student expenditure was $607.58 for 2003-2004. These district expenditure
figures should be viewed with some caution, since expenditure data reported by district
coordinators was not always consistent with data compiled by the Office of Finance in the
Department of Education. In some cases, the difference in these two figures was substantial.
EIA funds made up 63% of the total district expenditures for the academic gifted program
and 62% of the expenditures for artistically gifted students during 2003-2004. In 2001-2002, EIA
funds accounted for 73% of the expenditures for the academic program and 69% for the artistic
program. With increasing numbers of students and decreases in the EIA allocation since 2001-
2002, districts have been using more funds from other sources such as the general fund and
special revenue accounts. The majority of school districts were able to supplement their EIA
funds with monies from the general fund or from special revenue accounts in 2003-2004, but 17
districts relied totally on EIA funds to support their program for gifted students. The variation in
availability of supplemental funding from district to district may be contributing to some of the
differences in program services observed in this study.
Recommendation: Studies should be conducted on the funding mechanisms that
support the provision of services to gifted and talented students in the state to ensure that the
EIA’s requirement to provide programs to all elementary and secondary gifted and talented
students is achieved. An analysis of the necessary level of funding to provide an adequate gifted
and talented program should be part of these studies.
Recommendation: Clarification should be provided to the districts on whether program
services still need to be delivered to students if the program funds are “flexed” or shifted to
another district program as permitted under provisos to the state budget.
47
References
An Act Relative to Gifted and Talented Students, Proposed amendments to Massachusetts
General Law, Part I, Administration of the Government, Title XII, Education (2004).
Retrieved November 9, 2004, from http://www.massgifted.org/GTBill3490Feb04.html
Arkansas Department of Education. 2003-2004 statewide information system database.
Retrieved May 24, 2005, from http://adedata.k12.ar.us:8080/FY03-
04/State/State%20Profile.ADE
Arkansas Department of Education. (1995). Rules and regulations governing expenditure
requirements by Arkansas school districts. Little Rock, AR:Author. Retrieved November
17, 2004, from http://arkedu.state.ar.us/rules/pdf/current_rules/042.pdf
Arkansas Department of Education. (1999). Gifted and talented rules and regulations: program
approval standards. (Rev. ed.). Little Rock, AR: Author. Retrieved November 10, 2004,
from http://arkedu.state.ar.us/rules/pdf/current_rules/rr_giftedtalented_99.pdf
Arkansas Department of Education. Office of Professional Licensure. (n.d.) Gifted and talented
licensure endorsement. Little Rock, AR: Author. Retrieved November 10, 2004, from
http://arkedu.state.ar.us/teachers/pdf/gt_licensure031705.pdf
Arkansas Department of Education. Regulations Governing the Advanced Placement Incentive
Program (n.d.) Retrieved November 10, 2004, from
http://arkedu.state.ar.us/rules/pdf/current_rules/056.pdf
Arkansas Department of Education. Rules Governing Site Selection of Arkansas Governor’s
School. (2004 January). Retrieved November 10, 2004, from
http://arkedu.state.ar.us/rules/pdf/current_rules/gov_school_site_selection.pdf
Association for Children of New Jersey. (2004). Newark kids count 2004: A city profile of child
well-being. Newark, NJ: Author. Retrieved April 28, 2005, from
http://www.acnj.org/main.asp?uri=1004&sti=107
48
Braverman, R. (2004). Highly qualified requirement of NCLB and teachers of gifted in New
Jersey. Laurel, NJ: New Jersey Association for the Gifted. Retrieved November 10, 2004,
from http://www.njagc.org/highly_qualified.html
Brown, A., Avery, L., & VanTassel-Baska, J. (2003, Oct.). Gifted Policy Analysis Study for the
Ohio Department of Education Final Report. Retrieved May 8, 2005, from
www.ncpublicschools.org/ec/exceptionality/gifted
Charlotte Mecklenburg Schools Magnet Programs. (2004). Learning immersion centers and talent
development K-5. Charlotte, NC: Author. Retrieved November 12, 2004, from
http://www.cms.k12.nc.us/programs/magnet/magnet.asp?PK_Category=11
Connecticut Association for the Gifted. (2004). Connecticut laws and policies. Hartford, CT:
Author. Retrieved November 10, 2004, from http://www.ctgifted.org/policy/index.html
Connecticut Department of Education. (2001). Bureau of curriculum and instruction content area
gifted and talented publications. Retrieved November, 10, 2004, from
http://www.state.ct.us/sde/dtl/curriculum/currgift.htm
Connecticut Department of Education. (2002). Profiles of our schools: The condition of education
in Connecticut. Hartford, CT: Author. Retrieved November 17, 2004, from
http://www.csde.state.ct.us/public/der/coe/coe_2001_02.pdf
Darity, W., Castellino, D., Tyson, K., Cobb, C., McMillen, B. (2001). Increasing opportunity to
learn via access to rigourous courses and programs: One strategy for closing the
achievement gap for at-risk and ethnic minority students. Raleigh, NC: North Carolina
Department of Instruction. Retrieved November 10, 2004, from
http://www.ncpublicschools.org/docs/schoolimprovement/closingthegap/reports/
The Davidson Institute for Talent Development. (2004). Gifted education policies. Retrieved
November 17, 2004, from http://www.geniusdenied.com/
Driscoll, D. P. (personal communication, August 9, 2004). Retrieved November 9, 2004, from
http://finance1.doe.mass.edu/Grants/grants05/rfp/580_memo.html
49
Education Commission of the States. (June 2004). State gifted and talented definitions. Retrieved
April 6, 2005, from http://www.ecs.org/clearinghouse/52/28/5228.htm
The Education Trust. (2004). Education watch 2004 state summary reports. Retrieved April 20,
2005, from http://www2.edtrust.org/edtrust/summaries2004/states.html
Feng, A.X. & VanTassel-Baska, J. (2002). Project STAR Follow-up Study. College of William and
Mary. Retrieved May 8, 2005, from:
http://www.myscschools.com/offices/cso/Gifted_Talented/documents/LORDSouth
CarolinaTheUseofPerformance-BasedAssessment.ppt.
Florida Department of Education. Administrative Rule 6A-4.01791. (1992). Specialization
requirements for the gifted endorsement. Retrieved November 11, 2004, from
http://www.fldoe.org/edcert/rules/6A-4-01791.asp
Florida Department of Education, Bureau of Instructional Support and Community Services.
(2004a). 2004 SEA Profile. Tallahassee, FL: Author. Retrieved November 15, 2004, from
http://www.firn.edu/doe/bin00014/pdf/state.pdf
Florida Department of Education, Bureau of Instructional Support and Community Services.
(2004b). Challenge grant for the gifted collaborative curriculum projects: 2003-2004
summaries. Tallahassee, FL: Author. Retrieved November 10, 2004, from
http://www.firn.edu/doe/bin00014/pdf/ese10665.pdf
Florida Department of Education, Bureau of Instructional Support and Community Services.
(2004c). Services for secondary students who are gifted (Technical assistance paper
312273). Tallahassee, FL: Author. Retrieved April 6, 2005, from
http://www.firn.edu/doe/bin00014/pdf/y2004-13.pdf
Florida Special Education Regulations, Florida Administrative Code Ann. r. 6A-6.03019 (2001).
Retrieved April 26, 2005, from
http://128.146.206.233/glarrc/Resources/PDFs/StateRegsPDF/FLser502.pdf
Georgia Board of Education. (2003). Georgia Department of Education fiscal year 2004 budget.
Atlanta, GA: Author. Retrieved November 15, 2004,from
http://www.doe.k12.ga.us/_documents/doe/finances/budget_04.pdf
50
Georgia Department of Education. (2005). Curriculum and instruction: Gifted education. Atlanta,
GA: Author. Retrieved on April 28, 2000, from
http://www.doe.k12.ga.us/curriculum/instruction/gifted.asp
Georgia Professional Standards Commission. (2005). Certification Rules Index. Atlanta, GA:
Author. Retrieved April 29, 2005, from
http://www.gapsc.com/TeacherCertification/Documents/Rules.asp
Golden, G. (2004, Apr). Boosting minorities in gifted program poses dilemmas: Nontraditional
criteria lift admissions of blacks, poor. The Wall Street Journal. Retrieved April, 22, 2005,
from http://www.greenville.k12.sc.us/gifted/news/2003/wsj.asp
Hefner, S. (Speaker). (2003). The nature and needs of gifted and talented students: History and
rationale of gifted education (CD Rom). Columbia, SC: State Department of Education T3
Teaching Series.
Hendrix College. (2004). Arkansas governor’s school. Retrieved November 10, 2004, from
http://www.hendrix.edu/ags/
Krisel, S. (2004, March). Georgia Department of Education update: The state of the state in gifted
education. Presentation at Georgia Association for Gifted Children Conference, Athens,
GA. Retrieved November 15, 2004, from http://www.gagc.org/ppt/Conference Keynote
Addresses 1.ppt
Lord, W. (2004, Sept.). G&T Fall Update. Retrieved May, 6, 2005, from
www.myscschools.com/offices/cso/Gifted_Talented/documents/Lord2004FallUpdateforGT
Coordinators.ppt
Massachusetts Department of Education. (2004). School finance statistical comparisons: Fiscal
year 2003 per pupil expenditures. Malden, MA: Author. Retrieved November 9, 2004, from
http://finance1.doe.mass.edu/statistics/pp03_trends.html
Massachusetts Department of Education, Center for Teaching and Learning. (2002, October).
Promoting high achievement: Policies and programs for academically advanced students
51
in Massachusetts. Malden, MA: Author. Retrieved November 12, 2004, from
http://www.doe.mass.edu/famcomm/AAEreport.pdf
National Center for Educational Statistics. (2004). National Assessment of Educational Progress:
State Profiles. Washington, DC: Author. Retrieved November 11, 2004, from
http://nces.ed.gov/nationsreportcard/states/
National Council of State Directors of Programs for the Gifted. (2002). The 2001-2002 state of the
states: Gifted and talented education report. Austin, TX: Author.
New Jersey Association for Gifted Children. (2000). New Jersey Administrative Code. Retrieved
November 10, 2004, from http://www.njagc.org/admin_school_law.html
New Jersey Board of Education (2004). The New Jersey model for identifying highly qualified
teachers. (2004 -2005 ed.) Trenton, NJ: Author. Retrieved November 18, 2004, from
http://www.state.nj.us/njded/profdev/hqt/house.pdf
New Jersey Department of Education. (n.d.). New Jersey curriculum frameworks. Trenton, NJ:
Author. Retrieved November 16, 2004, fromhttp://www.state.nj.us/njded/frameworks/
North Carolina Board of Education. (2004, May) Revision of teacher education specialty area
standards. Raleigh, NC: Author. Retrieved November 10, 2004, from
http://www.ncpublicschools.org/sbe_meetings/0405/0405_QP.pdf
North Carolina Board of Education. (2004, July). HSP 5: Creating rigorous and challenging
learning experiences for students. Raleigh, NC: Author. Retrieved November 16, 2004,
from http://www.ncpublicschools.org/sbe_meetings/0407/0407_HSP.pdf
North Carolina Department of Public Instruction. (2004, March 30). 2004 Governor’s school
selections made. Retrieved November 16, 2004, from
http://www.ncpublicschools.org/news/03-04/033004p.html
North Carolina Department of Public Instruction. (2004). Operating procedures manual enrollment
of high school intellectually gifted and mature students in community college courses and
programs. Retrieved November 16, 2004, from http://www.ncpublicschools.org/curriculum/
52
North Carolina Department of Public Instruction. (2005a). Nomination packet for governor’s
school. Retrieved April 27, 2005, from http://www.ncgovschool.org/nomination/
North Carolina Department of Public Instruction. (2005b). Exceptional Children Division Retrieved
April 28, 2005, from http://www.ncpublicschools.org/ec/exceptionality/gifted/
Orange County Schools Curriculum and Instruction. (n.d.). Academically gifted services parent
guide. Hillsborough, NC: Author. Retrieved November 16, 2004, from
http://www.orange.k12.nc.us/instruction/instmain.html
South Carolina Department of Education Gifted and Talented Regulations R43-220, SC Code
Ann.§ 59-5-60 (2004).
South Carolina Department of Education. (1998). Proposed changes to gifted and talented
regulations. Retrieved September 1, 2004, from
http://www.myscschools.com/reports/gtpack.htm
South Carolina Department of Education. (2004-05). FY 2004-05 EIA Program Report: Gifted and
Talented Program. Columbia, SC: Author. Retrieved May 18, 2005, from
http://www.sceoc.com/EIAEAAProgram.htm
South Carolina Department of Education, Office of Curriculum and Standards. (2005). Gifted and
talented. Columbia, SC: Author. Retrieved April 28, 2005, from
http://www.myscschools.com/offices/cso/Gifted_Talented/gt.htm
South Carolina Department of Education Office of Curriculum and Standards. (2005, January).
South Carolina gifted and talented statistics. Columbia, SC: Author.
South Carolina Department of Education Office of Finance. (2004, July). FY’04 135 Day Student
Data/District. Columbia, SC: Author. Retrieved May 16, 2005, from
http://www.myscschools.com/offices/finance/FY04135D.txt
South Carolina General Assembly. H.R. 4925 115th Session (2004, June).
53
United States Department of Education. (2003). Jacob K. Javits gifted and talented students
education grant program fiscal year 2003 awards. Washington, DC: Author. Retrieved
November 12, 2004, from http://www.ed.gov/programs/javits/grants2003.doc
University of Arkansas at Little Rock, (n.d.) University of Arkansas at Little Rock Center for Gifted
Education. Little Rock, AR: Author. Retrieved November 10, 2004, from
http://www.ualr.edu/giftedctr/
VanTassel-Baska, J., Johnson, D., & Avery, L. (2002). Using performance tasks in the
identification of economically disadvantaged and minority gifted learners: Findings from
Project STAR. Gifted Child Quarterly, 46(2): 110-23.
Virginia Department of Education. (n.d.). Gifted education in the Commonwealth of Virginia and
governor’s schools. Retrieved April 27, 2005, from
http://www.pen.k12.va.us/VDOE/Instruction/Gifted/gifted.htm.
Virginia Department of Education Regulations Governing Educational Services for Gifted
Students. 8 VAC 20-40-10 through 8 VAC 20-40-70 (1993). Retrieved April 26, 2005, from
http://www.pen.k12.va.us/VDOE/Instruction/Gifted/gftregs.pdf
54
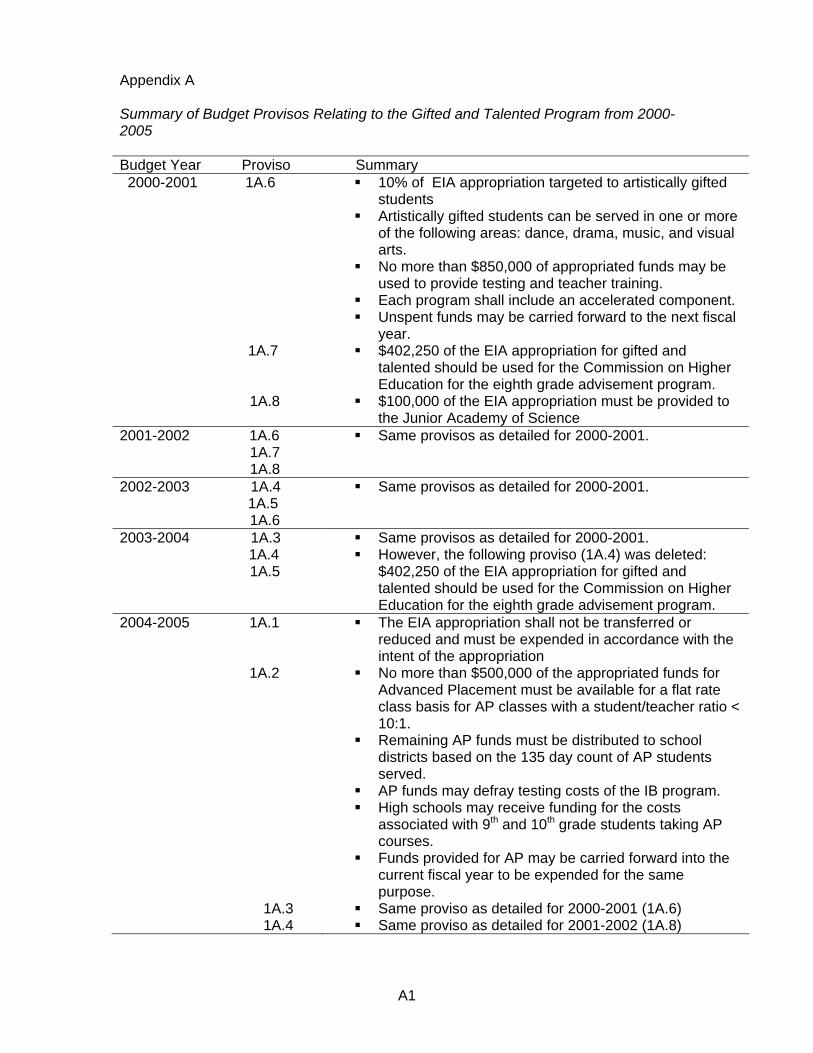
Appendix A
Summary of Budget Provisos Relating to the Gifted and Talented Program from 2000-2005
Budget Year Proviso Summary 2000-2001 1A.6
1A.7 1A.8
10% of EIA appropriation targeted to artistically gifted students
Artistically gifted students can be served in one or more of the following areas: dance, drama, music, and visual arts.
No more than $850,000 of appropriated funds may be used to provide testing and teacher training.
Each program shall include an accelerated component. Unspent funds may be carried forward to the next fiscal
year. $402,250 of the EIA appropriation for gifted and
talented should be used for the Commission on Higher Education for the eighth grade advisement program.
$100,000 of the EIA appropriation must be provided to the Junior Academy of Science
2001-2002 1A.6 1A.7 1A.8
Same provisos as detailed for 2000-2001.
2002-2003 1A.4 1A.5 1A.6
Same provisos as detailed for 2000-2001.
2003-2004 1A.3 1A.4 1A.5
Same provisos as detailed for 2000-2001. However, the following proviso (1A.4) was deleted:
$402,250 of the EIA appropriation for gifted and talented should be used for the Commission on Higher Education for the eighth grade advisement program.
2004-2005 1A.1
1A.2
1A.3 1A.4
The EIA appropriation shall not be transferred or reduced and must be expended in accordance with the intent of the appropriation
No more than $500,000 of the appropriated funds for Advanced Placement must be available for a flat rate class basis for AP classes with a student/teacher ratio < 10:1.
Remaining AP funds must be distributed to school districts based on the 135 day count of AP students served.
AP funds may defray testing costs of the IB program. High schools may receive funding for the costs
associated with 9th and 10th grade students taking AP courses.
Funds provided for AP may be carried forward into the current fiscal year to be expended for the same purpose.
Same proviso as detailed for 2000-2001 (1A.6) Same proviso as detailed for 2001-2002 (1A.8)
A1
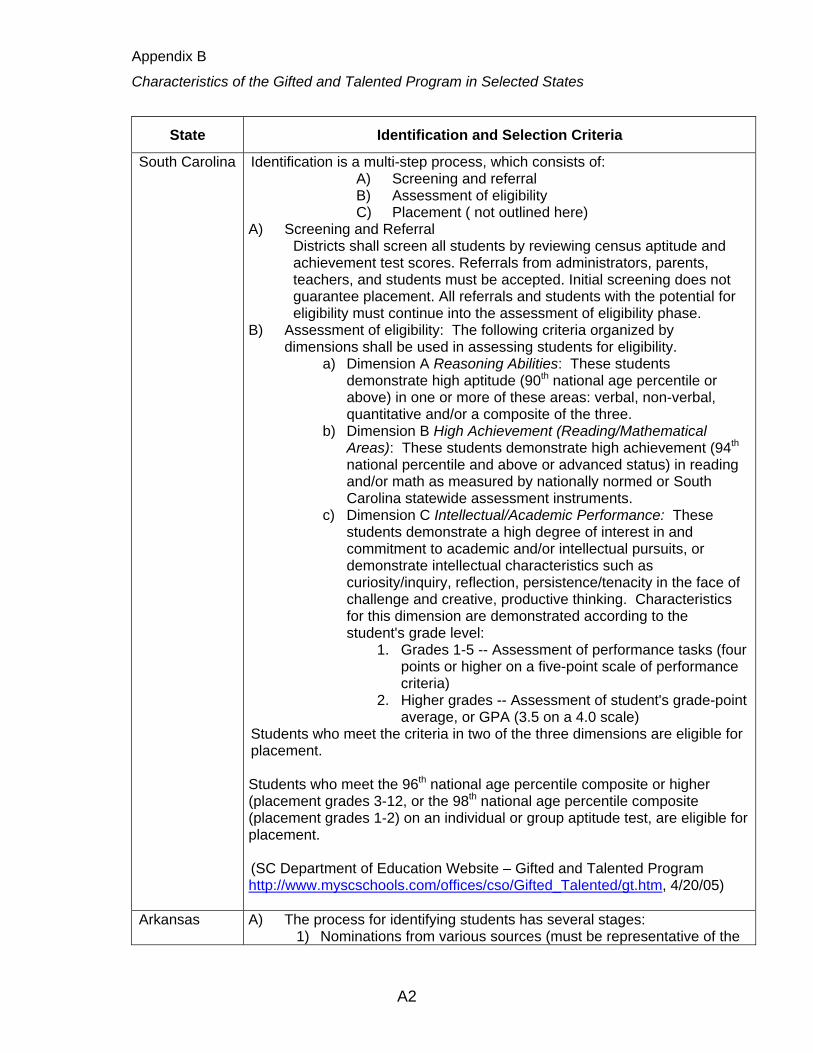
Appendix B
Characteristics of the Gifted and Talented Program in Selected States
State Identification and Selection Criteria
South Carolina Identification is a multi-step process, which consists of: A) Screening and referral B) Assessment of eligibility C) Placement ( not outlined here)
A) Screening and Referral Districts shall screen all students by reviewing census aptitude and achievement test scores. Referrals from administrators, parents, teachers, and students must be accepted. Initial screening does not guarantee placement. All referrals and students with the potential for eligibility must continue into the assessment of eligibility phase.
B) Assessment of eligibility: The following criteria organized by dimensions shall be used in assessing students for eligibility.
a) Dimension A Reasoning Abilities: These students demonstrate high aptitude (90th national age percentile or above) in one or more of these areas: verbal, non-verbal, quantitative and/or a composite of the three.
b) Dimension B High Achievement (Reading/Mathematical Areas): These students demonstrate high achievement (94th national percentile and above or advanced status) in reading and/or math as measured by nationally normed or South Carolina statewide assessment instruments.
c) Dimension C Intellectual/Academic Performance: These students demonstrate a high degree of interest in and commitment to academic and/or intellectual pursuits, or demonstrate intellectual characteristics such as curiosity/inquiry, reflection, persistence/tenacity in the face of challenge and creative, productive thinking. Characteristics for this dimension are demonstrated according to the student's grade level:
1. Grades 1-5 -- Assessment of performance tasks (four points or higher on a five-point scale of performance criteria)
2. Higher grades -- Assessment of student's grade-point average, or GPA (3.5 on a 4.0 scale)
Students who meet the criteria in two of the three dimensions are eligible for placement. Students who meet the 96th national age percentile composite or higher (placement grades 3-12, or the 98th national age percentile composite (placement grades 1-2) on an individual or group aptitude test, are eligible for placement. (SC Department of Education Website – Gifted and Talented Program http://www.myscschools.com/offices/cso/Gifted_Talented/gt.htm, 4/20/05)
Arkansas A) The process for identifying students has several stages: 1) Nominations from various sources (must be representative of the
A2
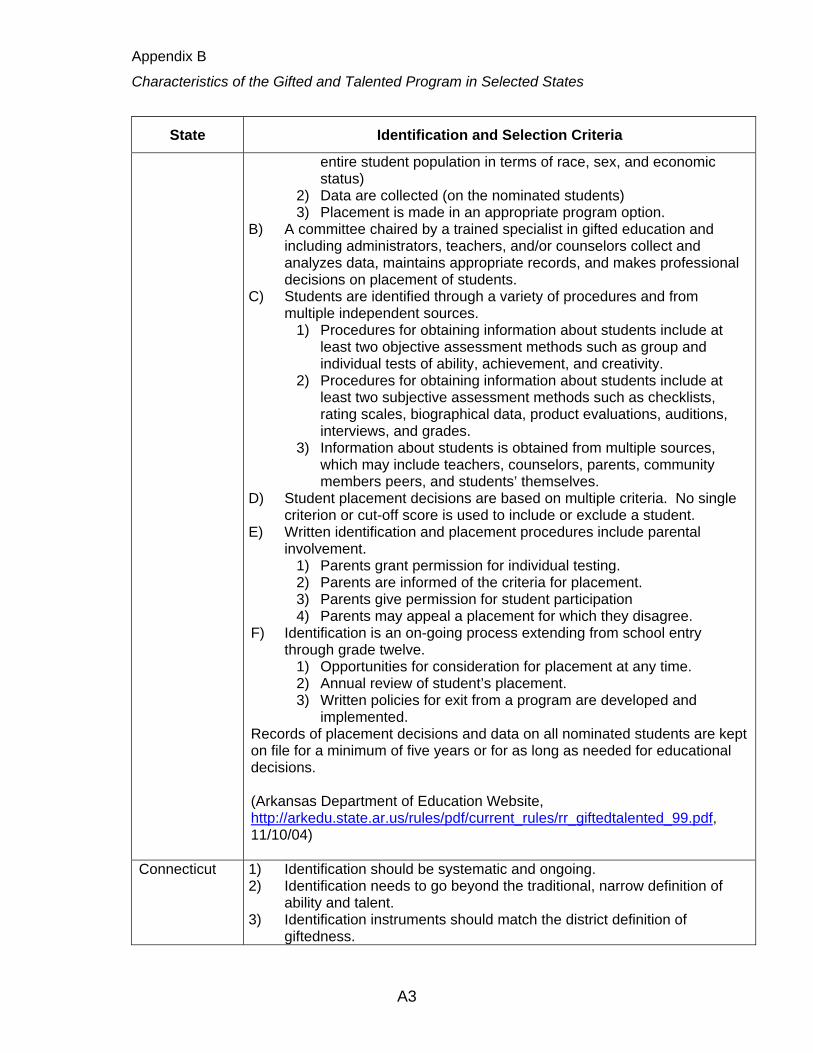
Appendix B
Characteristics of the Gifted and Talented Program in Selected States
State Identification and Selection Criteria
entire student population in terms of race, sex, and economic status)
2) Data are collected (on the nominated students) 3) Placement is made in an appropriate program option.
B) A committee chaired by a trained specialist in gifted education and including administrators, teachers, and/or counselors collect and analyzes data, maintains appropriate records, and makes professional decisions on placement of students.
C) Students are identified through a variety of procedures and from multiple independent sources.
1) Procedures for obtaining information about students include at least two objective assessment methods such as group and individual tests of ability, achievement, and creativity.
2) Procedures for obtaining information about students include at least two subjective assessment methods such as checklists, rating scales, biographical data, product evaluations, auditions, interviews, and grades.
3) Information about students is obtained from multiple sources, which may include teachers, counselors, parents, community members peers, and students’ themselves.
D) Student placement decisions are based on multiple criteria. No single criterion or cut-off score is used to include or exclude a student.
E) Written identification and placement procedures include parental involvement.
1) Parents grant permission for individual testing. 2) Parents are informed of the criteria for placement. 3) Parents give permission for student participation 4) Parents may appeal a placement for which they disagree.
F) Identification is an on-going process extending from school entry through grade twelve.
1) Opportunities for consideration for placement at any time. 2) Annual review of student’s placement. 3) Written policies for exit from a program are developed and
implemented. Records of placement decisions and data on all nominated students are kept on file for a minimum of five years or for as long as needed for educational decisions. (Arkansas Department of Education Website, http://arkedu.state.ar.us/rules/pdf/current_rules/rr_giftedtalented_99.pdf, 11/10/04)
Connecticut 1) Identification should be systematic and ongoing. 2) Identification needs to go beyond the traditional, narrow definition of
ability and talent. 3) Identification instruments should match the district definition of
giftedness.
A3
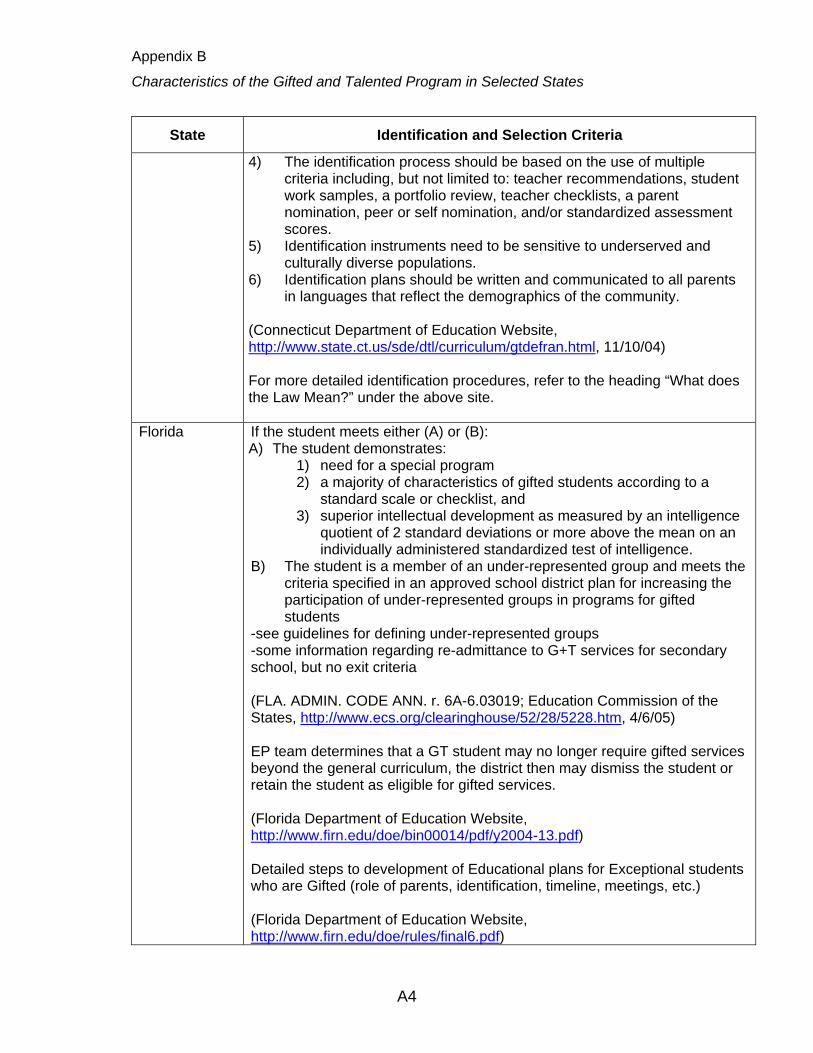
Appendix B
Characteristics of the Gifted and Talented Program in Selected States
State Identification and Selection Criteria
4) The identification process should be based on the use of multiple criteria including, but not limited to: teacher recommendations, student work samples, a portfolio review, teacher checklists, a parent nomination, peer or self nomination, and/or standardized assessment scores.
5) Identification instruments need to be sensitive to underserved and culturally diverse populations.
6) Identification plans should be written and communicated to all parents in languages that reflect the demographics of the community.
(Connecticut Department of Education Website, http://www.state.ct.us/sde/dtl/curriculum/gtdefran.html, 11/10/04) For more detailed identification procedures, refer to the heading “What does the Law Mean?” under the above site.
Florida If the student meets either (A) or (B): A) The student demonstrates:
1) need for a special program 2) a majority of characteristics of gifted students according to a
standard scale or checklist, and 3) superior intellectual development as measured by an intelligence
quotient of 2 standard deviations or more above the mean on an individually administered standardized test of intelligence.
B) The student is a member of an under-represented group and meets the criteria specified in an approved school district plan for increasing the participation of under-represented groups in programs for gifted students
-see guidelines for defining under-represented groups -some information regarding re-admittance to G+T services for secondary school, but no exit criteria (FLA. ADMIN. CODE ANN. r. 6A-6.03019; Education Commission of the States, http://www.ecs.org/clearinghouse/52/28/5228.htm, 4/6/05) EP team determines that a GT student may no longer require gifted services beyond the general curriculum, the district then may dismiss the student or retain the student as eligible for gifted services. (Florida Department of Education Website, http://www.firn.edu/doe/bin00014/pdf/y2004-13.pdf) Detailed steps to development of Educational plans for Exceptional students who are Gifted (role of parents, identification, timeline, meetings, etc.) (Florida Department of Education Website, http://www.firn.edu/doe/rules/final6.pdf)
A4
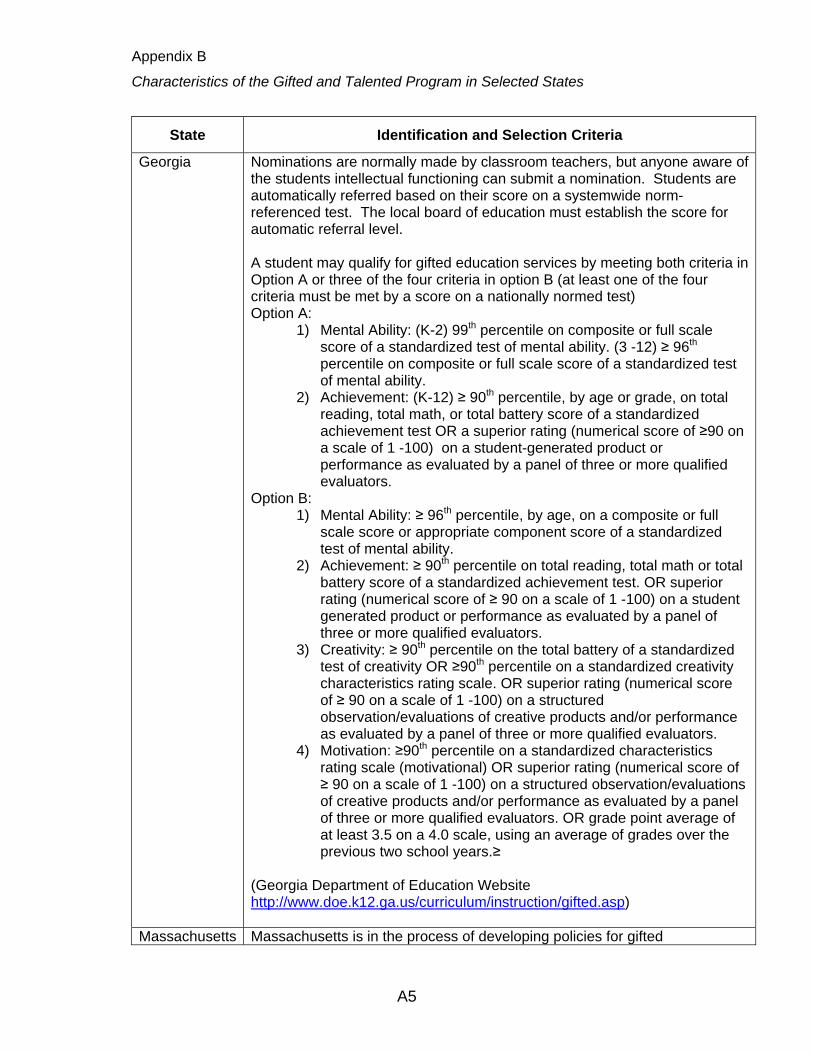
Appendix B
Characteristics of the Gifted and Talented Program in Selected States
State Identification and Selection Criteria
Georgia Nominations are normally made by classroom teachers, but anyone aware of the students intellectual functioning can submit a nomination. Students are automatically referred based on their score on a systemwide norm-referenced test. The local board of education must establish the score for automatic referral level. A student may qualify for gifted education services by meeting both criteria in Option A or three of the four criteria in option B (at least one of the four criteria must be met by a score on a nationally normed test) Option A:
1) Mental Ability: (K-2) 99th percentile on composite or full scale score of a standardized test of mental ability. (3 -12) ≥ 96th percentile on composite or full scale score of a standardized test of mental ability.
2) Achievement: (K-12) ≥ 90th percentile, by age or grade, on total reading, total math, or total battery score of a standardized achievement test OR a superior rating (numerical score of ≥90 on a scale of 1 -100) on a student-generated product or performance as evaluated by a panel of three or more qualified evaluators.
Option B: 1) Mental Ability: ≥ 96th percentile, by age, on a composite or full
scale score or appropriate component score of a standardized test of mental ability.
2) Achievement: ≥ 90th percentile on total reading, total math or total battery score of a standardized achievement test. OR superior rating (numerical score of ≥ 90 on a scale of 1 -100) on a student generated product or performance as evaluated by a panel of three or more qualified evaluators.
3) Creativity: ≥ 90th percentile on the total battery of a standardized test of creativity OR ≥90th percentile on a standardized creativity characteristics rating scale. OR superior rating (numerical score of ≥ 90 on a scale of 1 -100) on a structured observation/evaluations of creative products and/or performance as evaluated by a panel of three or more qualified evaluators.
4) Motivation: ≥90th percentile on a standardized characteristics rating scale (motivational) OR superior rating (numerical score of ≥ 90 on a scale of 1 -100) on a structured observation/evaluations of creative products and/or performance as evaluated by a panel of three or more qualified evaluators. OR grade point average of at least 3.5 on a 4.0 scale, using an average of grades over the previous two school years.≥
(Georgia Department of Education Website http://www.doe.k12.ga.us/curriculum/instruction/gifted.asp)
Massachusetts Massachusetts is in the process of developing policies for gifted
A5
Appendix B
Characteristics of the Gifted and Talented Program in Selected States
State Identification and Selection Criteria
programming in the state. (D. Modest, personal communication, May 18, 2005)
New Jersey Approved April 5, 2000: District boards of education shall make provisions for an ongoing identification process and appropriate educational challenges for Gifted and Talented students initiated in kindergarten and reviewed annually through grade 12. (New Jersey Association for Gifted Children Website, http://www.njagc.org/admin_school_law.html, 11/10/04) (Winter 1999) The identification process should reasonably identify 3% to 5% of the school population through multiple criteria:
1) Aptitude discovered through testing, special projects, teacher observation, student interest, and motivation, state or national standardized assessments;
2) Teacher recommendation; and 3) Self, peer, and/or parent nomination.
(New Jersey Department of Education Website, http://www.state.nj.us/njded/frameworks/arts/chap5.pdf. 11/16/04) -No exit criteria information
North Carolina Recommendation to AIG Program by educator, parent, or student using the following indicators:
1) Achievement 2) Aptitude 3) Scholastic Performance 4) Observation of Student 5) Student Interest/Motivation 6) Worksamples 7) Checklists
Criteria: 1) IQ/Aptitude – A full scale/composite score of 97th percentile or
above on a group or an individually administered (national norm) IQ test.
2) Aptitude and Achievement – The sum of the percentile scores for the battery scores on the nationally normed IQ/aptitude and achievement tests equal to or greater than 186.
3) Multiple criteria – The student’s scores must meet the minimum standard on any two of the following criteria.
a) 95th percentile on a nationally normed individual or group IQ/aptitude test,
b) 95th percentile on a nationally normed individual or group achievement test.
A6
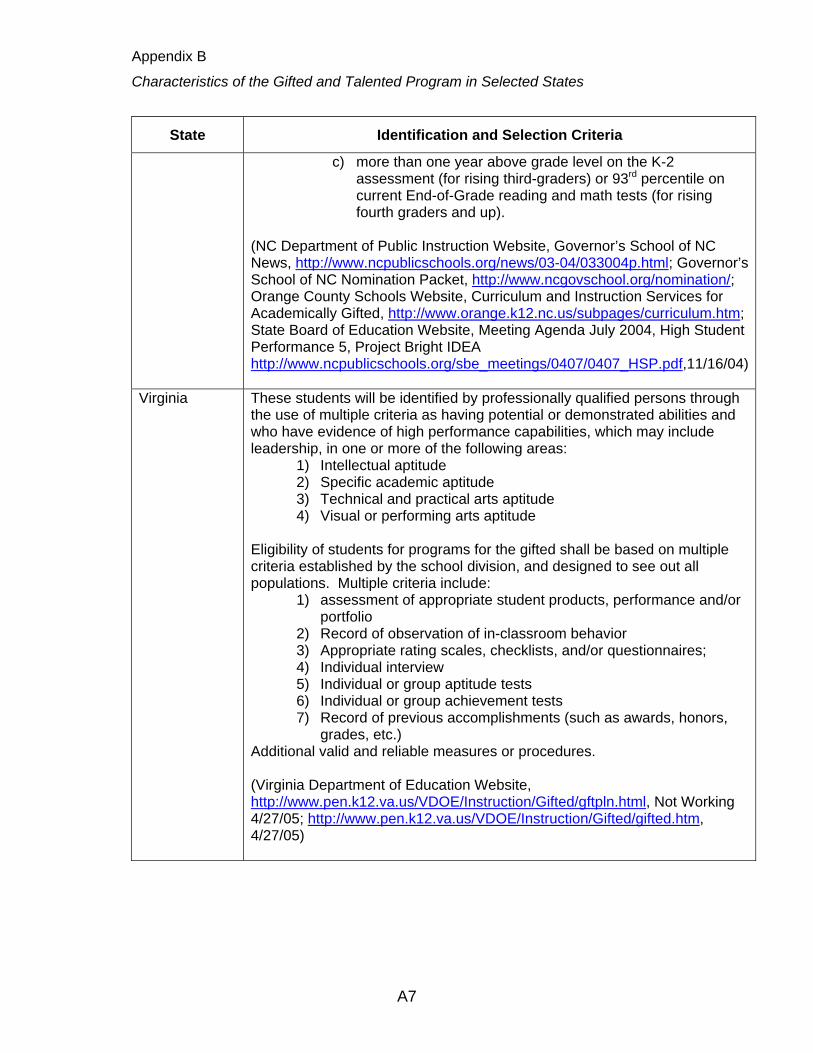
Appendix B
Characteristics of the Gifted and Talented Program in Selected States
State Identification and Selection Criteria
c) more than one year above grade level on the K-2 assessment (for rising third-graders) or 93rd percentile on current End-of-Grade reading and math tests (for rising fourth graders and up).
(NC Department of Public Instruction Website, Governor’s School of NC News, http://www.ncpublicschools.org/news/03-04/033004p.html; Governor’s School of NC Nomination Packet, http://www.ncgovschool.org/nomination/; Orange County Schools Website, Curriculum and Instruction Services for Academically Gifted, http://www.orange.k12.nc.us/subpages/curriculum.htm; State Board of Education Website, Meeting Agenda July 2004, High Student Performance 5, Project Bright IDEA http://www.ncpublicschools.org/sbe_meetings/0407/0407_HSP.pdf,11/16/04)
Virginia These students will be identified by professionally qualified persons through the use of multiple criteria as having potential or demonstrated abilities and who have evidence of high performance capabilities, which may include leadership, in one or more of the following areas:
1) Intellectual aptitude 2) Specific academic aptitude 3) Technical and practical arts aptitude 4) Visual or performing arts aptitude
Eligibility of students for programs for the gifted shall be based on multiple criteria established by the school division, and designed to see out all populations. Multiple criteria include:
1) assessment of appropriate student products, performance and/or portfolio
2) Record of observation of in-classroom behavior 3) Appropriate rating scales, checklists, and/or questionnaires; 4) Individual interview 5) Individual or group aptitude tests 6) Individual or group achievement tests 7) Record of previous accomplishments (such as awards, honors,
grades, etc.) Additional valid and reliable measures or procedures. (Virginia Department of Education Website, http://www.pen.k12.va.us/VDOE/Instruction/Gifted/gftpln.html, Not Working 4/27/05; http://www.pen.k12.va.us/VDOE/Instruction/Gifted/gifted.htm, 4/27/05)
A7
Appendix B
Characteristics of the Gifted and Talented Program in Selected States
State Profile of students served by grade, gender, ethnicity, and geographical location
South Carolina Number of gifted(03-04): 71,095 Race/ethnicity (03-04): White = 57.284
Black = 11,206 Other = 2,605
By Grade (02–03): Grade 3: 6,999
Grade 4: 10,259 Grade 5: 11,952 Grade 6: 10,283 Grade 7: 8,798 Grade 8: 8,594 Grade 9: 5,384 Grade 10: 4,206 Grade 11: 1,712 Grade 12: 1,167
Percent Gifted and Talented (03-04): African American: 15.76% White: 80.57% Other: 3.66
(Data provided by the Office of Research, South Carolina Department of Education)
Arkansas Number of gifted (03-04): 46,710 (Arkansas Department of Education Website, 2003-2004 Statewide Information System Database. http://adedata.k12.ar.us:8080/FY03_04/State/State%20Profile.ADE) Percent Gifted and Talented (99-00):
African – American: 15% Asian: 1% Latino: 2% Native American: < 0.5% White: 81%
(Education Trust Website, EdWatch Online 2004 State Summary Reports http://www2.edtrust.org/edtrust/summaries2004/Arkansas.pdf)
Connecticut Connecticut does not have a state-funded program for gifted students.
Florida Number of gifted (03-04): 46,710 Number of gifted: 116,880 Percent Gifted and Talented:
A8
Appendix B
Characteristics of the Gifted and Talented Program in Selected States
State Profile of students served by grade, gender, ethnicity, and geographical location
White = 63.17% Black = 9.61% Hispanic = 19.52 % Asian/PI = 4.23 % Am Ind/AN = 0.31 % Multiracial = 3.16%
(D. Smith, personal communication, May 16, 2005)
Number of gifted (02-03): 111,624 (5%) Number of gifted (03-04): 115,002 (4%) Free/reduced lunch: 21% LEP (Limited English Proficient): 3% (Florida Department of Education Website, http://www.firn.edu/doe/bin00014/pdf/state.pdf, 11/15/04)
Georgia Number of gifted (02–03): 104,673 Percent Gifted and Talented (02-03):
White = 74.86% Black = 15.21% Asian = 5.55% Hispanic = 2.20% American Indian = 0.15% Multi-Racial = 2.03%
(S. Krisel, personal communication, May 16, 2005)
Massachusetts They do not identify or serve gifted students. (The Davidson Institute for Talent Development Website, http://www.geniusdenied.com/StatePolicyDetails.aspx?StateCode=125&NavID=6_1)
New Jersey Number of gifted (99-00): 99,418 Percent Gifted and Talented:
African American 8% GT Asian 9% Latino 8% GT Native American <.5% GT White 75% GT
(The Education Trust- EdWatch Online 2004 State Summary Reports, http://www2.edtrust.org/edtrust/summaries2004/NewJersey.pdf)
A9
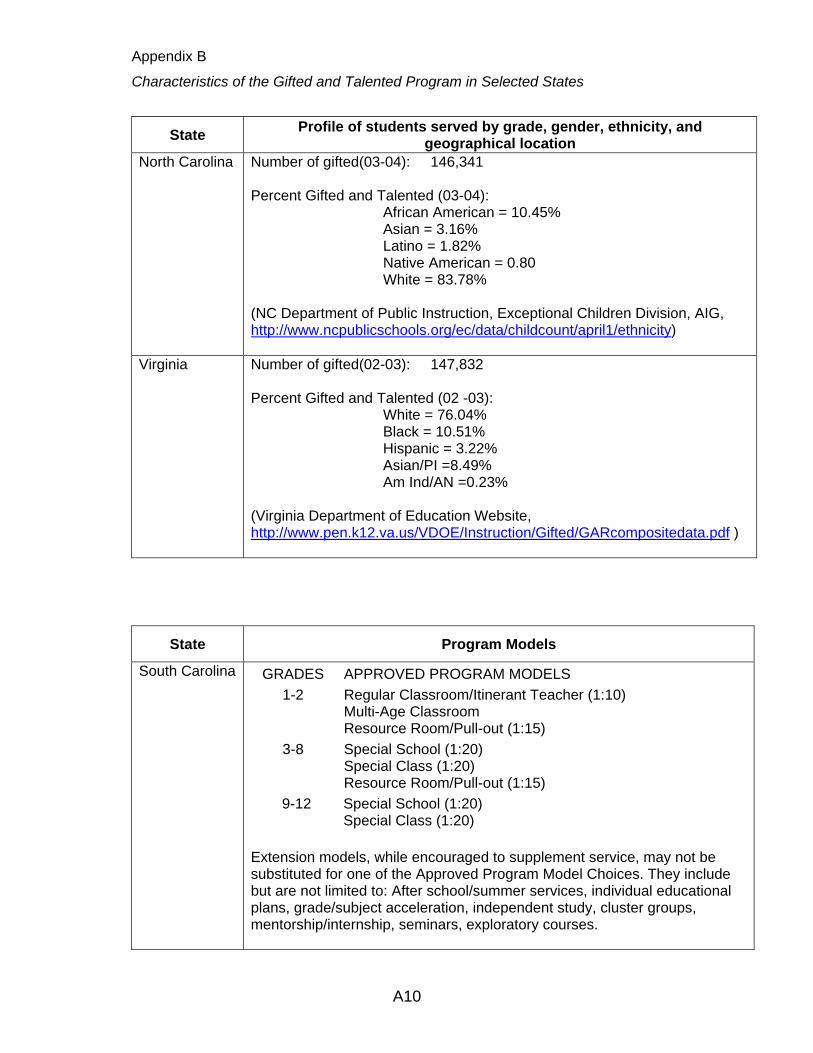
Appendix B
Characteristics of the Gifted and Talented Program in Selected States
State Profile of students served by grade, gender, ethnicity, and geographical location
North Carolina Number of gifted(03-04): 146,341 Percent Gifted and Talented (03-04):
African American = 10.45% Asian = 3.16% Latino = 1.82% Native American = 0.80 White = 83.78%
(NC Department of Public Instruction, Exceptional Children Division, AIG, http://www.ncpublicschools.org/ec/data/childcount/april1/ethnicity)
Virginia Number of gifted(02-03): 147,832 Percent Gifted and Talented (02 -03):
White = 76.04% Black = 10.51% Hispanic = 3.22% Asian/PI =8.49% Am Ind/AN =0.23%
(Virginia Department of Education Website, http://www.pen.k12.va.us/VDOE/Instruction/Gifted/GARcompositedata.pdf )
State Program Models
South Carolina GRADES APPROVED PROGRAM MODELS 1-2 Regular Classroom/Itinerant Teacher (1:10)
Multi-Age Classroom Resource Room/Pull-out (1:15)
3-8 Special School (1:20) Special Class (1:20) Resource Room/Pull-out (1:15)
9-12 Special School (1:20) Special Class (1:20)
Extension models, while encouraged to supplement service, may not be substituted for one of the Approved Program Model Choices. They include but are not limited to: After school/summer services, individual educational plans, grade/subject acceleration, independent study, cluster groups, mentorship/internship, seminars, exploratory courses.
A10
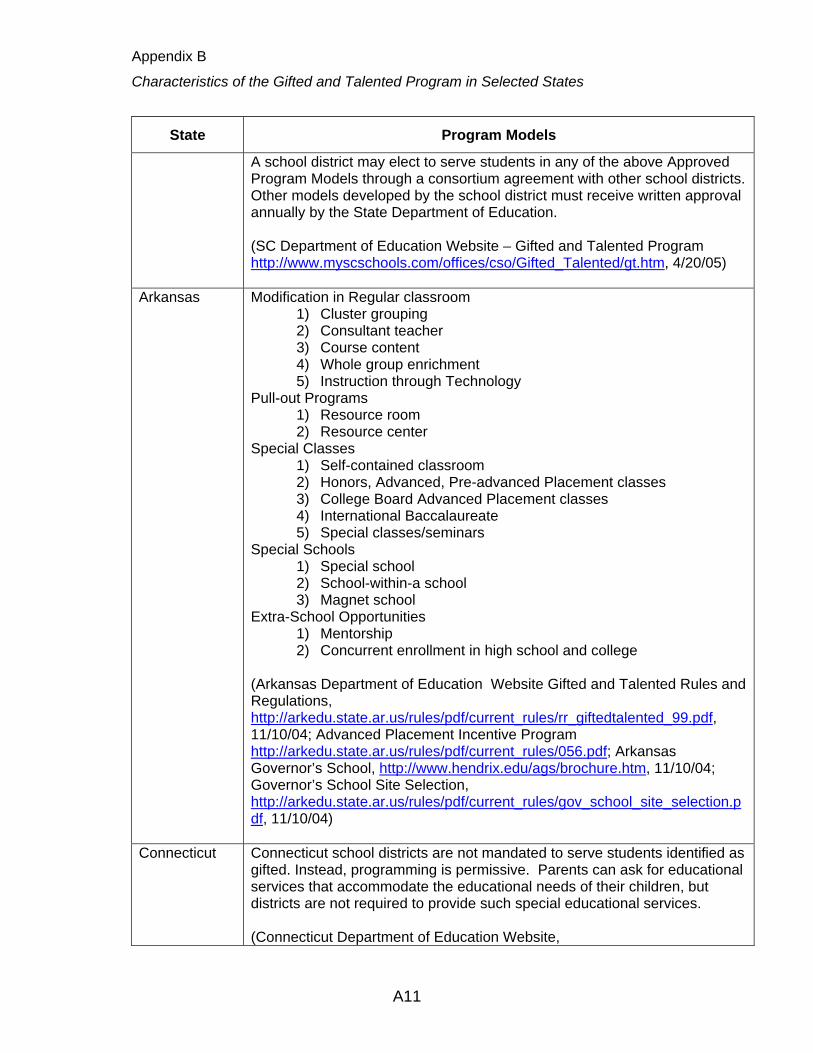
Appendix B
Characteristics of the Gifted and Talented Program in Selected States
State Program Models
A school district may elect to serve students in any of the above Approved Program Models through a consortium agreement with other school districts. Other models developed by the school district must receive written approval annually by the State Department of Education. (SC Department of Education Website – Gifted and Talented Program http://www.myscschools.com/offices/cso/Gifted_Talented/gt.htm, 4/20/05)
Arkansas Modification in Regular classroom 1) Cluster grouping 2) Consultant teacher 3) Course content 4) Whole group enrichment 5) Instruction through Technology
Pull-out Programs 1) Resource room 2) Resource center
Special Classes 1) Self-contained classroom 2) Honors, Advanced, Pre-advanced Placement classes 3) College Board Advanced Placement classes 4) International Baccalaureate 5) Special classes/seminars
Special Schools 1) Special school 2) School-within-a school 3) Magnet school
Extra-School Opportunities 1) Mentorship 2) Concurrent enrollment in high school and college
(Arkansas Department of Education Website Gifted and Talented Rules and Regulations, http://arkedu.state.ar.us/rules/pdf/current_rules/rr_giftedtalented_99.pdf, 11/10/04; Advanced Placement Incentive Program http://arkedu.state.ar.us/rules/pdf/current_rules/056.pdf; Arkansas Governor’s School, http://www.hendrix.edu/ags/brochure.htm, 11/10/04; Governor’s School Site Selection, http://arkedu.state.ar.us/rules/pdf/current_rules/gov_school_site_selection.pdf, 11/10/04)
Connecticut Connecticut school districts are not mandated to serve students identified as gifted. Instead, programming is permissive. Parents can ask for educational services that accommodate the educational needs of their children, but districts are not required to provide such special educational services. (Connecticut Department of Education Website,
A11
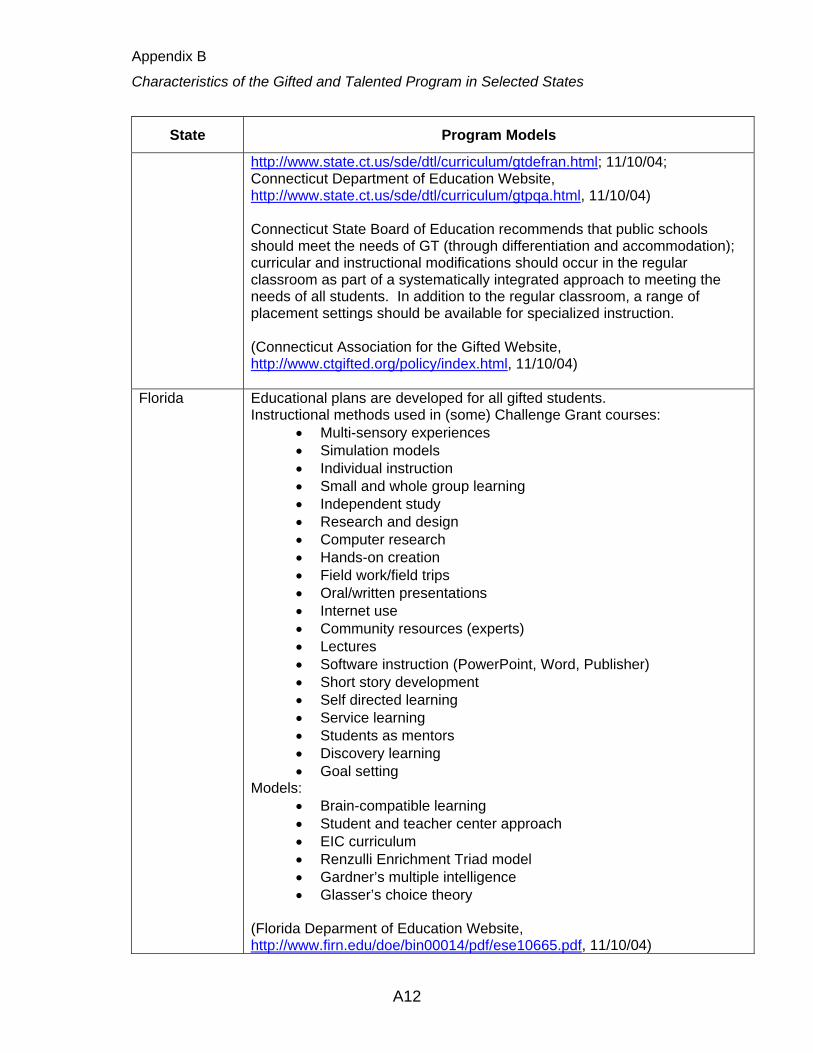
Appendix B
Characteristics of the Gifted and Talented Program in Selected States
State Program Models
http://www.state.ct.us/sde/dtl/curriculum/gtdefran.html; 11/10/04; Connecticut Department of Education Website, http://www.state.ct.us/sde/dtl/curriculum/gtpqa.html, 11/10/04) Connecticut State Board of Education recommends that public schools should meet the needs of GT (through differentiation and accommodation); curricular and instructional modifications should occur in the regular classroom as part of a systematically integrated approach to meeting the needs of all students. In addition to the regular classroom, a range of placement settings should be available for specialized instruction. (Connecticut Association for the Gifted Website, http://www.ctgifted.org/policy/index.html, 11/10/04)
Florida Educational plans are developed for all gifted students. Instructional methods used in (some) Challenge Grant courses:
• Multi-sensory experiences • Simulation models • Individual instruction • Small and whole group learning • Independent study • Research and design • Computer research • Hands-on creation • Field work/field trips • Oral/written presentations • Internet use • Community resources (experts) • Lectures • Software instruction (PowerPoint, Word, Publisher) • Short story development • Self directed learning • Service learning • Students as mentors • Discovery learning • Goal setting
Models: • Brain-compatible learning • Student and teacher center approach • EIC curriculum • Renzulli Enrichment Triad model • Gardner’s multiple intelligence • Glasser’s choice theory
(Florida Deparment of Education Website, http://www.firn.edu/doe/bin00014/pdf/ese10665.pdf, 11/10/04)
A12
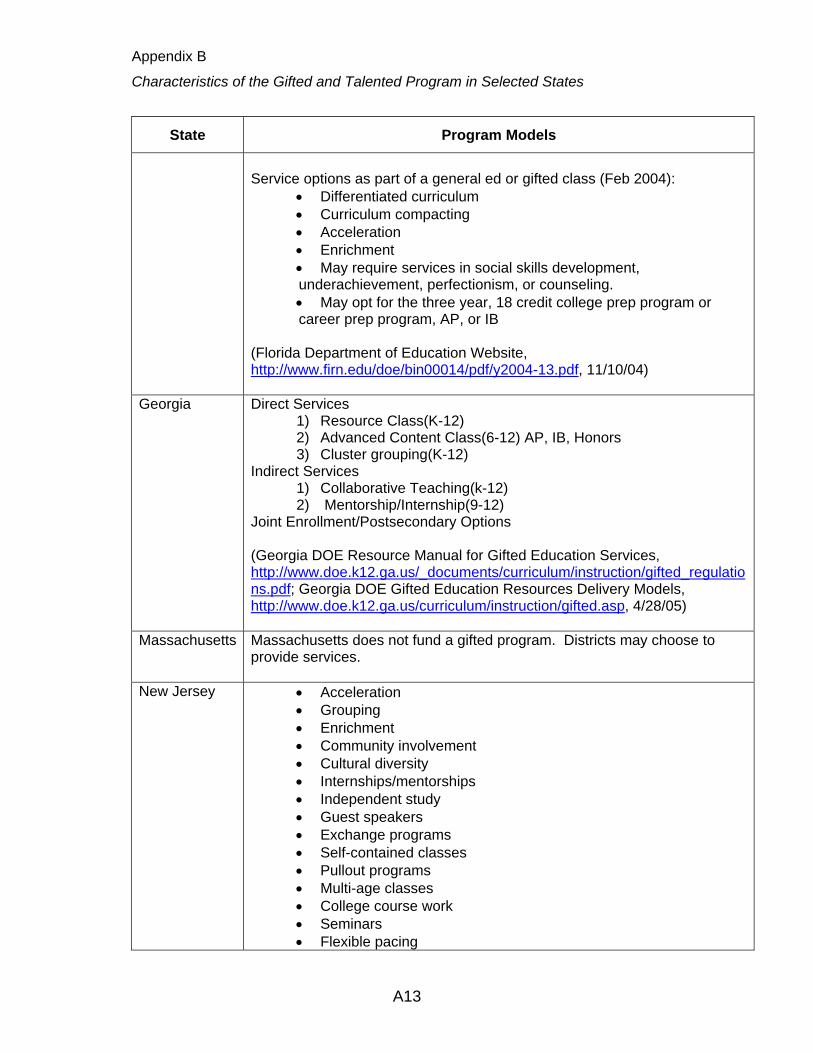
Appendix B
Characteristics of the Gifted and Talented Program in Selected States
State Program Models
Service options as part of a general ed or gifted class (Feb 2004):
• Differentiated curriculum • Curriculum compacting • Acceleration • Enrichment • May require services in social skills development, underachievement, perfectionism, or counseling. • May opt for the three year, 18 credit college prep program or career prep program, AP, or IB
(Florida Department of Education Website, http://www.firn.edu/doe/bin00014/pdf/y2004-13.pdf, 11/10/04)
Georgia Direct Services 1) Resource Class(K-12) 2) Advanced Content Class(6-12) AP, IB, Honors 3) Cluster grouping(K-12)
Indirect Services 1) Collaborative Teaching(k-12) 2) Mentorship/Internship(9-12)
Joint Enrollment/Postsecondary Options (Georgia DOE Resource Manual for Gifted Education Services, http://www.doe.k12.ga.us/_documents/curriculum/instruction/gifted_regulations.pdf; Georgia DOE Gifted Education Resources Delivery Models, http://www.doe.k12.ga.us/curriculum/instruction/gifted.asp, 4/28/05)
Massachusetts Massachusetts does not fund a gifted program. Districts may choose to provide services.
New Jersey • Acceleration • Grouping • Enrichment • Community involvement • Cultural diversity • Internships/mentorships • Independent study • Guest speakers • Exchange programs • Self-contained classes • Pullout programs • Multi-age classes • College course work • Seminars • Flexible pacing
A13

Appendix B
Characteristics of the Gifted and Talented Program in Selected States
State Program Models
• Content acceleration • Advanced thinking processes • Resource centers • Compacting • Alternate learning activities • Cluster scheduling Frameworks written 1998-1999
(New Jersey Department of Education Website, http://www.state.nj.us/njded/frameworks/, 11/16/04)
North Carolina Elementary Schools 1) Consultation 2) Pull out 3) Self-contained 4) Special projects 5) Independent Study
Middle School 1) Advanced classes 2) Integrated Instructional Program
High School 1) Honors classes 2) Honors Seminars 3) Advanced placement 4) Early graduation 5) Early admission 6) Dual Enrollment
UNC-G Fast Forward, UNC-Chapel Hill, U-STARS, Jacob K. Javits (US Department of Education Website, http://www.ed.gov/programs/javits/grants2003.doc, 11/12/04) Gifted and Talented Development Center at Queens College, High Student Performance 5, Project Bright IDEA (North Carolina State Board of Education Website, Meeting Agenda July 2004, http://www.ncpublicschools.org/sbe_meetings/0407/0407_HSP.pdf; Charlotte Mecklenburg Schools Website, http://www.cms.k12.nc.us/programs/magnet/magnet.asp?PK_Category=11, 11/12/04; Orange County Schools Website, Curriculum and Instruction Services for Academically Gifted, http://www.orange.k12.nc.us/instruction/ag/ag.htm, 11/16/04; NC Department of Public Instruction Website, http://www.ncpublicschools.org/curriculum/downloads/operatingprocedures.pdf, 11/16/04 [Link not working 4/28/05] http://www.ncpublicschools.org/curriculum/, 4/28/05; NC Department of Public Instruction, Exceptional Children Division, AIG,
A14
Appendix B
Characteristics of the Gifted and Talented Program in Selected States
State Program Models
http://www.ncpublicschools.org/ec/exceptionality/gifted/, 11/16/04)
Virginia Service options: 1) special classes provided on a part-time basis 2) differentiation in the regular classroom 3) honors or advanced level courses 4) full-time classes (center or school based) 5) seminars and special workshops 6) mentorship 7) independent study 8) counseling sessions 9) access to secondary level specialized programs (ie Governor’s
school)
(Virginia Department of Education Website, http://www.pen.k12.va.us/VDOE/Instruction/Gifted/gftpln.html)
State Teacher Characteristics and Profile
South Carolina A) Teachers must hold valid teaching certificates appropriate to the grade level(s) or subject area(s) included in the program.
B) Each teacher of a state funded gifted and talented course or class shall have completed a training program approved by the State Department of Education (6 graduate hours).
Exception 1: Newly assigned teachers will have one year to meet gifted and talented training requirements
Exception 2: Teachers who have experience in gifted and talented courses/classes may have this requirement waived upon approval of credentials by the State Department of Education.
C) Professional Development: Appropriate ongoing staff development activities shall be provided by the district.
(South Carolina Department of Education Website, Gifted and Talented Program http://www.myscschools.com/offices/cso/Gifted_Talented/gt.htm, 4/20/05)
Arkansas Minimum standards for an approved teacher of the gifted: 1) Certification 2) Pass appropriate state approved assessments 3) Meet standards for add-on endorsement in gifted education (18
graduate hours). Specific courses are not stipulated; however the following areas must be included:
A15
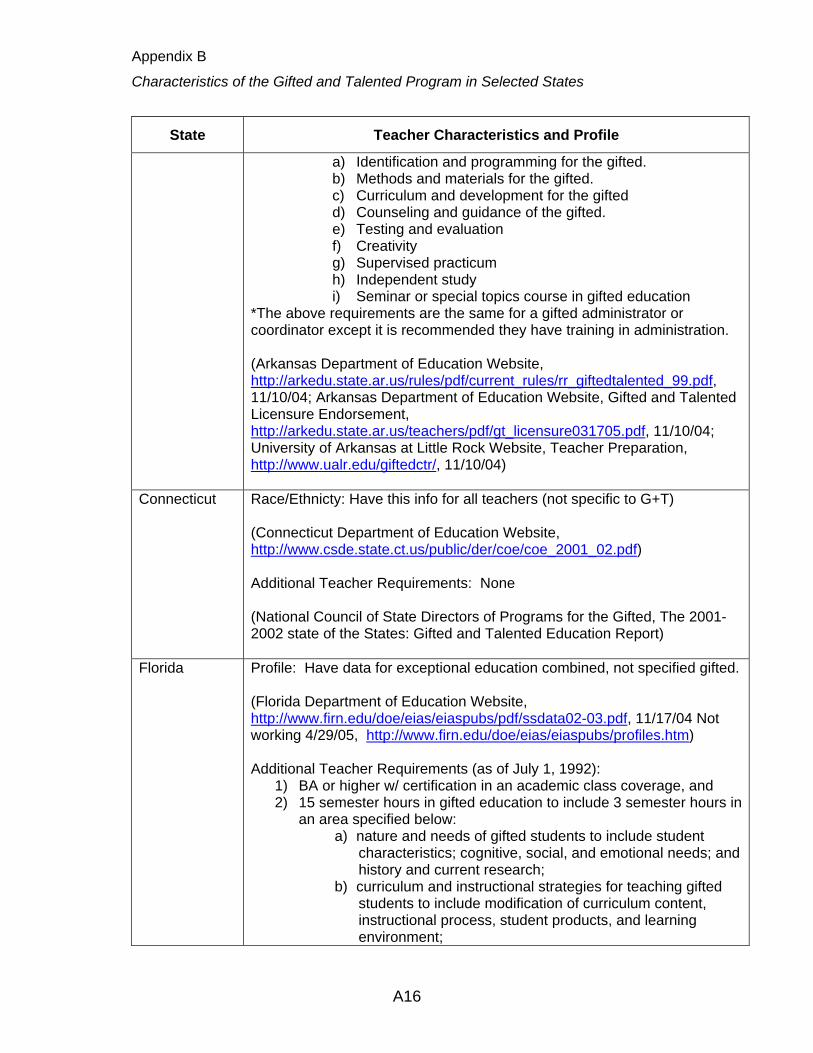
Appendix B
Characteristics of the Gifted and Talented Program in Selected States
State Teacher Characteristics and Profile
a) Identification and programming for the gifted. b) Methods and materials for the gifted. c) Curriculum and development for the gifted d) Counseling and guidance of the gifted. e) Testing and evaluation f) Creativity g) Supervised practicum h) Independent study i) Seminar or special topics course in gifted education
*The above requirements are the same for a gifted administrator or coordinator except it is recommended they have training in administration. (Arkansas Department of Education Website, http://arkedu.state.ar.us/rules/pdf/current_rules/rr_giftedtalented_99.pdf, 11/10/04; Arkansas Department of Education Website, Gifted and Talented Licensure Endorsement, http://arkedu.state.ar.us/teachers/pdf/gt_licensure031705.pdf, 11/10/04; University of Arkansas at Little Rock Website, Teacher Preparation, http://www.ualr.edu/giftedctr/, 11/10/04)
Connecticut Race/Ethnicty: Have this info for all teachers (not specific to G+T) (Connecticut Department of Education Website, http://www.csde.state.ct.us/public/der/coe/coe_2001_02.pdf) Additional Teacher Requirements: None (National Council of State Directors of Programs for the Gifted, The 2001-2002 state of the States: Gifted and Talented Education Report)
Florida Profile: Have data for exceptional education combined, not specified gifted. (Florida Department of Education Website, http://www.firn.edu/doe/eias/eiaspubs/pdf/ssdata02-03.pdf, 11/17/04 Not working 4/29/05, http://www.firn.edu/doe/eias/eiaspubs/profiles.htm) Additional Teacher Requirements (as of July 1, 1992):
1) BA or higher w/ certification in an academic class coverage, and 2) 15 semester hours in gifted education to include 3 semester hours in
an area specified below: a) nature and needs of gifted students to include student
characteristics; cognitive, social, and emotional needs; and history and current research;
b) curriculum and instructional strategies for teaching gifted students to include modification of curriculum content, instructional process, student products, and learning environment;
A16
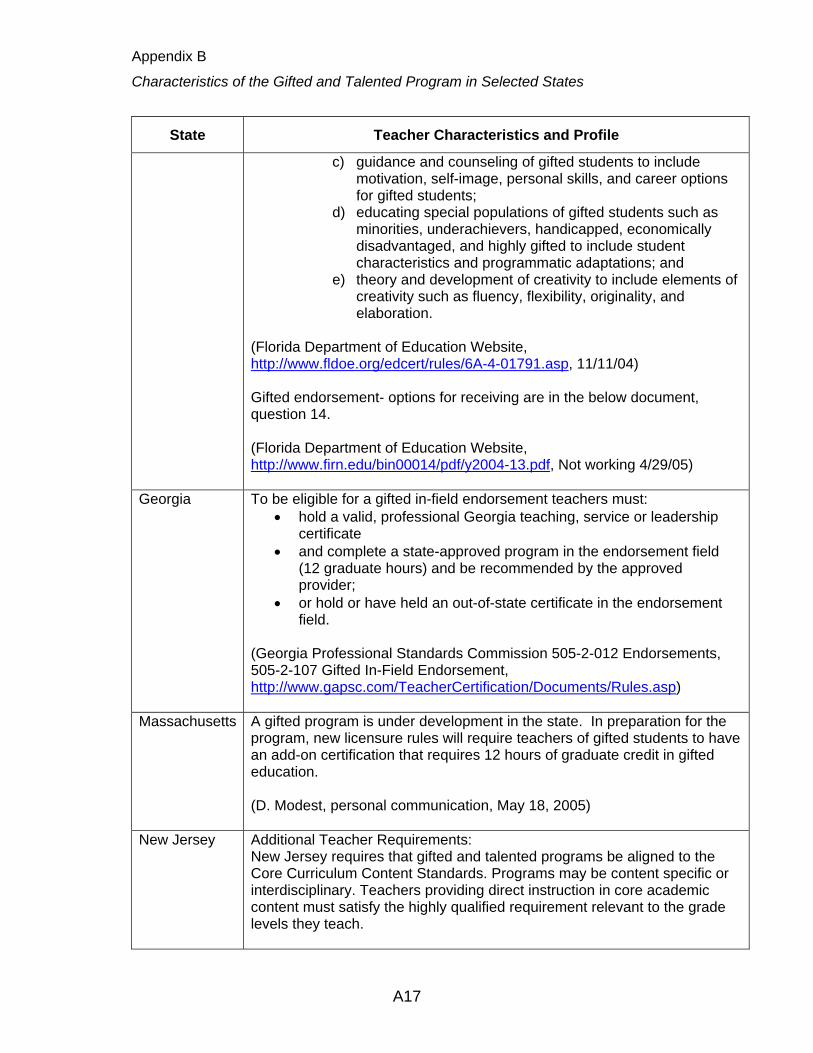
Appendix B
Characteristics of the Gifted and Talented Program in Selected States
State Teacher Characteristics and Profile
c) guidance and counseling of gifted students to include motivation, self-image, personal skills, and career options for gifted students;
d) educating special populations of gifted students such as minorities, underachievers, handicapped, economically disadvantaged, and highly gifted to include student characteristics and programmatic adaptations; and
e) theory and development of creativity to include elements of creativity such as fluency, flexibility, originality, and elaboration.
(Florida Department of Education Website, http://www.fldoe.org/edcert/rules/6A-4-01791.asp, 11/11/04) Gifted endorsement- options for receiving are in the below document, question 14. (Florida Department of Education Website, http://www.firn.edu/bin00014/pdf/y2004-13.pdf, Not working 4/29/05)
Georgia To be eligible for a gifted in-field endorsement teachers must: • hold a valid, professional Georgia teaching, service or leadership
certificate • and complete a state-approved program in the endorsement field
(12 graduate hours) and be recommended by the approved provider;
• or hold or have held an out-of-state certificate in the endorsement field.
(Georgia Professional Standards Commission 505-2-012 Endorsements, 505-2-107 Gifted In-Field Endorsement, http://www.gapsc.com/TeacherCertification/Documents/Rules.asp)
Massachusetts A gifted program is under development in the state. In preparation for the program, new licensure rules will require teachers of gifted students to have an add-on certification that requires 12 hours of graduate credit in gifted education. (D. Modest, personal communication, May 18, 2005)
New Jersey Additional Teacher Requirements: New Jersey requires that gifted and talented programs be aligned to the Core Curriculum Content Standards. Programs may be content specific or interdisciplinary. Teachers providing direct instruction in core academic content must satisfy the highly qualified requirement relevant to the grade levels they teach.
A17
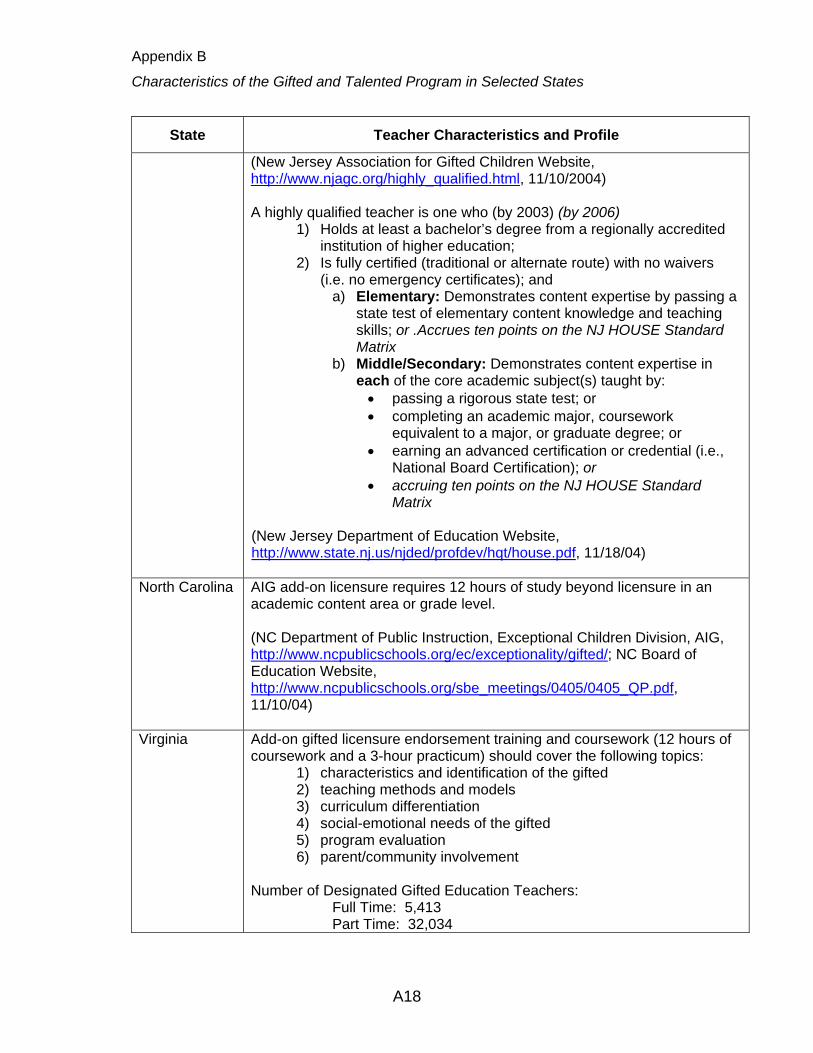
Appendix B
Characteristics of the Gifted and Talented Program in Selected States
State Teacher Characteristics and Profile
(New Jersey Association for Gifted Children Website, http://www.njagc.org/highly_qualified.html, 11/10/2004) A highly qualified teacher is one who (by 2003) (by 2006)
1) Holds at least a bachelor’s degree from a regionally accredited institution of higher education;
2) Is fully certified (traditional or alternate route) with no waivers (i.e. no emergency certificates); and
a) Elementary: Demonstrates content expertise by passing a state test of elementary content knowledge and teaching skills; or .Accrues ten points on the NJ HOUSE Standard Matrix
b) Middle/Secondary: Demonstrates content expertise in each of the core academic subject(s) taught by: • passing a rigorous state test; or • completing an academic major, coursework
equivalent to a major, or graduate degree; or • earning an advanced certification or credential (i.e.,
National Board Certification); or • accruing ten points on the NJ HOUSE Standard
Matrix (New Jersey Department of Education Website, http://www.state.nj.us/njded/profdev/hqt/house.pdf, 11/18/04)
North Carolina AIG add-on licensure requires 12 hours of study beyond licensure in an academic content area or grade level. (NC Department of Public Instruction, Exceptional Children Division, AIG, http://www.ncpublicschools.org/ec/exceptionality/gifted/; NC Board of Education Website, http://www.ncpublicschools.org/sbe_meetings/0405/0405_QP.pdf, 11/10/04)
Virginia Add-on gifted licensure endorsement training and coursework (12 hours of coursework and a 3-hour practicum) should cover the following topics:
1) characteristics and identification of the gifted 2) teaching methods and models 3) curriculum differentiation 4) social-emotional needs of the gifted 5) program evaluation 6) parent/community involvement
Number of Designated Gifted Education Teachers:
Full Time: 5,413 Part Time: 32,034
A18
Appendix B
Characteristics of the Gifted and Talented Program in Selected States
State Teacher Characteristics and Profile
(Virginia Department of Education Website, http://www.pen.k12.va.us/VDOE/Instruction/Gifted/gftplna.html#1Regs, Not working 5/4/05; Virginia Department of Education Website, http://www.pen.k12.va.us/VDOE/Instruction/Gifted/GARcompositedata.pdf, Not Working 5/3/05)
State Funding
South Carolina $26,056,345 for gifted students (2003-2004) (Office of Finance, South Carolina Department of Education)
Arkansas Local school districts shall expend for gifted and talented programs from state and local revenues not less than the previous year's ADM participating in gifted and talented programs, up to five percent (5%) of the previous year's ADM, multiplied by fifteen hundredths 1 5) times the Base Local Revenue Per Student. (Arkansas DOE http://arkedu.state.ar.us/rules/pdf/current_rules/042.pdf, 11/17/04; Jacob K. Javits Education Grant Program, http://www.ed.gov/programs/javits/grants2003.doc, 11/17/04)
Connecticut No state funding is provided for gifted programs
Florida Challenge Grant=$10,000 per awarded school (Florida Department of Education, http://info.fldoe.org/dscgi/ds.py/Get/File-1628/DPS_04-043rfp.pdf) -no additional information on funds allocated to gifted programs Districts spend a percentage of state-allocated special education funds on gifted programs. The specific percentage is determined by each district. (The Davidson Institute for Talent Development, http://www.geniusdenied.com/StatePolicyDetails.aspx?StateCode=113&NavID=6_1)
Georgia FY 2004 - $155,000,000 spent for gifted education (S. Krisel, personal communication, May 16, 2005)
Massachusetts None.
A19
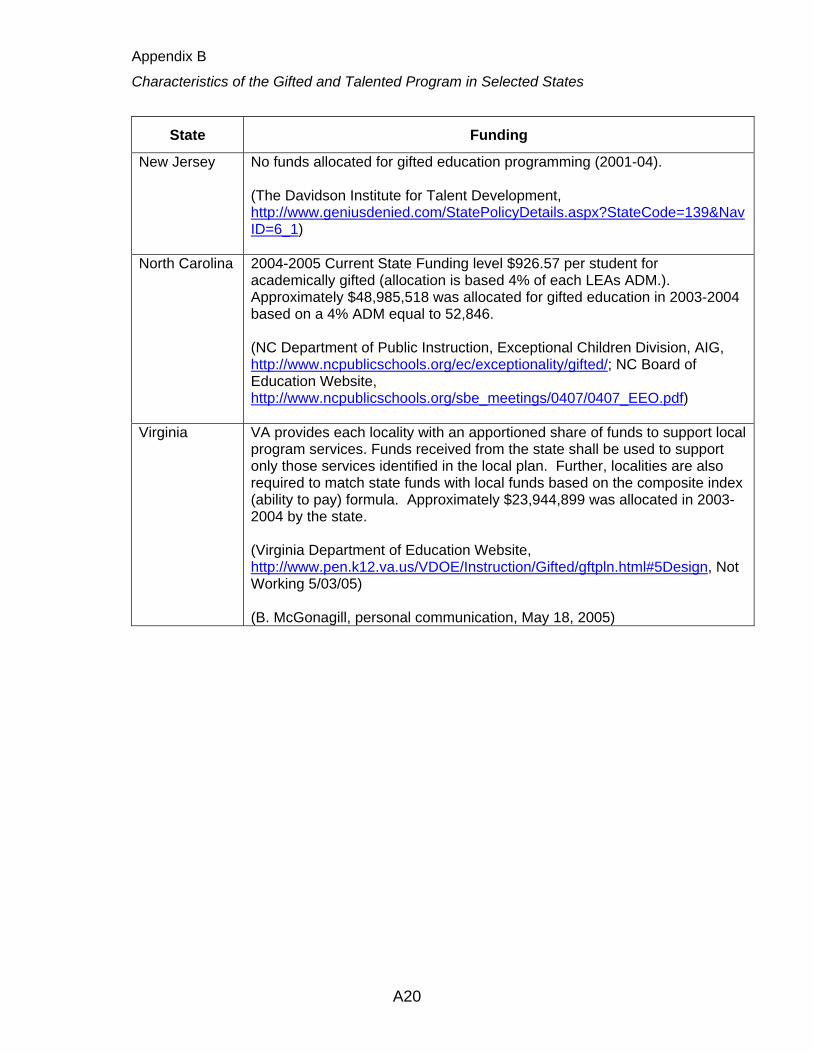
Appendix B
Characteristics of the Gifted and Talented Program in Selected States
State Funding
New Jersey No funds allocated for gifted education programming (2001-04). (The Davidson Institute for Talent Development, http://www.geniusdenied.com/StatePolicyDetails.aspx?StateCode=139&NavID=6_1)
North Carolina 2004-2005 Current State Funding level $926.57 per student for academically gifted (allocation is based 4% of each LEAs ADM.). Approximately $48,985,518 was allocated for gifted education in 2003-2004 based on a 4% ADM equal to 52,846. (NC Department of Public Instruction, Exceptional Children Division, AIG, http://www.ncpublicschools.org/ec/exceptionality/gifted/; NC Board of Education Website, http://www.ncpublicschools.org/sbe_meetings/0407/0407_EEO.pdf)
Virginia VA provides each locality with an apportioned share of funds to support local program services. Funds received from the state shall be used to support only those services identified in the local plan. Further, localities are also required to match state funds with local funds based on the composite index (ability to pay) formula. Approximately $23,944,899 was allocated in 2003-2004 by the state. (Virginia Department of Education Website, http://www.pen.k12.va.us/VDOE/Instruction/Gifted/gftpln.html#5Design, Not Working 5/03/05) (B. McGonagill, personal communication, May 18, 2005)
A20
Appendix C
South Carolina Gifted and Talented Disaggregated Student Counts by District and Year
Fiscal Gender Ethnicity Lunch Status Disabled Total
District Year Female Male White Af. Am. Other Free Reduced Paid Students Students Abbeville 2002 72 88 138 18 4 33 9 118 3 160
2003 88 101 167 18 4 37 14 138 1 1892004 115 109 190 28 6 55 23 146 3 224
Aiken 2002 1,893 1,636 3,026 408 95 411 154 2,964 54 3,529
2003 1,882 1,632 2,970 436 108 461 151 2,902 61 3,5142004 2,004 1,661 3,061 483 121 538 187 2,940 66 3,665
Allendale 2002 71 41 16 91 5 68 11 33 4 112
2003 42 22 10 53 1 38 7 19 1 642004 21 13 5 28 1 23 2 9 0 34
Anderson 1 2002 573 511 1,043 21 20 88 34 962 13 1,084
2003 600 532 1,079 34 19 88 49 995 14 1,1322004 721 630 1,297 29 25 118 68 1,165 18 1,351
Anderson 2 2002 206 177 357 23 3 37 16 330 9 383
2003 242 199 407 29 5 37 19 385 11 4412004 252 209 423 33 5 69 21 371 11 461
Anderson 3 2002 101 89 179 11 0 25 17 148 0 190
2003 110 94 192 11 1 35 18 151 0 2042004 118 103 211 10 0 40 13 168 2 221
Anderson 4 2002 173 114 260 22 5 37 20 230 4 287
2003 174 136 282 25 3 43 19 248 8 3102004 168 136 273 27 4 38 18 248 6 304
Anderson 5 2002 628 568 1,061 106 29 93 30 1,073 24 1,196
2003 578 525 978 96 29 111 41 951 22 1,1032004 535 493 899 105 24 120 52 856 16 1,028
Bamberg 1 2002 62 40 70 30 2 22 7 73 4 102
2003 52 52 73 29 2 15 8 81 3 1042004 52 46 67 29 2 18 6 74 1 98
A21
Appendix C
South Carolina Gifted and Talented Disaggregated Student Counts by District and Year
Fiscal Gender Ethnicity Lunch Status Disabled Total
District Year Female Male White Af. Am. Other Free Reduced Paid Students Students Bamberg 2 2002 8 10 0 18 0 11 3 4 0 18
2003 30 18 0 48 0 32 6 10 0 482004 31 21 0 52 0 38 5 9 0 52
Barnwell 19 2002 33 27 18 41 1 30 9 21 2 60 2003 27
25 16 36 0 28 8 16 2 522004 26 18 13 31 0 24 8 12 2 44
Barnwell 29 2002 36 50 62 24 0 26 7 53 6 86 2003 43
52 64 30 1 31 7 57 6 952004 41 46 57 30 0 28 10 49 6 87
Barnwell 45 2002 75 74 128 18 3 17 10 122 1 149 2003 72
68 115 21 4 20 12 108 2 1402004 65 78 122 16 5 21 17 105 2 143
Beaufort 2002 947 817 1,278 409 77 324 114 1,326 43 1,764
2003 1,102 899 1,474 437 90 346 148 1,507 41 2,0012004 1,247 1,002 1,625 502 122 397 161 1,691 41 2,249
Berkeley 2002 858 796 1,318 247 89 268 169 1,217 38 1,654
2003 799 804 1,276 240 87 288 164 1,151 36 1,6032004 887 828 1,350 270 95 342 172 1,201 41 1,715
Calhoun 2002 51 25 39 36 1 21 10 45 1 76
2003 59 36 45 46 4 39 14 42 1 952004 61 28 38 46 5 38 10 41 0 89
Charleston 2002 2,127 1,948 3,281 627 167 386 145 3,544 134 4,075
2003 2,706 2,558 4,153 874 237 580 217 4,467 151 5,2642004 3,087 2,915 4,645 1,064 293 744 247 5,011 170 6,002
Cherokee 2002 533 465 882 99 17 181 66 751 11 998
2003 528 452 859 96 25 186 77 717 9 9802004 585 489 937 111 26 226 93 755 13 1,074
A22
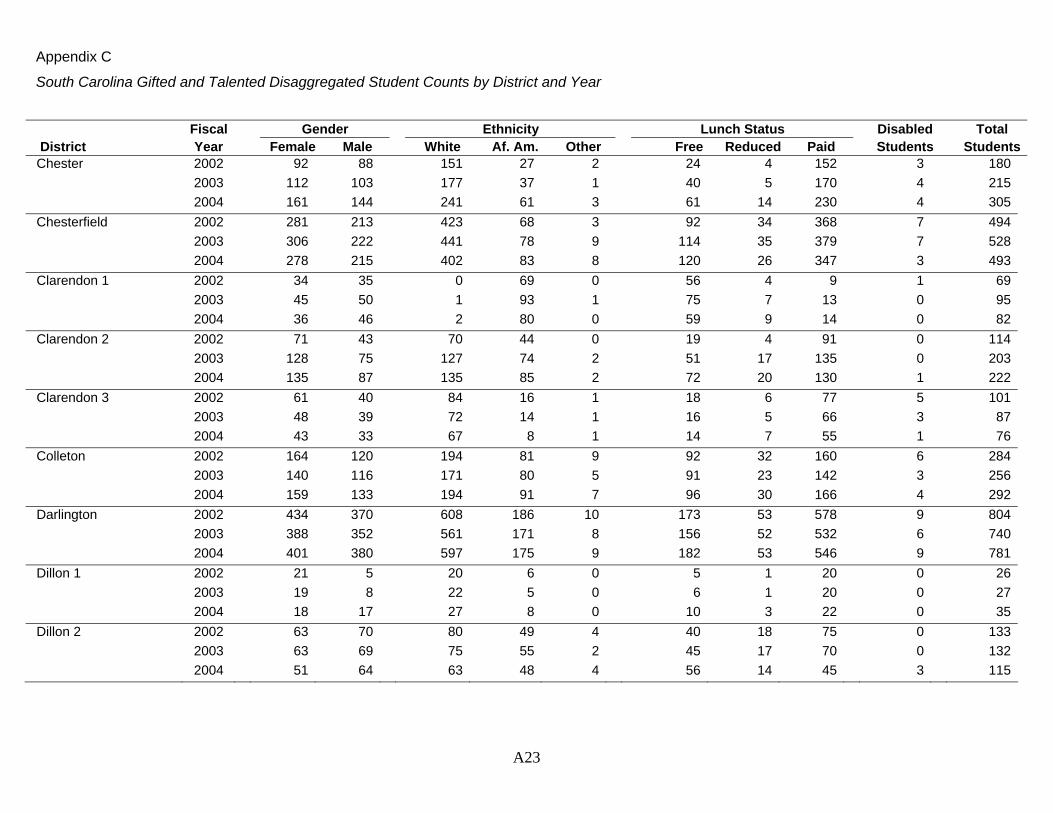
Appendix C
South Carolina Gifted and Talented Disaggregated Student Counts by District and Year
Fiscal Gender Ethnicity Lunch Status Disabled Total
District Year Female Male White Af. Am. Other Free Reduced Paid Students Students Chester 2002 92 88 151 27 2 24 4 152 3 180
2003 112 103 177 37 1 40 5 170 4 2152004 161 144 241 61 3 61 14 230 4 305
Chesterfield 2002 281 213 423 68 3 92 34 368 7 494 2003 306
222 441 78 9 114 35 379 7 5282004 278 215 402 83 8 120 26 347 3 493
Clarendon 1 2002 34 35 0 69 0 56 4 9 1 69 2003 45
50 1 93 1 75 7 13 0 952004 36 46 2 80 0 59 9 14 0 82
Clarendon 2 2002 71 43 70 44 0 19 4 91 0 114 2003 128
75 127 74 2 51 17 135 0 2032004 135 87 135 85 2 72 20 130 1 222
Clarendon 3 2002 61 40 84 16 1 18 6 77 5 101 2003 48
39 72 14 1 16 5 66 3 872004 43 33 67 8 1 14 7 55 1 76
Colleton 2002 164 120 194 81 9 92 32 160 6 284
2003 140 116 171 80 5 91 23 142 3 2562004 159 133 194 91 7 96 30 166 4 292
Darlington 2002 434 370 608 186 10 173 53 578 9 804
2003 388 352 561 171 8 156 52 532 6 7402004 401 380 597 175 9 182 53 546 9 781
Dillon 1 2002 21 5 20 6 0 5 1 20 0 26
2003 19 8 22 5 0 6 1 20 0 272004 18 17 27 8 0 10 3 22 0 35
Dillon 2 2002 63 70 80 49 4 40 18 75 0 133
2003 63 69 75 55 2 45 17 70 0 1322004 51 64 63 48 4 56 14 45 3 115
A23
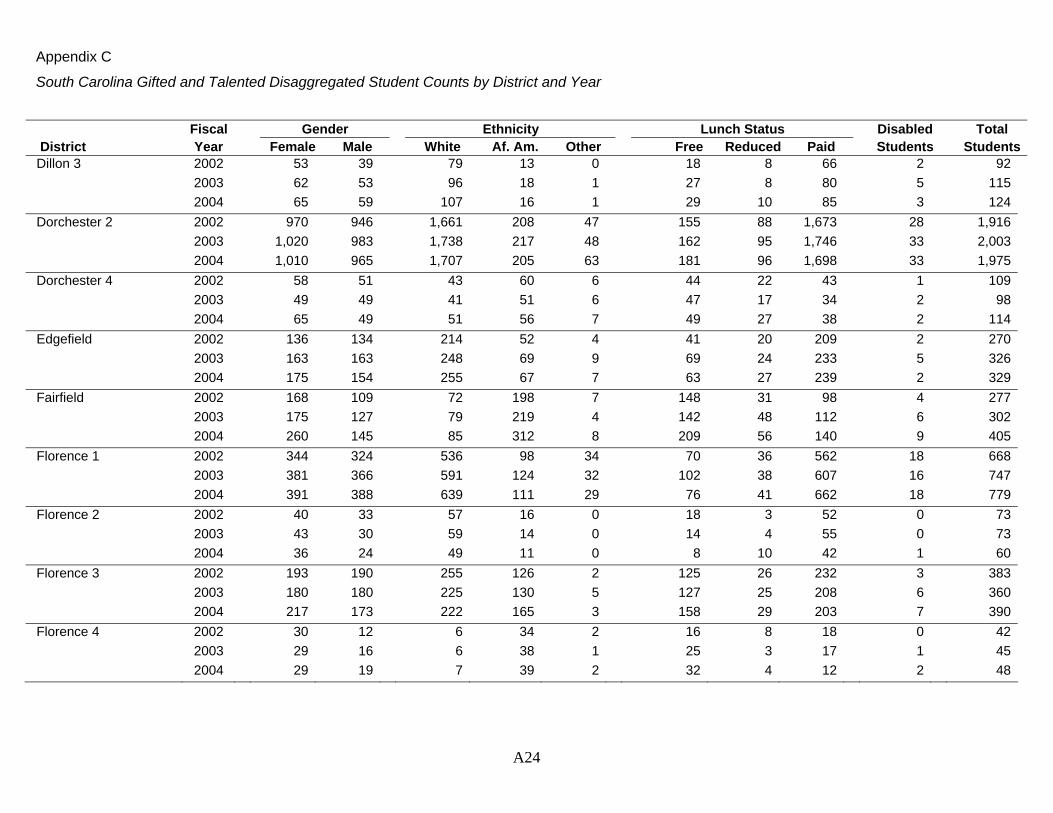
Appendix C
South Carolina Gifted and Talented Disaggregated Student Counts by District and Year
Fiscal Gender Ethnicity Lunch Status Disabled Total
District Year Female Male White Af. Am. Other Free Reduced Paid Students Students Dillon 3 2002 53 39 79 13 0 18 8 66 2 92
2003 62 53 96 18 1 27 8 80 5 1152004 65 59 107 16 1 29 10 85 3 124
Dorchester 2 2002 970 946 1,661 208 47 155 88 1,673 28 1,916 2003 1,020
983 1,738 217 48 162 95 1,746 33 2,0032004 1,010 965 1,707 205 63 181 96 1,698 33 1,975
Dorchester 4 2002 58 51 43 60 6 44 22 43 1 109 2003 49
49 41 51 6 47 17 34 2 982004 65 49 51 56 7 49 27 38 2 114
Edgefield 2002 136 134 214 52 4 41 20 209 2 270
2003 163 163 248 69 9 69 24 233 5 3262004 175 154 255 67 7 63 27 239 2 329
Fairfield 2002 168 109 72 198 7 148 31 98 4 277
2003 175 127 79 219 4 142 48 112 6 3022004 260 145 85 312 8 209 56 140 9 405
Florence 1 2002 344 324 536 98 34 70 36 562 18 668
2003 381 366 591 124 32 102 38 607 16 7472004 391 388 639 111 29 76 41 662 18 779
Florence 2 2002 40 33 57 16 0 18 3 52 0 73
2003 43 30 59 14 0 14 4 55 0 732004 36 24 49 11 0 8 10 42 1 60
Florence 3 2002 193 190 255 126 2 125 26 232 3 383
2003 180 180 225 130 5 127 25 208 6 3602004 217 173 222 165 3 158 29 203 7 390
Florence 4 2002 30 12 6 34 2 16 8 18 0 42
2003 29 16 6 38 1 25 3 17 1 452004 29 19 7 39 2 32 4 12 2 48
A24
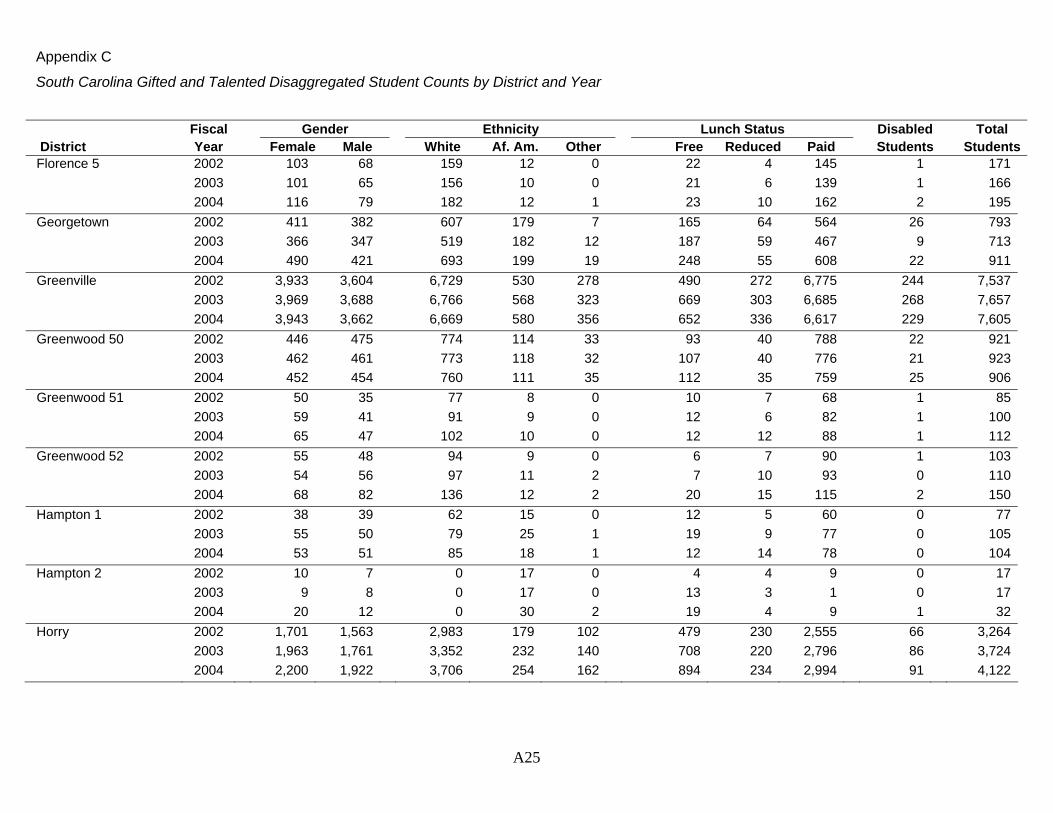
Appendix C
South Carolina Gifted and Talented Disaggregated Student Counts by District and Year
Fiscal Gender Ethnicity Lunch Status Disabled Total
District Year Female Male White Af. Am. Other Free Reduced Paid Students Students Florence 5 2002 103 68 159 12 0 22 4 145 1 171
2003 101 65 156 10 0 21 6 139 1 1662004 116 79 182 12 1 23 10 162 2 195
Georgetown 2002 411 382 607 179 7 165 64 564 26 793 2003 366
347 519 182 12 187 59 467 9 7132004 490 421 693 199 19 248 55 608 22 911
Greenville 2002 3,933 3,604 6,729 530 278 490 272 6,775 244 7,537
2003 3,969 3,688 6,766 568 323 669 303 6,685 268 7,6572004 3,943 3,662 6,669 580 356 652 336 6,617 229 7,605
Greenwood 50 2002 446 475 774 114 33 93 40 788 22 921 2003 462
461 773 118 32 107 40 776 21 9232004 452 454 760 111 35 112 35 759 25 906
Greenwood 51 2002 50 35 77 8 0 10 7 68 1 85 2003 59
41 91 9 0 12 6 82 1 1002004 65 47 102 10 0 12 12 88 1 112
Greenwood 52 2002 55 48 94 9 0 6 7 90 1 103 2003 54
56 97 11 2 7 10 93 0 1102004 68 82 136 12 2 20 15 115 2 150
Hampton 1 2002 38 39 62 15 0 12 5 60 0 77
2003 55 50 79 25 1 19 9 77 0 1052004 53 51 85 18 1 12 14 78 0 104
Hampton 2 2002 10 7 0 17 0 4 4 9 0 17
2003 9 8 0 17 0 13 3 1 0 172004 20 12 0 30 2 19 4 9 1 32
Horry 2002 1,701 1,563 2,983 179 102 479 230 2,555 66 3,264
2003 1,963 1,761 3,352 232 140 708 220 2,796 86 3,7242004 2,200 1,922 3,706 254 162 894 234 2,994 91 4,122
A25
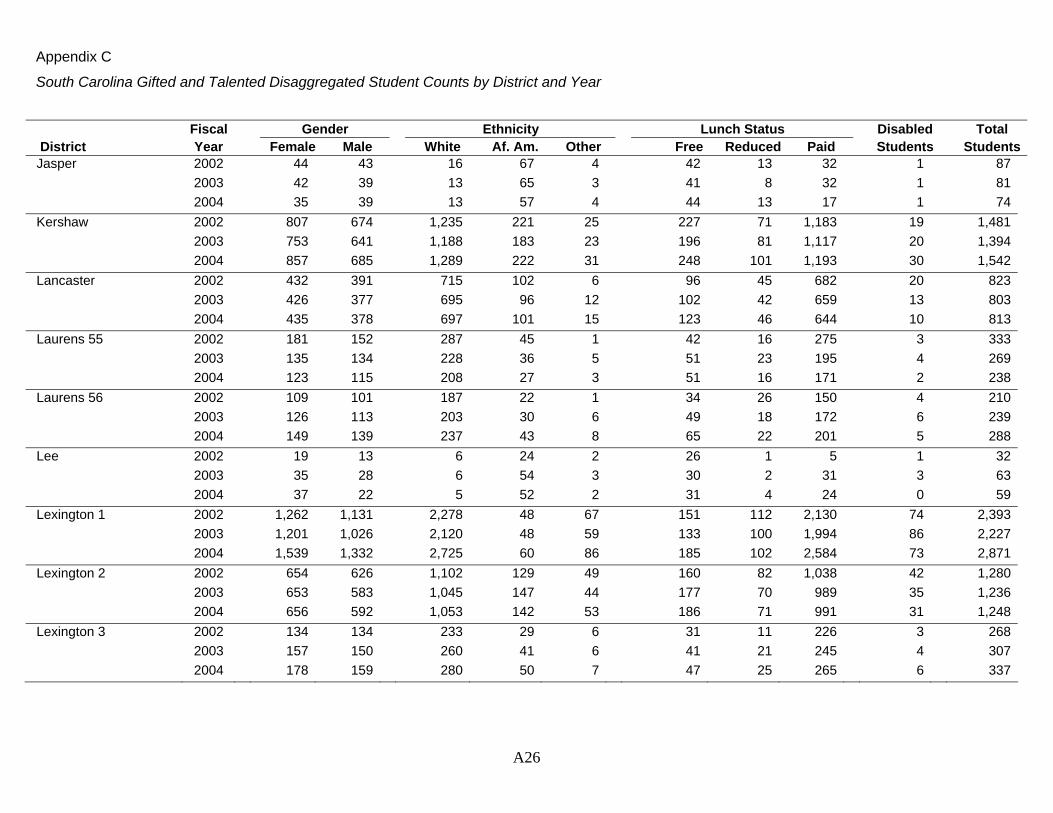
Appendix C
South Carolina Gifted and Talented Disaggregated Student Counts by District and Year
Fiscal Gender Ethnicity Lunch Status Disabled Total
District Year Female Male White Af. Am. Other Free Reduced Paid Students Students Jasper 2002 44 43 16 67 4 42 13 32 1 87
2003 42 39 13 65 3 41 8 32 1 812004 35 39 13 57 4 44 13 17 1 74
Kershaw 2002 807 674 1,235 221 25 227 71 1,183 19 1,481
2003 753 641 1,188 183 23 196 81 1,117 20 1,3942004 857 685 1,289 222 31 248 101 1,193 30 1,542
Lancaster 2002 432 391 715 102 6 96 45 682 20 823
2003 426 377 695 96 12 102 42 659 13 8032004 435 378 697 101 15 123 46 644 10 813
Laurens 55 2002 181 152 287 45 1 42 16 275 3 333
2003 135 134 228 36 5 51 23 195 4 2692004 123 115 208 27 3 51 16 171 2 238
Laurens 56 2002 109 101 187 22 1 34 26 150 4 210
2003 126 113 203 30 6 49 18 172 6 2392004 149 139 237 43 8 65 22 201 5 288
Lee 2002 19 13 6 24 2 26 1 5 1 32
2003 35 28 6 54 3 30 2 31 3 632004 37 22 5 52 2 31 4 24 0 59
Lexington 1 2002 1,262 1,131 2,278 48 67 151 112 2,130 74 2,393
2003 1,201 1,026 2,120 48 59 133 100 1,994 86 2,2272004 1,539 1,332 2,725 60 86 185 102 2,584 73 2,871
Lexington 2 2002 654 626 1,102 129 49 160 82 1,038 42 1,280
2003 653 583 1,045 147 44 177 70 989 35 1,2362004 656 592 1,053 142 53 186 71 991 31 1,248
Lexington 3 2002 134 134 233 29 6 31 11 226 3 268
2003 157 150 260 41 6 41 21 245 4 3072004 178 159 280 50 7 47 25 265 6 337
A26
Appendix C
South Carolina Gifted and Talented Disaggregated Student Counts by District and Year
Fiscal Gender Ethnicity Lunch Status Disabled Total
District Year Female Male White Af. Am. Other Free Reduced Paid Students Students Lexington 4 2002 91 68 150 7 2 37 21 101 4 159
2003 94 71 153 11 1 53 20 92 4 1652004 108 70 162 11 5 64 21 93 5 178
Lexington 5 2002 1,400 1,285 2,406 179 100 64 38 2,583 75 2,685
2003 1,312 1,258 2,264 212 94 96 57 2,417 85 2,5702004 1,479 1,432 2,559 239 113 106 66 2,739 100 2,911
McCormick 2002 28 22 16 33 1 20 6 24 1 50
2003 31 20 15 35 1 19 5 27 1 512004 22 22 13 30 1 19 8 17 0 44
Marion 1 2002 93 105 137 56 5 51 14 133 12 198
2003 98 106 137 62 5 57 12 135 7 2042004 108 103 133 73 5 66 11 134 9 211
Marion 2 2002 58 39 58 39 0 28 9 60 1 97
2003 58 42 55 45 0 31 9 60 1 1002004 50 35 48 36 1 26 13 46 0 85
Marion 7 2002 16 16 6 26 0 24 4 4 0 32
2003 21 18 8 31 0 30 5 4 0 392004 20 15 7 27 1 28 3 4 0 35
Marlboro 2002 95 70 93 68 4 65 31 69 3 165
2003 143 124 154 107 6 88 40 139 2 2672004 156 125 154 119 8 106 47 128 2 281
Newberry 2002 225 231 377 69 10 54 33 369 5 456
2003 242 244 394 77 15 81 40 365 10 4862004 300 288 478 89 21 97 44 447 8 588
Oconee 2002 488 384 830 28 14 102 56 714 9 872
2003 574 417 929 34 28 129 80 782 21 9912004 567 503 998 40 32 152 80 838 19 1,070
A27
Appendix C
South Carolina Gifted and Talented Disaggregated Student Counts by District and Year
Fiscal Gender Ethnicity Lunch Status Disabled Total
District Year Female Male White Af. Am. Other Free Reduced Paid Students Students Orangeburg 3 2002 109 61 29 140 1 104 18 48 2 170 2003 113
57 24 146 0 118 14 38 1 1702004 110 60 25 145 0 109 28 33 1 170
Orangeburg 4 2002 135 104 191 47 1 51 24 164 3 239 2003 114
102 177 38 1 41 22 153 1 2162004 125 100 181 42 2 46 25 154 0 225
Orangeburg 5 2002 122 87 43 152 14 83 24 102 2 209 2003 156
100 42 193 21 99 30 127 1 2562004 76 48 25 91 8 49 10 65 1 124
Pickens 2002 876 704 1,496 34 50 124 48 1,408 15 1,580
2003 965 788 1,664 35 54 142 65 1,546 15 1,7532004 942 825 1,661 39 67 173 72 1,522 24 1,767
Richland 1 2002 1,585 1,264 1,572 1,210 67 500 171 2,178 34 2,849
2003 1,528 1,254 1,378 1,320 84 630 182 1,970 39 2,7822004 1,632 1,330 1,480 1,392 90 697 122 2,143 42 2,962
Richland 2 2002 1,698 1,446 2,109 838 197 197 152 2,795 64 3,144
2003 1,655 1,469 2,067 837 220 239 131 2,754 62 3,1242004 1,452 1,255 1,705 812 190 263 127 2,317 50 2,707
Saluda 2002 78 81 144 14 1 23 10 126 3 159
2003 87 99 162 21 3 28 10 148 2 1862004 87 90 155 19 3 30 4 143 3 177
Spartanburg 1 2002 169 193 340 19 3 50 28 284 14 362 2003 244
249 459 27 7 70 43 380 21 4932004 321 315 593 28 15 92 52 492 16 636
Spartanburg 2 2002 362 307 625 28 16 61 27 581 8 669 2003 375
315 643 29 18 62 33 595 4 6902004 295 282 537 25 15 58 38 481 7 577
A28
Appendix C
South Carolina Gifted and Talented Disaggregated Student Counts by District and Year
Fiscal Gender Ethnicity Lunch Status Disabled Total
District Year Female Male White Af. Am. Other Free Reduced Paid Students Students Spartanburg 3 2002 149 121 243 23 4 47 18 205 8 270 2003 165
139 278 22 4 45 23 236 7 3042004 173 159 301 27 4 64 23 245 11 332
Spartanburg 4 2002 64 56 109 9 2 13 11 96 1 120 2003 81
64 128 15 2 17 12 116 4 1452004 76 63 117 19 3 18 12 109 1 139
Spartanburg 5 2002 289 294 537 29 17 49 32 502 18 583 2003 256
288 499 29 16 48 25 471 19 5442004 319 337 584 53 19 82 31 543 19 656
Spartanburg 6 2002 507 475 868 73 41 87 37 858 23 982 2003 537
470 880 75 52 101 43 863 25 1,0072004 503 476 812 97 70 124 44 811 25 979
Spartanburg 7 2002 677 664 968 321 52 239 81 1,021 34 1,341 2003 682
663 943 349 53 267 70 1,008 22 1,3452004 645 608 883 309 61 258 63 932 17 1,253
Sumter 2 2002 361 278 379 237 23 163 105 371 19 639
2003 310 260 341 210 19 158 102 310 17 5702004 339 279 363 233 22 187 104 327 15 618
Sumter 17 2002 361 335 483 186 27 110 51 535 5 696
2003 377 315 471 193 28 123 52 517 8 6922004 471 392 559 270 34 166 68 629 11 863
Union 2002 231 186 366 45 6 77 40 300 9 417
2003 254 211 398 60 7 92 29 344 12 4652004 275 212 419 60 8 93 40 354 14 487
Williamsburg 2002 104 92 27 169 0 116 12 68 5 196 2003 116
101 33 182 2 131 22 64 5 2172004 112 96 26 179 3 136 26 46 4 208
A29
Appendix C
South Carolina Gifted and Talented Disaggregated Student Counts by District and Year
Fiscal Gender Ethnicity Lunch Status Disabled Total
District Year Female Male White Af. Am. Other Free Reduced Paid Students Students York 1 2002 185 162 320 19 8 45 26 276 3 347
2003 213 198 379 22 10 56 30 325 4 4112004 211 194 369 24 12 76 34 295 4 405
York 2 2002 270 287 522 21 14 38 15 504 7 557
2003 265 289 523 17 14 32 17 505 7 5542004 331 315 604 21 21 54 23 569 6 646
York 3 2002 554 559 986 96 31 55 27 1,031 21 1,113
2003 579 586 1,008 111 46 67 35 1,063 18 1,1652004 646 630 1,085 134 57 91 56 1,129 22 1,276
York 4 2002 563 578 1,088 22 31 20 12 1,109 36 1,141
2003 625 648 1,212 25 36 25 12 1,236 41 1,2732004 698 714 1,345 28 39 30 12 1,370 50 1,412
*** STATE *** 2002 33,992 30,338 52,771 9,587 1,972
8,019 3,420 52,891 1,412 64,3302003 35,321 31,740 54,300 10,488 2,273 9,463 3,694 53,904 1,491 67,0612004 37,611 33,484 57,284 11,206 2,605 10,884 4,011 56,200 1,517 71,095
A30
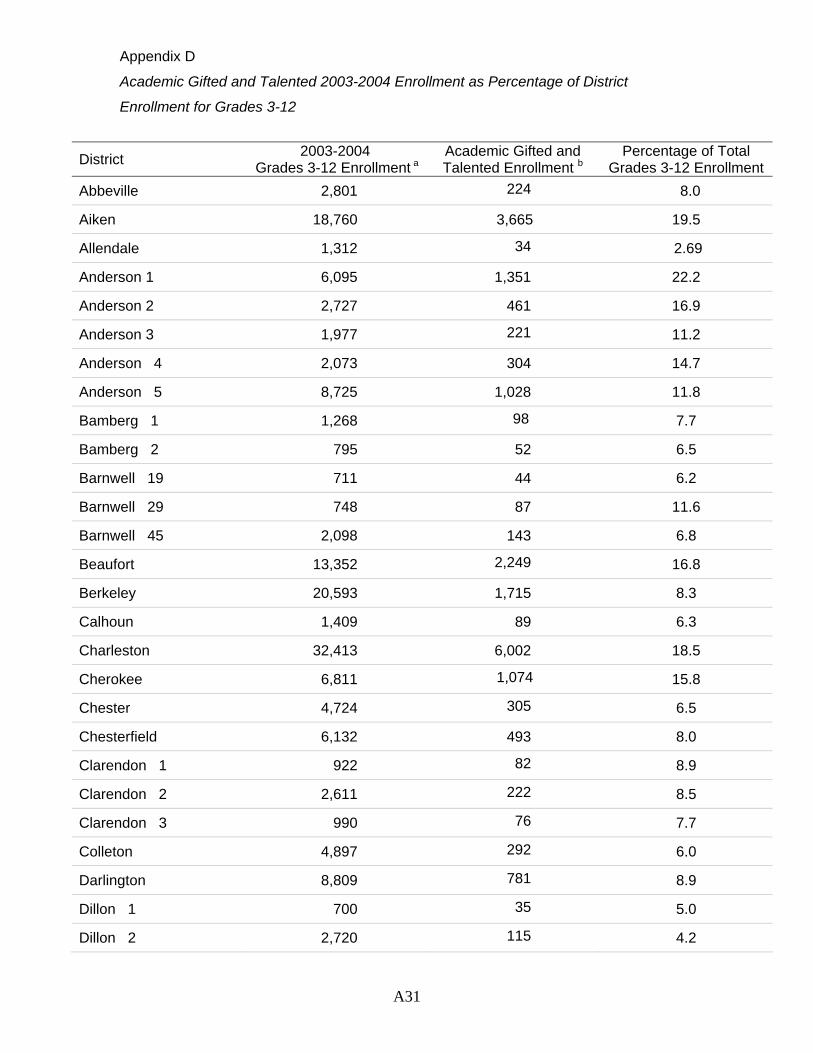
Appendix D
Academic Gifted and Talented 2003-2004 Enrollment as Percentage of District
Enrollment for Grades 3-12
District 2003-2004 Grades 3-12 Enrollment a
Academic Gifted and Talented Enrollment b
Percentage of Total Grades 3-12 Enrollment
Abbeville 2,801 224 8.0
Aiken 18,760 3,665 19.5
Allendale 1,312 34 2.69
Anderson 1 6,095 1,351 22.2
Anderson 2 2,727 461 16.9
Anderson 3 1,977 221 11.2
Anderson 4 2,073 304 14.7
Anderson 5 8,725 1,028 11.8
Bamberg 1 1,268 98 7.7
Bamberg 2 795 52 6.5
Barnwell 19 711 44 6.2
Barnwell 29 748 87 11.6
Barnwell 45 2,098 143 6.8
Beaufort 13,352 2,249 16.8
Berkeley 20,593 1,715 8.3
Calhoun 1,409 89 6.3
Charleston 32,413 6,002 18.5
Cherokee 6,811 1,074 15.8
Chester 4,724 305 6.5
Chesterfield 6,132 493 8.0
Clarendon 1 922 82 8.9
Clarendon 2 2,611 222 8.5
Clarendon 3 990 76 7.7
Colleton 4,897 292 6.0
Darlington 8,809 781 8.9
Dillon 1 700 35 5.0
Dillon 2 2,720 115 4.2
A31

Appendix D
Academic Gifted and Talented 2003-2004 Enrollment as Percentage of District
Enrollment for Grades 3-12
District 2003-2004 Grades 3-12 Enrollment a
Academic Gifted and Talented Enrollment b
Percentage of Total Grades 3-12 Enrollment
Dillon 3 1,171 124 10.6
Dorchester 2 13,798 1,975 14.3
Dorchester 4 1,850 114 6.2
Edgefield 3,554 329 9.3
Fairfield 2,721 405 14.9
Florence 1 11,130 779 7.0
Florence 2 845 60 7.1
Florence 3 2,986 390 13.1
Florence 4 821 48 5.8
Florence 5 1,145 195 17.0
Georgetown 7,812 911 11.7
Greenville 47,387 7,605 16.0
Greenwood 50 6,996 906 13.0
Greenwood 51 935 112 12.0
Greenwood 52 1,280 150 11.7
Hampton 1 2,042 104 5.1
Hampton 2 1,094 32 2.9
Horry 23,425 4,122 17.6
Jasper 2,244 74 3.3
Kershaw 7,570 1,542 20.4
Lancaster 8,470 813 9.6
Laurens 55 4,192 238 5.7
Laurens 56 2,583 288 11.1
Lee 2,101 59 2.8
Lexington 1 14,033 2,871 20.5
Lexington 2 6,684 1,248 18.7
Lexington 3 1,689 337 18.2
A32
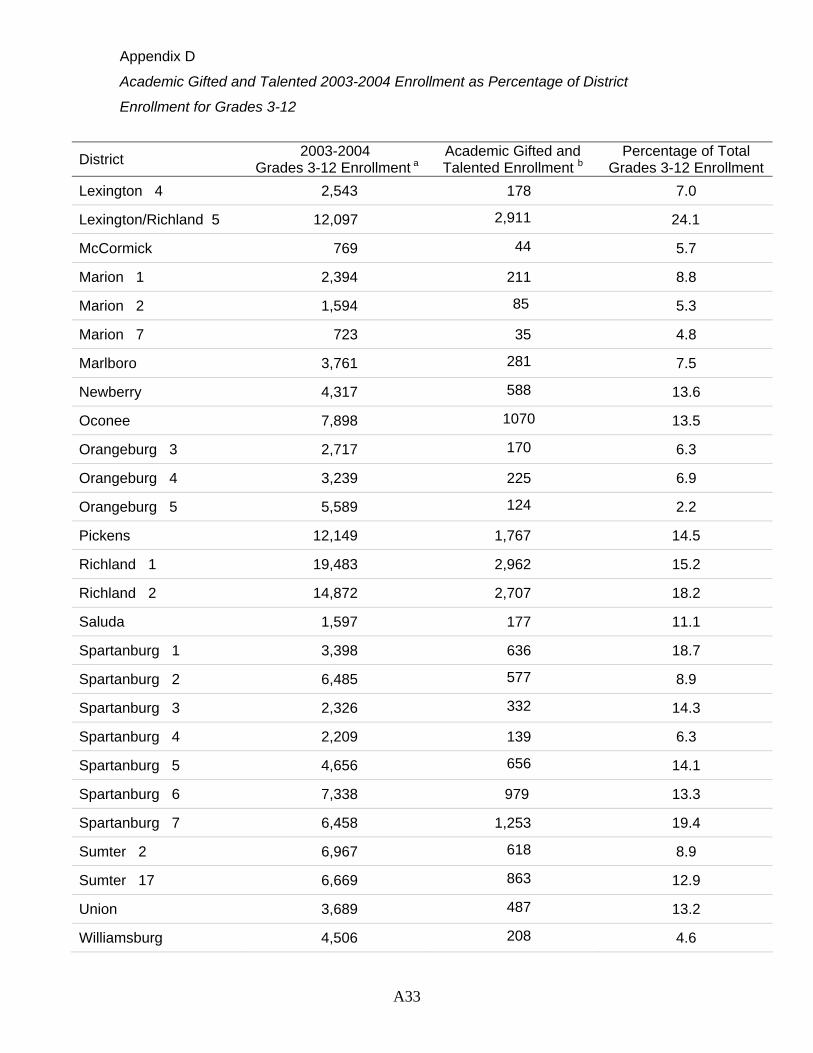
Appendix D
Academic Gifted and Talented 2003-2004 Enrollment as Percentage of District
Enrollment for Grades 3-12
District 2003-2004 Grades 3-12 Enrollment a
Academic Gifted and Talented Enrollment b
Percentage of Total Grades 3-12 Enrollment
Lexington 4 2,543 178 7.0
Lexington/Richland 5 12,097 2,911 24.1
McCormick 769 44 5.7
Marion 1 2,394 211 8.8
Marion 2 1,594 85 5.3
Marion 7 723 35 4.8
Marlboro 3,761 281 7.5
Newberry 4,317 588 13.6
Oconee 7,898 1070 13.5
Orangeburg 3 2,717 170 6.3
Orangeburg 4 3,239 225 6.9
Orangeburg 5 5,589 124 2.2
Pickens 12,149 1,767 14.5
Richland 1 19,483 2,962 15.2
Richland 2 14,872 2,707 18.2
Saluda 1,597 177 11.1
Spartanburg 1 3,398 636 18.7
Spartanburg 2 6,485 577 8.9
Spartanburg 3 2,326 332 14.3
Spartanburg 4 2,209 139 6.3
Spartanburg 5 4,656 656 14.1
Spartanburg 6 7,338 979 13.3
Spartanburg 7 6,458 1,253 19.4
Sumter 2 6,967 618 8.9
Sumter 17 6,669 863 12.9
Union 3,689 487 13.2
Williamsburg 4,506 208 4.6
A33
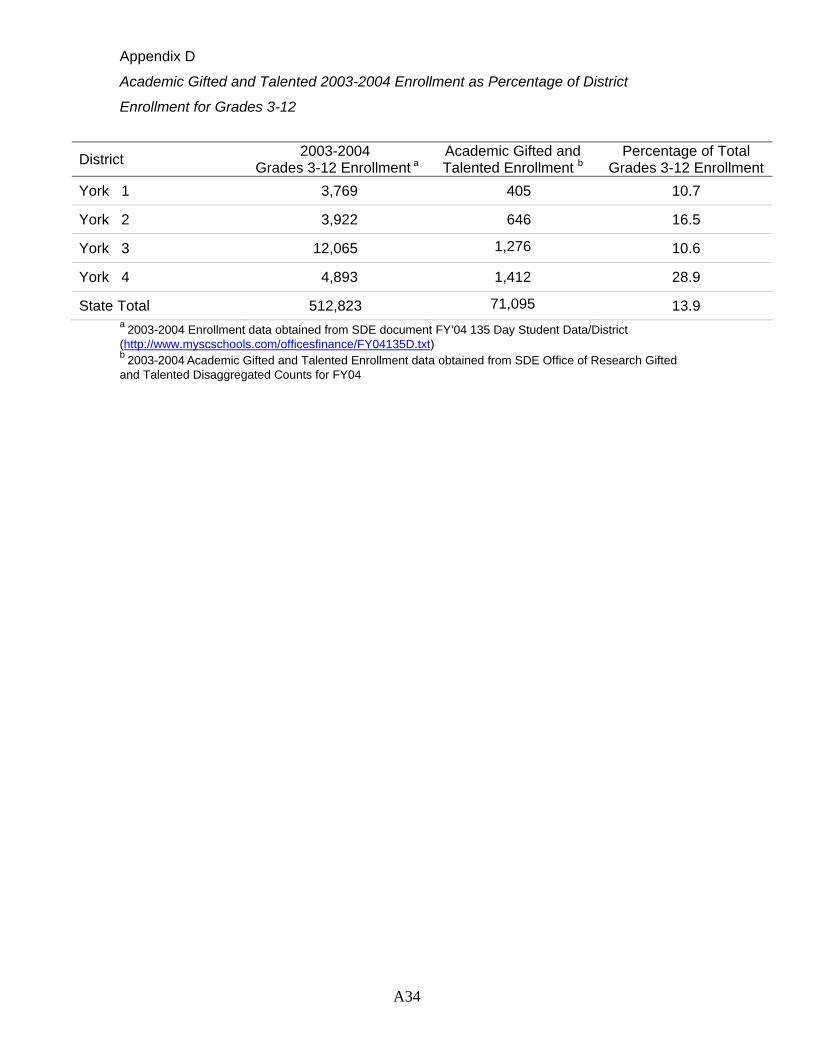
Appendix D
Academic Gifted and Talented 2003-2004 Enrollment as Percentage of District
Enrollment for Grades 3-12
District 2003-2004 Grades 3-12 Enrollment a
Academic Gifted and Talented Enrollment b
Percentage of Total Grades 3-12 Enrollment
York 1 3,769 405 10.7
York 2 3,922 646 16.5
York 3 12,065 1,276 10.6
York 4 4,893 1,412 28.9
State Total 512,823 71,095 13.9 a 2003-2004 Enrollment data obtained from SDE document FY’04 135 Day Student Data/District (http://www.myscschools.com/officesfinance/FY04135D.txt) b 2003-2004 Academic Gifted and Talented Enrollment data obtained from SDE Office of Research Gifted and Talented Disaggregated Counts for FY04
A34
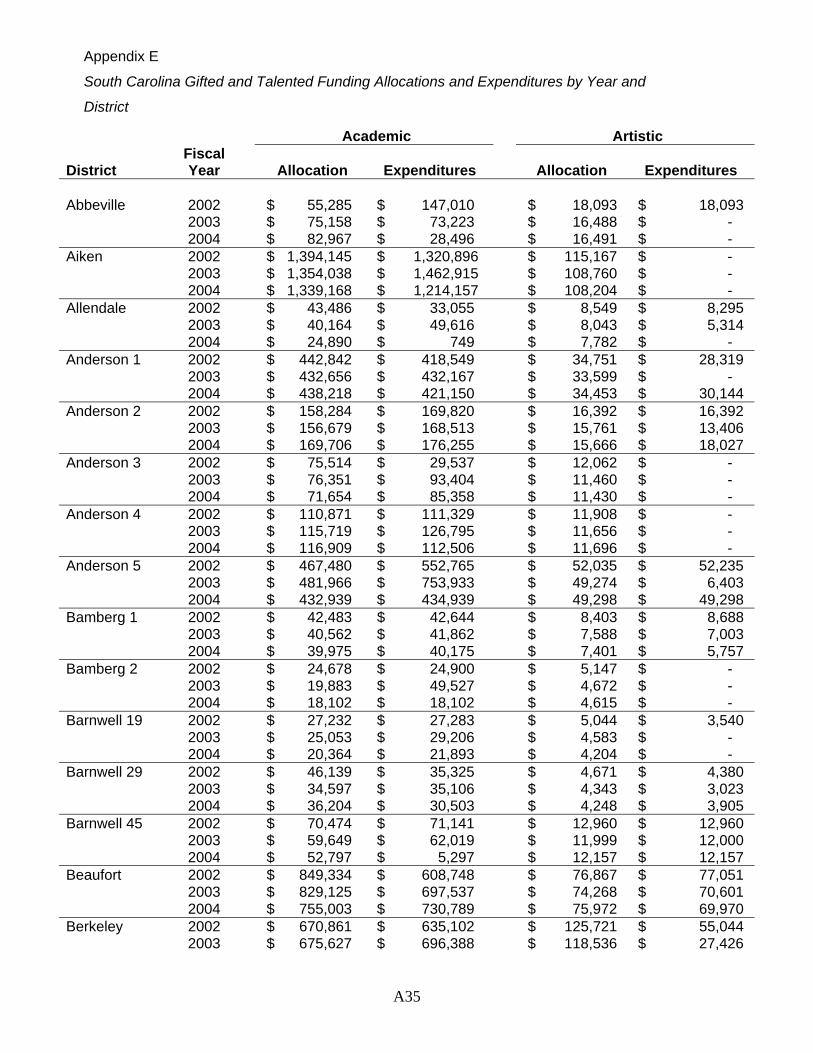
Appendix E
South Carolina Gifted and Talented Funding Allocations and Expenditures by Year and
District
Academic Artistic
District Fiscal Year Allocation Expenditures Allocation Expenditures
Abbeville 2002 $ 55,285 $ 147,010 $ 18,093 $ 18,093 2003 $ 75,158 $ 73,223 $ 16,488 $ - 2004 $ 82,967 $ 28,496 $ 16,491 $ - Aiken 2002 $ 1,394,145 $ 1,320,896 $ 115,167 $ - 2003 $ 1,354,038 $ 1,462,915 $ 108,760 $ - 2004 $ 1,339,168 $ 1,214,157 $ 108,204 $ - Allendale 2002 $ 43,486 $ 33,055 $ 8,549 $ 8,295 2003 $ 40,164 $ 49,616 $ 8,043 $ 5,314 2004 $ 24,890 $ 749 $ 7,782 $ - Anderson 1 2002 $ 442,842 $ 418,549 $ 34,751 $ 28,319 2003 $ 432,656 $ 432,167 $ 33,599 $ - 2004 $ 438,218 $ 421,150 $ 34,453 $ 30,144 Anderson 2 2002 $ 158,284 $ 169,820 $ 16,392 $ 16,392 2003 $ 156,679 $ 168,513 $ 15,761 $ 13,406 2004 $ 169,706 $ 176,255 $ 15,666 $ 18,027 Anderson 3 2002 $ 75,514 $ 29,537 $ 12,062 $ - 2003 $ 76,351 $ 93,404 $ 11,460 $ - 2004 $ 71,654 $ 85,358 $ 11,430 $ - Anderson 4 2002 $ 110,871 $ 111,329 $ 11,908 $ - 2003 $ 115,719 $ 126,795 $ 11,656 $ - 2004 $ 116,909 $ 112,506 $ 11,696 $ - Anderson 5 2002 $ 467,480 $ 552,765 $ 52,035 $ 52,235 2003 $ 481,966 $ 753,933 $ 49,274 $ 6,403 2004 $ 432,939 $ 434,939 $ 49,298 $ 49,298 Bamberg 1 2002 $ 42,483 $ 42,644 $ 8,403 $ 8,688 2003 $ 40,562 $ 41,862 $ 7,588 $ 7,003 2004 $ 39,975 $ 40,175 $ 7,401 $ 5,757 Bamberg 2 2002 $ 24,678 $ 24,900 $ 5,147 $ - 2003 $ 19,883 $ 49,527 $ 4,672 $ - 2004 $ 18,102 $ 18,102 $ 4,615 $ - Barnwell 19 2002 $ 27,232 $ 27,283 $ 5,044 $ 3,540 2003 $ 25,053 $ 29,206 $ 4,583 $ - 2004 $ 20,364 $ 21,893 $ 4,204 $ - Barnwell 29 2002 $ 46,139 $ 35,325 $ 4,671 $ 4,380 2003 $ 34,597 $ 35,106 $ 4,343 $ 3,023 2004 $ 36,204 $ 30,503 $ 4,248 $ 3,905 Barnwell 45 2002 $ 70,474 $ 71,141 $ 12,960 $ 12,960 2003 $ 59,649 $ 62,019 $ 11,999 $ 12,000 2004 $ 52,797 $ 5,297 $ 12,157 $ 12,157 Beaufort 2002 $ 849,334 $ 608,748 $ 76,867 $ 77,051 2003 $ 829,125 $ 697,537 $ 74,268 $ 70,601 2004 $ 755,003 $ 730,789 $ 75,972 $ 69,970 Berkeley 2002 $ 670,861 $ 635,102 $ 125,721 $ 55,044 2003 $ 675,627 $ 696,388 $ 118,536 $ 27,426
A35
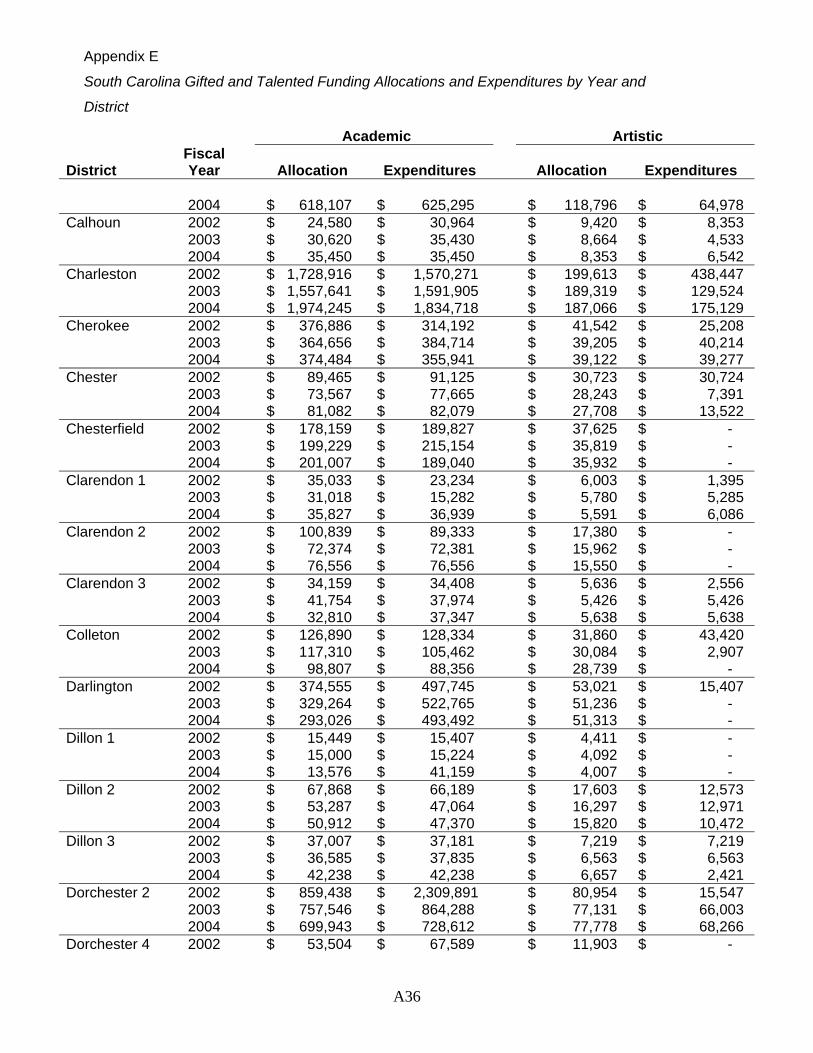
Appendix E
South Carolina Gifted and Talented Funding Allocations and Expenditures by Year and
District
Academic Artistic
District Fiscal Year Allocation Expenditures Allocation Expenditures
2004 $ 618,107 $ 625,295 $ 118,796 $ 64,978 Calhoun 2002 $ 24,580 $ 30,964 $ 9,420 $ 8,353 2003 $ 30,620 $ 35,430 $ 8,664 $ 4,533 2004 $ 35,450 $ 35,450 $ 8,353 $ 6,542 Charleston 2002 $ 1,728,916 $ 1,570,271 $ 199,613 $ 438,447 2003 $ 1,557,641 $ 1,591,905 $ 189,319 $ 129,524 2004 $ 1,974,245 $ 1,834,718 $ 187,066 $ 175,129 Cherokee 2002 $ 376,886 $ 314,192 $ 41,542 $ 25,208 2003 $ 364,656 $ 384,714 $ 39,205 $ 40,214 2004 $ 374,484 $ 355,941 $ 39,122 $ 39,277 Chester 2002 $ 89,465 $ 91,125 $ 30,723 $ 30,724 2003 $ 73,567 $ 77,665 $ 28,243 $ 7,391 2004 $ 81,082 $ 82,079 $ 27,708 $ 13,522 Chesterfield 2002 $ 178,159 $ 189,827 $ 37,625 $ - 2003 $ 199,229 $ 215,154 $ 35,819 $ - 2004 $ 201,007 $ 189,040 $ 35,932 $ - Clarendon 1 2002 $ 35,033 $ 23,234 $ 6,003 $ 1,395 2003 $ 31,018 $ 15,282 $ 5,780 $ 5,285 2004 $ 35,827 $ 36,939 $ 5,591 $ 6,086 Clarendon 2 2002 $ 100,839 $ 89,333 $ 17,380 $ - 2003 $ 72,374 $ 72,381 $ 15,962 $ - 2004 $ 76,556 $ 76,556 $ 15,550 $ - Clarendon 3 2002 $ 34,159 $ 34,408 $ 5,636 $ 2,556 2003 $ 41,754 $ 37,974 $ 5,426 $ 5,426 2004 $ 32,810 $ 37,347 $ 5,638 $ 5,638 Colleton 2002 $ 126,890 $ 128,334 $ 31,860 $ 43,420 2003 $ 117,310 $ 105,462 $ 30,084 $ 2,907 2004 $ 98,807 $ 88,356 $ 28,739 $ - Darlington 2002 $ 374,555 $ 497,745 $ 53,021 $ 15,407 2003 $ 329,264 $ 522,765 $ 51,236 $ - 2004 $ 293,026 $ 493,492 $ 51,313 $ - Dillon 1 2002 $ 15,449 $ 15,407 $ 4,411 $ - 2003 $ 15,000 $ 15,224 $ 4,092 $ - 2004 $ 13,576 $ 41,159 $ 4,007 $ - Dillon 2 2002 $ 67,868 $ 66,189 $ 17,603 $ 12,573 2003 $ 53,287 $ 47,064 $ 16,297 $ 12,971 2004 $ 50,912 $ 47,370 $ 15,820 $ 10,472 Dillon 3 2002 $ 37,007 $ 37,181 $ 7,219 $ 7,219 2003 $ 36,585 $ 37,835 $ 6,563 $ 6,563 2004 $ 42,238 $ 42,238 $ 6,657 $ 2,421 Dorchester 2 2002 $ 859,438 $ 2,309,891 $ 80,954 $ 15,547 2003 $ 757,546 $ 864,288 $ 77,131 $ 66,003 2004 $ 699,943 $ 728,612 $ 77,778 $ 68,266 Dorchester 4 2002 $ 53,504 $ 67,589 $ 11,903 $ -
A36
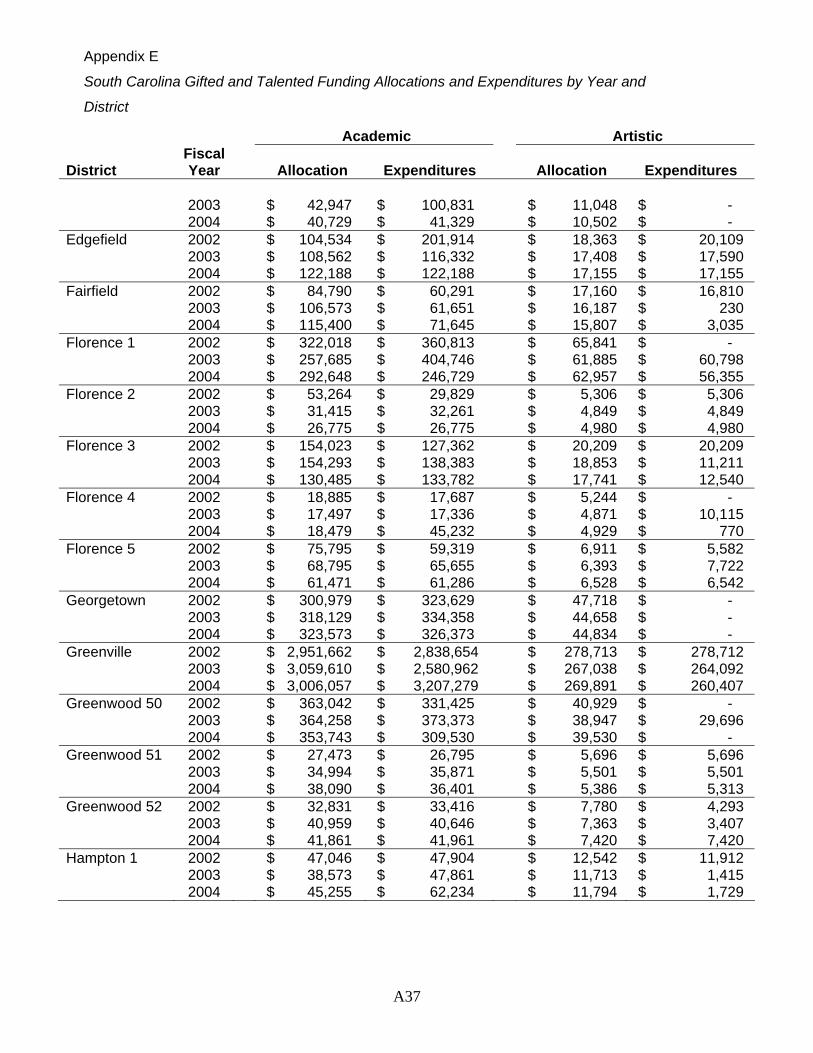
Appendix E
South Carolina Gifted and Talented Funding Allocations and Expenditures by Year and
District
Academic Artistic
District Fiscal Year Allocation Expenditures Allocation Expenditures
2003 $ 42,947 $ 100,831 $ 11,048 $ - 2004 $ 40,729 $ 41,329 $ 10,502 $ - Edgefield 2002 $ 104,534 $ 201,914 $ 18,363 $ 20,109 2003 $ 108,562 $ 116,332 $ 17,408 $ 17,590 2004 $ 122,188 $ 122,188 $ 17,155 $ 17,155 Fairfield 2002 $ 84,790 $ 60,291 $ 17,160 $ 16,810 2003 $ 106,573 $ 61,651 $ 16,187 $ 230 2004 $ 115,400 $ 71,645 $ 15,807 $ 3,035 Florence 1 2002 $ 322,018 $ 360,813 $ 65,841 $ - 2003 $ 257,685 $ 404,746 $ 61,885 $ 60,798 2004 $ 292,648 $ 246,729 $ 62,957 $ 56,355 Florence 2 2002 $ 53,264 $ 29,829 $ 5,306 $ 5,306 2003 $ 31,415 $ 32,261 $ 4,849 $ 4,849 2004 $ 26,775 $ 26,775 $ 4,980 $ 4,980 Florence 3 2002 $ 154,023 $ 127,362 $ 20,209 $ 20,209 2003 $ 154,293 $ 138,383 $ 18,853 $ 11,211 2004 $ 130,485 $ 133,782 $ 17,741 $ 12,540 Florence 4 2002 $ 18,885 $ 17,687 $ 5,244 $ - 2003 $ 17,497 $ 17,336 $ 4,871 $ 10,115 2004 $ 18,479 $ 45,232 $ 4,929 $ 770 Florence 5 2002 $ 75,795 $ 59,319 $ 6,911 $ 5,582 2003 $ 68,795 $ 65,655 $ 6,393 $ 7,722 2004 $ 61,471 $ 61,286 $ 6,528 $ 6,542 Georgetown 2002 $ 300,979 $ 323,629 $ 47,718 $ - 2003 $ 318,129 $ 334,358 $ 44,658 $ - 2004 $ 323,573 $ 326,373 $ 44,834 $ - Greenville 2002 $ 2,951,662 $ 2,838,654 $ 278,713 $ 278,712 2003 $ 3,059,610 $ 2,580,962 $ 267,038 $ 264,092 2004 $ 3,006,057 $ 3,207,279 $ 269,891 $ 260,407 Greenwood 50 2002 $ 363,042 $ 331,425 $ 40,929 $ - 2003 $ 364,258 $ 373,373 $ 38,947 $ 29,696 2004 $ 353,743 $ 309,530 $ 39,530 $ - Greenwood 51 2002 $ 27,473 $ 26,795 $ 5,696 $ 5,696 2003 $ 34,994 $ 35,871 $ 5,501 $ 5,501 2004 $ 38,090 $ 36,401 $ 5,386 $ 5,313 Greenwood 52 2002 $ 32,831 $ 33,416 $ 7,780 $ 4,293 2003 $ 40,959 $ 40,646 $ 7,363 $ 3,407 2004 $ 41,861 $ 41,961 $ 7,420 $ 7,420 Hampton 1 2002 $ 47,046 $ 47,904 $ 12,542 $ 11,912 2003 $ 38,573 $ 47,861 $ 11,713 $ 1,415 2004 $ 45,255 $ 62,234 $ 11,794 $ 1,729
A37
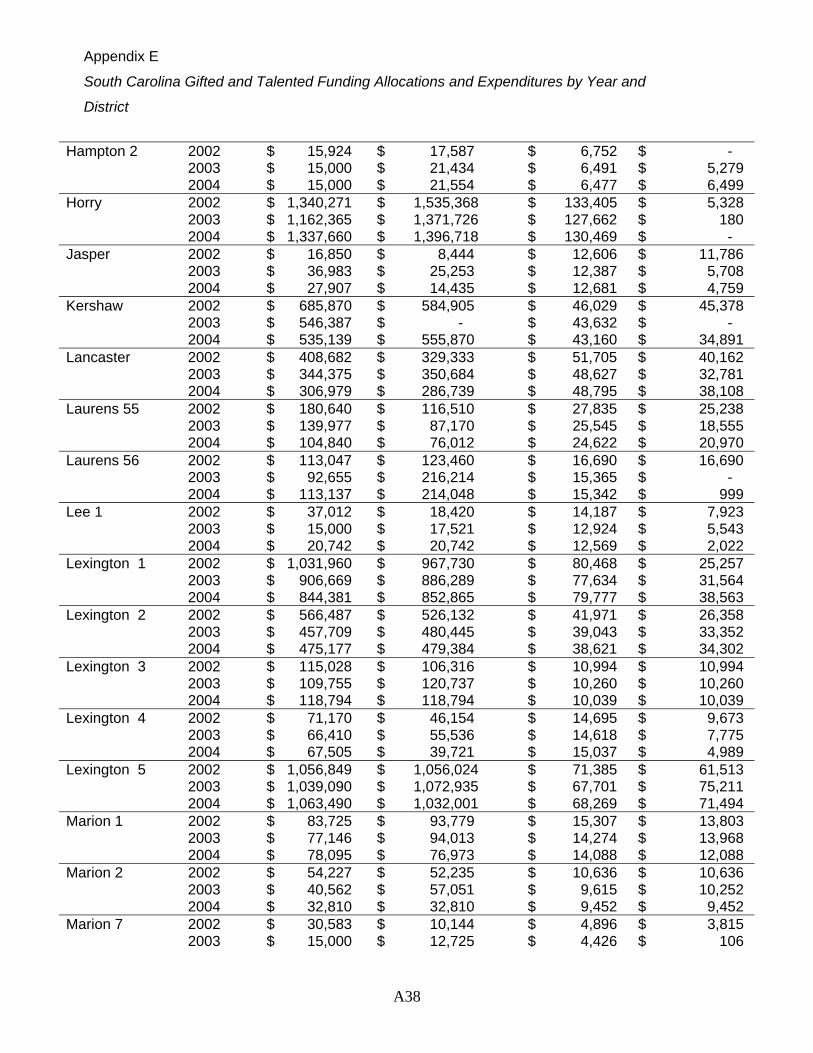
Appendix E
South Carolina Gifted and Talented Funding Allocations and Expenditures by Year and
District
Hampton 2 2002 $ 15,924 $ 17,587 $ 6,752 $ - 2003 $ 15,000 $ 21,434 $ 6,491 $ 5,279 2004 $ 15,000 $ 21,554 $ 6,477 $ 6,499 Horry 2002 $ 1,340,271 $ 1,535,368 $ 133,405 $ 5,328 2003 $ 1,162,365 $ 1,371,726 $ 127,662 $ 180 2004 $ 1,337,660 $ 1,396,718 $ 130,469 $ - Jasper 2002 $ 16,850 $ 8,444 $ 12,606 $ 11,786 2003 $ 36,983 $ 25,253 $ 12,387 $ 5,708 2004 $ 27,907 $ 14,435 $ 12,681 $ 4,759 Kershaw 2002 $ 685,870 $ 584,905 $ 46,029 $ 45,378 2003 $ 546,387 $ - $ 43,632 $ - 2004 $ 535,139 $ 555,870 $ 43,160 $ 34,891 Lancaster 2002 $ 408,682 $ 329,333 $ 51,705 $ 40,162 2003 $ 344,375 $ 350,684 $ 48,627 $ 32,781 2004 $ 306,979 $ 286,739 $ 48,795 $ 38,108 Laurens 55 2002 $ 180,640 $ 116,510 $ 27,835 $ 25,238 2003 $ 139,977 $ 87,170 $ 25,545 $ 18,555 2004 $ 104,840 $ 76,012 $ 24,622 $ 20,970 Laurens 56 2002 $ 113,047 $ 123,460 $ 16,690 $ 16,690 2003 $ 92,655 $ 216,214 $ 15,365 $ - 2004 $ 113,137 $ 214,048 $ 15,342 $ 999 Lee 1 2002 $ 37,012 $ 18,420 $ 14,187 $ 7,923 2003 $ 15,000 $ 17,521 $ 12,924 $ 5,543 2004 $ 20,742 $ 20,742 $ 12,569 $ 2,022 Lexington 1 2002 $ 1,031,960 $ 967,730 $ 80,468 $ 25,257 2003 $ 906,669 $ 886,289 $ 77,634 $ 31,564 2004 $ 844,381 $ 852,865 $ 79,777 $ 38,563 Lexington 2 2002 $ 566,487 $ 526,132 $ 41,971 $ 26,358 2003 $ 457,709 $ 480,445 $ 39,043 $ 33,352 2004 $ 475,177 $ 479,384 $ 38,621 $ 34,302 Lexington 3 2002 $ 115,028 $ 106,316 $ 10,994 $ 10,994 2003 $ 109,755 $ 120,737 $ 10,260 $ 10,260 2004 $ 118,794 $ 118,794 $ 10,039 $ 10,039 Lexington 4 2002 $ 71,170 $ 46,154 $ 14,695 $ 9,673 2003 $ 66,410 $ 55,536 $ 14,618 $ 7,775 2004 $ 67,505 $ 39,721 $ 15,037 $ 4,989 Lexington 5 2002 $ 1,056,849 $ 1,056,024 $ 71,385 $ 61,513 2003 $ 1,039,090 $ 1,072,935 $ 67,701 $ 75,211 2004 $ 1,063,490 $ 1,032,001 $ 68,269 $ 71,494 Marion 1 2002 $ 83,725 $ 93,779 $ 15,307 $ 13,803 2003 $ 77,146 $ 94,013 $ 14,274 $ 13,968 2004 $ 78,095 $ 76,973 $ 14,088 $ 12,088 Marion 2 2002 $ 54,227 $ 52,235 $ 10,636 $ 10,636 2003 $ 40,562 $ 57,051 $ 9,615 $ 10,252 2004 $ 32,810 $ 32,810 $ 9,452 $ 9,452 Marion 7 2002 $ 30,583 $ 10,144 $ 4,896 $ 3,815 2003 $ 15,000 $ 12,725 $ 4,426 $ 106
A38
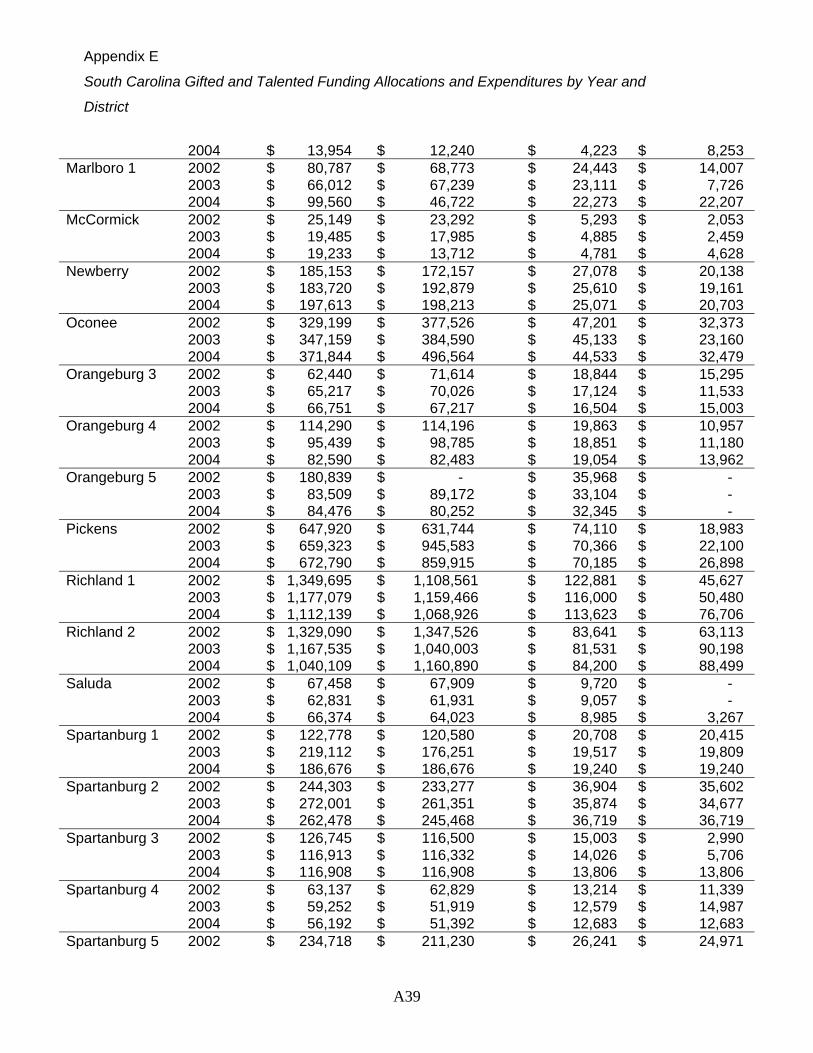
Appendix E
South Carolina Gifted and Talented Funding Allocations and Expenditures by Year and
District
2004 $ 13,954 $ 12,240 $ 4,223 $ 8,253 Marlboro 1 2002 $ 80,787 $ 68,773 $ 24,443 $ 14,007 2003 $ 66,012 $ 67,239 $ 23,111 $ 7,726 2004 $ 99,560 $ 46,722 $ 22,273 $ 22,207 McCormick 2002 $ 25,149 $ 23,292 $ 5,293 $ 2,053 2003 $ 19,485 $ 17,985 $ 4,885 $ 2,459 2004 $ 19,233 $ 13,712 $ 4,781 $ 4,628 Newberry 2002 $ 185,153 $ 172,157 $ 27,078 $ 20,138 2003 $ 183,720 $ 192,879 $ 25,610 $ 19,161 2004 $ 197,613 $ 198,213 $ 25,071 $ 20,703 Oconee 2002 $ 329,199 $ 377,526 $ 47,201 $ 32,373 2003 $ 347,159 $ 384,590 $ 45,133 $ 23,160 2004 $ 371,844 $ 496,564 $ 44,533 $ 32,479 Orangeburg 3 2002 $ 62,440 $ 71,614 $ 18,844 $ 15,295 2003 $ 65,217 $ 70,026 $ 17,124 $ 11,533 2004 $ 66,751 $ 67,217 $ 16,504 $ 15,003 Orangeburg 4 2002 $ 114,290 $ 114,196 $ 19,863 $ 10,957 2003 $ 95,439 $ 98,785 $ 18,851 $ 11,180 2004 $ 82,590 $ 82,483 $ 19,054 $ 13,962 Orangeburg 5 2002 $ 180,839 $ - $ 35,968 $ - 2003 $ 83,509 $ 89,172 $ 33,104 $ - 2004 $ 84,476 $ 80,252 $ 32,345 $ - Pickens 2002 $ 647,920 $ 631,744 $ 74,110 $ 18,983 2003 $ 659,323 $ 945,583 $ 70,366 $ 22,100 2004 $ 672,790 $ 859,915 $ 70,185 $ 26,898 Richland 1 2002 $ 1,349,695 $ 1,108,561 $ 122,881 $ 45,627 2003 $ 1,177,079 $ 1,159,466 $ 116,000 $ 50,480 2004 $ 1,112,139 $ 1,068,926 $ 113,623 $ 76,706 Richland 2 2002 $ 1,329,090 $ 1,347,526 $ 83,641 $ 63,113 2003 $ 1,167,535 $ 1,040,003 $ 81,531 $ 90,198 2004 $ 1,040,109 $ 1,160,890 $ 84,200 $ 88,499 Saluda 2002 $ 67,458 $ 67,909 $ 9,720 $ - 2003 $ 62,831 $ 61,931 $ 9,057 $ - 2004 $ 66,374 $ 64,023 $ 8,985 $ 3,267 Spartanburg 1 2002 $ 122,778 $ 120,580 $ 20,708 $ 20,415 2003 $ 219,112 $ 176,251 $ 19,517 $ 19,809 2004 $ 186,676 $ 186,676 $ 19,240 $ 19,240 Spartanburg 2 2002 $ 244,303 $ 233,277 $ 36,904 $ 35,602 2003 $ 272,001 $ 261,351 $ 35,874 $ 34,677 2004 $ 262,478 $ 245,468 $ 36,719 $ 36,719 Spartanburg 3 2002 $ 126,745 $ 116,500 $ 15,003 $ 2,990 2003 $ 116,913 $ 116,332 $ 14,026 $ 5,706 2004 $ 116,908 $ 116,908 $ 13,806 $ 13,806 Spartanburg 4 2002 $ 63,137 $ 62,829 $ 13,214 $ 11,339 2003 $ 59,252 $ 51,919 $ 12,579 $ 14,987 2004 $ 56,192 $ 51,392 $ 12,683 $ 12,683 Spartanburg 5 2002 $ 234,718 $ 211,230 $ 26,241 $ 24,971
A39
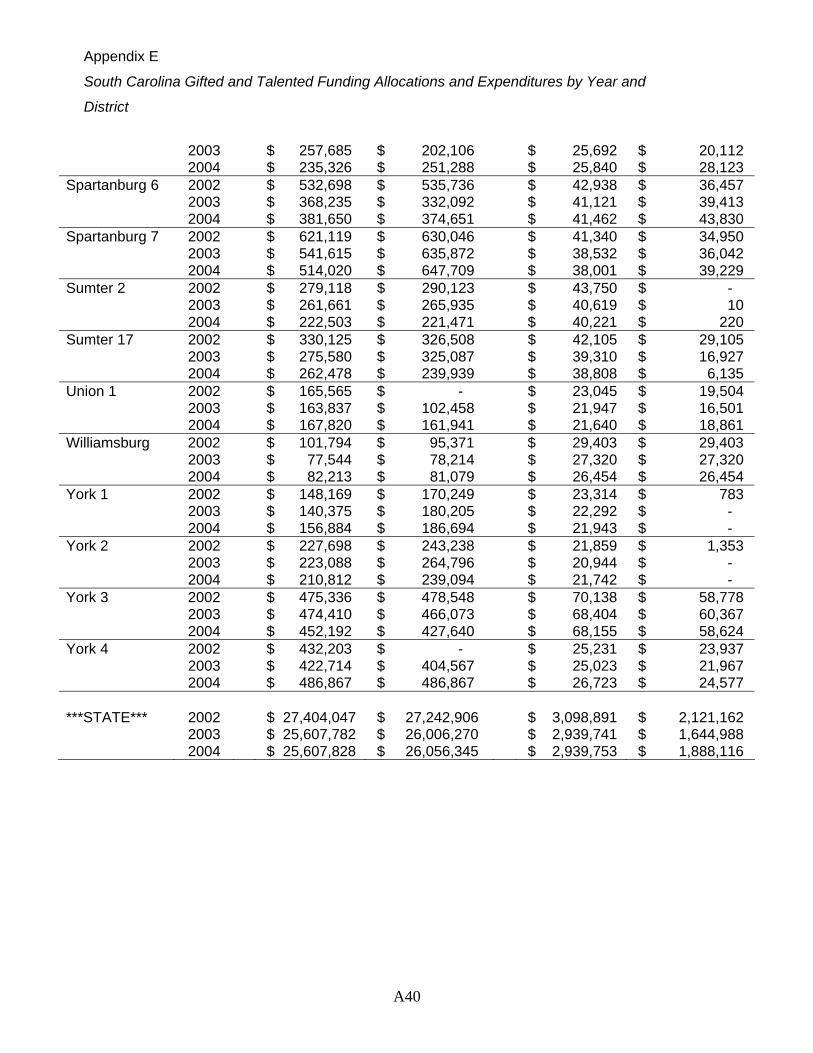
Appendix E
South Carolina Gifted and Talented Funding Allocations and Expenditures by Year and
District
2003 $ 257,685 $ 202,106 $ 25,692 $ 20,112 2004 $ 235,326 $ 251,288 $ 25,840 $ 28,123 Spartanburg 6 2002 $ 532,698 $ 535,736 $ 42,938 $ 36,457 2003 $ 368,235 $ 332,092 $ 41,121 $ 39,413 2004 $ 381,650 $ 374,651 $ 41,462 $ 43,830 Spartanburg 7 2002 $ 621,119 $ 630,046 $ 41,340 $ 34,950 2003 $ 541,615 $ 635,872 $ 38,532 $ 36,042 2004 $ 514,020 $ 647,709 $ 38,001 $ 39,229 Sumter 2 2002 $ 279,118 $ 290,123 $ 43,750 $ - 2003 $ 261,661 $ 265,935 $ 40,619 $ 10 2004 $ 222,503 $ 221,471 $ 40,221 $ 220 Sumter 17 2002 $ 330,125 $ 326,508 $ 42,105 $ 29,105 2003 $ 275,580 $ 325,087 $ 39,310 $ 16,927 2004 $ 262,478 $ 239,939 $ 38,808 $ 6,135 Union 1 2002 $ 165,565 $ - $ 23,045 $ 19,504 2003 $ 163,837 $ 102,458 $ 21,947 $ 16,501 2004 $ 167,820 $ 161,941 $ 21,640 $ 18,861 Williamsburg 2002 $ 101,794 $ 95,371 $ 29,403 $ 29,403 2003 $ 77,544 $ 78,214 $ 27,320 $ 27,320 2004 $ 82,213 $ 81,079 $ 26,454 $ 26,454 York 1 2002 $ 148,169 $ 170,249 $ 23,314 $ 783 2003 $ 140,375 $ 180,205 $ 22,292 $ - 2004 $ 156,884 $ 186,694 $ 21,943 $ - York 2 2002 $ 227,698 $ 243,238 $ 21,859 $ 1,353 2003 $ 223,088 $ 264,796 $ 20,944 $ - 2004 $ 210,812 $ 239,094 $ 21,742 $ - York 3 2002 $ 475,336 $ 478,548 $ 70,138 $ 58,778 2003 $ 474,410 $ 466,073 $ 68,404 $ 60,367 2004 $ 452,192 $ 427,640 $ 68,155 $ 58,624 York 4 2002 $ 432,203 $ - $ 25,231 $ 23,937 2003 $ 422,714 $ 404,567 $ 25,023 $ 21,967 2004 $ 486,867 $ 486,867 $ 26,723 $ 24,577 ***STATE*** 2002 $ 27,404,047 $ 27,242,906 $ 3,098,891 $ 2,121,162 2003 $ 25,607,782 $ 26,006,270 $ 2,939,741 $ 1,644,988 2004 $ 25,607,828 $ 26,056,345 $ 2,939,753 $ 1,888,116
A40
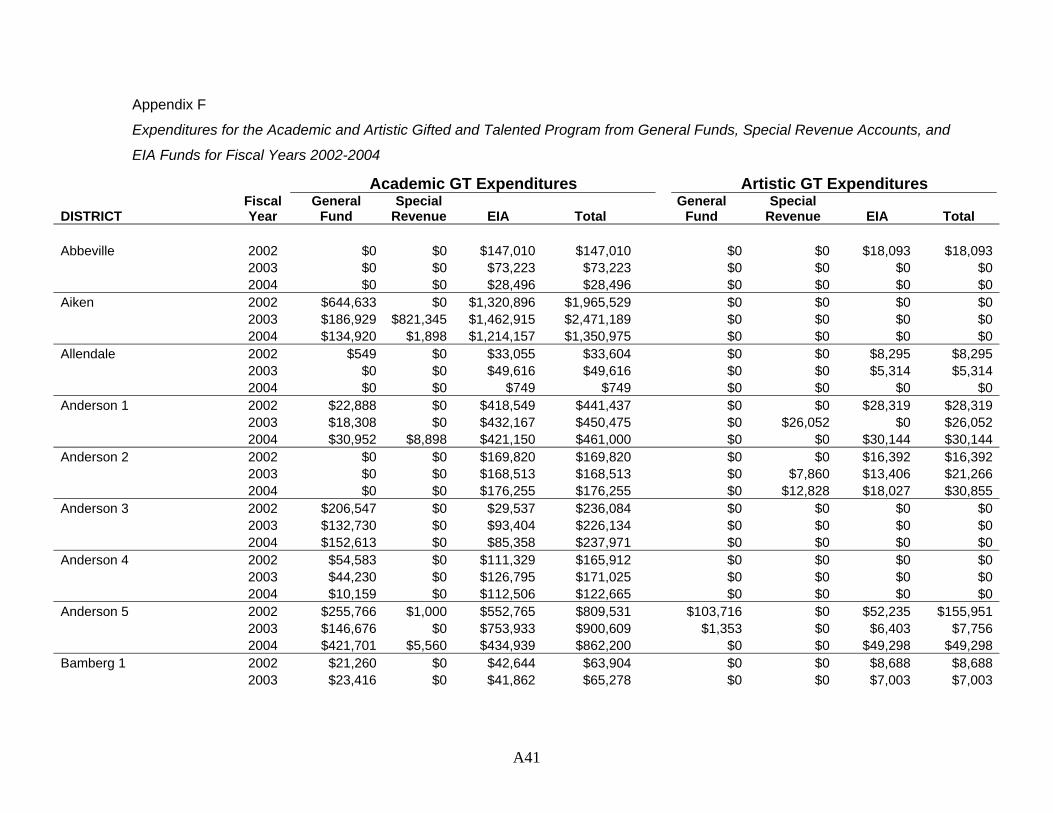
Appendix F
Expenditures for the Academic and Artistic Gifted and Talented Program from General Funds, Special Revenue Accounts, and
EIA Funds for Fiscal Years 2002-2004
Academic GT Expenditures Artistic GT Expenditures
DISTRICT Fiscal Year
General Fund
Special Revenue EIA Total
General Fund
Special Revenue EIA Total
Abbeville
2002 $0 $0 $147,010 $147,010 $0 $0 $18,093
$18,093 2003 $0 $0 $73,223 $73,223 $0 $0 $0 $0
2004 $0 $0 $28,496 $28,496 $0 $0 $0 $0Aiken 2002 $644,633 $0 $1,320,896 $1,965,529 $0 $0 $0 $0
2003 $186,929 $1,462,915$821,345 $2,471,189 $0 $0 $0 $02004 $134,920
$1,214,157$1,898 $1,350,975 $0 $0 $0 $0
Allendale 2002 $549 $0 $33,055 $33,604 $0 $0 $8,295 $8,295
2003 $0 $0 $49,616 $49,616 $0 $0 $5,314
$5,3142004 $0 $0 $749 $749 $0 $0 $0 $0
Anderson 1 2002 $22,888 $0 $418,549 $441,437 $0 $0 $28,319 $28,319
2003 $18,308 $0 $432,167 $450,475 $0 $26,052
$0 $26,0522004 $30,952 $8,898 $421,150 $461,000 $0 $0 $30,144 $30,144
Anderson 2 2002 $0 $0 $169,820 $169,820 $0 $0 $16,392 $16,392
2003 $0 $0 $168,513 $168,513 $0 $7,860 $13,406 $21,2662004 $0 $0 $176,255 $176,255 $0 $12,828 $18,027
$30,855
Anderson 3 2002 $206,547 $0 $29,537 $236,084 $0 $0 $0 $0
2003 $132,730 $0 $93,404 $226,134 $0 $0 $0 $02004 $152,613 $0 $85,358 $237,971 $0 $0 $0 $0
Anderson 4 2002 $54,583 $0 $111,329 $165,912 $0 $0 $0 $0
2003 $44,230 $0 $126,795 $171,025 $0 $0 $0 $02004 $10,159 $0 $112,506 $122,665 $0 $0 $0 $0
Anderson 5 2002 $255,766 $1,000 $552,765 $809,531 $103,716 $0 $52,235 $155,951
2003 $146,676 $0 $753,933 $900,609 $1,353
$0 $6,403 $7,7562004 $421,701 $5,560 $434,939 $862,200 $0 $0 $49,298
$49,298 Bamberg 1 2002 $21,260 $0 $42,644 $63,904 $0 $0 $8,688 $8,688
2003 $23,416 $0 $41,862 $65,278 $0 $0 $7,003 $7,003
A41
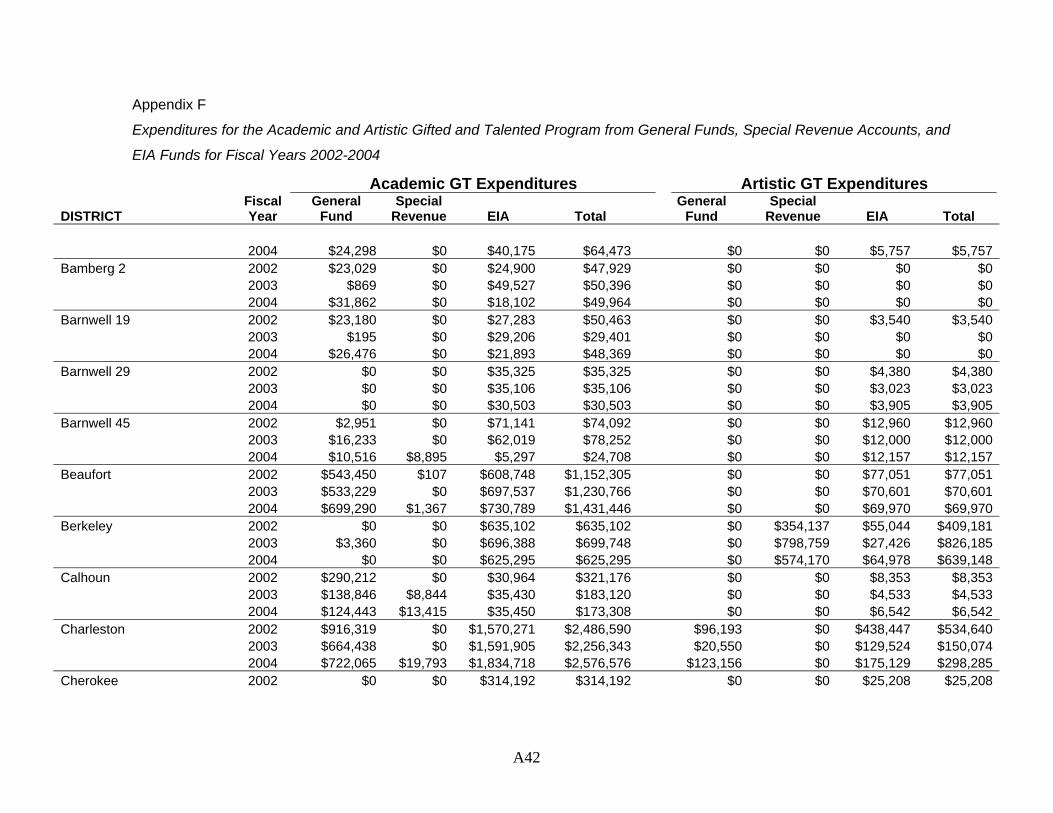
Appendix F
Expenditures for the Academic and Artistic Gifted and Talented Program from General Funds, Special Revenue Accounts, and
EIA Funds for Fiscal Years 2002-2004
Academic GT Expenditures Artistic GT Expenditures
DISTRICT Fiscal Year
General Fund
Special Revenue EIA Total
General Fund
Special Revenue EIA Total
2004 $24,298 $0 $40,175 $64,473 $0 $0 $5,757 $5,757
Bamberg 2 2002 $23,029 $0 $24,900 $47,929 $0 $0 $0 $0
2003 $869 $0 $49,527 $50,396 $0 $0 $0 $02004 $31,862 $0 $18,102 $49,964 $0 $0 $0 $0
Barnwell 19 2002 $23,180 $0 $27,283 $50,463 $0 $0 $3,540 $3,540
2003 $195 $0 $29,206 $29,401 $0 $0 $0 $02004 $26,476 $0 $21,893 $48,369 $0 $0 $0 $0
Barnwell 29 2002 $0 $0 $35,325 $35,325 $0 $0 $4,380 $4,380
2003 $0 $0 $35,106 $35,106 $0 $0 $3,023 $3,0232004 $0 $0 $30,503 $30,503 $0 $0 $3,905 $3,905
Barnwell 45 2002 $2,951 $0 $71,141 $74,092 $0 $0 $12,960 $12,960
2003 $16,233 $0 $62,019 $78,252 $0 $0 $12,000 $12,0002004 $10,516 $8,895 $5,297 $24,708 $0 $0 $12,157 $12,157
Beaufort 2002 $543,450 $107 $608,748 $1,152,305 $0 $0 $77,051 $77,051
2003 $533,229 $0 $697,537 $1,230,766 $0 $0 $70,601 $70,6012004 $699,290
$1,367 $730,789 $1,431,446 $0 $0 $69,970 $69,970
Berkeley 2002 $0 $0 $635,102 $635,102 $0 $354,137 $55,044 $409,181
2003 $3,360 $0 $696,388 $699,748 $0 $798,759 $27,426 $826,1852004 $0 $0 $625,295 $625,295 $0 $574,170
$64,978
$639,148
Calhoun 2002 $290,212 $0 $30,964 $321,176 $0 $0 $8,353 $8,353
2003 $138,846 $8,844 $35,430 $183,120 $0 $0 $4,533 $4,5332004 $124,443 $13,415 $35,450 $173,308 $0 $0 $6,542 $6,542
Charleston 2002 $916,319 $0 $1,570,271 $2,486,590 $96,193 $0 $438,447 $534,640
2003 $664,438 $1,591,905$0 $2,256,343 $20,550 $0 $129,524 $150,0742004 $722,065
$1,834,718$19,793 $2,576,576 $123,156
$0 $175,129 $298,285
Cherokee 2002 $0 $0 $314,192 $314,192 $0 $0 $25,208 $25,208
A42
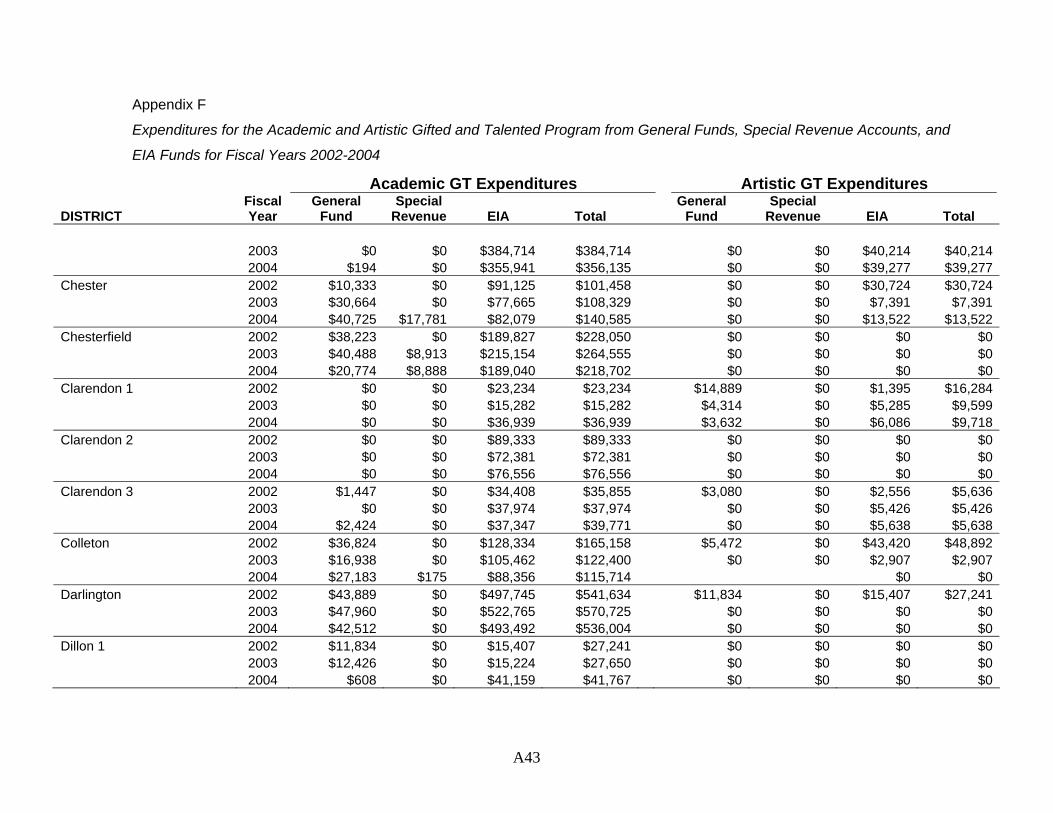
Appendix F
Expenditures for the Academic and Artistic Gifted and Talented Program from General Funds, Special Revenue Accounts, and
EIA Funds for Fiscal Years 2002-2004
Academic GT Expenditures Artistic GT Expenditures
DISTRICT Fiscal Year
General Fund
Special Revenue EIA Total
General Fund
Special Revenue EIA Total
2003 $0 $0 $384,714 $384,714 $0 $0 $40,214 $40,2142004 $194 $0 $355,941 $356,135 $0 $0 $39,277 $39,277
Chester 2002 $10,333 $0 $91,125 $101,458 $0 $0 $30,724 $30,724
2003 $30,664 $0 $77,665 $108,329 $0 $0 $7,391 $7,3912004 $40,725 $17,781 $82,079 $140,585 $0 $0 $13,522
$13,522 Chesterfield 2002 $38,223 $0 $189,827 $228,050 $0 $0 $0 $0
2003 $40,488 $8,913 $215,154 $264,555 $0 $0 $0 $02004 $20,774 $8,888 $189,040 $218,702 $0 $0 $0 $0
Clarendon 1 2002 $0 $0 $23,234 $23,234 $14,889 $0 $1,395 $16,284
2003 $0 $0 $15,282 $15,282 $4,314 $0 $5,285 $9,5992004 $0 $0 $36,939 $36,939 $3,632 $0 $6,086 $9,718
Clarendon 2 2002 $0 $0 $89,333 $89,333 $0 $0 $0 $0
2003 $0 $0 $72,381 $72,381 $0 $0 $0 $02004 $0 $0 $76,556 $76,556 $0 $0 $0 $0
Clarendon 3 2002 $1,447 $0 $34,408 $35,855 $3,080 $0 $2,556 $5,636
2003 $0 $0 $37,974 $37,974 $0 $0 $5,426 $5,4262004 $2,424 $0 $37,347 $39,771 $0 $0 $5,638 $5,638
Colleton 2002 $36,824 $0 $128,334 $165,158 $5,472 $0 $43,420 $48,892
2003 $16,938 $0 $105,462 $122,400 $0
$0 $2,907 $2,907 2004 $27,183 $175 $88,356 $115,714 $0 $0
Darlington 2002 $43,889 $0 $497,745 $541,634 $11,834 $0 $15,407 $27,241
2003 $47,960 $0 $522,765 $570,725 $0 $0 $0 $02004 $42,512 $0 $493,492 $536,004 $0 $0 $0 $0
Dillon 1 2002 $11,834 $0 $15,407 $27,241 $0 $0 $0 $0
2003 $12,426 $0 $15,224 $27,650 $0 $0 $0 $02004 $608 $0 $41,159 $41,767 $0 $0 $0 $0
A43
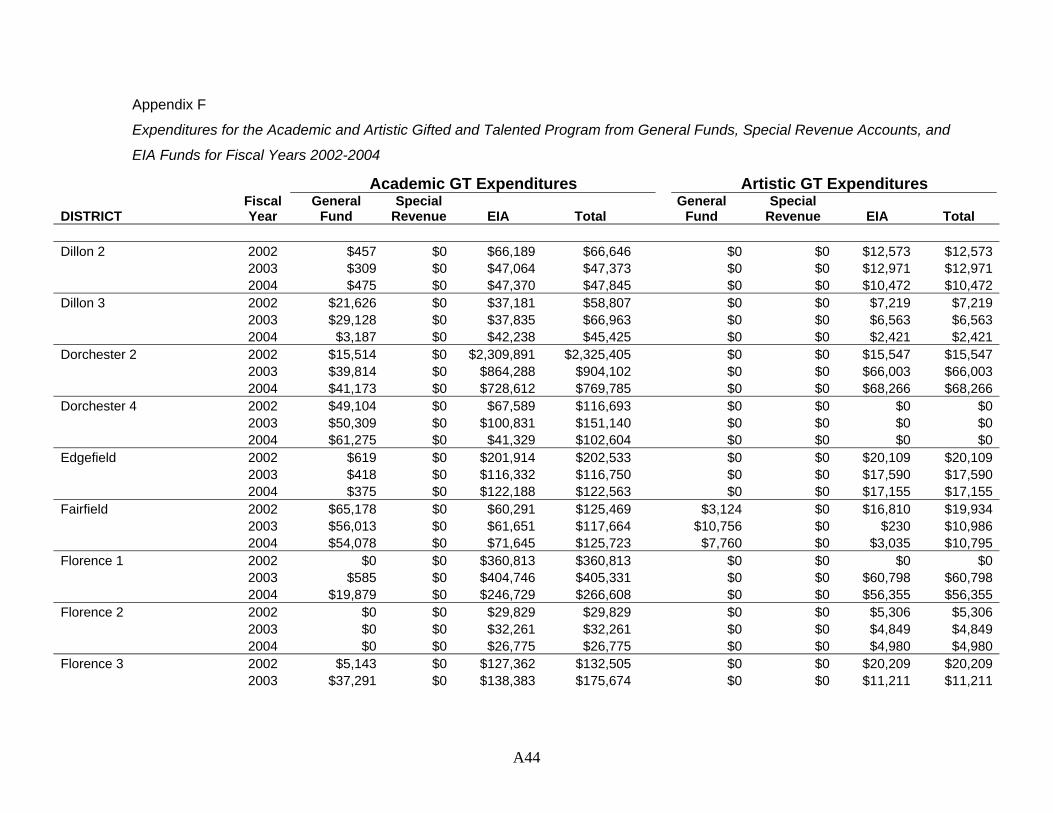
Appendix F
Expenditures for the Academic and Artistic Gifted and Talented Program from General Funds, Special Revenue Accounts, and
EIA Funds for Fiscal Years 2002-2004
Academic GT Expenditures Artistic GT Expenditures
DISTRICT Fiscal Year
General Fund
Special Revenue EIA Total
General Fund
Special Revenue EIA Total
Dillon 2 2002 $457 $0 $66,189 $66,646 $0 $0 $12,573 $12,573
2003 $309 $0 $47,064 $47,373 $0 $0 $12,971 $12,9712004 $475 $0 $47,370 $47,845 $0 $0 $10,472
$10,472 Dillon 3 2002 $21,626 $0 $37,181 $58,807 $0 $0 $7,219 $7,219
2003 $29,128 $0 $37,835 $66,963 $0 $0 $6,563 $6,5632004 $3,187 $0 $42,238 $45,425 $0 $0 $2,421 $2,421
Dorchester 2 2002 $15,514 $0 $2,309,891 $2,325,405 $0 $0 $15,547 $15,547
2003 $39,814 $0 $864,288 $904,102 $0 $0 $66,003 $66,0032004 $41,173 $0 $728,612 $769,785 $0 $0 $68,266
$68,266 Dorchester 4 2002 $49,104 $0 $67,589 $116,693 $0 $0 $0 $0
2003 $50,309 $0 $100,831 $151,140 $0 $0 $0 $02004 $61,275
$0 $41,329 $102,604 $0 $0 $0 $0
Edgefield 2002 $619 $0 $201,914 $202,533 $0 $0 $20,109 $20,109
2003 $418 $0 $116,332 $116,750 $0 $0 $17,590 $17,5902004 $375 $0 $122,188 $122,563 $0 $0 $17,155 $17,155
Fairfield 2002 $65,178 $0 $60,291 $125,469 $3,124 $0 $16,810 $19,934
2003 $56,013 $0 $61,651 $117,664 $10,756 $0 $230 $10,9862004 $54,078 $0 $71,645 $125,723 $7,760 $0 $3,035 $10,795
Florence 1 2002 $0 $0 $360,813 $360,813 $0 $0 $0 $0
2003 $585 $0 $404,746 $405,331 $0 $0 $60,798 $60,7982004 $19,879 $0 $246,729 $266,608 $0 $0 $56,355
$56,355 Florence 2 2002 $0 $0 $29,829 $29,829 $0 $0 $5,306 $5,306
2003 $0 $0 $32,261 $32,261 $0 $0 $4,849 $4,8492004 $0 $0 $26,775 $26,775 $0 $0 $4,980 $4,980
Florence 3 2002 $5,143 $0 $127,362 $132,505 $0 $0 $20,209 $20,209 2003 $37,291 $0 $138,383 $175,674 $0 $0 $11,211 $11,211
A44
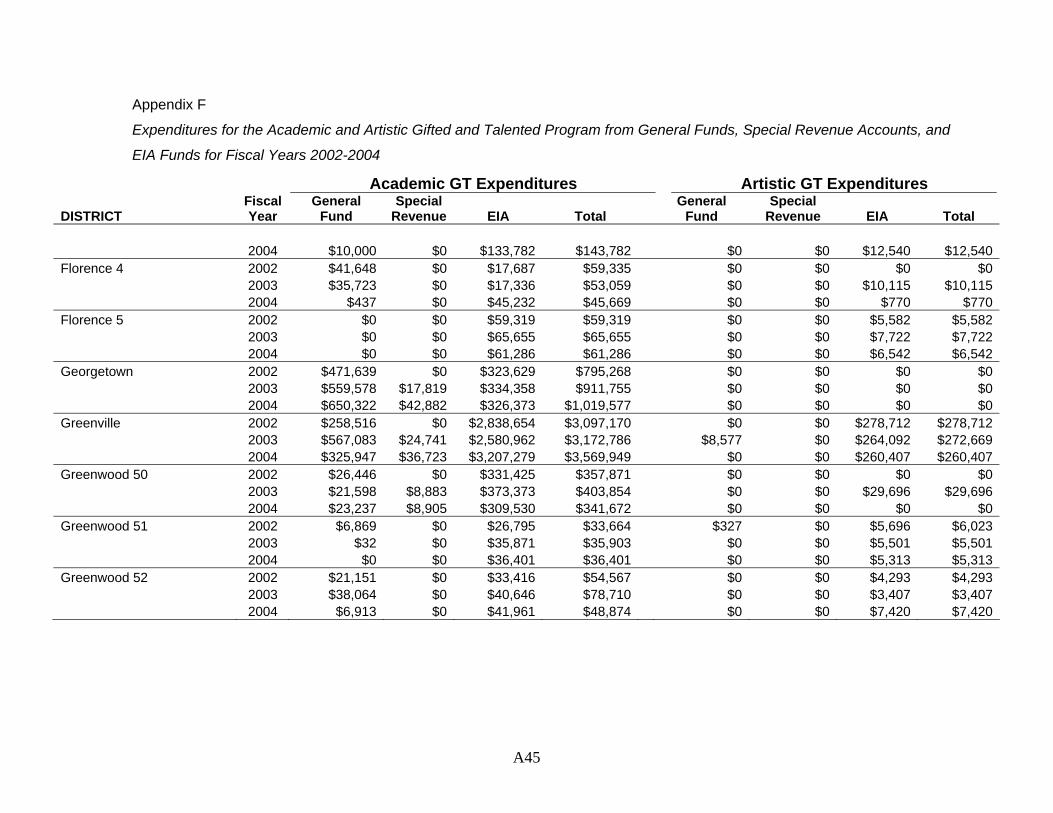
Appendix F
Expenditures for the Academic and Artistic Gifted and Talented Program from General Funds, Special Revenue Accounts, and
EIA Funds for Fiscal Years 2002-2004
Academic GT Expenditures Artistic GT Expenditures
DISTRICT Fiscal Year
General Fund
Special Revenue EIA Total
General Fund
Special Revenue EIA Total
2004 $10,000 $0 $133,782 $143,782 $0 $0 $12,540
$12,540 Florence 4 2002 $41,648 $0 $17,687 $59,335 $0 $0 $0 $0
2003 $35,723 $0 $17,336 $53,059 $0 $0 $10,115
$10,115 2004 $437 $0 $45,232 $45,669 $0 $0 $770 $770
Florence 5 2002 $0 $0 $59,319 $59,319 $0 $0 $5,582 $5,582
2003 $0 $0 $65,655 $65,655 $0 $0 $7,722 $7,7222004 $0 $0 $61,286 $61,286 $0 $0 $6,542 $6,542
Georgetown 2002 $471,639 $0 $323,629 $795,268 $0 $0 $0 $0
2003 $559,578 $17,819 $334,358 $911,755 $0 $0 $0 $02004 $650,322 $42,882 $326,373 $1,019,577 $0 $0 $0 $0
Greenville 2002 $258,516 $0 $2,838,654 $3,097,170 $0 $0 $278,712 $278,712
2003 $567,083 $2,580,962$24,741 $3,172,786 $8,577
$0 $264,092 $272,6692004 $325,947 $3,207,279$36,723 $3,569,949 $0 $0 $260,407
$260,407 Greenwood 50 2002 $26,446 $0 $331,425 $357,871 $0 $0 $0 $0
2003 $21,598 $8,883 $373,373 $403,854 $0 $0 $29,696
$29,696 2004 $23,237 $8,905 $309,530 $341,672 $0 $0 $0 $0
Greenwood 51 2002 $6,869 $0 $26,795 $33,664 $327 $0 $5,696 $6,023
2003 $32 $0 $35,871 $35,903 $0 $0 $5,501 $5,5012004 $0 $0 $36,401 $36,401 $0 $0 $5,313 $5,313
Greenwood 52 2002 $21,151 $0 $33,416 $54,567 $0 $0 $4,293 $4,293
2003 $38,064 $0 $40,646 $78,710 $0 $0 $3,407 $3,4072004 $6,913 $0 $41,961 $48,874 $0 $0 $7,420 $7,420
A45
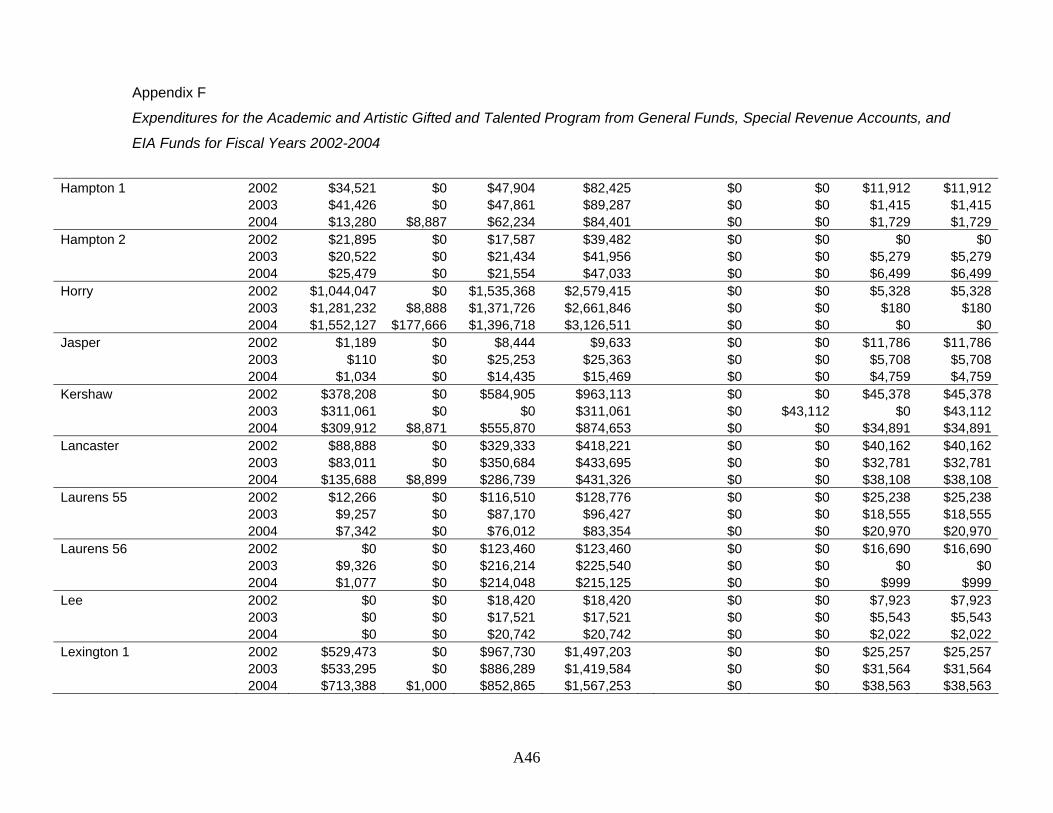
Appendix F
Expenditures for the Academic and Artistic Gifted and Talented Program from General Funds, Special Revenue Accounts, and
EIA Funds for Fiscal Years 2002-2004
Hampton 1 2002 $34,521 $0 $47,904 $82,425 $0 $0 $11,912 $11,912
2003 $41,426 $0 $47,861 $89,287 $0 $0 $1,415 $1,4152004 $13,280 $8,887 $62,234 $84,401 $0 $0 $1,729 $1,729
Hampton 2 2002 $21,895 $0 $17,587 $39,482 $0 $0 $0 $0
2003 $20,522 $0 $21,434 $41,956 $0 $0 $5,279 $5,2792004 $25,479 $0 $21,554 $47,033 $0 $0 $6,499 $6,499
Horry 2002 $1,044,047 $0 $1,535,368 $2,579,415 $0 $0 $5,328 $5,328
2003 $1,281,232 $1,371,726$8,888 $2,661,846 $0 $0 $180 $1802004 $1,552,127 $1,396,718$177,666 $3,126,511 $0 $0 $0 $0
Jasper 2002 $1,189 $0 $8,444 $9,633 $0 $0 $11,786 $11,786
2003 $110 $0 $25,253 $25,363 $0 $0 $5,708 $5,7082004 $1,034 $0 $14,435 $15,469 $0 $0 $4,759 $4,759
Kershaw 2002 $378,208 $0 $584,905 $963,113 $0 $0 $45,378 $45,378
2003 $311,061 $0 $0 $311,061 $0 $43,112 $0 $43,1122004 $309,912 $8,871 $555,870 $874,653 $0 $0 $34,891 $34,891
Lancaster 2002 $88,888 $0 $329,333 $418,221 $0 $0 $40,162 $40,162
2003 $83,011 $0 $350,684 $433,695 $0 $0 $32,781 $32,7812004 $135,688 $8,899 $286,739 $431,326 $0 $0 $38,108 $38,108
Laurens 55 2002 $12,266 $0 $116,510 $128,776 $0 $0 $25,238 $25,238
2003 $9,257 $0 $87,170 $96,427 $0 $0 $18,555 $18,5552004 $7,342 $0 $76,012 $83,354 $0 $0 $20,970 $20,970
Laurens 56 2002 $0 $0 $123,460 $123,460 $0 $0 $16,690 $16,690
2003 $9,326 $0 $216,214 $225,540 $0 $0 $0 $02004 $1,077
$0 $214,048 $215,125 $0 $0 $999 $999
Lee 2002 $0 $0 $18,420 $18,420 $0 $0 $7,923 $7,923
2003 $0 $0 $17,521 $17,521 $0 $0 $5,543 $5,5432004 $0 $0 $20,742 $20,742 $0 $0 $2,022 $2,022
Lexington 1 2002 $529,473 $0 $967,730 $1,497,203 $0 $0 $25,257 $25,257
2003 $533,295 $0 $886,289 $1,419,584 $0 $0 $31,564 $31,5642004 $713,388 $1,000 $852,865 $1,567,253 $0 $0 $38,563 $38,563
A46
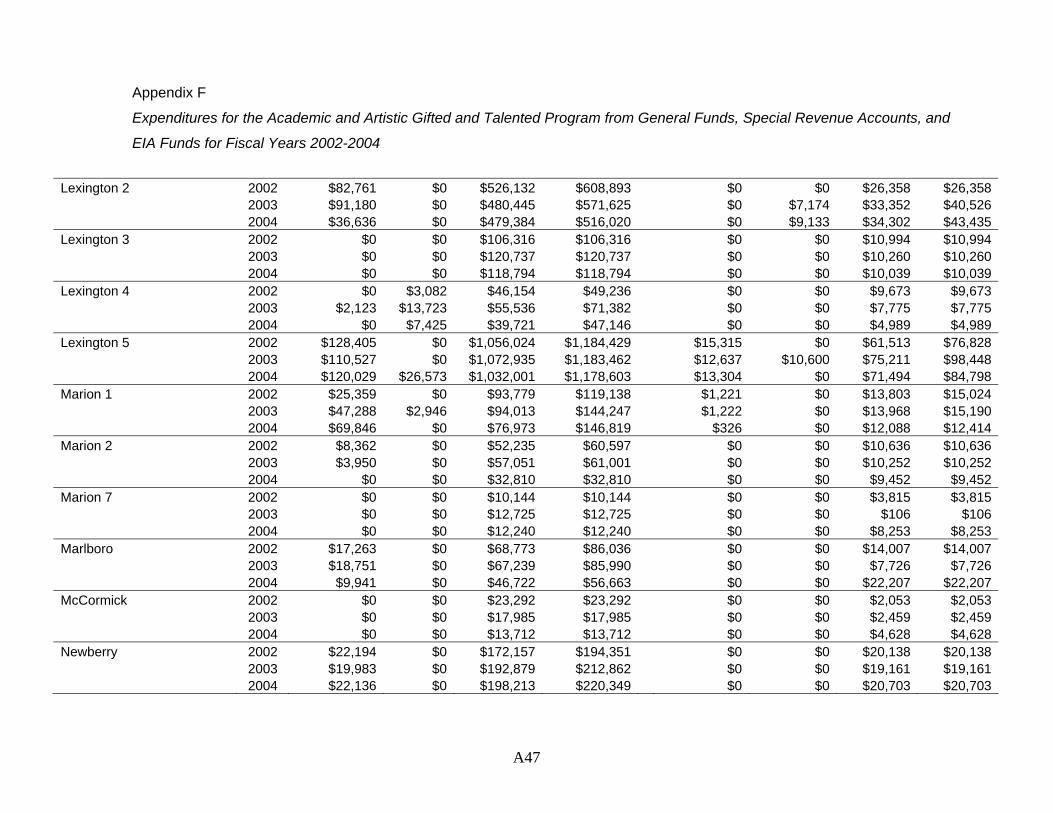
Appendix F
Expenditures for the Academic and Artistic Gifted and Talented Program from General Funds, Special Revenue Accounts, and
EIA Funds for Fiscal Years 2002-2004
Lexington 2 2002 $82,761 $0 $526,132 $608,893 $0 $0 $26,358 $26,358
2003 $91,180 $0 $480,445 $571,625 $0 $7,174 $33,352 $40,5262004 $36,636 $0 $479,384 $516,020 $0 $9,133 $34,302 $43,435
Lexington 3 2002 $0 $0 $106,316 $106,316 $0 $0 $10,994 $10,994
2003 $0 $0 $120,737 $120,737 $0 $0 $10,260 $10,2602004 $0 $0 $118,794 $118,794 $0 $0 $10,039
$10,039
Lexington 4 2002 $0 $3,082 $46,154 $49,236 $0 $0 $9,673 $9,673
2003 $2,123 $13,723 $55,536 $71,382 $0 $0 $7,775 $7,7752004 $0 $7,425 $39,721 $47,146 $0 $0 $4,989 $4,989
Lexington 5 2002 $128,405 $0 $1,056,024 $1,184,429 $15,315 $0 $61,513 $76,828
2003 $110,527 $1,072,935$0 $1,183,462 $12,637 $10,600 $75,211 $98,4482004 $120,029 $1,032,001$26,573 $1,178,603 $13,304 $0 $71,494 $84,798
Marion 1 2002 $25,359 $0 $93,779 $119,138 $1,221 $0 $13,803 $15,024
2003 $47,288 $2,946 $94,013 $144,247 $1,222 $0 $13,968 $15,1902004 $69,846 $0 $76,973 $146,819 $326 $0 $12,088 $12,414
Marion 2 2002 $8,362 $0 $52,235 $60,597 $0 $0 $10,636 $10,636
2003 $3,950 $0 $57,051 $61,001 $0 $0 $10,252
$10,252 2004 $0 $0 $32,810 $32,810 $0 $0 $9,452 $9,452
Marion 7 2002 $0 $0 $10,144 $10,144 $0 $0 $3,815 $3,815
2003 $0 $0 $12,725 $12,725 $0 $0 $106 $1062004 $0 $0 $12,240 $12,240 $0 $0 $8,253 $8,253
Marlboro 2002 $17,263 $0 $68,773 $86,036 $0 $0 $14,007 $14,007
2003 $18,751 $0 $67,239 $85,990 $0 $0 $7,726 $7,7262004 $9,941
$0 $46,722 $56,663 $0 $0 $22,207
$22,207
McCormick 2002 $0 $0 $23,292 $23,292 $0 $0 $2,053 $2,053
2003 $0 $0 $17,985 $17,985 $0 $0 $2,459 $2,4592004 $0 $0 $13,712 $13,712 $0 $0 $4,628 $4,628
Newberry 2002 $22,194 $0 $172,157 $194,351 $0 $0 $20,138 $20,138
2003 $19,983 $0 $192,879 $212,862 $0 $0 $19,161 $19,1612004 $22,136 $0 $198,213 $220,349 $0 $0 $20,703 $20,703
A47
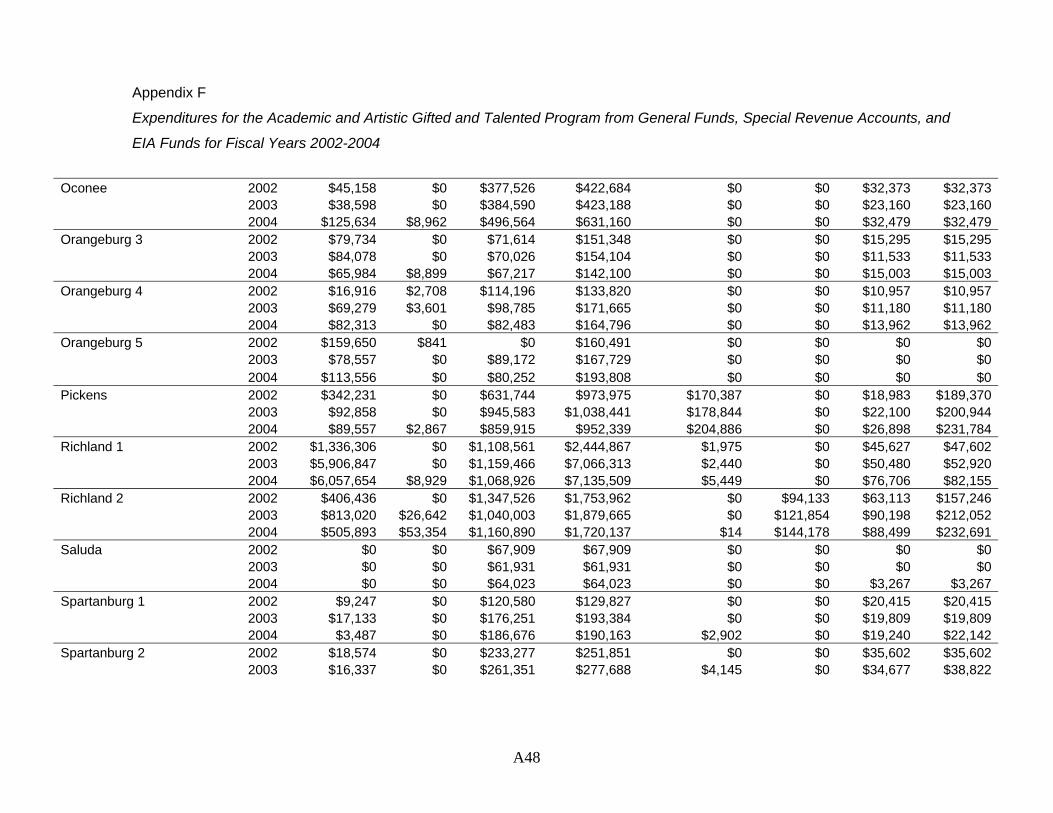
Appendix F
Expenditures for the Academic and Artistic Gifted and Talented Program from General Funds, Special Revenue Accounts, and
EIA Funds for Fiscal Years 2002-2004
Oconee 2002 $45,158 $0 $377,526 $422,684 $0 $0 $32,373 $32,373
2003 $38,598 $0 $384,590 $423,188 $0 $0 $23,160 $23,1602004 $125,634 $8,962 $496,564 $631,160 $0 $0 $32,479 $32,479
Orangeburg 3 2002 $79,734 $0 $71,614 $151,348 $0 $0 $15,295 $15,295
2003 $84,078 $0 $70,026 $154,104 $0 $0 $11,533 $11,5332004 $65,984 $8,899 $67,217 $142,100 $0 $0 $15,003 $15,003
Orangeburg 4 2002 $16,916 $2,708 $114,196 $133,820 $0 $0 $10,957 $10,957
2003 $69,279 $3,601 $98,785 $171,665 $0 $0 $11,180 $11,1802004 $82,313 $0 $82,483 $164,796 $0 $0 $13,962
$13,962
Orangeburg 5 2002 $159,650 $841 $0 $160,491 $0 $0 $0 $0
2003 $78,557 $0 $89,172 $167,729 $0 $0 $0 $02004 $113,556 $0 $80,252 $193,808 $0 $0 $0 $0
Pickens 2002 $342,231 $0 $631,744 $973,975 $170,387 $0 $18,983 $189,370
2003 $92,858 $0 $945,583 $1,038,441 $178,844 $0 $22,100 $200,9442004 $89,557 $2,867 $859,915 $952,339 $204,886 $0 $26,898 $231,784
Richland 1 2002 $1,336,306 $0 $1,108,561 $2,444,867 $1,975 $0 $45,627 $47,602
2003 $5,906,847 $1,159,466$0 $7,066,313 $2,440 $0 $50,480 $52,9202004 $6,057,654 $1,068,926$8,929 $7,135,509 $5,449 $0 $76,706 $82,155
Richland 2 2002 $406,436 $0 $1,347,526 $1,753,962 $0 $94,133 $63,113 $157,246
2003 $813,020 $1,040,003$26,642 $1,879,665 $0 $121,854 $90,198 $212,0522004 $505,893 $1,160,890$53,354 $1,720,137 $14 $144,178
$88,499
$232,691
Saluda 2002 $0 $0 $67,909 $67,909 $0 $0 $0 $0
2003 $0 $0 $61,931 $61,931 $0 $0 $0 $02004 $0 $0 $64,023 $64,023 $0 $0 $3,267 $3,267
Spartanburg 1 2002 $9,247 $0 $120,580 $129,827 $0 $0 $20,415 $20,415
2003 $17,133 $0 $176,251 $193,384 $0 $0 $19,809 $19,8092004 $3,487 $0 $186,676 $190,163 $2,902 $0 $19,240 $22,142
Spartanburg 2 2002 $18,574 $0 $233,277 $251,851 $0 $0 $35,602 $35,602 2003 $16,337 $0 $261,351 $277,688 $4,145 $0 $34,677 $38,822
A48
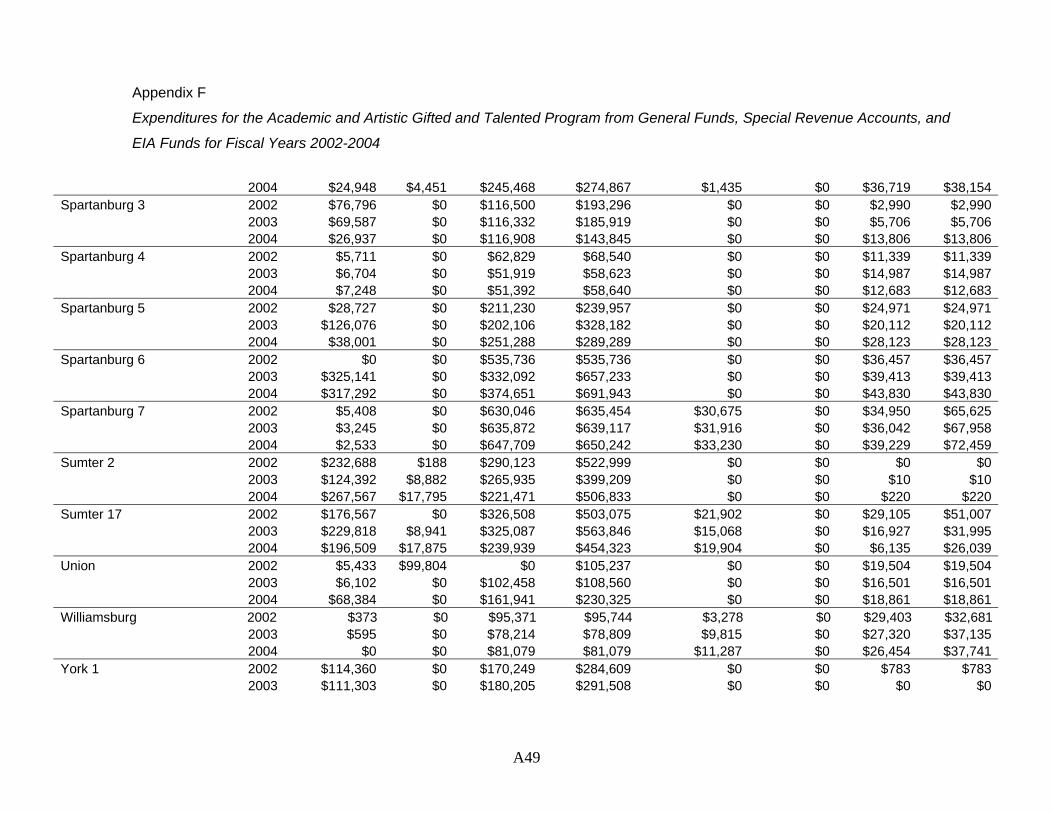
Appendix F
Expenditures for the Academic and Artistic Gifted and Talented Program from General Funds, Special Revenue Accounts, and
EIA Funds for Fiscal Years 2002-2004
2004 $24,948 $4,451 $245,468 $274,867 $1,435 $0 $36,719
$38,154
Spartanburg 3 2002 $76,796 $0 $116,500 $193,296 $0 $0 $2,990 $2,990
2003 $69,587 $0 $116,332 $185,919 $0 $0 $5,706 $5,7062004 $26,937 $0 $116,908 $143,845 $0 $0 $13,806 $13,806
Spartanburg 4 2002 $5,711 $0 $62,829 $68,540 $0 $0 $11,339 $11,339
2003 $6,704 $0 $51,919 $58,623 $0 $0 $14,987 $14,9872004 $7,248 $0 $51,392 $58,640 $0 $0 $12,683 $12,683
Spartanburg 5 2002 $28,727 $0 $211,230 $239,957 $0 $0 $24,971 $24,971
2003 $126,076 $0 $202,106 $328,182 $0 $0 $20,112 $20,1122004 $38,001 $0 $251,288 $289,289 $0 $0 $28,123 $28,123
Spartanburg 6 2002 $0 $0 $535,736 $535,736 $0 $0 $36,457 $36,457
2003 $325,141 $0 $332,092 $657,233 $0 $0 $39,413 $39,4132004 $317,292 $0 $374,651 $691,943 $0 $0 $43,830 $43,830
Spartanburg 7 2002 $5,408 $0 $630,046 $635,454 $30,675 $0 $34,950 $65,625
2003 $3,245 $0 $635,872 $639,117 $31,916 $0 $36,042 $67,9582004 $2,533 $0 $647,709 $650,242 $33,230 $0 $39,229
$72,459
Sumter 2 2002 $232,688 $188 $290,123 $522,999 $0 $0 $0 $0
2003 $124,392 $8,882 $265,935 $399,209 $0 $0 $10 $102004 $267,567 $17,795 $221,471 $506,833 $0 $0 $220 $220
Sumter 17 2002 $176,567 $0 $326,508 $503,075 $21,902 $0 $29,105 $51,007
2003 $229,818 $8,941 $325,087 $563,846 $15,068 $0 $16,927
$31,9952004 $196,509 $17,875 $239,939 $454,323 $19,904 $0 $6,135 $26,039
Union 2002 $5,433 $99,804 $0 $105,237 $0 $0 $19,504 $19,504
2003 $6,102 $0 $102,458 $108,560 $0 $0 $16,501 $16,5012004 $68,384 $0 $161,941 $230,325 $0 $0 $18,861 $18,861
Williamsburg 2002 $373 $0 $95,371 $95,744 $3,278 $0 $29,403 $32,681
2003 $595 $0 $78,214 $78,809 $9,815 $0 $27,320 $37,1352004 $0 $0 $81,079 $81,079 $11,287 $0 $26,454 $37,741
York 1 2002 $114,360 $0 $170,249 $284,609 $0 $0 $783 $783 2003 $111,303 $0 $180,205 $291,508 $0 $0 $0 $0
A49
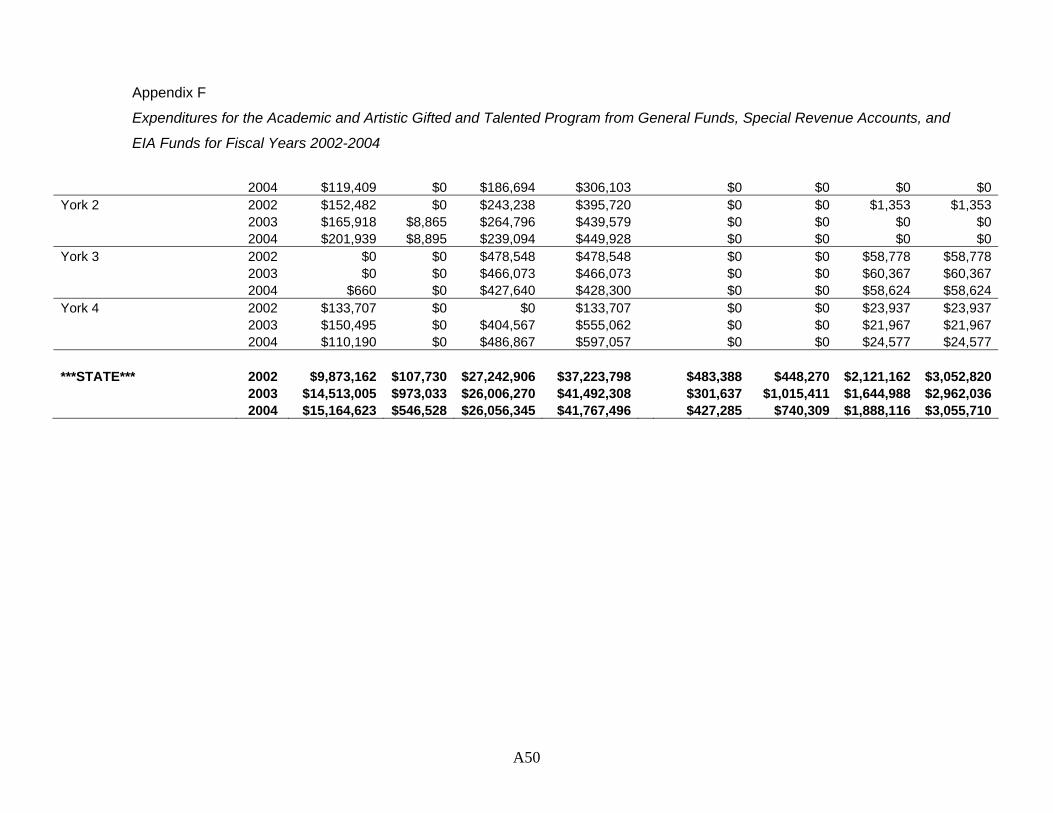
Appendix F
Expenditures for the Academic and Artistic Gifted and Talented Program from General Funds, Special Revenue Accounts, and
EIA Funds for Fiscal Years 2002-2004
2004 $119,409 $0 $186,694 $306,103 $0 $0 $0 $0
York 2 2002 $152,482 $0 $243,238 $395,720 $0 $0 $1,353 $1,353
2003 $165,918 $8,865 $264,796 $439,579 $0 $0 $0 $02004 $201,939 $8,895 $239,094 $449,928 $0 $0 $0 $0
York 3 2002 $0 $0 $478,548 $478,548 $0 $0 $58,778 $58,778
2003 $0 $0 $466,073 $466,073 $0 $0 $60,367 $60,3672004 $660 $0 $427,640 $428,300 $0 $0 $58,624 $58,624
York 4 2002 $133,707 $0 $0 $133,707 $0 $0 $23,937 $23,937
2003 $150,495 $0 $404,567 $555,062 $0 $0 $21,967 $21,9672004 $110,190
$0 $486,867
$597,057 $0 $0 $24,577
$24,577
***STATE***
2002 $9,873,162 $107,730 $27,242,906 $37,223,798 $483,388 $448,270 $2,121,162 $3,052,820 2003 $14,513,005 $26,006,270$973,033 $41,492,308 $301,637 $1,015,411 $1,644,988 $2,962,036 2004 $15,164,623 $546,528 $26,056,345 $41,767,496 $427,285 $740,309 $1,888,116 $3,055,710
A50
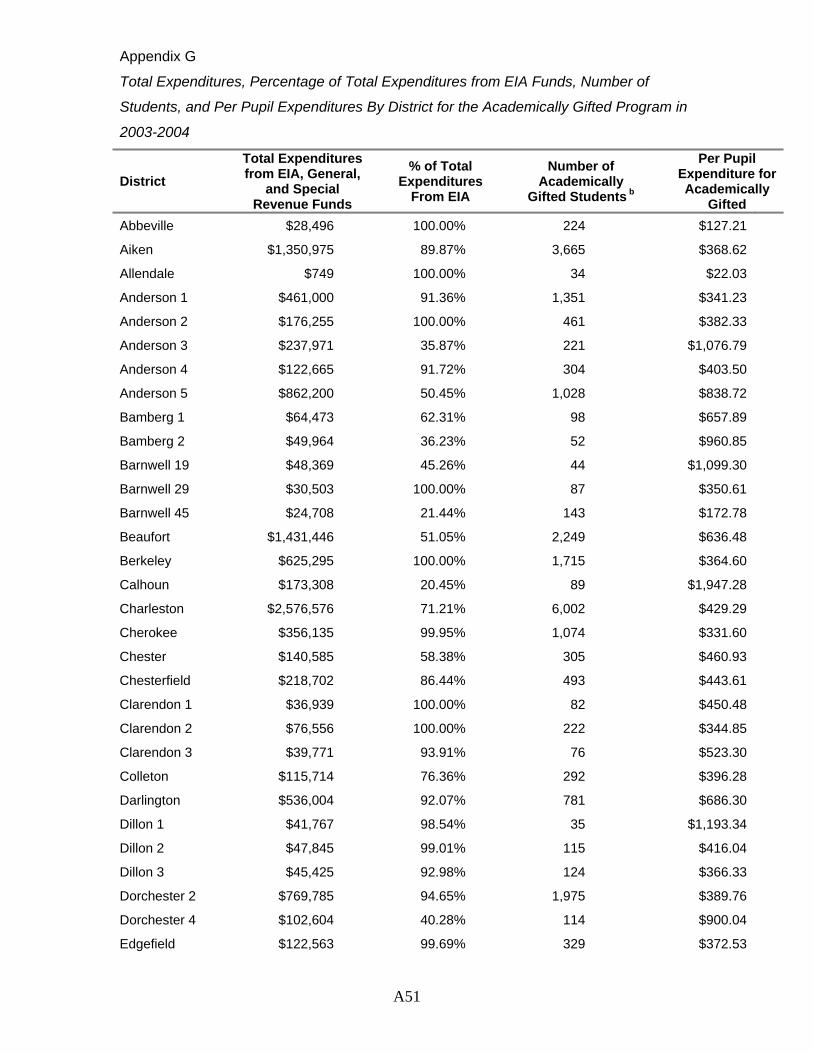
Appendix G
Total Expenditures, Percentage of Total Expenditures from EIA Funds, Number of
Students, and Per Pupil Expenditures By District for the Academically Gifted Program in
2003-2004
District Total Expenditures
from EIA, General, and Special
Revenue Funds
% of Total Expenditures
From EIA
Number of Academically
Gifted Students b
Per Pupil Expenditure for Academically
Gifted Abbeville $28,496 100.00% 224 $127.21
Aiken $1,350,975 89.87% 3,665 $368.62
Allendale $749 100.00% 34 $22.03
Anderson 1 $461,000 91.36% 1,351 $341.23
Anderson 2 $176,255 100.00% 461 $382.33
Anderson 3 $237,971 35.87% 221 $1,076.79
Anderson 4 $122,665 91.72% 304 $403.50
Anderson 5 $862,200 50.45% 1,028 $838.72
Bamberg 1 $64,473 62.31% 98 $657.89
Bamberg 2 $49,964 36.23% 52 $960.85
Barnwell 19 $48,369 45.26% 44 $1,099.30
Barnwell 29 $30,503 100.00% 87 $350.61
Barnwell 45 $24,708 21.44% 143 $172.78
Beaufort $1,431,446 51.05% 2,249 $636.48
Berkeley $625,295 100.00% 1,715 $364.60
Calhoun $173,308 20.45% 89 $1,947.28
Charleston $2,576,576 71.21% 6,002 $429.29
Cherokee $356,135 99.95% 1,074 $331.60
Chester $140,585 58.38% 305 $460.93
Chesterfield $218,702 86.44% 493 $443.61
Clarendon 1 $36,939 100.00% 82 $450.48
Clarendon 2 $76,556 100.00% 222 $344.85
Clarendon 3 $39,771 93.91% 76 $523.30
Colleton $115,714 76.36% 292 $396.28
Darlington $536,004 92.07% 781 $686.30
Dillon 1 $41,767 98.54% 35 $1,193.34
Dillon 2 $47,845 99.01% 115 $416.04
Dillon 3 $45,425 92.98% 124 $366.33
Dorchester 2 $769,785 94.65% 1,975 $389.76
Dorchester 4 $102,604 40.28% 114 $900.04
Edgefield $122,563 99.69% 329 $372.53
A51
Appendix G
Total Expenditures, Percentage of Total Expenditures from EIA Funds, Number of
Students, and Per Pupil Expenditures By District for the Academically Gifted Program in
2003-2004
District Total Expenditures
from EIA, General, and Special
Revenue Funds
% of Total Expenditures
From EIA
Number of Academically
Gifted Students b
Per Pupil Expenditure for Academically
Gifted Fairfield $125,723 56.99% 405 $310.43
Florence 1 $266,608 92.54% 779 $342.24
Florence 2 $26,775 100.00% 60 $446.25
Florence 3 $143,782 93.05% 390 $368.67
Florence 4 $45,669 99.04% 48 $951.44
Florence 5 $61,286 100.00% 195 $314.29
Georgetown $1,019,577 32.01% 911 $1,119.18
Greenville $3,569,949 89.84% 7,605 $469.42
Greenwood 50 $341,672 90.59% 906 $377.12
Greenwood 51 $36,401 100.00% 112 $325.01
Greenwood 52 $48,874 85.86% 150 $325.83
Hampton 1 $84,401 73.74% 104 $811.55
Hampton 2 $47,033 45.83% 32 $1,469.78
Horry $3,126,511 44.67% 4,122 $758.49
Jasper $15,469 93.32% 74 $209.04
Kershaw $874,653 63.55% 1,542 $567.22
Lancaster $431,326 66.48% 813 $530.54
Laurens 55 $83,354 91.19% 238 $350.23
Laurens 56 $215,125 99.50% 288 $746.96
Lee $20,742 100.00% 59 $351.56
Lexington 1 $1,567,253 54.42% 2,871 $545.89
Lexington 2 $516,020 92.90% 1,248 $413.48
Lexington 3 $118,794 100.00% 337 $352.50
Lexington 4 $47,146 84.25% 178 $264.87
Lexington 5 $1,178,603 87.56% 2,911 $404.88
Marion 1 $146,819 52.43% 44 $3,336.80
Marion 2 $32,810 100.00% 211 $155.50
Marion 7 $12,240 100.00% 85 $144.00
Marlboro $56,663 82.46% 35 $1,618.94
McCormick $13,712 100.00% 281 $48.80
Newberry $220,349 89.95% 588 $374.74
A52
Appendix G
Total Expenditures, Percentage of Total Expenditures from EIA Funds, Number of
Students, and Per Pupil Expenditures By District for the Academically Gifted Program in
2003-2004
District Total Expenditures
from EIA, General, and Special
Revenue Funds
% of Total Expenditures
From EIA
Number of Academically
Gifted Students b
Per Pupil Expenditure for Academically
Gifted Oconee $631,160 78.67% 1,070 $589.87
Orangeburg 3 $142,100 47.30% 170 $835.88
Orangeburg 4 $164,796 50.05% 225 $732.43
Orangeburg 5 $193,808 41.41% 124 $1,562.97
Pickens $952,339 90.30% 1,767 $538.96
Richland 1 $7,135,509 14.98% 2,962 $2,409.02
Richland 2 $1,720,137 67.49% 2,707 $635.44
Saluda $64,023 100.00% 177 $361.71
Spartanburg 1 $190,163 98.17% 636 $299.00
Spartanburg 2 $274,867 89.30% 577 $476.37
Spartanburg 3 $143,845 81.27% 332 $433.27
Spartanburg 4 $58,640 87.64% 139 $421.87
Spartanburg 5 $289,289 86.86% 656 $440.99
Spartanburg 6 $691,943 54.14% 979 $706.79
Spartanburg 7 $650,242 99.61% 1,253 $518.95
Sumter 2 $506,833 43.70% 618 $820.12
Sumter 17 $454,323 52.81% 863 $526.45
Union $230,325 70.31% 487 $472.95
Williamsburg $81,079 100.00% 208 $389.80
York 1 $306,103 60.99% 405 $755.81
York 2 $449,928 53.14% 646 $696.48
York 3 $428,300 99.85% 1,276 $335.66
York 4 $597,057 81.54% 1,412 $422.84
A53
Appendix H
Additional Roles, Departments, and Program of District Coordinators of Gifted and
Talented Programs
Academic assistance
Academic Bowl
Academic Plan for Students
ADEPT (Assisting, Developing, and
Evaluating Professional Teachers)
Coordinator/Director
Advanced Placement Coordinator
Artistic Gifted and Talented
Artistic Screening and Placement
Coordinator
Arts Program Director
Assistant principal
Career and Technology Education
Charter school site manager
Databases
Director of Academic Programs
Director of Curriculum and Instruction
Director of Early Childhood Programs
Director of Elementary Programs
Director of Middle schools
Director of Secondary Education
Director of Special Academic Programs
Director of Special Education
Director of Special Services
Distance learning
District Report Card Coordinator
ESOL (English for Speakers of Other
Languages)
Fine Arts
Foreign Exchange
Grants Coordinators
Guidance Counselor
Homebound
Home schooling
HOUSSE Evaluator (High Objective
Uniform State Standards of
Evaluation)
Instructional technology
Jr. Scholars Coordinator
Lottery
Magnet schools
Manager of special projects
Office of Civil Rights (OCR)
Personnel
Pre-code
Public Information Officer (PIO)
Professional development coordinator
Program director summer school
Recertification Coordinator
SACS (Southern Association of
Colleges and Schools)
Safe and Drug Free Schools
Special Revenue Project Coordinator
Strategic planning
Subject coordinator
Summer enrichment programs
Teachers
Teacher of the Year
Teacher Support Team
Testing Coordinators
Thinking Maps School Lead Team
Title I, II, III, IV
A54
Related Documents