A Decision Support System for Vendor Managed Inventory DALE D. ACHABAL SHELBY H. MCINTYRE STEPHEN A. SMITH KIRTHI KALYANAM Santa Clara University Recently, vendors and retailers have begun to forge cooperative agreements to manage inventory, which requires sharing demand information and setting mutually agreed upon performance targets for the supply chain. This paper describes the market forecasting and inventory management components of a Vendor Managed Inventory (VMI) decision support system and how this system was implemented by a major apparel manufacturer and over 30 of its retail partners. The DSS also helped the vendor and retailers arrive at jointly agreed upon customer service level and inventory turnover targets. As a result of implementing this VMI system, customer service levels improved dramatically, often coupled with a significant improvement in inventory turnover. The VMI performance results relative to the existing system and related insights for supply chain coordination are discussed. Vendor Managed Inventory (VMI) systems have been initiated by certain manufacturers to improve both retail customer service levels and inventory turnover. VMI systems achieve these goals through more accurate sales forecasting methods and more effective distribution of inventory in the supply chain. The VMI system allows the retailer to expand the assortment of the vendor’s products that can be offered within a given retail space. This improves the profitability of the vendor’s brand for both the retailer and the vendor. Retailers working alone are generally not able to achieve the same productivity increases because the vendor is the one able to provide a more responsive replenishment system based on more precise demand information. Dale D. Achabal is the L.J. Skaggs Distinguished Professor and Director, Retail Management Institute ([email protected]); Shelby H. McIntyre is Professor of Marketing ([email protected]); Stephen A. Smith is the J.C. Penney Research Professor & Associate Director for Research, Retail Management Institute ([email protected]); Kirthi Kalyanam is Associate Professor and Director of e.commerce Initiatives ([email protected]). All are in the Leavey School of Business & Administration, Santa Clara University, 500 El Camino Real, Santa Clara, CA 95053. Journal of Retailing, Volume 76(4) pp. 430 – 454, ISSN: 0022-4359 Copyright © 2000 by New York University. All rights of reproduction in any form reserved. 430

Welcome message from author
This document is posted to help you gain knowledge. Please leave a comment to let me know what you think about it! Share it to your friends and learn new things together.
Transcript

A Decision Support System for VendorManaged Inventory
DALE D. ACHABALSHELBY H. MCINTYRESTEPHEN A. SMITHKIRTHI KALYANAMSanta Clara University
Recently, vendors and retailers have begun to forge cooperative agreements to manageinventory, which requires sharing demand information and setting mutually agreed uponperformance targets for the supply chain. This paper describes the market forecasting andinventory management components of a Vendor Managed Inventory (VMI) decisionsupport system and how this system was implemented by a major apparel manufacturerand over 30 of its retail partners. The DSS also helped the vendor and retailers arrive atjointly agreed upon customer service level and inventory turnover targets. As a result ofimplementing this VMI system, customer service levels improved dramatically, oftencoupled with a significant improvement in inventory turnover. The VMI performanceresults relative to the existing system and related insights for supply chain coordination arediscussed.
Vendor Managed Inventory (VMI) systems have been initiated by certain manufacturersto improve both retail customer service levels and inventory turnover. VMI systemsachieve these goals through more accurate sales forecasting methods and more effectivedistribution of inventory in the supply chain. The VMI system allows the retailer toexpand the assortment of the vendor’s products that can be offered within a given retailspace. This improves the profitability of the vendor’s brand for both the retailer and thevendor. Retailers working alone are generally not able to achieve the same productivityincreases because the vendor is the one able to provide a more responsive replenishmentsystem based on more precise demand information.
Dale D. Achabal is the L.J. Skaggs Distinguished Professor and Director, Retail Management Institute([email protected]); Shelby H. McIntyre is Professor of Marketing ([email protected]); Stephen A. Smith isthe J.C. Penney Research Professor & Associate Director for Research, Retail Management Institute([email protected]); Kirthi Kalyanam is Associate Professor and Director of e.commerce Initiatives([email protected]). All are in the Leavey School of Business & Administration, Santa Clara University, 500El Camino Real, Santa Clara, CA 95053.
Journal of Retailing, Volume 76(4) pp. 430–454, ISSN: 0022-4359Copyright © 2000 by New York University. All rights of reproduction in any form reserved.
430

The VMI system we describe uses a decision support system (DSS) to develop aspecific model for each retailer that provides weekly sales forecasts (even in difficultpromotional retail environments). The DSS further assists the user with decision methodsfor inventory management and models for measuring and improving system performance.Under the VMI agreement, the retailer provides seasonal promotional plans and sales datato the vendor. The vendor then produces the sales forecasts and supplies the inventory tomeet agreed upon customer service levels and inventory turnover targets. The DSS alsohelps the vendor and each retail partner to jointly set customer service levels and inventoryturnover targets by evaluating alternative inventory level and replenishment decisions andidentifying achievable system performance levels.
The DSS described here has been implemented by a major apparel manufacturer inconjunction with over 30 of its key retail accounts. The VMI system has been highlysuccessful. Over a three-year period, service levels have improved dramatically, withminor increases in the retailers’ inventory levels. In many cases, the participating retailers’buyers have found that the VMI system’s forecasts are more accurate than their own andthey now rely on these forecasts for merchandise planning.
One of the vendor’s primary objectives in this VMI system was to increase customerservice level through better forecasts and more effective use of inventory. This would leadto a higher availability of sizes and color choices, thus making this vendor’s brandrelatively more attractive and therefore achieve increased sales. In principle, one couldargue that it might be difficult to persuade the retailers to increase their service levels, asopposed to simply using the VMI’s improved inventory management to increase theirinventory turnover. However, in this instance, the participating retailers had set high goalsfor customer service level, but were failing to meet them because of inaccurate salesforecasting and/or suboptimal inventory allocation. Thus, when the VMI system causedthe customer service level to increase with a relatively small amount of additionalinventory investment, both the vendor and the retailers experienced improved results.
Related Supply Chain Literature
VMI can be viewed as an example of channel coordination, which has been studied byboth marketing and supply chain researchers. The supply chain literature, recently sur-veyed by Tsay et al. (1998), develops an economic rationale for why retailers and vendorsmay choose different levels of inventory investment. In particular, Narayan and Raman(1997) and Cachon (1997) study the coordination of inventory levels when the retail priceis fixed and develop models for the effects of VMI on service level and channel profits.They argue that the vendor may have a higher perceived cost of stockouts than the retailer.This may occur because the retailer’s profit margin per unit is lower than the vendor’s, orbecause a customer may simply substitute a different brand at the same store when astockout occurs. This clearly results in a shortage cost that is larger for the vendor than forthe retailer. These cost differences can cause retailers to select a lower customer servicelevel than the manufacturer would prefer.
The marketing models, beginning with the seminal paper by Jeuland and Shugan
Managing Inventory 431
(1983), compare both the prices and the “level of channel effort” that retailers choose,versus those the vendor would choose, to optimize the complete channel. For our VMIapplication, retail prices were fixed, due to legal considerations. Thus, the VMI channelcoordination problem in this paper more closely resembles the situation studied byDesiraju and Moorthy (1997). They consider the case of demand uncertainty and proposejointly set performance requirements as a means of coordinating channel effort among theretailers. In the VMI context, the retailer’s inventory investment and the correspondingcustomer service level can be viewed as an example of “channel effort” that has adecreasing marginal impact on demand. The conclusion of the related marketing literatureis again that without channel coordination retailers will tend to provide a lower level of“effort” than is needed to maximize channel profits.
Collaborative, forecasting, planning and replenishment, or CPFR1, systems also im-prove sales forecasts through information sharing between retailers and vendors. CPFRagreements typically go further than this paper’s VMI system in that they develop jointbusiness plans with specified financial remedies when targets are not met. On the otherhand, a CPFR system need not include a vendor managed DSS for sales forecasting,inventory management and performance analysis. A CPFR approach to sales forecastingmay not lead to the same improvements in accuracy as VMI, since they are typicallycollaborative subjective forecasting efforts. Quick Response (Q/R) systems, which havealso been implemented by a number of vendors, focus on reducing the lead time forreplenishment, which in turn reduces the need for safety stock and thus improvesinventory turnover. A VMI system can potentially achieve these same objectives.
This paper makes the following contributions to retailing research in supply chainmanagement. It:
● Combines promotion response and parameter updating models developed in themarketing and forecasting literature with inventory management and system per-formance models developed in the management science literature. This is a novelintegration of these individual models into a single decision support system.
● Describes a major multicompany implementation of a VMI decision support systemand the resulting improvements in supply chain performance.
● Provides an example of how certain incentive incompatibilities in retail supply chainmanagement can be resolved and discusses the relationship to channel coordinationtheory.
VMI BACKGROUND AND BENEFITS
A key business motivation for developing VMI replenishment systems is to develop adeeper partnership between the vendor and key retail accounts. Some of the specific goalscited for this system were to: (1) give the retailers’ customers the best opportunity topurchase the vendor’s products, (2) help the retailers manage their inventory moreeffectively, and (3) assist the vendor in production scheduling2.
To understand the importance of enhancing the vendor/retailer relationship, it is useful
432 Journal of Retailing Vol. 76, No. 4 2000

to consider the typical retail decision-making environment for forecasting and inventorymanagement. Buyers for department store chains are responsible for 20 to 40 productcategories, which may include thousands of individual SKUs at the style-color-size level.For example, a product category might be Levi 501 stone washed denim jeans. Buyersgenerate an aggregate (chainwide or regional level) forecast and use historical ratios toforecast sales allocations among the individual SKUs and stores (e.g., 40% of past saleswere medium size, 2.2% of sales in the Eastridge store).
Buyers are also responsible for planning and executing temporary price promotions thatinclude newspaper, radio, or TV support.3 Many of the phenomena that affect sales in acategory are observable only infrequently (e.g., Father’s Day coupled with a radio ad).Thus, the opportunities for the buyer to learn from previous decisions are limited andperplexing. At the same time, buyers monitor sales trends on a weekly basis andcorrespondingly adjust their forecasts. These forecast updates are often made intuitivelybased on ad hoc rules.
Specifically VMI offers the following benefits. For the retailer:
● More effective inventory management and less uncertainty regarding inventoryturnover and customer service levels. The VMI system provides a way to set andachieve performance targets for both these goals.
● A cost-effective way to obtain sales forecasting and inventory management services.As the vendor’s analysts implemented the system across many retailers, economiesof scale were achieved in both the development and the customization of the models.This lead to a VMI forecasting system that was more accurate and developed at alower cost than could be realized by any individual retailer.
For the vendor:
● VMI provides a method for the vendor to increase the availability of their brand instores, relative to competitors’ brands, and still meet the retailers’ budgetaryopen-to-buy constraints.
● Retailers’ orders are often misleading data for production planning. Orders do notprovide accurate information about which merchandise sells more rapidly and whichstyles stocks out in midseason, for example. Furthermore, less popular styles andcolors are typically sold eventually through markdowns. Relying on actual sales dataalso prevents the “bullwhip effect” (Lee, Padmanabhan, and Whang, 1997), thatoccurs when time lags, coupled with batch orders from the retailer, tend to amplifydemand fluctuations as they go up the supply chain.
● VMI also reduces the opportunity and incentives for gaming, for example, retailerssometimes intentionally inflate orders when product supplies are limited and pro-portionally allocated by the vendor.
In this paper, we first describe the forecasting, inventory management and systemsperformance models, followed by an overview of the decision support system for imple-menting the VMI. We then discuss the implementation of the VMI system by a major
Managing Inventory 433

apparel vendor and the benefits achieved. We conclude with insights for future imple-mentations and research.
MODEL DEVELOPMENT
An overview of the models developed for the VMI system is shown in Figure 1. Theforecasting modelprovides the weekly forecasts at the product level for a specific retailerand an estimate for the standard error of the demand, which are required as inputs for theinventory decision model. The product sales forecast is also used by the vendor forproduction planning and by the participating retailers for merchandise planning. Theparameter estimationprovides initial values for the parameters of theforecasting modeland theupdating modelthen smoothes them each week to adjust for changes in salespatterns over time. Theinventory decision modeldetermines the appropriate stock levelsfor each SKU at each store in each week of the season, depending on the forecasteddemand and the choice of inventory management policy. These models also offer the
FIGURE 1
Models Used for VMI Decision Support System
434 Journal of Retailing Vol. 76, No. 4 2000

capability to do “what if?” analyses by simulating the performance results that can beobtained with different choices of inventory management policies.
The Inventory Decision Model
Retailers tend to replenish the inventory of each product category on a fixed schedule(once a week is typical). In this context, the classical “news vendor” inventory modelprovides a good approximation for the inventory replenishment decision (Nahmias andSmith, 1994). Conceptually, the target inventory level at the beginning of the cycle foreach SKU at each store has the form:
s 5 Forecasted Demand1 Safety Stock,
where the time period for the forecast is the inventory “cycle time” between replenish-ments.
We adopt the common assumption that the demand per cycle is normally distributed. Inthis case, the safety stock for any particular SKU can be expressed as:
Safety Stock5 z* s~t!,
wheres(t) 5 the standard deviation of the sales forecast error in weekt andz is chosensuch that P{demand# s} 5 target service level. Estimates ofs(t) are computed by theforecasting model in the VMI system, as we discuss later in the paper.
We use a “top down” model that allocates the total forecasted sales for each product ateach retailer across the product’s SKUs and the retailer’s stores. This is preferable to a“bottom up” forecasting model for this application because the low weekly sales rates atthe store and SKU level generate extremely noisy estimates of demand.
Thus, for a given retailer, we have that:
Fin(t) 5 forecasted sales of SKUi at storen in week t is given by
Fin~t! 5 fin F~t!. (1)
where:
F~t! 5 total forecasted product sales at this retailer in weekt
fin 5 fraction of sales of SKUi occurring at storen.
If the retailer has micromarketing data that forecast the individual SKU and store sellingrates, the fractionsfin can be estimated directly. In our application, no micromarketing data
Managing Inventory 435

were available, and consequently separate store and SKU proportions were determinedindependently.
Because the vendor can observe the proportional selling patterns for each size and colorof a particular product across all its retail customers, the SKU selling proportions can bedefined as:
fi 5 fraction of product sales coming from SKUi .
Similarly, each retailer can estimate the expected proportion of sales for each store in thechain for a product of this kind. This defines:
gn 5 historical proportion of product sales coming from storen.
This leads to a first order approximation fin 5 fi gn that uses readily available data.The allocated forecastFin(t) 5 fi gn F(t) from (1) then combines the vendor’s knowl-
edge of proportional selling patterns for SKUs obtained across all retailers with eachretailer’s knowledge of the stores’ selling proportions within that chain.
If we define:
s2in~t! 5 the variance of demand for SKUi at storen,
then the target stock levels:
sin~t! 5 stock level for SKUi at storen in weekt
can be determined from the safety stock formula discussed previously:
sin~t! 5 F in~t! 1 z * s in~t!. (2)
The z value is determined by the customer service level target, that is,
F~z! 5 P{the SKU is in stock for the entire cycle time},
with F(z) 5 the cumulative of the standard normal distribution.In some cases, the desired service levelF(z) is set by corporate policy, for example,
95%. Service level can also be chosen to minimize the sum of expected shortage andinventory costs by using the “critical ratio” formula (see, e.g., Nahmias, 1997, p. 275)
F~z! 5 cu / ~cu 1 ce!, (3)
wherecu 5 the cost per unit of inventory shortage
ce 5 the holding cost per unit of excess inventory.
436 Journal of Retailing Vol. 76, No. 4 2000

Clearly, service level increases withce and decreases withcu. When the retailer and thevendor have different values for these costs channel distortions can result, as notedpreviously.
A simple approximation forsin(t) can be obtained by allocating the total variances2(t)proportionally to each SKU/store combination, that is, lets2
in(t) 5 fin s2(t). In the likelycase that the SKU/store sales are positively correlated for a given product, this becomesa conservative approximation becauses2(t) is larger than the sum of the individualvariances when there is positive correlation.
Improving the forecast accuracy reduces the safety stock by reducings(t). Morefrequent inventory replenishments, offered by Quick Response and VMI, reduce both theforecasted demand and the safety stock, since both depend directly on the cycle time.
Using the Inventory Decision Models to Set Performance Targets
An essential part of the VMI system was developing jointly agreed upon performancetargets for each retailer. Each retailer had a number of goals and constraints, whichincluded:
1. Minimum total inventory levels for each SKU for presentation purposes.2. Initial total season open-to-buy budgets for each product.3. Inventory turnover requirements.4. Customer service level.
Clearly, some of these objectives are conflicting and some combinations of constraintsmay be infeasible. The inventory decision models were used as part of the VMI DSS tounderstand the tradeoffs between the constraints and the system performance for eachretailer.
Minimum store inventory constraints can be expressed as:
sin~t! $ min for all i , n, and t, (4)
wheremin is the minimum presentation inventory required for SKUi at storen. The initialopen-to-buy (OTB) budget can be expressed as:
Oi,n,t
cisin~t! # B, (5)
whereci 5 the standard unit cost for SKUi andB is the retailer’s OTB budget.The forecasted annual inventory turnover for a product at a particular retailer can be
predicted from the total annualized sales forecast divided by the average target inventoryover the season:
Managing Inventory 437

Retailer’s Annualized Inventory Turnover5
52*Ot
F~t!/W
Oi,n,t
sin~t!/W. (6)
whereW 5 length of the season in weeks. (Note thatW cancels out of this ratio.)For normally distributed demand, the service level:
a in~t! 5 P$SKU i is in stock at storen for the complete inventory cycle%
can be predicted for any particular choice ofsin(t). The weighted average system servicelevel a can then be defined as shown below:
a in~t! 5 FSsin~t! 2 Fin~t!
s in~t!D (7)
a 5
Oi,n,t
a in~t!Fin~t!
Ot
F~t!. (8)
These formulas thus provide the basis for determining the tradeoffs between inventoryinvestment and service level for each specific retailer.
The Sales Forecasting Model
The sales forecasts generated by the model must meet three specific goals:
1. Provide the forecasted weekly demand and the forecast error inputs for theinventory decision model,
2. Provide the long-term aggregate forecasts for the vendor’s production planning;and
3. Provide weekly promotion response forecasts for buyers for use in their merchan-dise planning.
Because the forecasting model is used for many different retailers, it must be flexibleand customizable. We specified a general class of models that includes several functionalforms for sales response that have previously been applied successfully by marketingresearchers.
Forecasted salesF(t) for a product in any given weekt of the season are expressed asa product of Baseline SalesS0, Seasonal EffectsV(t) and Merchandising EffectsM(x), asshown in (9):
438 Journal of Retailing Vol. 76, No. 4 2000

Sales5 FBaselineSales G 3 FSeasonal
Effect G 3 FMechandisingEffects G , (9)
or F~t! 5 S0V~t!M~x!.
The weekly sales forecast in (9) corresponds to the total sales of all sizes of the givenproduct. If merchandising decisions are made at the corporate level, the forecast corre-sponds to the sum of sales across all stores. However, if merchandising decisions are madeat a regional or zone level, the same model can be applied to these forecasts as well. Asnoted previously, while the sales model could also be applied at the individual SKU/storelevel, the weekly unit sales rates are too low for reliable parameter estimation.
Baseline salesare sometimes referred to as “normal” sales or “de-promoted” sales. Theseasonal effectcaptures the periodic seasonal variations in sales that are due to factorssuch as holidays and back-to-school.Merchandising effectsinclude all factors affectingsales that are controllable by the retailer, such as price, advertising and in-store presen-tation. The settings of these variables are specified each week by the retailer as representedby the vectorx 5 x1, x2, . . . , xm, which is set by the retailer.
We also use a multiplicatively separable model to combine the individual merchandis-ing effects. The general form is:
M~x! 5 Pi51
m
@c i~xi /xi0!#vi, (10)
wherexi 5 the setting for the marketing variablei
xi0 5 a normalizing value for variablei
n i 5 the elasticity or sensitivity parameter for variablei .
The functionci(xi /xi0) in (10) takes one of three forms, which can be tested to determine
the best functional form for each merchandising effect:
1. c i~xi /xi0! 5 xi /xi
0 constant elasticity (11)
2. c i~xi /xi0! 5 e12xi/xi0, wherexi , xi
0 exponential (12)
3. c i~xi /xi0! 5 exi, wherexi 5 0 or 1. simple multiplier (13)
All three forms have the advantage that taking a natural logarithm of Equation (10) resultsin a linear function of the parameters {ni}, which allows these parameters to be estimatedby linear regression.
The multiplicative sales response model presented in Equations (9) through (13) builds
Managing Inventory 439

on several studies that have found multiplicative (nonlinear) models to be better thanadditive ones (See the review in Kalyanam, 1996). However, there is less of a consensusregarding the exact nonlinear functional form that is most appropriate for an individualmerchandising effect. Some studies have used the exponential form (12) to model pricesensitivity when periodic promotions are used (Blattberg and Wisniewski, 1989). Thisfunctional form can be written ase2hp or eh(12p/p0), wherep0 is the regular price andp isthe temporary markdown price.4 Others (e.g., Achabal et al., 1990) have used the constantelasticity form (11) written as (p0/p)g for modeling response to temporary price promo-tions. This form is similar to the Cobb–Douglas models used in the economics literaturefor modeling sensitivity to permanent price changes. Both forms provide similar forecastaccuracy (Kalyanam, 1996).
The following equation illustrates one example specification of the forecasting modelthat was used for several retailers. For other retailers, fewer effects or different modelforms were determined to be more appropriate.
M~p,A,L,T,d! 5 Sp0
pDg S A
A0Da SL
7Dt Sp0
pDb~121/T! P
kem~k!d~k,t! (14)
where:
p0 5 the regular pricep 5 the current (possibly markdown) priceT 5 time (in weeks) since the previous promotional markdown on this productA 5 feature advertising space for this product in percentage of a page
A0 5 smallest ad size (typically a line list, which is 10% of a page)L 5 length of time, in days, that the promotional price will run during the weekg 5 elasticity of sales with respect to markdown priceb 5 elasticity of sales with respect to promotional frequencya 5 elasticity of sales with respect to ad sizet 5 elasticity of sales with respect to promotion length
m(k) 5 parameter for store-wide-event typekd(k,t) 5 indicator variable for “store-wide event”k in weekt; that is,d(k,t) 51 if event
k occurs in weekt, 0 otherwise.
Two timing effects are considered in (14). The increase in weekly sales from atemporary price reduction depends upon the lengthL in days of the price reduction. Thisis captured by using the constant elasticity functional form (L/7)t, (corresponding toxi 5L andxi
0 5 7 days.) This function is set equal to 1 when there is no price markdown. Witht , 1, the function provides a concave correction factor for promotions that are less than7 days. The other timing effect is captured by (p0 /p)b[121/T]. This effect implies that alonger intervalT between promotions contributes increasing amounts to the price elas-ticity with respect to the markdown pricep. This form of the timing effect was developedand tested in Achabal et al. (1990).
A number of retailers we studied use free-standing-inserts in the Sunday newspaper to
440 Journal of Retailing Vol. 76, No. 4 2000

advertise temporary price markdowns. This advertising typically features selected prod-ucts with large full page or half page photos in the insert, and uses smaller ads or simplyline lists to announce the markdowns on other products that are also part of the weeklypromotion. In our experience, markdowns without any type of ad are rare and are oftencontrary to corporate policy. Experimentation with various functional forms found that theconstant elasticity form (A/A0)
a performed well for the historical sales data from a largenumber of retailers, where A is the size of the ad, andA0 is a normalizing factor, whichcan be set equal to the smallest ad size. The elasticitya is less than one, which impliesthat ads make decreasing marginal contributions to sales as size increases.
Retailers use a variety of storewide events such as “white sales,” Super-Saturday, andso forth, whose effects can be captured by the simple multiplier form (10). Each of theseeffects has an indicator variabled(k,t) that specifies whether an eventk occurs in weekt.
Parameter Estimation by Linear Regression
By taking the natural logarithm of the multiplicative model (14), we obtain a linearrelationship that allows the parametersg, a, t, b, and m(k) to be estimated by OLSregression. For each regression run, a minimum of 104 weeks of sales data were used sothat all seasonal variations were observed at least twice. Stepwise regression was thenapplied so that only those coefficient values that had significant sales impacts wereretained in the model. Also, pooling was used to include products that were promoted ondifferent schedules to reduce the collinearity between the estimates of the promotionresponses and the estimation of the seasonal coefficients. Pooling is particularly importantfor estimating parameters for the elements of the model that are observed only infre-quently, in particular, the weekly seasonality valuesV(t).
Product pooling choices were made subjectively, by selecting products that are ex-pected to appeal to similar customers (such as men’s and women’s products). At the sametime, it is important to select enough products for pooling to obtain a sufficient number ofobservations of seasonal effects and promotion response. In general, pooling four to tenproducts within the same subcategory seemed to work the best (for instance, eightdifferent styles of men’s casual pants of the same type). However, when fewer distinctproducts were available, it was sometimes necessary to combine products from differentsubcategories. The approach of pooling products that appeal to similar customers wassuccessful in yielding highR2 values.
Sales forecasts were conducted on a weekly basis for all retailers on the VMI DSS. Thistime period was selected because retailers typically retain sales data and promotioninformation on a weekly basis. Promotions sometimes run for less than one week, but thiscan be handled by the correction factor and parametert shown in (14), where theparametert is determined as part of the regression.
Aggregating sales data across retailers was specifically avoided because this wouldrequire adding together sales that occurred under different promotional environments. Forany given retailer, the promotion response model could be developed either for the totalchain sales or for total regional sales. The preferred approach was to conform to the
Managing Inventory 441

retailer’s current practice of chainwide or regional forecasting. A good rule of thumb isthat weekly product sales forecasts should average at least several hundred units at thechosen level of aggregation. Table 1 summarizes typical ranges of parameter values andthe Adj.-R2 values observed over all participating retailers.
Parameter Updating
Despite the fact the Adjusted R2 values in Table 1 were considered quite good, wefound that the weekly sales forecast accuracy during the season could be improvedsignificantly by updating certain parameters. This might be due to the fact that theparameters estimated by regression on the previous season’s sales data failed to reflectchanges in market conditions or promotional strategy for the current season, for example.Furthermore, in the case of new products, the regression estimates were often based onsales of similar, but not identical, products in the previous season.
A variety of methods has been used for parameter updating in retail sales forecastingsystems. Exponential smoothing, originally developed for inventory management byBrown (1962), is the basis for parameter updating in IBM’s INFOREM inventorymanagement system, which is used by a number of retailers. For a more recent treatmentof exponential smoothing, see Nahmias (1997, Chapter 2).
Smith et al. (1994) developed a discounted least squares method for simultaneousupdating of multiple model parameters and tested it in a retail sales forecastingapplication. This method reduces to exponential smoothing in the one-dimensionalcase. Nahmias (1997, p. 294) also summarizes Brown’s method for using exponentialsmoothing to obtain updated estimatess(t), the standard deviation of the forecasterror.
Both discounted least squares and simple exponential smoothing methods were testedon the historical data in a number of our applications. Although discounted least squaresadapts to parameter changes more quickly and provides more accurate forecasts, it alsotends to cause greater fluctuations in the parameter values and requires a matrix inversion
TABLE 1
Ranges of Values from Stage 1Parameter Symbol Range of Values
Elasticity ParametersMarkdown Price g 1.00 to 5.00Promotion Spacing b 0.00 to 3.00Ad Size a 0.05 to 0.35Promotion Length t 0.00 to 0.30
Event TypeSmall S 0.00 to 0.50Medium M 0.00 to 1.30Large L 0.00 to 2.00
Adj. R2 values 0.75 to 0.93
442 Journal of Retailing Vol. 76, No. 4 2000

for implementation. In the VMI application, the current parameter values are used toprovide a 60 week forecast for the vendor’s production planning. Because this requiresstable parameter estimates, we chose exponential smoothing methods for parameterupdating rather than discounted least squares.
The choice of which parameters to update was based on which parameters were themost significant explanatory variables. In the table below, as indicated, each product hasits own Base Sales parameter S0. Common seasonal effects V(t) and elasticities {ni} areused for all products pooled in the regression. However, the price response parametergin (14) is updated separately for each product, due to its significance. Since the regressionestimates of price response may suffer somewhat due to pooling, parameter updatingthrough exponential smoothing reduces the averaging effects of pooling and mimics, insome respects, the results of using shrinkage estimators (Blattberg and George, 1992).
Parameter Estimation and Updating Rules
Parameter Estimation Parameter Updating
Base Sales Different by product Weekly by productPrice Response Same for all pooled products Weekly by productFactors Other than Price Same for all pooled products Not smoothed
THE VMI DECISION SUPPORT SYSTEM
The DSS for the VMI system was designed to support three user activities: (1) selectingand fitting a forecasting model to historical data; (2) sales forecasting and parameterupdating; (3) performance analysis. Working with a team of buyers and database design-ers, the authors designed the user interface and developed the software for the first twofunctions. The vendor’s analysts, on a separate system, implemented the third function ofperformance analysis.
Operationally, the VMI DSS was used to generate revised sales forecasts eachweek, as actual sales data are observed by updating the base sales value S0 and thepromotion elasticity parameterg for each product. This is illustrated schematically inFigure 1. Estimates of the MAD (Mean Absolute Deviation) of the one-week ahead,four-weeks ahead and sixty-weeks ahead sales forecasts are also updated by expo-nential smoothing. Users can then review the results displayed by the DSS, as shownin Figure 2.
Figure 2 features a unified user view with several panels on one screen: a forecaststatistics panel, a graphical panel, and a database panel. The forecast statistics panelallows the user to see the 1, 4, 8, and 60 week ahead forecasts for each given product,for a given customer account. The graphical panel contains a chart of forecastedversus actual unit sales over a historical time frame so that the user can visually assessthe system’s performance. The database panel contains a “snapshot window” that
Managing Inventory 443

displays the important promotion and inventory data that the analyst can use to reviewthe results of the forecasting model. Based on an analysis of the information con-tained in the snapshot window, the user has the option to drop a particular weekfrom the learning process, thus treating it as an outlier. The VMI DSS also offeredthe ability to automatically drop outliers that exceeded a certain percentage errortolerance.
Using the graph in Figure 2, the user can view the forecasted versus actual sales forany specified time period. Based on the user specified outlier tolerances, the resultingoutlier points are highlighted by the circles on the x-axis shown on this screen. Insome cases, outliers may be caused by data integrity problems (e.g., unrecordedpromotions). The Data Snapshot Window at the bottom of the screen allows the userto view all the supporting details for “suspicious” weeks. This helps the analyst detectand correct the data integrity problems and leads to a more accurate regressionestimation of the parameters.
FIGURE 2
VMI Prototype
444 Journal of Retailing Vol. 76, No. 4 2000

Determining the Forecasting Model and Updating the Parameters
For each new retailer, the first step is to specify the form of the response model (14) anddetermine the initial model parameters by linear regression. The user first selects theproducts to be pooled for the analysis and the promotional factors (e.g., newspaper ad size,radio or TV time) to be included. A functional form for each promotional factor is selectedfrom the three choices listed in (11) through (13). The VMI DSS simplified the task ofselecting alternative choices of products for pooling together. By trial and error, the usertests different combinations and compares their R-square values in the regression until asatisfactory model is developed. Once the final form of the model is decided upon, thepromotional factors and their model forms are stored in a parameter data table. This allowsthe different models for each retailer’s set of products to be stored as data, without anyreprogramming.
Setting Inventory Performance Targets
The vendor’s analysts worked with merchandising managers at each retail company to setspecific performance targets. Using Equations (4) through (8), the DSS forecasted the effectsof different inventory decisions to determine the performance tradeoffs available to a specificretailer. When the open-to-buy budget or inventory turnover constraints in (5) and (6) were notmet with the selected stock levels, the inventory levelssin(t) were adjusted downward untiltargets were met. If the resulting decrease in service level (8) was too great, the retailer wasoften persuaded to relax the budget constraints. After the system operated for some time, theobserved inventory turnover and service levels could be used to fine-tune the system.
These trial and error experiments were performed jointly by team members from thevendor and the retailer. Thus, the retailers’ team members learned what tradeoffs werepossible and whether or not certain combinations of constraints were feasible. The mutualunderstanding that evolved from this interactive process was an added benefit of the VMIsystem and was essential to its satisfactory implementation.
The Implementation Process
A proof of concept study was undertaken with two retailers in 1995 to validate theforecasting models and to train the vendor’s analysts in the use of the DSS. For sixadditional retailers, the authors and the analysts worked together to develop an appropriateforecasting model for each retailer. After that, the vendor’s analysts performed more of themodeling themselves, with assistance from the authors. Roughly half the retailer modelswere developed without the authors’ assistance. The first four to six retailers each tookseveral days of runs and experimentation with the model to achieve satisfactory forecasts.By the time the vendor’s analysts took over the model development, the estimationprocess was reduced to four to six hours. Thus, there was a significant “learning curve”
Managing Inventory 445

effect, as the analysts learned which promotional factors were likely to be significant andwhich model form worked for each particular retailer. Approximately 1,150 product andcustomer combinations were included in the VMI DSS replenishment system by 1996.Based on favorable initial results, during 1997 and 1998 the system was rolled out acrossproduct categories within existing accounts and expanded to new accounts. The vendorestablished a dedicated work group of managers, forecasters and business analysts to runthe forecasting models and the replenishment system.
ASSESSING THE BENEFITS
Figures 3 and 4 show the changes in the annual inventory turnover and the customer servicelevel that occurred over the first four years of the VMI system’s operation. The companiesshown here are two of the nation’s largest department store chains that consist of a total of 15separate retail divisions. They have the longest history on the system, representing roughly halfof the total VMI sales volume by the end of 1997. Merchandise Categories 1 and 2 were alsothe first ones on the system and represent over 75% of sales for the products on the VMIsystem. Figure 3 shows that the inventory turnover declined slightly, stabilizing around 4.0 forCompany 1 and around 3.0 for Company 2, whereas Figure 4 shows that service levelsincreased dramatically, particularly for Company 2. Service level was measured as the average
FIGURE 3
Annual Inventory Turnover for VMI Companies
446 Journal of Retailing Vol. 76, No. 4 2000

percentage of SKUs in stock at the end of the inventory cycle, which is computed automat-ically by the system. The expected value of this observed service level corresponds to theformulas given in (7) and (8), but individual observations may differ.
These results show that the service level increased substantially after the system’sintroduction, with only a modest decrease in annual inventory turnover. Figures 3 and 4show that for Merchandise Category 1, the service level and inventory turnover improvedsimultaneously in some instances for both retailers. This was possible because theavailable inventory was allocated across the stores and SKUs more effectively than before.From one retailer’s perspective, the increase in service level achieved by the VMI systemrepresents “the difference between night and day.”5
Calculating the Incremental Improvement
Although these performance results are impressive, they do not provide an incrementalquantitative measure of the VMI system’s contributions, as compared to the retailers’previous inventory management methods. Specifically, a comparison of the performanceof the retailers’ systems in 1995 with the VMI system’s performance in subsequent yearsshould take into account the fact that the service levels increased significantly between1995 and 1998. This direct comparison requires some further assumptions and analysis.
We used the target stock level formula (2) to compute the change in inventory that
FIGURE 4
Customer Service Level for VMI Companies
Managing Inventory 447

would be required to support the observed service level improvement between 1995 and1998. Multiplying the 1995 inventory turnover by the corresponding inventory factorprojects the inventory turnover that would have been required in 1998 using the 1995inventory management system. Figure 5 illustrates this approach. Using (2), the optimalinventory level can be written asm 1 s*z, wherem is the mean demand per cycle andsis the standard deviation of the demand. Our calculation is based on the coefficient ofvariation ratios/m for the “average” SKU stocked. For the “average” SKU we used acoefficient of variations/m 5 2.0 at the single SKU and store level, which has been foundto be typical for merchandise in this category (Agrawal and Smith, 1997).
We can now compute the ratio r12 for the change in the target inventory of the “average”SKU that is required to change the service level fromF(z1) to F(z2) as follows:
r12 5m 1 s* z1
m 1 s* z21
1 1 2z1
1 1 2z2, (15)
wherez1 and z2 are selected from Table 2 below for 1995 and 1998, respectively. Thepredicted turnover in 1998 is determined byr12*(1995 Turnover) in each case. Thecomputed values are presented in Table 3.
Comparing the predicted values to the actual values, we see substantial improvementsin all four instances. The largest improvement of 76% is for Company 2, in Category 1.
FIGURE 5
Comparing the VMI and Existing Systems
448 Journal of Retailing Vol. 76, No. 4 2000

The difference in inventory turnover can then be used to compute the correspondingsavings in the value of the on-hand inventory required for the reported 1998 sales. Thesesavings are reported in the last column of Table 3 and are, as in the case of inventoryturnover, quite substantial.
It is natural to wonder whether some of this improvement occurred due to a generalimprovement in inventory management effectiveness across all retailers. For example, itis well known that sales volume increases lead to improved economies of scale ininventory management and thus to improved inventory turnover. However, during thisperiod, sales for Category 1 declined while Category 2 increased, and total unit salesremained relatively flat. As further evidence, Figure 6 compares the annual inventoryturnover of the retailers who participated in the VMI system during 1996 to 1998 to thosewho did not. Despite the vendor’s goal of having the VMI retailers increase their servicelevels, which in turn requires more inventory, the non-VMI retailers still had lowerinventory turnovers in both categories during this same time period. (Service levels atnon-VMI retailers were not available.) This implies that the non-VMI retailers did notachieve significant inventory efficiency improvements for these two product categoriesduring this same time period because they lacked the support from the improved system.
Thus, we can infer that the VMI system allowed these two multidivision companies toimprove service levels significantly at all their retail chains, with only a modest increasein inventory investment and a substantial improvement in the efficiency of the inventorymanagement system. The corresponding inventory dollar savings are substantial, partic-ularly if a VMI system were rolled-out to achieve similar savings for other product linesat these companies.
TABLE 2
Service Level Changes and Ratio Calculations1995 1998
Company 1 Service Level 77% 91%Z value 0.74 1.34r12 value 0.67
Company 2 Service Level 69% 94%Z value 0.50 1.56r12 value 0.49
TABLE 3
Predicted and Actual Inventory Turnover in 1998Without VMI(Predicted)
With VMI(Acutal) Improvement
InventoryReduction
Company 1 Category 1 3.4 4.0 18% $1.1MCategory 2 3.0 4.0 33% $1.7M
Company 2 Category 1 1.7 3.0 76% $6.5MCategory 2 2.2 3.1 41% $1.5M
Managing Inventory 449

Estimating the Benefits to the Vendor
The increase in service level resulting from the VMI system is an important benefitfrom the vendor’s perspective as well. One of the vendor’s goals for the VMI system wasto improve customer service level. This enhances the competitive position of the vendor’sproducts by making them more readily available to customers. One quantitative measureof this benefit is the reduction in lost sales shown in Table 4 for these two companies.These lost sales percentages are determined from the partial expectation of the normaldistribution for the given service levels.6 Using this estimate assumes that all SKUs andstores are stocked at precisely their target service levels and that the demand is normallydistributed, so that unfilled demand can be estimated. In one respect, this is a conservative
FIGURE 6
Annual Inventory Turnover for VMI and non-VMI Retailers
TABLE 4
Predicted Change in Lost Sales 1995–98
1995 Lost Sales 1998 Lost Sales$ Values of Change
in 1998
Company 1 13% 9% $ 720,000Company 2 30% 6% $2,440,000Total $3,160,000
450 Journal of Retailing Vol. 76, No. 4 2000

assumption in that if the same total inventory were suboptimally distributed, lost saleswould necessarily be higher. These reductions in lost sales represent roughly $3.2 millionin additional annual revenue for the vendor from just these two retailers, based on 1998unit sales. Thus the vendor also achieved direct financial benefits from the VMI system.
CONCLUSIONS
This VMI decision support system combines inventory optimization methods frommanagement science and promotional response models from marketing. We believe thatthis is the first time that these individual models have been integrated together in aretailing DSS application and implemented in a field setting. This implementation of theVMI system at over 30 major retailers demonstrates that service levels can be improveddramatically with a nominal increase in inventory investment using such a system. Thejoint development of the DSS by the authors and the vendor’s analysts proved to be acritical step in achieving acceptance and effective implementation of these marketing andmanagement science models across multiple organizations. The vendor and the retailersuse of the VMI system led to greater inventory management effectiveness and morerealistic expectations for system performance than could have been achieved by eitherindividually. Based on the benefits calculations, discussed previously, retailers who didnot participate in the system did not achieve comparable performance improvementsduring the same time period with the same products.
The development and implementation of this system offers several important insightsfor retail supply chain researchers and practitioners. It demonstrates that a vendormanaged sales forecasting and inventory replenishment system can achieve effective retailsupply chain coordination that is viewed as beneficial by both the vendor and the retailers.In particular, the VMI system achieved the vendor’s goal of better product availability,both in terms of the breadth of the vendor’s product line offered by the retailers and in thecustomer service levels that were achieved, even with the broader assortment. At the sametime, the retailers received improved sales forecasts and more effective inventory man-agement that benefited their financial performance.
It is important to note how the theory was modified to allow the models to work inpractice. For example, even when the regression was successful in fitting the salesforecasting model to the previous years’ sales data, updating of certain model parametersimproved the forecast by adapting to the changing sales rates in the current year. Storingeach component of the model (both its form specification and parameters) as data in alarge relational database allowed the DSS to manage literally hundreds of econometricmodels. Parameter updating occurred automatically each week, subject to review by thevendor’s analysts. The DSS software automated much of the econometric work and theninteracted with the analysts on a continual, but “exception oriented” basis as new dataarrived and new forecasts were generated. This allowed the system to scale well to servemany accounts.
There are significant “learning curve” effects in the design of sales forecastingmodels across multiple retailers for the same categories of products. This provided
Managing Inventory 451
economies of scale in the vendor’s implementation of the VMI forecasting system.There were further economies of scale in resources for software development andanalytically skilled personnel that also benefited the vendor, which made the systemcost effective to implement. Although the authors assisted with the first few imple-mentations, the vendor’s analysts’ cumulative experience with the DSS allowedthem to assume full responsibility for implementing the system at over half of theretailers.
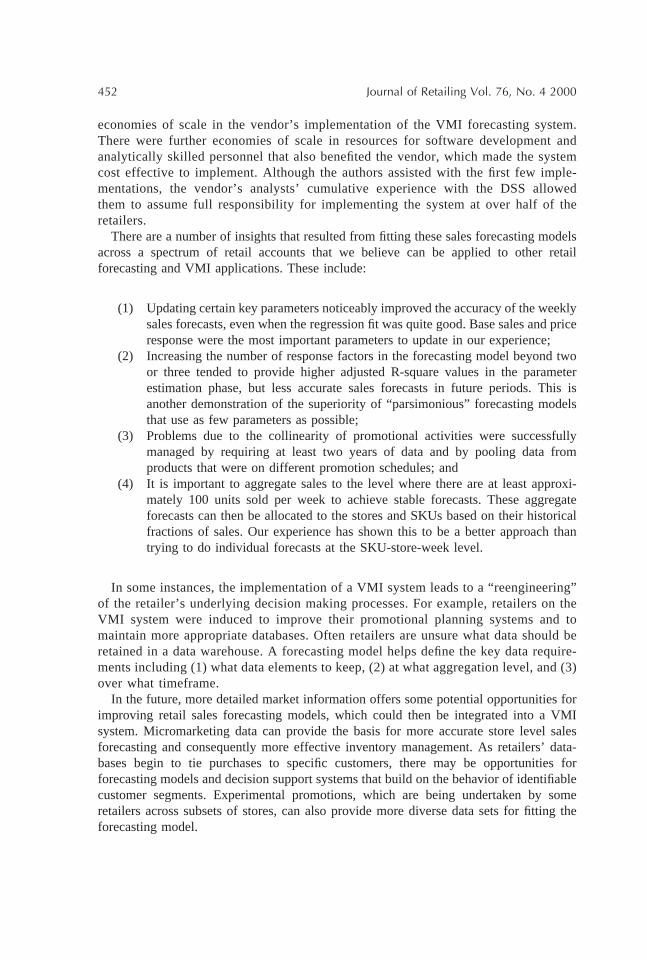
There are a number of insights that resulted from fitting these sales forecasting modelsacross a spectrum of retail accounts that we believe can be applied to other retailforecasting and VMI applications. These include:
(1) Updating certain key parameters noticeably improved the accuracy of the weeklysales forecasts, even when the regression fit was quite good. Base sales and priceresponse were the most important parameters to update in our experience;
(2) Increasing the number of response factors in the forecasting model beyond twoor three tended to provide higher adjusted R-square values in the parameterestimation phase, but less accurate sales forecasts in future periods. This isanother demonstration of the superiority of “parsimonious” forecasting modelsthat use as few parameters as possible;
(3) Problems due to the collinearity of promotional activities were successfullymanaged by requiring at least two years of data and by pooling data fromproducts that were on different promotion schedules; and
(4) It is important to aggregate sales to the level where there are at least approxi-mately 100 units sold per week to achieve stable forecasts. These aggregateforecasts can then be allocated to the stores and SKUs based on their historicalfractions of sales. Our experience has shown this to be a better approach thantrying to do individual forecasts at the SKU-store-week level.
In some instances, the implementation of a VMI system leads to a “reengineering”of the retailer’s underlying decision making processes. For example, retailers on theVMI system were induced to improve their promotional planning systems and tomaintain more appropriate databases. Often retailers are unsure what data should beretained in a data warehouse. A forecasting model helps define the key data require-ments including (1) what data elements to keep, (2) at what aggregation level, and (3)over what timeframe.
In the future, more detailed market information offers some potential opportunities forimproving retail sales forecasting models, which could then be integrated into a VMIsystem. Micromarketing data can provide the basis for more accurate store level salesforecasting and consequently more effective inventory management. As retailers’ data-bases begin to tie purchases to specific customers, there may be opportunities forforecasting models and decision support systems that build on the behavior of identifiablecustomer segments. Experimental promotions, which are being undertaken by someretailers across subsets of stores, can also provide more diverse data sets for fitting theforecasting model.
452 Journal of Retailing Vol. 76, No. 4 2000

NOTES
1. For additional information see www.cpfr.org.2. Interviews with Tom Fanoe, President, Joe Boxer; Ralph Briskin, former Director, Levi
Link Services (currently Director e.commerce The Mens Wearhouse); and Sandy Golden, Manager,Retail Replenishment–Levi Strauss & Company.
3. Apparel buyers typically work on initial markups that allow promotional markdowns to beprofitable with little if any support from the vendor. As a result, apparel buyers generally plan andexecute their promotions independently of the vendor. This is in contrast to packaged goodspromotions that are typically initiated by vendors.
4. These forms are equivalent, except that the second is expressed in terms of percentagemarkdown 12p/p0.
5. Interview with Howard Gross, Chairman–Miller’s Outpost/Anchor Blue.6. This partial expectation is tabulated, for example, in Nahmias (1997, pp. 835–41).
REFERENCES
Achabal, Dale D., Shelby H. McIntyre and Stephen A. Smith (1990). “Maximizing Profits fromDepartment Store Promotions,”Journal of Retailing, 66, (4-Winter): 383–407.
Agrawal, Naren and Stephen A. Smith (1996). “Estimating Negative Binomial Demand for RetailInventory Management with Unobservable Lost Sales,”Naval Research Logistics, 43, 839–861.
Blattberg, Robert C. and Edward I. George (1991). “Shrinkage Estimation of Price & PromotionalElasticities: Seemingly Unrelated Equations,”Journal of the American Statistical Association, 86,(414): 304–315.
Blattberg, Robert and Kenneth Wisniewski (1989). “Price-Induced Patterns of Competition,”Marketing Science, 8 (4): 291–309.
Brown, Robert G. (1962).Smoothing, Forecasting and Prediction of Discrete Time Series, Engle-wood Cliffs, NJ: Prentice Hall.
Cachon, Gerard P. (1997). “Stock Wars: Inventory Competition in a Two Echelon Supply Chainwith Multiple Retailers,” Fuqua School of Business Working Paper, Duke University.
Desiraju, Ramarao and Sridhar Moorthy (1997). “Managing a Distribution Channel Under Asym-metric Information with Performance Requirements,”Management Science, 43 (12): 1628–1644.
Kalyanam, Kirthi (1996). “Pricing Decisions Under Demand Uncertainty: A Bayesian MixtureModel Approach,”Marketing Science, 15 (3): 207–221.
Jeuland, Abel and Steven Shugan (1983). “Managing Channel Profits,”Marketing Science, 2 (3):239–272.
Lee, Hau L, V. Padmanabhan and Seungjin Whang (1997). “Information Distortion in a SupplyChain: The Bullwhip Effect,”Management Science, 43 (4): 546–558.
Nahmias, Steven (1997).Production and Operations Analysis, 3rd Edition, Chicago, IL: Irwin.Nahmias, Steven and Stephen A. Smith (1994). “Optimizing Inventory Levels in a Two Echelon
Retailer Inventory System with Partial Lost Sales,”Management Science, 40 (5): 582–596.Narayan, V. G. and Ananth Raman (1997). “Assignment of Stocking Decision Rights Under
Incomplete Contracting,” Working Paper, Harvard Business School.Smith, Stephen A., Dale D. Achabal and Shelby H. McIntyre (1994). “A Two Stage Sales
Managing Inventory 453

Forecasting Procedure Using Discounted Least Squares,”Journal of Marketing Research, 31(February): 44–56.
Tsay, Andy, Steven Nahmias and Naren Agrawal (1998). “Modeling Supply Chain Contracts: AReview.” Pp. 299–336 in S. Tayur, R. Ganeshan, and M. Magazine (Eds.),Quantitative Modelsfor Supply Chain Management. Boston: Kluwer Academic Publishers.
454 Journal of Retailing Vol. 76, No. 4 2000
Related Documents


