GROWTH and DISPARITY A Decade of U.S. Public School Construction

Welcome message from author
This document is posted to help you gain knowledge. Please leave a comment to let me know what you think about it! Share it to your friends and learn new things together.
Transcript

GROWTH and DISPARITYA Decade of U.S. Public School Construction

Building Education Success Together -- BEST
Our country has long struggled to improve public education and achieve equity in public schools. The
condition of public school facilities was highlighted as a social justice issue in the 1954 Brown v. Board ofEducation challenge to segregation and poignantly described in 1991 by Jonathan Kozol in his book,
Savage Inequalities. But inadequate facilities are still largely unrecognized as an education quality issue in
standards reform, teacher quality, new school creation, choice or other education improvement movements
or efforts. In addition, the important role public school quality—including building quality—plays in
neighborhood and community revitalization is just beginning to be understood.
As a collaborative of organizations engaged in education reform, community development, historic
preservation, and social justice, Building Educational Success Together (BEST) works at the nexus of
education quality and school facilities and community vitality and school facilities. This research was
designed to help us and others better understand the scale, scope and distribution of school building
investment so we can ensure that policy, practice and funding are aligned to the schools and communities
with the greatest need.
This report has good news and troubling news. It reveals what is known in many local communities:
school construction and building improvements have been booming. Local school districts and a number
of states are planning, designing and building and renovating some public school buildings of exceptional
quality and at the same time, working hard to bring existing schools up to code and into good repair.
Where enrollment has been growing, school districts have adding new schools and classrooms to ensure
appropriate class sizes and an adequate environment for teaching and learning.
But our analysis also reaffirms our worst suspicions: Despite record spending on school construction, low-
income and minority students, who already experience disadvantages, have had far less investment in their
school facilities than their more affluent, white counterparts and the conditions for these students continues
to be substandard.
The BEST partners believe that every child deserves the programs, people and the place—the school
buildings—that will support his or her efforts to prepare for a lifetime of health, work, family and civic
responsibility. Likewise, educators deserve a safe, healthy and inspiring place to work. And every
community deserves a public school around which it can build and sustain neighborhoods and community
connections. But in many places, especially where children are in the most need, this is still not the case,
despite record spending on school buildings over the last decade.
Mary W. Filardo
Executive Director
FOREWORD

Building Education Success Together -- BEST
TABLE OF CONTENTSExecutive Summary 1
Our Public Education Infrastructure 3The Condition of America's Public School Buildings 3Education Quality and the Condition of School Buildings 3Community Vitality and School Buildings 5
School Construction Growth 1995-2004 6School Construction Projects: Building New and Fixing Old 8School Construction Spending by State 9Enrollment Growth Fuels New School Construction 12Poor Conditions, New Codes and Practices Spur Renovations 15The Need for Continued Spending and Growth 16
School Construction Disparity, 1995-2004 17School District Spending by Family Income 17School District Spending by Community Household Income 20School District Spending by Race and Ethnicity 21Progress Toward Greater Equity and Adequacy 24New Jersey’s Abbott Decision Shows Potential to Alleviate Disparities 25
Recommendations and Conclusion 27About BEST: 30References 31Appendix A: Methodology 32Table 1: State-by-State School Construction Expenditures 34Table 2: Student Spending State Rankings 35
Figure 1: Public School Construction Dominates School Districts’ Capital Outlay on Education 6Figure 2: U.S. Public School Construction 1995-2004 7Figure 3: Nearly Half of Construction Spending Goes for New Schools 9Figure 4: Public School Construction Varied from State to State 10Figure 5: U.S. Public School Enrollment is Projected to Continue Rising 12Figure 6: Greatest Increase in Public School Enrollment Change in Southwest and Southeast 13Figure 7: New Construction Dominates Western and Southern States 14Figure 8: Investment Increases with Family Income 18Figure 9: Disparity is Greater on Spending for Improvements to Existing Schools 19Figure 10: Disparity Increases with Household Income 21Figure 11: Public School Students by Race/Ethnicity, 2003-04 22Figure 12: Minority Districts Fall Behind 23Figure 13: New Jersey Public School Construction Spending Increases with Court Rulings 25Figure 14: New Jersey Remedies Drastically Reduce Disparity 26

1 Building Education Success Together -- BEST
In 1995, a federal report by the General Accounting Office (GAO) estimated that $112 billion was needed to bring the nation's school facilities into good repair. Subsequentstudies estimated it would take more than $320 billion to build new schools to handle swellingenrollments, renovate aging buildings, and equip all buildings with the technologies needed toprepare students for success in the 21st century. By far, though, the most troubling findings werethat the academically neediest students—minorities and impoverished students—were most likelyto attend the most decrepit facilities.
Now, for the first time ever, this report provides a comprehensive analysis of who hasbenefited from school construction spending across the nation. In this report, the BuildingEducational Success Together (BEST) research team looks at how much was spent, whatwas accomplished, and which students and communities saw benefits. The analysis looksat the decade from 1995, when the GAO report was first released, through 2004, the mostcurrent information available.
We found unprecedented spending and growth in school facility construction across thecountry:
� The U.S. Census of Governments report that public school districts spent $504 billion(2005 dollars) in capital expenditures. Adding interest, the total comes to nearly $600billion.
� Public school districts spent more than $304 billion (2005 dollars) in bricks and mortar,"hard costs" for public school construction contracts according to data collected byMcGraw-Hill Construction.
� Over this decade, public school districts built more than 12,000 new schools andmanaged more than 130,000 renovation and other improvement projects to addresshealth, safety, technology, access for students with disabilities, educationalenhancement and other needs.
� While most states increased their school construction expenditures during the lastdecade, the states with successful court cases that challenged school facility inequitiesspent, on average, an additional $158 per student annually.
But this report confirms what many educators and communities have suspected for years:these billions of dollars spent on facilities have not been equally available to affluent andlow-income communities and for minority and white students.
� The least affluent school districts made the lowest investment ($4,800 per student),while the most affluent districts made the highest investment ($9,361 per student);
EXECUTIVE SUMMARY

� The money spent on schools serving low-income students was more likely to fund basicrepairs, such as new roofs or asbestos removal, while schools in more affluent districtswere more likely to receive funds for educational enhancements such as science labs orperforming arts centers;
� The lowest investment ($4,140 per student) was made in the poorest communities,while the highest investment ($11,500 per student) was made in the high-incomecommunities;
� School districts with predominantly minority student enrollment invested the least($5,172 per student), while school districts with predominantly white student enrollmentspent the most ($7,102 per student).
Overall, the schools in poor condition 10 years ago received the least investment in theirfacilities, even as the nation’s schools have seen record spending on school facilities.
The inadequacy of funding in low-income districts and communities and the disparity in whobenefited from this spending would not be of such importance if the condition, design, anduse of school buildings did not affect the quality of education. An increasing body ofresearch indicates that poor building conditions such as a lack of temperature control, poorindoor air quality, insufficient daylight, overcrowded classrooms, and a lack of specialtyclassrooms are obstacles to academic achievement.
Although the plight of students in the country’s most decrepit school buildings has not beenentirely ignored, federal and state policies to address the problems have been inadequate.The scale, scope and distribution of school construction spending need to be betterunderstood and monitored. Improving the quality of school facilities should be part of stateeducation policy and funding.
This report is a step in recognizing the tremendous opportunity and challenge of providingthe highest quality education and the highest quality school buildings to all our children.
Building Education Success Together -- BEST 2

OUR PUBLIC EDUCATION INFRASTRUCTURE
The Condition of America's Public School Buildings
When the U.S. Government Accounting Office (GAO) released a groundbreaking series ofreports in the mid-1990s, it was the first time that the physical conditions of America'sschool facilities were detailed. The GAO found that 25 million children attended schools inbuildings with at least one unsatisfactory condition. Further, one-third of all public schoolbuildings in the country—about 25,000, serving nearly 14 million children—were in a seriousstate of disrepair. These most decrepit schools served primarily minority and low-incomestudents.
The GAO estimated the average cost to bring schools into good repair was $1.7 millioneach—a national total they pegged at $112 billion ($163 billion in today’s dollars). But whilethe report estimated the cost to bring existing schools into good repair, it did not estimatethe cost to build new schools to meet the growing enrollments or to update and modernizeschools to incorporate technology or other educational enhancements.
In 2000, in an attempt to more fully evaluate the need for public school buildinginfrastructure, the National Educational Association (NEA) conducted a study of statebuilding needs and estimated that $322 billion was needed to repair existing schools andbuild new schools with adequate technology to support student educational needs.
However, the GAO and NEA grossly underestimated the need for school improvements andnew construction. Even as we have spent record amounts on school construction, therecontinues to be millions of students in substandard and crowded school conditions.Currently, there is no reliable measure of how much money is needed to provide all childrenwith adequate public school facilities. No public agency is monitoring school conditionsnationally, and many states do not have a way to evaluate the extent or level of need at thestate level. We know from our work in our BEST partner communities and states that schooldistricts are falling short and billions more are needed.
Education Quality and the Condition of School Buildings
Recent research has confirmed what many educators have held as common sense—thequality of a school facility has an impact on student's experiences and ultimately on theireducational achievement. The research on school building conditions and student outcomesfinds a consistent relationship between poor facilities and poor performance: when schoolfacilities are clean, in good repair, and designed to support high academic standards, therewill be higher student achievement, independent of student socio-economic status. There isgrowing evidence supporting these findings:
� The cognitive requirements for learning and teaching — motivation, energy, attention,hearing, and seeing—are affected by the physical surroundings where they take place(Schneider 2002);
3 Building Education Success Together -- BEST

� The amount of natural light, the indoor air quality, the temperature, and the cleanlinessof schools and classrooms all impact student learning (Earthman 2004);
� Overcrowded schools lead to higher absenteeism rates for both students and teachersand have detrimental effects on children's ability to learn and perform well (PolicyLink2005);
� Poor building conditions greatly increase the likelihood that teachers will leave theirschool; a troubling fact given the need for more and better teachers in the mostdisadvantaged schools (Buckley et. al 2004).
If school facilities are unsafe, unhealthy and unable to support technology for the delivery ofcurriculum or services needed to succeed, minority and low-income children are furtherdisadvantaged.
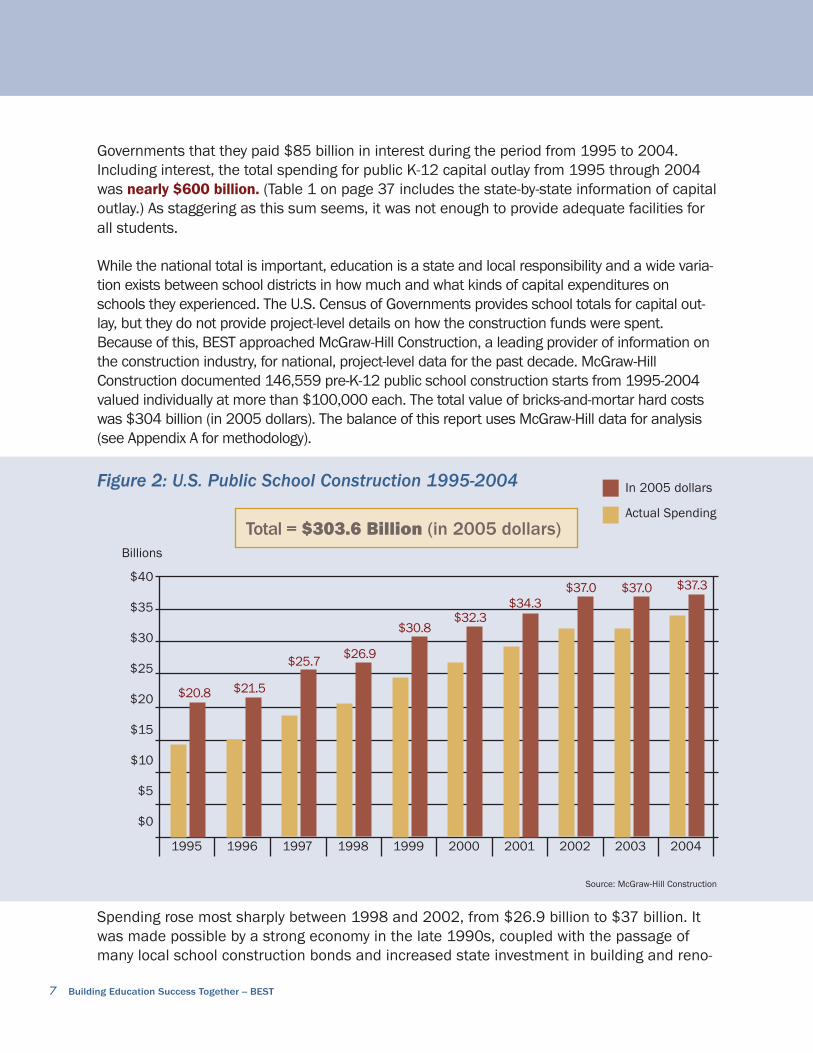
21st Century School Fund

Community Vitality and School Buildings Research has also confirmed that public schools affect communities and their economicstrength (Weiss 2004). Schools influence the reputation, quality of life, and vitality ofneighborhoods. Conversely, the quality, vitality, and support of a neighborhood affects localschools. Because school facility improvements mean an influx of capital dollars into aneighborhood, there is great potential to positively impact that community. Evidenceincreasingly supports the following:
� School quality has a direct and positive impact on residential property values (Kane, etal. 2003);
� School quality helps determine a locality’s quality of life and can affect the ability of anarea to attract businesses and workers (Salveson and Renski 2002);
� Investments in the construction and maintenance of school facilities inject money intolocal economies through job creation and supply purchases (Economics Center forEducation and Research 2003);
� New or well-maintained school facilities can help revitalize distressed neighborhoods(Local Government Commission 2002);
� The activities that occur in and around school buildings can help build neighborhoodsocial capital and affect student achievement (Blank, et al. 2003).
5 Building Education Success Together -- BEST

Building Education Success Together -- BEST 6
SCHOOL CONSTRUCTION GROWTH 1995-2004Across the country, public school district spending on school construction—both buildingnew schools and upgrading existing schools—has grown steadily over the last decade. Ofthe 17,468 school districts in the United States, nearly three-quarters had school construc-tion projects during the years from 1995 to 2004. Not since the post-World War II babyboom has the nation seen such investment in public K-12 school buildings.
According to the U.S. Census of Governments, school districts reported spending $504 billion (in 2005 construction dollars) in capital expenditures from 1995 to 2004.
Figure 1: Public School Construction Dominates School District Capital Outlayon Education
Source: U.S. Census of Governments
School districts and states fund the bricks and mortar “hard costs” of actual construction andthe “soft costs” of project planning, design, engineering, and project management as part ofcapital budgets reported in “total capital outlay.” Capital funds also pay for land acquisition,furniture, fixtures, instructional and non-instructional equipment, and other related fees andcosts. As illustrated in Figure 1, the vast majority of capital outlay is for school constructioncontracts.
But capital outlay is not the only cost to school districts. Because capital dollars are borrowed,districts must pay interest on these funds. The interest and principal is repaid from the operat-ing budgets of the school district or state. School districts reported to the U.S. Census of
Construction$363,157,222,258
72%
15%
7%
6%
Other or nonspecified equipment$73,205,643,390
Instructional equipment$36,217,514,636
Land and existingstructures$31,995,440,635
Total Capital Outlay(from 1995-2004)
$504 Billion in 2005 Dollars
7 Building Education Success Together -- BEST
Governments that they paid $85 billion in interest during the period from 1995 to 2004.Including interest, the total spending for public K-12 capital outlay from 1995 through 2004was nearly $600 billion. (Table 1 on page 37 includes the state-by-state information of capitaloutlay.) As staggering as this sum seems, it was not enough to provide adequate facilities forall students.
While the national total is important, education is a state and local responsibility and a wide varia-tion exists between school districts in how much and what kinds of capital expenditures onschools they experienced. The U.S. Census of Governments provides school totals for capital out-lay, but they do not provide project-level details on how the construction funds were spent.Because of this, BEST approached McGraw-Hill Construction, a leading provider of information onthe construction industry, for national, project-level data for the past decade. McGraw-HillConstruction documented 146,559 pre-K-12 public school construction starts from 1995-2004valued individually at more than $100,000 each. The total value of bricks-and-mortar hard costswas $304 billion (in 2005 dollars). The balance of this report uses McGraw-Hill data for analysis(see Appendix A for methodology).
Figure 2: U.S. Public School Construction 1995-2004
Source: McGraw-Hill Construction
Spending rose most sharply between 1998 and 2002, from $26.9 billion to $37 billion. Itwas made possible by a strong economy in the late 1990s, coupled with the passage ofmany local school construction bonds and increased state investment in building and reno-
1995 1996 1997 1998 1999 2000 2001 2002 2003 2004
$40
$35
$30
$25
$20
$15
$10
$5
$0
Total = $303.6 Billion (in 2005 dollars)Billions
$20.8 $21.5
$25.7 $26.9
$30.8$32.3
$34.3$37.0 $37.0 $37.3
In 2005 dollars
Actual Spending
Building Education Success Together -- BEST 8
vating schools. However, between 2002 and 2004, spending leveled off at about $37 bil-lion. The economic downturn in 2001 has tempered spending, although many school dis-tricts continue to spend funds that were approved before the recession because of the con-tinuing need for school facility improvements.
The average enrollment of public school students in the United States between 1995 and2004 was about 46.6 million. This translates into a 10-year national average expenditure of$6,519 per student per year—$652 per student per year of school construction expendi-tures. While this has been a substantial investment, because of intense enrollment growth,deferred maintenance, and new educational program demands, this level of funding hasbeen inadequate for many districts.
Spending on school construction nearly doubled from 1995 through 2004 as shown in Figure 2. School districts spent more than $20 billion dollars in 1995 on construction. By2002, school districts were spending record-breaking totals—more than $37 billion annuallyon hard construction expenses alone.
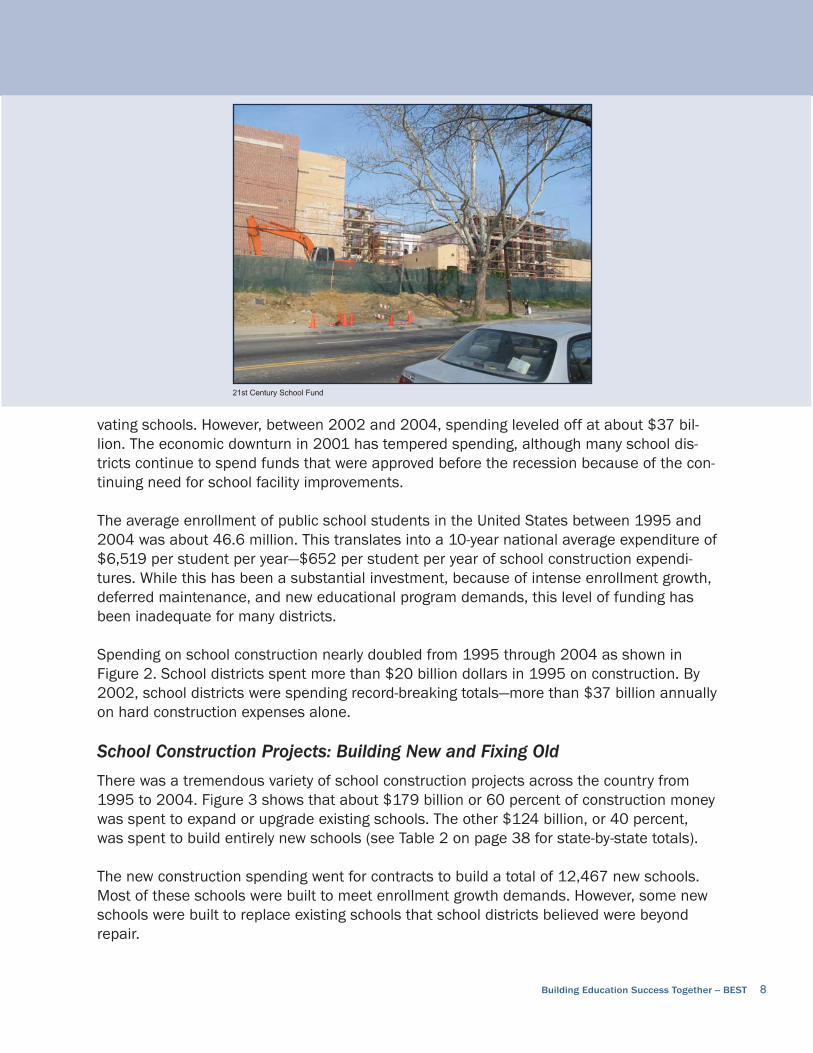
School Construction Projects: Building New and Fixing OldThere was a tremendous variety of school construction projects across the country from1995 to 2004. Figure 3 shows that about $179 billion or 60 percent of construction moneywas spent to expand or upgrade existing schools. The other $124 billion, or 40 percent,was spent to build entirely new schools (see Table 2 on page 38 for state-by-state totals).
The new construction spending went for contracts to build a total of 12,467 new schools.Most of these schools were built to meet enrollment growth demands. However, some newschools were built to replace existing schools that school districts believed were beyondrepair.
21st Century School Fund
Figure 3: Nearly Half of Construction Spending Goes for New Schools
Source: McGraw-Hill Construction; National Center for Education Statistics
Of the building improvements to existing schools, 35 percent included additions andimprovements to existing schools Only 25 percent was spent to just improve existingschools without adding more space.
School Construction Spending by StateStates spending totals on public school construction varied significantly over the pastdecade. (Figure 4 shows a national map of school construction spending by student.) Tounderstand the variation among states, we took the total expenditures for each state from1995 to 2004 and divided these by the average enrollment of that state during the sameperiod. (See Table 2 on page 38 for the table of state-by-state spending.) The national aver-age per student of $6,519 was more than three times higher than Montana, the lowest-spending state, which spent only $2,004 per student, and slightly less than half the spend-ing of Alaska, the highest-spending state, which spent $12,842 per student.
9 Building Education Success Together -- BEST
New School Construction $124,108,709,504
24%
35% 41%
Additions andImprovements toExisting Schools$105,214,284,075
Improvements to Existing Schools$74,274,675,092
All Types=$304 Billion
Of the buildingimprovements to exist-ing schools, 35 percent includedadditions along withexisting buildingimprovements andabout 24 percent wasspent on improvingexisting school facili-ties, without addingmore space.
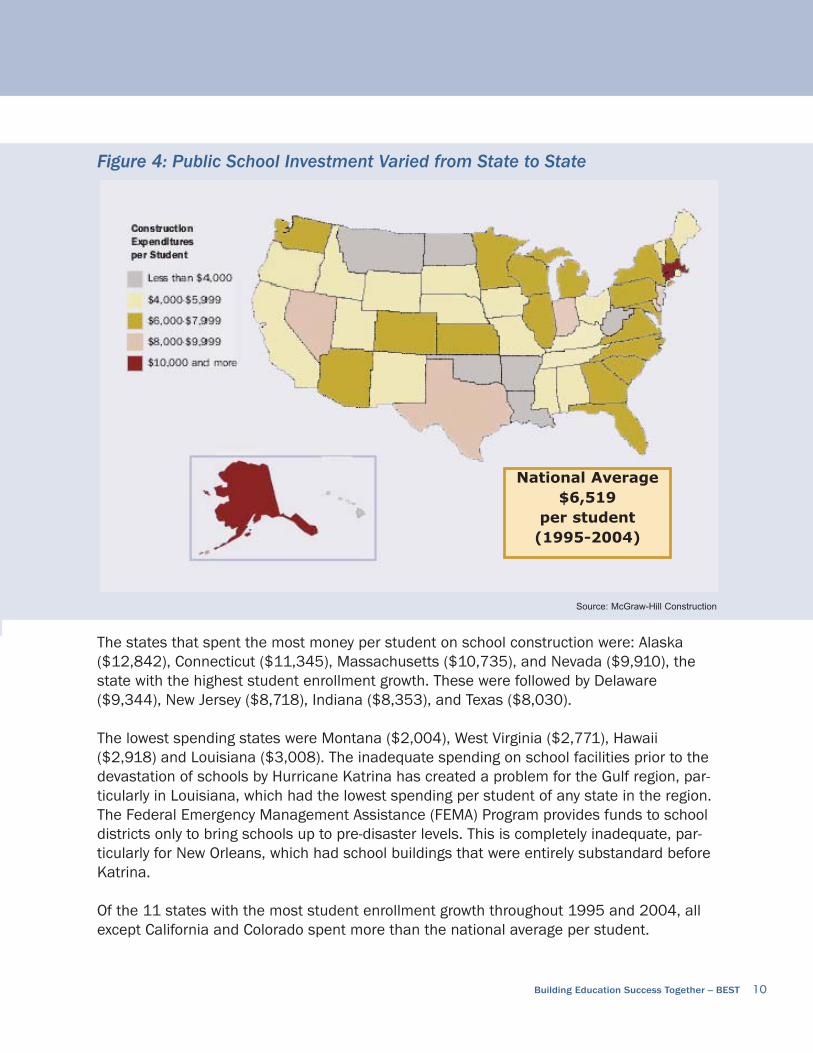
Figure 4: Public School Investment Varied from State to State
Source: McGraw-Hill Construction
The states that spent the most money per student on school construction were: Alaska($12,842), Connecticut ($11,345), Massachusetts ($10,735), and Nevada ($9,910), thestate with the highest student enrollment growth. These were followed by Delaware($9,344), New Jersey ($8,718), Indiana ($8,353), and Texas ($8,030).
The lowest spending states were Montana ($2,004), West Virginia ($2,771), Hawaii($2,918) and Louisiana ($3,008). The inadequate spending on school facilities prior to thedevastation of schools by Hurricane Katrina has created a problem for the Gulf region, par-ticularly in Louisiana, which had the lowest spending per student of any state in the region.The Federal Emergency Management Assistance (FEMA) Program provides funds to schooldistricts only to bring schools up to pre-disaster levels. This is completely inadequate, par-ticularly for New Orleans, which had school buildings that were entirely substandard beforeKatrina.
Of the 11 states with the most student enrollment growth throughout 1995 and 2004, allexcept California and Colorado spent more than the national average per student.
Building Education Success Together -- BEST 10
National Average$6,519
per student(1995-2004)
State-by-state comparisons pose a challenge because the cost of construction varies widelyacross states and even within states. For example, Alaska spent more money per studentthan any other state; however, construction materials and labor there are nearly 30 percenthigher than the national average. In Texas, however, the cost of materials is close to thenational average, but labor is often more than 30 percent lower than the national average.This means that some states get more value for the same amount of money. Within states,labor and material costs in central cities tend to be higher than in outlying areas furtherexacerbating problems in many low-income school districts. In this report, we do not adjustexpenditures for regional construction cost indices.
Construction spending in all states with declining student enrollments (13 states and the District ofColumbia) was below the national average. Of these, Montana, West Virginia, Louisiana, andHawaii each spent less than half the national average per student.
11 Building Education Success Together -- BEST
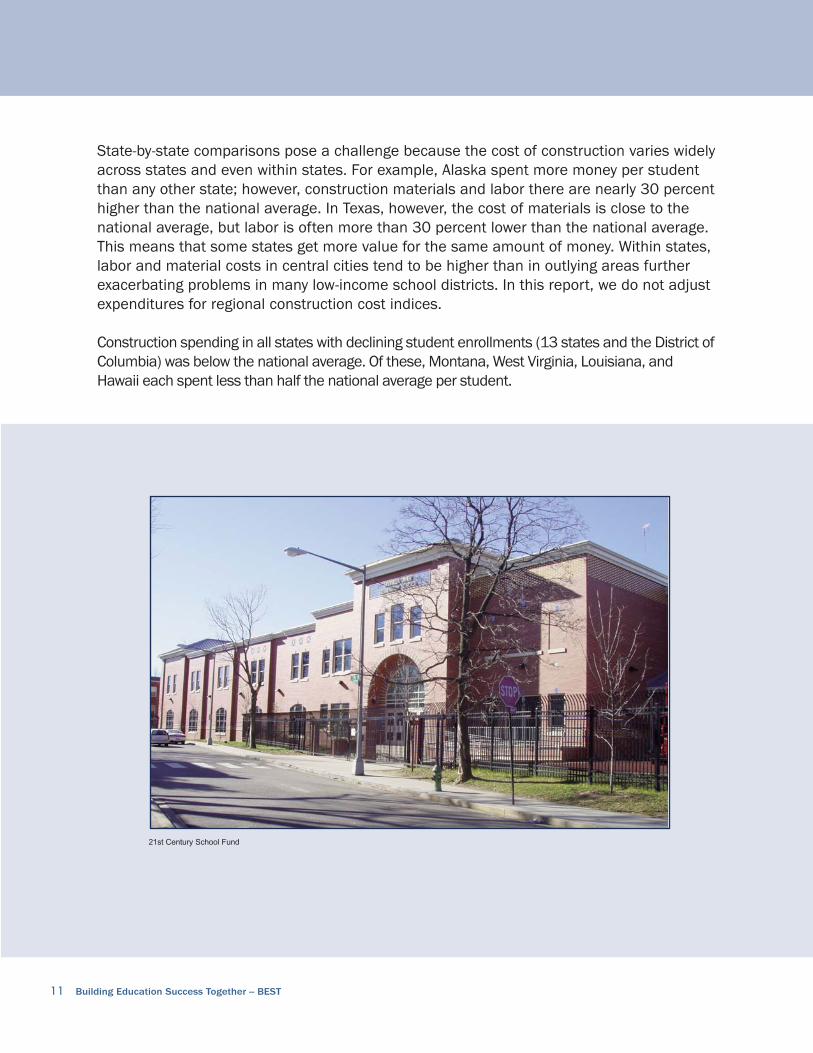
21st Century School Fund
Building Education Success Together -- BEST 12
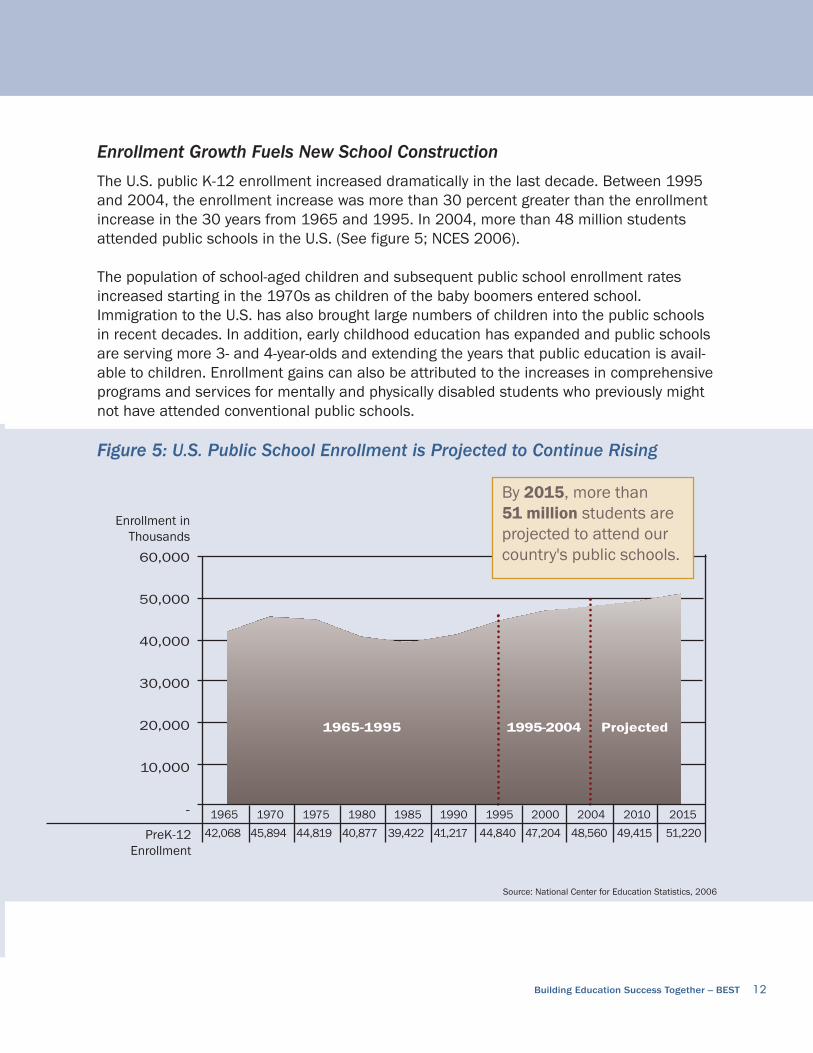
Enrollment Growth Fuels New School ConstructionThe U.S. public K-12 enrollment increased dramatically in the last decade. Between 1995and 2004, the enrollment increase was more than 30 percent greater than the enrollmentincrease in the 30 years from 1965 and 1995. In 2004, more than 48 million studentsattended public schools in the U.S. (See figure 5; NCES 2006).
The population of school-aged children and subsequent public school enrollment ratesincreased starting in the 1970s as children of the baby boomers entered school.Immigration to the U.S. has also brought large numbers of children into the public schoolsin recent decades. In addition, early childhood education has expanded and public schoolsare serving more 3- and 4-year-olds and extending the years that public education is avail-able to children. Enrollment gains can also be attributed to the increases in comprehensiveprograms and services for mentally and physically disabled students who previously mightnot have attended conventional public schools.
Figure 5: U.S. Public School Enrollment is Projected to Continue Rising
Source: National Center for Education Statistics, 2006
1965 1970 1975 1980 1985 1990 1995 2000 2004 2010 2015
60,000
50,000
40,000
30,000
20,000
10,000
-
Enrollment inThousands
42,068 45,894 44,819 40,877 39,422 41,217 44,840 47,204 48,560 49,415 51,220
By 2015, more than 51 million students areprojected to attend ourcountry's public schools.
1965-1995 1995-2004 Projected
PreK-12Enrollment

13 Building Education Success Together -- BEST
In addition to overall student enrollment increases, many states saw significant gains in theirimmigrant populations which has increased school enrollments. More than 15 million immigrantsentered the U.S. during the 1990s. As would be expected, the number of children in the U.S. withimmigrant parents is on the rise—immigrants now exceed 35 million and their children numberover 15 million (The Urban Institute 2006).
According to the 2000 Census, the states with the most foreign-born residents are: California,New York, Texas, Florida, Illinois, New Jersey, and Georgia. These states saw the most gainslargely because immigrants tend to settle in large metropolitan areas with ample jobopportunities (Frey 2003). They also tend to settle where other immigrants of similar origins havealready set up local immigrant communities, which have also traditionally been larger cities andmetropolitan areas.
During the last decade, most states saw at least moderate enrollment growth which followedpopulation trends across the U.S. The greatest booms in student population since 1995 havemostly been in western and southeastern states, including: Nevada, Arizona, California, Colorado,and Texas, as shown in Figure 6. East of the Mississippi River, the states with the largestenrollment increases were on the Atlantic coast: Florida, Georgia and North Carolina in the South,New Jersey, Virginia and Delaware in the Mid-Atlantic, and Connecticut in New England.
Figure 6: Greatest Increase in Public School Enrollment Change in Southwest and Southeast
Source: National Center for Education Statistics

Building Education Success Together -- BEST 14
Student enrollments also grew, although at a more moderate pace, in the Pacific Northwest, inMidwestern states, particularly Michigan and Illinois, and in the mid-Atlantic region.
Districts built thousands of new schools to meet the demands of this enrollment growth.Figure 7 shows the percentage of total school construction dollars that each state spent onnew school construction.
Figure 7: New Construction Dominates Western and Southern States
Source: McGraw-Hill Construction; National Center for Education Statistics
Comparing enrollment growth (Figure 6) with spending on new schools (Figure 7) reveals trendsand discrepancies. The largest expenditures on new schools were not always made in thestates that saw the greatest enrollment growth. Idaho and Nevada spent the largest share oftheir school construction expenditures on new construction—more than 60 percent, well over thenational average. However, these two states differ in terms of enrollment growth. Nevada has hadthe fastest-growing enrollment, but Idaho's enrollment has been stable. Idaho's school buildingprogram, a policy resulting from a school finance ruling that required the state to improve its schoolfacilities, favors new construction over renovation.
In the East, New Jersey and Connecticut had the greatest increase in student enrollment between1995 and 2004, but like their neighbors, spent little on new school construction. Districts arechallenged to find affordable and environmentally safe sites in this densely populated, once highlyindustrial, part of the northeast.

15 Building Education Success Together -- BEST
Poor Conditions, New Codes and Practices Spur RenovationsThe vast majority of school construction funding was for improvements and additionsto existing buildings. Years of deferred maintenance and normal wear-and-tear put thenation's aging school infrastructure in need of massive investment. School facilitiesrequire constant care and maintenance. Without this, health and safety problems arisein both old and new buildings. But while some health and safety problems are foundonly in older buildings—asbestos and lead paint, for example, other problems such asmold and poor indoor air quality can be found in old or new buildings. All school build-ings see significant use over the years, and roofs, windows, doors, furniture, and heat-ing, ventilation and air-conditioning equipment need replacing at the end of theirexpected life, no matter how well maintained.
Further, building codes and materials have changed dramatically. For instance, there isa much greater understanding of the need to conserve energy and incorporate envi-ronmentally responsible elements into buildings. There are also basic features, nowconsidered standard, that were not a part of design and construction of earlier genera-tions. For example, heating, ventilation and air conditioning systems have advancedover the decades. Even in the school buildings of the 1960s, there was far less electri-cal capacity built into schools and the wiring to support current technology simply is notthere.
21st Century School Fund

Building Education Success Together -- BEST 16
There is also greater use of special techniques and materials to help school buildingswithstand natural disasters. For example, windows in Florida schools must meet higherwind resistances to guard against hurricane damage and injuries. California schoolsmust comply with the Field Act, which has stringent structural codes to protect occu-pants from the effects of earthquakes. Because schools become refuge centers intimes of emergency, new security and safety measures are required for school con-struction and these policies support schools in this important civic role.
But beyond basic maintenance, repairs and improvements, other factors fueling theneed for school building improvements are changes in educational standards, curricu-lum, and teaching. The average age of our country's school buildings is now more than40 years, and they were built to accommodate teaching practices and the communityneeds of earlier generations. Educational programs have changed to include early-childhood education, smaller class sizes, social services and supports for students,programs for severely disabled students, and the use of new instructional technologies.Many schools are also now being designed or reconfigured for use by members of thecommunity outside of regular school hours. Joint-use schools—which might share alibrary, gym, theater, or swimming pool, with the community, for example—require dif-ferent designs.
The Need for Continued Spending and GrowthSince 1996 California voters have passed state K-12 school construction bonds total-ing more than $30 billion. When combined with local district matching bonds, this rep-resents $60 billion for elementary and secondary school construction and relatedcosts.
California is not alone in the need to maintain, and even increase, the level of fundingfor school construction. The state of New Jersey has estimated that it needs another$13 billion to meet the needs of school districts over the next 5 years. The District ofColumbia is considering a $4.5 billion plan to modernize and replace public schoolsover the next 15 years. New York City will be spending more than $9 billion in statefunds on new construction. Illinois is debating a new school construction bond programthat would total between $1 billion and $2 billion.
Although there has been tremendous growth in school construction spending over thelast decade, the scale and scope of facility needs are so large that more funding isneeded for school districts to relieve overcrowding and repair and modernize existingschools.
But it’s not only the level of capital spending that matters,it also matters where thesedollars go.
17 Building Education Success Together -- BEST
SCHOOL CONSTRUCTION DISPARITY, 1995-2004Ten years ago, the GAO study found that one-third of the nation's school buildings were in aserious state of disrepair. What was disturbing then was the great disparity in who attendedthe country's most dilapidated school buildings. What is disturbing now is that after thebiggest school building boom—undertaken during strong economic times, with low inflationand increasing spending in public education—there is no sign that the disparity documentedby the GAO in 1995 has been alleviated.
What was true in 1995 is still true today: a school with large minority enrollment, in adistrict with a high percentage of students from low-income families, is still most likelyto be in the worst physical condition.
The higher the percentage of low-income students in a district, the less money wasspent on school facilities. Over the last decade, the most disadvantaged studentsreceived about half the funding for their school buildings as their wealthier peers. Andeven though all students are held to the same academic standards under state andfederal education policy, students with the greatest disadvantages must overcome farmore than their more affluent counterparts to meet those same standards.
To understand the distribution of funding since the 1995 study, the BEST research teamanalyzed the per student funding by family income level in public school districts, perstudent funding of projects by median household income by community zip code, andper pupil funding by the racial and ethnic composition of school districts.
School District Spending by Family IncomeTo analyze how school construction spending was distributed by family income, school dis-tricts were classified into five categories (quintiles) based on the percentage of a district'sstudents that qualify for free or reduced-priced lunch. For the 2006-2007 school year, chil-dren who are eligible for free or reduced-price school lunches must come from families withan income of less than $37,000 for a family of four (U.S. Department of Agriculture 2006).
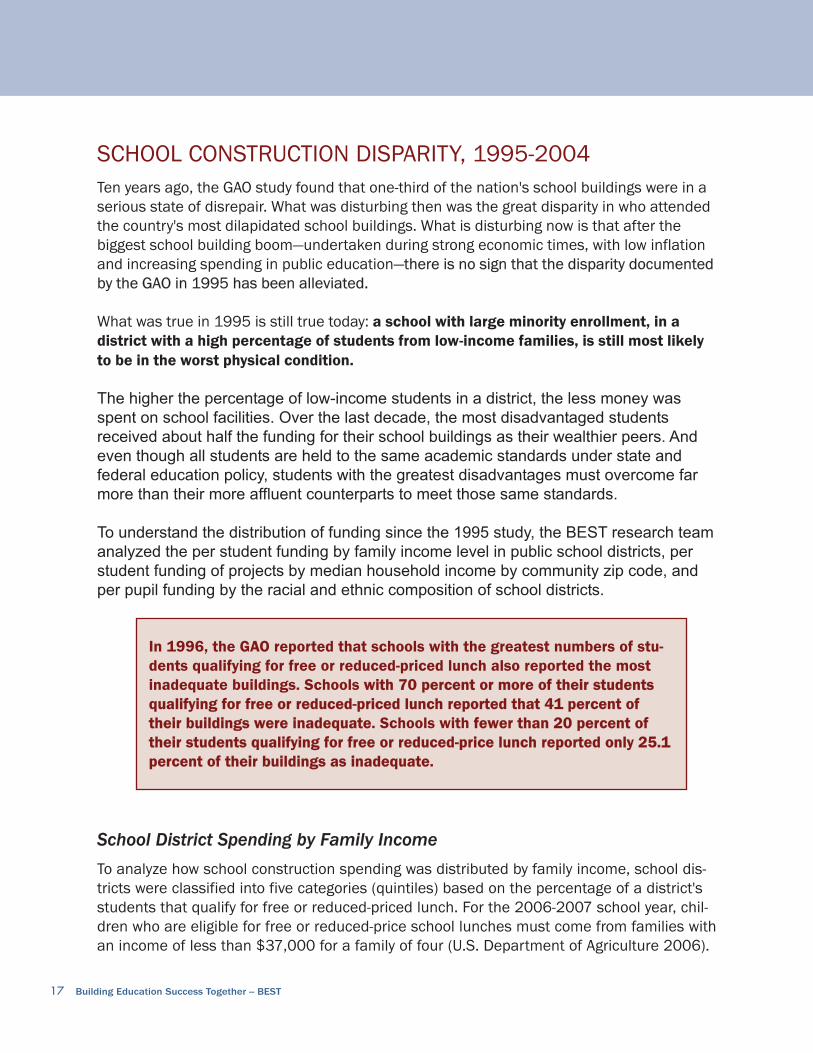
In 1996, the GAO reported that schools with the greatest numbers of stu-dents qualifying for free or reduced-priced lunch also reported the mostinadequate buildings. Schools with 70 percent or more of their studentsqualifying for free or reduced-priced lunch reported that 41 percent oftheir buildings were inadequate. Schools with fewer than 20 percent oftheir students qualifying for free or reduced-price lunch reported only 25.1percent of their buildings as inadequate.

Building Education Success Together -- BEST 18
To analyze how school construction was distributed by family income, school districts wereclassified into five categories based on the percentage of a district's students that qualifyfor free or reduced-priced lunch. The quintiles are as follows:
� Very Low Income: More than 75 percent of students qualify for lunch subsidies� Low Income: 40 to 75 percent of students qualify for lunch subsidies� Moderate Income: 25 to 40 percent of students qualify for lunch subsidies� Middle Income: 10 to 25 percent of students qualify for lunch subsidies� High Income: Less than 10 percent of students qualify for lunch subsidies
Just over 18 million students attend public schools in school districts where 40 to 75 percent ofstudents qualify for school lunch subsidies, but the majority of students attend public school indistricts where less than 40 percent of students qualify for lunch subsidies.
The yellow columns in Figure 8 display the distribution of students by school district percentagesof students who are eligible for free and reduced priced lunch.
As evident in Figure 8, school districts with 75 percent or more of their students qualifying for freeor reduced-price lunch received the least facility expenditures per student—an average of $4,800per student. The school districts with the fewest students qualifying for free or reduced-pricelunch, less than 10 percent, spent the most money per student—an average of $9,361. Overall,the higher the percentage of low-income students in a district, the less money was spent onschool facilities.
Figure 8: Investment Increases with Family Income
Source: McGraw-Hill Construction; National Center for Education Statistics
Very LowIncome
Low Income ModerateIncome
Middle Income High Income
18,000
16,000
14,000
12,000
10,000
8,000
6,000
4,000
2,000
0
Enrollment School year 2001-2002
$4,800$6,302
$7,105
$9,361
School Districts by Students’ Family income
ConstructionSpending Per Student
SY2001-02Enrollment (in thousands)
NationalAverage$6,519
$5,179
19 Building Education Success Together -- BEST
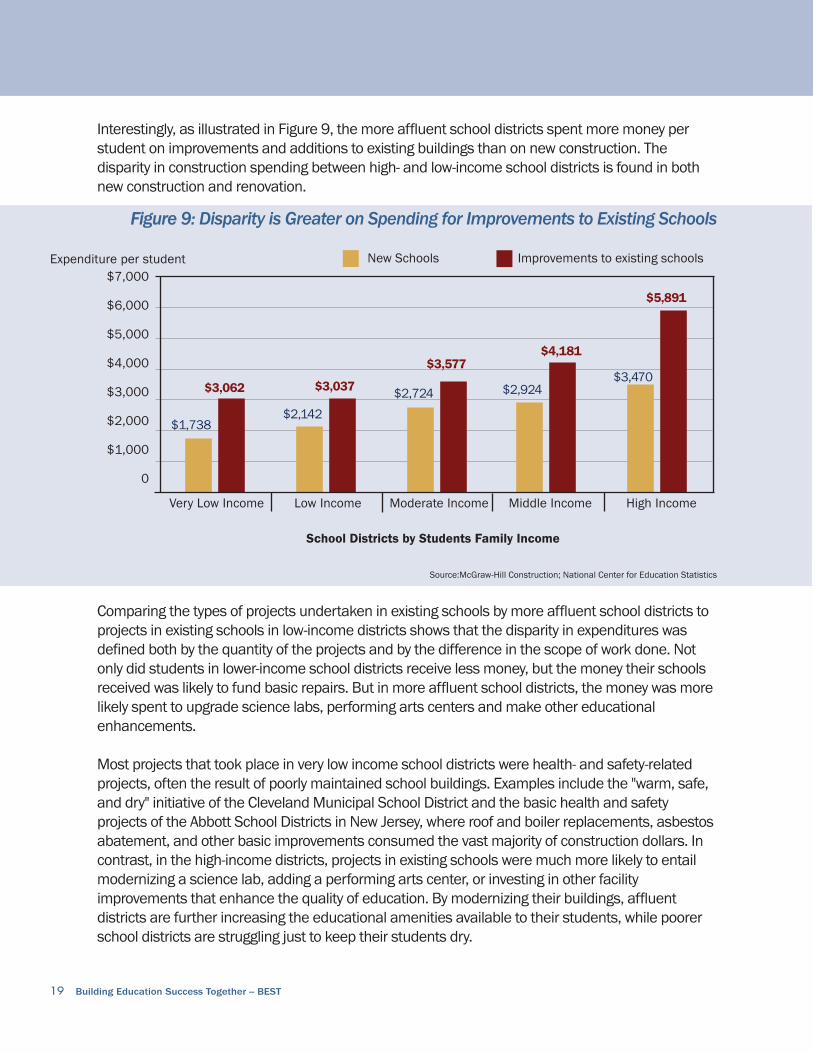
Interestingly, as illustrated in Figure 9, the more affluent school districts spent more money perstudent on improvements and additions to existing buildings than on new construction. Thedisparity in construction spending between high- and low-income school districts is found in bothnew construction and renovation.
Figure 9: Disparity is Greater on Spending for Improvements to Existing Schools
Source:McGraw-Hill Construction; National Center for Education Statistics
Comparing the types of projects undertaken in existing schools by more affluent school districts toprojects in existing schools in low-income districts shows that the disparity in expenditures wasdefined both by the quantity of the projects and by the difference in the scope of work done. Notonly did students in lower-income school districts receive less money, but the money their schoolsreceived was likely to fund basic repairs. But in more affluent school districts, the money was morelikely spent to upgrade science labs, performing arts centers and make other educationalenhancements.
Most projects that took place in very low income school districts were health- and safety-relatedprojects, often the result of poorly maintained school buildings. Examples include the "warm, safe,and dry" initiative of the Cleveland Municipal School District and the basic health and safetyprojects of the Abbott School Districts in New Jersey, where roof and boiler replacements, asbestosabatement, and other basic improvements consumed the vast majority of construction dollars. Incontrast, in the high-income districts, projects in existing schools were much more likely to entailmodernizing a science lab, adding a performing arts center, or investing in other facilityimprovements that enhance the quality of education. By modernizing their buildings, affluentdistricts are further increasing the educational amenities available to their students, while poorerschool districts are struggling just to keep their students dry.
$7,000
$6,000
$5,000
$4,000
$3,000
$2,000
$1,000
0
Expenditure per student
$3,062
School Districts by Students Family Income
New Schools Improvements to existing schools
Very Low Income Low Income Moderate Income Middle Income High Income
$1,738
$3,037
$2,142
$4,181
$2,924
$5,891
$3,577
$2,724$3,470

Building Education Success Together -- BEST 20
School District Spending by Community Household IncomeBecause school districts can cover hundreds of square miles and include many types ofcommunities, an analysis of school construction spending at the school district level canmask important variations in spending, particularly in states with county school districtssuch as Florida and Georgia. To try to understand what is happening at the neighborhoodand project level, we analyzed the McGraw-Hill data by project zip code and Census 2000median household income at the zip code level. In the U.S., there are nearly 18,000 schooldistricts and almost 35,000 five-digit zip codes.
Zip code areas were divided into five categories according to their median householdincome:
� Very Low Income (Less than $20,000)� Low Income ($20,000 to $34,999)� Moderate Income ($35,000 to $59,999)� Middle Income ($60,000 to $99,999)� High Income ($100,000 and more)
In 2003, about half of all public school students in the country lived in moderate-incomecommunities with median household incomes between $35,000 and less than $60,000.Only 1 percent of students live in high-income communities with median householdincomes of $100,000 or more, and more than 30 percent of students live in low- or very-low-income neighborhoods with median household incomes of less than $35,000.
21st Century School Fund

21 Building Education Success Together -- BEST
As Figure 10 shows, the lowest investment ($4,140 per student) was made in the poorestcommunities, while the highest investment ($11,500 per student) was made in high-income communities. Overall, the more affluent a community, the more funds were spentper student on school construction.
It is interesting to note that the disparity in construction spending is greater by communityhousehold income (Figure 10), than by school district family income (Figure 9). This sug-gests that disparity within school districts is masked in a district level analysis. Low-incomestudents may be getting an even smaller share of school construction investment than isrepresented by school district level analysis. This will be analyzed further in subsequentstudies by BEST.
Figure 10: Disparity Increases with Household Income
Source: McGraw-Hill Construction; U.S. Census Bureau, Census 2000 Summary File 3 (SF3)
School District Spending by Race and Ethnicity The minority enrollment in public schools is changing. In 2003, Hispanic students becamethe largest minority in public schools. The 2003-2004 distribution of students by race isillustrated in Figure 11.
Many of our nation's school districts are racially diverse, a condition made possible bydesegregation in the 1950s and immigration, which has accelerated since the 1970s.
Very LowIncome
Low Income ModerateIncome
Middle Income High Income
25,000
20,000
15,000
10,000
5,000
0
Census 2000Public School
Enrollment
$4,140
$6,045$7,922
$11,500
Median Household Income by Zip Code
Expenditure PerPupil
Census 2000Public SchoolEnrollment (in thousands)
NationalAverage$6,519
$4,824

Building Education Success Together -- BEST 22
Figure 11: Public School Students by Race/Ethnicity, 2003-04
Source: National Center for Education Statistics
This finding is consistent with changes in neighborhoods. In their recent paper,"Understanding Diverse Neighborhoods in an Era of Demographic Change," researchersMargery Turner and Julie Fenderson (2006) write:
Both city and suburban neighborhoods today exhibit more diversity—along lines of race,ethnicity, nativity, and income—than is commonly recognized. For example, more than halfof all neighborhoods in the 100 largest metro areas nationwide (56.6 percent) are hometo significant numbers of whites, minorities, and immigrants, with no single racial orethnic group dominating the minority population.
But at the same time, a substantial share of neighborhoods remain either exclusive—occupied predominantly by affluent, native-born whites, or isolated—occupiedpredominantly by lower-income minorities and immigrants.
In 1996 the GAO reported that individual schools with higher proportions ofminority students were most likely to report inadequate buildingconditions: 42 percent of the schools where more than half of the studentswere minorities were reported as being inadequate. Conversely, only 28 percent of schools that had very few minority studentswere reported as inadequate.
20%Hispanic 17%
Black
58%White
4%Asian
1%Native
American

23 Building Education Success Together -- BEST
Like neighborhoods, there is growing diversity in school districts. But while school districtsmay be more diverse, individual schools within a district can be an entirely different story.Many of our schools have student populations that are less diverse, by race and/or income,than the communities they serve.
In our analysis of school construction investment by race and ethnicity, we have used thetypologies developed by Turner and Fenderson (2006) to report the racial and ethnicdiversity in school districts. Using this typology, school districts are divided into four differenttypes of districts:
� Predominantly minority: population is less than 10 percent non-Hispanic white� Majority minority: population is 10 to 50 percent non-Hispanic white � Majority White: population is 50 to 90 percent non-Hispanic white� Predominantly white: population is more than 90 percent non-Hispanic white
Nineteen percent of the nation's 48 million public school students attend schools in districtsthat are more than 90 percent white. Although 60 percent of the nation's public schoolstudents still attend public school districts that are majority white, 40 percent attend publicschool districts that have majority-minority populations.
Figure 12: Minority Districts Fall Behind
Source: McGraw-Hill Construction; National Center for Education Statistics
School DistrictPredominantly
minority
School DistrictMajority minority
School DistrictMajority white
School DistrictPredominantly
white
20,000
18,000
16,000
14,000
12,000
10,000
8,000
6,000
4,000
2,000
0
Enrollment SY2003-04(in Thousands)
$5,172
$6,452 $7,102
School District Types by Race and Ethnicity
ConstructionSpending Per Student
Enrollment SY2003-04(in thousands)
NationalAverage$6,519$5,612

Building Education Success Together -- BEST 24
Spending on school construction from 1995 through 2004 ranged from an average of $5,172 perstudent in the districts with the highest concentration of minority students to $7,102 per student indistricts with the highest concentration of white students. The higher average expendituresoccurred in schools that were predominantly white. Schools with high percentages of minoritiesreceived the lowest average expenditures per student.
Overall, about 60 percent of school districts in the U.S. have student populations of at least50 percent white. On average, the school districts with the largest enrollments of whitestudents had significantly higher spending on their school facilities over the last decadethan school districts where minorities make up the majority of student enrollments.
Interestingly, our analysis reveals that the disparity by race is less than the disparity by bothfamily and community income (Figures 9, 10 and 11). This suggests that a substantialnumber of minority children are affluent enough or attend school districts with enoughaffluent children to benefit from a higher level of investment than would be likely in moreeconomically isolated and poor districts.
Progress Toward Greater Equity and Adequacy States and local school districts have been spending ever-increasing amounts for newschools and to improve and expand existing school buildings. But many states have beenforced into doing so. During the last 20 years, an increasing number of lawsuits havechallenged the distribution of state funding for facilities. Many of these lawsuits haveincluded a challenge to the disparities found in school facility conditions that lead to unsafeand inadequate facilities disproportionately attended by low-income students. Currently, 24states are named in cases challenging public school financing; in total, 35 states have seencases involving school facilities funding (National Access Network 2006).
To evaluate the impact these cases have had had on school construction spending, weanalyzed the 1995-2004 McGraw-Hill construction start data by comparing the per-studentexpenditures before and two years after successful school facility finance lawsuit decisions(Buckley 2005).
While most states increased school construction expenditures during this time, the stateswith successful court cases spent, on average, an additional $158 per student annuallythan states with unsuccessful cases or no facility-related cases at all (for a discussion of themethodology, see Appendix A). To illustrate the significance of $158, the median annualfacility expenditure per student in 2004 was $680. An increase of $158 is 23 percent morethan the median construction expenditures per student. Therefore, the lawsuits appear tobe having a significant impact on the amount of funding for school construction.

25 Building Education Success Together -- BEST
New Jersey's Abbott Decisions Show Potential to Alleviate Disparities New Jersey's Abbott v. Burke ruling—which led to new school construction policies—was one of thefirst statewide school finance decisions to include remedies for inadequate school facilities as away to address pervasive inequities in a state school finance system. The original 1985 statesupreme court ruling and subsequent rulings through the 1990s cited the poor condition andovercrowding of the school buildings in the state's poorest areas as evidence of severe inequitiesbetween school districts with large percentages of students from low-income families and theirwealthier counterparts.
As a result of the court actions, the state made wholesale changes to its education system,including a new funding formula, core curriculum, a statewide preschool initiative, and programs forat-risk students. After determining that facilities were vital to building a more equitable educationsystem, the state also implemented a large-scale plan to build and better maintain facilities,particularly in the neediest districts.
In 2000, the state allocated $8.6 billion—$6 billion for the lowest income, Abbott School Districtsand $2.6 billion for other high need districts—for new school construction and renovations. Thestate authorized the Economic Development Authority and then the Schools ConstructionCorporation (SCC), to oversee the work. More than 500 projects were scheduled. Figure 13illustrates the dramatic impact of the court decisions on school construction spending in NewJersey.
Figure 13: New Jersey Construction Spending Increases with Court Rulings
Source: McGraw-Hill Construction
$3,500,000,000
$3,000,000,000
$2,500,000,000
$2,000,000,000
$1,500,000,000
$1,000,000,000
$500,000,000
$0
1995 1996 1997 1998 1999 2000 2001 2002 2003 2004
Abbott IV Abbott V Abbott VII
Expenditures in 2005 Dollars
$559,390,541
$588,751,548
$611,127,937
$859,313,446
$629,231,063
$814,975,049
$1,175,931,046$1,669,515,563
$1,705,555,401
$2,554,789,738

Building Education Success Together -- BEST 26
About a quarter of New Jersey's students come from low-income or moderately low-incomehouseholds. The Abbott decision and subsequent New Jersey School ConstructionCorporation funds targeted these districts. As Figure 14 shows, the Abbott districts received,on average, nearly as much per-student funding as the high-wealth districts—$7,795 perlow-income student and $7,777 per moderately low-income student, compared to $8,548per high-income student. An average of $6,889 was spent on each student from middle-income households, and $6,967 was spent on each student from moderate-incomefamilies.
Figure 14: New Jersey Remedies Drastically Reduce Disparity
Source: McGraw-Hill Construction; National Center for Education Statistics
Spending disparity in New Jersey is far less than the national average because of the policychanges brought by the court actions. New Jersey demonstrates that targeted state inter-vention can greatly remedy school facility spending disparities that ultimately impact thelearning experiences of our children.
Very LowIncome
Low Income ModerateIncome
Middle Income High Income
10,000
8,000
6,000
4,000
2,000
0
EnrollmentSY2001-02
$7,795$6,967 $6,889
$8,548
School Districts by Students Family Income
ConstructionSpending Per Student
EnrollmentSY2001-02(in thousands)
NationalAverage$6,519
$7,777

27 Building Education Success Together -- BEST
RECOMMENDATIONS AND CONCLUSIONDespite record investments in school construction, the students who were most likely toattend school in run-down buildings with health and safety issues 10 years ago are still mostlikely to attend precisely the same types of buildings today. While federal and state policiesstrive to set high academic standards for all children, we have allowed a double standard toexist in the quality of our children’s school buildings. A shift in federal and state policy,funding and accountability is needed to support high quality school facilities.
Federal and State PolicyThe federal government, while mandating new accountability measures, has provided nolarge-scale relief for school districts needing support for school facilities. The No Child LeftBehind Act’s major objective is to close achievement gaps and boost the performance oflow-income and minority students. But while the law acknowledges the importance ofteachers, governance, curriculum and standards, it is stunningly silent on educationalfacilities. Even at the state level, there is a dearth of policy and minimal involvement inproviding adequate facilities for students and teachers.
At the Federal and State level we recommend:
It is clear from the local and state work in which BEST partners are engaged, that individualschool systems cannot meet the need for high quality school facilities without the help andparticipation of the entire community.
To support school districts, we recommend:
Closing the disparity gap in school building quality should be an integral part of closing theachievement gap, and should be an explicit objective of state and federal educational law,including No Child Left Behind and other funding sources.
That public school facilities be incorporated into programs and funding of a wide range offederal and state agencies. For example:� What can HUD do to ensure that when housing is developed, there is a plan and
the ability to improve neighborhood schools as part of the community development?
� How can FEMA modify its aid so it can be combined with other funds to improve school facilities beyond their “pre-disaster” conditions?
� How might Homeland Security assist localities in their preparedness by helping school districts with the modifications needed for use of schools as shelters?
Building Education Success Together -- BEST 28
School Construction FundingThe operating budget of school districts is-on average-funded 9 percent from the federalgovernment, 47 percent by the state and 44 percent by local revenues (U.S. CensusBureau). The federal government provides only minimal funding for school facilities. Otherthan E-rate funding for technology infrastructure, the only substantial federal funding isthrough the U.S. Department of Treasury tax credit to school districts through Qualified ZoneAcademy Bonds.
State funding for school construction varies. Some states assume all responsibility forschool construction funding, but others provide virtually no funding. In some states, schooldistricts fund capital projects and new construction through a reimbursement formula. Thismeans school districts must have all of the necessary capital funds upfront before they canbe reimbursed for the state’s share. Such a system gives an obvious advantage to moreaffluent districts—a disparity that has increasingly been successfully challenged in court.
We recommend:
AccountabilityUnlike the operating budget, school district capital budgets are largely unstudied andtherefore poorly understood. In the course of this study, for example, we sought to learnwhat proportion of school district capital outlay was funded locally and what proportion wasfunded by the state or other sources. We found no national database that allowed thiscomparison. Far greater accountability is required to support learning and teachingconditions in our school buildings and to monitor the funds spent providing facilities forchildren, educators and communities.
To understand how to reflect facility quality as an additional indicator for school quality, andto help guide decision-making and investment in public school facilities, more research isneeded on the impact school facilities have on teaching and learning. We need greaterunderstanding of the real conditions our students and teachers face, the ways schoolbuildings and communities affect one another, and the costs and efficiencies of variousdesign and building measures. Most fundamentally, good, basic information on schoolbuilding inventory, design, utilization and condition is necessary.
Construction and related capital outlay for schools should be funded from the federal andstate governments in at least the same proportion as operating budget expenditures—9percent from the federal government, targeted to the neediest children; and at least 47percent from the states, again allocated on a needs basis, but in advance, rather than as areimbursement.
29 Building Education Success Together -- BEST
We recommend:
ConclusionIt is not an accident that communities that have the means to invest in their public schoolbuildings do so. They improve and enhance their school facilities because it matters to thequality of education, the strength of their community, and the achievement and well-being oftheir children and teachers.
Though state funding and local funding for improving school infrastructure have increaseddramatically, there has been no federal or national interest or intervention commensuratewith the size of construction spending, extent of disparity, or level of need. At the state levelthere is too much variation in the involvement and responsibility taken by policy makers forthe quality of school buildings.
To address these problems, we recommend a set of measures to ensure that public schoolbuildings are healthy, safe, and educationally adequate for all students, teachers andfamilies.
This report has illuminated the unprecedented spending and growth in the construction andrenovation of our country’s schools over the last decade. Yet, there is a tremendousdisparity in who has benefited from the billions of public dollars invested. With new federaland state laws holding schools accountable for high student achievement, it is only fair thatwe give all students, especially the most disadvantaged, every opportunity they need tosucceed.
The quality of our nation’s public schools is a critical contributor to our country’s prosperityand democracy. We must strive to provide our children with the highest quality education tocompete in the global workforce and participate in civic life. Our communities need publicplaces that connect us to our children and to each other. When we invest in good qualitymaintenance, design and construction, we are supporting educational opportunity, socialequity, environmental responsibility, children’s health, and community vitality, safety andsecurity.
� The National Center for Educational Statistics (NCES) expand the Common Core ofData (CCD) to include information on inventory, condition, design, utilization andfunding of public school buildings.
� A consortium of educators, community developers, advocates, researchers, from thepublic and private sector develop a coherent research agenda to better understandthe relationships between learning, teaching and the built environment of schoolfacilities; and to document and evaluate policy and practice in the planning, siting,management, financing, design and construction of school facilities.
� Funds to support this research and subsequent change in policy and practice shouldbe identified through public and private partnerships at the federal, state and locallevels.

Building Education Success Together -- BEST 30
ABOUT BEST:Under the leadership of the 21st Century School Fund and with support from the Ford Foundation, agroup of local and national organizations working to improve public school facilities created BuildingEducational Success Together (BEST) in 2001. BEST is dedicated to identifying, developing and sharingexperience and knowledge about policy and practices, to improve public school facilities but also topromote educational quality and community vitality.
The BEST partners have developed a five-part policy agenda:
1. Connect educational improvements and school facility improvements;
2. Engage communities and school staff in district-wide and school-specific facility planning;
3. Modify and build school facilities that support extensive community use;
4. Manage school facility maintenance and construction effectively, efficiently and fairly;
5. Fund school building maintenance and construction with stable and sufficient budgets thatwill ensure adequate facilities for all children.
BEST partners have also worked to better understand the impact of facility condition and design onlearning and teaching, by researching and publishing the following reports:
� "Do School Facilities Affect Academic Outcomes?" (2002) - reviews the research on school buildingquality and academic outcomes, which finds consistent relationships between poor facilityconditions and poor performance.
� "Linking School Facility Conditions to Teacher Satisfaction and Success" (2003) - finds that poorfacility conditions make it more difficult for teachers to deliver an adequate education to theirstudents, adversely affect teachers' health, and increase the likelihood that teachers will leave theirschool.
� "The Effects of School Facility Quality on Teacher Retention in Urban School Districts" (2004) - findsthat school facility quality is an important predictor that teachers will leave their current position.
� "The Educational Adequacy of New Jersey Public School Facilities: Results from a Survey ofPrincipals" (2004) - presents the results of a survey of New Jersey school principals, which revealedthat a third felt that their facilities were in poor condition and those conditions impacted thecurricula and course offerings as well as teacher recruitment and retention.
� "Los Angeles Unified School District School Facilities and Academic Performance" (2004) evaluatesschools on 14 measures of compliance that included aspects of environment, safety, maintenance,and vehicular traffic and finds that there is a positive relationship between a school’s compliancewith health and safety regulations and its academic performance.
� "School Facility Investments in the Washington DC Metropolitan Area, 1995-2004" (2006) - tracksthe expenditures on school facilities within the District of Columbia, and finds that the district'sracially diverse schools often received more funding than the majority black schools and those withlow percentages of white students.

31 Building Education Success Together -- BEST
REFERENCES
Blank, Martin J. Atelia Melville, and Bela P. Shah. 2003. Making the Difference: Research and Practice inCommunity Schools. Washington, DC: Coalition for Community Schools.
Buckley, Jack, Mark Schneider, and Yi Shang. 2004. The Effects of School Facility Quality on Teacher Retentionin Urban School Districts. Washington, DC: National Clearinghouse for Educational Facilities.
Buckley, Jack. 2005. Analysis of the Relationship between Public School Construction Expenditures and PublicSchool Finance Court Cases with Facilities Element. Washington, DC: BEST.
Earthman, Glen I. 2004. Prioritization of the 31 Criteria for School Building Adequacy. Baltimore, MD: AmericanCivil Liberties Union Foundation of Maryland.
Economics Center for Education and Research. 2003. The Economic Impact of Implementing the CincinnatiPublic Schools’ Facilities Master Plan on Greater Cincinnati. Prepared for the Greater Cincinnati Chamberof Commerce and the Cincinnati Area Board of Realtors.
Frey, William H. 2003. Metro Magnets for International and Domestic Migrants. Washington, DC: Brookings.Kane, Thomas J., Douglas O. Staiger, and Gavin Samms. 2003. School Accountability Ratings and Housing
Values, Brookings-Wharton Papers on Urban Affairs. Washington, DC: Brookings Institution.Local Government Commission. 2002. New Schools for Older Neighborhoods: Strategies for Building our
Communities’ Most Important Assets. Sacramento, CA: Local Government Commission and NationalAssociation of Realtors.
National Access Network. 2006. Litigation Overview. Campaign for Educational Equity at Teachers College,Columbia University, http://www.schoolfunding.info/litigation/litigation.php3.
National Center for Education Statistics. The Common Core of Data (CCD). http://nces.ed.gov/ccd/.National Center for Education Statistics. 2006. Projections of Education Statistics to 2015. Washington, DC:
National Center for Educational Statistics. National Education Association. 2000. Modernizing our Schools: What will it cost? Washington, DC: National
Education Association.PolicyLink. 2005. Ending School Overcrowding in California: Building Quality Schools for All Children. A Report
from PolicyLink and MALDEF. Oakland, CA: PolicyLink.Salveson, David and Henry Renski. 2002. The Importance of Quality of Life in the Location Decisions of New
Economic Firms. Reviews of Economic Development Literature and Practice, No. 15. EconomicDevelopment Administration, U.S. Department of Commerce.
Schneider, Mark. 2002. Do School Facilities Affect Academic Outcomes? Washington, DC: NationalClearinghouse for Educational Facilities.
Turner, Margery Austin and Julie Fenderson. 2006. Understanding Diverse Neighborhoods in an Era ofDemographic Change. Washington, DC: The Urban Institute.
U.S. Census Bureau. Census 2000 Summary File 3 (SF 3).U.S. Census Bureau. Federal, State, and Local Governments: Public Elementary-Secondary Education Finance
Data, 1995-2004. http://www.census.gov/govs/www/school.html.U.S. Department of Agriculture. 2006. National School Lunch Program Factsheet.
http://www.fns.usda.gov/cnd/lunch/AboutLunch/NSLPFactSheet.pdf.U.S. General Accounting Office. 1995. School facilities: Conditions of America's Schools. Washington, DC: GAO.U.S. General Accounting Office. 1996. School Facilities: America’s Schools Report Different Conditions.
Washington DC: GAO.Urban Institute. 2006. Children of Immigrants: Facts and Figures. Washington, DC: Urban Institute.Weiss, Jonathan D. 2004. Public Schools and Economic Development: What the research shows. Cincinnati,
Ohio: KnowledgeWorks Foundation.

Building Education Success Together -- BEST 32
APPENDIX A: METHODOLOGY
BEST sought a reliable alternative source of data to assess the last decade of school capital spend-ing since the 1995 findings by the GAO, however, there is no comprehensive public national data-base on public school facility conditions or school construction spending. While the federal govern-ment has shown little interest in the condition of the country’s public school buildings, the privatesector, as the primary provider of the labor, materials, and management for school construction,has had a stronger interest in this information.
McGraw Hill Construction, a segment of McGraw Hill Companies collects detailed project-level dataon every building project valued at more than $100,000 undertaken by the nation’s school dis-tricts. These “construction start” data reflect the contract value of each project and represent theconstruction “hard costs”: the basic labor and material expenses of the project. The additional “softcosts” – such as site acquisition, architectural, engineering, project management and other fees –are not collected by McGraw-Hill. Hard costs typically account for about 70 percent of a project’stotal cost.
These proprietary McGraw Hill data are collected in real time for the purpose of informing construc-tion industry manufacturers, contractors, and subcontractors of projects that will be under con-struction, so they can market their goods or services to the project owner and contractor. The 21stCentury School Fund, the lead BEST partner, purchased a data set from McGraw Hill containing Pre-K-12 public school construction expenditures between 1995 and 2004.
There were 184,000 projects in the initial data set. BEST partners did a random comparison checkof McGraw Hill project data to school facility data maintained and collected by BEST partners onschool construction in their own regions and cities. The check was to determine if the basic projectlevel data included in the McGraw Hill data set was complete and accurate for the cost and descrip-tion. The 21st Century School Fund, the lead researcher for this report, also compared theMcGraw-Hill cost data in aggregate to U.S. Census of Governments, Education finance data on pub-lic school district capital outlay that is collected as part of the Common Core of Data by the NationalCenter for Education Statistics.
Through these comparisons, we determined that the totals were of high quality, although about20% less than reported by the school districts themselves, and that the project level data was com-plete and accurate enough to work with, although we knew the data was not without shortcomings.Although we were satisfied with the accuracy of McGraw Hill Construction Starts, the format, layoutand fields of this data set were not designed for research purposes. There were no formatted fieldsto indicate school name/identification or school district name/identification of the projects. After aninitial clean up, a total of 146,559 projects were ultimately able to be used in this analysis.
33 Building Education Success Together -- BEST
BEST spent nearly a year cleaning and formatting the data to meet the needs for use in this analy-sis. The data was then linked to National Center for Education Statistics (NCES) Common Core Data(CCD) and U.S. Census data. These data were linked to the McGraw-Hill data using school informa-tion and zip code data.
In addition to basic totals and ratios prepared for this analysis, BEST partners were interested in theeffects of litigation on school construction spending. Jack Buckley, PhD, used the McGraw Hill datato assess the impact of successful legal challenges to school finance practices on school construc-tion expenditures when school facilities have been an element of the legal challenge. He analyzedthe construction expenditures from states with successful finance cases which included a facilitieselement by analyzing the change in per pupil expenditures from the year of the case to two yearsafter the last successful case. States with successful lawsuits were compared to a control group of31 randomly selected states with either unsuccessful cases, cases that did not include facilities, orno cases at all. State expenditure data was compared the year of the successful decision to twoyears after the ruling. A differences-in-differences model via a robust regression of the differencesin spending on an indicator variable for the successful court cases, an indicator if the state had hada successful court case earlier than the period for which spending data was available, and the levelof per pupil construction spending at the first time point for each case. Although most of the statesspent increasing amounts of money on school construction over the 10-year period, the states withsuccessful facility court cases spent, on average, an additional $158 dollars per pupil (p = .04) twoyears after the successful court cases, than the states without successful cases or no cases at all.

Building Education Success Together -- BEST 34
State
1Interest on debt was not adjusted to 2005 dollars
Source: U.S. Census of Governments, Public Elementary-Secondary Education Finance Data
Total Construction
Land and existing
structures InstructionalOther or
nonspecified
Equipment
Capital Outlay (in 2005 dollars)(Thousand dollars)
Table 1: U.S. Census of Governments Public School Capital Outlay by State: 1995-2004
Alabama
Alaska
Arizona
Arkansas
California
Colorado
Connecticut
Delaware
District of Columbia
Florida
Georgia
Hawaii
Idaho
Illinois
Indiana
Iowa
Kansas
Kentucky
Louisiana
Maine
Maryland
Massachusetts
Michigan
Minnesota
Mississippi
Missouri
Montana
Nebraska
Nevada
New Hampshire
New Jersey
New Mexico
New York
North Carolina
North Dakota
Ohio
Oklahoma
Oregon
Pennsylvania
Rhode Island
South Carolina
South Dakota
Tennessee
Texas
Utah
Vermont
Virginia
Washington
West Virginia
Wisconsin
Wyoming
Total
$5,578,276
$2,193,385
$10,453,456
$2,694,905
$65,021,676
$8,537,061
$3,968,193
$1,244,720
$1,213,080
$31,222,025
$16,821,535
$1,397,102
$2,005,655
$25,697,980
$9,732,972
$4,450,163
$2,836,198
$4,026,310
$4,298,569
$1,382,401
$7,980,462
$6,835,573
$21,509,245
$11,598,672
$3,812,590
$8,225,380
$797,134
$3,330,512
$5,207,379
$1,749,703
$15,215,015
$3,617,303
$40,726,422
$12,597,662
$796,347
$17,792,043
$3,832,844
$4,953,719
$20,775,891
$320,594
$8,154,870
$1,333,584
$7,526,725
$49,217,076
$4,424,676
$736,139
$11,467,549
$12,636,480
$1,883,172
$9,710,171
$1,035,223
$504,575,821
$4,294,572
$1,760,908
$7,199,758
$1,045,699
$45,434,396
$5,958,608
$2,528,881
$1,003,318
$1,011,690
$22,979,860
$12,744,410
$956,330
$1,608,401
$19,045,529
$5,628,524
$2,882,416
$1,047,975
$2,425,358
$2,429,072
$568,629
$5,795,987
$5,250,621
$12,921,998
$8,830,550
$2,617,500
$5,308,758
$484,026
$1,678,056
$4,178,553
$1,161,934
$11,067,633
$2,172,280
$34,923,272
$9,749,931
$446,625
$12,041,948
$2,097,564
$4,001,325
$17,907,163
$97,863
$5,762,724
$811,878
$5,269,841
$38,414,540
$2,618,804
$497,793
$7,215,825
$9,251,116
$633,688
$6,807,924
$585,170
$363,157,222
$166,120
$206,676
$336,819
$695,260
$9,161,186
$398,407
$563,855
-
$9,318
$1,616,863
$629,640
$99,402
-
-
$331,484
$111,326
$184,054
$95,557
$560,545
$327,076
$247,781
$376,630
$2,631,099
$493,017
-
$594,507
$28,716
$174,861
$263,916
$318,104
$1,855,066
$768,625
$661,018
$514,129
$49,968
$493,319
$415,107
$97,445
$97,999
$8,690
$302,735
-
$200,966
$1,812,056
$677,338
$30,790
$1,506,265
$713,548
$562,430
$553,725
$51,982
$31,995,441
$466,177
$123,553
$1,063,059
$330,438
$3,902,452
$570,153
$392,474
$100,547
$37,069
$143,129
$1,225,488
$225,316
$194,701
$1,745,253
$268,469
$559,697
$709,001
$1,050,741
$690,760
$162,963
$622,215
$601,007
$1,115,324
$575,026
$411,905
$724,030
$109,542
$295,181
$477,256
$144,668
$971,439
$94,792
$2,317,142
$1,005,983
$122,401
$1,918,967
$567,591
$215,216
$1,230,790
$108,043
$556,232
$163,096
$890,830
$3,193,845
$348,165
$94,485
$1,256,493
$705,650
$326,316
$956,100
$136,346
$36,217,515
$651,407
$102,248
$1,853,818
$623,509
$6,523,643
$1,609,893
$482,980
$134,837
$154,999
$6,482,173
$2,221,998
$116,055
$202,553
$4,907,198
$3,504,495
$896,724
$895,169
$454,654
$618,191
$323,733
$1,314,479
$607,315
$4,840,824
$1,700,075
$783,185
$1,598,084
$174,850
$1,182,413
$287,654
$124,997
$1,320,878
$581,606
$2,824,990
$1,247,279
$177,352
$3,337,808
$752,583
$639,733
$1,539,939
$105,997
$1,533,179
$347,918
$1,165,087
$5,796,635
$780,369
$112,773
$1,488,967
$1,966,167
$360,738
$1,392,423
$261,725
$73,108,299
Interest on debt1
$695,465
$231,534
$2,453,069
$549,888
$4,740,076
$2,122,931
$1,108,827
$74,038
-
$3,800,010
$1,608,902
-
$312,068
$4,472,474
$535,009
$499,229
$965,555
$929,300
$973,346
$353,193
$784,559
$2,058,315
$5,434,554
$2,791,311
$524,297
$1,480,229
$110,750
$400,777
$1,182,116
$320,971
$2,155,608
$305,820
$7,563,824
$2,013,762
$70,419
$2,484,016
$401,280
$1,253,408
$6,285,583
$197,511
$1,214,488
$171,351
$1,142,729
$10,361,891
$627,793
$121,780
$1,990,194
$2,801,461
$111,978
$2,053,096
$94,200
$79,142,295
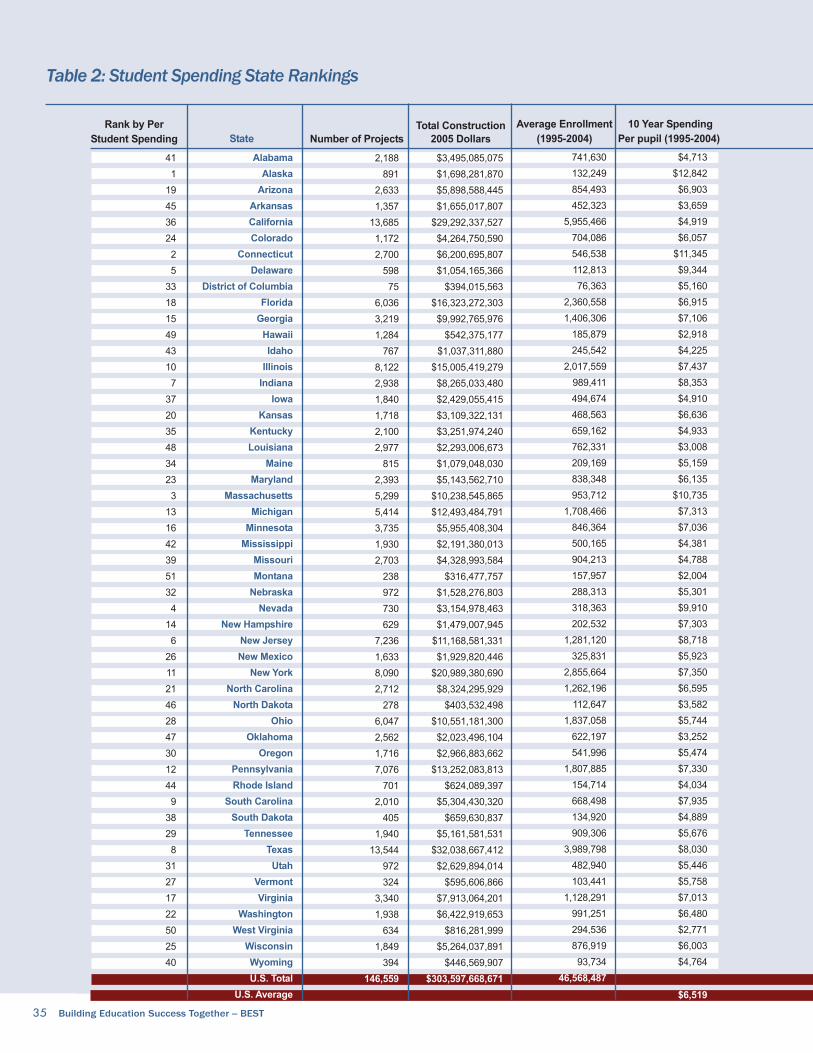
35 Building Education Success Together -- BEST
State Number of Projects
Total Construction
2005 Dollars
Average Enrollment
(1995-2004)
Table 2: Student Spending State Rankings
41
1
19
45
36
24
2
5
33
18
15
49
43
10
7
37
20
35
48
34
23
3
13
16
42
39
51
32
4
14
6
26
11
21
46
28
47
30
12
44
9
38
29
8
31
27
17
22
50
25
40
10 Year Spending
Per pupil (1995-2004)
Rank by Per
Student Spending
Alabama
Alaska
Arizona
Arkansas
California
Colorado
Connecticut
Delaware
District of Columbia
Florida
Georgia
Hawaii
Idaho
Illinois
Indiana
Iowa
Kansas
Kentucky
Louisiana
Maine
Maryland
Massachusetts
Michigan
Minnesota
Mississippi
Missouri
Montana
Nebraska
Nevada
New Hampshire
New Jersey
New Mexico
New York
North Carolina
North Dakota
Ohio
Oklahoma
Oregon
Pennsylvania
Rhode Island
South Carolina
South Dakota
Tennessee
Texas
Utah
Vermont
Virginia
Washington
West Virginia
Wisconsin
Wyoming
U.S. Total
U.S. Average
2,188
891
2,633
1,357
13,685
1,172
2,700
598
75
6,036
3,219
1,284
767
8,122
2,938
1,840
1,718
2,100
2,977
815
2,393
5,299
5,414
3,735
1,930
2,703
238
972
730
629
7,236
1,633
8,090
2,712
278
6,047
2,562
1,716
7,076
701
2,010
405
1,940
13,544
972
324
3,340
1,938
634
1,849
394
146,559
$3,495,085,075
$1,698,281,870
$5,898,588,445
$1,655,017,807
$29,292,337,527
$4,264,750,590
$6,200,695,807
$1,054,165,366
$394,015,563
$16,323,272,303
$9,992,765,976
$542,375,177
$1,037,311,880
$15,005,419,279
$8,265,033,480
$2,429,055,415
$3,109,322,131
$3,251,974,240
$2,293,006,673
$1,079,048,030
$5,143,562,710
$10,238,545,865
$12,493,484,791
$5,955,408,304
$2,191,380,013
$4,328,993,584
$316,477,757
$1,528,276,803
$3,154,978,463
$1,479,007,945
$11,168,581,331
$1,929,820,446
$20,989,380,690
$8,324,295,929
$403,532,498
$10,551,181,300
$2,023,496,104
$2,966,883,662
$13,252,083,813
$624,089,397
$5,304,430,320
$659,630,837
$5,161,581,531
$32,038,667,412
$2,629,894,014
$595,606,866
$7,913,064,201
$6,422,919,653
$816,281,999
$5,264,037,891
$446,569,907
$303,597,668,671
741,630
132,249
854,493
452,323
5,955,466
704,086
546,538
112,813
76,363
2,360,558
1,406,306
185,879
245,542
2,017,559
989,411
494,674
468,563
659,162
762,331
209,169
838,348
953,712
1,708,466
846,364
500,165
904,213
157,957
288,313
318,363
202,532
1,281,120
325,831
2,855,664
1,262,196
112,647
1,837,058
622,197
541,996
1,807,885
154,714
668,498
134,920
909,306
3,989,798
482,940
103,441
1,128,291
991,251
294,536
876,919
93,734
46,568,487
$4,713
$12,842
$6,903
$3,659
$4,919
$6,057
$11,345
$9,344
$5,160
$6,915
$7,106
$2,918
$4,225
$7,437
$8,353
$4,910
$6,636
$4,933
$3,008
$5,159
$6,135
$10,735
$7,313
$7,036
$4,381
$4,788
$2,004
$5,301
$9,910
$7,303
$8,718
$5,923
$7,350
$6,595
$3,582
$5,744
$3,252
$5,474
$7,330
$4,034
$7,935
$4,889
$5,676
$8,030
$5,446
$5,758
$7,013
$6,480
$2,771
$6,003
$4,764
$6,519
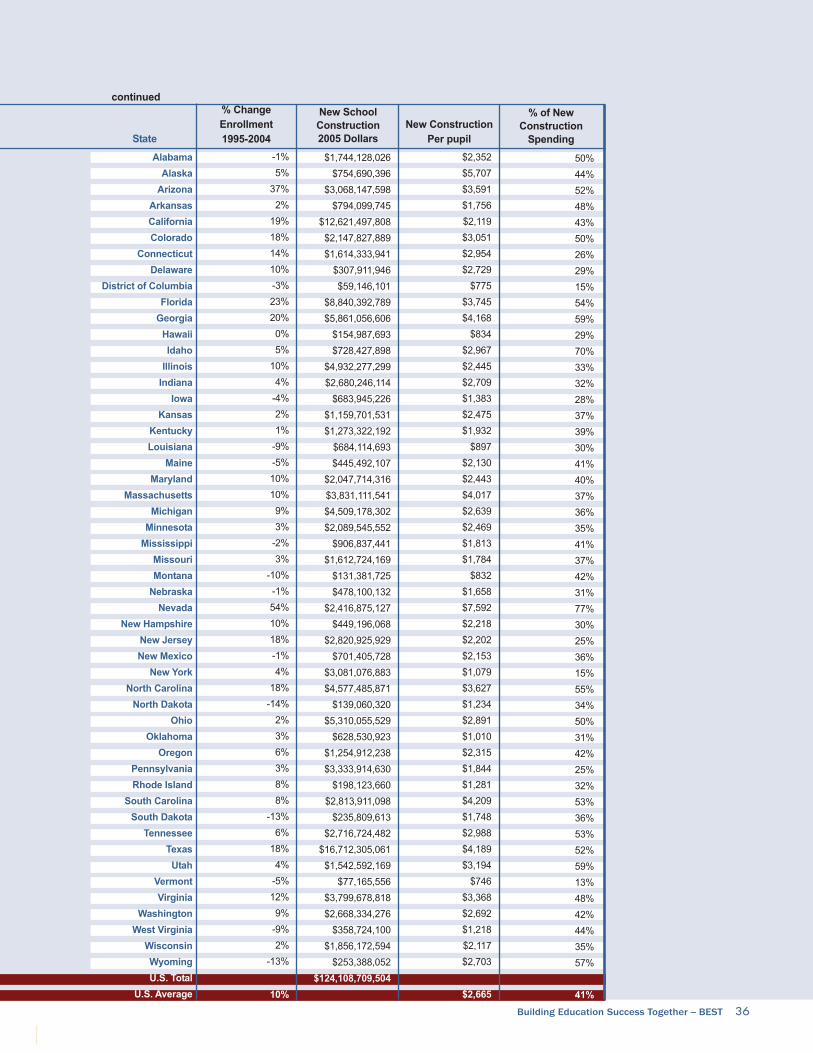
Building Education Success Together -- BEST 36
% Change
Enrollment
1995-2004
New School
Construction
2005 Dollars
New Construction
Per pupil
% of New
Construction
Spending
continued
State
Alabama
Alaska
Arizona
Arkansas
California
Colorado
Connecticut
Delaware
District of Columbia
Florida
Georgia
Hawaii
Idaho
Illinois
Indiana
Iowa
Kansas
Kentucky
Louisiana
Maine
Maryland
Massachusetts
Michigan
Minnesota
Mississippi
Missouri
Montana
Nebraska
Nevada
New Hampshire
New Jersey
New Mexico
New York
North Carolina
North Dakota
Ohio
Oklahoma
Oregon
Pennsylvania
Rhode Island
South Carolina
South Dakota
Tennessee
Texas
Utah
Vermont
Virginia
Washington
West Virginia
Wisconsin
Wyoming
U.S. Total
U.S. Average
$1,744,128,026
$754,690,396
$3,068,147,598
$794,099,745
$12,621,497,808
$2,147,827,889
$1,614,333,941
$307,911,946
$59,146,101
$8,840,392,789
$5,861,056,606
$154,987,693
$728,427,898
$4,932,277,299
$2,680,246,114
$683,945,226
$1,159,701,531
$1,273,322,192
$684,114,693
$445,492,107
$2,047,714,316
$3,831,111,541
$4,509,178,302
$2,089,545,552
$906,837,441
$1,612,724,169
$131,381,725
$478,100,132
$2,416,875,127
$449,196,068
$2,820,925,929
$701,405,728
$3,081,076,883
$4,577,485,871
$139,060,320
$5,310,055,529
$628,530,923
$1,254,912,238
$3,333,914,630
$198,123,660
$2,813,911,098
$235,809,613
$2,716,724,482
$16,712,305,061
$1,542,592,169
$77,165,556
$3,799,678,818
$2,668,334,276
$358,724,100
$1,856,172,594
$253,388,052
$124,108,709,504
-1%
5%
37%
2%
19%
18%
14%
10%
-3%
23%
20%
0%
5%
10%
4%
-4%
2%
1%
-9%
-5%
10%
10%
9%
3%
-2%
3%
-10%
-1%
54%
10%
18%
-1%
4%
18%
-14%
2%
3%
6%
3%
8%
8%
-13%
6%
18%
4%
-5%
12%
9%
-9%
2%
-13%
10%
50%
44%
52%
48%
43%
50%
26%
29%
15%
54%
59%
29%
70%
33%
32%
28%
37%
39%
30%
41%
40%
37%
36%
35%
41%
37%
42%
31%
77%
30%
25%
36%
15%
55%
34%
50%
31%
42%
25%
32%
53%
36%
53%
52%
59%
13%
48%
42%
44%
35%
57%
41%
$2,352
$5,707
$3,591
$1,756
$2,119
$3,051
$2,954
$2,729
$775
$3,745
$4,168
$834
$2,967
$2,445
$2,709
$1,383
$2,475
$1,932
$897
$2,130
$2,443
$4,017
$2,639
$2,469
$1,813
$1,784
$832
$1,658
$7,592
$2,218
$2,202
$2,153
$1,079
$3,627
$1,234
$2,891
$1,010
$2,315
$1,844
$1,281
$4,209
$1,748
$2,988
$4,189
$3,194
$746
$3,368
$2,692
$1,218
$2,117
$2,703
$2,665

ABOUT THE AUTHORSMary W. Filardo is executive director of the 21st Century School Fund in Washington, DC,which manages the Building Educational Success Together partnership.
Jeffrey M. Vincent, PhD is deputy director of the Center for Cities and Schools at theUniversity of California, Berkeley, in the Institute for Urban Regional Development.
Ping Sung is research associate and policy analyst at the 21st Century School Fund.
Travis Stein is research associate and policy analyst at the Neighborhood Capital BudgetGroup in Chicago, Illinois.
ACKNOWLEDGEMENTSThe authors and the Building Educational Success Together (BEST) partnership thank theFord Foundation for their support of our research, policy advocacy and innovative projects.In particular, we thank Janice Petrovich, director of Education, Sexuality and Religion at theFord Foundation, whose commitment to equity and excellence has sustained this and otherwork over many years.
We also want to thank McGraw-Hill Construction, without whose dedication to informationabout construction and their reliable assistance in working with the data, this report wouldnot have been possible. The staff at the National Center for Education Statistics was alsoresponsive and helpful as we worked to align education data with McGraw-Hill Constructiondata.
Finally, to all of the BEST partners and the many people who provided us with comments,insight and feedback, we are greatly appreciative. And we acknowledge the contributions ofour editing, publishing and design team of Joetta Sack-Min, Robert Johnston, andVanessa Solis. Of course, all errors and omissions remain the responsibility of the authors.
Building Educational Success Together is a community of practice dedicated to sharing anddeveloping knowledge to improve urban public school facilities and the communities theyserve. The BEST partners are: 21st Century School Fund, Washington, DC; Center forCities and Schools, University of California, Berkeley; Education Law Center, Newark,New Jersey; KnowledgeWorks Foundation, Cincinnati, Ohio; National Clearinghouse forEducational Facilities, Washington, DC; National Trust for Historic Preservation,Washington, DC; Neighborhood Capital Budget Group, Chicago, Illinois; New Visions forPublic Schools, New York, New York.

Related Documents