A DECADE OF CHANGE IN LEARNER A DECADE OF CHANGE IN LEARNER RACIAL DESEGREGATION: RACIAL DESEGREGATION: TSHWANE, 2000 - 2010 TSHWANE, 2000 - 2010 André Carl Horn Paper presented at the Conference on Emerging Urban Transformations Emerging Urban Transformations IGU Commission Meeting Canterbury Christ Church University 14 – 20 August 2011 14 – 20 August 2011

A DECADE OF CHANGE IN LEARNER RACIAL DESEGREGATION: TSHWANE, 2000 - 2010 André Carl Horn Paper presented at the Conference on Emerging Urban Transformations.
Dec 21, 2015
Welcome message from author
This document is posted to help you gain knowledge. Please leave a comment to let me know what you think about it! Share it to your friends and learn new things together.
Transcript

A DECADE OF CHANGE IN LEARNER A DECADE OF CHANGE IN LEARNER RACIAL DESEGREGATION:RACIAL DESEGREGATION:
TSHWANE, 2000 - 2010TSHWANE, 2000 - 2010
A DECADE OF CHANGE IN LEARNER A DECADE OF CHANGE IN LEARNER RACIAL DESEGREGATION:RACIAL DESEGREGATION:
TSHWANE, 2000 - 2010TSHWANE, 2000 - 2010
André Carl Horn
Paper presented at the Conference on
Emerging Urban TransformationsEmerging Urban Transformations
IGU Commission MeetingCanterbury Christ Church University
14 – 20 August 201114 – 20 August 2011

THEORYTHEORYTHEORYTHEORY
Segregation TheoryRenewed social and cultural intolerance, increased
discrimination and social and economic exclusion
School IntegrationSeen as an important mechanism towards social
integration and economic inclusion in society
ObservationSegregation levels in the USA and other countries
are again increasing

BACKGROUNDBACKGROUNDBACKGROUNDBACKGROUND
South Africa poses a unique opportunity to study racial desegregation in schools because:
(1) It had a complete legal history of racial classification and school desegregation up to 1990
(2) It started with official school desegregation in 1990
(3) It continues with official racial classification to this day
(4) It broke the clear link between residence and school intake

APARTHEID SCHOOLSAPARTHEID SCHOOLSAPARTHEID SCHOOLSAPARTHEID SCHOOLS
Public schools (PU) and Independent schools (IS)
PU schools for the four racial groups:- Africans- Coloureds- Indians- Whites- + Homeland schools
IS schools- Linked to one of the above departments

NEW DISPENSATIONNEW DISPENSATIONNEW DISPENSATIONNEW DISPENSATION
All PU schools are either managed by the state or are
IS schools registered to the state
The order of registration in a year is:
(1) Existing learners
(2) New learners with brothers or sisters in the school
(3) New learners in the school area (residence or working address of parent)
(4) New applicants from outside the school area

AIM AND PRESENTATIONAIM AND PRESENTATIONAIM AND PRESENTATIONAIM AND PRESENTATION
Annually the provincial departments conduct a school census and these
figures have been collected: -
The aim of this presentation is to monitor and interpret the figures from
2000 to 2010 for the City of Tshwane as per school category
The presentation focuses on:
• Learners and schools
• Dissimilarity and multi-ethnic dissimilarity
• Exposure and isolation
• Racial distribution per school category
• Trajectory of change

CRITERIACRITERIACRITERIACRITERIA
Each learner Gr 1 to Gr 12 in 538 schools in Tshwane has been
considered.
Each learner (99.7%) has a recorded racial identity.
Each school is either affiliated to an ‘old’ education Department or is
recorded as PU New or IS New, but still has a racial majority (although it
may have changed)
The following percentages for ‘others’ are crucial:• 0 – 10 (segregation)• 10 – 25 (slow desegregation)• 25 – 50 (rapid desegregation)• 50 – 75 (succession)• 75 – 90 (re-segregation)• 90 – 100 (complete re-segregation)

City of City of TshwaneTshwane
Population 1,99 million (72% black African)
Schools: 585
City of City of TshwaneTshwane
Population 1,99 million (72% black African)
Schools: 585

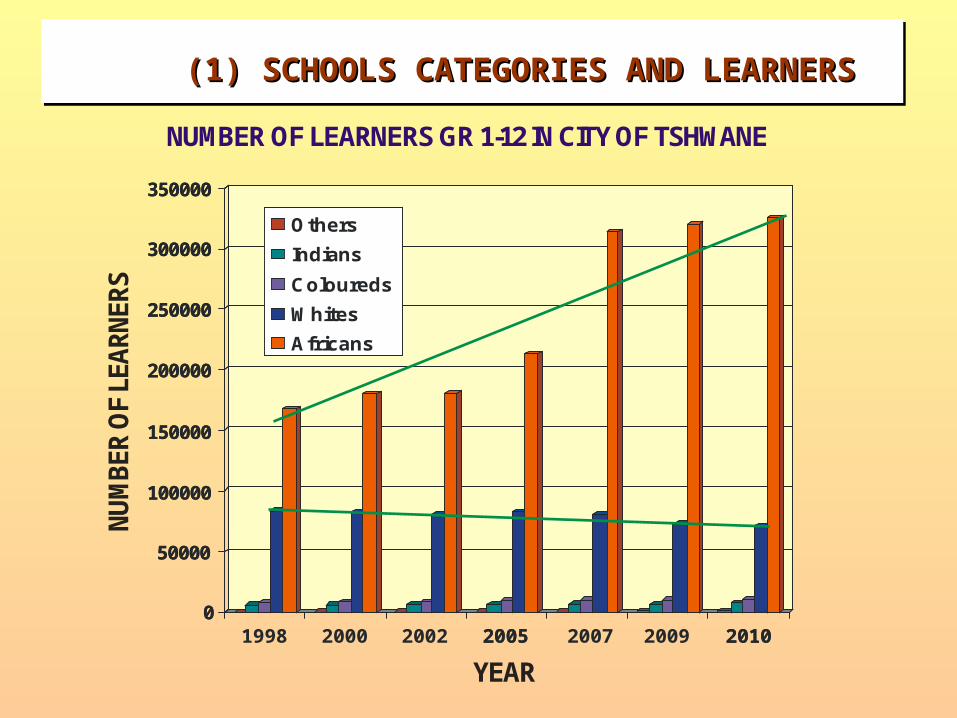
(1) SCHOOLS CATEGORIES AND LEARNERS(1) SCHOOLS CATEGORIES AND LEARNERS(1) SCHOOLS CATEGORIES AND LEARNERS(1) SCHOOLS CATEGORIES AND LEARNERS
SCHOOLS PER SCHOOL CATEGORIES IN TSHWANE (1998 – 2010) Year
School cats 98 00 02 05 07 09 10 % Inc
98-10 PU ex DET (Afr) 173 175 175 170 167 162 162 -6.4%PU ex HOD (Indian) 8 8 8 8 8 8 8 0.0%PU ex HOR (Col) 6 6 6 6 6 6 6 0.0%
PU New 2 11 13 21 138 153 157 7750%
PU ex HOA (White) 124 124 124 124 124 124 124 0.0%
Tot PU Sector 313 324 326 329 443 453 457 46%IS 41 55 64 74 88 89 95 131.7%Total Schools 354 379 390 403 531 542 552 55.9%
(1) SCHOOLS CATEGORIES AND LEARNERS(1) SCHOOLS CATEGORIES AND LEARNERS(1) SCHOOLS CATEGORIES AND LEARNERS(1) SCHOOLS CATEGORIES AND LEARNERS
0
50000
100000
150000
200000
250000
300000
350000
1998 2000 2002 2005 2007 2009 2010
Others
Indians
Coloureds
Whites
Africans
0
50000
100000
150000
200000
250000
300000
350000
2005 2010
Others
Indians
Coloureds
Whites
Africans
YEAR
NU
MB
ER O
F LE
AR
NER
SNUMBER OF LEARNERS GR 1-12 IN CITY OF TSHWANE

(2) DISSIMILARITY (D) AND MULTI-(2) DISSIMILARITY (D) AND MULTI-ETHNIC DISSIMILARITY (D(m))ETHNIC DISSIMILARITY (D(m))(2) DISSIMILARITY (D) AND MULTI-(2) DISSIMILARITY (D) AND MULTI-ETHNIC DISSIMILARITY (D(m))ETHNIC DISSIMILARITY (D(m))
DISSIMILARITY INDEX (GROUP X OTHERS) (D) AND MULTI-ETHNIC DISSIMILARITY INDEX (D(M)) IN ALL SCHOOLS IN TSHWANE
2000 2010 Africans 86.9 86.8 Coloureds 77.4 73.9 Indians 86.3 85.2 Whites 90.0 91.5 Others 85.9 89.0 Total (D(m)) 87.5
2005 85.3 73.1 84.1 88.5 85.4 89.9 87.7

(3) EXPOSURE OF RACE GROUPS TO ‘OTHERS’(3) EXPOSURE OF RACE GROUPS TO ‘OTHERS’(3) EXPOSURE OF RACE GROUPS TO ‘OTHERS’(3) EXPOSURE OF RACE GROUPS TO ‘OTHERS’
EXPOSURE TO ‘OTHER RACES’ IN ALL SCHOOLS IN TSHWANE
2000 2005 2010 Africans 7.5 7.7 5.3 Coloureds 56.3 62.3 66.8 Indians 55.9 55.0 53.9 Whites 13.1 15.8 16.4

(3) DISTRIBUTION OF RACE GROUPS (3) DISTRIBUTION OF RACE GROUPS (3) DISTRIBUTION OF RACE GROUPS (3) DISTRIBUTION OF RACE GROUPS
DISTRIBUTION OF RACE GROUPS AS PER ETHNIC CATEGORY IN SCHOOLS IN TSHWANE
0 – 10% 10 – 25% 25 – 50% 50 – 75% 75-90% 90 – 100 % Africans 1 2 3 4 5 6 2000 0.6 2.0 3.8 5.9 3.2 84.52005 0.6 2.0 3.7 5.5 5.2 83.12010 0.3 0.8 2.5 3.7 5.2 87.4Coloureds 1 2 3 4 5 6 2000 26.4 10.1 22.0 12.7 28.9 -2005 33.6 9.7 14.4 13.3 29.1 -2010 36.1 17.8 15.2 14.6 16.3 -Indians 1 2 3 4 5 6 2000 20.0 9.3 42.0 0.0 0.0 28.72005 18.6 30.2 12.2 4.5 12.1 22.42010 26.2 20.3 5.5 12.2 12.6 23.2Whites 1 2 3 4 5 6 2000 0.6 0.7 4.1 17.2 13.8 63.72005 0.5 1.7 6.9 15.5 14.0 61.52010 1.1 2.3 9.6 10.8 11.4 64.8

(3) ISOLATION AND EXPOSURE (3) ISOLATION AND EXPOSURE (3) ISOLATION AND EXPOSURE (3) ISOLATION AND EXPOSURE
ISOLATION AND EXPOSURE OF RACE GROUPS IN SCHOOLS IN TSHWANE
2010 [2005] (2000) Africans Coloureds Indians White s
Isolation (<10% ; >90%) 87.7 [83.7]
(85.1)
36.1 [33.6]
(26.4)
49.4 [41.0]
(48.7)
65.9 [62.0]
(64.3)
Marginal Exposure (10 - <25% ; >75 – 100%)
6.0 [7.2]
(5.2)
34.1 [38.8]
(39.1)
32.9 [42.3]
(9.3)
13.7 [15.7]
(14.5)
Proper Exposure (>25% ; <75%)
6.2 [9.2]
(9.7)
29.8 [27.7]
(34.7)
17.7 [16.7]
(42.0)
20.4 [22.4]
(21.3)

(4) RACIAL DISTRIBUTION PER SCHOOL (4) RACIAL DISTRIBUTION PER SCHOOL CATEGORIES CATEGORIES
(4) RACIAL DISTRIBUTION PER SCHOOL (4) RACIAL DISTRIBUTION PER SCHOOL CATEGORIES CATEGORIES
RACIAL DISTRIBUTION PER SCHOOL CATEGORIES 2000/2005/2010 Africans Coloureds Indians Whites
DET (Africans)
72.9 63.8
38.0
1.7 0.8
0.6
0.0 0.0
0.1
0.0 0.0
0.0
HOR (Coloureds)
1.4 1.2
0.9
56.2 46.4
37.9
0.4 0.2
0.3
0.0 0.0
0.0
HOD 2.9 1.8 39.4 0.0
(Indians) 2.4 1.8
1.9 1.3
25.4 25.8
0.0 0.0
HOA (Whites)
11.0 14.6
13.3
34.3 41.8
43.2
20.5 28.1
27.8
92.8 87.7
87.3
PU-New 5.6
10.0 39.3
1.8 2.8
10.3
7.1 6.1
8.4
0.8 1.5
1.5
IS 6.5
7.8 6.7
4.1 6.4
6.6
32.6 40.0
37.6
6.3 10.8
11.2

(5) TRAJECTORY OF RACIAL CHANGE IN (5) TRAJECTORY OF RACIAL CHANGE IN SCHOOLS SCHOOLS
(5) TRAJECTORY OF RACIAL CHANGE IN (5) TRAJECTORY OF RACIAL CHANGE IN SCHOOLS SCHOOLS
3500
3000
2500
2000
1500
1000
500
00 10 50
% OTHERS
RA
NK
(bas
ed o
n Im
pact
)
507510025
DERACIALISATION ACHIEVED: RANKING SCHOOL CATEGORIES (2010)
PU HOA (whites)

CONCLUSIONCONCLUSIONCONCLUSIONCONCLUSION
Moreover:(1) The number of learners increased with just over 56%. The Africans
increased with almost 94%. Whites have decreased by almost 18%. Coloureds increased by 31% and Indians by almost 24%.
(2) The increased number of Africans implied that only 38.0% (2010) from 72.9% are still in formerly African schools. 39.3% are in PU New schools with 13.3% in previous White schools (from 11.0% in 2000).
(3) Indians were already a minority in formerly Indian schools (39.4% in 1998) and 25.8% in 2010. There are more Indians in formerly Whites schools (27.8% in 2010) and 37.6% in Independent schools.
(4) Coloureds have been replaced as a majority in formerly Coloured schools (from 56.2% in 2000 to 37.9% in 2010). A large contingent are now in White schools (43.2 in 2010)

CONCLUSIONCONCLUSIONCONCLUSIONCONCLUSION
In the course of a decade:
(4) Africans are extreme isolated, followed by Whites and then by Coloureds and Indians.
(5) Whites are being way ahead in terms of desegregation
Related Documents