A Data Streaming Algorithm Estimating Subpopulation Flow Size Distribution Abhishek Kumar Minho Sung Jun (Jim) Xu Ellen W. Zegura Networking and Telecommunications Group College of Computing Georgia Institute of Technology {akumar,mhsung,jx,ewz}@cc.gatech.edu

Welcome message from author
This document is posted to help you gain knowledge. Please leave a comment to let me know what you think about it! Share it to your friends and learn new things together.
Transcript
A Data Streaming Algorithm Estimating Subpopulation FlowSize Distribution
Abhishek KumarMinho SungJun (Jim) Xu
Ellen W. ZeguraNetworking and Telecommunications Group
College of ComputingGeorgia Institute of Technology
{akumar,mhsung,jx,ewz}@cc.gatech.edu
1
Problem Statement
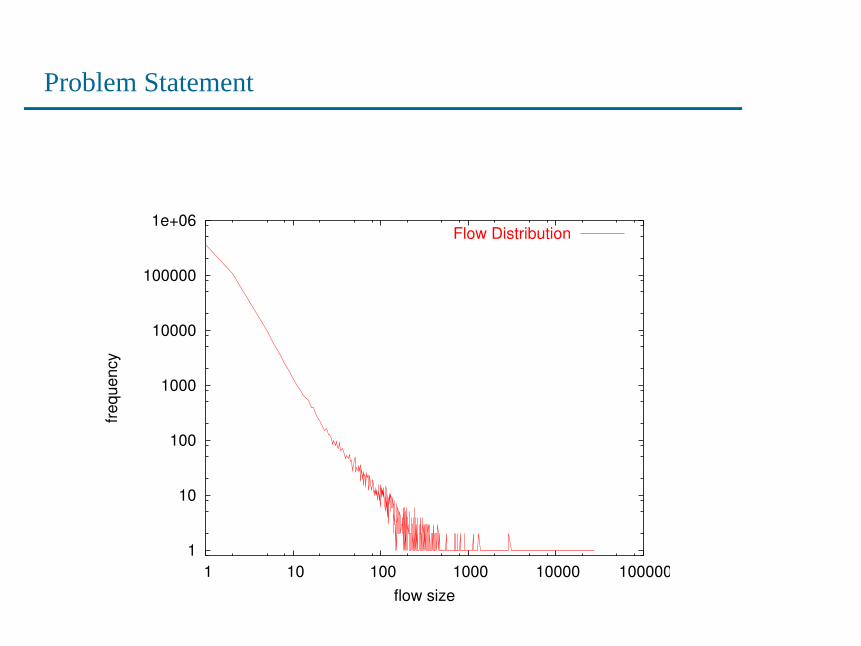
Problem: To estimate the empirical distribution of flow sizes inthe network traffic, for arbitrary subpopulations specified after theact of data collection.
2
Problem Statement
1
10
100
1000
10000
100000
1e+06
1 10 100 1000 10000 100000
frequ
ency
flow size
Flow Distribution
3
Problem Statement
Problem: To estimate the empirical distribution of flow sizes inthe network traffic, for arbitrary subpopulations specified after theact of data collection.
Definition of Flow: All packets with the same flow-label.The flow-label can be defined as any combination of fields fromthe IP header, e.g <Source IP, source Port, Dest. IP, Dest. Port,Protocol>.
Subpopulation: The subpopulation of interest can be specifiedthrough a set of flow classification rules, or asubpopulation filter.
4
Overview
Motivation
Related work: Estimation from sampled data
Solution Architecture
Data Collection
Preprocessing
A joint estimation algorithm
5
Motivation
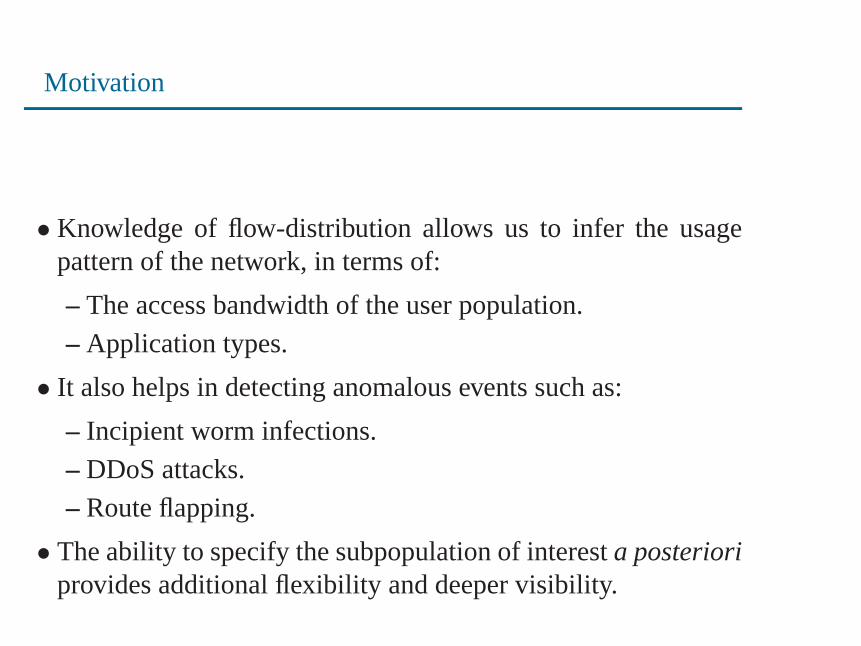
• Knowledge of flow-distribution allows us to infer the usagepattern of the network, in terms of:
– The access bandwidth of the user population.
– Application types.
• It also helps in detecting anomalous events such as:
– Incipient worm infections.
– DDoS attacks.
– Route flapping.
• The ability to specify the subpopulation of interesta posterioriprovides additional flexibility and deeper visibility.
6
Related work: Inverting sampled packet traces.
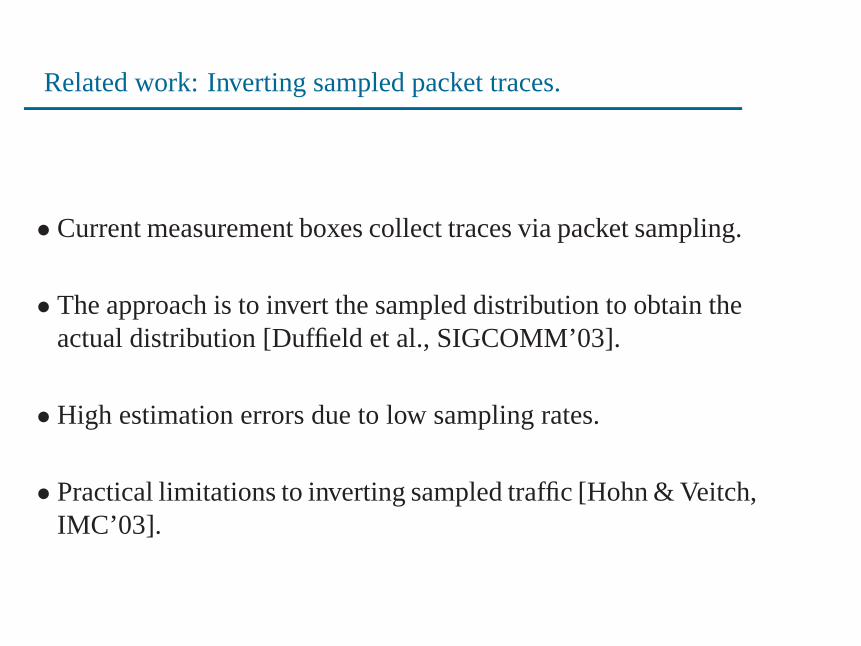
• Current measurement boxes collect traces via packet sampling.
• The approach is to invert the sampled distribution to obtain theactual distribution [Duffield et al., SIGCOMM’03].
• High estimation errors due to low sampling rates.
• Practical limitations to inverting sampled traffic [Hohn & Veitch,IMC’03].
7
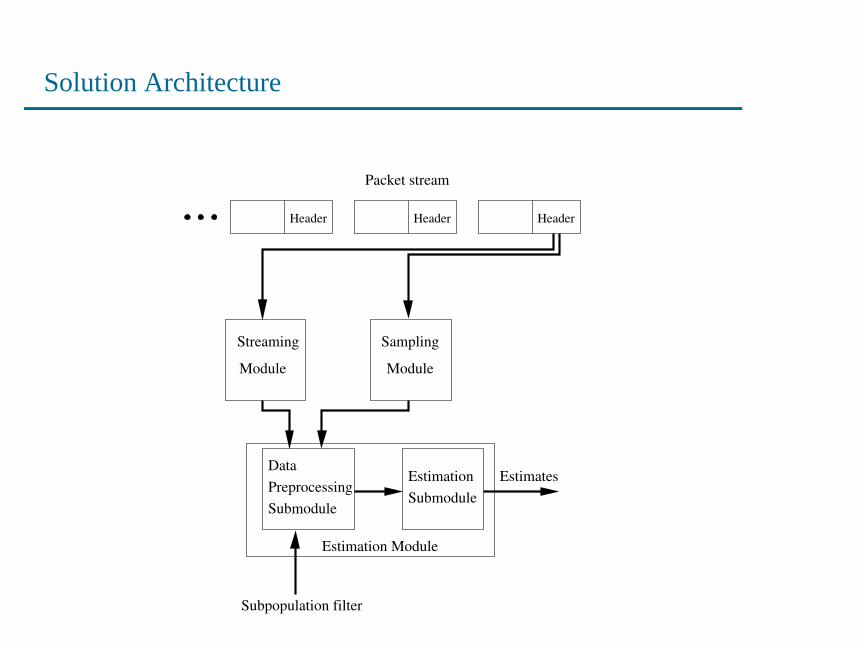
Solution Architecture
Packet stream
Sampling
Module
Streaming
Module
DataPreprocessingSubmodule
Estimation Module
Subpopulation filter
EstimatesSubmoduleEstimation
Header Header Header
8
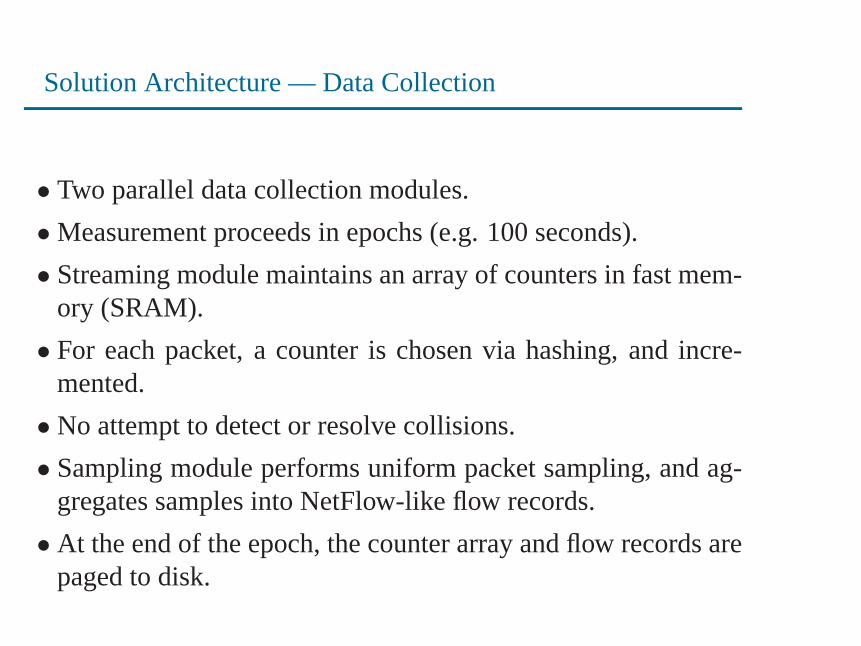
Solution Architecture — Data Collection
• Two parallel data collection modules.
• Measurement proceeds in epochs (e.g. 100 seconds).
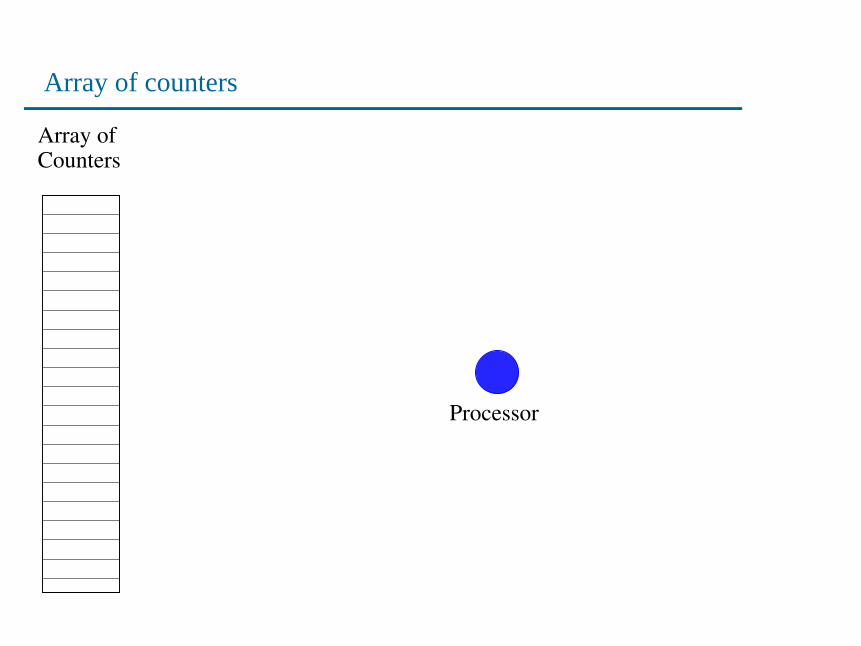
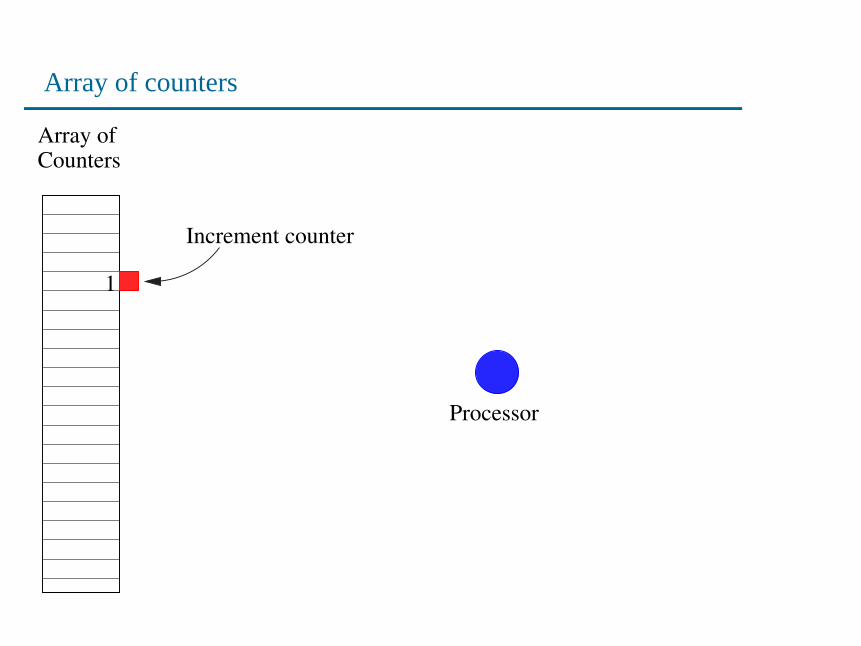
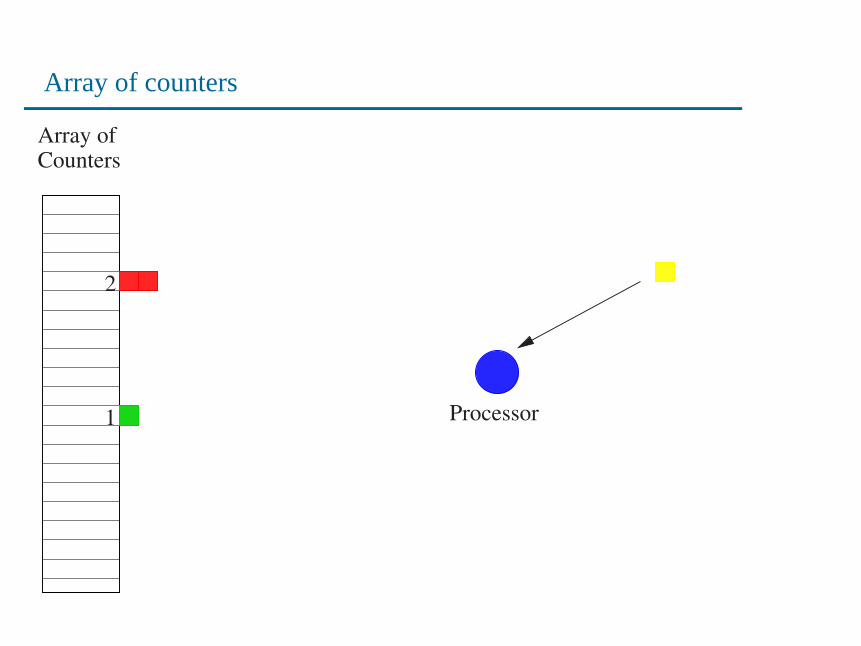
• Streaming module maintains an array of counters in fast mem-ory (SRAM).
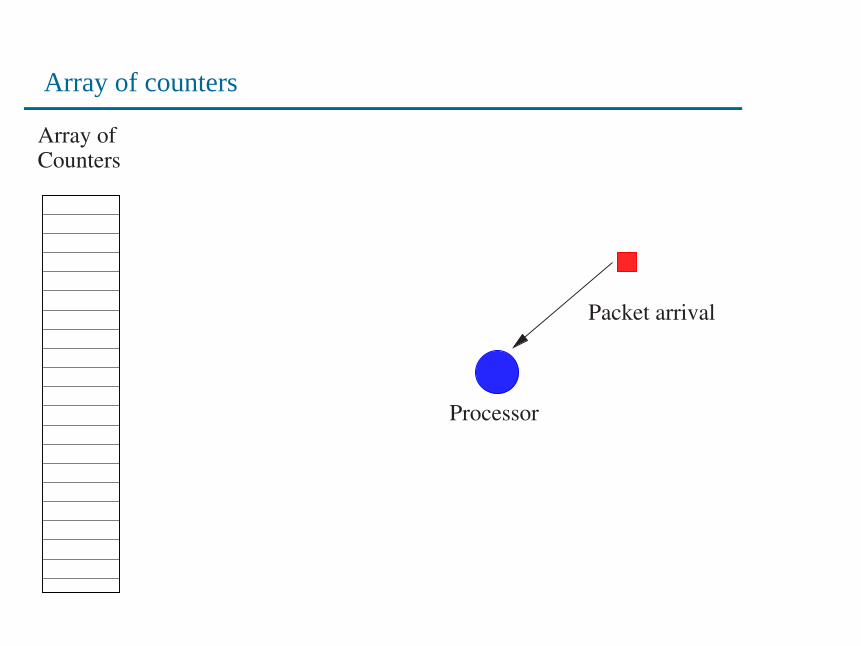
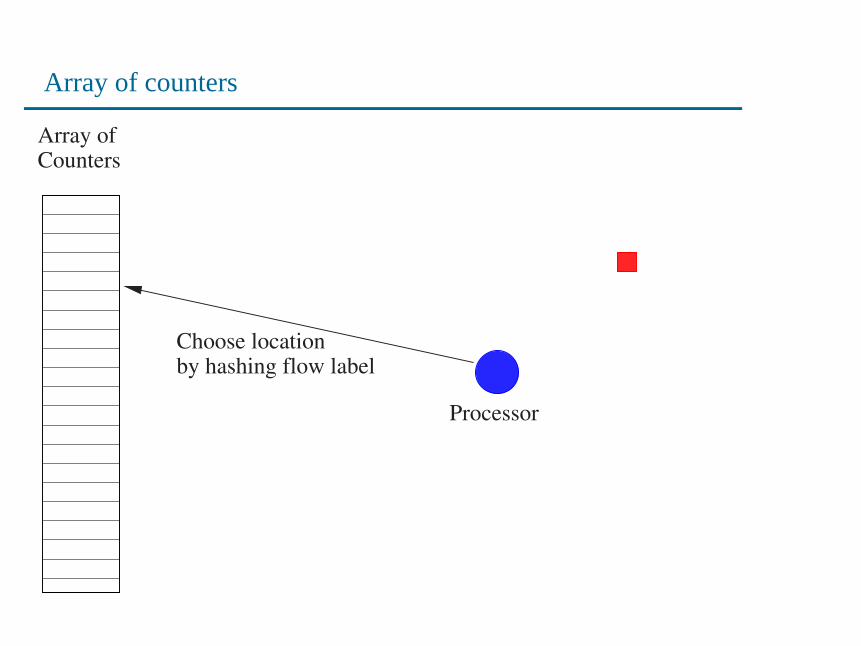
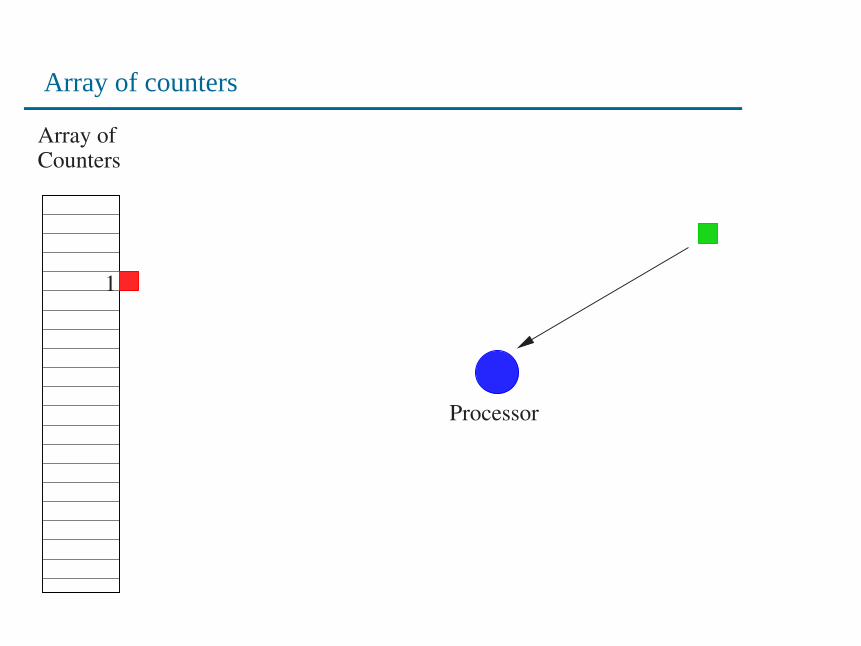
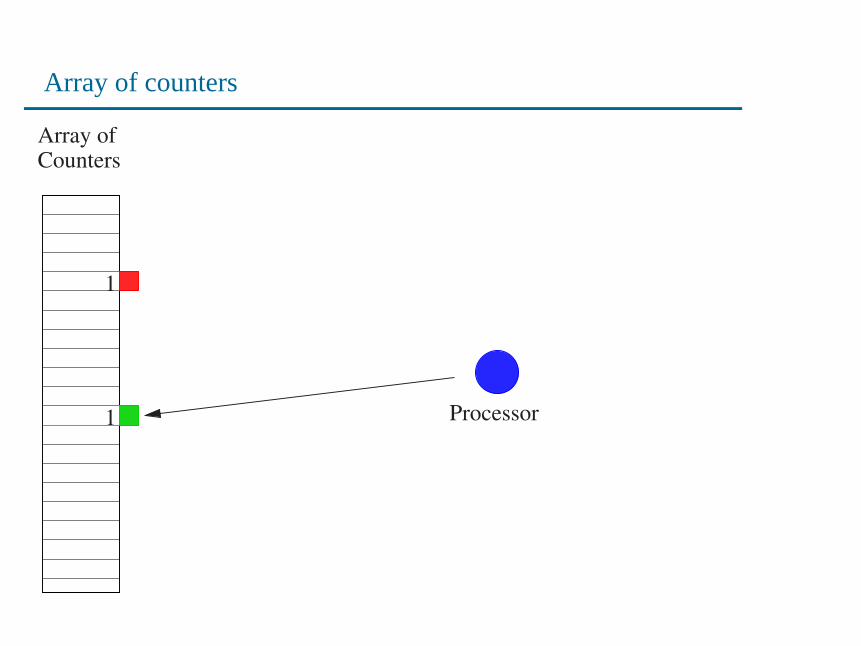
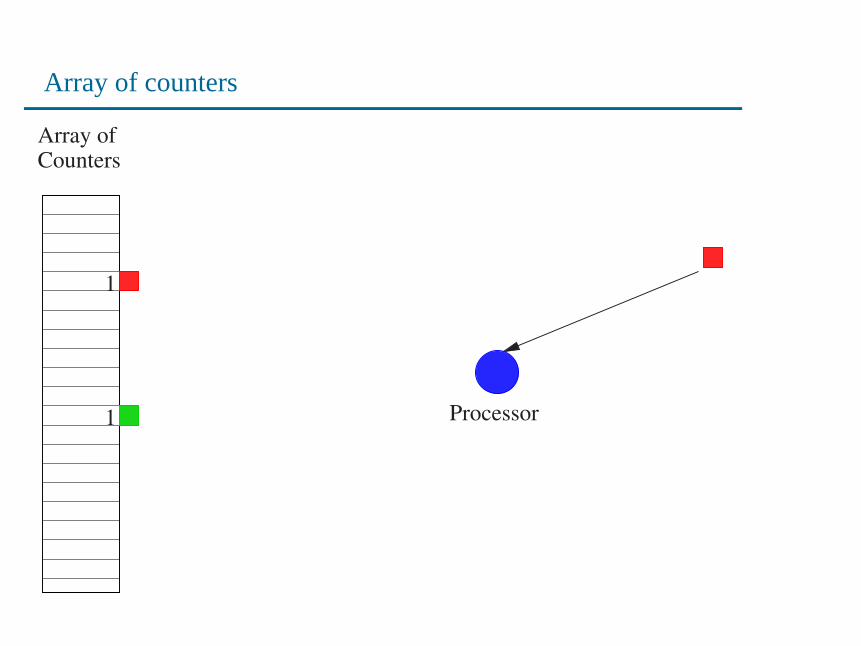
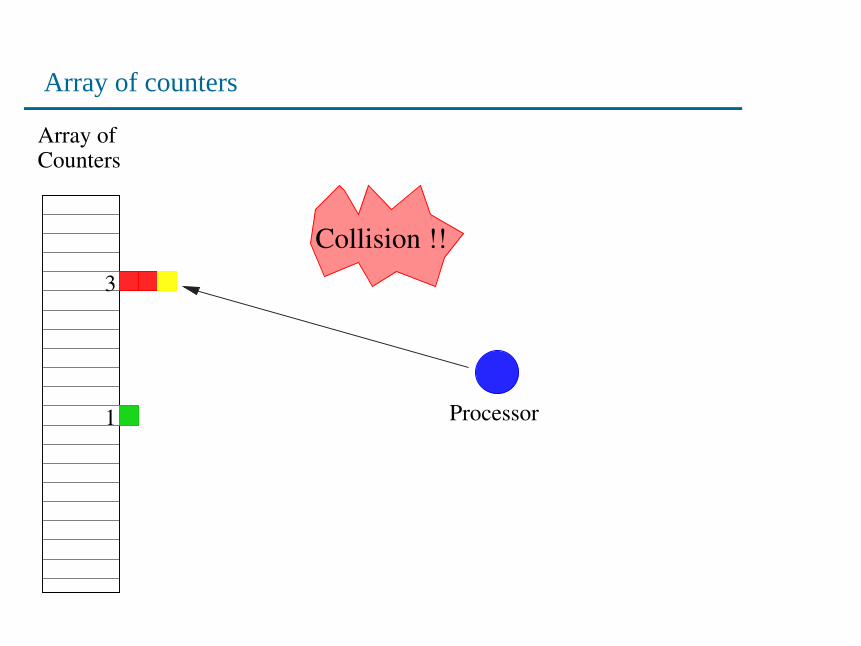
• For each packet, a counter is chosen via hashing, and incre-mented.
• No attempt to detect or resolve collisions.
• Sampling module performs uniform packet sampling, and ag-gregates samples into NetFlow-like flow records.
• At the end of the epoch, the counter array and flow records arepaged to disk.
9
Array of counters
Array of Counters
Processor
10
Array of counters
Array of Counters
Processor
Packet arrival
11
Array of counters
Array of Counters
Processor
Choose location by hashing flow label
12
Array of counters
Array of Counters
Processor
1
Increment counter
13
Array of counters
Array of Counters
Processor
1
14
Array of counters
Array of Counters
Processor
1
1
15
Array of counters
Array of Counters
Processor
1
1
16

Array of counters
Array of Counters
Processor1
2
17
Array of counters
Array of Counters
Processor1
2
18
Array of counters
Array of Counters
Processor1
Collision !!3
19
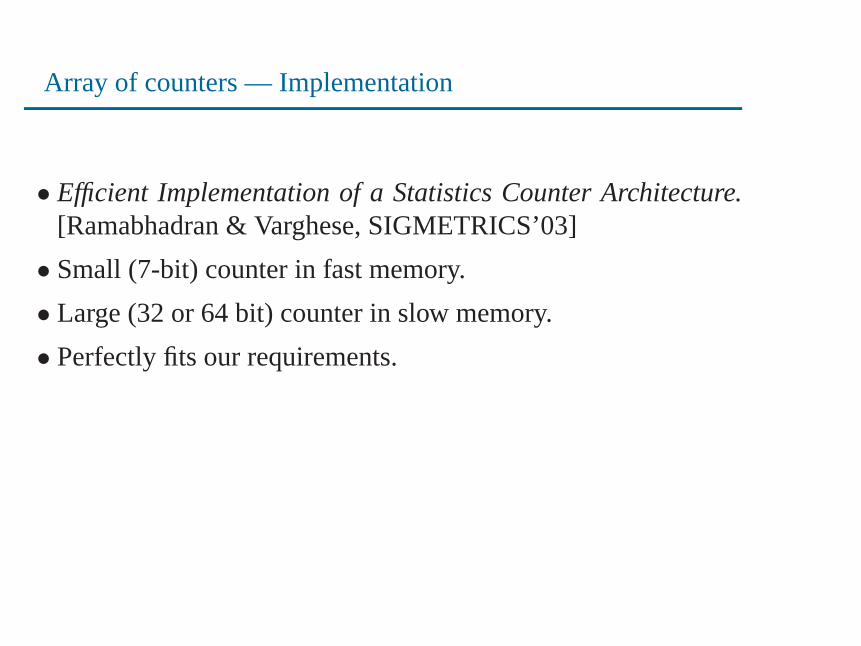
Array of counters — Implementation
• Efficient Implementation of a Statistics Counter Architecture.[Ramabhadran & Varghese, SIGMETRICS’03]
• Small (7-bit) counter in fast memory.
• Large (32 or 64 bit) counter in slow memory.
• Perfectly fits our requirements.
20
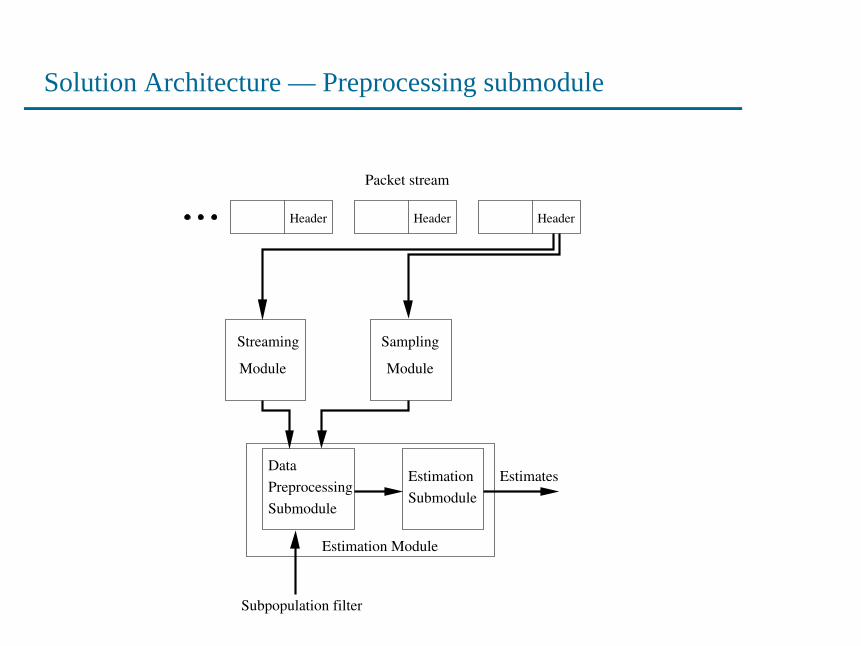
Solution Architecture — Preprocessing submodule
Packet stream
Sampling
Module
Streaming
Module
DataPreprocessingSubmodule
Estimation Module
Subpopulation filter
EstimatesSubmoduleEstimation
Header Header Header
21

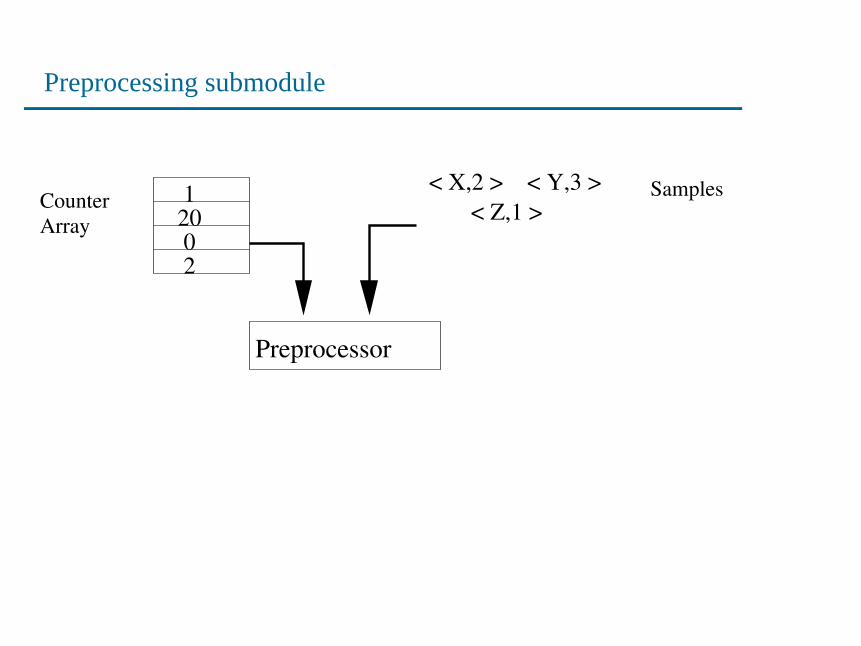
Solution Architecture — Preprocessing submodule
< Z,1 >< X,2 > < Y,3 >
Counter Array
Samples200
1
2
22
Preprocessing submodule
< Z,1 >< X,2 > < Y,3 >
Counter Array
Samples
Preprocessor
200
1
2
23
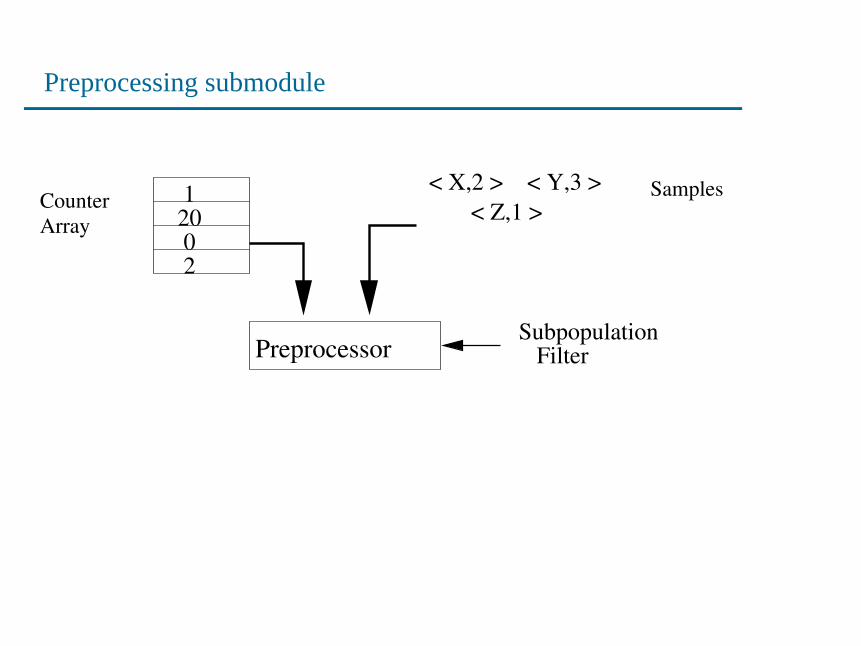
Preprocessing submodule
< Z,1 >< X,2 > < Y,3 >
Counter Array
Samples
Preprocessor
200
1
2
SubpopulationFilter
24

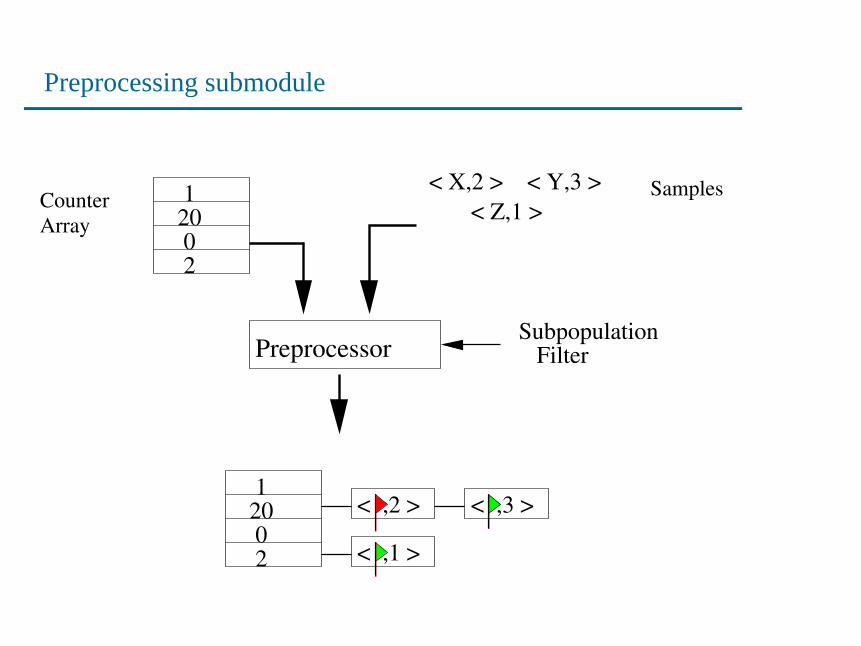
Preprocessing submodule
200
1
2
200
1
2
< Z,1 >< X,2 > < Y,3 >
Counter Array
Samples
PreprocessorSubpopulation
Filter
< X,2 > < Y,3 >
< Z,1 >
25
Preprocessing submodule
200
1
2
200
1
2
< Z,1 >< X,2 > < Y,3 >
Counter Array
Samples
PreprocessorSubpopulation
Filter
< ,2 > < ,3 >
< ,1 >
26
Preprocessing submodule
• Separate losses in collected data due to collisionsandsampling
• Need to compute the MLE of flow size distributions that wouldcause the observations after these losses
• Joint estimation over the combined data, using the EM algo-rithm
27
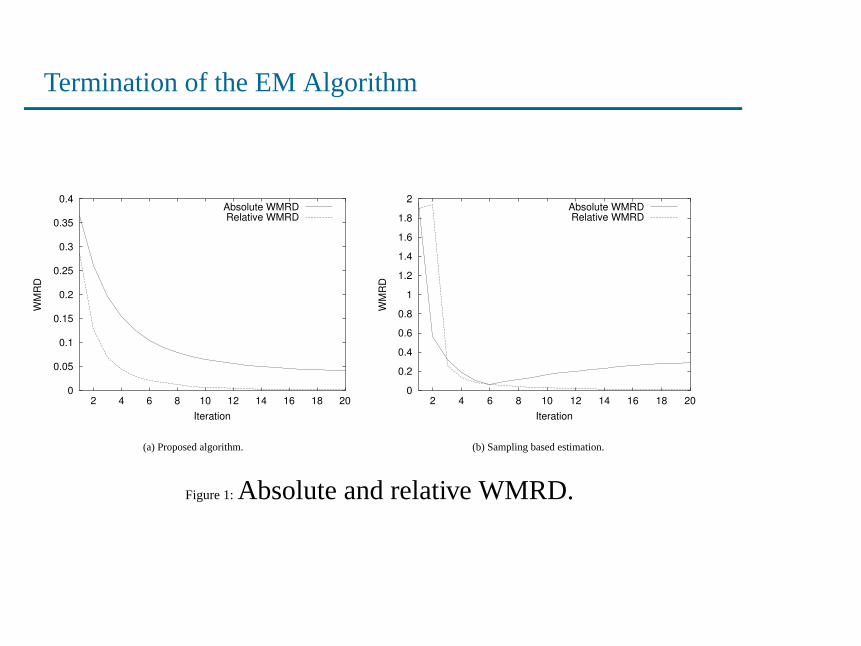
Termination of the EM Algorithm
0
0.05
0.1
0.15
0.2
0.25
0.3
0.35
0.4
2 4 6 8 10 12 14 16 18 20
WM
RD
Iteration
Absolute WMRDRelative WMRD
(a) Proposed algorithm.
0
0.2
0.4
0.6
0.8
1
1.2
1.4
1.6
1.8
2
2 4 6 8 10 12 14 16 18 20
WM
RD
Iteration
Absolute WMRDRelative WMRD
(b) Sampling based estimation.
Figure 1:Absolute and relative WMRD.
28
Trace driven Evaluation
0.001
0.01
0.1
1
10
100
1000
10000
100000
1 10 100 1000 10000
frequ
ency
flow size
Actual distributionSampling based estimate
Proposed algorithm
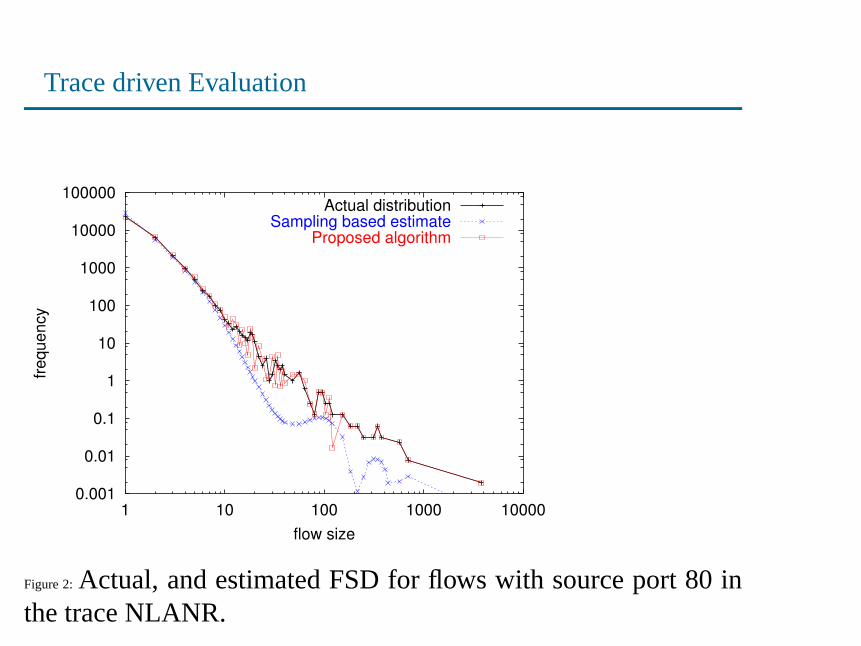
Figure 2:Actual, and estimated FSD for flows with source port 80 inthe trace NLANR.
29
Evaluation
0.001
0.01
0.1
1
10
100
1000
10000
100000
1 10 100 1000 10000 100000
frequ
ency
flow size
Actual distributionSampling based estimate
Proposed algorithm
(a) Estimate of FSD ofall DNS flows.
0.001
0.01
0.1
1
10
100
1000
10000
100000
1e+06
1 10 100 1000 10000 100000
frequ
ency
flow size
Actual distributionSampling based estimate
Proposed algorithm
(b) Estimate of FSD ofall HTTP flows.
0.001
0.01
0.1
1
10
100
1000
10000
100000
1 10 100 1000 10000
frequ
ency
flow size
Actual distributionSampling based estimate
Proposed algorithm
(c) Estimate of FSD ofall HTTPS flows.
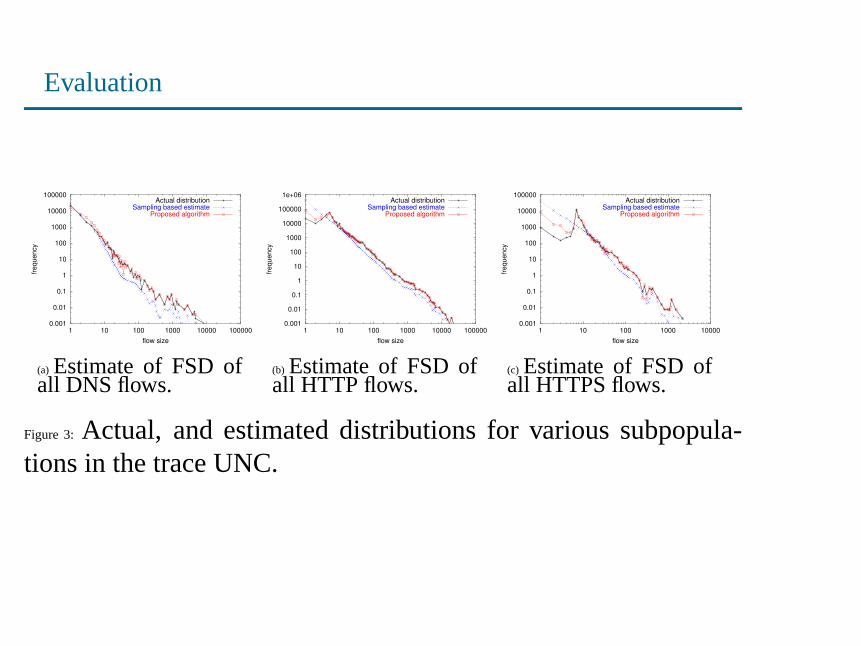
Figure 3: Actual, and estimated distributions for various subpopula-tions in the trace UNC.
30

Evaluation
0.001
0.01
0.1
1
10
100
1000
10000
100000
1e+06
1 10 100 1000 10000 100000
frequ
ency
flow size
Actual distributionSampling based estimate
Proposed algorithm
(a) Estimate of FSD ofall DNS flows.
0.001
0.01
0.1
1
10
100
1000
10000
100000
1e+06
1 10 100 1000 10000 100000
frequ
ency
flow size
Actual distributionSampling based estimate
Proposed algorithm
(b) Estimate of FSD ofall HTTP flows.
0.001
0.01
0.1
1
10
100
1000
10000
100000
1 10 100 1000 10000
frequ
ency
flow size
Actual distributionSampling based estimate
Proposed algorithm
(c) Estimate of FSD ofall HTTPS flows.
Figure 4: Actual, and estimated distributions for various subpopula-tions in the trace from USC.
31

Monitoring subpopulation flow size distribution – Evaluation
Trace Sub- Actual Sampling Proposedpopulation value based Algorithm
estimates
DNS 31932 38997.87 31389.68HTTP 277583 641874.11 330064.71
UNCHTTPS 27337 72174.95 37928.81Prefix 1.0 388326 673519.43 377266.40DNS 132396.00 161440.75 130686.73HTTP 244773.00 574610.23 283664.58
USCHTTPS 24731.00 64523.73 32660.56Prefix 1.0 637949.00 1017053.20 599140.25
Table 1: Estimates of total number of flows for various subpopulations in tracesUNC and USC
32
Conclusions
• Data-Streaming based solution for estimating flow-distributionof arbitrary subpopulations.
• Lossy data structure + Bayesian statistics = Accurate stream-ing
• Data-collection in parallel modules.
• Joint Estimation using EM algorithm.
33

Thank You !
34
Related Documents


![A Golgi-Released Subpopulation of the Trans-Golgi · A Golgi-Released Subpopulation of the Trans-Golgi Network Mediates Protein Secretion in Arabidopsis1[OPEN] Tomohiro Uemura,a,b,2,3,4](https://static.cupdf.com/doc/110x72/5eda9f5a09f66a09130ba5a1/a-golgi-released-subpopulation-of-the-trans-golgi-a-golgi-released-subpopulation.jpg)