HYDROLOGICAL PROCESSES Hydrol. Process. 23, 3641 – 3649 (2009) Published online 17 November 2009 in Wiley InterScience (www.interscience.wiley.com). DOI: 10.1002/hyp.7518 A data assimilation approach to discharge estimation from space Jeffrey Neal, 1 * Guy Schumann, 1 Paul Bates, 1 Wouter Buytaert, 1 Patrick Matgen 2 and Florian Pappenberger 3 1 School of Geographical Sciences, University of Bristol, Bristol BS8 1SS, UK 2 Public Research Centre—Gabriel Lippmann, Belvaux L-4422, Luxembourg 3 European Centre for Medium-Range Weather Forecasts, Reading RG29AX, UK *Correspondence to: Jeffrey Neal, School of Geographical Sciences, University of Bristol, Bristol BS8 1SS, UK. E-mail: [email protected] Received 27 May 2009 Accepted 9 October 2009 Abstract River discharge is currently monitored by a diminishing network of gauges, which provide a spatially incomplete picture of global discharges. This study assimilated water level information derived from a fused satellite Synthetic Aperture Radar (SAR) image and digital terrain model (DTM) with simulations from a coupled hydrological and hydrodynamic model to estimate discharge in an un-gauged basin scenario. Assimilating water level measurements led to a 79% reduction in ensemble discharge uncertainty over the coupled hydrological hydrodynamic model alone. Measurement bias was evident, but the method still provided a means of improving estimates of discharge for high flows. The study demonstrates the potential of currently available synthetic aperture radar imagery to reduce discharge uncertainty in un-gauged basins when combined with model simulations in a data assimilation framework, where sufficient topographic data are available. The work is timely because in the near future the launch of satellite radar missions will lead to a significant increase in the volume of data available for space-borne discharge estimation. Copyright 2009 John Wiley & Sons, Ltd. Key Words data assimilation; discharge estimation; hydraulic model; SAR Introduction Remote sensing from space-borne platforms offers a potentially cost-effective method of monitoring components of the hydrological cycle, including river discharge, at global scales (Biggin and Blyth, 1996). Unfortunately, discharge cannot be measured directly from these platforms with current technology and so the use of observable hydraulic variables such as water level, width, sinuosity and area as proxies to estimate discharge has been suggested (see reviews by Smith, 1997; Alsdorf and Lettenmaier, 2003; Brakenridge et al., 2005; Alsdorf et al., 2007). Images collected by Synthetic Aperture Radar (SAR) sensors have proven particularly useful for flood monitoring due to their all weather capabilities, and ability to penetrate vegetation cover at some wavelengths (Alsdorf et al., 2007). For example, Bjerklie et al. (2003) developed river discharge estimation equations using multiple-regression, based on over 1000 independent discharge measurements, whilst Smith and Pavelsky (2008) used the correlation between effective widths upstream and ground-based measurements of discharge to forecast discharge up to 8 days ahead with a mean absolute error of <25%. These techniques indicate that there are usable signals in remotely sensed SAR data, but exploiting these requires direct measurements of discharge at some point in the catchment. An alternative way of using observed data is to combine it with a dynamic model to obtain an optimal estimate of a geophysical field of interest. This process, known as data assimilation, has been widely applied to remotely sensed data for atmospheric and hydrological applications (Walker et al., 2003; Reichle, 2008). An advantage of this approach is that it considers both model simulations and the image-derived measurement data when esti- mating state variables such as level and discharge, without the need for ground observations. Furthermore, if integrated with parameter-estimation techniques (Vrugt et al., 2005), there is the potential to estimate uncer- tain model parameters, which may be used to increase the accuracy of the simulation model. This is particularly relevant in un-gauged basins where Copyright 2009 John Wiley & Sons, Ltd. 3641

Welcome message from author
This document is posted to help you gain knowledge. Please leave a comment to let me know what you think about it! Share it to your friends and learn new things together.
Transcript
HYDROLOGICAL PROCESSESHydrol. Process. 23, 3641–3649 (2009)Published online 17 November 2009 in Wiley InterScience (www.interscience.wiley.com). DOI: 10.1002/hyp.7518
A data assimilation approach to discharge estimationfrom space
Jeffrey Neal,1*Guy Schumann,1
Paul Bates,1
Wouter Buytaert,1
Patrick Matgen2
and Florian Pappenberger3
1 School of Geographical Sciences,University of Bristol, Bristol BS8 1SS,UK2 Public Research Centre—GabrielLippmann, Belvaux L-4422,Luxembourg3 European Centre for Medium-RangeWeather Forecasts, Reading RG29AX,UK
*Correspondence to:Jeffrey Neal, School of GeographicalSciences, University of Bristol, BristolBS8 1SS, UK.E-mail: [email protected]
Received 27 May 2009Accepted 9 October 2009
Abstract
River discharge is currently monitored by a diminishing network of gauges, whichprovide a spatially incomplete picture of global discharges. This study assimilatedwater level information derived from a fused satellite Synthetic Aperture Radar(SAR) image and digital terrain model (DTM) with simulations from a coupledhydrological and hydrodynamic model to estimate discharge in an un-gaugedbasin scenario. Assimilating water level measurements led to a 79% reductionin ensemble discharge uncertainty over the coupled hydrological hydrodynamicmodel alone. Measurement bias was evident, but the method still provided ameans of improving estimates of discharge for high flows. The study demonstratesthe potential of currently available synthetic aperture radar imagery to reducedischarge uncertainty in un-gauged basins when combined with model simulationsin a data assimilation framework, where sufficient topographic data are available.The work is timely because in the near future the launch of satellite radar missionswill lead to a significant increase in the volume of data available for space-bornedischarge estimation. Copyright 2009 John Wiley & Sons, Ltd.
Key Words data assimilation; discharge estimation; hydraulic model; SAR
IntroductionRemote sensing from space-borne platforms offers a potentially cost-effectivemethod of monitoring components of the hydrological cycle, including riverdischarge, at global scales (Biggin and Blyth, 1996). Unfortunately, dischargecannot be measured directly from these platforms with current technologyand so the use of observable hydraulic variables such as water level, width,sinuosity and area as proxies to estimate discharge has been suggested (seereviews by Smith, 1997; Alsdorf and Lettenmaier, 2003; Brakenridge et al.,2005; Alsdorf et al., 2007). Images collected by Synthetic Aperture Radar(SAR) sensors have proven particularly useful for flood monitoring due totheir all weather capabilities, and ability to penetrate vegetation cover atsome wavelengths (Alsdorf et al., 2007). For example, Bjerklie et al. (2003)developed river discharge estimation equations using multiple-regression,based on over 1000 independent discharge measurements, whilst Smith andPavelsky (2008) used the correlation between effective widths upstream andground-based measurements of discharge to forecast discharge up to 8 daysahead with a mean absolute error of <25%. These techniques indicate thatthere are usable signals in remotely sensed SAR data, but exploiting theserequires direct measurements of discharge at some point in the catchment.
An alternative way of using observed data is to combine it with a dynamicmodel to obtain an optimal estimate of a geophysical field of interest. Thisprocess, known as data assimilation, has been widely applied to remotelysensed data for atmospheric and hydrological applications (Walker et al.,2003; Reichle, 2008). An advantage of this approach is that it considersboth model simulations and the image-derived measurement data when esti-mating state variables such as level and discharge, without the need forground observations. Furthermore, if integrated with parameter-estimationtechniques (Vrugt et al., 2005), there is the potential to estimate uncer-tain model parameters, which may be used to increase the accuracy of thesimulation model. This is particularly relevant in un-gauged basins where
Copyright 2009 John Wiley & Sons, Ltd. 3641
J. NEAL ET AL.
often very few data are available to drive hydrologicalsimulation models of discharge.
Data assimilation techniques based on versions of theKalman filter have been used to assimilate ground-gauge-based river level data at points along river reaches (Mad-sen and Skotner, 2005; Neal et al., 2007) from whichone method of estimating discharge is to use state aug-mentation (Madsen and Canizares, 1999). However, theneed to use ground-based river level data is a majorlimitation for globally applicable techniques. Applica-tions of assimilation techniques with remotely sensedwater level data are rare. In one of the few studies ofthis type, Andreadis et al. (2007) successfully used asquare root Ensemble Kalman Filter (EnKF) (Evensen,2004) to assimilate synthetic water level measurementsfrom a proposed swath altimetry satellite (Alsdorf et al.,2007) with simulations from the LISFLOOD-FP two-dimensional hydraulic model (Bates and De Roo, 2000).However, an assimilation study of this type has yet to beattempted using real observations in an un-gauged basinscenario. Accordingly, in this paper, shoreline heightsderived from SAR imagery and a Light Detection andRanging (LiDAR)-based digital terrain model (DTM)were assimilated with model simulations from a cou-pled hydrological and hydrodynamic model to explore thepotential for reducing errors in discharge and water levelestimates in un-gauged basins with space-borne SARimagery. The reasons why the SAR data and proposedmethod do not represent a gauge replacement strategyare also discussed in the Section on Results.
Methods and Data
A 10-km reach of the River Alzette (Luxembourg) witha history of flooding and an average floodplain width of
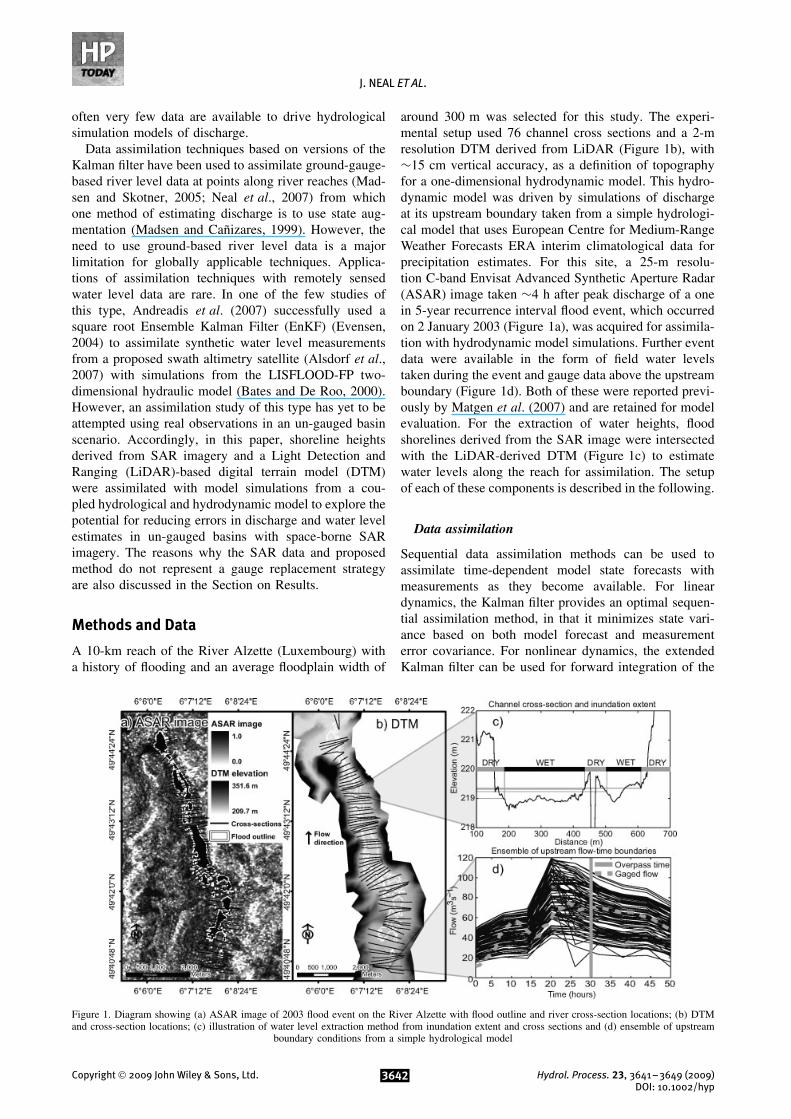
around 300 m was selected for this study. The experi-mental setup used 76 channel cross sections and a 2-mresolution DTM derived from LiDAR (Figure 1b), with¾15 cm vertical accuracy, as a definition of topographyfor a one-dimensional hydrodynamic model. This hydro-dynamic model was driven by simulations of dischargeat its upstream boundary taken from a simple hydrologi-cal model that uses European Centre for Medium-RangeWeather Forecasts ERA interim climatological data forprecipitation estimates. For this site, a 25-m resolu-tion C-band Envisat Advanced Synthetic Aperture Radar(ASAR) image taken ¾4 h after peak discharge of a onein 5-year recurrence interval flood event, which occurredon 2 January 2003 (Figure 1a), was acquired for assimila-tion with hydrodynamic model simulations. Further eventdata were available in the form of field water levelstaken during the event and gauge data above the upstreamboundary (Figure 1d). Both of these were reported previ-ously by Matgen et al. (2007) and are retained for modelevaluation. For the extraction of water heights, floodshorelines derived from the SAR image were intersectedwith the LiDAR-derived DTM (Figure 1c) to estimatewater levels along the reach for assimilation. The setupof each of these components is described in the following.
Data assimilation
Sequential data assimilation methods can be used toassimilate time-dependent model state forecasts withmeasurements as they become available. For lineardynamics, the Kalman filter provides an optimal sequen-tial assimilation method, in that it minimizes state vari-ance based on both model forecast and measurementerror covariance. For nonlinear dynamics, the extendedKalman filter can be used for forward integration of the
Figure 1. Diagram showing (a) ASAR image of 2003 flood event on the River Alzette with flood outline and river cross-section locations; (b) DTMand cross-section locations; (c) illustration of water level extraction method from inundation extent and cross sections and (d) ensemble of upstream
boundary conditions from a simple hydrological model
Copyright 2009 John Wiley & Sons, Ltd. 3642 Hydrol. Process. 23, 3641–3649 (2009)DOI: 10.1002/hyp
SCIENTIFIC BRIEFING
error covariance, but becomes very expensive computa-tionally as the problem dimensionality increases (Reichle,2008). An alternative solution is to approximate errorcovariance using an EnKF, where errors are defined bythe difference between each ensemble member and theensemble mean (Evensen, 2003). The EnKF was adoptedhere because it provides a framework for consideringuncertainty in both model simulations and measurementdata, and has been applied successfully to nonlinear mod-els and ensembles where the state variables of interest arenot normally distributed (as is the case here). The filterwas also used to update simulated flows by augmentingthem with the water levels in the state vector (Madsenand Canizares, 1999).
Hydrological modelling
The Alzette river basin was treated as un-gauged, and,therefore, only data that have not been measured in situwere used by the hydrological model. In this study, weused predictions of convective and stratiform precipita-tion and evaporation from the ERA interim reanalysisdataset (Simmons, 2006). Daily forecasts issued at 12p.m. with lead times of 3, 6, 9 and 12 h were convertedinto time series with a temporal resolution of 6 h. TheERA interim data do not close the water balance, whilstthe evaporation data are known to contain large errors(For the study region, they were nearly as high as theprecipitation data, suggesting an overestimation). There-fore, a correction factor was added to the evaporationdata in order to allow the hydrological model control overthe water balance of the catchment. Assuming a lack ofany information regarding the internal hydrological pro-cesses of the catchment, a widely used simple conceptualmodel was implemented. The catchment moisture deficitstore of Croke and Jakeman (2004) was used as a lossmodule, whilst routing was implemented as a linear store(Beven, 2001). This results in a model with two parame-ters, controlling respectively the catchment water balanceand response velocity, as well as two state variables thatneed to be initialized. The parameters are summarizedin Table I. However, a longer-than-necessary warming-up period from the start of the ERA interim data set in1990 was used to minimize the impact of model stateinitialization. Errors in reanalysis data are likely to bequite large, thus it should be noted that the parameteriza-tion of the hydrological model that might result from anyparameter-estimation scheme is expected to be effective.This is an inherent problem with the use of these data,although they are more skilful than climatology, whichin turn means that they are better than guessing.
The model was run in a Monte Carlo simulation withparameter sets that were drawn from a prior uniformrange of feasible parameter values (Table I) to gener-ate 100 ensemble members. As the parameter rangescan be very wide, particularly for conceptual models,further constraining was done by selecting only modelresults that gave peak discharges during the study periodwithin the range of 30–100 m3 s�1. These limits were
Table I. Hydrological model parameters and ranges sampled
Minimum Maximum
Loss moduleInitial soil moisture deficit (m) 0 1Ð5Flow threshold (m) 0Ð1 2Ratio between stress and flow thresholds 0 1
Routing module
Initial flow (m/h) 0 0Ð05Linear reservoir time constant (h) 1 10
This table includes initialisation parameters that are not important giventhe long warm-up period.
determined by expert judgment, similar to the limits ofacceptability approach of Beven (2006).
Hydrodynamic model
A one-dimensional hydrodynamic model of the reachbased on the Hydrologic Engineering Centers River Anal-ysis System (HEC-RAS) code was used, with the flood-plain conveyance accounted for by extending the crosssections onto the floodplain based on the LiDAR DEM(Pappenberger et al., 2006; Schumann et al., 2007a). Thecross sections were a composite of ground survey datain the channel and floodplain terrain heights extractedfrom the LiDAR DTM. The model required a hydro-graph as its upstream boundary condition (Figure 1d),which in this case was derived from the hydrologicalmodel simulations described above, and specification ofthe friction (Manning’s n) at each cross section. Esti-mates of global channel roughness of 0Ð035 and globalfloodplain roughness of 0Ð05 were made on the basis ofthe physical characteristics of a river of this type (Acre-ment and Schneider, 1984).
The use of channel cross-section data limits the appli-cability of the methodology as such data are oftenunavailable in un-gauged basins to a reasonable levelof accuracy and may have to be estimated (e.g. usinggeomorphic relationships). The model is expected to besensitive to the treatment of channel bathymetry, mean-ing the use of less accurate bathymetric data is likelyto affect simulation accuracy. To crudely simulate thisscenario, the cross-section data were simplified to a trape-zoidal channel using the channel-restricted cross-sectionpoint filtering tool in HEC-RAS, creating a second ‘sim-ple bathymetry’ hydrodynamic model. An alternativeapproach would be to estimate channel bathymetry aspart of the data assimilation methodology (Durand et al.,2008).
SAR data processing
Flood extent was estimated by classifying the ASARimage into dry and wet pixels using a simple radiometricthreshold technique (Deshmukh and Shinde, 2005). Toaccount for uncertainty in the image threshold value, thiswas repeated four times using threshold values equallyspaced between digital numbers 120 and 150. These
Copyright 2009 John Wiley & Sons, Ltd. 3643 Hydrol. Process. 23, 3641–3649 (2009)DOI: 10.1002/hyp
J. NEAL ET AL.
0 1000 2000 3000 4000 5000 6000 7000 8000 9000 10000210
215
220
225
230
235
Distance downstream (m)
Ele
vatio
n (m
)
(a)
0 1000 2000 3000 4000 5000 6000 7000 8000 9000 10000214216218220222224226228
Distance downstream (m)
Ele
vatio
n (m
)
(b)
0 1000 2000 3000 4000 5000 6000 7000 8000 9000 10000214216218220222224226228
Distance downstream (m)
Ele
vatio
n (m
)
(c)
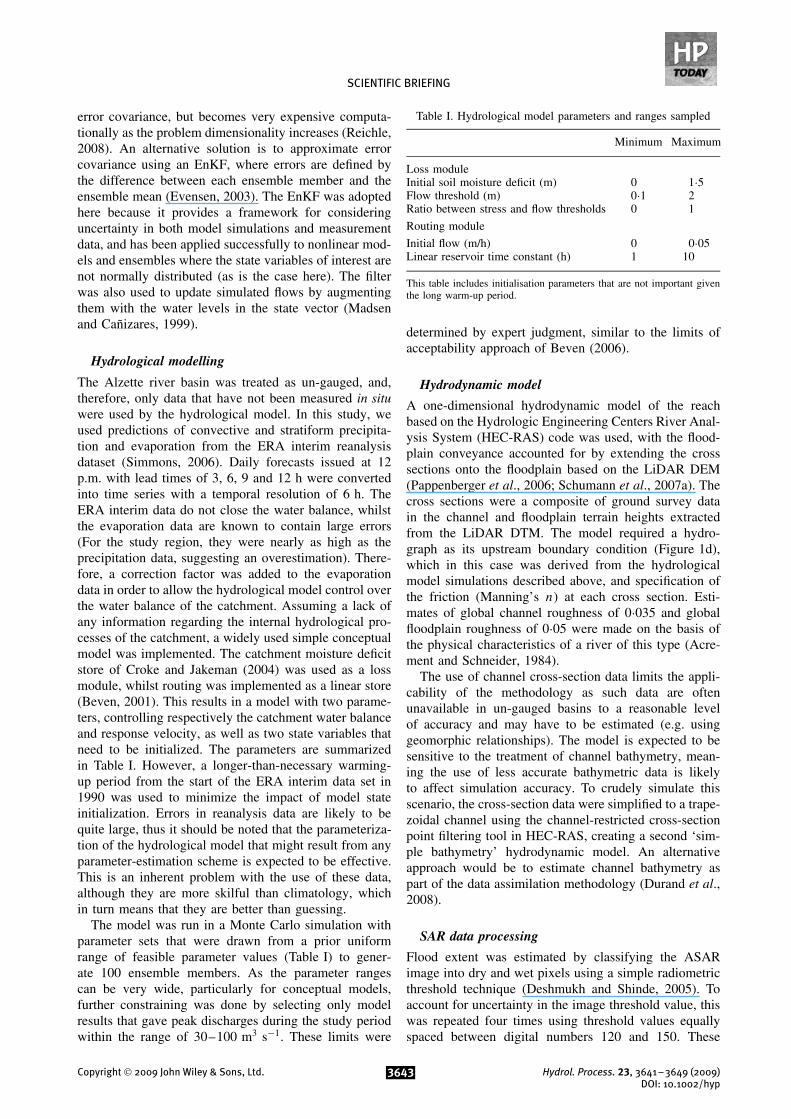
Figure 2. (a) Plot of measurement ensembles derived from the ASAR image, which were retained for assimilation (dark dots) and rejected (lightdots). Level simulations at the time of the satellite overpass before and after assimilation are also shown. (b) Plot of ensemble levels before (lighterlines) and after (darker line) assimilation along with water levels measured in the field. (c) Plot of ensemble water levels before and after assimilation
along with water levels measured in the field using the simple channel geometry
were chosen to represent the range of threshold valuesexpected for this image given specular reflectance overopen water. The ASAR image was geo-located using fourground control points easily locatable on bridges and roadcrossings, then fine tuned using the Monte Carlo–basedimage shifting technique described in Schumann et al.(2008). A comparison with independent check pointssuggests that this resulted in a standard deviation of geo-location errors of 19Ð4 m, which was found to be thelargest source of uncertainty in water stage estimates fromthis image by Schumann et al. (2008).
The EnKF required an ensemble of measurementsto represent measurement uncertainty. To achieve this,the four flood edge estimates derived from the imageclassification were repeatedly shifted in space accordingto the estimated geo-location error above. These newshoreline locations were then intersected with the DTM,as illustrated by Figure 1c and described in more detail bySchumann et al. (2008), to yield the ensemble of waterlevel estimates shown in Figure 2a. Measurement errorcovariance was defined from the perturbations of thisensemble around the mean. Thus, if Y is a matrix ofN ensemble perturbations from the ensemble mean, thenthe measurement error covariance matrix Re is definedas follows(Evensen, 2003):
Re D YYT
N � 1�1�
In Figure 2a, the cluster of high points at ¾5000 m down-stream was caused by a steep road embankment bordering
the flood edge. These measurements are clearly incorrectand introduce bias into the mean of the measurements.This was not unexpected as it is often noted that the com-bination of remotely sensed imagery of this resolution anda near-valley filling event (like the one observed here)tends to be more sensitive to over-prediction of water lev-els than on-site measurements. This is because the groundelevation rapidly increases at the valley side relative tothe floodplain as a whole, whilst any vegetation heightsnot removed from the raw LiDAR data tend to increasethe elevation of the DTM. However, the spatial coverageoffered by the remote sensing means it is not necessaryto use all measurements derived from the image. Hereonly half the measurements were assimilated (darker dotsin Figure 2a) by considering only those with the small-est inter-quartile range over the ensemble at a particularlocation, thus favouring measurement locations with rela-tively flat topography and small classification uncertainty.The size of this subsample came about by removingsamples until no measurement mean increased by morethan twice the expected LiDAR error (0Ð15 m) in thedownstream direction. The idea here was to remove mea-surements that are hydraulically incoherent due to steeptopography or image classification errors. Ranking sam-ples based on topographic slope or a normality test andremoving half the locations resulted in a broadly similarsubset of measurements. The sub-sampling method doesnot completely remove measurement bias but reduces itsimpact as the retained measurement ensembles show lessevidence of skew towards higher elevations. Although the
Copyright 2009 John Wiley & Sons, Ltd. 3644 Hydrol. Process. 23, 3641–3649 (2009)DOI: 10.1002/hyp
SCIENTIFIC BRIEFING
subsample of measurements is used for most of the exper-iments here, the effect of assimilating different numbersof measurements locations is assessed in the Section onSensitivity to Geometry and Number of Measurements.More advanced processing techniques based on activecontouring methods that fuse with the DTM (Masonet al., 2007) could be used to improve upon the waterlevel estimates and further reduce the bias, although thislatter technique is not easily applicable at this site due tofragmentation of the flooded area (Figure 1a).
Evaluation data
Maximum water level data were available from a surveyof wrack marks at five locations and three automaticstage readings at bridges (Matgen et al., 2007) wherelocalized surcharging may have increased water levels.The wrack mark measurements represent peak waterlevel around 4 h before the satellite overpass but aresubject to uncertainty due to geo-location errors (asthey were collected with a handheld global positioningsystem (GPS)) and errors in the DTM off which theheights were sampled. Levels at these measurementlocations were compared with the level at the closesthydrodynamic model cross section. A flow gauge 7 kmabove the upstream end of the site was also retainedfor evaluating posterior flow estimates. To evaluate themodel flow estimates, the gauge discharge was assumedto represent reach average discharge as there are nomajor tributaries along the reach. However, the errorsintroduced by converting gauged levels to flow via arating curve were significant relative to other modeluncertainties, especially at high flows. Pappenbergeret al. (2006) found the uncertainty range in this gauge tobe at least š11–16 m3 s�1 when assessing the influenceof rating curve uncertainty on flow estimates. Therefore,the evaluation conducted here is limited by these gaugeerrors and a lack of repeat independent data for thisor other events, a problem common to many floodinundation studies (Bates, 2004).
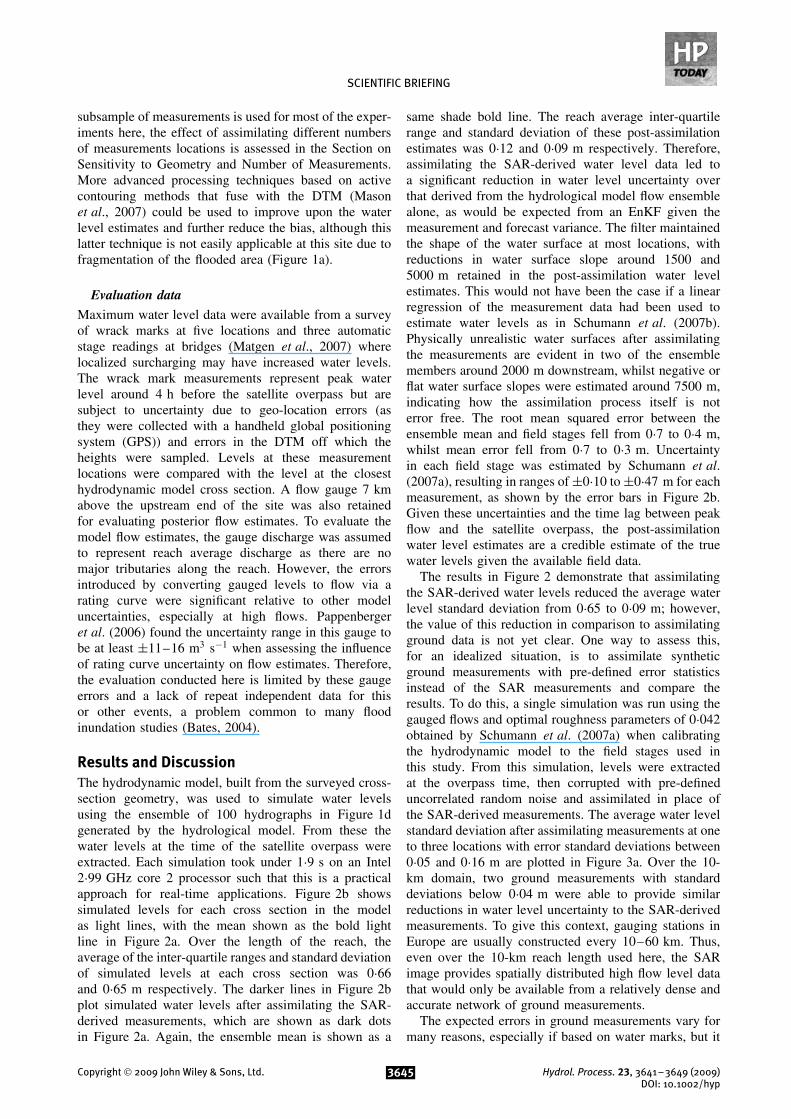
Results and DiscussionThe hydrodynamic model, built from the surveyed cross-section geometry, was used to simulate water levelsusing the ensemble of 100 hydrographs in Figure 1dgenerated by the hydrological model. From these thewater levels at the time of the satellite overpass wereextracted. Each simulation took under 1Ð9 s on an Intel2Ð99 GHz core 2 processor such that this is a practicalapproach for real-time applications. Figure 2b showssimulated levels for each cross section in the modelas light lines, with the mean shown as the bold lightline in Figure 2a. Over the length of the reach, theaverage of the inter-quartile ranges and standard deviationof simulated levels at each cross section was 0Ð66and 0Ð65 m respectively. The darker lines in Figure 2bplot simulated water levels after assimilating the SAR-derived measurements, which are shown as dark dotsin Figure 2a. Again, the ensemble mean is shown as a
same shade bold line. The reach average inter-quartilerange and standard deviation of these post-assimilationestimates was 0Ð12 and 0Ð09 m respectively. Therefore,assimilating the SAR-derived water level data led toa significant reduction in water level uncertainty overthat derived from the hydrological model flow ensemblealone, as would be expected from an EnKF given themeasurement and forecast variance. The filter maintainedthe shape of the water surface at most locations, withreductions in water surface slope around 1500 and5000 m retained in the post-assimilation water levelestimates. This would not have been the case if a linearregression of the measurement data had been used toestimate water levels as in Schumann et al. (2007b).Physically unrealistic water surfaces after assimilatingthe measurements are evident in two of the ensemblemembers around 2000 m downstream, whilst negative orflat water surface slopes were estimated around 7500 m,indicating how the assimilation process itself is noterror free. The root mean squared error between theensemble mean and field stages fell from 0Ð7 to 0Ð4 m,whilst mean error fell from 0Ð7 to 0Ð3 m. Uncertaintyin each field stage was estimated by Schumann et al.(2007a), resulting in ranges of š0Ð10 to š0Ð47 m for eachmeasurement, as shown by the error bars in Figure 2b.Given these uncertainties and the time lag between peakflow and the satellite overpass, the post-assimilationwater level estimates are a credible estimate of the truewater levels given the available field data.
The results in Figure 2 demonstrate that assimilatingthe SAR-derived water levels reduced the average waterlevel standard deviation from 0Ð65 to 0Ð09 m; however,the value of this reduction in comparison to assimilatingground data is not yet clear. One way to assess this,for an idealized situation, is to assimilate syntheticground measurements with pre-defined error statisticsinstead of the SAR measurements and compare theresults. To do this, a single simulation was run using thegauged flows and optimal roughness parameters of 0Ð042obtained by Schumann et al. (2007a) when calibratingthe hydrodynamic model to the field stages used inthis study. From this simulation, levels were extractedat the overpass time, then corrupted with pre-defineduncorrelated random noise and assimilated in place ofthe SAR-derived measurements. The average water levelstandard deviation after assimilating measurements at oneto three locations with error standard deviations between0Ð05 and 0Ð16 m are plotted in Figure 3a. Over the 10-km domain, two ground measurements with standarddeviations below 0Ð04 m were able to provide similarreductions in water level uncertainty to the SAR-derivedmeasurements. To give this context, gauging stations inEurope are usually constructed every 10–60 km. Thus,even over the 10-km reach length used here, the SARimage provides spatially distributed high flow level datathat would only be available from a relatively dense andaccurate network of ground measurements.
The expected errors in ground measurements vary formany reasons, especially if based on water marks, but it
Copyright 2009 John Wiley & Sons, Ltd. 3645 Hydrol. Process. 23, 3641–3649 (2009)DOI: 10.1002/hyp

J. NEAL ET AL.
0 2000 4000 6000 8000 10000210
215
220
225
230
Distance downstream (m)
Ele
vatio
n (m
)
0 2000 4000 6000 8000 10000210
215
220
225
230
Distance downstream (m)
Ele
vatio
n (m
)
0 2000 4000 6000 8000 10000210
215
220
225
230
Distance downstream (m)
Ele
vatio
n (m
)
0 0.05 0.1 0.150
0.05
0.1
0.15
0.2
0.25
Measurement std (m)
Ave
rage
wat
er le
vel s
td (
m) SAR water levels
One gauge
Two gauges
Three gauges
Figure 3. (a) Plot of average water level against measurements standard deviations. Plots of ensemble water levels before (light lines) and after (darklines) assimilation of 1 (b), 2 (c) and 3(d) measurements with standard deviation of 0Ð04 m
is not unreasonable to expect measurements at gaugingstations to be accurate to a few centimetres. Given thisexpectation, Figure 3b–c plots the prior and posteriorlevel ensembles given 1, 2 and 3 ground measurementswith a standard deviation of 0Ð04 m. By assimilatingone ground measurement, the posterior ensemble atthe measurement location was more constrained thanwas possible with the SAR data, but less so over thewhole domain because the ensemble error covariancebetween the measurement location and other modelcross sections decreased with distance. This decrease islikely to be greater if the hydrodynamic model wereconsidered as a source of uncertainty in the experimentaldesign. However, a gauging station would probably alsooperate at low flow and provide a much greater temporalresolution, which would propagate downstream over timeto increase the spatial influence of the gauge. Therefore, itshould be stressed that a gauge would provide level data,especially in the time dimension, that are not attainablefrom currently available SAR imagery. For this reason,the use of SAR imagery in a data assimilation frameworkshould not be viewed as an alternative to ground gauges.
Estimating flow
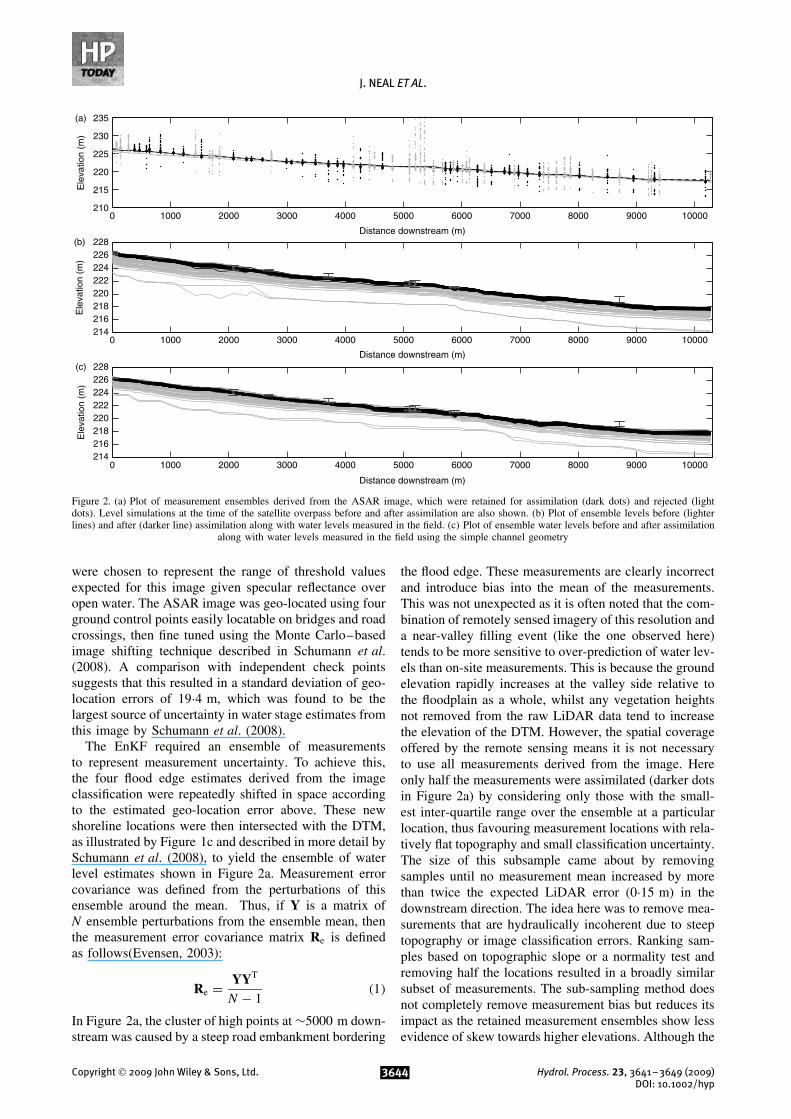
Estimates of prior and posterior flows are shown inFigure 4, along with the gauged flows of 75Ð0 m3 s�1
and the 5th and 95th percentile of the uncertainty range(š0Ð16 m3 s�1) from Pappenberger et al. (2006). Thefilter reduced the flow standard deviation by 79% from21Ð1 to 4Ð4 m3 s�1. Prior to assimilation, the ensemblemean flow of 60Ð5 m3 s�1 was 14Ð5 m3 s�1 lower thanthe gauge estimate, whilst after assimilation the ensemblemean flow of 85Ð1 m3 s�1 was 10Ð1 m3 s�1 greaterthan the gauge estimate. Given that errors in gauged
ratings when extrapolated for high flows are up to 20%for this gauge (Pappenberger et al., 2006), this is acredible but possibly an overly high estimate of the flow.This overestimation could be partly due to uncertaintyin the hydrodynamic model parameters or the ratingapplied to the gauge data. However, it is indicativeof an inherent weakness in using water level estimatesderived from imagery of near-valley filling events, inthat they are skewed towards over-prediction due tothe valley shape, and become more so with coarserimage resolutions. Thus, direct measurements of waterlevel (such as, for large rivers, those from the proposedsatellite swath altimetry mission surface water oceantopography (SWOT) (http://swot.jpl.nasa.gov/)) shouldoffer a fundamental improvement over those derivedhere because they are digital elevation model (DEM)independent. However, supplementing direct altimetrymeasurements with measurements derived from imagerywould reduce the time lag between measurements duringhigh flows.
This study has neglected sources of uncertainty fromthe hydrodynamic modelling as these were assumed tobe small relative to uncertainty in the SAR-derived waterlevels and hydrological modelling. However, the hydro-dynamic model is known to be a source of error inthat the parameter, process and topographic representa-tion are uncertain. These will become more significantif the hydrological model parameters are more accu-rately defined (Pappenberger et al., 2007). Thus, futurework will need to address the magnitude of hydrody-namic model uncertainty in relation to other errors asso-ciated with the hydrological model, measurement dataand assimilation process, as well as the topographic detailrequired to capture the first-order flow hydraulics.
Copyright 2009 John Wiley & Sons, Ltd. 3646 Hydrol. Process. 23, 3641–3649 (2009)DOI: 10.1002/hyp
SCIENTIFIC BRIEFING
0 20 40 60 80 100
Discharge (m3s–1)
Fre
quen
cy (
coun
t)
(a)
0 20 40 60 80 1000
5
10
15
20
25
30
35
40
45
Discharge (m3s–1)
Fre
quen
cy (
coun
t)
(c)
0 20 40 60 80 1000
5
10
15
20
25
30
35
40
45
0
5
10
15
20
25
30
35
40
45
Discharge (m3s–1)
Fre
quen
cy (
coun
t)
(b)
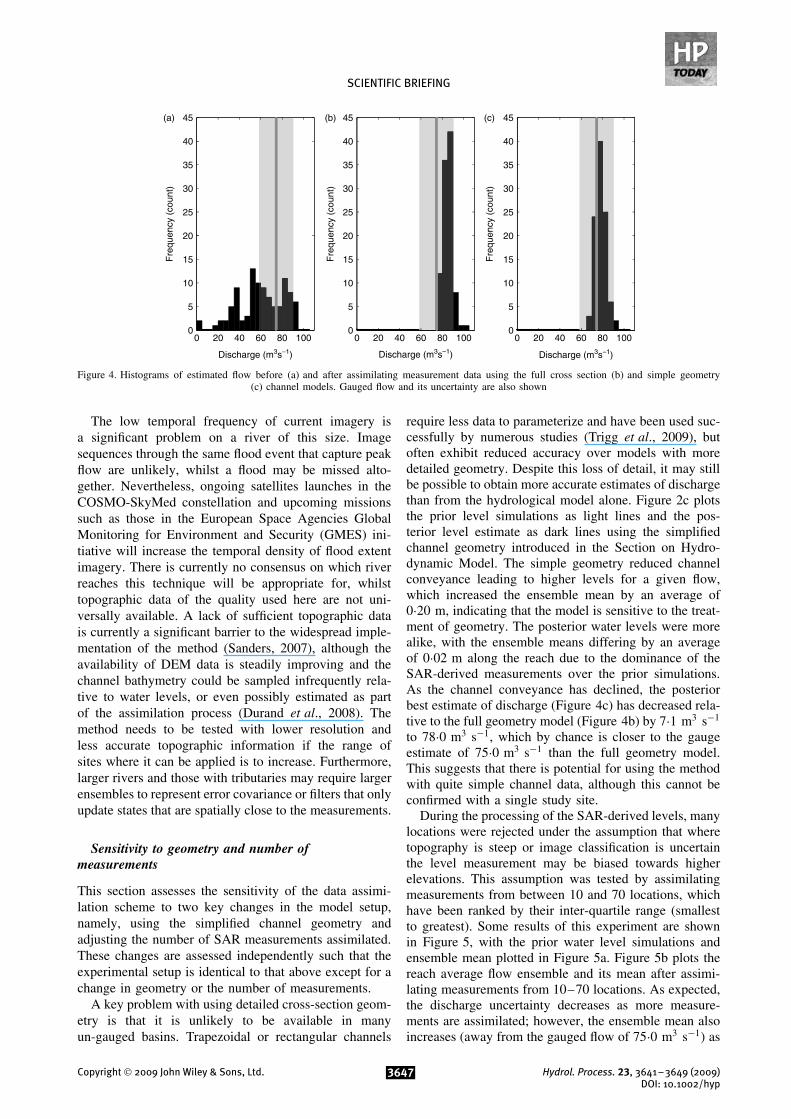
Figure 4. Histograms of estimated flow before (a) and after assimilating measurement data using the full cross section (b) and simple geometry(c) channel models. Gauged flow and its uncertainty are also shown
The low temporal frequency of current imagery isa significant problem on a river of this size. Imagesequences through the same flood event that capture peakflow are unlikely, whilst a flood may be missed alto-gether. Nevertheless, ongoing satellites launches in theCOSMO-SkyMed constellation and upcoming missionssuch as those in the European Space Agencies GlobalMonitoring for Environment and Security (GMES) ini-tiative will increase the temporal density of flood extentimagery. There is currently no consensus on which riverreaches this technique will be appropriate for, whilsttopographic data of the quality used here are not uni-versally available. A lack of sufficient topographic datais currently a significant barrier to the widespread imple-mentation of the method (Sanders, 2007), although theavailability of DEM data is steadily improving and thechannel bathymetry could be sampled infrequently rela-tive to water levels, or even possibly estimated as partof the assimilation process (Durand et al., 2008). Themethod needs to be tested with lower resolution andless accurate topographic information if the range ofsites where it can be applied is to increase. Furthermore,larger rivers and those with tributaries may require largerensembles to represent error covariance or filters that onlyupdate states that are spatially close to the measurements.
Sensitivity to geometry and number ofmeasurements
This section assesses the sensitivity of the data assimi-lation scheme to two key changes in the model setup,namely, using the simplified channel geometry andadjusting the number of SAR measurements assimilated.These changes are assessed independently such that theexperimental setup is identical to that above except for achange in geometry or the number of measurements.
A key problem with using detailed cross-section geom-etry is that it is unlikely to be available in manyun-gauged basins. Trapezoidal or rectangular channels
require less data to parameterize and have been used suc-cessfully by numerous studies (Trigg et al., 2009), butoften exhibit reduced accuracy over models with moredetailed geometry. Despite this loss of detail, it may stillbe possible to obtain more accurate estimates of dischargethan from the hydrological model alone. Figure 2c plotsthe prior level simulations as light lines and the pos-terior level estimate as dark lines using the simplifiedchannel geometry introduced in the Section on Hydro-dynamic Model. The simple geometry reduced channelconveyance leading to higher levels for a given flow,which increased the ensemble mean by an average of0Ð20 m, indicating that the model is sensitive to the treat-ment of geometry. The posterior water levels were morealike, with the ensemble means differing by an averageof 0Ð02 m along the reach due to the dominance of theSAR-derived measurements over the prior simulations.As the channel conveyance has declined, the posteriorbest estimate of discharge (Figure 4c) has decreased rela-tive to the full geometry model (Figure 4b) by 7Ð1 m3 s�1
to 78Ð0 m3 s�1, which by chance is closer to the gaugeestimate of 75Ð0 m3 s�1 than the full geometry model.This suggests that there is potential for using the methodwith quite simple channel data, although this cannot beconfirmed with a single study site.
During the processing of the SAR-derived levels, manylocations were rejected under the assumption that wheretopography is steep or image classification is uncertainthe level measurement may be biased towards higherelevations. This assumption was tested by assimilatingmeasurements from between 10 and 70 locations, whichhave been ranked by their inter-quartile range (smallestto greatest). Some results of this experiment are shownin Figure 5, with the prior water level simulations andensemble mean plotted in Figure 5a. Figure 5b plots thereach average flow ensemble and its mean after assimi-lating measurements from 10–70 locations. As expected,the discharge uncertainty decreases as more measure-ments are assimilated; however, the ensemble mean alsoincreases (away from the gauged flow of 75Ð0 m3 s�1) as
Copyright 2009 John Wiley & Sons, Ltd. 3647 Hydrol. Process. 23, 3641–3649 (2009)DOI: 10.1002/hyp

J. NEAL ET AL.
0 2000 4000 6000 8000 10000214
216
218
220
222
224
226
228
Distance downstream (m)
Ele
vatio
n (m
)
Ele
vatio
n (m
)(a)
70
80
90
100
110
Number of SAR measurements assimilated (count)
Dis
char
ge (
m3 s-1
)
(b)
0 2000 4000 6000 8000 10000214
216
218
220
222
224
226
228
Distance downstream (m)
Ele
vatio
n (m
)
(c)
0 2000 4000 6000 8000 10000214
216
218
220
222
224
226
228
Distance downstream (m)
Ele
vatio
n (m
)
(d)
10 20 30 40 50 60 70-0.2
-0.1
0
0.1
0.2Ensemble mean discharge
Mean elevation difference
Figure 5. (a) prior level simulations from Figure 2b. (b) Posterior flow estimates after assimilating 10–70 SAR-derived measurements and meandifference in level estimates from Figure 2b. (c) Plot of ensemble water levels before and after assimilation 10 SAR measurements. (d) Plot of
ensemble water levels before and after assimilation 70 SAR measurements
the measurement bias is introduced from 60 measurementlocations and upwards. Discharge estimates are relativelysimilar for between 20 and 50 measurement locations asis the mean difference in water level from the resultsfrom the Section on Results and Discussion. Therefore,it is essential that the SAR-derived levels are subject tosome form of quality control prior to assimilation and thatthe image is not assumed to provide suitable data every-where. Figure 5c and d plots the posterior level ensem-bles after assimilating measurements from 10 and 70locations, respectively. Obviously assimilating 70 mea-surement locations led to less spread in the ensemble thanassimilation of 10 measurement locations. However, the70 measurement locations plot indicates a further reasonfor not assimilating all SAR locations, in that the poste-rior water level profile has diverged from a hydraulicallyplausible surface as it contains many locations where thelevel increases with distance downstream. Thus, as manylocations are unsuitable for extracting water heights, it isessential to consider measurement error before using thistype of data.
ConclusionsThe test case has shown that where detailed digital eleva-tion data are available it is possible to retrieve dischargeand level estimates from 25-m resolution ASAR imagerywhen combined with hydrodynamic modelling using adata assimilation approach. These estimates were con-sistent with independent water level and discharge eval-uation data, although there is evidence of bias towardshigher water levels in the SAR-derived data. Notably,in an un-gauged basin scenario, the SAR-derived mea-surements led to a significant reduction in dischargeuncertainty and error. This uniquely demonstrates the
application of an EnKF for river discharge estimationwith currently available SAR imagery and hydrodynamicmodel simulations in an un-gauged basin scenario. Thedischarge estimates could be used to constrain the hydro-logical model parameters, which may improve forecastsor predictions made by the hydrological model whenmeasurement data are unavailable. The method there-fore has the potential to improve discharge predictionsin un-gauged basins and provide reliable information onextreme high flows not easily observable over large scalesfrom the ground. However, it is essential that the SAR-derived levels are subject to some form of quality controlprior to assimilation and that the image is not assumedto provide suitable data everywhere.
The SAR-derived data are not a substitute for a densein situ gauge network, as they are only applicable infre-quently at high flow and are likely to be less accuratethan in situ gauge data at local scales. A significant draw-back of the method demonstrated here is the need forgood topographic data both within channel and on thefloodplain, whilst expert judgement was used to estab-lish the prior discharge estimate. Such problems can beminimized as channel geometry can be collected infre-quently relative to water level measurements. Moreover,the use of a simplified trapezoidal channel at this sitestill improved the posterior discharge estimate over thehydrological model alone. Nevertheless, further tests ofthe method with less accurate and lower-resolution topo-graphic data are required.
AcknowledgementsJeffrey Neal was funded by the Flood Risk ManagementResearch Consortium (FRMRC), supported by grantnumber EP/F20511/1 from the EPSRC. Guy Schumann
Copyright 2009 John Wiley & Sons, Ltd. 3648 Hydrol. Process. 23, 3641–3649 (2009)DOI: 10.1002/hyp
SCIENTIFIC BRIEFING
was funded by a Great Western Research fellowship.Patrick Matgen was funded by the Hydrasens project,financed by the National Research Fund of the GrandDuchy of Luxembourg and the Belgian Science Policy.The authors would like to thank the reviewers for theirvaluable contribution to the development of this paper.
References
Acrement GJ, Schneider VR. 1984. Guide for Selecting Manning’sRoughness Coefficients for Natural Channels and flood plains . Report No.FHWA-TS-84-204. Federal Highways Administration, US Department ofTransportation: Washington, D.C., 62 pp.
Alsdorf DE, Rodriguez E, Lettenmaier DP. 2007. Measuring surfacewater from space. Reviews of Geophysics 45: DOI:10.1029/2006RG000197.
Alsdorf DE, Lettenmaier DP. 2003. Tracking fresh water from space.Science 301(5639): 1491–1494.
Andreadis KM, Clark EA, Lettenmaier DP, Alsdorf DE. 2007. Prospectsfor river discharge and depth estimation through assimilation of swath-altimetry into a raster-based hydrodynamics model. Geophysical ResearchLetters 34: DOI:10.1029/2007GL02972.
Bates PD. 2004. Remote sensing and flood inundation modelling. Hydro-logical Processes 18: 2593–2597.
Bates PD, De Roo APJ. 2000. A simple raster-based model for floodinundation simulation. Journal of Hydrology 236(1–2): 54–77.
Beven KJ. 2001. Rainfall-Runoff Modelling. The Primer . John Wiley andsons: Chichester; 360 pp.
Beven K. 2006. A manifesto for the equifinality thesis. Journal ofHydrology 320: 18–36.
Biggin DS, Blyth K. 1996. A comparison of ERS-1 satellite radar andaerial photography for river flood mapping. Journal of the Institution ofWater and Environmental Management 10: 59–64.
Bjerklie DM, et al. 2003. Evaluating the potential for measuring riverdischarge from space. Journal of Hydrology 278(1–4): 17–38.
Brakenridge GR, Nghiem SV, Anderson E, Chien S. 2005. Space-BasedMeasurement of River Runoff, Eos Transcations . AGU, 86(19): 185,DOI:10.1029/2005EO190001.
Croke B, Jakeman A. 2004. A catchment moisture deficit module for theihacres rainfall-runoff model. Environmental Modelling and Software 19:1–5.
Deshmukh KS, Shinde GN. 2005. An adaptive color image segmentation.Electronic Letters on Computer Vision and Image Analysis 5(4): 12–23.
Durand MD, et al. 2008. Estimation of bathymetric depth and slopefrom data assimilation of swath altimetry into a hydrodynamic model.Geophysical Research Letters 35: L20401. DOI:10.1029/2008GL034150.
Evensen G. 2003. The Ensemble Kalman Filter: theoretical formulationand practical implementation. Ocean Dynamics 53: 343–367.
Evensen G. 2004. Sampling strategies and square root analysis schemesfor the EnKF. Ocean Dynamics 54(6): 539–560.
Madsen H, Canizares R. 1999. Comparison of extended and ensembleKalman filters for data assimilation in coastal area modeling. Interna-tional Journal for Numerical Methods in Fluids 31(6): 961–981.
Madsen H, Skotner C. 2005. Adaptive state updating in real-time riverflow forecasting—a combined filtering and error forecasting procedure.Journal of Hydrology 308(1–4): 302–312.
Mason DC, et al. 2007. Use of fused airborne scanning laser altimetryand digital map data for urban flood modelling. Hydrological Processes21(11): 1436–1447.
Matgen P, et al. 2007. Integration of SAR-derived river inundation areas,high-precision topographic data and a river flow model toward nearreal-time flood management. International Journal of Applied EarthObservation and Geoinformation 9(3): 247–263.
Neal JC, et al. 2007. Flood inundation model updating using an ensembleKalman filter and spatially distributed measurements. Journal of Hydrol-ogy 336(3–4): 401–415.
Pappenberger F, et al. 2006. Influence of uncertain boundary conditionsand model structure on flood inundation predictions. Advances in WaterResources 29(10): 1430–1449.
Pappenberger F, et al. 2007. Grasping the unavoidable subjectivity incalibration of flood inundation models: a vulnerability weighted approach.Journal of Hydrology 333(2–4): 275–287.
Reichle R. 2008. Data assimilation methods in the Earth sciences.Advances in Water Resources 31: 1411–1418.DOI:10.1016/j.advwatres.2008.01.001.
Sanders B. 2007. Evaluation of on-line DEMs for flood inundationmodeling. Advances in Water Resources 30: 1831–1843.
Schumann G, et al. 2007a. Deriving distributed roughness values fromsatellite radar data for flood inundation modelling. Journal of Hydrology344: 96–111.
Schumann G, et al. 2007b. High-resolution 3D flood information fromradar imagery for flood hazard management. Transactions on Geoscienceand Remote Sensing 45(6): 1715–1725.
Schumann G, et al. 2008. Conditioning water stages from satelliteimagery on uncertain data points. IEEE Geoscience and Remote SensingLetters 5(4): 810–813.
Simmons A, et al. 2006. ERA-Interim: new ECMWF reanalysis productsfrom 1989 onwards. ECMWF Newsletter 110: 25–35.
Smith LC. 1997. Satellite remote sensing of river inundation area, stage,and discharge: a review. Hydrological Processes 11(10): 1427–1439.
Smith LC, Pavelsky TM. 2008. Estimation of river discharge, propaga-tion speed, and hydraulic geometry from space: Lena River, Siberia.Water Resources Research 44(3): W03427, DOI:10.1029/2007WR006133.
Trigg M, et al. 2009. Amazon flood wave hydraulics. Journal of Hydrol-ogy 374(1–2): 92–105. DOI:10.1016/j.jhydrol.2009.06.004.
Vrugt JA, et al. 2005. Improved treatment of uncertainty in hydrologicmodeling: combining the strengths of global optimization and dataassimilation. Water Resources Research 41: W01017.
Walker JP, et al. 2003. New remote sensing technologies requireadvances in hydrologic data assimilation. EOS, American Geophys Union84(49): 545–551.
Copyright 2009 John Wiley & Sons, Ltd. 3649 Hydrol. Process. 23, 3641–3649 (2009)DOI: 10.1002/hyp
Related Documents