A Cost of the Diet Analysis in the Agro-Pastoral Zone of Wadi Bissam, Kanem Region, Chad Location: Wadi Bissam, Kanem , Agro-pastoral zone TD05 Date of data collection: November 2017 Date of final report: December 2017

Welcome message from author
This document is posted to help you gain knowledge. Please leave a comment to let me know what you think about it! Share it to your friends and learn new things together.
Transcript
A Cost of the Diet Analysis in the Agro-Pastoral
Zone of Wadi Bissam, Kanem Region, Chad Location: Wadi Bissam, Kanem , Agro-pastoral zone TD05
Date of data collection: November 2017
Date of final report: December 2017
A Cost of the Diet Analysis Wadi Bissam, Kanem region, Chad.
1 |
Acknowledgements
The Cost of the Diet field assessment was led by Claudia Damu (International Consultant) and Vanessa Piechotta (Trainee CotD practitioner), coordinated by Alexis Alonda (Action Contre la Faim) and Emanuel Ilunga (Action Contre la Faim). Allandiguim Dana, (independent translator) provided interpreting services during the assessment. The analysis and this report were written by Claudia Damu and Vanessa Piechotta, with technical inputs from Josselin Gauny (Regional Technical Advisor, Action Contre la Faim). The assessment was also possible thanks to the ACF team of staff who conducted the surveys and collected the data: Wobiakbe Kakiang, Pierre Djonyo, Mahamat Teib Saleh, Louahikbe Pakouare, Moustapha Mahamat Moustapha, Mahamat Issa Adoum, Moussa Ali Mahamat Aguid, Elhadji Mahamat Idriss, Abakar Elhadji Baba, Hassan Abakar Adoum, Prudence Ngarbaye and Ahmat Adramane Hassane. This analysis would not have been possible without the help of the local traders and of the women who kindly participated in the focus group discussions. Their time and invaluable insights are greatly appreciated. Suggested citation: Action Contre la Faim (2017). A Cost of the Diet analysis in Wadi Bissam, Kanem Region, Chad. ACF,
N’Djamena.
A Cost of the Diet Analysis Wadi Bissam, Kanem region, Chad.
2 |
CONTENTS Acknowledgements ....................................................................................................................................... 1
List of abbreviations ...................................................................................................................................... 4
EXECUTIVE SUMMARY .................................................................................................................................. 5
1. INTRODUCTION ..................................................................................................................................... 9
1.1. Background ................................................................................................................................... 9
1.2. Aims and objectives of the study ................................................................................................ 10
2. METHODS ............................................................................................................................................ 11
2.1. Cost of the Diet ........................................................................................................................... 11
2.1.1. Energy only diet (EO) ........................................................................................................... 11
2.1.2. Micronutrient nutritious diet (NUT) .................................................................................... 12
2.1.3. Food habits nutritious diet (FHAB) ...................................................................................... 12
2.2. Data collection ............................................................................................................................ 12
2.2.1. Location ................................................................................................................................... 12
2.2.2. Market survey ......................................................................................................................... 13
2.2.3. Interviews and focus group discussions .................................................................................. 14
2.3. Average family size and composition ......................................................................................... 15
2.4. Estimating affordability of the diet ............................................................................................. 16
3. RESULTS............................................................................................................................................... 17
3.1. Typical food consumption ........................................................................................................... 17
3.2. Food availability and markets ..................................................................................................... 18
3.3. Cost of the Diet ........................................................................................................................... 19
3.3.1. Energy only diet (EO) ........................................................................................................... 22
3.3.2. Micronutrient nutritious diet (NUT) .................................................................................... 23
3.3.3. Food habits diet (FHAB) ...................................................................................................... 24
3.3.3.1. Seasonal fluctuations in cost of the FHAB diet ................................................................ 26
3.4. Limiting nutrients analysis .......................................................................................................... 28
3.5. Cost of the diet for vulnerable groups ........................................................................................ 29
3.5.1. Cost of the diet for children under 5 ...................................................................................... 29
3.5.2. Cost of the diet for pregnant and lactating women ............................................................... 29
3.6. Affordability of diet ..................................................................................................................... 30
A Cost of the Diet Analysis Wadi Bissam, Kanem region, Chad.
3 |
3.7. Modelling the impact of scenarios on the cost of the diet ......................................................... 32
3.7.1. The impact of sugar consumption .......................................................................................... 32
3.7.2. The impact of milk consumption on the cost of the diet ........................................................ 32
3.7.3. The impact of produce from garden oasis on the cost of the diet ......................................... 33
3.7.4. The potential impact of green leafy vegetables on the cost of the diet ................................. 34
4. KEY FINDINGS AND RECOMMENDATIONS .......................................................................................... 37
BIBLIOGRAPHY ............................................................................................................................................ 40
APPENDICES ................................................................................................................................................ 43
A Cost of the Diet Analysis Wadi Bissam, Kanem region, Chad.
4 |
List of abbreviations
ACF – Action Contre la Faim
CotD – Cost of the Diet
FCFA – Central African FCFA Franc
ECHO – European Civil Protection and Humanitarian Aid Operations
EO – Energy only diet
FAO – Food and Agriculture Organization
FGD- Focus Group Discussion
FHAB – Food habits nutritious diet
FEWSNET – Famine Early Warning Systems Network
HDDS – Household Dietary Diversity Score
HEA – Household Economy Analysis
HH – Household
NFE – Non-food expenditure
NUT – Micronutrient nutritious diet
WFP – UN World Food Programme
WRA – Women of reproductive age
A Cost of the Diet Analysis Wadi Bissam, Kanem region, Chad.
5 |
EXECUTIVE SUMMARY
The Cost of the Diet (CotD) is a method and software developed by Save the Children to estimate the
amount and combination of local foods that are needed to provide individuals or a family with foods
that meet their average needs for energy and their recommended intakes of protein, fat and
micronutrients (Deptford et al., 2017). The Cost of the Diet software selects a variety of foods that
would enable a family to meet their nutrient requirements. The analysis focuses on three diets:
energy only, nutritious and food habits nutritious diets.
Aim of the study
The aim of this Cost of the Diet analysis was to assess whether it is possible for households in the
Wadi Bissam region to meet energy and nutrient specifications using locally available foods, and the
cost of meeting these needs in relation to the socio-economic categorization of households according
to the Household Economy Analysis (HEA 2016).
The data collection and analysis set out to answer the following questions:
What is the cost of a nutritionally adequate diet for a typical household? What is the cost of the diet for a child under 5?
What is the cost of the diet for a lactating or pregnant woman?
Can a nutritionally adequate diet be achieved using locally available food? What nutrients have the greatest influence on the cost of a nutritious diet?
Are there neglected or new foods that could reduce the cost of the diet?
Based on local availability, what foods or food groups contribute the most to a nutritious diet?
What are the food preferences, habits and taboos across communities in Wadi Bissam?
Can households afford a nutritious diet based on local dietary habits? If not, what is the
affordability gap? What can be done to close or narrow the affordability gap?
Key findings and recommendations
Table 1 is a summary of the cost of all diets calculated by the software. The analysis revealed that
across all diets the requirements can be met using locally available foods, reflecting the small yet
varied list of food items found across markets in Wadi Bissam. The analysis found that a nutritious
diet is approximately twice the cost of an energy only diet, reflecting the high cost of meeting fat,
protein and micronutrient requirements compared to only meeting energy requirements. The cost of
the food habits nutritious diet is 1.5 times greater than the cost of the nutritious diet. In the FHAB
diet, the software applies minimum and maximum weekly food constraints to reflect the dietary
habits as a results of the interviews conducted. Thus, the elevated cost of the FHAB diet is indicative
of the higher cost of meeting nutrient specifications when accounting for dietary habits.
A Cost of the Diet Analysis Wadi Bissam, Kanem region, Chad.
6 |
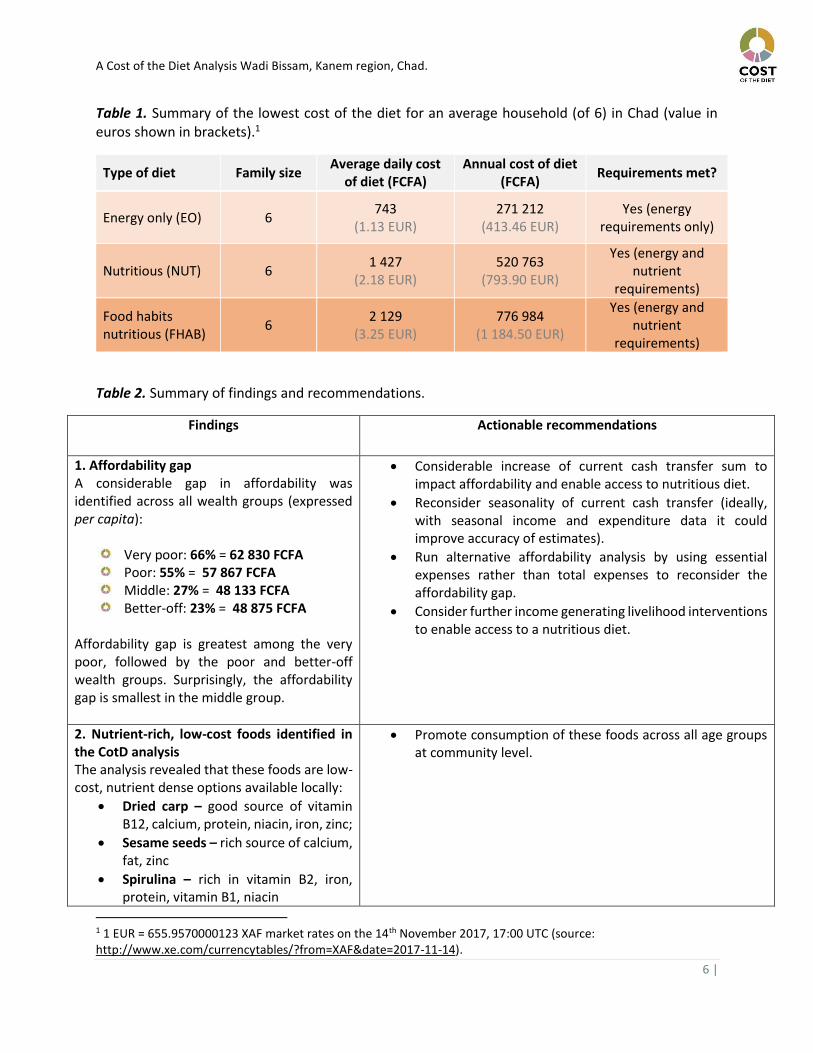
Table 1. Summary of the lowest cost of the diet for an average household (of 6) in Chad (value in euros shown in brackets).1
Type of diet Family size Average daily cost
of diet (FCFA) Annual cost of diet
(FCFA) Requirements met?
Energy only (EO) 6 743
(1.13 EUR) 271 212
(413.46 EUR) Yes (energy
requirements only)
Nutritious (NUT) 6 1 427
(2.18 EUR) 520 763
(793.90 EUR)
Yes (energy and nutrient
requirements)
Food habits nutritious (FHAB)
6 2 129
(3.25 EUR) 776 984
(1 184.50 EUR)
Yes (energy and nutrient
requirements)
Table 2. Summary of findings and recommendations.
Findings Actionable recommendations
1. Affordability gap A considerable gap in affordability was identified across all wealth groups (expressed per capita):
Very poor: 66% = 62 830 FCFA Poor: 55% = 57 867 FCFA Middle: 27% = 48 133 FCFA Better-off: 23% = 48 875 FCFA
Affordability gap is greatest among the very poor, followed by the poor and better-off wealth groups. Surprisingly, the affordability gap is smallest in the middle group.
Considerable increase of current cash transfer sum to impact affordability and enable access to nutritious diet.
Reconsider seasonality of current cash transfer (ideally, with seasonal income and expenditure data it could improve accuracy of estimates).
Run alternative affordability analysis by using essential expenses rather than total expenses to reconsider the affordability gap.
Consider further income generating livelihood interventions to enable access to a nutritious diet.
2. Nutrient-rich, low-cost foods identified in the CotD analysis The analysis revealed that these foods are low-cost, nutrient dense options available locally:
Dried carp – good source of vitamin B12, calcium, protein, niacin, iron, zinc;
Sesame seeds – rich source of calcium, fat, zinc
Spirulina – rich in vitamin B2, iron, protein, vitamin B1, niacin
Promote consumption of these foods across all age groups at community level.
1 1 EUR = 655.9570000123 XAF market rates on the 14th November 2017, 17:00 UTC (source: http://www.xe.com/currencytables/?from=XAF&date=2017-11-14).
A Cost of the Diet Analysis Wadi Bissam, Kanem region, Chad.
7 |
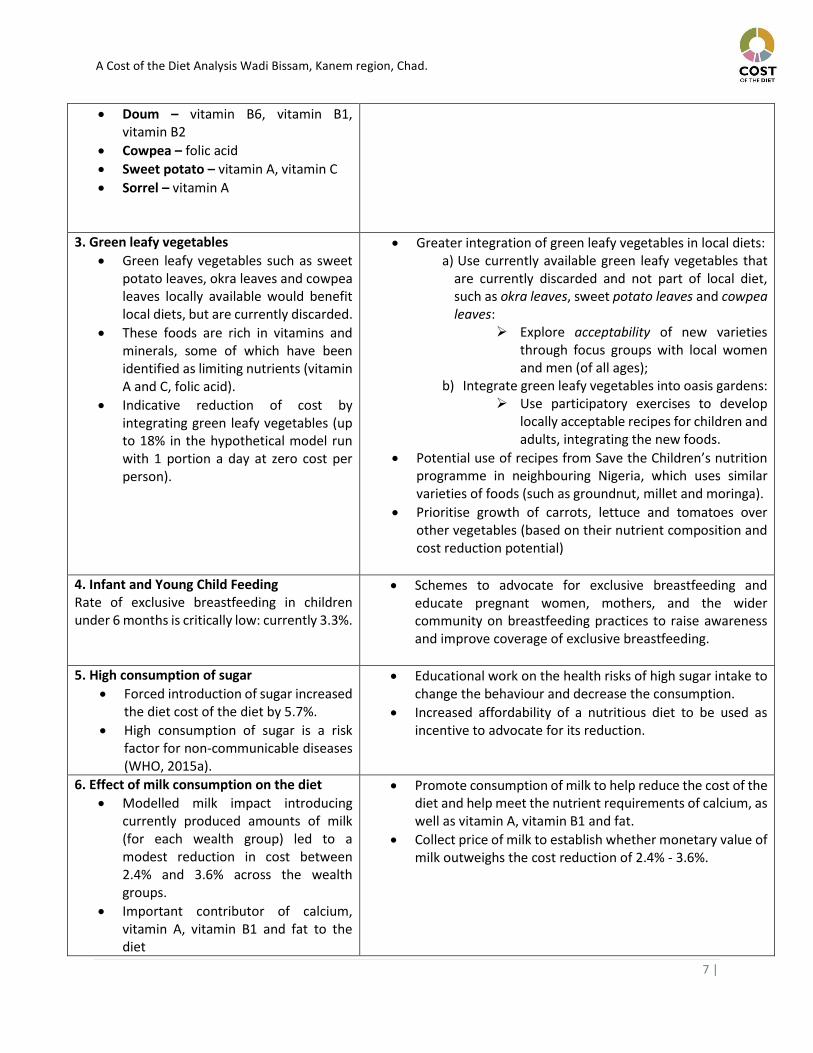
Doum – vitamin B6, vitamin B1, vitamin B2
Cowpea – folic acid
Sweet potato – vitamin A, vitamin C
Sorrel – vitamin A
3. Green leafy vegetables
Green leafy vegetables such as sweet potato leaves, okra leaves and cowpea leaves locally available would benefit local diets, but are currently discarded.
These foods are rich in vitamins and minerals, some of which have been identified as limiting nutrients (vitamin A and C, folic acid).
Indicative reduction of cost by integrating green leafy vegetables (up to 18% in the hypothetical model run with 1 portion a day at zero cost per person).
Greater integration of green leafy vegetables in local diets: a) Use currently available green leafy vegetables that
are currently discarded and not part of local diet, such as okra leaves, sweet potato leaves and cowpea leaves:
Explore acceptability of new varieties through focus groups with local women and men (of all ages);
b) Integrate green leafy vegetables into oasis gardens: Use participatory exercises to develop
locally acceptable recipes for children and adults, integrating the new foods.
Potential use of recipes from Save the Children’s nutrition programme in neighbouring Nigeria, which uses similar varieties of foods (such as groundnut, millet and moringa).
Prioritise growth of carrots, lettuce and tomatoes over other vegetables (based on their nutrient composition and cost reduction potential)
4. Infant and Young Child Feeding Rate of exclusive breastfeeding in children under 6 months is critically low: currently 3.3%.
Schemes to advocate for exclusive breastfeeding and educate pregnant women, mothers, and the wider community on breastfeeding practices to raise awareness and improve coverage of exclusive breastfeeding.
5. High consumption of sugar
Forced introduction of sugar increased the diet cost of the diet by 5.7%.
High consumption of sugar is a risk factor for non-communicable diseases (WHO, 2015a).
Educational work on the health risks of high sugar intake to change the behaviour and decrease the consumption.
Increased affordability of a nutritious diet to be used as incentive to advocate for its reduction.
6. Effect of milk consumption on the diet
Modelled milk impact introducing currently produced amounts of milk (for each wealth group) led to a modest reduction in cost between 2.4% and 3.6% across the wealth groups.
Important contributor of calcium, vitamin A, vitamin B1 and fat to the diet
Promote consumption of milk to help reduce the cost of the diet and help meet the nutrient requirements of calcium, as well as vitamin A, vitamin B1 and fat.
Collect price of milk to establish whether monetary value of milk outweighs the cost reduction of 2.4% - 3.6%.
A Cost of the Diet Analysis Wadi Bissam, Kanem region, Chad.
8 |
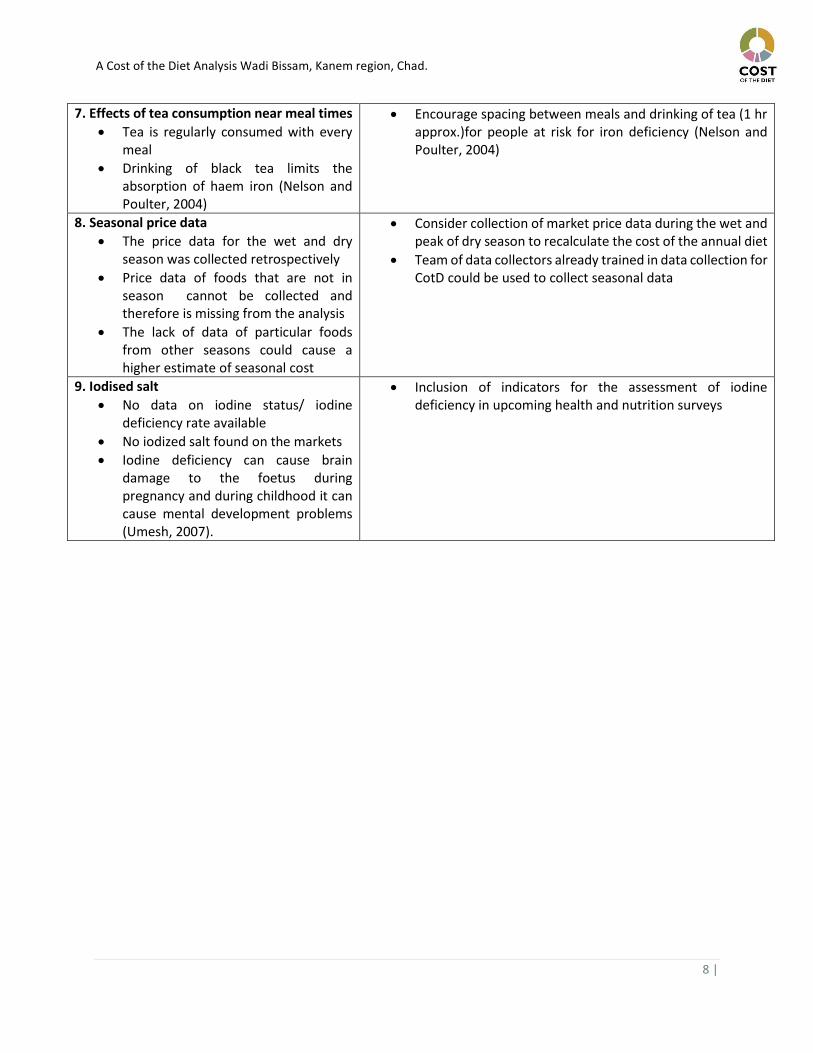
7. Effects of tea consumption near meal times
Tea is regularly consumed with every meal
Drinking of black tea limits the absorption of haem iron (Nelson and Poulter, 2004)
Encourage spacing between meals and drinking of tea (1 hr approx.)for people at risk for iron deficiency (Nelson and Poulter, 2004)
8. Seasonal price data
The price data for the wet and dry season was collected retrospectively
Price data of foods that are not in season cannot be collected and therefore is missing from the analysis
The lack of data of particular foods from other seasons could cause a higher estimate of seasonal cost
Consider collection of market price data during the wet and peak of dry season to recalculate the cost of the annual diet
Team of data collectors already trained in data collection for CotD could be used to collect seasonal data
9. Iodised salt
No data on iodine status/ iodine deficiency rate available
No iodized salt found on the markets
Iodine deficiency can cause brain damage to the foetus during pregnancy and during childhood it can cause mental development problems (Umesh, 2007).
Inclusion of indicators for the assessment of iodine deficiency in upcoming health and nutrition surveys
A Cost of the Diet Analysis Wadi Bissam, Kanem region, Chad.
9 |
1. INTRODUCTION
1.1. Background
The Republic of Chad is located in the Sahelian region of Africa, south of Libya, and is the home to
around 14 million people. 87% of the population, mostly living in rural area, lives below the poverty
line (WFP, 2017). Faced with high child mortality (138.7 of 1000 children under 5) and low life
expectancy (52 and 54 for males and females, respectively), Chad is amongst the least developed
countries in the world, currently ranking 186th in the Human Development Index (UNDP, 2017; WHO,
2017b). Chad has one of the highest rates of hunger in the world, aggravated by climate change and
conflict in the region (WFP, 2017).
The Kanem region is located at the western border of the country; east of Niger and above the Lac
region. The region has around 400 000 habitants, 55.7% of whom are under the age of 18 years
(OCHA, 2016 and INSEED, 2009). Access to basic social services (such as schools and health services)
is very restricted; the region has a student-teacher ratio of 214 to 1 and only one doctor for 29 486
habitants. 56% of the population is food insecure (OCHA, 2016).
Nutrition status of children and mothers
Findings from the 2017 SMART survey presented high rates of underweight, acute and chronic
malnutrition in the Kanem region, indicating a critical situation. In the region, 19.2% of children below
5 are wasted (4.1% severe), 50.8% are stunted (17.7% severe), and 45.2% are underweight (13.7%
severe) (SMART 2017). All three rates are above the national average, with stunting and underweight
representing the highest rates compared to other regions. Comparing current rates of acute and
chronic malnutrition to results from the 2015 SMART survey reveals an increase over the past two
years of 5.2% and 7.8%, respectively. Based on mid-upper arm circumference measurements, acute
malnutrition is prevalent in 8.6% of adolescent women (15-19 years) and 3.8% of adult women (20-
49 years) in the Kanem region (SMART 2015).
1.1.1. IYCF practices
The 2015 SMART revealed that more than 90% of 0-23 months old children are breastfed in Chad. In
regard to the Kanem region, 99.5% of children below 2 years of age were breastfed and 54.3%
benefited from an early initiation of breastfeeding. However, only 3.3% of 0-5 months-old children
are exclusively breastfed in the region. The survey showed that 55.6% of women introduce solid and
semi-solid foods when the baby is 6 months old.
1.1.2. Micronutrients deficiencies
There is currently little or no data available on the micronutrient status of the Chadian population.
According WHO published figures, anaemia is prevalent in 74% of children under five (WHO, 2015b),
47.1% in non-pregnant women, 52.1% in pregnant women, and 47.7% in women of reproductive age
(WHO, 2016a, 2016b). Iodized salt is consumed by 53.8% of the population (UNICEF, 2013).
A Cost of the Diet Analysis Wadi Bissam, Kanem region, Chad.
10 |
1.1.3. WASH
According to the 2015 SMART survey, 83.2% of households in Kanem access their water through safe
sources, such as piped water, borehole or protected shallow wells. The remaining 16.7% of
households obtain their water from sources that would normally require treatment prior to drinking.
The majority of Kanem’s households (91.7%) practice open-air defecation and only 8.3% have access
to latrines. The stool of children under 3 years is correctly eliminated from 40.4% of households. 60%
of households do not dispose of children’s (under 3) stools correctly.
The habits of hand washing at critical times was assessed: 52.2% wash their hands before preparing
the meals, 48.8% before feeding children, 65.5% after visiting the toilet, 49.6% before cleaning a child
which defecated, 85.3% before and after eating, 41.2% after touching garbage.
1.2. Aims and objectives of the study
The aim of this Cost of the Diet analysis was to assess whether it is possible for households in the
Wadi Bissam region to meet energy and nutrient specifications using locally available foods, and the
cost of meeting these needs in relation to the socio-economic categorization of households according
to the Household Economy Analysis (HEA 2016).
The data collection and analysis set out to answer the following questions:
What is the cost of a nutritionally adequate diet for a typical household? What is the cost of the diet for a child under 5?
What is the cost of the diet for a lactating or pregnant woman?
Can a nutritionally adequate diet be achieved using locally available food? What nutrients have the greatest influence on the cost of a nutritious diet?
Are there neglected or new foods that could reduce the cost of the diet?
Based on local availability, what foods or food groups contribute the most to a nutritious diet?
What are the food preferences, habits and taboos across communities in Wadi Bissam?
Can households afford a nutritious diet based on local dietary habits? If not, what is the
affordability gap? What can be done to close or narrow the affordability gap?
A Cost of the Diet Analysis Wadi Bissam, Kanem region, Chad.
11 |
2. METHODS
2.1. Cost of the Diet
The Cost of the Diet (CotD) is a method and software developed by Save the Children to estimate the
amount and combination of local foods that are needed to provide individuals or a family with foods
that meet their average needs for energy and their recommended intakes of protein, fat and
micronutrients (Deptford et al., 2017). The Cost of the Diet software selects a variety of foods that
would enable a family to meet their nutrient requirements. As outlined in Table 3 and below, the
analysis focuses on three diets: energy only, nutritious and food habits nutritious diets.
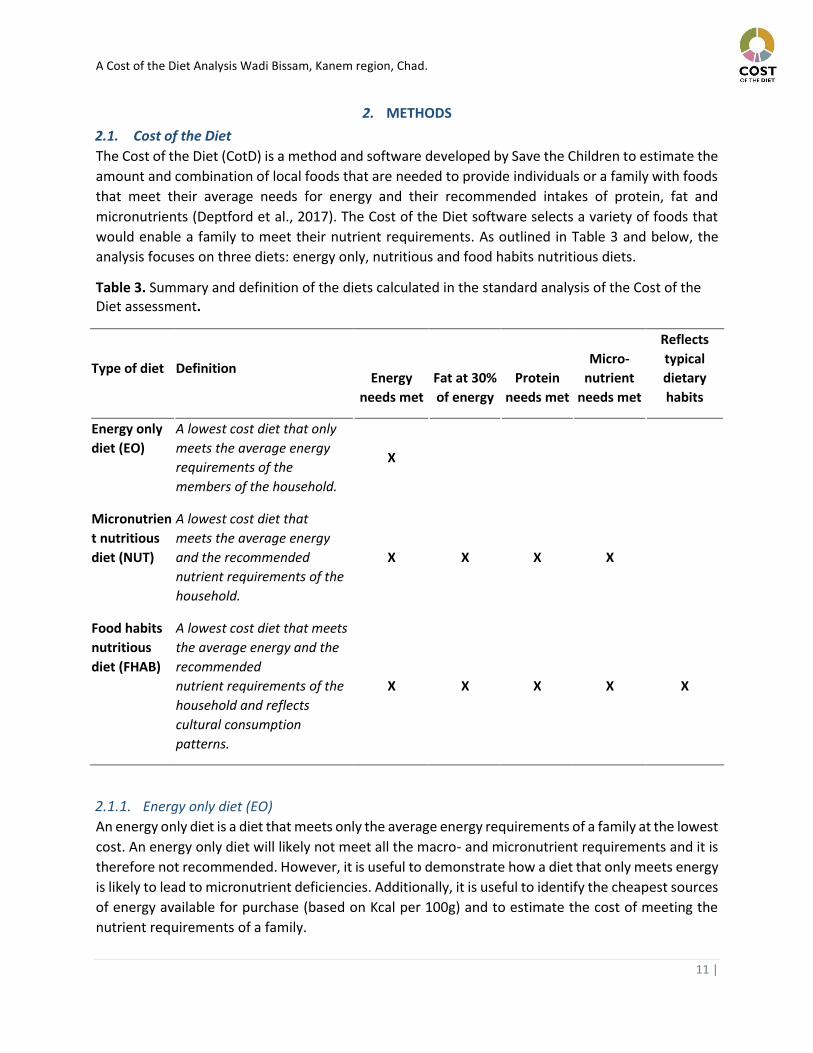
Table 3. Summary and definition of the diets calculated in the standard analysis of the Cost of the Diet assessment.
Type of diet Definition Energy
needs met
Fat at 30%
of energy
Protein
needs met
Micro-
nutrient
needs met
Reflects
typical
dietary
habits
Energy only
diet (EO)
A lowest cost diet that only
meets the average energy
requirements of the
members of the household.
X
Micronutrien
t nutritious
diet (NUT)
A lowest cost diet that
meets the average energy
and the recommended
nutrient requirements of the
household.
X X X X
Food habits
nutritious
diet (FHAB)
A lowest cost diet that meets
the average energy and the
recommended
nutrient requirements of the
household and reflects
cultural consumption
patterns.
X X X X X
2.1.1. Energy only diet (EO)
An energy only diet is a diet that meets only the average energy requirements of a family at the lowest
cost. An energy only diet will likely not meet all the macro- and micronutrient requirements and it is
therefore not recommended. However, it is useful to demonstrate how a diet that only meets energy
is likely to lead to micronutrient deficiencies. Additionally, it is useful to identify the cheapest sources
of energy available for purchase (based on Kcal per 100g) and to estimate the cost of meeting the
nutrient requirements of a family.
A Cost of the Diet Analysis Wadi Bissam, Kanem region, Chad.
12 |
2.1.2. Micronutrient nutritious diet (NUT)
A micronutrient nutritious diet (also more simply referred to as a nutritious diet) is a diet that meets
the recommended intakes for energy, protein, fat and micronutrients (nine vitamins and four
minerals) at the lowest cost. The diet does not reflect typical dietary habits, but it is useful to illustrate
the following:
The additional cost of meeting requirements for micronutrients compared with a diet
that only meets average energy needs.
The surprisingly small number of foods needed to meet a nutritious diet, although
often included in very large quantities.
The difference in the foods selected and their cost when compared with a diet that
takes into account typical dietary habits (in the FHAB diet, see 2.1.3. below).
2.1.3. Food habits nutritious diet (FHAB)
A food habits nutritious diet is a diet that meets the recommended intakes for energy, protein, fat
and micronutrients (nine vitamins and four minerals) for the specified family or individual at the
lowest cost, whilst applying a minimum and maximum number of times a week that the foods can be
included in the diet. The minimum and maximum constraints are based on a dietary habits
questionnaire as part of a focus group discussion. The food habits nutritious diet is useful to illustrate
the extra cost of meeting average energy and recommended nutrient when taking into account
typical dietary habits and preferences, such as the main staple food consumed and frequency of
consumption of other particular foods.
The Cost of the Diet software can also be used to:
Estimate the minimum cost of a diet for specified families/households of multiple individuals;
Identify seasonal shortfalls in nutrient intake;
Take into account seasonal variations in food prices when costing the diet;
Develop models of current or potential interventions.
The details of the parameters used and the limitations of the Cost of the Diet software and method
can be found in Appendix 1.
2.2. Data collection
The sections below describe in detail the data collection of market prices and dietary habits for the
purpose of conducting the cost of the diet analysis (see Annexes 1 and 2 for data collection tools).
2.2.1. Location
The Cost of the Diet assessment was conducted in the region of Wadi Bissam and part of the
agropastoral zone of Chad (see Figure 1). ACF has been operating in this region since 2008 and in
terms of malnutrition and food insecurity, it is amongst the most vulnerable regions in Chad (ACF,
2017). Wadi Bissam has a sahélo-saharan climate, which is characterized by long dry seasons and an
annual rainfall of 200-400 mm/year (HEA, 2016). The data was collected at the beginning of the dry
season, in mid-November 2017. According to the local ACF team and key informants experienced the
region relatively scarce rainfall during the previous wet season.
A Cost of the Diet Analysis Wadi Bissam, Kanem region, Chad.
13 |
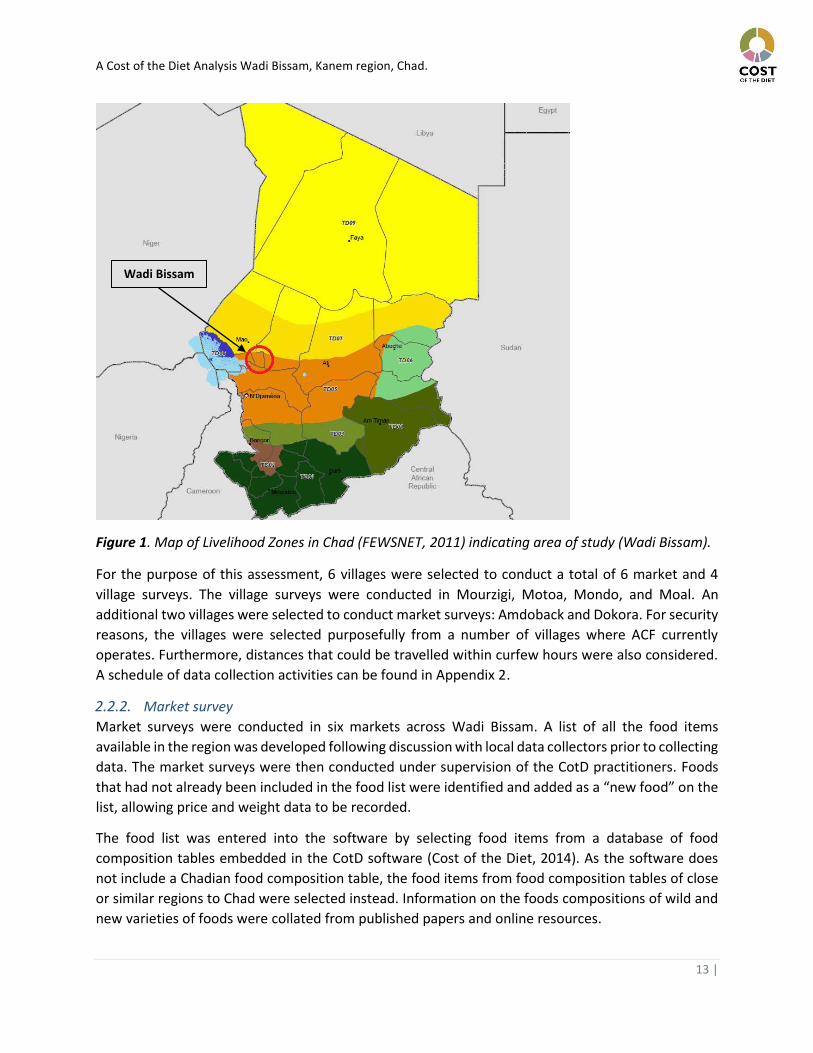
Figure 1. Map of Livelihood Zones in Chad (FEWSNET, 2011) indicating area of study (Wadi Bissam).
For the purpose of this assessment, 6 villages were selected to conduct a total of 6 market and 4
village surveys. The village surveys were conducted in Mourzigi, Motoa, Mondo, and Moal. An
additional two villages were selected to conduct market surveys: Amdoback and Dokora. For security
reasons, the villages were selected purposefully from a number of villages where ACF currently
operates. Furthermore, distances that could be travelled within curfew hours were also considered.
A schedule of data collection activities can be found in Appendix 2.
2.2.2. Market survey
Market surveys were conducted in six markets across Wadi Bissam. A list of all the food items
available in the region was developed following discussion with local data collectors prior to collecting
data. The market surveys were then conducted under supervision of the CotD practitioners. Foods
that had not already been included in the food list were identified and added as a “new food” on the
list, allowing price and weight data to be recorded.
The food list was entered into the software by selecting food items from a database of food
composition tables embedded in the CotD software (Cost of the Diet, 2014). As the software does
not include a Chadian food composition table, the food items from food composition tables of close
or similar regions to Chad were selected instead. Information on the foods compositions of wild and
new varieties of foods were collated from published papers and online resources.
Wadi Bissam
A Cost of the Diet Analysis Wadi Bissam, Kanem region, Chad.
14 |
The prices of foods across three seasons were recorded for each food item found during the survey.
For the purpose of the assessment, retrospective price data were collected to cover a one year
period, from December 2016 to November 2017, to estimate the annual cost of the diet.
Information on seasons and periods of the year was gathered from the data collection team. Thus,
the seasons were defined as follows:
Season 1: current situation - November 2017
Season 2: wet season - October 2017 – June 2017
Season 3: dry season - May 2017 – December 2016
Market traders were asked current prices of the smallest unit of all food items sold at the point of
trade (based on the assumption that this is the unit the poor are likely to afford and to purchase).
The traders were also asked to recall the price of each item during each season. The weight and price
of the smallest unit of each food item sold was recorded.
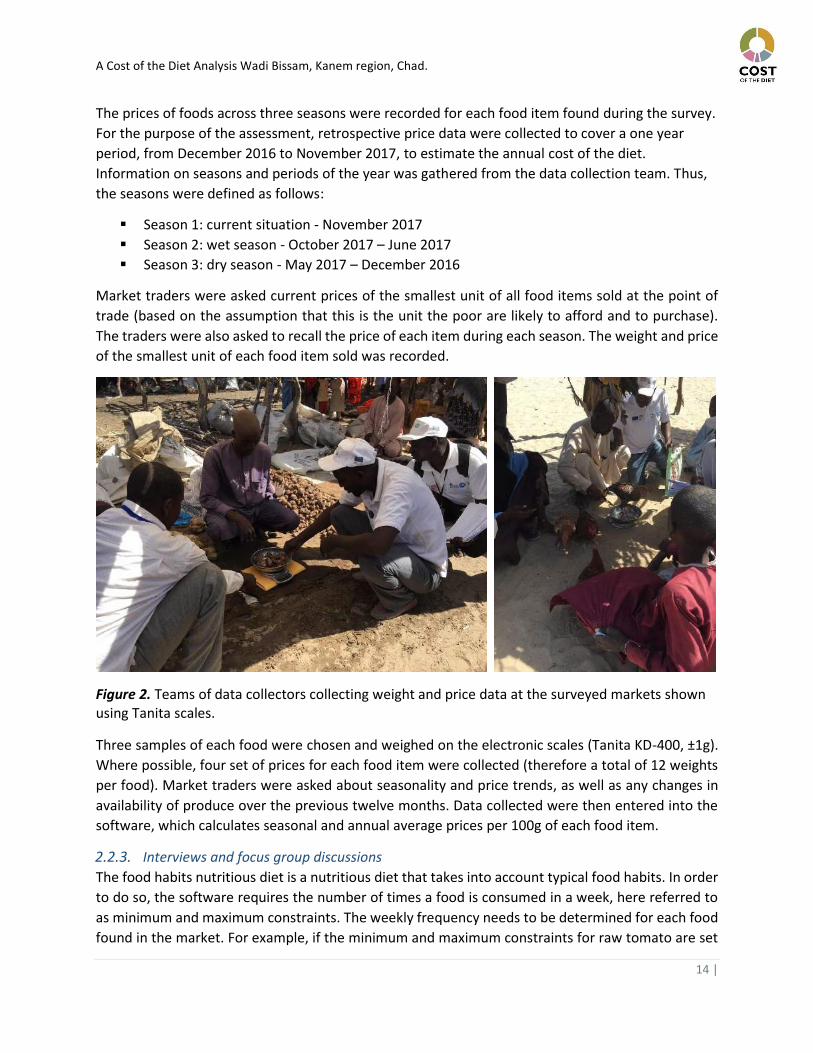
Figure 2. Teams of data collectors collecting weight and price data at the surveyed markets shown using Tanita scales.
Three samples of each food were chosen and weighed on the electronic scales (Tanita KD-400, ±1g).
Where possible, four set of prices for each food item were collected (therefore a total of 12 weights
per food). Market traders were asked about seasonality and price trends, as well as any changes in
availability of produce over the previous twelve months. Data collected were then entered into the
software, which calculates seasonal and annual average prices per 100g of each food item.
2.2.3. Interviews and focus group discussions
The food habits nutritious diet is a nutritious diet that takes into account typical food habits. In order
to do so, the software requires the number of times a food is consumed in a week, here referred to
as minimum and maximum constraints. The weekly frequency needs to be determined for each food
found in the market. For example, if the minimum and maximum constraints for raw tomato are set
A Cost of the Diet Analysis Wadi Bissam, Kanem region, Chad.
15 |
between 0 and 7, the software has the ability to include it in the diet up to seven times a week, or
once a day, for each individual in the family.
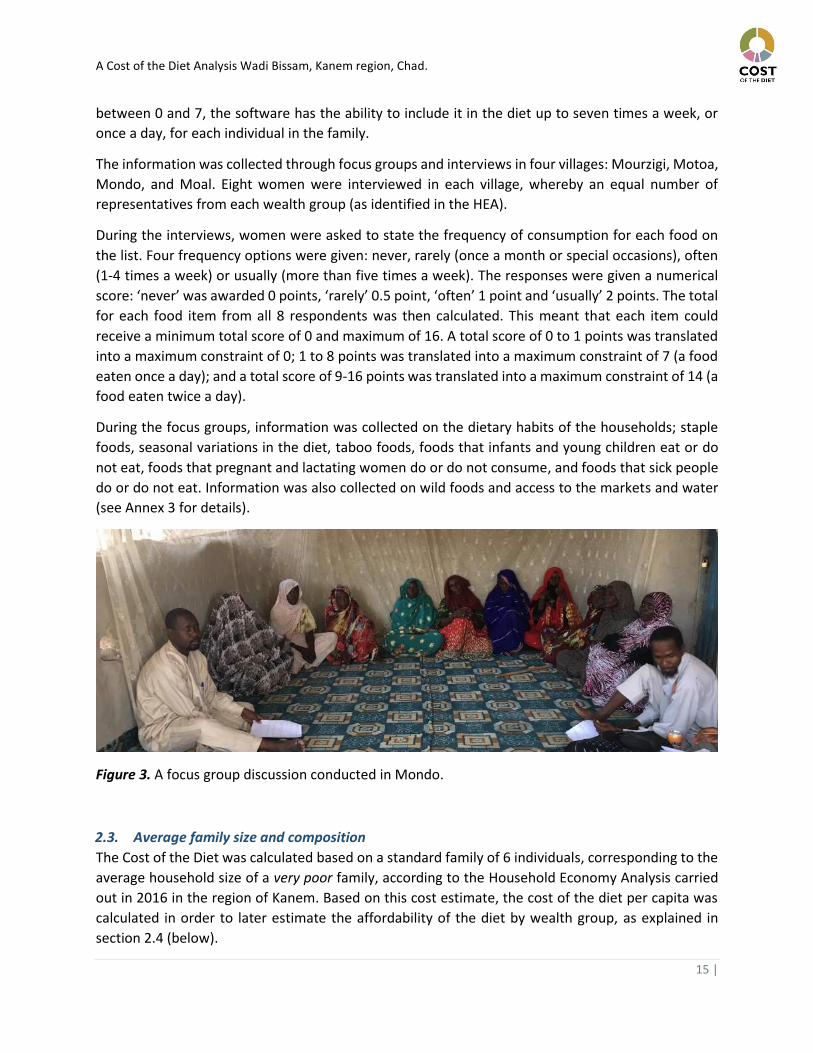
The information was collected through focus groups and interviews in four villages: Mourzigi, Motoa,
Mondo, and Moal. Eight women were interviewed in each village, whereby an equal number of
representatives from each wealth group (as identified in the HEA).
During the interviews, women were asked to state the frequency of consumption for each food on
the list. Four frequency options were given: never, rarely (once a month or special occasions), often
(1-4 times a week) or usually (more than five times a week). The responses were given a numerical
score: ‘never’ was awarded 0 points, ‘rarely’ 0.5 point, ‘often’ 1 point and ‘usually’ 2 points. The total
for each food item from all 8 respondents was then calculated. This meant that each item could
receive a minimum total score of 0 and maximum of 16. A total score of 0 to 1 points was translated
into a maximum constraint of 0; 1 to 8 points was translated into a maximum constraint of 7 (a food
eaten once a day); and a total score of 9-16 points was translated into a maximum constraint of 14 (a
food eaten twice a day).
During the focus groups, information was collected on the dietary habits of the households; staple
foods, seasonal variations in the diet, taboo foods, foods that infants and young children eat or do
not eat, foods that pregnant and lactating women do or do not consume, and foods that sick people
do or do not eat. Information was also collected on wild foods and access to the markets and water
(see Annex 3 for details).
Figure 3. A focus group discussion conducted in Mondo.
2.3. Average family size and composition
The Cost of the Diet was calculated based on a standard family of 6 individuals, corresponding to the
average household size of a very poor family, according to the Household Economy Analysis carried
out in 2016 in the region of Kanem. Based on this cost estimate, the cost of the diet per capita was
calculated in order to later estimate the affordability of the diet by wealth group, as explained in
section 2.4 (below).
A Cost of the Diet Analysis Wadi Bissam, Kanem region, Chad.
16 |
Thus, for the purpose of this analysis a household size of 6 was used, representing the average
number of individuals in a very poor family: a man, a woman and 4 children. As the estimates of
household income for this typical family are based on an energy requirement of 6 x 2,100 kcals, or
12,600 kcal in total, the Cost of the Diet method identifies a family of the same individuals that require
as close to 12,600 kcal as possible. The typical HEA/Cost of the Diet family consists of:
Child (either sex) 12-23 months
Child (either sex) 8-9 years
Child (either sex) 10-11 years
Child (either sex) 12-13 years
Man, 30-59 years, 50kg, moderately active
Woman, 30-59 years, 45kg, moderately active, lactating
The total energy requirement of this family is 12,671 kcal/ day.
In order to estimate a cost for poor, middle and better-off households for the purpose of
modelling, the composition of a typical household of 8, 11 and 16 individuals were also
calculated. The specifications can be found in Appendix 3.
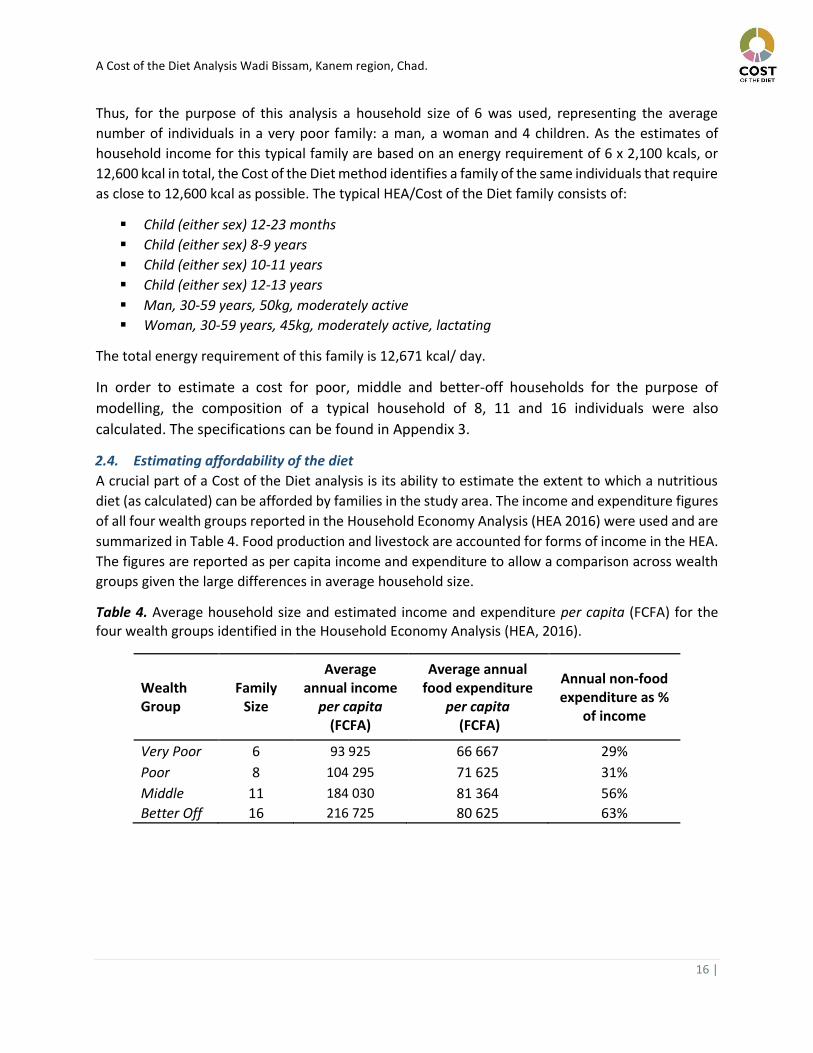
2.4. Estimating affordability of the diet
A crucial part of a Cost of the Diet analysis is its ability to estimate the extent to which a nutritious
diet (as calculated) can be afforded by families in the study area. The income and expenditure figures
of all four wealth groups reported in the Household Economy Analysis (HEA 2016) were used and are
summarized in Table 4. Food production and livestock are accounted for forms of income in the HEA.
The figures are reported as per capita income and expenditure to allow a comparison across wealth
groups given the large differences in average household size.
Table 4. Average household size and estimated income and expenditure per capita (FCFA) for the four wealth groups identified in the Household Economy Analysis (HEA, 2016).
Wealth Group
Family Size
Average annual income
per capita (FCFA)
Average annual food expenditure
per capita (FCFA)
Annual non-food expenditure as %
of income
Very Poor 6 93 925 66 667 29%
Poor 8 104 295 71 625 31%
Middle 11 184 030 81 364 56%
Better Off 16 216 725 80 625 63%
A Cost of the Diet Analysis Wadi Bissam, Kanem region, Chad.
17 |
3. RESULTS
The data collection team collected price and weight data for a total of 93 foods across a total of 6
markets in the Wadi Bissam region: 14 grains and grain-based products, 6 tubers, 7 legumes, nuts
and seeds, 15 types of meat, 6 types of fish, eggs, 3 milk products, 17 vegetables and vegetable
products, 10 fruits and fruit products, 3 fats and oils, 2 sugars, 7 spices and condiments, and 2
supplements. A detailed list of the food items as well as seasonal and annual average prices per 100g
can be found in Appendix 4.
3.1. Typical food consumption
The focus group discussions and interviews revealed that maize, rice, millet, dried okra, and dried
tomatoes are the staple foods in the Wadi Bissam region and these are consumed across all seasons.
Other foods that often feature in the diet are soumbala, dried carp, beans, sorrel, doum powder,
pasta, onions, spirulina, salt, and sugar, which are consumed on a regular basis. According to the
recent ECHO baseline survey for Kanem (2017), the average Household Dietary Diversity score (HDDS)
is 5, with 97% of households consuming cereals, 93% consuming sugar or honey, 87% consuming oil
or fat, 67% consuming condiments, and 48% consuming vegetables, revealing a slight discrepancy
with the diversity reported during discussions. 2
Responses indicated that kept animals are rarely slaughtered for home consumption, and mostly for
special occasions (approximately once a year). Wild foods, such as savonnier (balanites aegyptiaca),
jujube or doum were foraged and consumed when available during the dry season (short periods).
Similarly, the ECHO baseline revealed that only 2% of households consume wild foods. The HEA (2016)
revealed high per capita consumption of sugar between 30g to 120g daily (very poor and better off
respectively), which is typically used to sweeten tea. Thus, current consumption of sugar may be
exceeding WHO recommended sugar intake levels (below 10% of total energy intake) posing
significant health risks (WHO, 2015a). Tea drinking practice is inextricably linked to sugar
consumption, as black tea is highly sweetened and drank during the day and around meal times.
Drinking tea close to meals may also inhibit the absorption of iron due to iron-binding polyphenols
(WHO/FAO, 2004).
Focus group discussions also revealed that dietary habits generally remain the same across seasons,
as no other foods are available. Nevertheless, the number of meals per day may vary depending on
food availability and income to purchase these. Typically, families consume between 2 to 3 meals per
day. However, during the dry season, when food is scarce, only 1 to 2 meals are consumed per day.
Respondents showed awareness of the importance of children’s nutrition, reporting a practice of
setting food aside specifically for children, maintaining a meal frequency of 2 to 3 times a day even
when food is scarce.
It was reported that mostly the women and the head of the household purchase the food from the
market, which are held on a weekly basis all year round. All community members interviewed
reported purchasing their food at the weekly held market. The participants lived within a 5 to 20
2 The figures reported were taken from the unpublished ECHO baseline survey Excel database.
A Cost of the Diet Analysis Wadi Bissam, Kanem region, Chad.
18 |
minutes walking distance from the market place and, therefore, did not have any access problems.
The communities reported that water pumps are also available within a 5 to 20 minutes walking
distance and, therefore, had access to water.
Women were asked if there were any foods that they would consume but cannot be afforded; among
these: oil, rice, milk, meat, guava, mango, banana, avocado, potatoes, tomatoes, lettuce, powdered
milk ,lentils, couscous, chicken, orange, liver and sugar cane. As part of the focus group discussion
themes, food taboos were also discussed. All communities mentioned a variety of taboos concerning
a number of foods due to religious and customary believes: dog, horse, pig, donkey, cat, snake, and
rat. The ‘Tourndjeur’ tribe, which lives in Mondo, doesn’t eat or touch the meat, eggs, or oil of
ostriches, because they believe that it is harmful for the organism and may cause allergies. Taboo
foods due to health concerns were only identified for individuals, but these did not reflect the wider
community. No taboo foods for specific groups of individuals, such as children, were identified. The
women indicated that there are no foods excluded out of the diet because only few aliments are
available in the region.
It was discussed whether individuals at risk, such as children, pregnant, or lactating women, or sick
people receive any special foods. Among the foods given to 6-23 months old children, the mothers
mentioned enriched porridge, which is prepared out of maize, millet, or rice flour, beans, peanuts,
sugar, milk, savonier, and peanut oil; meat soup out of sheep or goat, potatoes, sweet potatoes,
bananas, goat milk, a bit of lemon, tomatoes, carrots, and rarely eggs, if the families have access to
it or can afford it. The communities believe that these foods contain vitamins and avoid malnutrition.
There are no special foods given to pregnant women. The focus group discussions revealed that they
eat the same as the rest of the household, mostly because the families cannot afford other foods.
When possible, bouillie is sometimes prepared for pregnant women. However, the discussions also
revealed that there are no special foods given to pregnant women, because it is believed that if the
women eat too much, the baby grows too much and will cause problems during delivery. The Analyse
qualitative des Causes de la Malnutrition (ACF, 2012) indicated that pregnant women purposefully
reduce the amount of food consumed during the last trimester (referred to as “voluntary anorexia”),
as they believe that the baby will be born smaller and, thus, delivering the baby will be easier.
The interviewed women reported that pregnant women take iron and folic acid supplements, which
are given to them for free at the hospital. However it should be noted that the interviews took place
in villages with access to local health centres. According to OCHA (2016) there are only 153 health
centers in the whole Kanem region, 17% of which are not operating. If possible, enriched porridge,
powdered milk, forested fruits, or meat soup are given to lactating women to strengthen them after
the delivery, to stop the bleedings and to enrich the breast milk. These foods and rarely liver are also
given to sick people to give them strength and to allow them to fully recover.
3.2. Food availability and markets
All markets in Wadi Bissam are weekly village markets and consisted mostly of small traders clustered
close to the village centers. Markets start operating around 11 am to allow traders from other villages
to travel to the markets. The lack of fresh produce, eggs (mostly found already boiled) and dairy
A Cost of the Diet Analysis Wadi Bissam, Kanem region, Chad.
19 |
products was evident across the livelihood zone. Fresh fruit and vegetables were seldom encountered
and found in small quantity. However, the survey was conducted shortly after the rainfed season and
at the start of the dry season; consequently, there was a higher availability of cereals, legumes and
fresh meat, while vegetables would normally become available later in the dry season, after harvest.
There was little availability of butter and the team did not encounter fresh milk sellers during data
collection. The limited data on these products was a limitation to the study. The most common foods
across markets were: dried grains, legumes, peanuts, dried okra, dried tomatoes, fresh and dried
meat.
The foods that are not found during data collection are automatically omitted from the analysis, as
no price or weight data can be collected. Therefore, the results for the seasons for which data was
gathered retrospectively would potentially change once real time data has been collected, and newly
available foods added to the analysis.
During the survey, no iodized salt was found at the markets. In 2 out of the 6 markets, the team
encountered PlumpyNut and Super Cereal Plus (WFP) being sold. The origin of these stocks were not
easily identified, as traders were not forthcoming about their sources.
3.3. Cost of the Diet
Table 5 is a summary of the cost of all diets calculated by the software. The average cost estimates
take into account seasonal variations across the year. The analysis revealed that across all diets the
requirements can be met using locally available foods, reflecting the small yet varied list of food items
found across markets in Wadi Bissam. The analysis found that a nutritious diet is approximately twice
the cost of an energy only diet, reflecting the high cost of meeting fat, protein and micronutrient
requirements compared to only meeting energy requirements. The cost of the food habits nutritious
diet is 1.5 times greater than the cost of the nutritious diet. In the FHAB diet, the software applies
minimum and maximum weekly food constraints to reflect the dietary habits as a results of the
interviews conducted. Thus, the elevated cost of the FHAB diet is indicative of the higher cost of
meeting nutrient specifications when accounting for dietary habits.
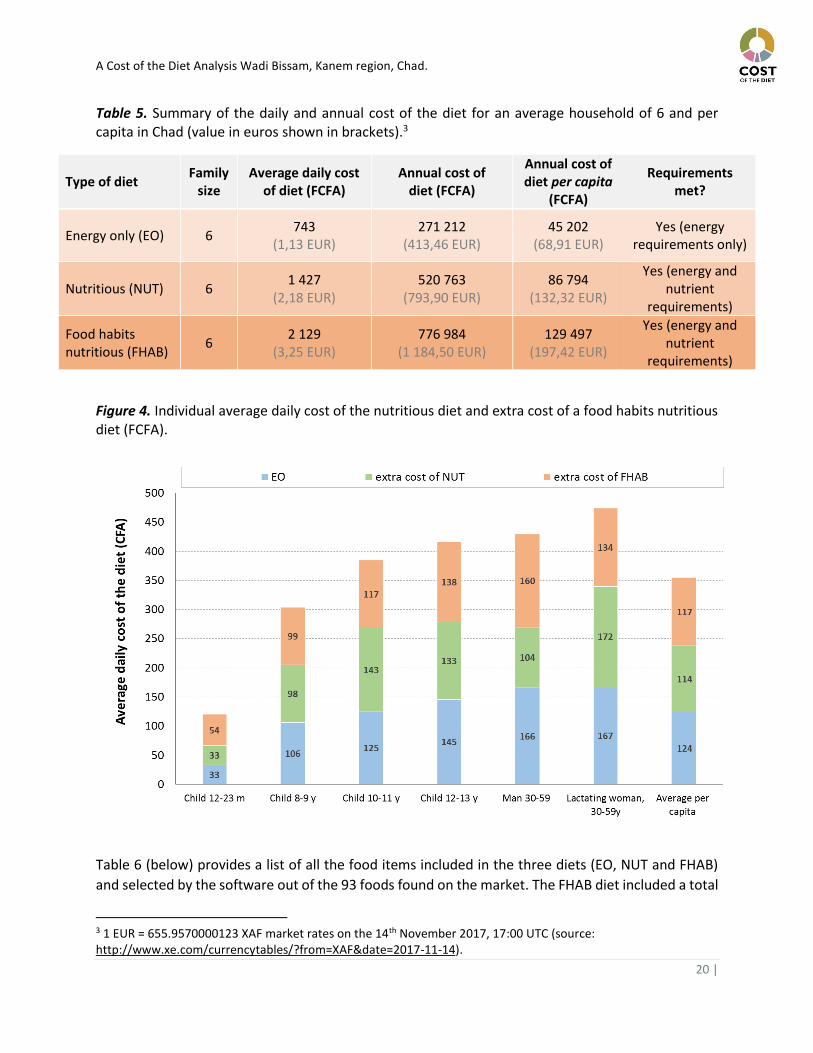
Figure 4 further illustrates the additional cost of the nutritious and food habits nutritious diet
compared to an energy only diet, providing a breakdown of the cost of the diet for each individual in
an average family of 6 (very poor). The analysis revealed that the highest cost of the diet (across all
three diets was for a lactating woman, followed by an adult man, child 12 to 13 years, child 10 to 11
years, child 8 to 9 years and a child 12 to 23 months.
A Cost of the Diet Analysis Wadi Bissam, Kanem region, Chad.
20 |
Table 5. Summary of the daily and annual cost of the diet for an average household of 6 and per capita in Chad (value in euros shown in brackets).3
Type of diet Family
size Average daily cost
of diet (FCFA) Annual cost of
diet (FCFA)
Annual cost of diet per capita
(FCFA)
Requirements met?
Energy only (EO) 6 743
(1,13 EUR) 271 212
(413,46 EUR) 45 202
(68,91 EUR) Yes (energy
requirements only)
Nutritious (NUT) 6 1 427
(2,18 EUR) 520 763
(793,90 EUR) 86 794
(132,32 EUR)
Yes (energy and nutrient
requirements)
Food habits nutritious (FHAB)
6 2 129
(3,25 EUR) 776 984
(1 184,50 EUR) 129 497
(197,42 EUR)
Yes (energy and nutrient
requirements)
Figure 4. Individual average daily cost of the nutritious diet and extra cost of a food habits nutritious diet (FCFA).
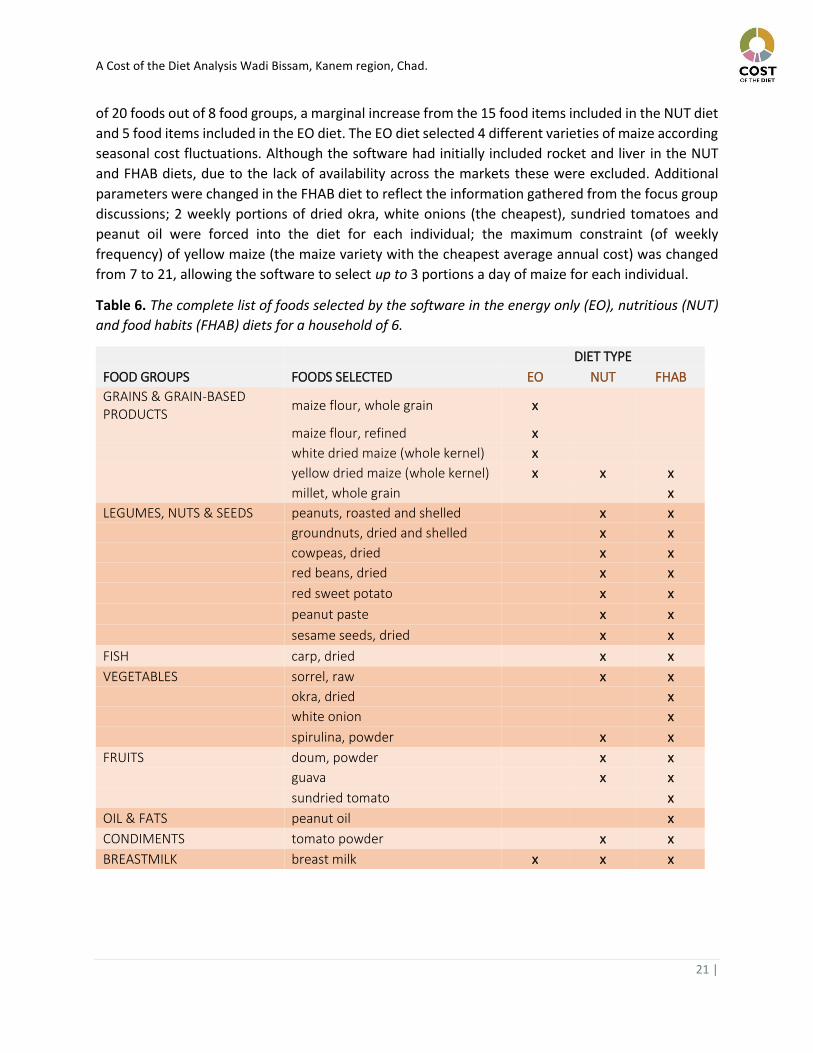
Table 6 (below) provides a list of all the food items included in the three diets (EO, NUT and FHAB)
and selected by the software out of the 93 foods found on the market. The FHAB diet included a total
3 1 EUR = 655.9570000123 XAF market rates on the 14th November 2017, 17:00 UTC (source: http://www.xe.com/currencytables/?from=XAF&date=2017-11-14).
A Cost of the Diet Analysis Wadi Bissam, Kanem region, Chad.
21 |
of 20 foods out of 8 food groups, a marginal increase from the 15 food items included in the NUT diet
and 5 food items included in the EO diet. The EO diet selected 4 different varieties of maize according
seasonal cost fluctuations. Although the software had initially included rocket and liver in the NUT
and FHAB diets, due to the lack of availability across the markets these were excluded. Additional
parameters were changed in the FHAB diet to reflect the information gathered from the focus group
discussions; 2 weekly portions of dried okra, white onions (the cheapest), sundried tomatoes and
peanut oil were forced into the diet for each individual; the maximum constraint (of weekly
frequency) of yellow maize (the maize variety with the cheapest average annual cost) was changed
from 7 to 21, allowing the software to select up to 3 portions a day of maize for each individual.
Table 6. The complete list of foods selected by the software in the energy only (EO), nutritious (NUT)
and food habits (FHAB) diets for a household of 6.
DIET TYPE
FOOD GROUPS FOODS SELECTED EO NUT FHAB
GRAINS & GRAIN-BASED PRODUCTS
maize flour, whole grain x
maize flour, refined x
white dried maize (whole kernel) x
yellow dried maize (whole kernel) x x x
millet, whole grain x
LEGUMES, NUTS & SEEDS peanuts, roasted and shelled x x
groundnuts, dried and shelled x x
cowpeas, dried x x
red beans, dried x x
red sweet potato x x
peanut paste x x
sesame seeds, dried x x
FISH carp, dried x x
VEGETABLES sorrel, raw x x
okra, dried x
white onion x
spirulina, powder x x
FRUITS doum, powder x x
guava x x
sundried tomato x
OIL & FATS peanut oil x
CONDIMENTS tomato powder x x
BREASTMILK breast milk x x x
A Cost of the Diet Analysis Wadi Bissam, Kanem region, Chad.
22 |
3.3.1. Energy only diet (EO)
The daily cost of an energy only diet (a diet that meets the energy requirements of a standard family of 6) has been estimated at 702 FCFA at the time of the survey (November 2017), 740 FCFA in the wet season and 752 FCFA in the previous dry season, varying according to seasonal food availability and price variation. The dry season (2016 – 2017) was the most expensive season, reflecting a higher cost of maize. The annual average cost was estimated at 271 212 FCFA.
The diet includes 5 food items: 4 types of maize products and breast milk (for the child 12-23 months). Around three fifths of the energy are sourced from whole dried kernel of yellow maize (61.3%), representing the cheapest source of calories on the market. A detailed breakdown of the annual diet calculated by the software can be found in Appendix 6, which shows the weight and cost of the food items included, and the percentage contribution of each to energy, protein, fat, vitamin and mineral requirements. Breast milk requirement for the child 12-23 months has been accounted for in the diet by including 532g of breast milk (daily) to the child’s diet at a zero cost. The mother’s additional energy required during lactation has also been accounted for and an additional 460 kcal added to the woman’s daily energy requirements, thus included in the overall estimated cost.
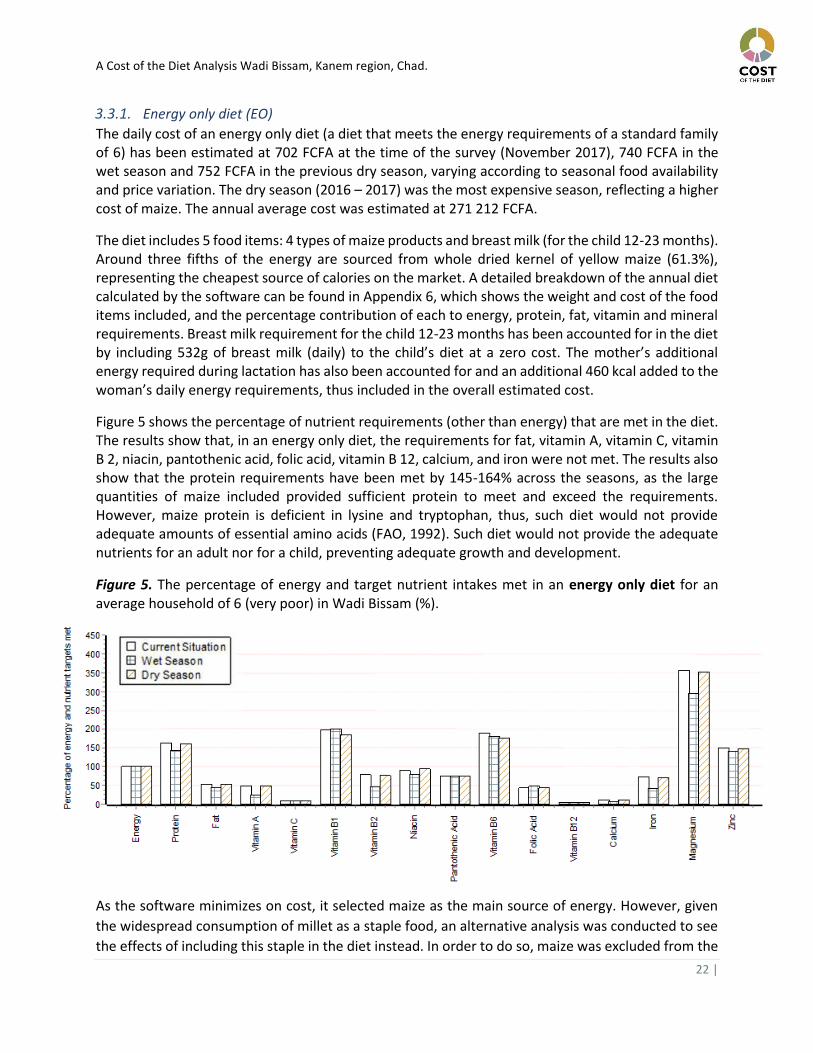
Figure 5 shows the percentage of nutrient requirements (other than energy) that are met in the diet. The results show that, in an energy only diet, the requirements for fat, vitamin A, vitamin C, vitamin B 2, niacin, pantothenic acid, folic acid, vitamin B 12, calcium, and iron were not met. The results also show that the protein requirements have been met by 145-164% across the seasons, as the large quantities of maize included provided sufficient protein to meet and exceed the requirements. However, maize protein is deficient in lysine and tryptophan, thus, such diet would not provide adequate amounts of essential amino acids (FAO, 1992). Such diet would not provide the adequate nutrients for an adult nor for a child, preventing adequate growth and development.
Figure 5. The percentage of energy and target nutrient intakes met in an energy only diet for an average household of 6 (very poor) in Wadi Bissam (%).
As the software minimizes on cost, it selected maize as the main source of energy. However, given
the widespread consumption of millet as a staple food, an alternative analysis was conducted to see
the effects of including this staple in the diet instead. In order to do so, maize was excluded from the
A Cost of the Diet Analysis Wadi Bissam, Kanem region, Chad.
23 |
list of foods (by applying 0 to 0 minimum and maximum weekly constraints) and the standard portion
size4 of millet was set at 65g (as maize). The changes led to the inclusion of 1,064kg of millet, meeting
83.7% of the energy requirements of a standard family of 6. The diet also included doum powder
(101kg) and groundnut (45kg), thus identifying these foods as the next energy-dense and low cost
options. With the inclusion of millet, the overall cost of the EO diet was estimated at 353 317 FCFA,
thus an increase of 30% in cost. The increase reflects the higher cost of millet across the year
compared to maize.
3.3.2. Micronutrient nutritious diet (NUT)
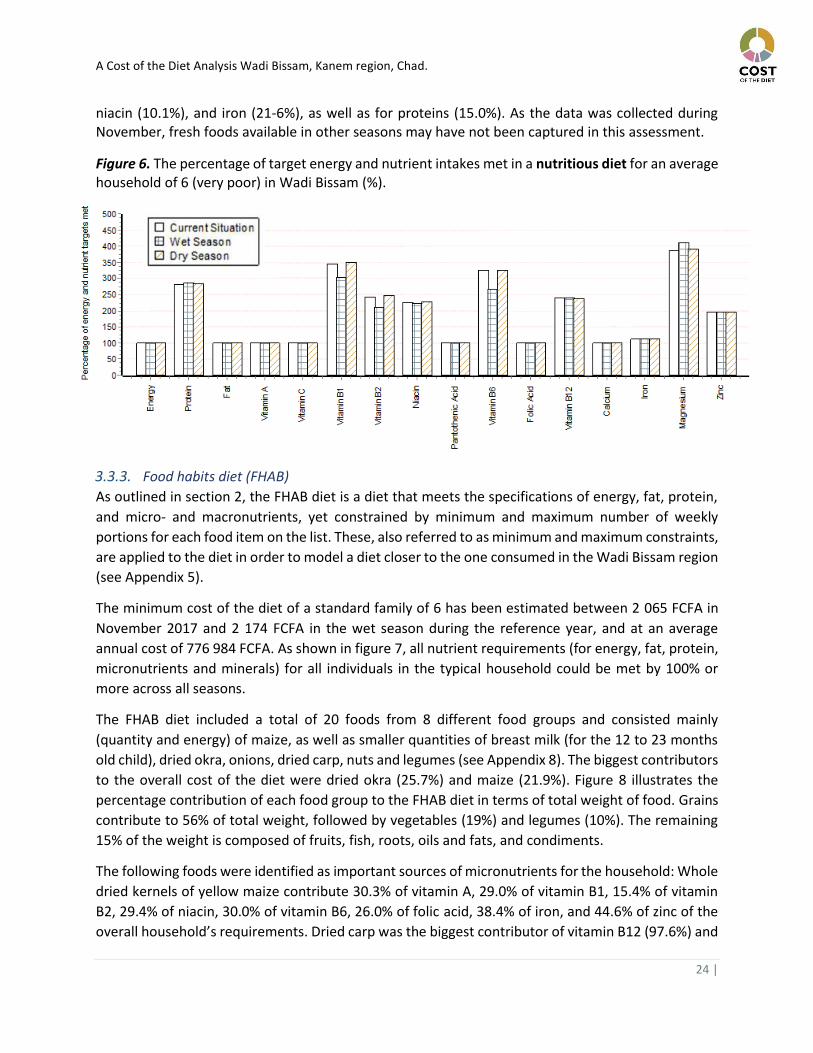
The minimum cost of the diet that meets macro- and micronutrient requirements of a standard family
of 6 has been estimated between 1 311 FCFA in November 2017 and 1 481 FCFA in the wet season
during the reference year. As shown in figure 4, all nutrient requirements (for energy, fat, protein,
micronutrients and minerals) for all individuals in the typical household could be met by 100% or
more across all seasons (see Figure 6).
Seasonal fluctuations in percentage of nutrient requirements met are due to the price variations of
foods across the seasons. As the software aims to calculate the cheapest diet, it chooses the least
expensive combination of foods that meet the requirements. As the composition of the diet changes,
the percentage of nutrient requirements that are met also varies across the seasons.
The nutritious diet included a total of 15 foods from 8 different food groups and consisted mainly (quantity and energy) of maize, as well as smaller quantities of breast milk (for the 12 to 23 months
old child), dried carp, nuts and legumes (see Appendix 7). The biggest contributors to the overall cost of the diet were maize (34.7%) and dried carp (18.8%), which were also identified as an important source of micronutrients for the household. In particular, whole dried kernels of yellow maize contribute, inter alia, to 32.2% of vitamin A, 36.1% of vitamin B1, 41.5% of vitamin B6, 41.4% of iron, and 49.8% of zinc of the overall household’s requirements.
Dried carp was the biggest contributor of vitamin B12 (98.3%) and of calcium (72.9%). The main sources of the household’s fat requirements were roasted and dried peanuts (16.4% and 28.9%, respectively).Together, the two also contribute a substantial amount of vitamin B1 (9.8%), niacin (27.8%), folic acid (16.9%), and zinc (11.2%).
Dried, powdered doum fruit was a leading contributor of vitamin B1 (27.9%), B2 (29.0%), and B6 (39.6%) in the calculated diet. As one of the only fresh fruits of the diet, guava contributes 48.5% of Vitamin C. Spirulina is an important source for micronutrients, such as vitamin B1 (16.7%), B2 (35.5%),
4 Standard portion sizes are scaled up for each individual according to energy requirements. Please refer to COTD (2014) guidelines (p. 127) for details.
A Cost of the Diet Analysis Wadi Bissam, Kanem region, Chad.
24 |
niacin (10.1%), and iron (21-6%), as well as for proteins (15.0%). As the data was collected during November, fresh foods available in other seasons may have not been captured in this assessment.
Figure 6. The percentage of target energy and nutrient intakes met in a nutritious diet for an average household of 6 (very poor) in Wadi Bissam (%).
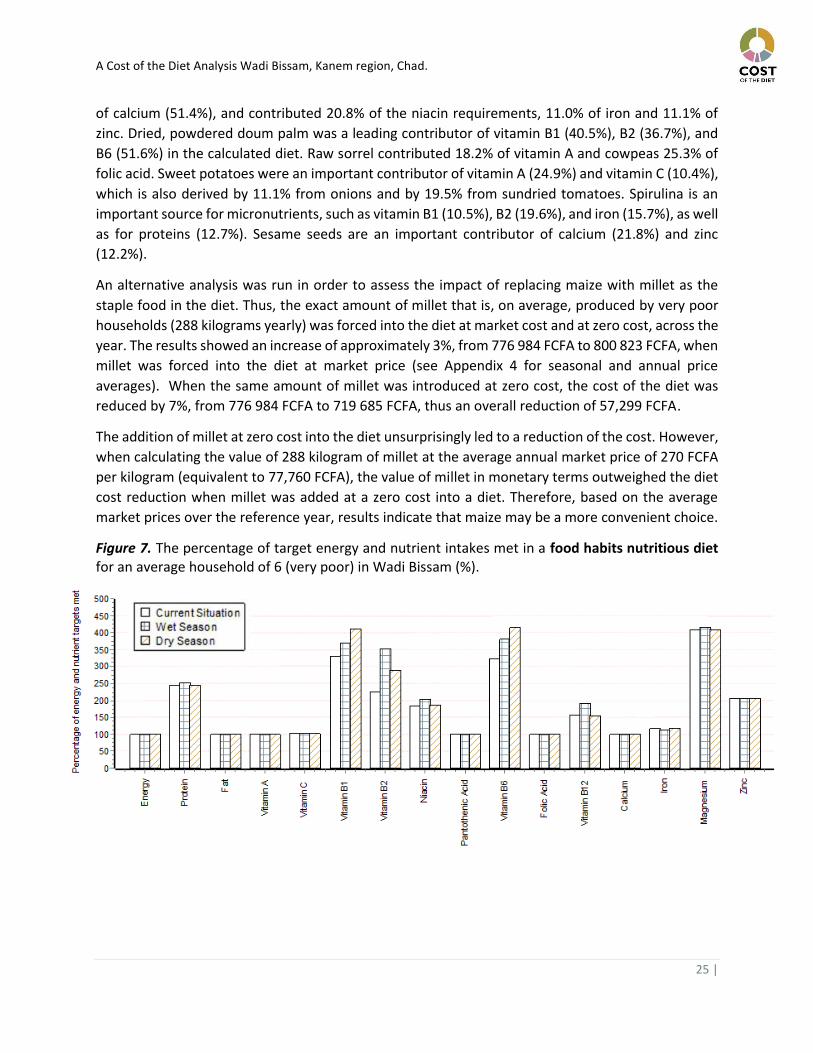
3.3.3. Food habits diet (FHAB)
As outlined in section 2, the FHAB diet is a diet that meets the specifications of energy, fat, protein,
and micro- and macronutrients, yet constrained by minimum and maximum number of weekly
portions for each food item on the list. These, also referred to as minimum and maximum constraints,
are applied to the diet in order to model a diet closer to the one consumed in the Wadi Bissam region
(see Appendix 5).
The minimum cost of the diet of a standard family of 6 has been estimated between 2 065 FCFA in
November 2017 and 2 174 FCFA in the wet season during the reference year, and at an average
annual cost of 776 984 FCFA. As shown in figure 7, all nutrient requirements (for energy, fat, protein,
micronutrients and minerals) for all individuals in the typical household could be met by 100% or
more across all seasons.
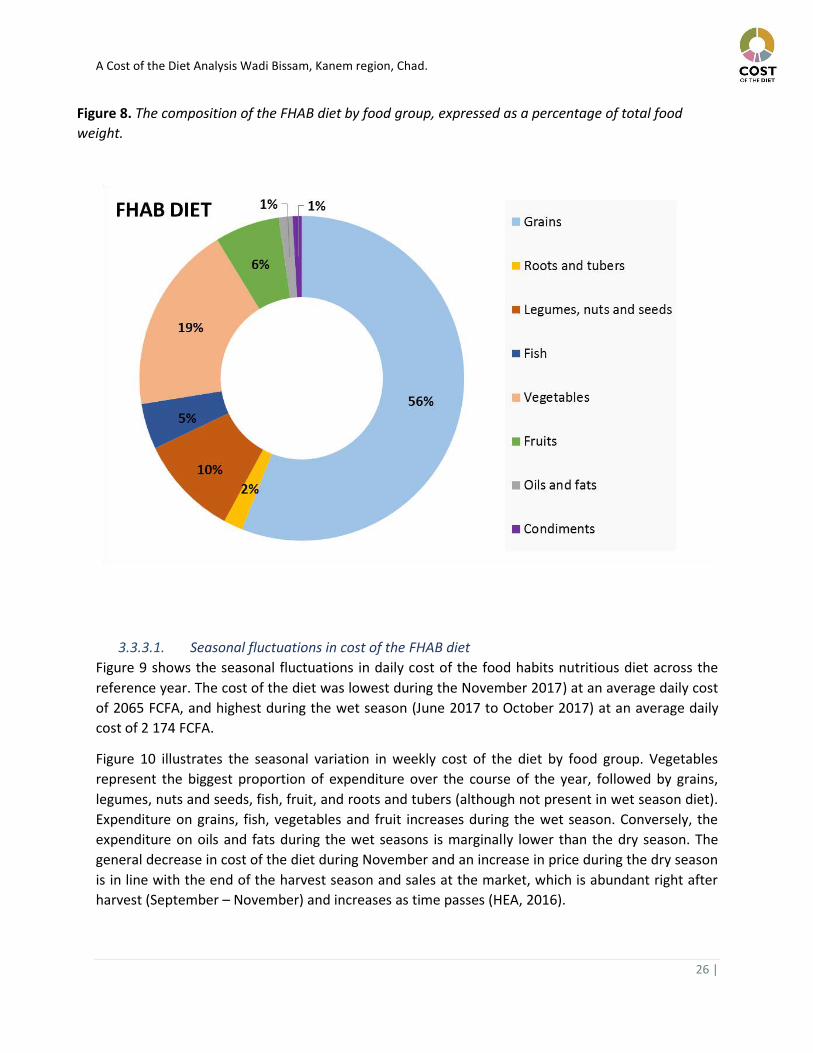
The FHAB diet included a total of 20 foods from 8 different food groups and consisted mainly
(quantity and energy) of maize, as well as smaller quantities of breast milk (for the 12 to 23 months
old child), dried okra, onions, dried carp, nuts and legumes (see Appendix 8). The biggest contributors
to the overall cost of the diet were dried okra (25.7%) and maize (21.9%). Figure 8 illustrates the
percentage contribution of each food group to the FHAB diet in terms of total weight of food. Grains
contribute to 56% of total weight, followed by vegetables (19%) and legumes (10%). The remaining
15% of the weight is composed of fruits, fish, roots, oils and fats, and condiments.
The following foods were identified as important sources of micronutrients for the household: Whole
dried kernels of yellow maize contribute 30.3% of vitamin A, 29.0% of vitamin B1, 15.4% of vitamin
B2, 29.4% of niacin, 30.0% of vitamin B6, 26.0% of folic acid, 38.4% of iron, and 44.6% of zinc of the
overall household’s requirements. Dried carp was the biggest contributor of vitamin B12 (97.6%) and
A Cost of the Diet Analysis Wadi Bissam, Kanem region, Chad.
25 |
of calcium (51.4%), and contributed 20.8% of the niacin requirements, 11.0% of iron and 11.1% of
zinc. Dried, powdered doum palm was a leading contributor of vitamin B1 (40.5%), B2 (36.7%), and
B6 (51.6%) in the calculated diet. Raw sorrel contributed 18.2% of vitamin A and cowpeas 25.3% of
folic acid. Sweet potatoes were an important contributor of vitamin A (24.9%) and vitamin C (10.4%),
which is also derived by 11.1% from onions and by 19.5% from sundried tomatoes. Spirulina is an
important source for micronutrients, such as vitamin B1 (10.5%), B2 (19.6%), and iron (15.7%), as well
as for proteins (12.7%). Sesame seeds are an important contributor of calcium (21.8%) and zinc
(12.2%).
An alternative analysis was run in order to assess the impact of replacing maize with millet as the
staple food in the diet. Thus, the exact amount of millet that is, on average, produced by very poor
households (288 kilograms yearly) was forced into the diet at market cost and at zero cost, across the
year. The results showed an increase of approximately 3%, from 776 984 FCFA to 800 823 FCFA, when
millet was forced into the diet at market price (see Appendix 4 for seasonal and annual price
averages). When the same amount of millet was introduced at zero cost, the cost of the diet was
reduced by 7%, from 776 984 FCFA to 719 685 FCFA, thus an overall reduction of 57,299 FCFA.
The addition of millet at zero cost into the diet unsurprisingly led to a reduction of the cost. However,
when calculating the value of 288 kilogram of millet at the average annual market price of 270 FCFA
per kilogram (equivalent to 77,760 FCFA), the value of millet in monetary terms outweighed the diet
cost reduction when millet was added at a zero cost into a diet. Therefore, based on the average
market prices over the reference year, results indicate that maize may be a more convenient choice.
Figure 7. The percentage of target energy and nutrient intakes met in a food habits nutritious diet for an average household of 6 (very poor) in Wadi Bissam (%).
A Cost of the Diet Analysis Wadi Bissam, Kanem region, Chad.
26 |
Figure 8. The composition of the FHAB diet by food group, expressed as a percentage of total food
weight.
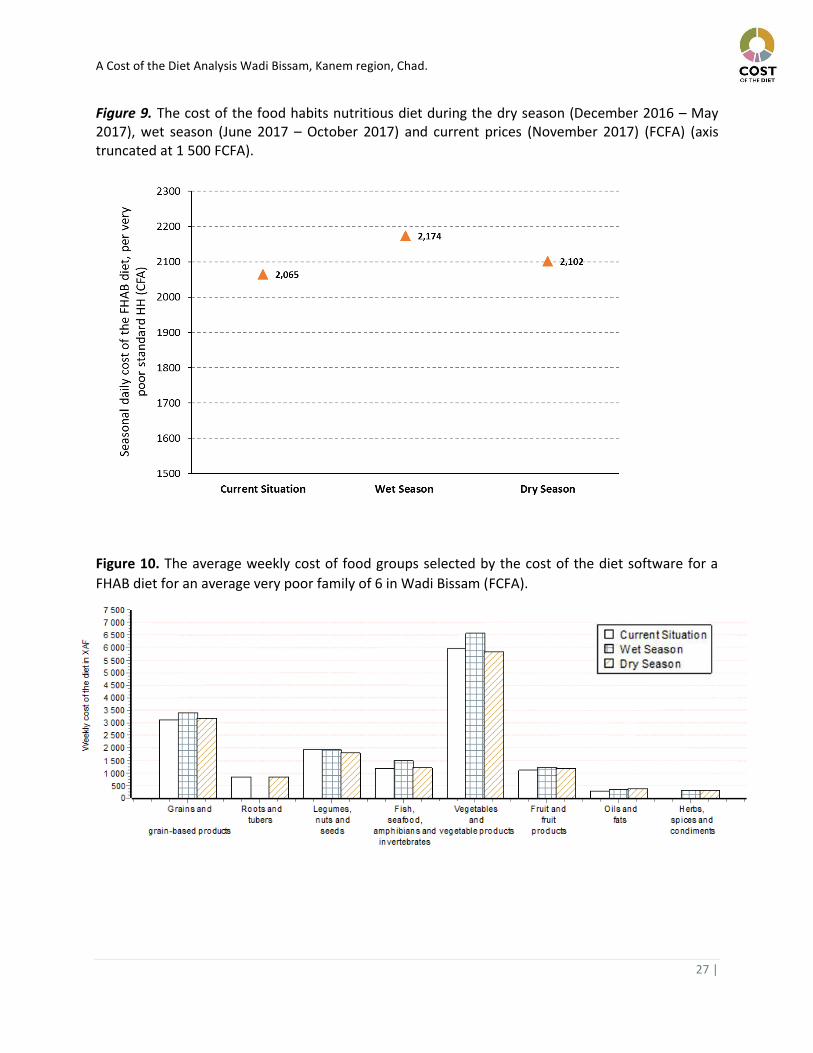
3.3.3.1. Seasonal fluctuations in cost of the FHAB diet
Figure 9 shows the seasonal fluctuations in daily cost of the food habits nutritious diet across the
reference year. The cost of the diet was lowest during the November 2017) at an average daily cost
of 2065 FCFA, and highest during the wet season (June 2017 to October 2017) at an average daily
cost of 2 174 FCFA.
Figure 10 illustrates the seasonal variation in weekly cost of the diet by food group. Vegetables
represent the biggest proportion of expenditure over the course of the year, followed by grains,
legumes, nuts and seeds, fish, fruit, and roots and tubers (although not present in wet season diet).
Expenditure on grains, fish, vegetables and fruit increases during the wet season. Conversely, the
expenditure on oils and fats during the wet seasons is marginally lower than the dry season. The
general decrease in cost of the diet during November and an increase in price during the dry season
is in line with the end of the harvest season and sales at the market, which is abundant right after
harvest (September – November) and increases as time passes (HEA, 2016).
A Cost of the Diet Analysis Wadi Bissam, Kanem region, Chad.
27 |
Figure 9. The cost of the food habits nutritious diet during the dry season (December 2016 – May 2017), wet season (June 2017 – October 2017) and current prices (November 2017) (FCFA) (axis truncated at 1 500 FCFA).
Figure 10. The average weekly cost of food groups selected by the cost of the diet software for a
FHAB diet for an average very poor family of 6 in Wadi Bissam (FCFA).
A Cost of the Diet Analysis Wadi Bissam, Kanem region, Chad.
28 |
3.4. Limiting nutrients analysis
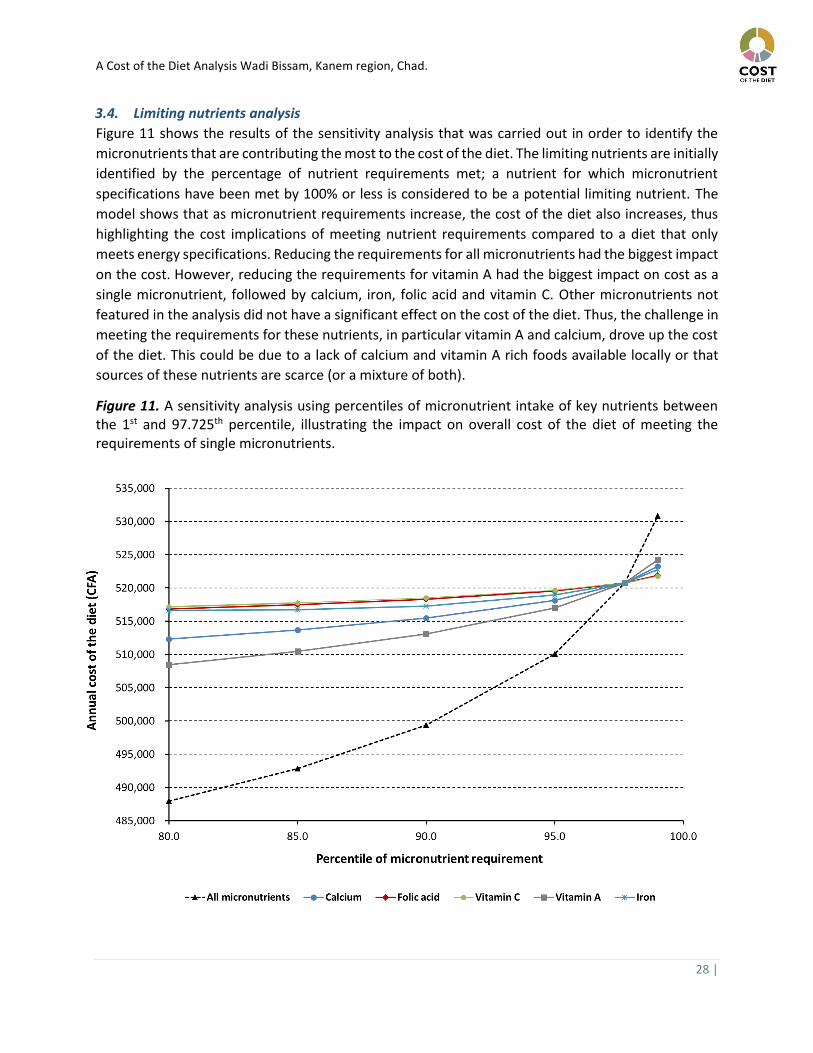
Figure 11 shows the results of the sensitivity analysis that was carried out in order to identify the
micronutrients that are contributing the most to the cost of the diet. The limiting nutrients are initially
identified by the percentage of nutrient requirements met; a nutrient for which micronutrient
specifications have been met by 100% or less is considered to be a potential limiting nutrient. The
model shows that as micronutrient requirements increase, the cost of the diet also increases, thus
highlighting the cost implications of meeting nutrient requirements compared to a diet that only
meets energy specifications. Reducing the requirements for all micronutrients had the biggest impact
on the cost. However, reducing the requirements for vitamin A had the biggest impact on cost as a
single micronutrient, followed by calcium, iron, folic acid and vitamin C. Other micronutrients not
featured in the analysis did not have a significant effect on the cost of the diet. Thus, the challenge in
meeting the requirements for these nutrients, in particular vitamin A and calcium, drove up the cost
of the diet. This could be due to a lack of calcium and vitamin A rich foods available locally or that
sources of these nutrients are scarce (or a mixture of both).
Figure 11. A sensitivity analysis using percentiles of micronutrient intake of key nutrients between the 1st and 97.725th percentile, illustrating the impact on overall cost of the diet of meeting the requirements of single micronutrients.
A Cost of the Diet Analysis Wadi Bissam, Kanem region, Chad.
29 |
3.5. Cost of the diet for vulnerable groups
The cost of the energy only, nutritious and food habits nutritious diets for children under five and
pregnant and lactating women was calculated.
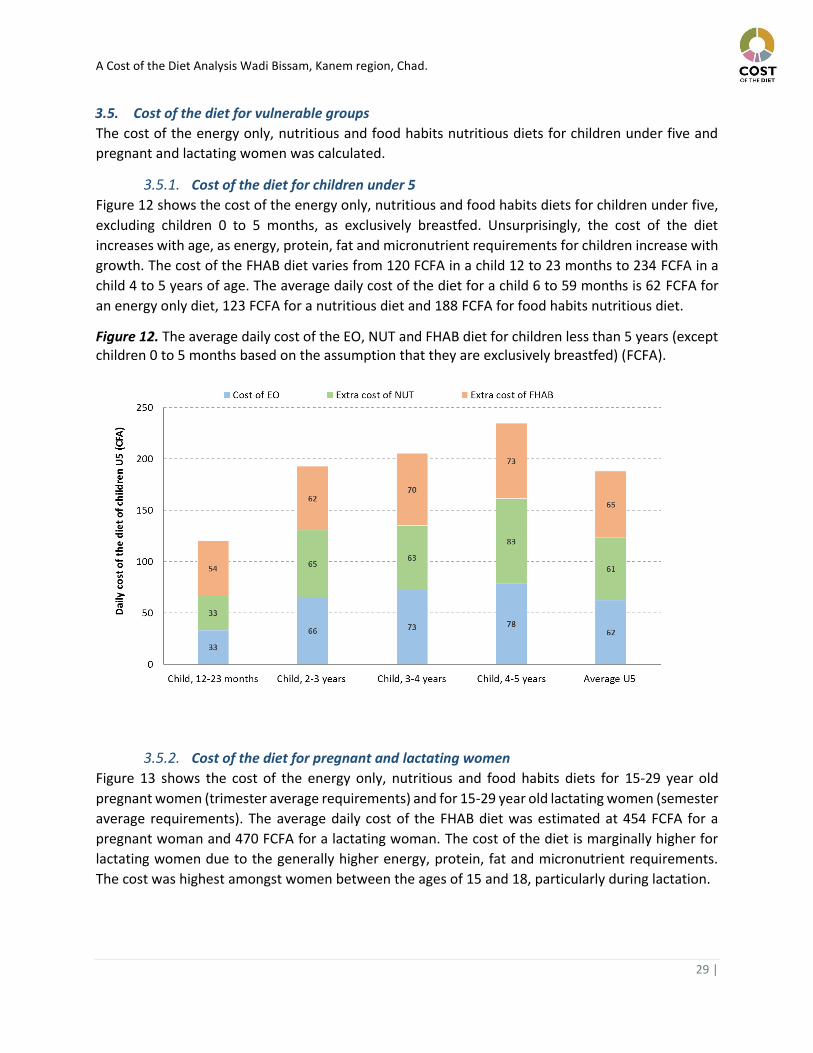
3.5.1. Cost of the diet for children under 5
Figure 12 shows the cost of the energy only, nutritious and food habits diets for children under five,
excluding children 0 to 5 months, as exclusively breastfed. Unsurprisingly, the cost of the diet
increases with age, as energy, protein, fat and micronutrient requirements for children increase with
growth. The cost of the FHAB diet varies from 120 FCFA in a child 12 to 23 months to 234 FCFA in a
child 4 to 5 years of age. The average daily cost of the diet for a child 6 to 59 months is 62 FCFA for
an energy only diet, 123 FCFA for a nutritious diet and 188 FCFA for food habits nutritious diet.
Figure 12. The average daily cost of the EO, NUT and FHAB diet for children less than 5 years (except children 0 to 5 months based on the assumption that they are exclusively breastfed) (FCFA).
3.5.2. Cost of the diet for pregnant and lactating women
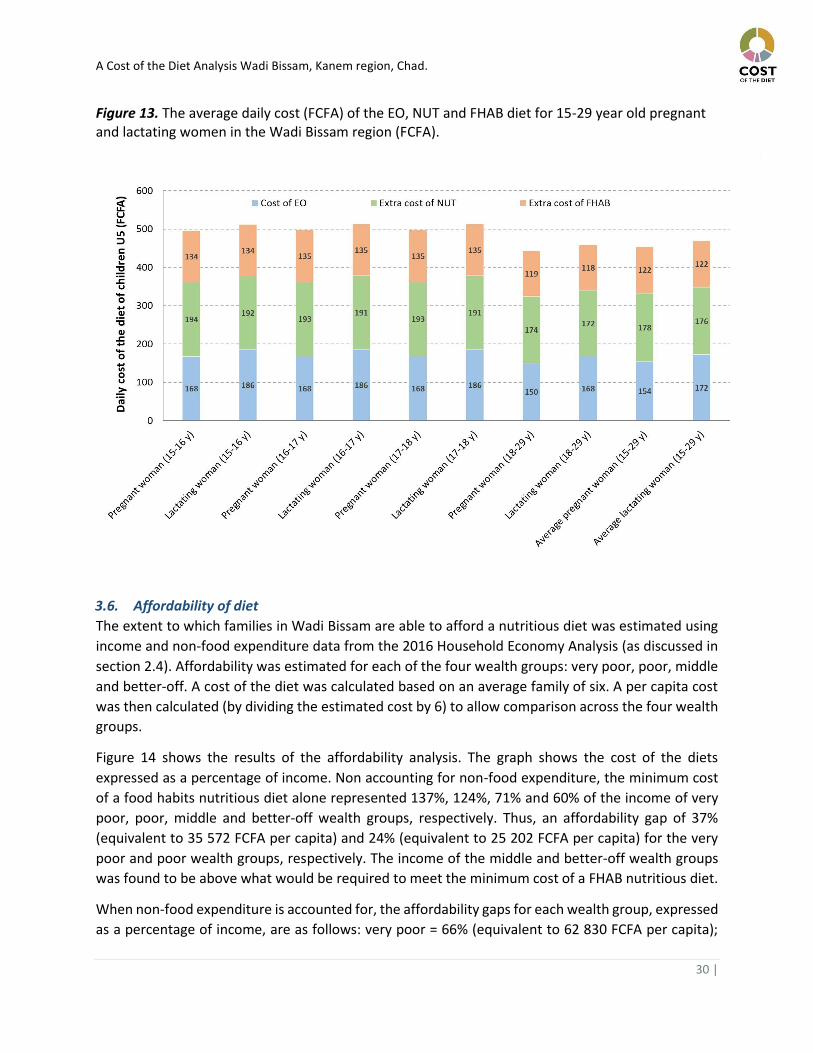
Figure 13 shows the cost of the energy only, nutritious and food habits diets for 15-29 year old
pregnant women (trimester average requirements) and for 15-29 year old lactating women (semester
average requirements). The average daily cost of the FHAB diet was estimated at 454 FCFA for a
pregnant woman and 470 FCFA for a lactating woman. The cost of the diet is marginally higher for
lactating women due to the generally higher energy, protein, fat and micronutrient requirements.
The cost was highest amongst women between the ages of 15 and 18, particularly during lactation.
A Cost of the Diet Analysis Wadi Bissam, Kanem region, Chad.
30 |
Figure 13. The average daily cost (FCFA) of the EO, NUT and FHAB diet for 15-29 year old pregnant and lactating women in the Wadi Bissam region (FCFA).
3.6. Affordability of diet
The extent to which families in Wadi Bissam are able to afford a nutritious diet was estimated using
income and non-food expenditure data from the 2016 Household Economy Analysis (as discussed in
section 2.4). Affordability was estimated for each of the four wealth groups: very poor, poor, middle
and better-off. A cost of the diet was calculated based on an average family of six. A per capita cost
was then calculated (by dividing the estimated cost by 6) to allow comparison across the four wealth
groups.
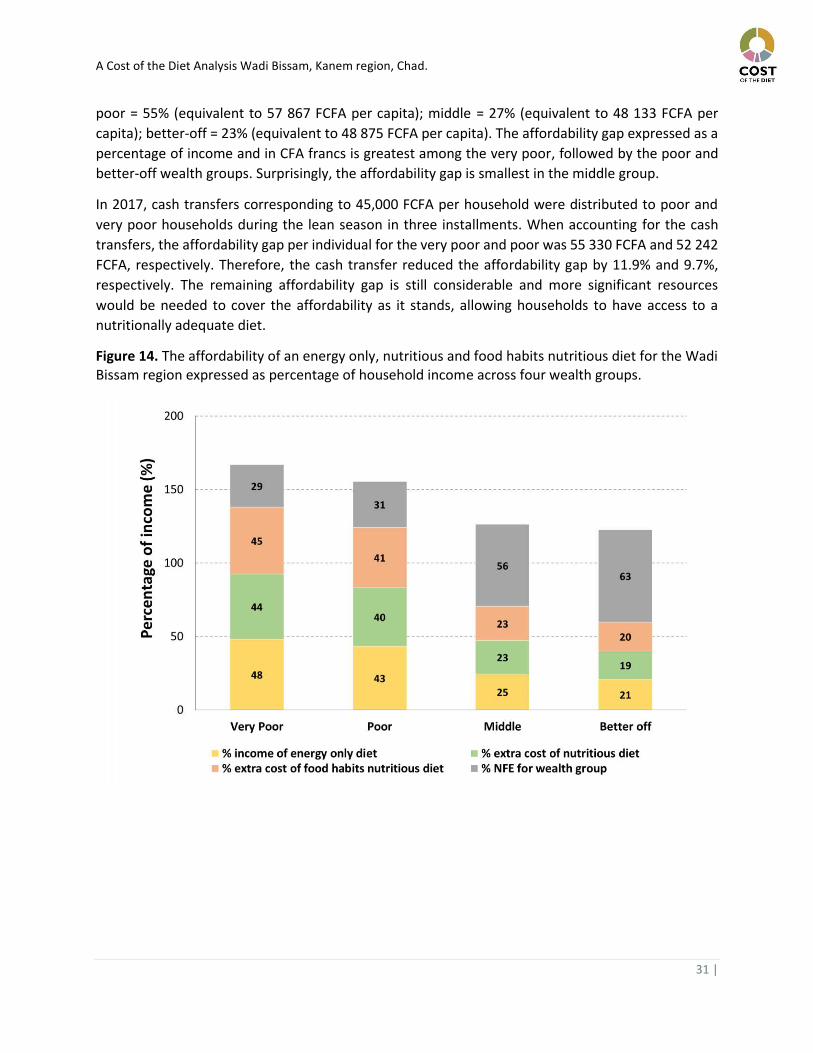
Figure 14 shows the results of the affordability analysis. The graph shows the cost of the diets
expressed as a percentage of income. Non accounting for non-food expenditure, the minimum cost
of a food habits nutritious diet alone represented 137%, 124%, 71% and 60% of the income of very
poor, poor, middle and better-off wealth groups, respectively. Thus, an affordability gap of 37%
(equivalent to 35 572 FCFA per capita) and 24% (equivalent to 25 202 FCFA per capita) for the very
poor and poor wealth groups, respectively. The income of the middle and better-off wealth groups
was found to be above what would be required to meet the minimum cost of a FHAB nutritious diet.
When non-food expenditure is accounted for, the affordability gaps for each wealth group, expressed
as a percentage of income, are as follows: very poor = 66% (equivalent to 62 830 FCFA per capita);
A Cost of the Diet Analysis Wadi Bissam, Kanem region, Chad.
31 |
poor = 55% (equivalent to 57 867 FCFA per capita); middle = 27% (equivalent to 48 133 FCFA per
capita); better-off = 23% (equivalent to 48 875 FCFA per capita). The affordability gap expressed as a
percentage of income and in CFA francs is greatest among the very poor, followed by the poor and
better-off wealth groups. Surprisingly, the affordability gap is smallest in the middle group.
In 2017, cash transfers corresponding to 45,000 FCFA per household were distributed to poor and
very poor households during the lean season in three installments. When accounting for the cash
transfers, the affordability gap per individual for the very poor and poor was 55 330 FCFA and 52 242
FCFA, respectively. Therefore, the cash transfer reduced the affordability gap by 11.9% and 9.7%,
respectively. The remaining affordability gap is still considerable and more significant resources
would be needed to cover the affordability as it stands, allowing households to have access to a
nutritionally adequate diet.
Figure 14. The affordability of an energy only, nutritious and food habits nutritious diet for the Wadi Bissam region expressed as percentage of household income across four wealth groups.
A Cost of the Diet Analysis Wadi Bissam, Kanem region, Chad.
32 |
3.7. Modelling the impact of scenarios on the cost of the diet
The cost of the diet software allows for the modelling of scenarios is order to showcase the effect of
changes to the diet on the cost or composition of the diet calculated. The following scenarios were
modelled for this assessment.
3.7.1. The impact of sugar consumption
As discussed in the earlier sections, sugar is an important commodity and is consumed abundantly
when households can afford to do so. Consumption varies between 30g and 120g per day, per person,
for very poor and better-off households, respectively (HEA, 2016).
The impact of a high consumption of sugar was modelled in the FHAB diet to observe the effect on
the cost. Two portions of rice a day, per person, per individual, were forced into the diet and no
changes in price were made. The amount of sugar forced into the diet is equivalent to a daily per
capita consumption of approximately 30g, equivalent to the average consumption among very poor
households. This caused a 5.7% increase in the cost of the FHAB diet.
The cost of the diet caps the energy intake of an individual at the 50th percentile, meeting the
requirement yet not exceeding. Thus, the forceful inclusion of calories form sugar forces the software
to include more nutrient rich, yet more expensive food items.
3.7.2. The impact of milk consumption on the cost of the diet
According to the HEA (2016), households in Wadi Bissam produce between 60 litres and 240 litres of
milk per year (very poor and better-off, respectively). In order to model the potential impact of milk
production on the diets of families across all wealth groups, the average milk production was
introduced into the diet at zero cost and up to 7 times per week. The standard portion size of milk
was recalculated based on the amount of milk available to the respective wealth groups. Goat’s milk
was used for the analysis as it is the most common amongst animals reared. Table 7 is a summary of
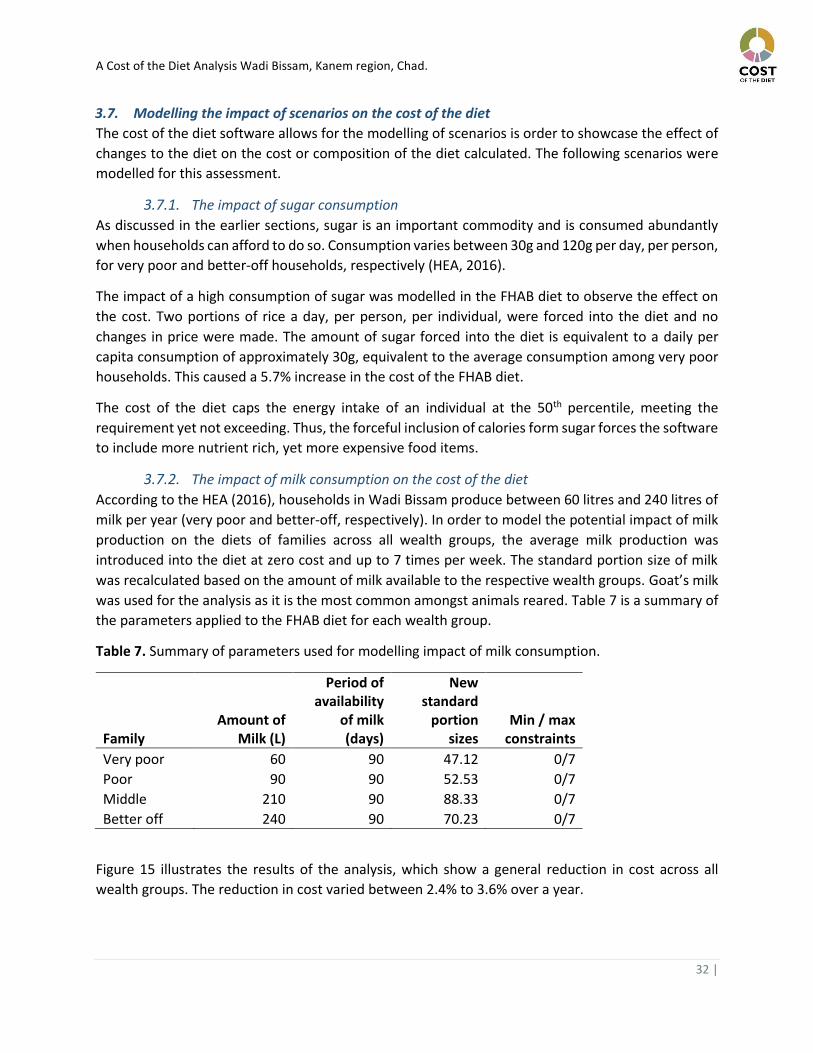
the parameters applied to the FHAB diet for each wealth group.
Table 7. Summary of parameters used for modelling impact of milk consumption.
Family Amount of
Milk (L)
Period of availability
of milk (days)
New standard
portion sizes
Min / max constraints
Very poor 60 90 47.12 0/7
Poor 90 90 52.53 0/7
Middle 210 90 88.33 0/7
Better off 240 90 70.23 0/7
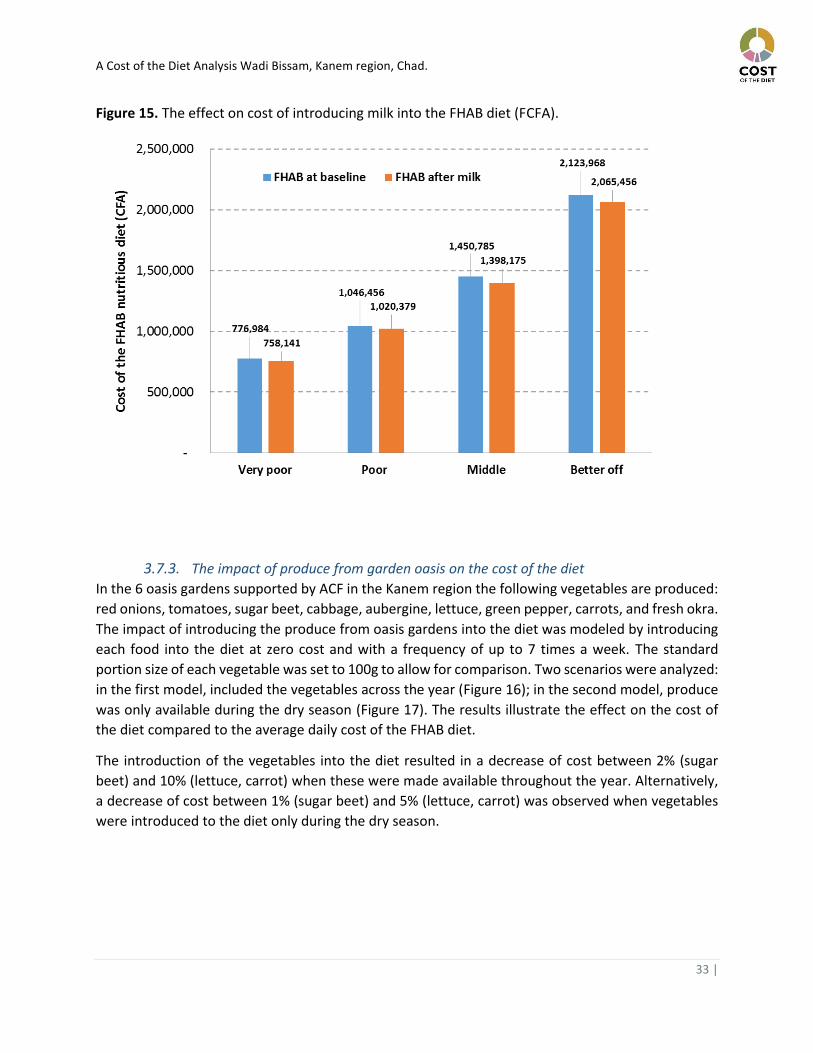
Figure 15 illustrates the results of the analysis, which show a general reduction in cost across all
wealth groups. The reduction in cost varied between 2.4% to 3.6% over a year.
A Cost of the Diet Analysis Wadi Bissam, Kanem region, Chad.
33 |
Figure 15. The effect on cost of introducing milk into the FHAB diet (FCFA).
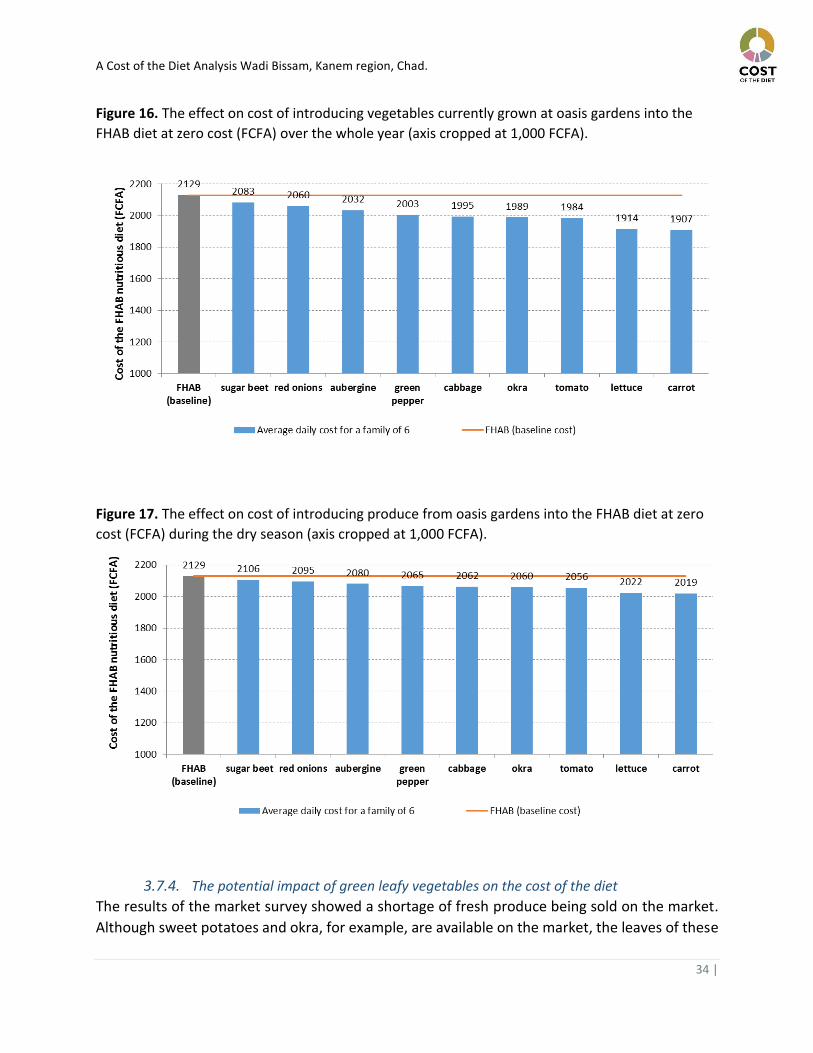
3.7.3. The impact of produce from garden oasis on the cost of the diet
In the 6 oasis gardens supported by ACF in the Kanem region the following vegetables are produced:
red onions, tomatoes, sugar beet, cabbage, aubergine, lettuce, green pepper, carrots, and fresh okra.
The impact of introducing the produce from oasis gardens into the diet was modeled by introducing
each food into the diet at zero cost and with a frequency of up to 7 times a week. The standard
portion size of each vegetable was set to 100g to allow for comparison. Two scenarios were analyzed:
in the first model, included the vegetables across the year (Figure 16); in the second model, produce
was only available during the dry season (Figure 17). The results illustrate the effect on the cost of
the diet compared to the average daily cost of the FHAB diet.
The introduction of the vegetables into the diet resulted in a decrease of cost between 2% (sugar
beet) and 10% (lettuce, carrot) when these were made available throughout the year. Alternatively,
a decrease of cost between 1% (sugar beet) and 5% (lettuce, carrot) was observed when vegetables
were introduced to the diet only during the dry season.
A Cost of the Diet Analysis Wadi Bissam, Kanem region, Chad.
34 |
Figure 16. The effect on cost of introducing vegetables currently grown at oasis gardens into the
FHAB diet at zero cost (FCFA) over the whole year (axis cropped at 1,000 FCFA).
Figure 17. The effect on cost of introducing produce from oasis gardens into the FHAB diet at zero
cost (FCFA) during the dry season (axis cropped at 1,000 FCFA).
3.7.4. The potential impact of green leafy vegetables on the cost of the diet
The results of the market survey showed a shortage of fresh produce being sold on the market.
Although sweet potatoes and okra, for example, are available on the market, the leaves of these
A Cost of the Diet Analysis Wadi Bissam, Kanem region, Chad.
35 |
plants are discarded, as these are not part of local cuisine. Green leafy vegetables are an excellent
source of micronutrients: these are rich in carotenoids, folate, vitamin C, vitamin K, iron, and
calcium (Adams, 2013). Therefore, the potential impact of possibly locally available green leafy
vegetables (such as sweet potato leaves, okra leaves, moringa leaves and cowpea leaves) on the
diet was modeled at zero cost, allowing up to 7 portions a week, over the whole year and only in
the dry season. The standard portion size of each vegetable was set to 100g to allow for
comparability.
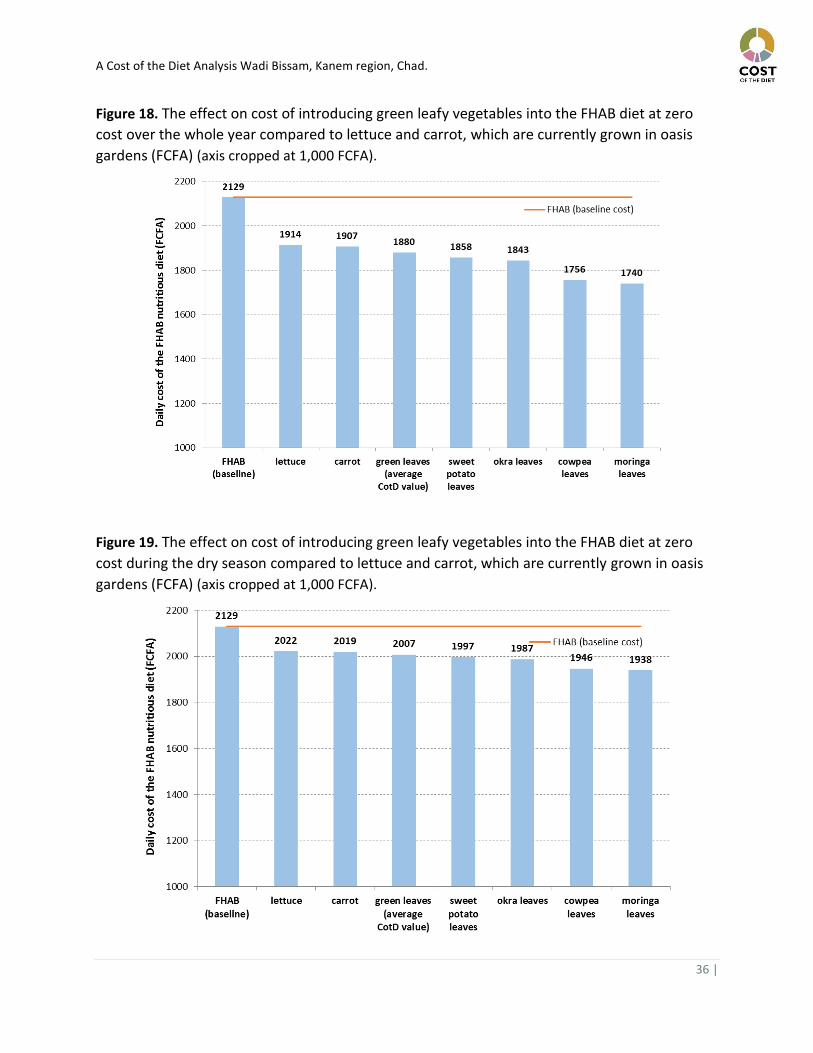
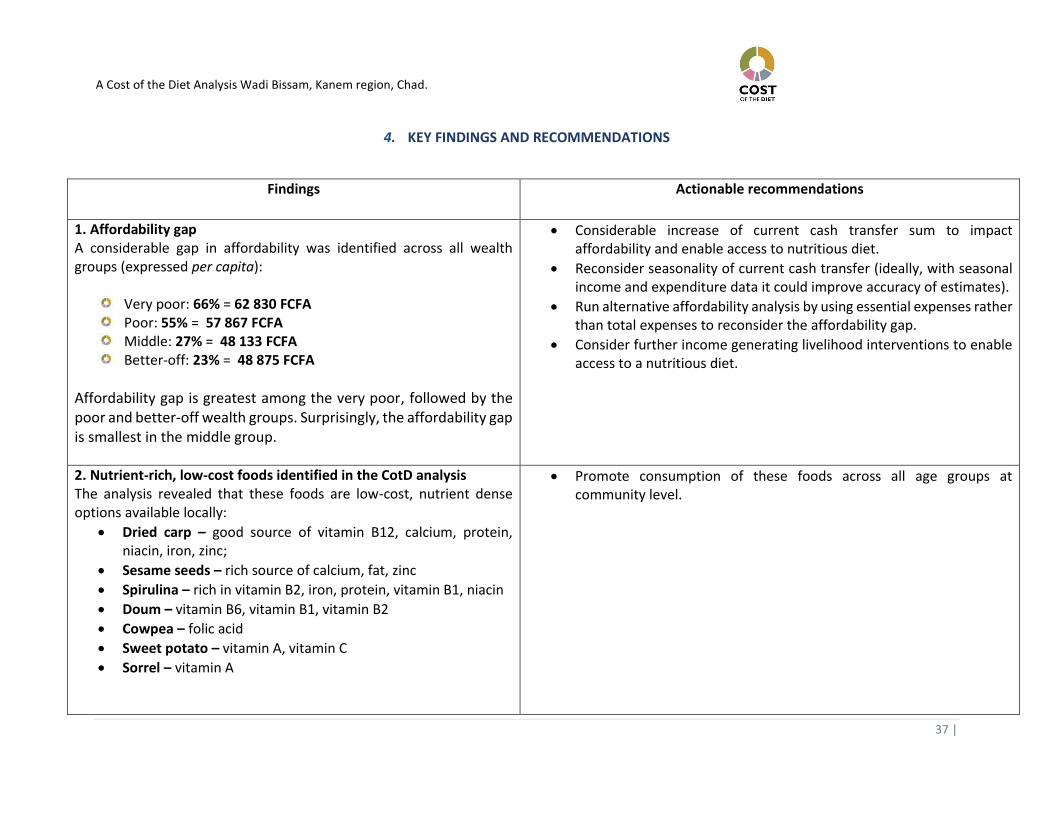
Figure 18 and 19 show the effect on cost compared to the average daily cost of the FHAB diet.
The introduction of green leafy vegetables into the diet resulted in a decrease of cost between
13% (sweet potato leaves, okra leaves) and 18% (moringa leaves, cowpea leaves) when the leaves
are introduced into the diet over the whole year (Figure 18). A decrease of cost between 6% and
9% was observed when vegetables are introduced to the diet only during the dry season (Figure
19).
The reduction in cost is likely more significant than the modelled effects of vegetables in section
3.7.3 due to the higher concentration of vitamin A, vitamin C and folic acid. This suggests that the
integration of green leafy vegetables into the diet may be a cost effective intervention to
introduce these nutrients into local diets by also utilizing already available foods.
A Cost of the Diet Analysis Wadi Bissam, Kanem region, Chad.
36 |
Figure 18. The effect on cost of introducing green leafy vegetables into the FHAB diet at zero
cost over the whole year compared to lettuce and carrot, which are currently grown in oasis
gardens (FCFA) (axis cropped at 1,000 FCFA).
Figure 19. The effect on cost of introducing green leafy vegetables into the FHAB diet at zero
cost during the dry season compared to lettuce and carrot, which are currently grown in oasis
gardens (FCFA) (axis cropped at 1,000 FCFA).
A Cost of the Diet Analysis Wadi Bissam, Kanem region, Chad.
37 |
4. KEY FINDINGS AND RECOMMENDATIONS
Findings Actionable recommendations
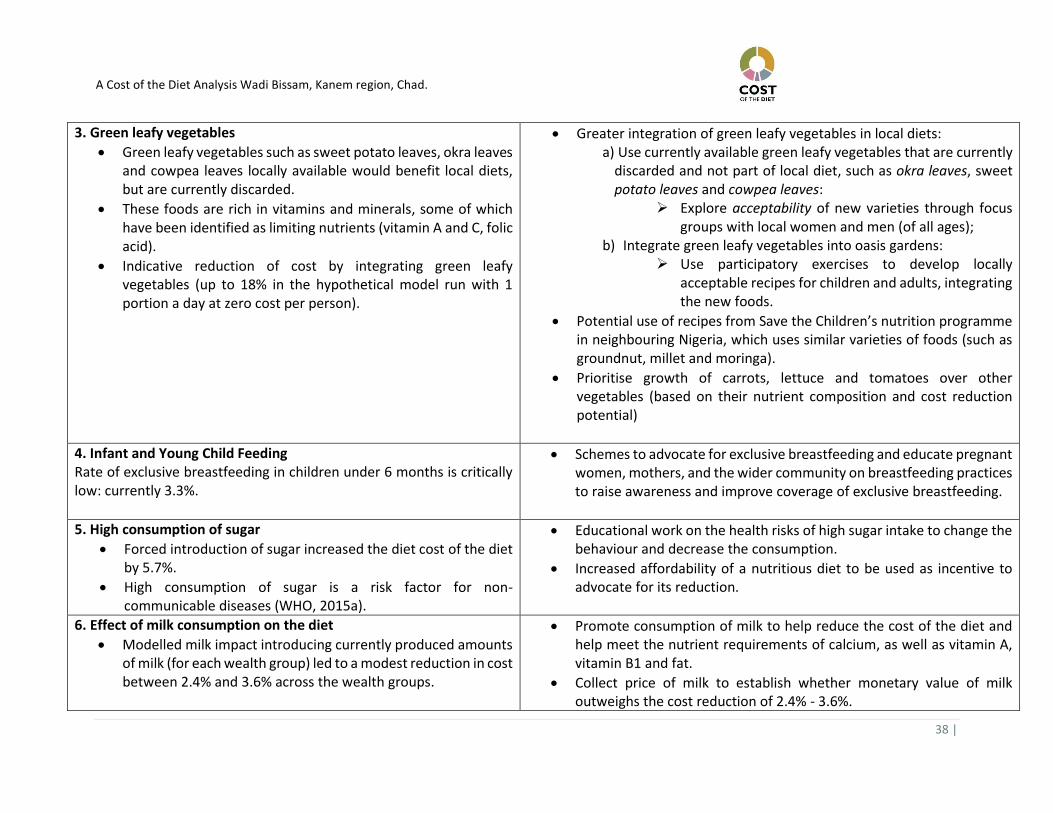
1. Affordability gap A considerable gap in affordability was identified across all wealth groups (expressed per capita):
Very poor: 66% = 62 830 FCFA Poor: 55% = 57 867 FCFA Middle: 27% = 48 133 FCFA Better-off: 23% = 48 875 FCFA
Affordability gap is greatest among the very poor, followed by the poor and better-off wealth groups. Surprisingly, the affordability gap is smallest in the middle group.
Considerable increase of current cash transfer sum to impact affordability and enable access to nutritious diet.
Reconsider seasonality of current cash transfer (ideally, with seasonal income and expenditure data it could improve accuracy of estimates).
Run alternative affordability analysis by using essential expenses rather than total expenses to reconsider the affordability gap.
Consider further income generating livelihood interventions to enable access to a nutritious diet.
2. Nutrient-rich, low-cost foods identified in the CotD analysis The analysis revealed that these foods are low-cost, nutrient dense options available locally:
Dried carp – good source of vitamin B12, calcium, protein, niacin, iron, zinc;
Sesame seeds – rich source of calcium, fat, zinc
Spirulina – rich in vitamin B2, iron, protein, vitamin B1, niacin
Doum – vitamin B6, vitamin B1, vitamin B2
Cowpea – folic acid
Sweet potato – vitamin A, vitamin C
Sorrel – vitamin A
Promote consumption of these foods across all age groups at community level.
A Cost of the Diet Analysis Wadi Bissam, Kanem region, Chad.
38 |
3. Green leafy vegetables
Green leafy vegetables such as sweet potato leaves, okra leaves and cowpea leaves locally available would benefit local diets, but are currently discarded.
These foods are rich in vitamins and minerals, some of which have been identified as limiting nutrients (vitamin A and C, folic acid).
Indicative reduction of cost by integrating green leafy vegetables (up to 18% in the hypothetical model run with 1 portion a day at zero cost per person).
Greater integration of green leafy vegetables in local diets: a) Use currently available green leafy vegetables that are currently
discarded and not part of local diet, such as okra leaves, sweet potato leaves and cowpea leaves:
Explore acceptability of new varieties through focus groups with local women and men (of all ages);
b) Integrate green leafy vegetables into oasis gardens: Use participatory exercises to develop locally
acceptable recipes for children and adults, integrating the new foods.
Potential use of recipes from Save the Children’s nutrition programme in neighbouring Nigeria, which uses similar varieties of foods (such as groundnut, millet and moringa).
Prioritise growth of carrots, lettuce and tomatoes over other vegetables (based on their nutrient composition and cost reduction potential)
4. Infant and Young Child Feeding Rate of exclusive breastfeeding in children under 6 months is critically low: currently 3.3%.
Schemes to advocate for exclusive breastfeeding and educate pregnant women, mothers, and the wider community on breastfeeding practices to raise awareness and improve coverage of exclusive breastfeeding.
5. High consumption of sugar
Forced introduction of sugar increased the diet cost of the diet by 5.7%.
High consumption of sugar is a risk factor for non-communicable diseases (WHO, 2015a).
Educational work on the health risks of high sugar intake to change the behaviour and decrease the consumption.
Increased affordability of a nutritious diet to be used as incentive to advocate for its reduction.
6. Effect of milk consumption on the diet
Modelled milk impact introducing currently produced amounts of milk (for each wealth group) led to a modest reduction in cost between 2.4% and 3.6% across the wealth groups.
Promote consumption of milk to help reduce the cost of the diet and help meet the nutrient requirements of calcium, as well as vitamin A, vitamin B1 and fat.
Collect price of milk to establish whether monetary value of milk outweighs the cost reduction of 2.4% - 3.6%.
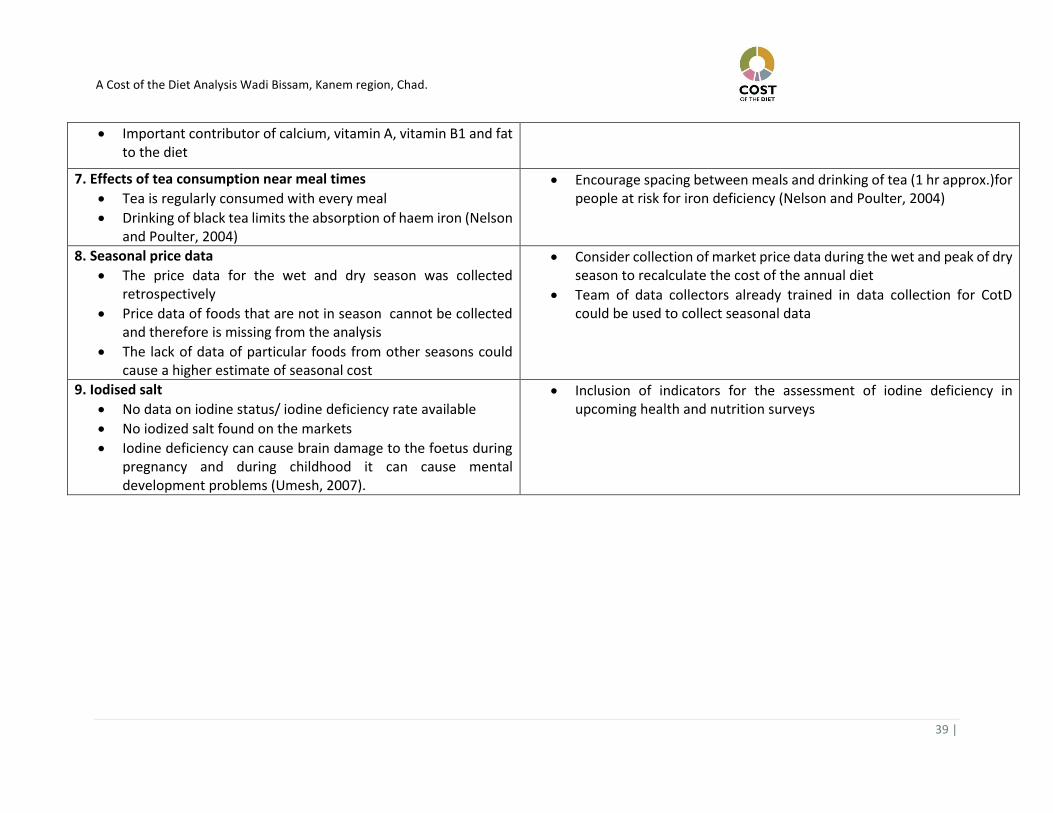
A Cost of the Diet Analysis Wadi Bissam, Kanem region, Chad.
39 |
Important contributor of calcium, vitamin A, vitamin B1 and fat to the diet
7. Effects of tea consumption near meal times
Tea is regularly consumed with every meal
Drinking of black tea limits the absorption of haem iron (Nelson and Poulter, 2004)
Encourage spacing between meals and drinking of tea (1 hr approx.)for people at risk for iron deficiency (Nelson and Poulter, 2004)
8. Seasonal price data
The price data for the wet and dry season was collected retrospectively
Price data of foods that are not in season cannot be collected and therefore is missing from the analysis
The lack of data of particular foods from other seasons could cause a higher estimate of seasonal cost
Consider collection of market price data during the wet and peak of dry season to recalculate the cost of the annual diet
Team of data collectors already trained in data collection for CotD could be used to collect seasonal data
9. Iodised salt
No data on iodine status/ iodine deficiency rate available
No iodized salt found on the markets
Iodine deficiency can cause brain damage to the foetus during pregnancy and during childhood it can cause mental development problems (Umesh, 2007).
Inclusion of indicators for the assessment of iodine deficiency in upcoming health and nutrition surveys
A Cost of the Diet Analysis Wadi Bissam, Kanem region, Chad.
40 |
BIBLIOGRAPHY
Action contre la Faim (2012). Analyse qualitative des Causes de la Malnutrition- Grand Kanem, Tchad.
France, Paris.
Action contre la Faim (2017). Cost of Diet(Coût de la Diète) pour le Kanem (Tchad). Termes de
Reference. N’Djamena, Chad. Action contre la Faim.
Adams, I.(2013). The Health Benefits of Dark Green Leafy Vegetables. Kentucky, USA: University of
Kentucky, College of Agriculture.
Cost of the Diet (2014). A method and software to calculate the lowest cost of meeting recommended
nutrient intakes using local foods. Version 2. London, UK: Save the Children.
Deptford, A., Allieri, T., Childs, R., Damu, C., Ferguson, E., Hilton, J., Parham, P., Perry, A., Rees, A.,
Seddon, J. and Hall, A. (2017). “Cost of the Diet: a method and software to calculate the lowest cost
of meeting recommended intakes of energy and nutrients from local foods.” BMC Nutrition, 3:26, pp.
1-17.
Famine Early Warning Systems Network (2011). Chad – Livelihood Zones. Last accessed on the 12th of
December 2017: http://www.fews.net/west-africa/chad/livelihood-zone-map/august-2011.
Food and Agriculture Organization (1992). Maize in Human Nutrition. Rome
Household Economy Analysis – Sahel (2017). Profil de référence de l’économie des ménages ruraux
de la zone Agropastorale des Départements de Wadi Bissam (région du Kanem) et de Dagana (région
de Hadjer Lamis).
Humanitarian Aid and Civil Protection, United Nations Children’s Fund, United States Agency for
International Development (2017). Note de présentation synthétique des résultats
anthropométriques et de mortalité retrospective de l’enquête nationale de nutrition chez les enfants
de 0 à 59 mois. N’Djamena, Chad: Chadian Ministry of Health, Direction of Nutrition and Food
technology.
A Cost of the Diet Analysis Wadi Bissam, Kanem region, Chad.
41 |
Institut National de la Statistique, des Études Économiques et Démographique (2009). Deuxieme
Recensement General de la Population et de l’Habitat. Chad. Ministère de l’Économie et du Plan.
Nelson, M., Poulter, J. (2004). Impact of tea drinking on iron status in the UK: a review. J Hum Nutr
Diet., 17(1):43-54.
Umesh, K. (2007). Health Consequences of Iodine Deficiency. Sultan Qaboos Univ Med J., 7(3): 267–
272.
United Nations Children’s Fund (2015). Evaluation de la situation nutritionnelle par la methodologie
SMART au Tchad. Last accessed on the 10 December 2017 at:
https://www.humanitarianresponse.info/system/files/documents/files/rapport_final_smart_tchad
_2015.pdf.
United Nations Development Programme (2017). Human Development Reports. Chad. Last accessed
on the 10th of December 2017 at: http://hdr.undp.org/en/countries/profiles/TCD
United Nations Office for the Coordination of Humanitarian Affairs (2016). Tchad: Profil humanitaire
de la région du Kanem. Last accessed on the 15 December 2017 at:
https://www.humanitarianresponse.info/system/files/documents/files/tcd_viz_profil_regional_kan
em_fin_a4p_20161012.pdf
World Health Organization (2015a). Guideline: sugars intake for adults and children. Geneva.
World Health Organization (2015b). The global prevalence of anaemia in 2011. Geneva, World Health
Organization. Last accessed on the 12th of December 2017 at:
http://apps.who.int/iris/bitstream/10665/177094/1/9789241564960_eng.pdf?ua=1&ua=1.
World Health Organization and Food and Agriculture Organization (2004). Vitamin and mineral
requirements in human nutrition. Second edition.
World Health Organization (2016a). Prevalence of anaemia in non-pregnant women. Estimates by
country. Last accessed on the 10th of December 2017 at:
http://apps.who.int/gho/data/node.main.ANEMIA2?lang=en.
A Cost of the Diet Analysis Wadi Bissam, Kanem region, Chad.
42 |
World Health Organization (2016b). Prevalence of anaemia in women of reproductive age. Estimates
by country. Last accessed on the 10th of December 2017 at:
http://apps.who.int/gho/data/node.main.ANEMIA3?lang=en.
World Health Organization (2017a). Micronutrient deficiencies. Iodine deficiency disorders. Last
accessed on the 15th of December 2017 at: http://www.who.int/nutrition/topics/idd/en/.
World Health Organization (2017b). Countries. Chad. Last accessed on the 10th of December 2017 at:
http://www.who.int/countries/tcd/en/.
A Cost of the Diet Analysis Wadi Bissam, Kanem region, Chad.
43 |
APPENDICES
Appendix 1. Recommended intakes for energy and micronutrients, and limitations of the Cost of the
Diet software and method.
i. Recommended intakes for energy and micronutrients
The needs of individuals for energy are taken from a database embedded in the Cost of the Diet
software that specifies the estimated average requirement (EAR) recommended by the WHO and
FAO (2004) for individuals by age, sex and activity level. As this intake is based on the estimated
average requirement, the probability that any given individual’s requirement is met is 0.5 or 50%.
The needs of individuals for protein are taken from a database embedded in the software which
specifies the safe individual intake recommended by the WHO and FAO (2007) for individuals by age
and sex. This intake is defined as the 97.5th percentile of the distribution of individual requirements,
so the probability that any given individual’s protein requirement is met is 0.975 or 97.5%.
The needs of individuals for vitamins and minerals (collectively called micronutrients) are taken from
a database embedded in the software which specifies the recommended nutrient intake (RNI)
proposed by the WHO and FAO (2004) for individuals by age and sex. This intake is defined as the
97.5th percentile of the distribution of individual requirements, so the probability that any given
individual’s requirement is met is 0.975 or 97.5%. The recommended intake of vitamin A is specified
as the recommended safe intake, as there are no adequate data to derive mean and standard
deviations of intake (WHO/FAO, 2004).
The needs of individuals for fat are specified as 30% of total energy intake (WHO, 2008).
A diet selected by the Cost of Diet software which meets all of the requirements described above is
called a ‘nutritious’ diet.
ii. The limitations of the Cost of the Diet software and method
It is useful to understand the limitations of the cost of the diet method before applying any analysis.
The software can identify a ‘diet’ that provides the recommended amounts of energy and
micronutrients from a relatively small number of foods, but they would need to be eaten every day
at every meal, which is unrealistic.
Because the actual requirements for micronutrients of any given individual cannot be known, the
RNIs are set at two standard deviations above the average, to minimise the risk of deficiency. This
means that when the mixture of foods selected by the Cost of the Diet software meets the RNIs of a
family by 100%, the nutritional needs of 97% of all individuals will be exceeded. The result is that
greater quantities of food are selected and at a higher cost than is necessary to meet the actual
nutritional requirements of most individuals.
A Cost of the Diet Analysis Wadi Bissam, Kanem region, Chad.
44 |
The needs for a number of nutrients are not taken into account by the software including iodine,
vitamin D, essential amino acids and essential fatty acids. Iodine is not included because the amount
in foods depends on the soil on which plants are grown or animals are reared, so no data are provided
in food tables. Vitamin D is not included because requirements can be met by making vitamin D in
skin exposed to ultra-violet light. And most food tables do not provide data on essential amino acids
or fatty acids.
References
World Health Organization and Food and Agriculture Organization (2004). Human energy
requirements report of a Joint FAO/WHO/UNU Expert Consultation. Rome
World Health Organization and Food and Agriculture Organization (2007). Vitamin and mineral
requirements in human nutrition. Second edition.
World Health Organization and Food and Agriculture Organization (2008). Joint FAO/WHO Expert
Consultation on Fats and Fatty Acids in Human Nutrition. Geneva
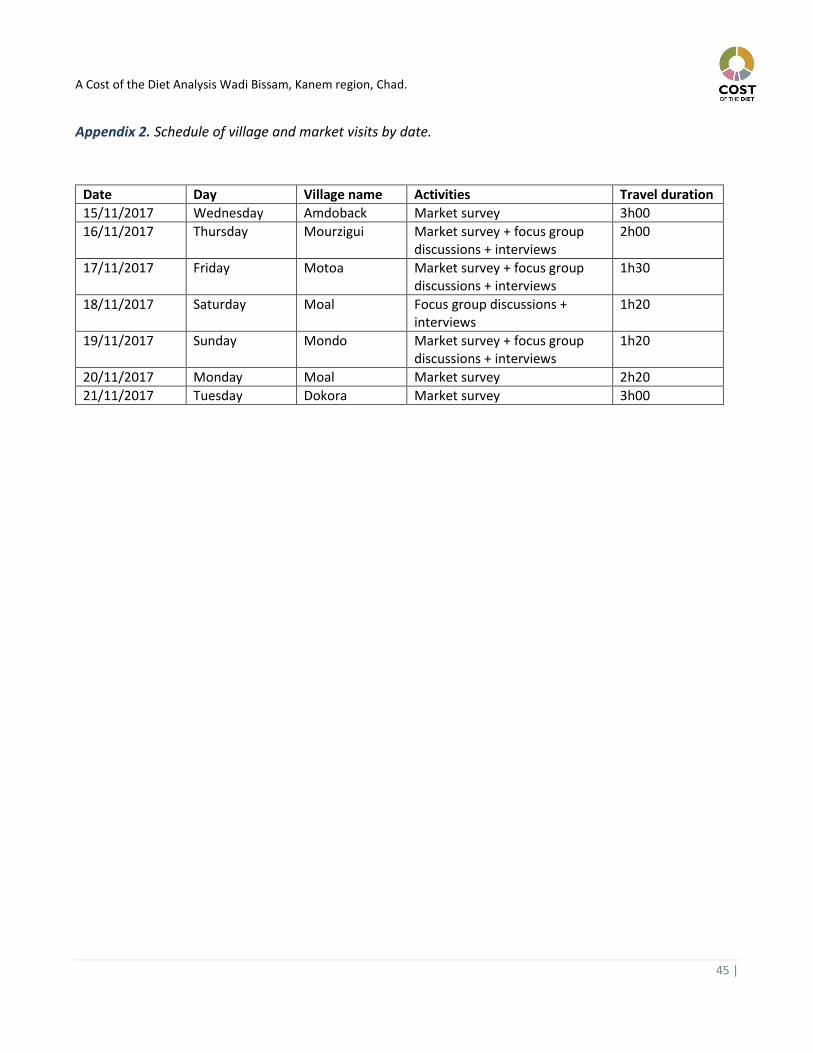
A Cost of the Diet Analysis Wadi Bissam, Kanem region, Chad.
45 |
Appendix 2. Schedule of village and market visits by date.
Date Day Village name Activities Travel duration
15/11/2017 Wednesday Amdoback Market survey 3h00
16/11/2017 Thursday Mourzigui Market survey + focus group discussions + interviews
2h00
17/11/2017 Friday Motoa Market survey + focus group discussions + interviews
1h30
18/11/2017 Saturday Moal Focus group discussions + interviews
1h20
19/11/2017 Sunday Mondo Market survey + focus group discussions + interviews
1h20
20/11/2017 Monday Moal Market survey 2h20
21/11/2017 Tuesday Dokora Market survey 3h00
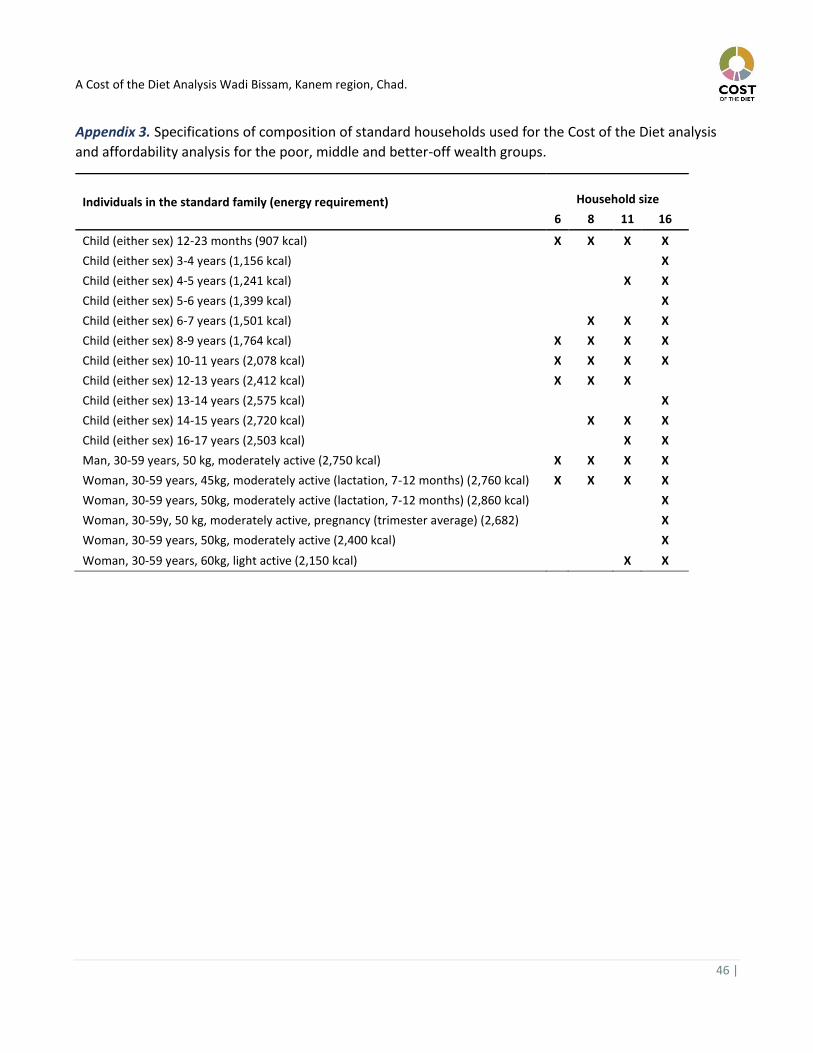
A Cost of the Diet Analysis Wadi Bissam, Kanem region, Chad.
46 |
Appendix 3. Specifications of composition of standard households used for the Cost of the Diet analysis
and affordability analysis for the poor, middle and better-off wealth groups.
Individuals in the standard family (energy requirement)
Household size
6 8 11 16
Child (either sex) 12-23 months (907 kcal) X X X X
Child (either sex) 3-4 years (1,156 kcal) X
Child (either sex) 4-5 years (1,241 kcal) X X
Child (either sex) 5-6 years (1,399 kcal) X
Child (either sex) 6-7 years (1,501 kcal) X X X
Child (either sex) 8-9 years (1,764 kcal) X X X X
Child (either sex) 10-11 years (2,078 kcal) X X X X
Child (either sex) 12-13 years (2,412 kcal) X X X
Child (either sex) 13-14 years (2,575 kcal) X
Child (either sex) 14-15 years (2,720 kcal) X X X
Child (either sex) 16-17 years (2,503 kcal) X X
Man, 30-59 years, 50 kg, moderately active (2,750 kcal) X X X X
Woman, 30-59 years, 45kg, moderately active (lactation, 7-12 months) (2,760 kcal) X X X X
Woman, 30-59 years, 50kg, moderately active (lactation, 7-12 months) (2,860 kcal) X
Woman, 30-59y, 50 kg, moderately active, pregnancy (trimester average) (2,682) X
Woman, 30-59 years, 50kg, moderately active (2,400 kcal) X
Woman, 30-59 years, 60kg, light active (2,150 kcal) X X
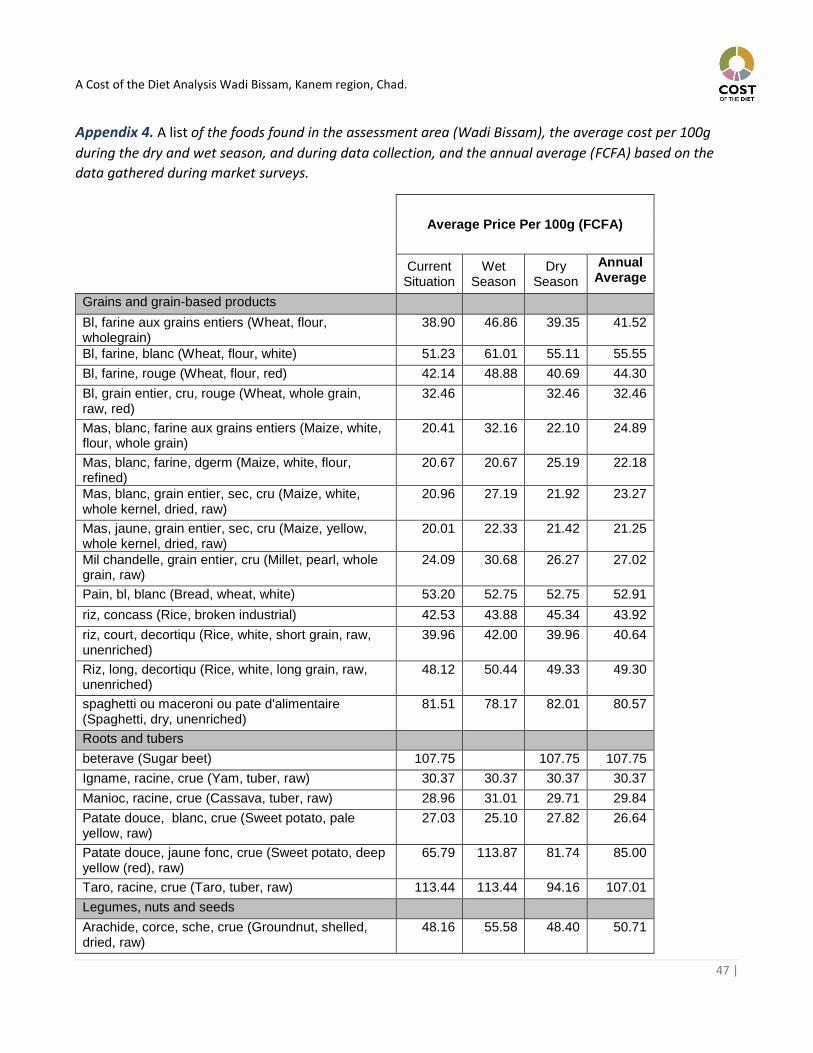
A Cost of the Diet Analysis Wadi Bissam, Kanem region, Chad.
47 |
Appendix 4. A list of the foods found in the assessment area (Wadi Bissam), the average cost per 100g
during the dry and wet season, and during data collection, and the annual average (FCFA) based on the
data gathered during market surveys.
Average Price Per 100g (FCFA)
Current
Situation Wet
Season Dry
Season
Annual Average
Grains and grain-based products
Bl, farine aux grains entiers (Wheat, flour, wholegrain)
38.90 46.86 39.35 41.52
Bl, farine, blanc (Wheat, flour, white) 51.23 61.01 55.11 55.55
Bl, farine, rouge (Wheat, flour, red) 42.14 48.88 40.69 44.30
Bl, grain entier, cru, rouge (Wheat, whole grain, raw, red)
32.46 32.46 32.46
Mas, blanc, farine aux grains entiers (Maize, white, flour, whole grain)
20.41 32.16 22.10 24.89
Mas, blanc, farine, dgerm (Maize, white, flour, refined)
20.67 20.67 25.19 22.18
Mas, blanc, grain entier, sec, cru (Maize, white, whole kernel, dried, raw)
20.96 27.19 21.92 23.27
Mas, jaune, grain entier, sec, cru (Maize, yellow, whole kernel, dried, raw)
20.01 22.33 21.42 21.25
Mil chandelle, grain entier, cru (Millet, pearl, whole grain, raw)
24.09 30.68 26.27 27.02
Pain, bl, blanc (Bread, wheat, white) 53.20 52.75 52.75 52.91
riz, concass (Rice, broken industrial) 42.53 43.88 45.34 43.92
riz, court, decortiqu (Rice, white, short grain, raw, unenriched)
39.96 42.00 39.96 40.64
Riz, long, decortiqu (Rice, white, long grain, raw, unenriched)
48.12 50.44 49.33 49.30
spaghetti ou maceroni ou pate d'alimentaire (Spaghetti, dry, unenriched)
81.51 78.17 82.01 80.57
Roots and tubers
beterave (Sugar beet) 107.75 107.75 107.75
Igname, racine, crue (Yam, tuber, raw) 30.37 30.37 30.37 30.37
Manioc, racine, crue (Cassava, tuber, raw) 28.96 31.01 29.71 29.84
Patate douce, blanc, crue (Sweet potato, pale yellow, raw)
27.03 25.10 27.82 26.64
Patate douce, jaune fonc, crue (Sweet potato, deep yellow (red), raw)
65.79 113.87 81.74 85.00
Taro, racine, crue (Taro, tuber, raw) 113.44 113.44 94.16 107.01
Legumes, nuts and seeds
Arachide, corce, sche, crue (Groundnut, shelled, dried, raw)
48.16 55.58 48.40 50.71
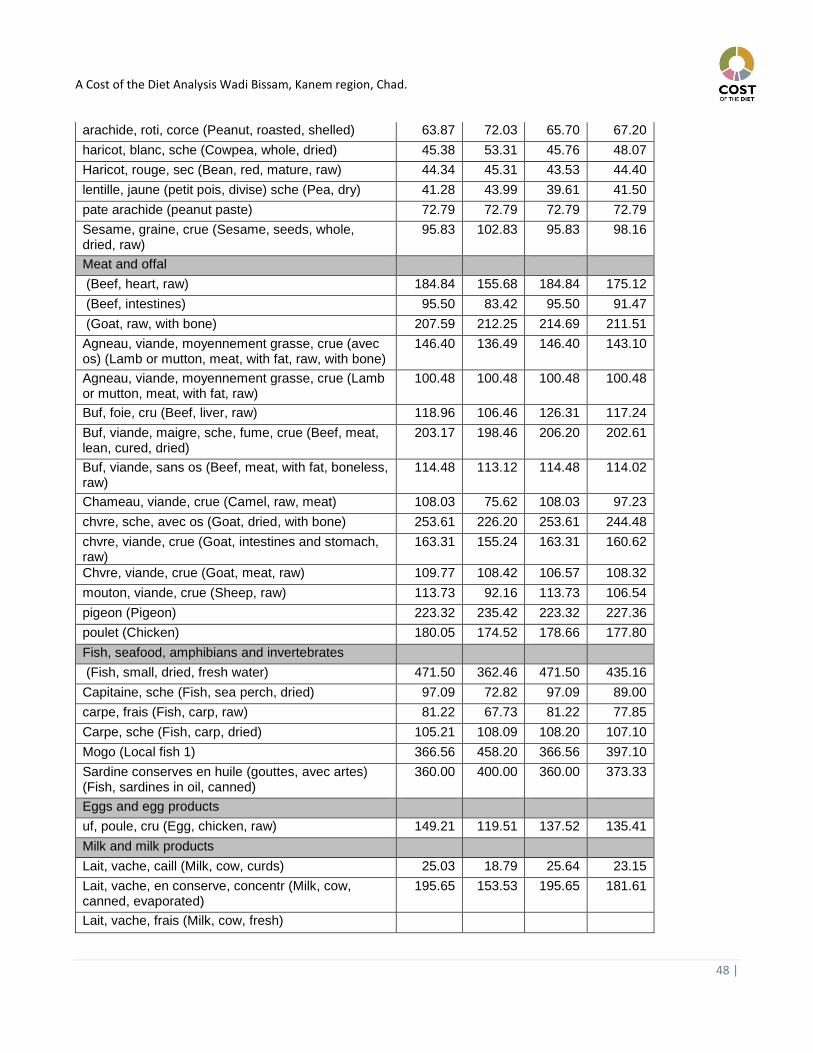
A Cost of the Diet Analysis Wadi Bissam, Kanem region, Chad.
48 |
arachide, roti, corce (Peanut, roasted, shelled) 63.87 72.03 65.70 67.20
haricot, blanc, sche (Cowpea, whole, dried) 45.38 53.31 45.76 48.07
Haricot, rouge, sec (Bean, red, mature, raw) 44.34 45.31 43.53 44.40
lentille, jaune (petit pois, divise) sche (Pea, dry) 41.28 43.99 39.61 41.50
pate arachide (peanut paste) 72.79 72.79 72.79 72.79
Sesame, graine, crue (Sesame, seeds, whole, dried, raw)
95.83 102.83 95.83 98.16
Meat and offal
(Beef, heart, raw) 184.84 155.68 184.84 175.12
(Beef, intestines) 95.50 83.42 95.50 91.47
(Goat, raw, with bone) 207.59 212.25 214.69 211.51
Agneau, viande, moyennement grasse, crue (avec os) (Lamb or mutton, meat, with fat, raw, with bone)
146.40 136.49 146.40 143.10
Agneau, viande, moyennement grasse, crue (Lamb or mutton, meat, with fat, raw)
100.48 100.48 100.48 100.48
Buf, foie, cru (Beef, liver, raw) 118.96 106.46 126.31 117.24
Buf, viande, maigre, sche, fume, crue (Beef, meat, lean, cured, dried)
203.17 198.46 206.20 202.61
Buf, viande, sans os (Beef, meat, with fat, boneless, raw)
114.48 113.12 114.48 114.02
Chameau, viande, crue (Camel, raw, meat) 108.03 75.62 108.03 97.23
chvre, sche, avec os (Goat, dried, with bone) 253.61 226.20 253.61 244.48
chvre, viande, crue (Goat, intestines and stomach, raw)
163.31 155.24 163.31 160.62
Chvre, viande, crue (Goat, meat, raw) 109.77 108.42 106.57 108.32
mouton, viande, crue (Sheep, raw) 113.73 92.16 113.73 106.54
pigeon (Pigeon) 223.32 235.42 223.32 227.36
poulet (Chicken) 180.05 174.52 178.66 177.80
Fish, seafood, amphibians and invertebrates
(Fish, small, dried, fresh water) 471.50 362.46 471.50 435.16
Capitaine, sche (Fish, sea perch, dried) 97.09 72.82 97.09 89.00
carpe, frais (Fish, carp, raw) 81.22 67.73 81.22 77.85
Carpe, sche (Fish, carp, dried) 105.21 108.09 108.20 107.10
Mogo (Local fish 1) 366.56 458.20 366.56 397.10
Sardine conserves en huile (gouttes, avec artes) (Fish, sardines in oil, canned)
360.00 400.00 360.00 373.33
Eggs and egg products
uf, poule, cru (Egg, chicken, raw) 149.21 119.51 137.52 135.41
Milk and milk products
Lait, vache, caill (Milk, cow, curds) 25.03 18.79 25.64 23.15
Lait, vache, en conserve, concentr (Milk, cow, canned, evaporated)
195.65 153.53 195.65 181.61
Lait, vache, frais (Milk, cow, fresh)
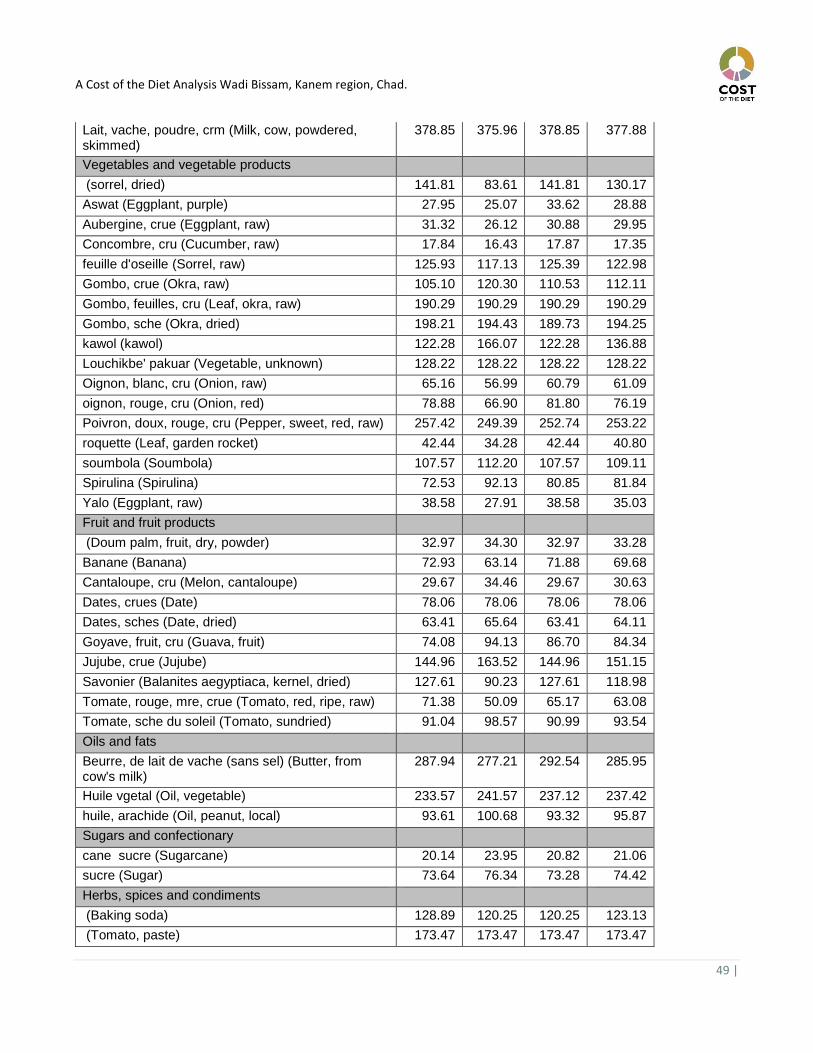
A Cost of the Diet Analysis Wadi Bissam, Kanem region, Chad.
49 |
Lait, vache, poudre, crm (Milk, cow, powdered, skimmed)
378.85 375.96 378.85 377.88
Vegetables and vegetable products
(sorrel, dried) 141.81 83.61 141.81 130.17
Aswat (Eggplant, purple) 27.95 25.07 33.62 28.88
Aubergine, crue (Eggplant, raw) 31.32 26.12 30.88 29.95
Concombre, cru (Cucumber, raw) 17.84 16.43 17.87 17.35
feuille d'oseille (Sorrel, raw) 125.93 117.13 125.39 122.98
Gombo, crue (Okra, raw) 105.10 120.30 110.53 112.11
Gombo, feuilles, cru (Leaf, okra, raw) 190.29 190.29 190.29 190.29
Gombo, sche (Okra, dried) 198.21 194.43 189.73 194.25
kawol (kawol) 122.28 166.07 122.28 136.88
Louchikbe' pakuar (Vegetable, unknown) 128.22 128.22 128.22 128.22
Oignon, blanc, cru (Onion, raw) 65.16 56.99 60.79 61.09
oignon, rouge, cru (Onion, red) 78.88 66.90 81.80 76.19
Poivron, doux, rouge, cru (Pepper, sweet, red, raw) 257.42 249.39 252.74 253.22
roquette (Leaf, garden rocket) 42.44 34.28 42.44 40.80
soumbola (Soumbola) 107.57 112.20 107.57 109.11
Spirulina (Spirulina) 72.53 92.13 80.85 81.84
Yalo (Eggplant, raw) 38.58 27.91 38.58 35.03
Fruit and fruit products
(Doum palm, fruit, dry, powder) 32.97 34.30 32.97 33.28
Banane (Banana) 72.93 63.14 71.88 69.68
Cantaloupe, cru (Melon, cantaloupe) 29.67 34.46 29.67 30.63
Dates, crues (Date) 78.06 78.06 78.06 78.06
Dates, sches (Date, dried) 63.41 65.64 63.41 64.11
Goyave, fruit, cru (Guava, fruit) 74.08 94.13 86.70 84.34
Jujube, crue (Jujube) 144.96 163.52 144.96 151.15
Savonier (Balanites aegyptiaca, kernel, dried) 127.61 90.23 127.61 118.98
Tomate, rouge, mre, crue (Tomato, red, ripe, raw) 71.38 50.09 65.17 63.08
Tomate, sche du soleil (Tomato, sundried) 91.04 98.57 90.99 93.54
Oils and fats
Beurre, de lait de vache (sans sel) (Butter, from cow's milk)
287.94 277.21 292.54 285.95
Huile vgetal (Oil, vegetable) 233.57 241.57 237.12 237.42
huile, arachide (Oil, peanut, local) 93.61 100.68 93.32 95.87
Sugars and confectionary
cane sucre (Sugarcane) 20.14 23.95 20.82 21.06
sucre (Sugar) 73.64 76.34 73.28 74.42
Herbs, spices and condiments
(Baking soda) 128.89 120.25 120.25 123.13
(Tomato, paste) 173.47 173.47 173.47 173.47
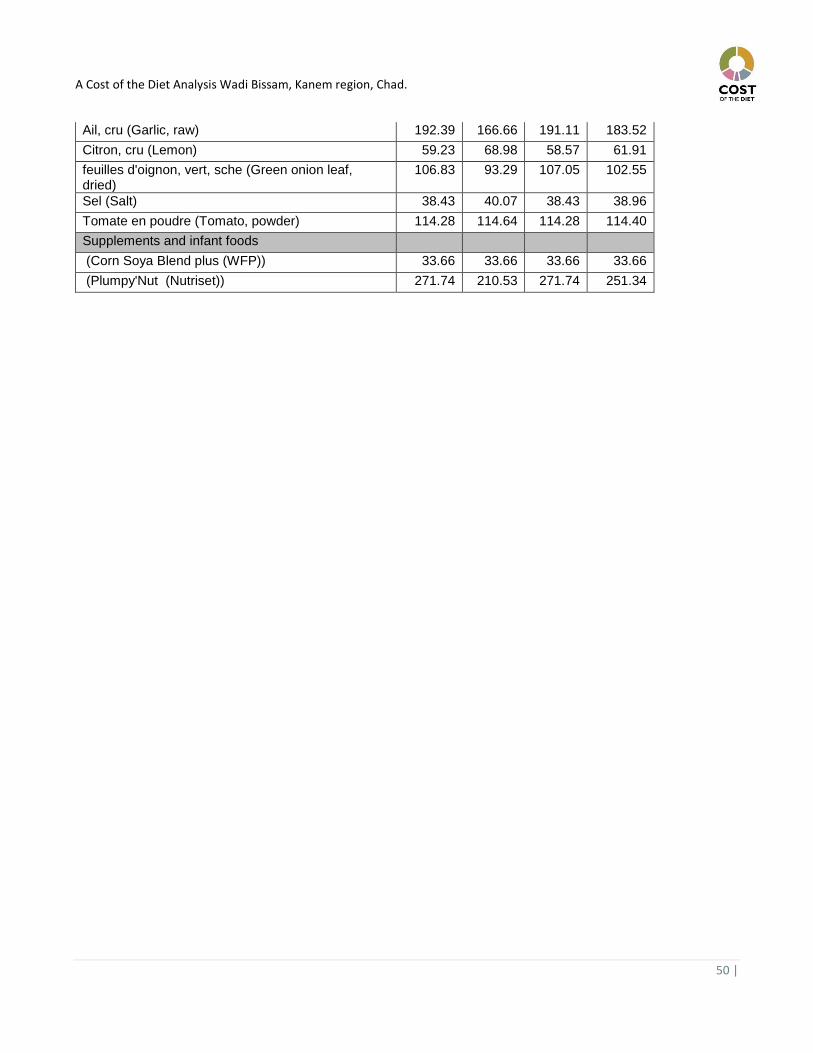
A Cost of the Diet Analysis Wadi Bissam, Kanem region, Chad.
50 |
Ail, cru (Garlic, raw) 192.39 166.66 191.11 183.52
Citron, cru (Lemon) 59.23 68.98 58.57 61.91
feuilles d'oignon, vert, sche (Green onion leaf, dried)
106.83 93.29 107.05 102.55
Sel (Salt) 38.43 40.07 38.43 38.96
Tomate en poudre (Tomato, powder) 114.28 114.64 114.28 114.40
Supplements and infant foods
(Corn Soya Blend plus (WFP)) 33.66 33.66 33.66 33.66
(Plumpy'Nut (Nutriset)) 271.74 210.53 271.74 251.34
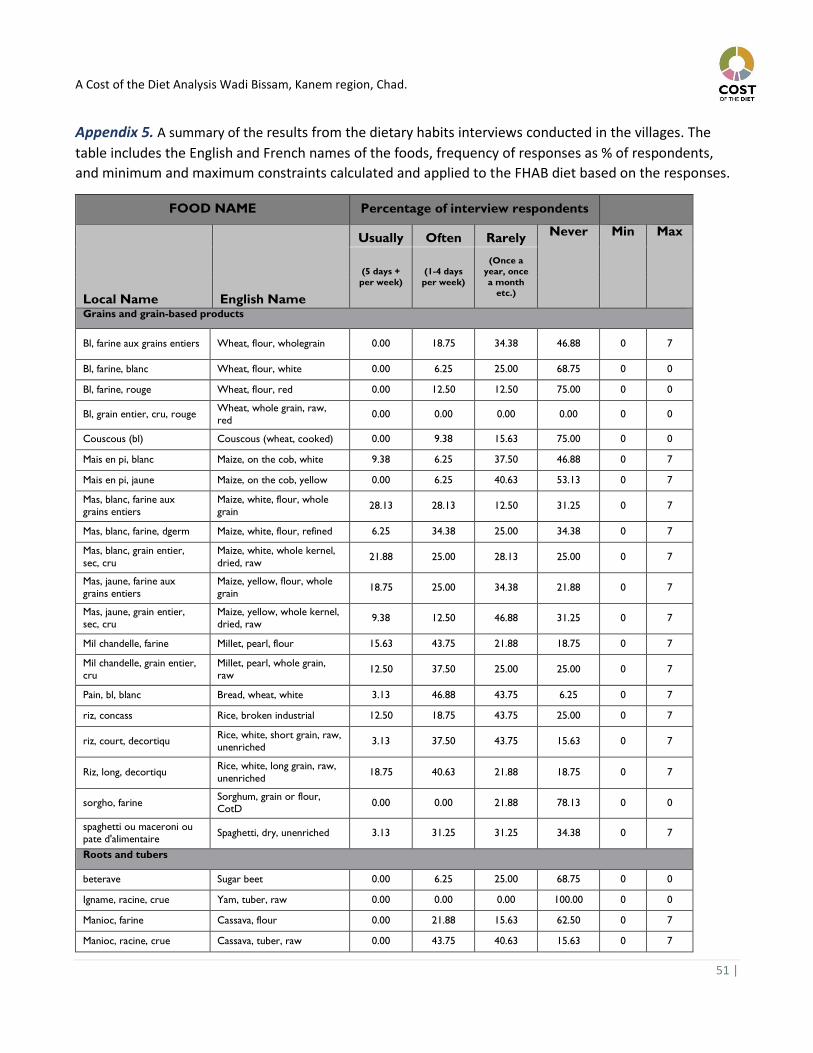
A Cost of the Diet Analysis Wadi Bissam, Kanem region, Chad.
51 |
Appendix 5. A summary of the results from the dietary habits interviews conducted in the villages. The
table includes the English and French names of the foods, frequency of responses as % of respondents,
and minimum and maximum constraints calculated and applied to the FHAB diet based on the responses.
FOOD NAME Percentage of interview respondents
Local Name English Name
Usually Often Rarely Never Min Max
(5 days +
per week)
(1-4 days
per week)
(Once a
year, once
a month
etc.)
Grains and grain-based products
Bl, farine aux grains entiers Wheat, flour, wholegrain 0.00 18.75 34.38 46.88 0 7
Bl, farine, blanc Wheat, flour, white 0.00 6.25 25.00 68.75 0 0
Bl, farine, rouge Wheat, flour, red 0.00 12.50 12.50 75.00 0 0
Bl, grain entier, cru, rouge Wheat, whole grain, raw, red
0.00 0.00 0.00 0.00 0 0
Couscous (bl) Couscous (wheat, cooked) 0.00 9.38 15.63 75.00 0 0
Mais en pi, blanc Maize, on the cob, white 9.38 6.25 37.50 46.88 0 7
Mais en pi, jaune Maize, on the cob, yellow 0.00 6.25 40.63 53.13 0 7
Mas, blanc, farine aux grains entiers
Maize, white, flour, whole grain
28.13 28.13 12.50 31.25 0 7
Mas, blanc, farine, dgerm Maize, white, flour, refined 6.25 34.38 25.00 34.38 0 7
Mas, blanc, grain entier,
sec, cru
Maize, white, whole kernel,
dried, raw 21.88 25.00 28.13 25.00 0 7
Mas, jaune, farine aux grains entiers
Maize, yellow, flour, whole grain
18.75 25.00 34.38 21.88 0 7
Mas, jaune, grain entier, sec, cru
Maize, yellow, whole kernel, dried, raw
9.38 12.50 46.88 31.25 0 7
Mil chandelle, farine Millet, pearl, flour 15.63 43.75 21.88 18.75 0 7
Mil chandelle, grain entier, cru
Millet, pearl, whole grain, raw
12.50 37.50 25.00 25.00 0 7
Pain, bl, blanc Bread, wheat, white 3.13 46.88 43.75 6.25 0 7
riz, concass Rice, broken industrial 12.50 18.75 43.75 25.00 0 7
riz, court, decortiqu Rice, white, short grain, raw, unenriched
3.13 37.50 43.75 15.63 0 7
Riz, long, decortiqu Rice, white, long grain, raw,
unenriched 18.75 40.63 21.88 18.75 0 7
sorgho, farine Sorghum, grain or flour, CotD
0.00 0.00 21.88 78.13 0 0
spaghetti ou maceroni ou pate d'alimentaire
Spaghetti, dry, unenriched 3.13 31.25 31.25 34.38 0 7
Roots and tubers
beterave Sugar beet 0.00 6.25 25.00 68.75 0 0
Igname, racine, crue Yam, tuber, raw 0.00 0.00 0.00 100.00 0 0
Manioc, farine Cassava, flour 0.00 21.88 15.63 62.50 0 7
Manioc, racine, crue Cassava, tuber, raw 0.00 43.75 40.63 15.63 0 7
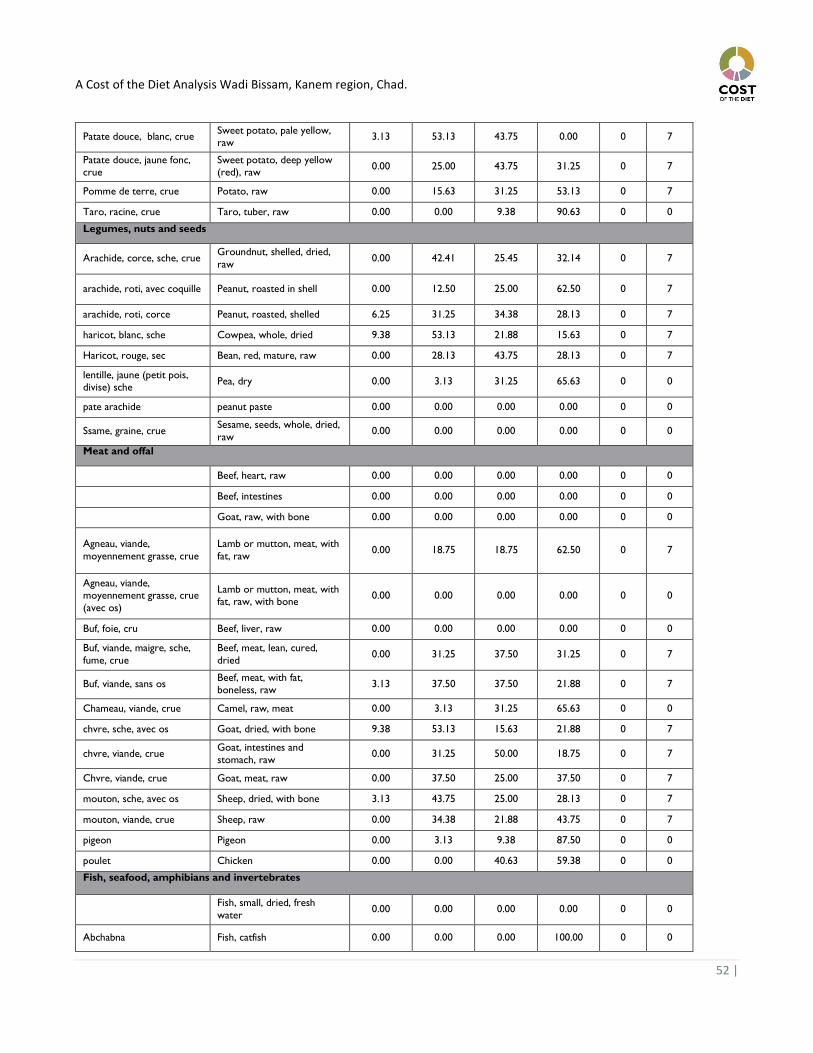
A Cost of the Diet Analysis Wadi Bissam, Kanem region, Chad.
52 |
Patate douce, blanc, crue Sweet potato, pale yellow, raw
3.13 53.13 43.75 0.00 0 7
Patate douce, jaune fonc, crue
Sweet potato, deep yellow (red), raw
0.00 25.00 43.75 31.25 0 7
Pomme de terre, crue Potato, raw 0.00 15.63 31.25 53.13 0 7
Taro, racine, crue Taro, tuber, raw 0.00 0.00 9.38 90.63 0 0
Legumes, nuts and seeds
Arachide, corce, sche, crue Groundnut, shelled, dried,
raw 0.00 42.41 25.45 32.14 0 7
arachide, roti, avec coquille Peanut, roasted in shell 0.00 12.50 25.00 62.50 0 7
arachide, roti, corce Peanut, roasted, shelled 6.25 31.25 34.38 28.13 0 7
haricot, blanc, sche Cowpea, whole, dried 9.38 53.13 21.88 15.63 0 7
Haricot, rouge, sec Bean, red, mature, raw 0.00 28.13 43.75 28.13 0 7
lentille, jaune (petit pois, divise) sche
Pea, dry 0.00 3.13 31.25 65.63 0 0
pate arachide peanut paste 0.00 0.00 0.00 0.00 0 0
Ssame, graine, crue Sesame, seeds, whole, dried,
raw 0.00 0.00 0.00 0.00 0 0
Meat and offal
Beef, heart, raw 0.00 0.00 0.00 0.00 0 0
Beef, intestines 0.00 0.00 0.00 0.00 0 0
Goat, raw, with bone 0.00 0.00 0.00 0.00 0 0
Agneau, viande,
moyennement grasse, crue
Lamb or mutton, meat, with
fat, raw 0.00 18.75 18.75 62.50 0 7
Agneau, viande, moyennement grasse, crue
(avec os)
Lamb or mutton, meat, with fat, raw, with bone
0.00 0.00 0.00 0.00 0 0
Buf, foie, cru Beef, liver, raw 0.00 0.00 0.00 0.00 0 0
Buf, viande, maigre, sche,
fume, crue
Beef, meat, lean, cured,
dried 0.00 31.25 37.50 31.25 0 7
Buf, viande, sans os Beef, meat, with fat,
boneless, raw 3.13 37.50 37.50 21.88 0 7
Chameau, viande, crue Camel, raw, meat 0.00 3.13 31.25 65.63 0 0
chvre, sche, avec os Goat, dried, with bone 9.38 53.13 15.63 21.88 0 7
chvre, viande, crue Goat, intestines and
stomach, raw 0.00 31.25 50.00 18.75 0 7
Chvre, viande, crue Goat, meat, raw 0.00 37.50 25.00 37.50 0 7
mouton, sche, avec os Sheep, dried, with bone 3.13 43.75 25.00 28.13 0 7
mouton, viande, crue Sheep, raw 0.00 34.38 21.88 43.75 0 7
pigeon Pigeon 0.00 3.13 9.38 87.50 0 0
poulet Chicken 0.00 0.00 40.63 59.38 0 0
Fish, seafood, amphibians and invertebrates
Fish, small, dried, fresh
water 0.00 0.00 0.00 0.00 0 0
Abchabna Fish, catfish 0.00 0.00 0.00 100.00 0 0
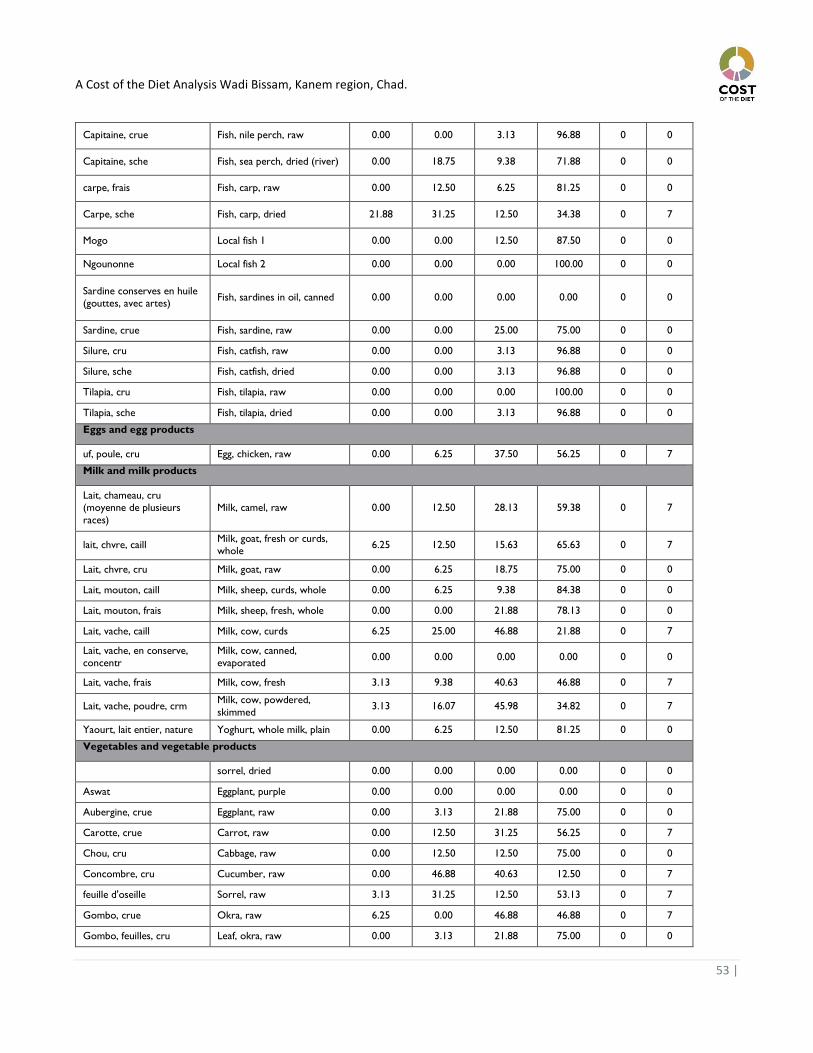
A Cost of the Diet Analysis Wadi Bissam, Kanem region, Chad.
53 |
Capitaine, crue Fish, nile perch, raw 0.00 0.00 3.13 96.88 0 0
Capitaine, sche Fish, sea perch, dried (river) 0.00 18.75 9.38 71.88 0 0
carpe, frais Fish, carp, raw 0.00 12.50 6.25 81.25 0 0
Carpe, sche Fish, carp, dried 21.88 31.25 12.50 34.38 0 7
Mogo Local fish 1 0.00 0.00 12.50 87.50 0 0
Ngounonne Local fish 2 0.00 0.00 0.00 100.00 0 0
Sardine conserves en huile (gouttes, avec artes)
Fish, sardines in oil, canned 0.00 0.00 0.00 0.00 0 0
Sardine, crue Fish, sardine, raw 0.00 0.00 25.00 75.00 0 0
Silure, cru Fish, catfish, raw 0.00 0.00 3.13 96.88 0 0
Silure, sche Fish, catfish, dried 0.00 0.00 3.13 96.88 0 0
Tilapia, cru Fish, tilapia, raw 0.00 0.00 0.00 100.00 0 0
Tilapia, sche Fish, tilapia, dried 0.00 0.00 3.13 96.88 0 0
Eggs and egg products
uf, poule, cru Egg, chicken, raw 0.00 6.25 37.50 56.25 0 7
Milk and milk products
Lait, chameau, cru (moyenne de plusieurs
races)
Milk, camel, raw 0.00 12.50 28.13 59.38 0 7
lait, chvre, caill Milk, goat, fresh or curds, whole
6.25 12.50 15.63 65.63 0 7
Lait, chvre, cru Milk, goat, raw 0.00 6.25 18.75 75.00 0 0
Lait, mouton, caill Milk, sheep, curds, whole 0.00 6.25 9.38 84.38 0 0
Lait, mouton, frais Milk, sheep, fresh, whole 0.00 0.00 21.88 78.13 0 0
Lait, vache, caill Milk, cow, curds 6.25 25.00 46.88 21.88 0 7
Lait, vache, en conserve, concentr
Milk, cow, canned, evaporated
0.00 0.00 0.00 0.00 0 0
Lait, vache, frais Milk, cow, fresh 3.13 9.38 40.63 46.88 0 7
Lait, vache, poudre, crm Milk, cow, powdered,
skimmed 3.13 16.07 45.98 34.82 0 7
Yaourt, lait entier, nature Yoghurt, whole milk, plain 0.00 6.25 12.50 81.25 0 0
Vegetables and vegetable products
sorrel, dried 0.00 0.00 0.00 0.00 0 0
Aswat Eggplant, purple 0.00 0.00 0.00 0.00 0 0
Aubergine, crue Eggplant, raw 0.00 3.13 21.88 75.00 0 0
Carotte, crue Carrot, raw 0.00 12.50 31.25 56.25 0 7
Chou, cru Cabbage, raw 0.00 12.50 12.50 75.00 0 0
Concombre, cru Cucumber, raw 0.00 46.88 40.63 12.50 0 7
feuille d'oseille Sorrel, raw 3.13 31.25 12.50 53.13 0 7
Gombo, crue Okra, raw 6.25 0.00 46.88 46.88 0 7
Gombo, feuilles, cru Leaf, okra, raw 0.00 3.13 21.88 75.00 0 0
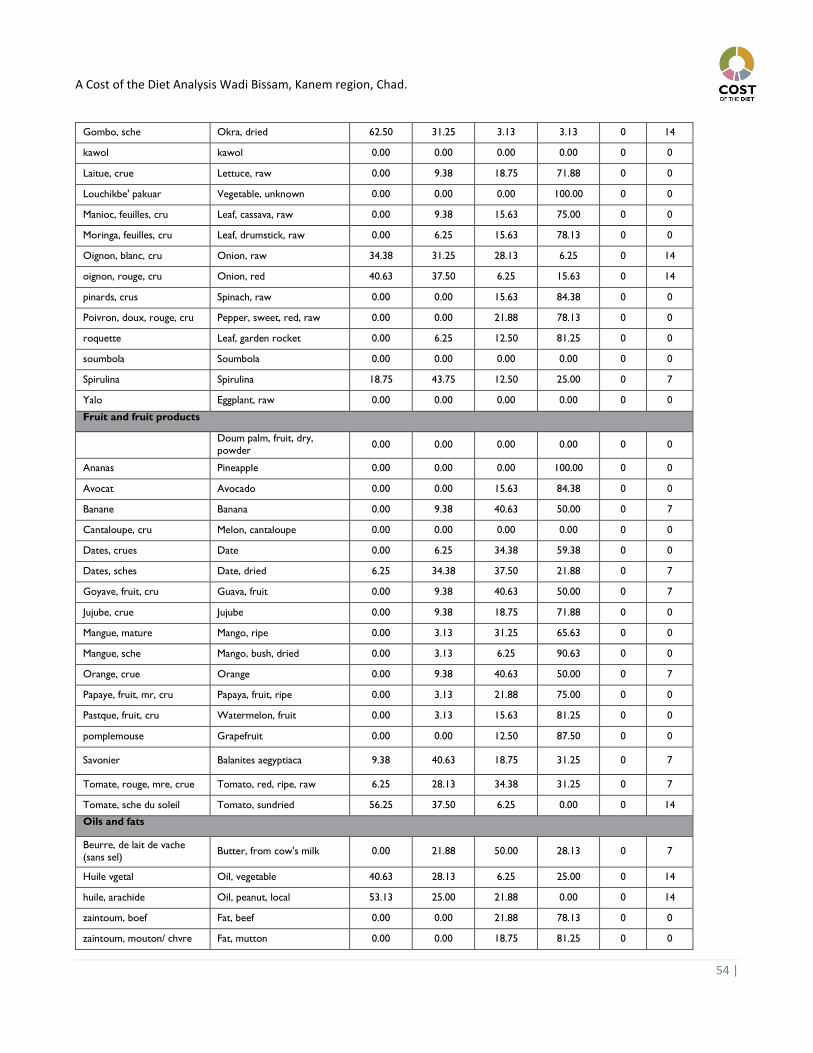
A Cost of the Diet Analysis Wadi Bissam, Kanem region, Chad.
54 |
Gombo, sche Okra, dried 62.50 31.25 3.13 3.13 0 14
kawol kawol 0.00 0.00 0.00 0.00 0 0
Laitue, crue Lettuce, raw 0.00 9.38 18.75 71.88 0 0
Louchikbe' pakuar Vegetable, unknown 0.00 0.00 0.00 100.00 0 0
Manioc, feuilles, cru Leaf, cassava, raw 0.00 9.38 15.63 75.00 0 0
Moringa, feuilles, cru Leaf, drumstick, raw 0.00 6.25 15.63 78.13 0 0
Oignon, blanc, cru Onion, raw 34.38 31.25 28.13 6.25 0 14
oignon, rouge, cru Onion, red 40.63 37.50 6.25 15.63 0 14
pinards, crus Spinach, raw 0.00 0.00 15.63 84.38 0 0
Poivron, doux, rouge, cru Pepper, sweet, red, raw 0.00 0.00 21.88 78.13 0 0
roquette Leaf, garden rocket 0.00 6.25 12.50 81.25 0 0
soumbola Soumbola 0.00 0.00 0.00 0.00 0 0
Spirulina Spirulina 18.75 43.75 12.50 25.00 0 7
Yalo Eggplant, raw 0.00 0.00 0.00 0.00 0 0
Fruit and fruit products
Doum palm, fruit, dry, powder
0.00 0.00 0.00 0.00 0 0
Ananas Pineapple 0.00 0.00 0.00 100.00 0 0
Avocat Avocado 0.00 0.00 15.63 84.38 0 0
Banane Banana 0.00 9.38 40.63 50.00 0 7
Cantaloupe, cru Melon, cantaloupe 0.00 0.00 0.00 0.00 0 0
Dates, crues Date 0.00 6.25 34.38 59.38 0 0
Dates, sches Date, dried 6.25 34.38 37.50 21.88 0 7
Goyave, fruit, cru Guava, fruit 0.00 9.38 40.63 50.00 0 7
Jujube, crue Jujube 0.00 9.38 18.75 71.88 0 0
Mangue, mature Mango, ripe 0.00 3.13 31.25 65.63 0 0
Mangue, sche Mango, bush, dried 0.00 3.13 6.25 90.63 0 0
Orange, crue Orange 0.00 9.38 40.63 50.00 0 7
Papaye, fruit, mr, cru Papaya, fruit, ripe 0.00 3.13 21.88 75.00 0 0
Pastque, fruit, cru Watermelon, fruit 0.00 3.13 15.63 81.25 0 0
pomplemouse Grapefruit 0.00 0.00 12.50 87.50 0 0
Savonier Balanites aegyptiaca 9.38 40.63 18.75 31.25 0 7
Tomate, rouge, mre, crue Tomato, red, ripe, raw 6.25 28.13 34.38 31.25 0 7
Tomate, sche du soleil Tomato, sundried 56.25 37.50 6.25 0.00 0 14
Oils and fats
Beurre, de lait de vache (sans sel)
Butter, from cow's milk 0.00 21.88 50.00 28.13 0 7
Huile vgetal Oil, vegetable 40.63 28.13 6.25 25.00 0 14
huile, arachide Oil, peanut, local 53.13 25.00 21.88 0.00 0 14
zaintoum, boef Fat, beef 0.00 0.00 21.88 78.13 0 0
zaintoum, mouton/ chvre Fat, mutton 0.00 0.00 18.75 81.25 0 0
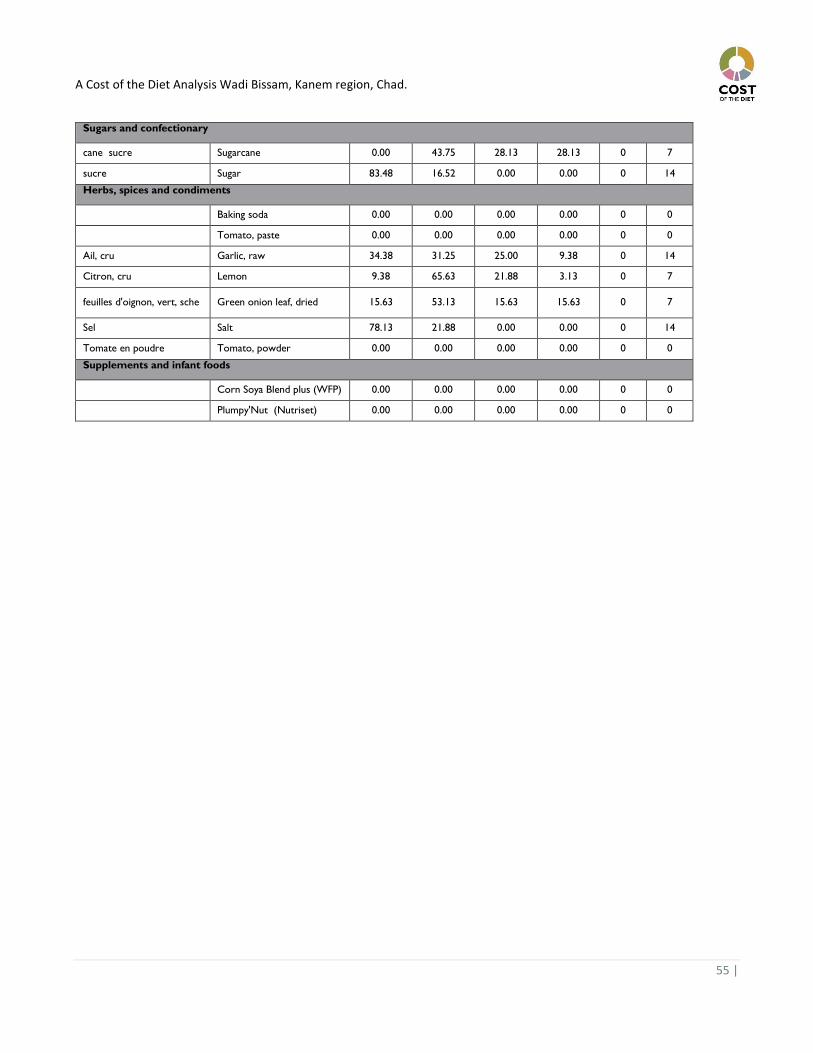
A Cost of the Diet Analysis Wadi Bissam, Kanem region, Chad.
55 |
Sugars and confectionary
cane sucre Sugarcane 0.00 43.75 28.13 28.13 0 7
sucre Sugar 83.48 16.52 0.00 0.00 0 14
Herbs, spices and condiments
Baking soda 0.00 0.00 0.00 0.00 0 0
Tomato, paste 0.00 0.00 0.00 0.00 0 0
Ail, cru Garlic, raw 34.38 31.25 25.00 9.38 0 14
Citron, cru Lemon 9.38 65.63 21.88 3.13 0 7
feuilles d'oignon, vert, sche Green onion leaf, dried 15.63 53.13 15.63 15.63 0 7
Sel Salt 78.13 21.88 0.00 0.00 0 14
Tomate en poudre Tomato, powder 0.00 0.00 0.00 0.00 0 0
Supplements and infant foods
Corn Soya Blend plus (WFP) 0.00 0.00 0.00 0.00 0 0
Plumpy'Nut (Nutriset) 0.00 0.00 0.00 0.00 0 0
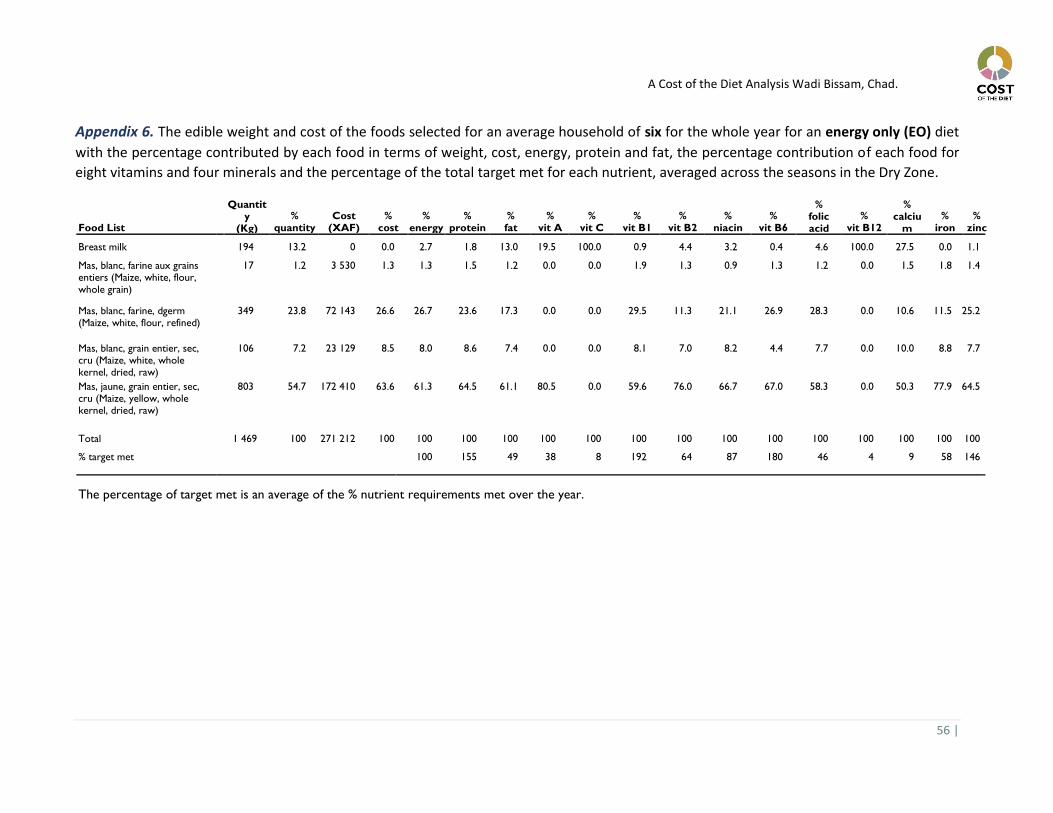
A Cost of the Diet Analysis Wadi Bissam, Chad.
56 |
Appendix 6. The edible weight and cost of the foods selected for an average household of six for the whole year for an energy only (EO) diet
with the percentage contributed by each food in terms of weight, cost, energy, protein and fat, the percentage contribution of each food for
eight vitamins and four minerals and the percentage of the total target met for each nutrient, averaged across the seasons in the Dry Zone.
Food List
Quantity
(Kg)
% quantity
Cost (XAF)
% cost
% energy
% protein
% fat
% vit A
% vit C
% vit B1
% vit B2
% niacin
% vit B6
% folic acid
% vit B12
% calciu
m
% iron
% zinc
Breast milk 194 13.2 0 0.0 2.7 1.8 13.0 19.5 100.0 0.9 4.4 3.2 0.4 4.6 100.0 27.5 0.0 1.1
Mas, blanc, farine aux grains entiers (Maize, white, flour, whole grain)
17 1.2 3 530 1.3 1.3 1.5 1.2 0.0 0.0 1.9 1.3 0.9 1.3 1.2 0.0 1.5 1.8 1.4
Mas, blanc, farine, dgerm (Maize, white, flour, refined)
349 23.8 72 143 26.6 26.7 23.6 17.3 0.0 0.0 29.5 11.3 21.1 26.9 28.3 0.0 10.6 11.5 25.2
Mas, blanc, grain entier, sec, cru (Maize, white, whole kernel, dried, raw)
106 7.2 23 129 8.5 8.0 8.6 7.4 0.0 0.0 8.1 7.0 8.2 4.4 7.7 0.0 10.0 8.8 7.7
Mas, jaune, grain entier, sec, cru (Maize, yellow, whole kernel, dried, raw)
803 54.7 172 410 63.6 61.3 64.5 61.1 80.5 0.0 59.6 76.0 66.7 67.0 58.3 0.0 50.3 77.9 64.5
Total 1 469 100 271 212 100 100 100 100 100 100 100 100 100 100 100 100 100 100 100
% target met 100 155 49 38 8 192 64 87 180 46 4 9 58 146
The percentage of target met is an average of the % nutrient requirements met over the year.
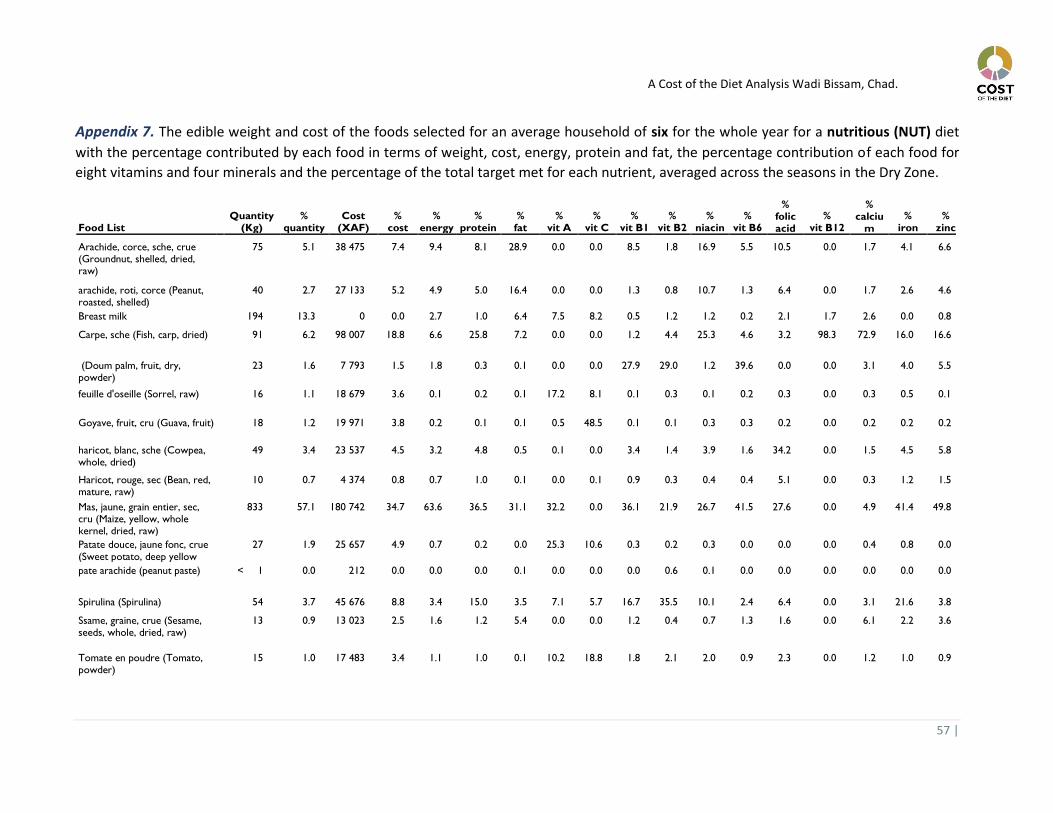
A Cost of the Diet Analysis Wadi Bissam, Chad.
57 |
Appendix 7. The edible weight and cost of the foods selected for an average household of six for the whole year for a nutritious (NUT) diet
with the percentage contributed by each food in terms of weight, cost, energy, protein and fat, the percentage contribution of each food for
eight vitamins and four minerals and the percentage of the total target met for each nutrient, averaged across the seasons in the Dry Zone.
Food List
Quantity
(Kg) %
quantity Cost
(XAF) %
cost %
energy %
protein % fat
% vit A
% vit C
% vit B1
% vit B2
% niacin
% vit B6
% folic acid
% vit B12
% calciu
m
% iron
% zinc
Arachide, corce, sche, crue (Groundnut, shelled, dried, raw)
75 5.1 38 475 7.4 9.4 8.1 28.9 0.0 0.0 8.5 1.8 16.9 5.5 10.5 0.0 1.7 4.1 6.6
arachide, roti, corce (Peanut, roasted, shelled)
40 2.7 27 133 5.2 4.9 5.0 16.4 0.0 0.0 1.3 0.8 10.7 1.3 6.4 0.0 1.7 2.6 4.6
Breast milk 194 13.3 0 0.0 2.7 1.0 6.4 7.5 8.2 0.5 1.2 1.2 0.2 2.1 1.7 2.6 0.0 0.8
Carpe, sche (Fish, carp, dried) 91 6.2 98 007 18.8 6.6 25.8 7.2 0.0 0.0 1.2 4.4 25.3 4.6 3.2 98.3 72.9 16.0 16.6
(Doum palm, fruit, dry, powder)
23 1.6 7 793 1.5 1.8 0.3 0.1 0.0 0.0 27.9 29.0 1.2 39.6 0.0 0.0 3.1 4.0 5.5
feuille d'oseille (Sorrel, raw) 16 1.1 18 679 3.6 0.1 0.2 0.1 17.2 8.1 0.1 0.3 0.1 0.2 0.3 0.0 0.3 0.5 0.1
Goyave, fruit, cru (Guava, fruit) 18 1.2 19 971 3.8 0.2 0.1 0.1 0.5 48.5 0.1 0.1 0.3 0.3 0.2 0.0 0.2 0.2 0.2
haricot, blanc, sche (Cowpea, whole, dried)
49 3.4 23 537 4.5 3.2 4.8 0.5 0.1 0.0 3.4 1.4 3.9 1.6 34.2 0.0 1.5 4.5 5.8
Haricot, rouge, sec (Bean, red, mature, raw)
10 0.7 4 374 0.8 0.7 1.0 0.1 0.0 0.1 0.9 0.3 0.4 0.4 5.1 0.0 0.3 1.2 1.5
Mas, jaune, grain entier, sec, cru (Maize, yellow, whole kernel, dried, raw)
833 57.1 180 742 34.7 63.6 36.5 31.1 32.2 0.0 36.1 21.9 26.7 41.5 27.6 0.0 4.9 41.4 49.8
Patate douce, jaune fonc, crue (Sweet potato, deep yellow (red), raw)
27 1.9 25 657 4.9 0.7 0.2 0.0 25.3 10.6 0.3 0.2 0.3 0.0 0.0 0.0 0.4 0.8 0.0
pate arachide (peanut paste) < 1 0.0 212 0.0 0.0 0.0 0.1 0.0 0.0 0.0 0.6 0.1 0.0 0.0 0.0 0.0 0.0 0.0
Spirulina (Spirulina) 54 3.7 45 676 8.8 3.4 15.0 3.5 7.1 5.7 16.7 35.5 10.1 2.4 6.4 0.0 3.1 21.6 3.8
Ssame, graine, crue (Sesame, seeds, whole, dried, raw)
13 0.9 13 023 2.5 1.6 1.2 5.4 0.0 0.0 1.2 0.4 0.7 1.3 1.6 0.0 6.1 2.2 3.6
Tomate en poudre (Tomato, powder)
15 1.0 17 483 3.4 1.1 1.0 0.1 10.2 18.8 1.8 2.1 2.0 0.9 2.3 0.0 1.2 1.0 0.9
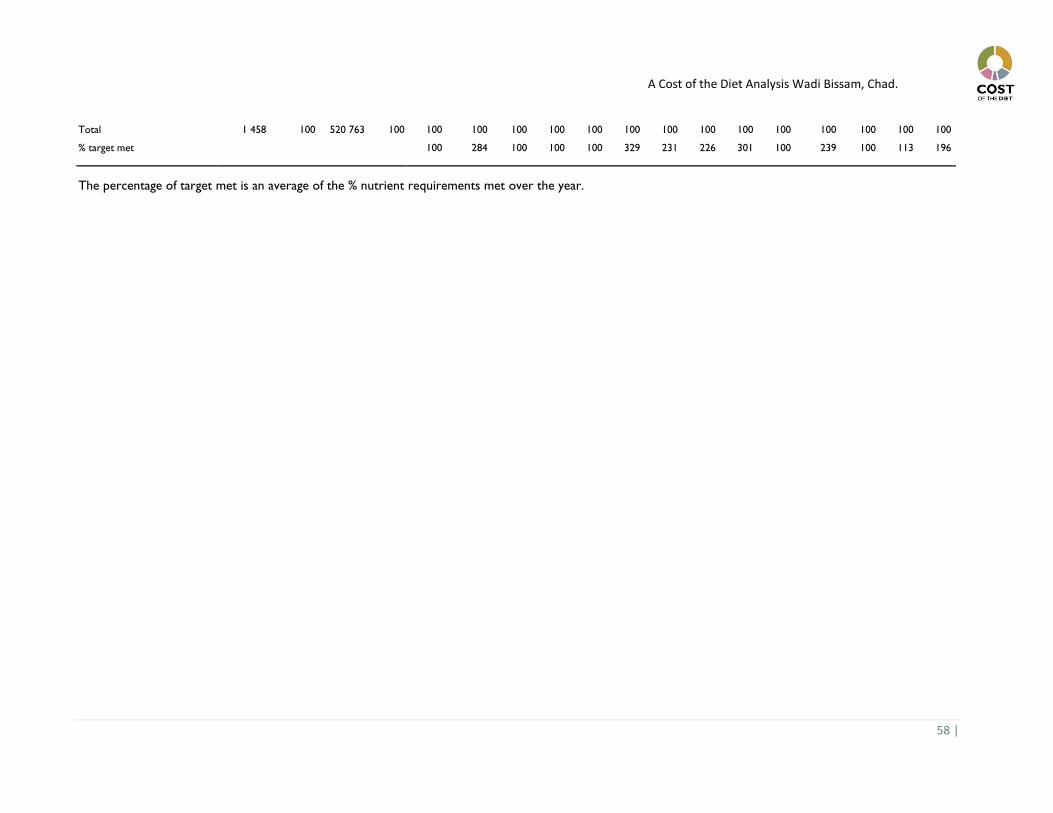
A Cost of the Diet Analysis Wadi Bissam, Chad.
58 |
Total 1 458 100 520 763 100 100 100 100 100 100 100 100 100 100 100 100 100 100 100
% target met 100 284 100 100 100 329 231 226 301 100 239 100 113 196
The percentage of target met is an average of the % nutrient requirements met over the year.
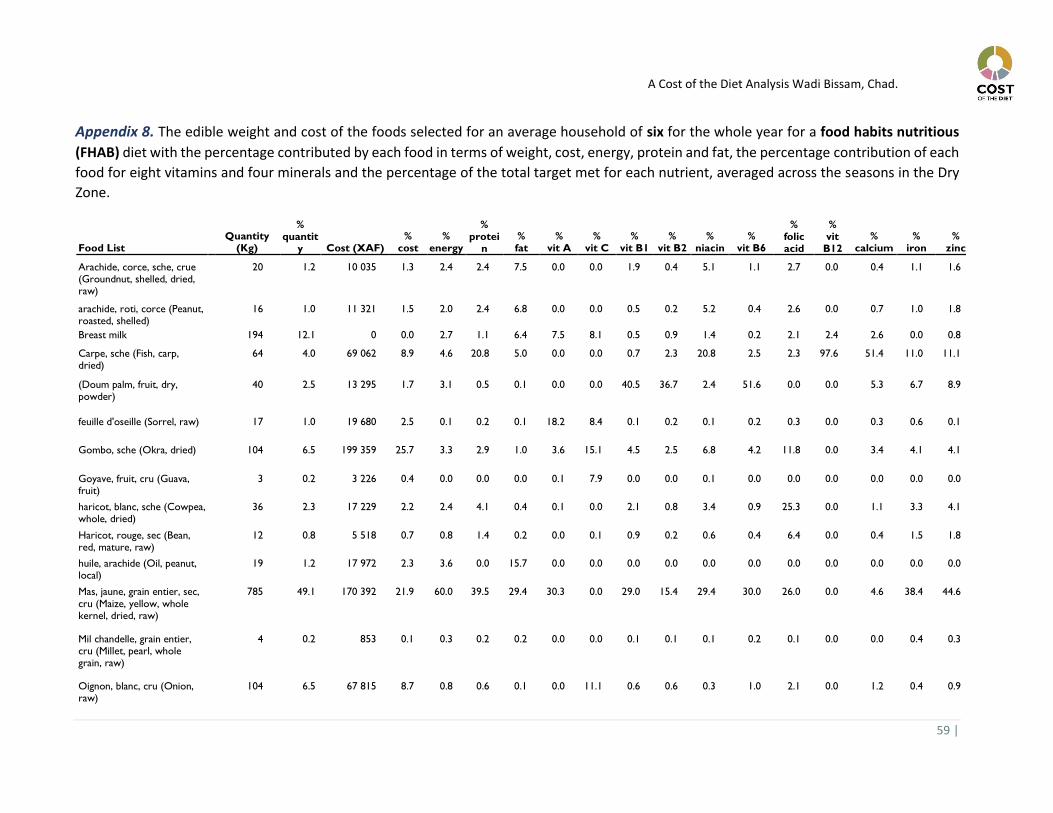
A Cost of the Diet Analysis Wadi Bissam, Chad.
59 |
Appendix 8. The edible weight and cost of the foods selected for an average household of six for the whole year for a food habits nutritious
(FHAB) diet with the percentage contributed by each food in terms of weight, cost, energy, protein and fat, the percentage contribution of each
food for eight vitamins and four minerals and the percentage of the total target met for each nutrient, averaged across the seasons in the Dry
Zone.
Food List
Quantity
(Kg)
% quantit
y Cost (XAF) %
cost %
energy
% protei
n
% fat
% vit A
% vit C
% vit B1
% vit B2
% niacin
% vit B6
% folic acid
% vit
B12
% calcium
% iron
% zinc
Arachide, corce, sche, crue (Groundnut, shelled, dried, raw)
20 1.2 10 035 1.3 2.4 2.4 7.5 0.0 0.0 1.9 0.4 5.1 1.1 2.7 0.0 0.4 1.1 1.6
arachide, roti, corce (Peanut, roasted, shelled)
16 1.0 11 321 1.5 2.0 2.4 6.8 0.0 0.0 0.5 0.2 5.2 0.4 2.6 0.0 0.7 1.0 1.8
Breast milk 194 12.1 0 0.0 2.7 1.1 6.4 7.5 8.1 0.5 0.9 1.4 0.2 2.1 2.4 2.6 0.0 0.8
Carpe, sche (Fish, carp, dried)
64 4.0 69 062 8.9 4.6 20.8 5.0 0.0 0.0 0.7 2.3 20.8 2.5 2.3 97.6 51.4 11.0 11.1
(Doum palm, fruit, dry, powder)
40 2.5 13 295 1.7 3.1 0.5 0.1 0.0 0.0 40.5 36.7 2.4 51.6 0.0 0.0 5.3 6.7 8.9
feuille d'oseille (Sorrel, raw) 17 1.0 19 680 2.5 0.1 0.2 0.1 18.2 8.4 0.1 0.2 0.1 0.2 0.3 0.0 0.3 0.6 0.1
Gombo, sche (Okra, dried) 104 6.5 199 359 25.7 3.3 2.9 1.0 3.6 15.1 4.5 2.5 6.8 4.2 11.8 0.0 3.4 4.1 4.1
Goyave, fruit, cru (Guava, fruit)
3 0.2 3 226 0.4 0.0 0.0 0.0 0.1 7.9 0.0 0.0 0.1 0.0 0.0 0.0 0.0 0.0 0.0
haricot, blanc, sche (Cowpea, whole, dried)
36 2.3 17 229 2.2 2.4 4.1 0.4 0.1 0.0 2.1 0.8 3.4 0.9 25.3 0.0 1.1 3.3 4.1
Haricot, rouge, sec (Bean, red, mature, raw)
12 0.8 5 518 0.7 0.8 1.4 0.2 0.0 0.1 0.9 0.2 0.6 0.4 6.4 0.0 0.4 1.5 1.8
huile, arachide (Oil, peanut, local)
19 1.2 17 972 2.3 3.6 0.0 15.7 0.0 0.0 0.0 0.0 0.0 0.0 0.0 0.0 0.0 0.0 0.0
Mas, jaune, grain entier, sec, cru (Maize, yellow, whole kernel, dried, raw)
785 49.1 170 392 21.9 60.0 39.5 29.4 30.3 0.0 29.0 15.4 29.4 30.0 26.0 0.0 4.6 38.4 44.6
Mil chandelle, grain entier, cru (Millet, pearl, whole grain, raw)
4 0.2 853 0.1 0.3 0.2 0.2 0.0 0.0 0.1 0.1 0.1 0.2 0.1 0.0 0.0 0.4 0.3
Oignon, blanc, cru (Onion, raw)
104 6.5 67 815 8.7 0.8 0.6 0.1 0.0 11.1 0.6 0.6 0.3 1.0 2.1 0.0 1.2 0.4 0.9
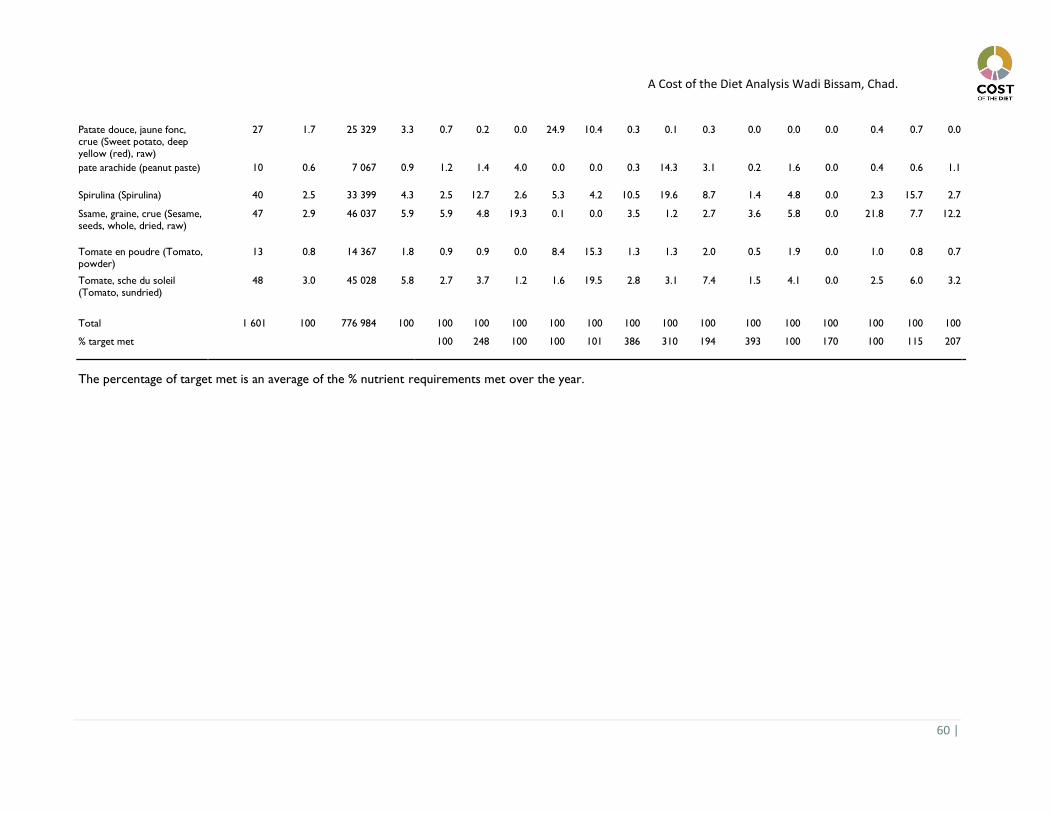
A Cost of the Diet Analysis Wadi Bissam, Chad.
60 |
Patate douce, jaune fonc, crue (Sweet potato, deep yellow (red), raw)
27 1.7 25 329 3.3 0.7 0.2 0.0 24.9 10.4 0.3 0.1 0.3 0.0 0.0 0.0 0.4 0.7 0.0
pate arachide (peanut paste) 10 0.6 7 067 0.9 1.2 1.4 4.0 0.0 0.0 0.3 14.3 3.1 0.2 1.6 0.0 0.4 0.6 1.1
Spirulina (Spirulina) 40 2.5 33 399 4.3 2.5 12.7 2.6 5.3 4.2 10.5 19.6 8.7 1.4 4.8 0.0 2.3 15.7 2.7
Ssame, graine, crue (Sesame, seeds, whole, dried, raw)
47 2.9 46 037 5.9 5.9 4.8 19.3 0.1 0.0 3.5 1.2 2.7 3.6 5.8 0.0 21.8 7.7 12.2
Tomate en poudre (Tomato, powder)
13 0.8 14 367 1.8 0.9 0.9 0.0 8.4 15.3 1.3 1.3 2.0 0.5 1.9 0.0 1.0 0.8 0.7
Tomate, sche du soleil (Tomato, sundried)
48 3.0 45 028 5.8 2.7 3.7 1.2 1.6 19.5 2.8 3.1 7.4 1.5 4.1 0.0 2.5 6.0 3.2
Total 1 601 100 776 984 100 100 100 100 100 100 100 100 100 100 100 100 100 100 100
% target met 100 248 100 100 101 386 310 194 393 100 170 100 115 207
The percentage of target met is an average of the % nutrient requirements met over the year.
A Cost of the Diet Analysis Wadi Bissam, Chad.
61 |
Related Documents
![The Spread of Agro-Pastoral Economies across Mediterranean ... · [Journal of Mediterranean Archaeology 611 (1993) 5-63] The Spread of Agro-Pastoral Economies across Mediterranean](https://static.cupdf.com/doc/110x72/5c16aeed09d3f2c0488cec45/the-spread-of-agro-pastoral-economies-across-mediterranean-journal-of-mediterranean.jpg)


![Toward a Definition of Minoan Agro-Pastoral Landscapes ... · 480 hector a. orengo and carl knappett [aja 122 2018] Minoan Agro-Pastoral Landscapes: the Survey at Palaikastro (Crete)481](https://static.cupdf.com/doc/110x72/5e1f80b1df46a07a6d26942f/toward-a-definition-of-minoan-agro-pastoral-landscapes-480-hector-a-orengo.jpg)