A Cost Effective Multi-Spectral Scanner for Natural Gas Detection Final Technical Report Reporting Period Start Date: 10/01/2003 Reporting Period End Date: 9/30/2005 Principal Authors: Yudaya Sivathanu, Jongmook Lim, Vinoo Narayanan, and Seonghyeon Park Issue Date: December 7, 2005 Contract Number: DE-FC26-03NT41857 Submitting Organization: En’Urga Inc. 1291-A, Cumberland Avenue West Lafayette, IN 47906

Welcome message from author
This document is posted to help you gain knowledge. Please leave a comment to let me know what you think about it! Share it to your friends and learn new things together.
Transcript

A Cost Effective Multi-Spectral Scanner for Natural Gas Detection
Final Technical Report
Reporting Period Start Date: 10/01/2003
Reporting Period End Date: 9/30/2005
Principal Authors: Yudaya Sivathanu, Jongmook Lim, Vinoo Narayanan, and Seonghyeon Park Issue Date: December 7, 2005 Contract Number: DE-FC26-03NT41857 Submitting Organization: En’Urga Inc. 1291-A, Cumberland Avenue West Lafayette, IN 47906

1
Final Technical Report on
A Cost Effective Multi-Spectral Scanner for Natural Gas Detection Yudaya Sivathanu, Jongmook Lim, Vinoo Narayanan, and Seonghyeon Park
DISCLAIMER NOTICE
This report was prepared as an account of work sponsored by an agency of the United States Government. Neither the United States Government nor any agency thereof, nor any of their employees, makes any warranty, express or implied, or assumes any legal liability or responsibility for the accuracy, completeness, or usefulness of any information, apparatus, product, or process disclosed, or represents that its use would not infringe privately owned rights. Reference herein to any specific commercial product, process, or service by trade name, trademark, manufacturer, or otherwise does not necessarily constitute or imply its endorsement, recommendation, or favoring by the United States Government or any agency thereof. The views and opinions of authors expressed herein do not necessarily state or reflect those of the United States Government or any agency thereof.

2
A Cost Effective Multi-Spectral Scanner for Natural Gas Detection
ABSTRACT
The objective of this project is to design, fabricate and demonstrate a cost effective, multi-spectral scanner for natural gas leak detection in transmission and distribution pipelines. During the first year of the project, a laboratory version of the multi-spectral scanner was designed, fabricated, and tested at En’Urga Inc. The multi-spectral scanner was also evaluated using a blind Department of Energy study at the Rocky Mountain Oilfield Testing Center. The performance of the scanner was inconsistent during the blind study. However, most of the leaks were outside the view of the multi-spectral scanner that was developed during the first year of the project. Therefore, a definite evaluation of the capability of the scanner was not obtained. Despite the results, sufficient number of plumes was detected fully confirming the feasibility of the multi-spectral scanner. During the second year, the optical design of the scanner was changed to improve the sensitivity of the system. Laboratory tests show that the system can reliably detect small leaks (20 SCFH) at 30 to 50 feet. A prototype scanner was built and evaluated during the second year of the project. Only laboratory evaluations were completed during the second year. The laboratory evaluations show the feasibility of using the scanner to determine natural gas pipeline leaks. Further field evaluations and optimization of the scanner are required before commercialization of the scanner can be initiated.

3
TABLE OF CONTENTS Title Page
Disclaimer Notice ……………………………………….……………………………… 1
Abstract ………………………………………………..…………………………….… 2
List of Figures …………………………………………………………………………. 4
Nomeclature …………………………………………………………………………… 5
Executive Summary …………………………………………………………………… 6
1. Research Management Report …………………………..……………………… 7
2. Technology Status Report …………………………………….………………… 7
3. Design and Fabrication of Laboratory Scale Scanner …………..……….……… 9
4. Evaluation of the Laboratory Scale Scanner ………………….………………… 15
5. Development of Prototype Scanner ……………………………………………. 21
6. Evaluation of the Prototype Scanner ……………………….………………… 29
7. Conclusions and Recommendations …………..………………………………… 30

4
List of Figures
Figure No. Title Page No.
1. Schematic diagram of the optical design for the multi-spectral scanner. 9
2. Optical performance of the scanner/lens combination for the multi-spectral scanner. 9
3. Theoretical transmittance from a column of natural gas. 10
4. Sample ratio of intensities from a surface attenuated due to natural gas in the path. 11
5. Circuit used for direct signal amplification on each detector of the sensor. 12
6. Circuit used for lock-in amplification on each detector of the sensor. 13
7. Engineering drawings of the housing assembly for the scanner optics. 14
8. Side view and front view of the scanner assembly. 14
9. Photograph of scanner housing with the four element sensor and PCBs. 15
10. Experimental arrangement used to evaluate the multi-spectral scanner. 16
11. Raw voltages seen on the four sensors with and without a methane leak in the path. 16
12. Ratio of intensities obtained from the multi-spectral scanner. 17
13. Photograph of the laboratory scale scanner mounted on a tripod. 17
14. Photograph of the prototype multi-spectral scanner. 21
15. Modified design and spot diagram of the lens for the prototype scanner. 22
16. Schematic of the stepper motor drive electronics. 23
17. Photograph of the stepper motor driver board. 23
18. Flow chart for the main program of the stepper motor micro-controller. 24
19. Flow chart for the SLEW subroutine. 25
20. low chart for the ACW subroutine. 25
21. Flow chart for the COUNT subroutine. 26
22. Photograph of the single board computer (microprocessor). 27
23. Photograph of the arrangement used to evaluate the prototype scanner. 28
24. Photograph of the LCD screen during the evaluation tests. 28
25. Photograph of the arrangement used to evaluate the prototype scanner. 29
26. Sample results obtained from the prototype scanner. 30

5
Nomenclature
ACW Subroutine for executing a counter clockwise step with the stepper motor ADC Analog to digital converter C1 First radiation constant, 0.59544 x 10⁸ W-μm4/m2 C2 Second radiation constant, 14,388 μm-K CH4 Methane CO2 Carbon dioxide COUNT Subroutine for counting the number of steps taken by the stepper motor CW Subroutine for executing a clockwise step with the stepper motor DOE Department of Energy Iλ Spectral radiation intensity, W/m2-μm-str. Iλb Spectral radiation intensity from a black body, kW/m2-μm-str. LCD Liquid crystal display LED Light emitting diode LR Left to right motion for the stepper motor NETL National Energy Technology Laboratory PCB Printed circuit board PbSe Lead selenide RL Right to left motion for the stepper motor RMOTC Rocky Mountain Oilfield Testing Center RMS Root mean square SBC Single board computer SCFH Standard cubic foot per hour SLEW Subroutine for performing a slewing motion with the stepper motor SRAM Static random access memory T Temperature TTL Transistor-transistor logic
Greek
ελ Spectral emissivity λ Wavelength, μm

6
A Cost Effective Multi-Spectral Scanner for Natural Gas Detection
1. Executive Summary
The objective of the project was to design, fabricate and evaluate a cost effective, multi-spectral scanner for natural gas leak detection in transmission and distribution pipelines. The six specific tasks of the project were: (1) development of a research management plan, (2) assessment of current natural gas leak detection technology, (3) design and fabrication of a laboratory scale multi-spectral scanner, (4) evaluation of the laboratory scale multi-spectral scanner, (5) design and fabrication of a prototype multi-spectral scanner, and (6) evaluation of the prototype multi-spectral scanner. The first task, which was the development of the research management plan, was completed during the initial month of the project and provided to National Energy Technology Laboratory (NETL). The second task, which was the review of the natural gas leak detection technology, was completed during the second month of the project. The report is available online at the Department of Energy’s website. The third task was the design and fabrication of a laboratory scale multi-spectral scanner. The design and fabrication of the laboratory scale multi-spectral scanner was completed during the tenth month of the project. The laboratory scale scanner was housed in an aluminum enclosure, with power supply and data acquisition cables running from the enclosure. The data was collected using a data acquisition system installed on a laboratory computer. The fourth task was the evaluation of the performance of the laboratory scale scanner. The performance of the system was evaluated for stationary applications at En’Urga Inc. and found to be satisfactory. The scanner was then evaluated using a Department of Energy organized test at Rocky Mountain Oilfield Testing Center (RMOTC). The evaluations were not good since the multi-spectral scanner was mounted on a vehicle and most of the leaks were outside the stated view area of the scanner. However, some plumes from big leaks were detected, even when outside the view area of the scanner. The fifth task on the project was the fabrication and evaluation of a rugged, prototype scanner. During the second year of the project, a prototype version of the scanner was designed and fabricated. The prototype version has all the electronic, optical, and mechanical components integrated into one package. A Liquid Crystal Display (LCD) for the leaks was part of the package. The only external connection to the scanner was a 12V power supply. The final task on the project was the evaluation of the prototype scanner. The prototype scanner was evaluated under laboratory conditions at En’Urga Inc. Reliable detection of natural gas leaks as low as 25 SCFH was obtained. Further field evaluations and optimization are required before commercialization of the sensor can begin. It is anticipated that optimization and commercialization of the sensor requires about two to three years of additional work.

7
A Cost Effective Multi-Spectral Scanner for Natural Gas Detection
The final report on the development of the multi-spectral scanner for natural gas detection is covered in six parts. These parts correspond to the different tasks completed during the two years of the project in a chronological order. 1. Research Management Report
The first task of the project was the development of a research management report. The list of deliverables and target dates for the project are shown in Table 1.
Table 1: List of Deliverable and Target Dates
Item No. Deliverable Target Date 1 Research management plan October 31, 2003 2 Technology status report/briefing November 30, 2003 3 First bi-annual report April 15, 2004 4 Second bi-annual report October 15, 2004 5 Conference presentation October 15, 2004 6 Third bi-annual report April 15, 2005 7 Final report October 15, 2005 8 Informal reports Monthly
The list of milestones for the project, with target dates are shown in Table 2.
Table 2: List of Milestone with Target Dates
Item No. Milestones Target Date 1 Laboratory scanner design February 29,2004 2 Laboratory scanner
fabrication/calibration May 29,2004
3 Laboratory scanner evaluation September 30, 2004 4 Prototype PCB design and fabrication January 31, 2005 5 Prototype scanner
fabrication/calibration May 31, 2005
6 Prototype scanner evaluation September 15, 2005 A detailed description of the deliverables and milestones was provided to DOE during the first month of the project. 2. Technology Status Report
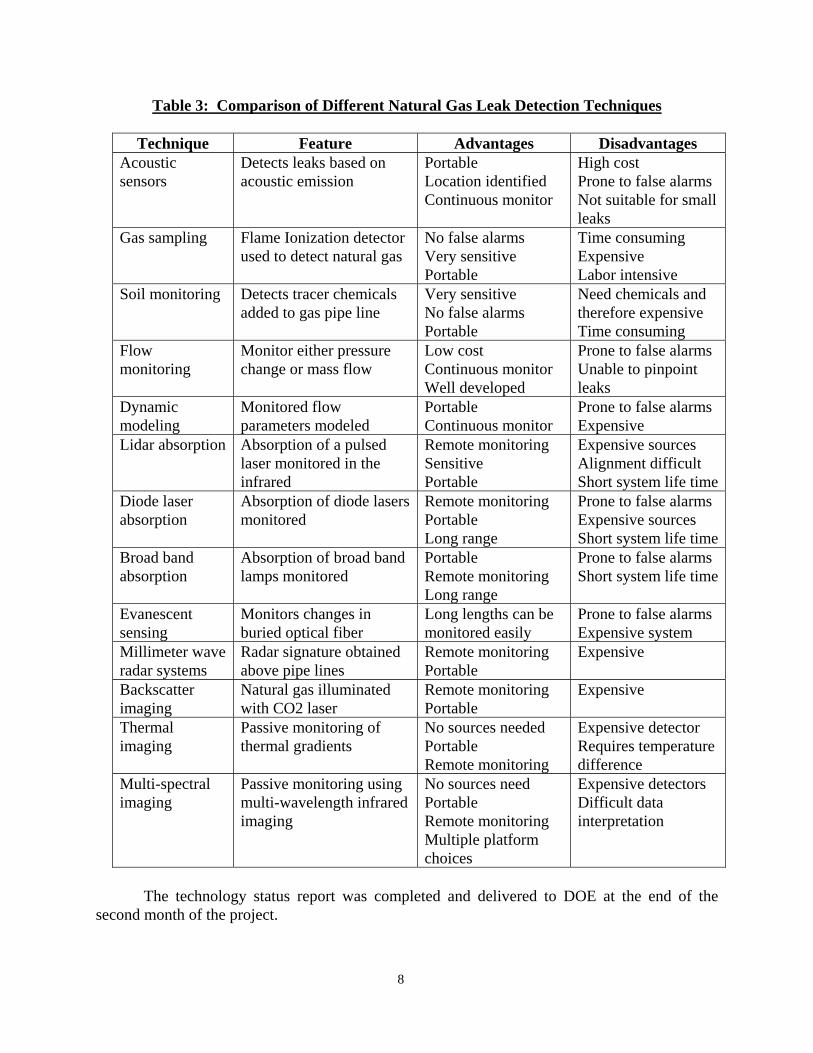
The second task of the project was the creation of a technology status report. The technology status report highlighted the current status of pipeline leak detection. A summary comparison of the different natural gas leak detection techniques is provided in Table 3.
8
Table 3: Comparison of Different Natural Gas Leak Detection Techniques
Technique Feature Advantages Disadvantages Acoustic sensors
Detects leaks based on acoustic emission
Portable Location identified Continuous monitor
High cost Prone to false alarms Not suitable for small leaks
Gas sampling Flame Ionization detector used to detect natural gas
No false alarms Very sensitive Portable
Time consuming Expensive Labor intensive
Soil monitoring Detects tracer chemicals added to gas pipe line
Very sensitive No false alarms Portable
Need chemicals and therefore expensive Time consuming
Flow monitoring
Monitor either pressure change or mass flow
Low cost Continuous monitor Well developed
Prone to false alarms Unable to pinpoint leaks
Dynamic modeling
Monitored flow parameters modeled
Portable Continuous monitor
Prone to false alarms Expensive
Lidar absorption Absorption of a pulsed laser monitored in the infrared
Remote monitoring Sensitive Portable
Expensive sources Alignment difficult Short system life time
Diode laser absorption
Absorption of diode lasers monitored
Remote monitoring Portable Long range
Prone to false alarms Expensive sources Short system life time
Broad band absorption
Absorption of broad band lamps monitored
Portable Remote monitoring Long range
Prone to false alarms Short system life time
Evanescent sensing
Monitors changes in buried optical fiber
Long lengths can be monitored easily
Prone to false alarms Expensive system
Millimeter wave radar systems
Radar signature obtained above pipe lines
Remote monitoring Portable
Expensive
Backscatter imaging
Natural gas illuminated with CO2 laser
Remote monitoring Portable
Expensive
Thermal imaging
Passive monitoring of thermal gradients
No sources needed Portable Remote monitoring
Expensive detector Requires temperature difference
Multi-spectral imaging
Passive monitoring using multi-wavelength infrared imaging
No sources need Portable Remote monitoring Multiple platform choices
Expensive detectors Difficult data interpretation
The technology status report was completed and delivered to DOE at the end of the second month of the project.
9
3. Design and Fabrication of the Laboratory Scale Scanner
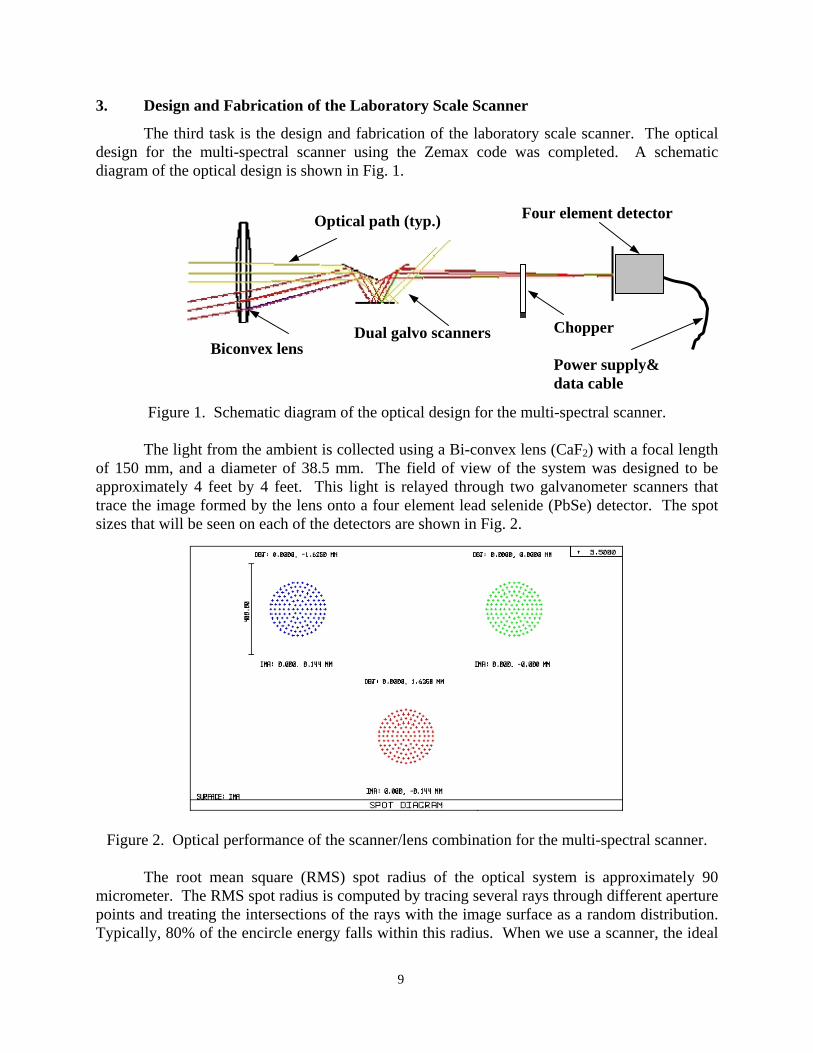
The third task is the design and fabrication of the laboratory scale scanner. The optical design for the multi-spectral scanner using the Zemax code was completed. A schematic diagram of the optical design is shown in Fig. 1.
Figure 1. Schematic diagram of the optical design for the multi-spectral scanner. The light from the ambient is collected using a Bi-convex lens (CaF2) with a focal length of 150 mm, and a diameter of 38.5 mm. The field of view of the system was designed to be approximately 4 feet by 4 feet. This light is relayed through two galvanometer scanners that trace the image formed by the lens onto a four element lead selenide (PbSe) detector. The spot sizes that will be seen on each of the detectors are shown in Fig. 2.
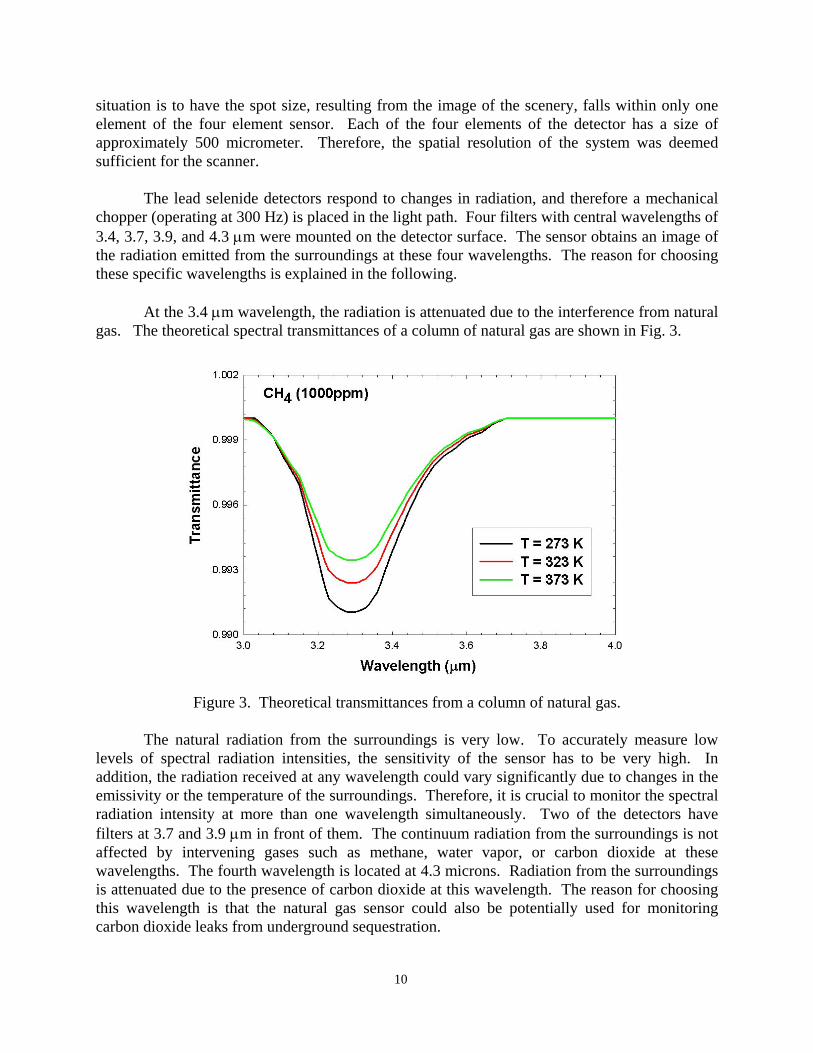
Figure 2. Optical performance of the scanner/lens combination for the multi-spectral scanner. The root mean square (RMS) spot radius of the optical system is approximately 90 micrometer. The RMS spot radius is computed by tracing several rays through different aperture points and treating the intersections of the rays with the image surface as a random distribution. Typically, 80% of the encircle energy falls within this radius. When we use a scanner, the ideal
Biconvex lens
Optical path (typ.)
Dual galvo scanners
Four element detector
Power supply& data cable
Chopper
10
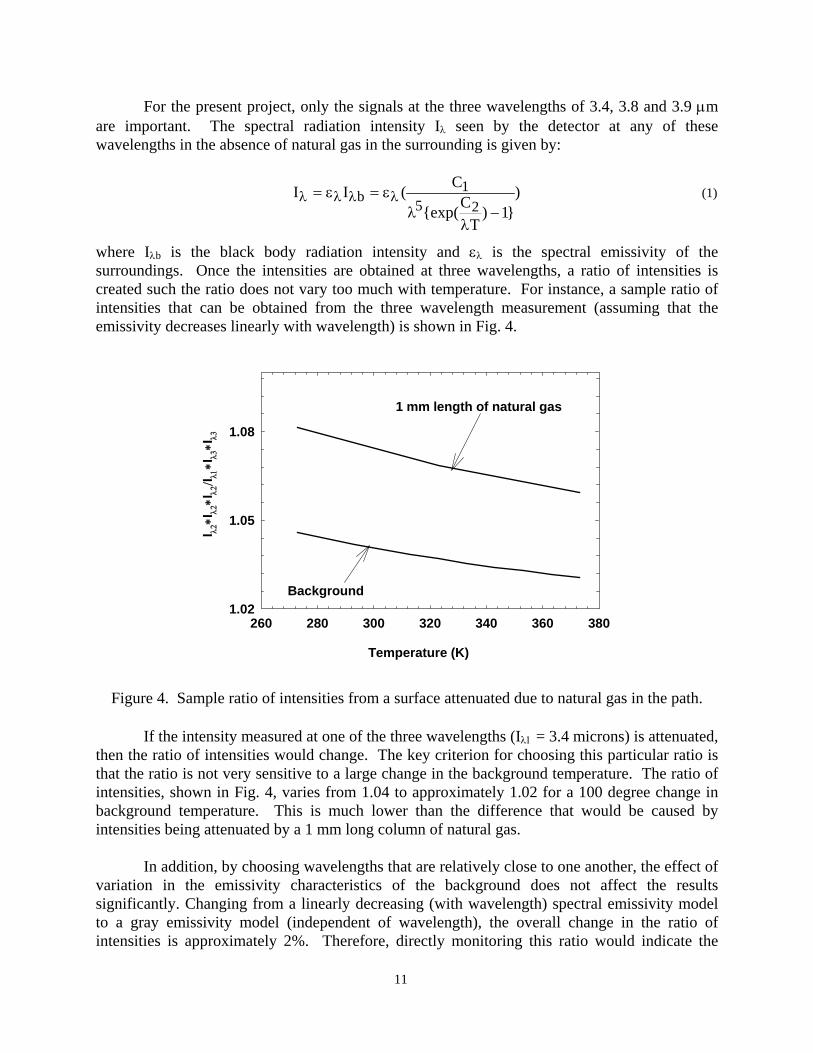
situation is to have the spot size, resulting from the image of the scenery, falls within only one element of the four element sensor. Each of the four elements of the detector has a size of approximately 500 micrometer. Therefore, the spatial resolution of the system was deemed sufficient for the scanner. The lead selenide detectors respond to changes in radiation, and therefore a mechanical chopper (operating at 300 Hz) is placed in the light path. Four filters with central wavelengths of 3.4, 3.7, 3.9, and 4.3 μm were mounted on the detector surface. The sensor obtains an image of the radiation emitted from the surroundings at these four wavelengths. The reason for choosing these specific wavelengths is explained in the following. At the 3.4 μm wavelength, the radiation is attenuated due to the interference from natural gas. The theoretical spectral transmittances of a column of natural gas are shown in Fig. 3.
Figure 3. Theoretical transmittances from a column of natural gas. The natural radiation from the surroundings is very low. To accurately measure low levels of spectral radiation intensities, the sensitivity of the sensor has to be very high. In addition, the radiation received at any wavelength could vary significantly due to changes in the emissivity or the temperature of the surroundings. Therefore, it is crucial to monitor the spectral radiation intensity at more than one wavelength simultaneously. Two of the detectors have filters at 3.7 and 3.9 μm in front of them. The continuum radiation from the surroundings is not affected by intervening gases such as methane, water vapor, or carbon dioxide at these wavelengths. The fourth wavelength is located at 4.3 microns. Radiation from the surroundings is attenuated due to the presence of carbon dioxide at this wavelength. The reason for choosing this wavelength is that the natural gas sensor could also be potentially used for monitoring carbon dioxide leaks from underground sequestration.
11
For the present project, only the signals at the three wavelengths of 3.4, 3.8 and 3.9 μm are important. The spectral radiation intensity Iλ seen by the detector at any of these wavelengths in the absence of natural gas in the surrounding is given by:
)}1)
TC{exp(
C(II25
1b
−λ
λε=ε= λλλλ (1)
where Iλb is the black body radiation intensity and ελ is the spectral emissivity of the surroundings. Once the intensities are obtained at three wavelengths, a ratio of intensities is created such the ratio does not vary too much with temperature. For instance, a sample ratio of intensities that can be obtained from the three wavelength measurement (assuming that the emissivity decreases linearly with wavelength) is shown in Fig. 4.
Figure 4. Sample ratio of intensities from a surface attenuated due to natural gas in the path. If the intensity measured at one of the three wavelengths (Iλ1 = 3.4 microns) is attenuated, then the ratio of intensities would change. The key criterion for choosing this particular ratio is that the ratio is not very sensitive to a large change in the background temperature. The ratio of intensities, shown in Fig. 4, varies from 1.04 to approximately 1.02 for a 100 degree change in background temperature. This is much lower than the difference that would be caused by intensities being attenuated by a 1 mm long column of natural gas. In addition, by choosing wavelengths that are relatively close to one another, the effect of variation in the emissivity characteristics of the background does not affect the results significantly. Changing from a linearly decreasing (with wavelength) spectral emissivity model to a gray emissivity model (independent of wavelength), the overall change in the ratio of intensities is approximately 2%. Therefore, directly monitoring this ratio would indicate the
260 280 300 320 340 360 3801.02
1.05
1.08
I λ2∗I
λ2∗I
λ2/I λ
1∗I λ3∗I
λ3
Temperature (K)
Background (no methane)
1 mm length of natural gas

12
R1
R3
R4
R5
R6
R7
R8
C4
C6 C8
C5C7
C2
C3
+5
+5
-512
JP1B+
C1
R2
1SP1
2
3
8
1
4
U1A6
57U1B
2
38
14
U2A
6
57
U2B
+5
-5
C39
C40
presence of natural gas in the path of the surface radiation seen by the sensor. The potential causes for false alarm rises from differences in the emissivity of the surfaces resulting from different spectral characteristics than the one assumed. This can be circumvented to a certain degree by increasing the threshold value for indication of a leak. The electronic design of the sensor is one of the most challenging aspects of developing the sensor. To achieve high amplification, with minimal noise, lock-in amplification of the signals is required. Three printed circuit boards (PCBs) were used in the multi-spectral scanner to provide for a noise free image of the scenery at the four wavelengths. The first PCB provides bias voltages to the PbSe detectors and amplifies the raw electrical signal from the detectors. The second PCB provides lock-in amplification of the electrical signals from the detector, with the lock-in signal being provided from the chopper. The third PCB was used to control the motion of the galvo-scanners in synchronization with the data acquisition. The three PCBs are described in further detail below. The schematic of a part of the first PCB is shown in Fig. 5. The schematic shows the
Figure 5. Circuit used for direct signal amplification on each detector of the sensor. biasing and amplifier part of one detector of the four element sensor. The input from the detector is shown as 1s at the left end of the circuit. The circuit is a three stage amplifier (consisting of Op-Amps (U), capacitors ©, and resistors ®), followed by a buffer stage. The output from the detector after amplification is marked P1 in the above schematic. The values of the capacitors and resistors are chosen to enable an optimal response for a chopping frequency of 300 Hz, and a total amplification of approximately 2,500. The same elements of the above circuit are repeated four times for the four detectors of sensor. The circuits for the four detectors are placed in one PCB along with the connectors to the power supply and the other two PCBs. The output signal from the above PCB board goes to the second PCB for lock-in amplification. A schematic of the lock-in amplifier circuit for one detector is shown in Fig. 6. The input S1 corresponds to the output P1 from the first PCB.
13
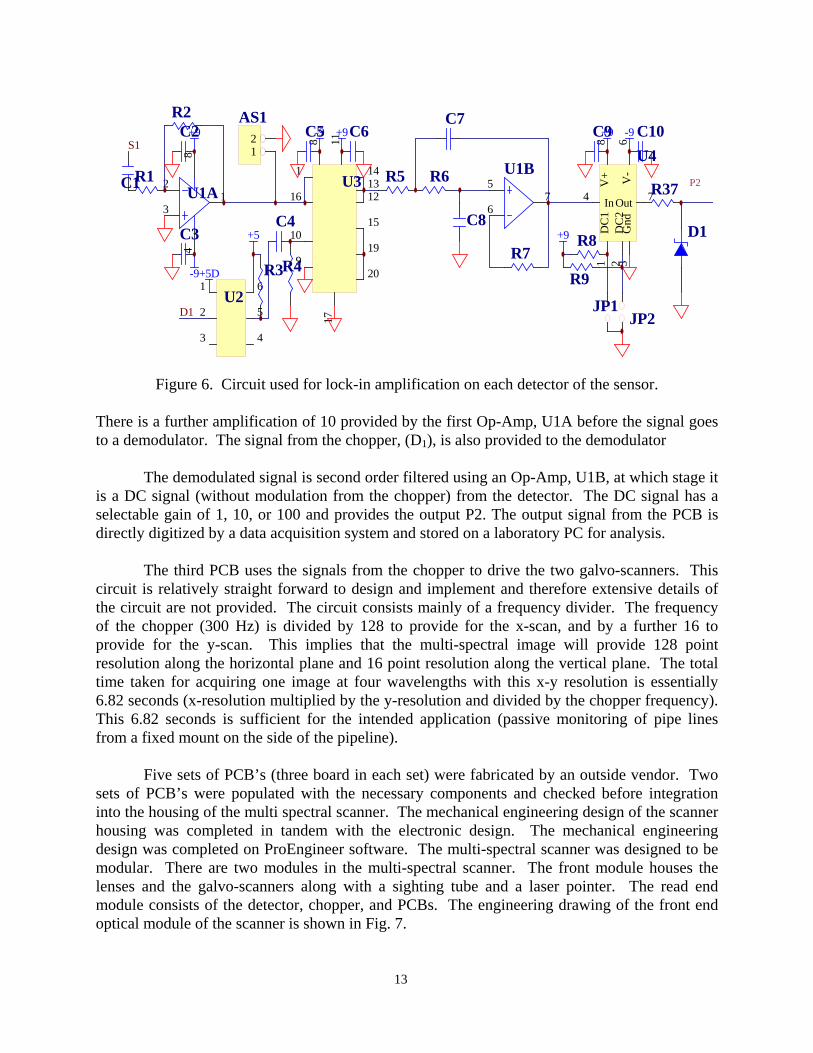
Figure 6. Circuit used for lock-in amplification on each detector of the sensor. There is a further amplification of 10 provided by the first Op-Amp, U1A before the signal goes to a demodulator. The signal from the chopper, (D1), is also provided to the demodulator The demodulated signal is second order filtered using an Op-Amp, U1B, at which stage it is a DC signal (without modulation from the chopper) from the detector. The DC signal has a selectable gain of 1, 10, or 100 and provides the output P2. The output signal from the PCB is directly digitized by a data acquisition system and stored on a laboratory PC for analysis. The third PCB uses the signals from the chopper to drive the two galvo-scanners. This circuit is relatively straight forward to design and implement and therefore extensive details of the circuit are not provided. The circuit consists mainly of a frequency divider. The frequency of the chopper (300 Hz) is divided by 128 to provide for the x-scan, and by a further 16 to provide for the y-scan. This implies that the multi-spectral image will provide 128 point resolution along the horizontal plane and 16 point resolution along the vertical plane. The total time taken for acquiring one image at four wavelengths with this x-y resolution is essentially 6.82 seconds (x-resolution multiplied by the y-resolution and divided by the chopper frequency). This 6.82 seconds is sufficient for the intended application (passive monitoring of pipe lines from a fixed mount on the side of the pipeline). Five sets of PCB’s (three board in each set) were fabricated by an outside vendor. Two sets of PCB’s were populated with the necessary components and checked before integration into the housing of the multi spectral scanner. The mechanical engineering design of the scanner housing was completed in tandem with the electronic design. The mechanical engineering design was completed on ProEngineer software. The multi-spectral scanner was designed to be modular. There are two modules in the multi-spectral scanner. The front module houses the lenses and the galvo-scanners along with a sighting tube and a laser pointer. The read end module consists of the detector, chopper, and PCBs. The engineering drawing of the front end optical module of the scanner is shown in Fig. 7.
1
16
15
19
20
141312
10
9
8 1117
U3
1
2
3 4
5
6U2
48
2
31U1A
5
67
U1B
DC
11
DC
22
Gnd
3
In4
V+
8
V-
6
Out 7
U4
C4
R4R3
R1C1
R2
R5 R6
C7
C8
R7
+9 -9+9-9S1
+5
+9
-9
C2
C3 R8
R9
+9
+5D
D1
C5 C6 C9 C10
JP1JP2
12
AS1
R37
D1
P2
14
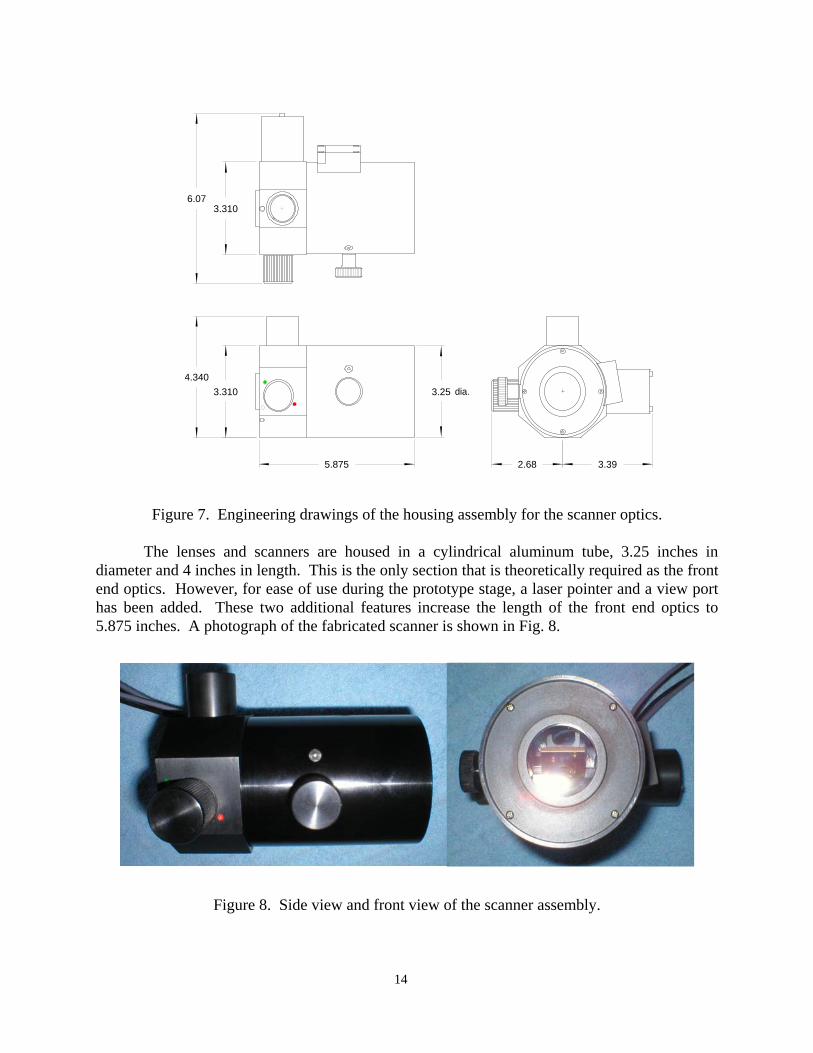
Figure 7. Engineering drawings of the housing assembly for the scanner optics. The lenses and scanners are housed in a cylindrical aluminum tube, 3.25 inches in diameter and 4 inches in length. This is the only section that is theoretically required as the front end optics. However, for ease of use during the prototype stage, a laser pointer and a view port has been added. These two additional features increase the length of the front end optics to 5.875 inches. A photograph of the fabricated scanner is shown in Fig. 8.
Figure 8. Side view and front view of the scanner assembly.
5.875
3.3104.340
dia.3.25
3.310
3.39
6.07
2.68
15
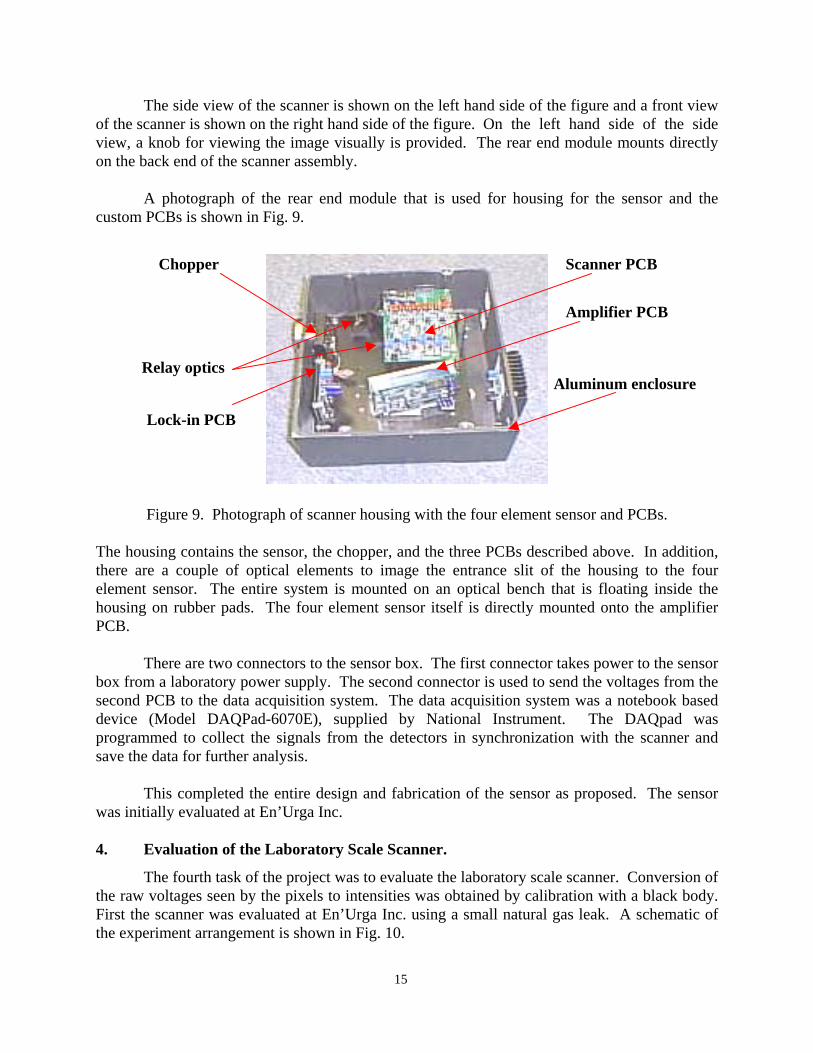
The side view of the scanner is shown on the left hand side of the figure and a front view of the scanner is shown on the right hand side of the figure. On the left hand side of the side view, a knob for viewing the image visually is provided. The rear end module mounts directly on the back end of the scanner assembly. A photograph of the rear end module that is used for housing for the sensor and the custom PCBs is shown in Fig. 9.
Figure 9. Photograph of scanner housing with the four element sensor and PCBs. The housing contains the sensor, the chopper, and the three PCBs described above. In addition, there are a couple of optical elements to image the entrance slit of the housing to the four element sensor. The entire system is mounted on an optical bench that is floating inside the housing on rubber pads. The four element sensor itself is directly mounted onto the amplifier PCB. There are two connectors to the sensor box. The first connector takes power to the sensor box from a laboratory power supply. The second connector is used to send the voltages from the second PCB to the data acquisition system. The data acquisition system was a notebook based device (Model DAQPad-6070E), supplied by National Instrument. The DAQpad was programmed to collect the signals from the detectors in synchronization with the scanner and save the data for further analysis. This completed the entire design and fabrication of the sensor as proposed. The sensor was initially evaluated at En’Urga Inc. 4. Evaluation of the Laboratory Scale Scanner.
The fourth task of the project was to evaluate the laboratory scale scanner. Conversion of the raw voltages seen by the pixels to intensities was obtained by calibration with a black body. First the scanner was evaluated at En’Urga Inc. using a small natural gas leak. A schematic of the experiment arrangement is shown in Fig. 10.
Amplifier PCB
Scanner PCB
Lock-in PCB
Chopper
Relay optics Aluminum enclosure
16
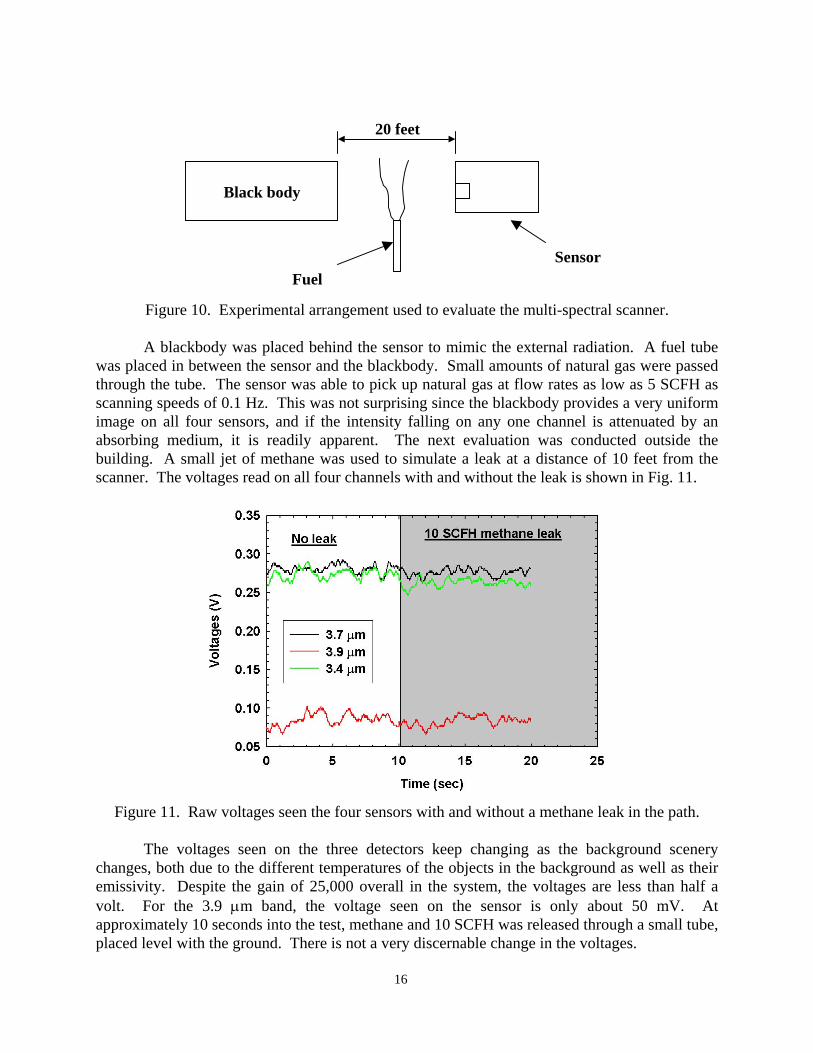
Figure 10. Experimental arrangement used to evaluate the multi-spectral scanner. A blackbody was placed behind the sensor to mimic the external radiation. A fuel tube was placed in between the sensor and the blackbody. Small amounts of natural gas were passed through the tube. The sensor was able to pick up natural gas at flow rates as low as 5 SCFH as scanning speeds of 0.1 Hz. This was not surprising since the blackbody provides a very uniform image on all four sensors, and if the intensity falling on any one channel is attenuated by an absorbing medium, it is readily apparent. The next evaluation was conducted outside the building. A small jet of methane was used to simulate a leak at a distance of 10 feet from the scanner. The voltages read on all four channels with and without the leak is shown in Fig. 11.
Figure 11. Raw voltages seen the four sensors with and without a methane leak in the path. The voltages seen on the three detectors keep changing as the background scenery changes, both due to the different temperatures of the objects in the background as well as their emissivity. Despite the gain of 25,000 overall in the system, the voltages are less than half a volt. For the 3.9 μm band, the voltage seen on the sensor is only about 50 mV. At approximately 10 seconds into the test, methane and 10 SCFH was released through a small tube, placed level with the ground. There is not a very discernable change in the voltages.
Black body
Fuel Sensor
20 feet
17
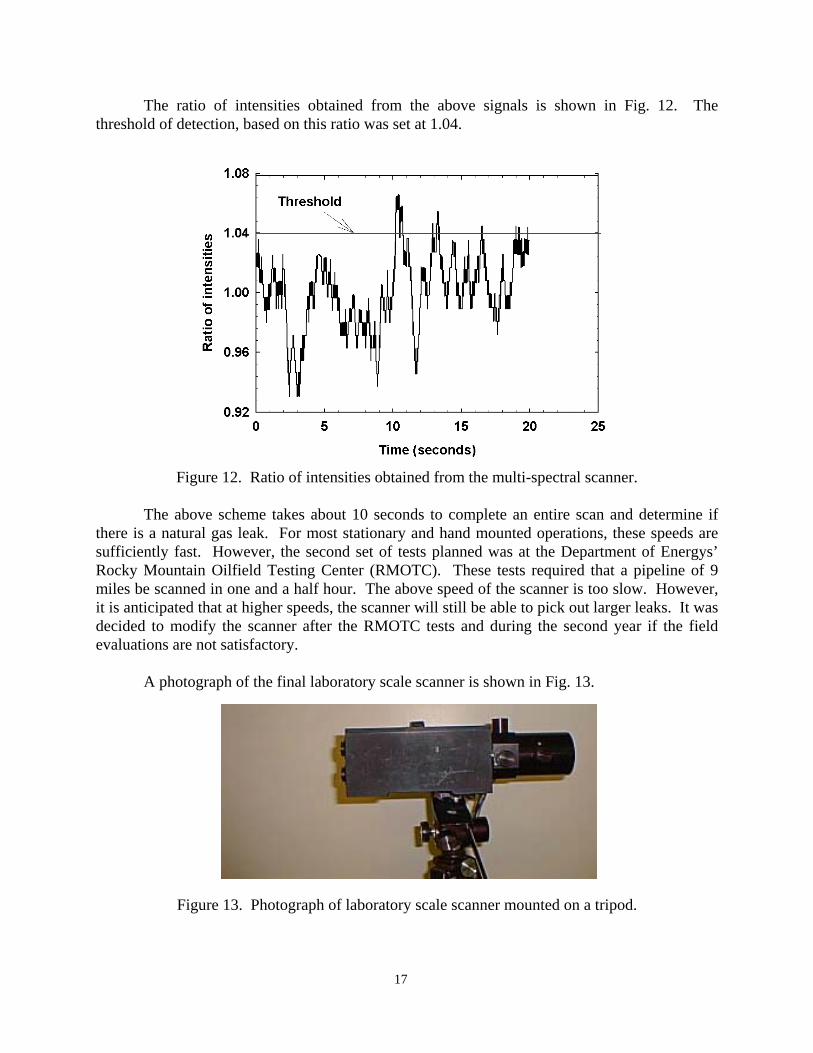
The ratio of intensities obtained from the above signals is shown in Fig. 12. The threshold of detection, based on this ratio was set at 1.04.
Figure 12. Ratio of intensities obtained from the multi-spectral scanner. The above scheme takes about 10 seconds to complete an entire scan and determine if there is a natural gas leak. For most stationary and hand mounted operations, these speeds are sufficiently fast. However, the second set of tests planned was at the Department of Energys’ Rocky Mountain Oilfield Testing Center (RMOTC). These tests required that a pipeline of 9 miles be scanned in one and a half hour. The above speed of the scanner is too slow. However, it is anticipated that at higher speeds, the scanner will still be able to pick out larger leaks. It was decided to modify the scanner after the RMOTC tests and during the second year if the field evaluations are not satisfactory. A photograph of the final laboratory scale scanner is shown in Fig. 13.
Figure 13. Photograph of laboratory scale scanner mounted on a tripod.
18
The scanner was mounted on a tripod so that it could be used for field trails. The sensor is to be evaluated in the field using a truck. Unlike a stand-alone application, this can cause serious vibration problems. The power for the scanner and the four element sensor was supplied from an external power supply box. The scanner housing also has two connectors attached to it. One connector supplies power to the scanner and the four element sensor. Another connector transfers the signal from the multi-spectral scanner to the data acquisition board on the computer. The field tests were conducted during the second week of September, at the RMOTC facility in Casper, Wyoming. For the tests, leaks of different sizes were present along a nine mile corridor. En’Urga Inc. and six other equipment providers used different methods to detect these leaks. For the leak tests performed at RMOTC, the system was mounted on a tripod inside a mini-van. The computer and data acquisition system was also placed within the mini-van. Data was collected continuously during the drive-through and analyzed later to provide the leak locations. The high speed required to scan a long pipeline from a moving platform, as opposed to a stationary platform, required data collection in one step and subsequent analysis off-line. Therefore, it was not possible to stop at suspected leak sites and obtain more definite data. Based on discussions with the test provider (SWRI), the optical design of the system was fixed to scan from the edge of the road to approximately 50 feet way from the road. The pre-test checks conducted were to ensure that the system was obtaining sufficient signals from the background radiation. At Wyoming, during all the tests, a minimum of 0.2 V was obtained from the background radiation at all times. This is sufficient to detect leaks from the natural gas pipelines, based on data obtained at En’Urga Inc. The data acquisition system collected the voltages on the four channels at a frequency of 10 Hz. Due to the difficulty in changing the orientation of the scanner, only one side of the road was scanned during each run. One continuous file of data was collected for each segment of the road, marked by the road crossing symbols, RC1, RC2, etc. Each file was named RCx-Rcy_date.scn, where x and y are the two neighboring road crossings. The data files were analyzed off-line to determine the absence/presence of natural gas leaks. The location of the leak was approximated by interpolating between the GPS readings of the two road crossing locations, with the ratio being determined by the position of the leak indication in the data file. This was necessary since the current system was not capable of simultaneously obtaining and displaying the leak at sufficiently high speeds required by the specific RMOTC test conditions. The system was tested on five separate passes. Only a portion of the pipeline was covered during each pass, as described in the following. In addition, most of the test leaks were well beyond 50 feet from the roadway. Therefore, these leaks cannot be detected and only the plumes from large leaks that are far away from the system were detected. The section of the pipelines scanned, the leaks along that section, and the results obtained from the scanner are shown in Tables 4-8. The five tables are broken down into the separate runs for each test. Comments on the performance of the sensor during the five test runs are also provided in the respective tables.

19
Table 4: September 13, Morning Run
Leak detected Leaks along scanned pipes Yes No
Comments
1 X Calibration leak close to road 2B X Small leak, 78 feet from road
X Some plume detected probably from upstream location 5 6 X Plume detected
Table 5: September 13, Afternoon Run
Leak detected Leaks along scanned pipes Yes No
Comments
1 X Calibration leak close to road Plume possibly detected at RC2
3 X Big leak, 44 feet from road, even the plume was not detected, could be due to a very high wind condition
4 X Small leak, 90 feet away 5 X Leak not detected at site, 59 feet from road and uphill.
Therefore leak location not scanned P2 X Plume detected, could be from 6 P5 X Very small leak
Table 6: September 14, Morning Run
Leak detected Leaks along scanned pipes Yes No
Comments
1 X Calibration leak close to road 3 X Big leak, 44 feet from road 4 X Medium leak, 90 feet from road
2D X Small, 100 feet from road 5 X Plume detected downstream 6 X Small leak 170 feet from road X A plume detected here, probably from upstream location
P5 X Very small leak
Table 7: September 14, Afternoon Run
Leak detected Leaks along scanned pipes Yes No
Comments
1 X Calibration leak close to road X Some plume detected here, probably from upstream
location 3 P1 X Big leak 78 feet from road

20
P2 X Small leak, 240 feet from road 6 X Small leak 170 feet from road
P3 X Small leak, 114 feet from road P4 X Medium leak, 66 feet from road
Table 8: September 15, Morning Run
Leak detected Leaks along scanned pipes Yes No
Comments
1 X Calibration leak close to road Also plume detected at RC2Calibration leak close to
road 2C X Small leak, 122 feet from road 3 X Small leak, 44 feet from road 4 X Plume detected downstream
2D X Small leak 100 feet from road 5 X Leak not detected at site, 59 feet from road and uphill.
Therefore leak location not scanned Some plume detected here, probably from upstream
location P4 P5 X Very small leak
The following conclusions were drawn from the first set of field tests.
1 Small leaks that are more than 50 feet from road cannot be detected when the multi-spectral scanner is configured to scan only up to 50 feet from the mount location.
2. The exact leak location cannot be determined unless the vehicle-mounted scanner is
riding on top of the pipeline. If the scanner is on a moving platform and scanning some distance to the side, only approximate locations of the plume itself can be ascertained.
3. For future tests, it would be desirable to have an access way on top of the pipeline.
Failing that, all leaks should be located within 50 feet from the middle of the road, or prior notice of the maximum distance of the leak location from the road should be provided.
4. Only one portion of the road could be scanned on each pass since the entire pipeline had
to be inspected at 2/3rd the speed of an aircraft inspection. The results of the evaluation were not definitive since most of the leaks were more than 50 ft away from the pipeline. In addition, the dust collected on the system prevented testing of the laboratory scale scanner after three days. It was hoped that the field tests could be repeated after the prototype scanner is developed during the second year of the project. However, this has not been possible. Therefore, field evaluations of the prototype scanner have to be conducted in some future date, and under some other program.
21
5. Development of Prototype Scanner
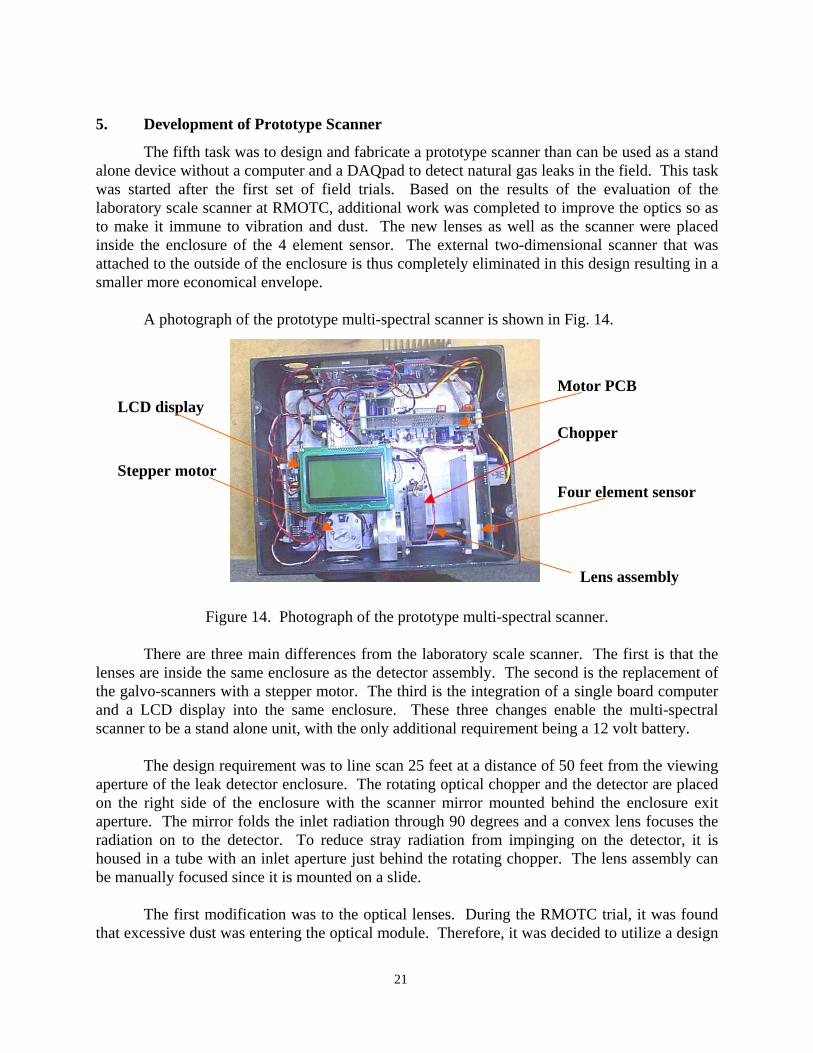
The fifth task was to design and fabricate a prototype scanner than can be used as a stand alone device without a computer and a DAQpad to detect natural gas leaks in the field. This task was started after the first set of field trials. Based on the results of the evaluation of the laboratory scale scanner at RMOTC, additional work was completed to improve the optics so as to make it immune to vibration and dust. The new lenses as well as the scanner were placed inside the enclosure of the 4 element sensor. The external two-dimensional scanner that was attached to the outside of the enclosure is thus completely eliminated in this design resulting in a smaller more economical envelope. A photograph of the prototype multi-spectral scanner is shown in Fig. 14.
Figure 14. Photograph of the prototype multi-spectral scanner. There are three main differences from the laboratory scale scanner. The first is that the lenses are inside the same enclosure as the detector assembly. The second is the replacement of the galvo-scanners with a stepper motor. The third is the integration of a single board computer and a LCD display into the same enclosure. These three changes enable the multi-spectral scanner to be a stand alone unit, with the only additional requirement being a 12 volt battery. The design requirement was to line scan 25 feet at a distance of 50 feet from the viewing aperture of the leak detector enclosure. The rotating optical chopper and the detector are placed on the right side of the enclosure with the scanner mirror mounted behind the enclosure exit aperture. The mirror folds the inlet radiation through 90 degrees and a convex lens focuses the radiation on to the detector. To reduce stray radiation from impinging on the detector, it is housed in a tube with an inlet aperture just behind the rotating chopper. The lens assembly can be manually focused since it is mounted on a slide. The first modification was to the optical lenses. During the RMOTC trial, it was found that excessive dust was entering the optical module. Therefore, it was decided to utilize a design
Stepper motor
LCD display
Lens assembly
Four element sensor
Motor PCB
Chopper
22
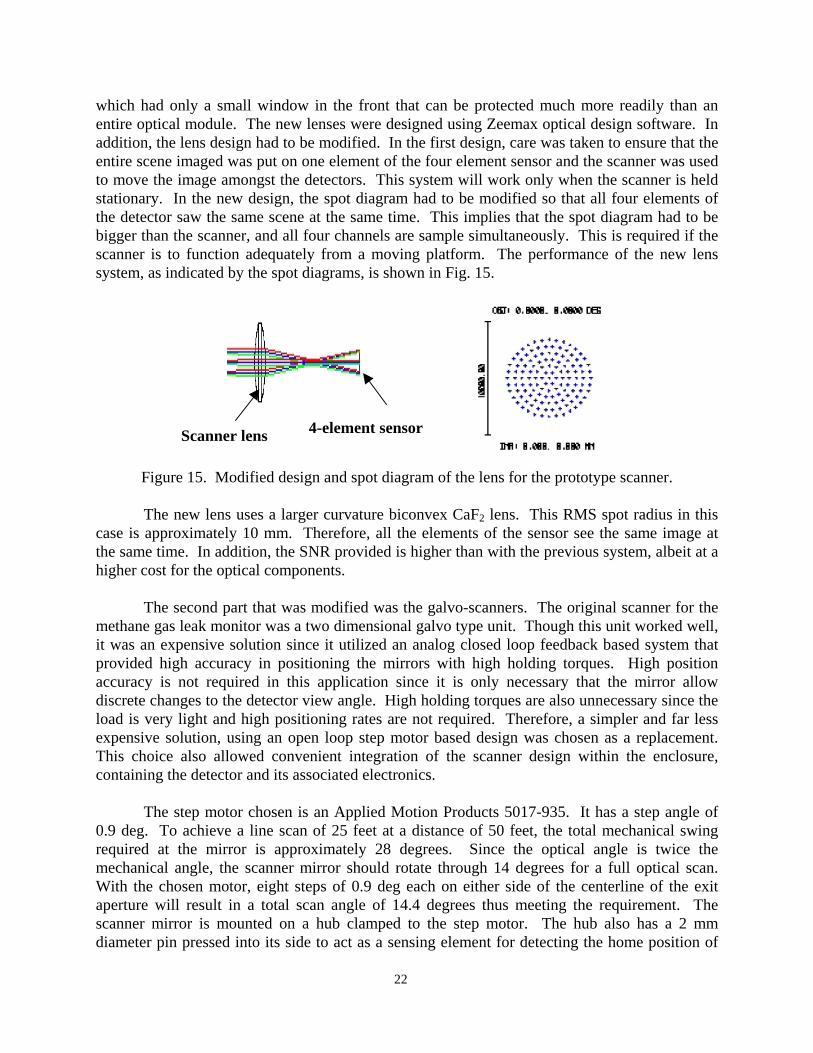
which had only a small window in the front that can be protected much more readily than an entire optical module. The new lenses were designed using Zeemax optical design software. In addition, the lens design had to be modified. In the first design, care was taken to ensure that the entire scene imaged was put on one element of the four element sensor and the scanner was used to move the image amongst the detectors. This system will work only when the scanner is held stationary. In the new design, the spot diagram had to be modified so that all four elements of the detector saw the same scene at the same time. This implies that the spot diagram had to be bigger than the scanner, and all four channels are sample simultaneously. This is required if the scanner is to function adequately from a moving platform. The performance of the new lens system, as indicated by the spot diagrams, is shown in Fig. 15.
Figure 15. Modified design and spot diagram of the lens for the prototype scanner. The new lens uses a larger curvature biconvex CaF2 lens. This RMS spot radius in this case is approximately 10 mm. Therefore, all the elements of the sensor see the same image at the same time. In addition, the SNR provided is higher than with the previous system, albeit at a higher cost for the optical components. The second part that was modified was the galvo-scanners. The original scanner for the methane gas leak monitor was a two dimensional galvo type unit. Though this unit worked well, it was an expensive solution since it utilized an analog closed loop feedback based system that provided high accuracy in positioning the mirrors with high holding torques. High position accuracy is not required in this application since it is only necessary that the mirror allow discrete changes to the detector view angle. High holding torques are also unnecessary since the load is very light and high positioning rates are not required. Therefore, a simpler and far less expensive solution, using an open loop step motor based design was chosen as a replacement. This choice also allowed convenient integration of the scanner design within the enclosure, containing the detector and its associated electronics. The step motor chosen is an Applied Motion Products 5017-935. It has a step angle of 0.9 deg. To achieve a line scan of 25 feet at a distance of 50 feet, the total mechanical swing required at the mirror is approximately 28 degrees. Since the optical angle is twice the mechanical angle, the scanner mirror should rotate through 14 degrees for a full optical scan. With the chosen motor, eight steps of 0.9 deg each on either side of the centerline of the exit aperture will result in a total scan angle of 14.4 degrees thus meeting the requirement. The scanner mirror is mounted on a hub clamped to the step motor. The hub also has a 2 mm diameter pin pressed into its side to act as a sensing element for detecting the home position of
Scanner lens 4-element sensor
23
PD0 2
PD1 3
PD2 6
PD3 7
MR
1
GN
D10
PB012
PB113
PB214
PB315
PB416
PB517 Vcc
20
U1
Vcc
28
1Y 3
3Y 11
2Y 6
4Y 14
1,2EN 1
3,4EN 9
G4
G5
G13
G12
Vcc116
1A2
2A7
3A10
4A15
U2
C2C1
C3
R1
+5
+5
+5
+9+5 C4
CHOP
RL
LR
CK
R
HOME
1234
J1
S1
R4+5
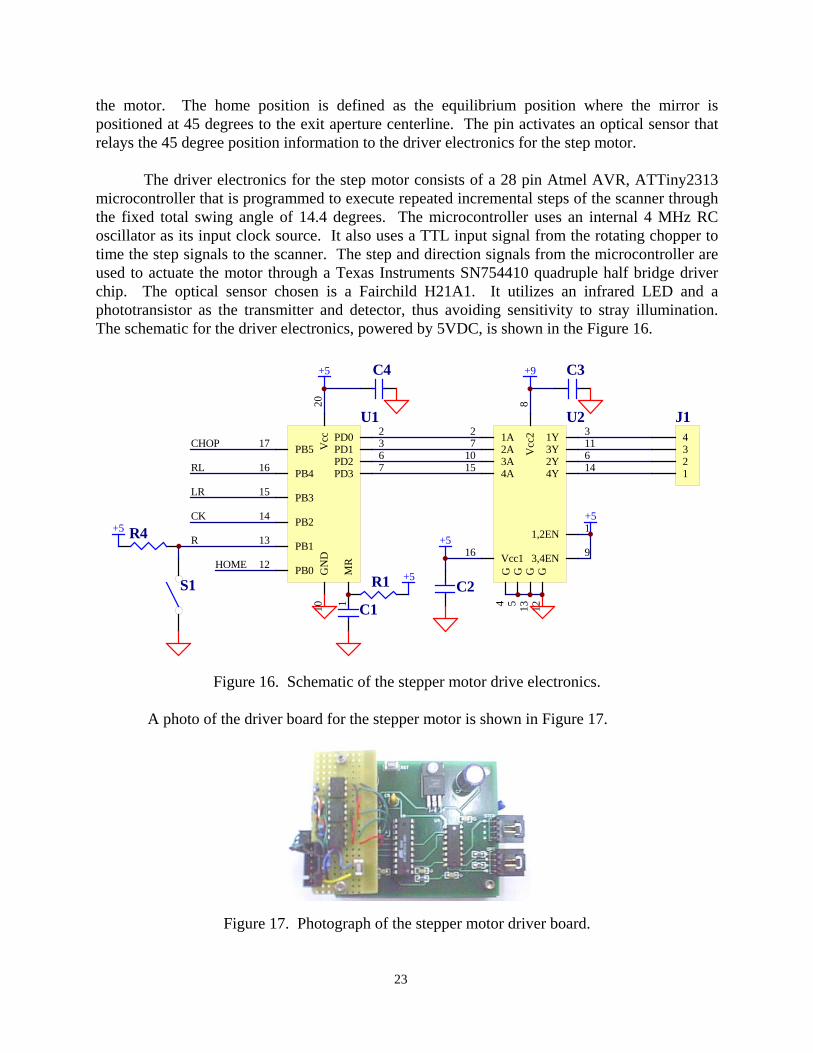
the motor. The home position is defined as the equilibrium position where the mirror is positioned at 45 degrees to the exit aperture centerline. The pin activates an optical sensor that relays the 45 degree position information to the driver electronics for the step motor. The driver electronics for the step motor consists of a 28 pin Atmel AVR, ATTiny2313 microcontroller that is programmed to execute repeated incremental steps of the scanner through the fixed total swing angle of 14.4 degrees. The microcontroller uses an internal 4 MHz RC oscillator as its input clock source. It also uses a TTL input signal from the rotating chopper to time the step signals to the scanner. The step and direction signals from the microcontroller are used to actuate the motor through a Texas Instruments SN754410 quadruple half bridge driver chip. The optical sensor chosen is a Fairchild H21A1. It utilizes an infrared LED and a phototransistor as the transmitter and detector, thus avoiding sensitivity to stray illumination. The schematic for the driver electronics, powered by 5VDC, is shown in the Figure 16.
Figure 16. Schematic of the stepper motor drive electronics. A photo of the driver board for the stepper motor is shown in Figure 17.
Figure 17. Photograph of the stepper motor driver board.
24
S T A R T
S E T U P P A R A M E T E R S and
IN IT IA LIZE
C A LL S U B R O U T IN E S LE W
C A LL S U B R O U T IN E A C W
C A LL S U B R O U T IN E C W
A
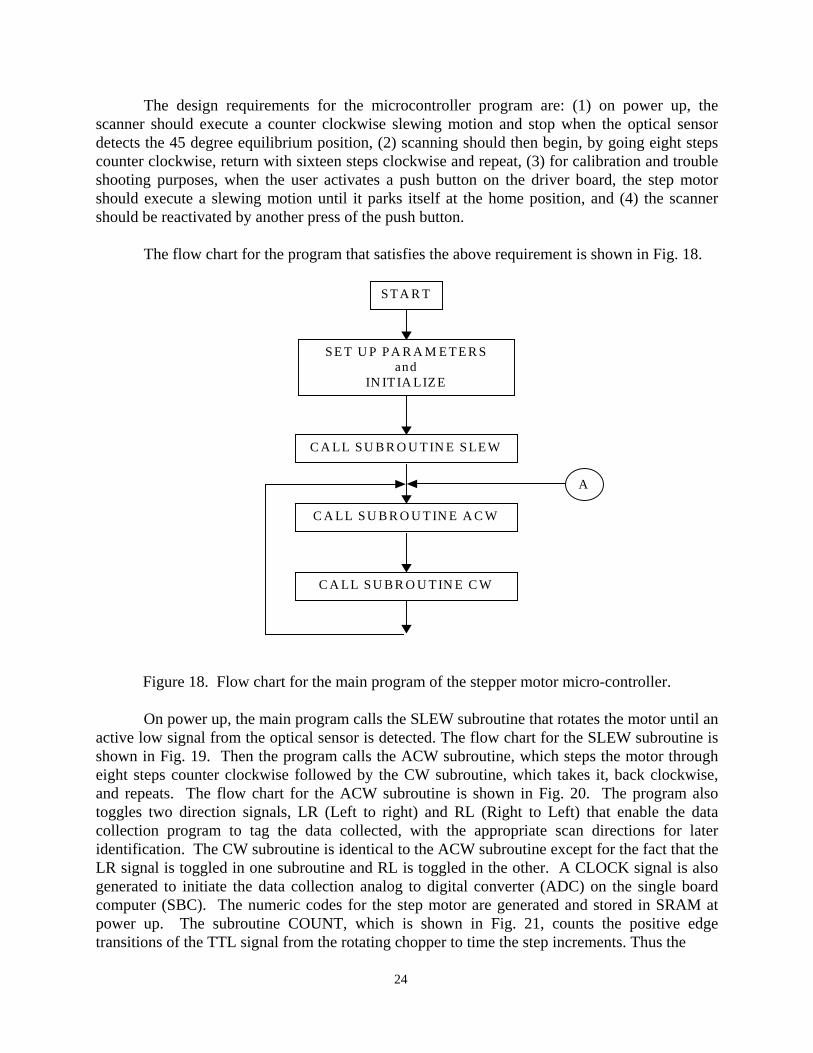
The design requirements for the microcontroller program are: (1) on power up, the scanner should execute a counter clockwise slewing motion and stop when the optical sensor detects the 45 degree equilibrium position, (2) scanning should then begin, by going eight steps counter clockwise, return with sixteen steps clockwise and repeat, (3) for calibration and trouble shooting purposes, when the user activates a push button on the driver board, the step motor should execute a slewing motion until it parks itself at the home position, and (4) the scanner should be reactivated by another press of the push button. The flow chart for the program that satisfies the above requirement is shown in Fig. 18.
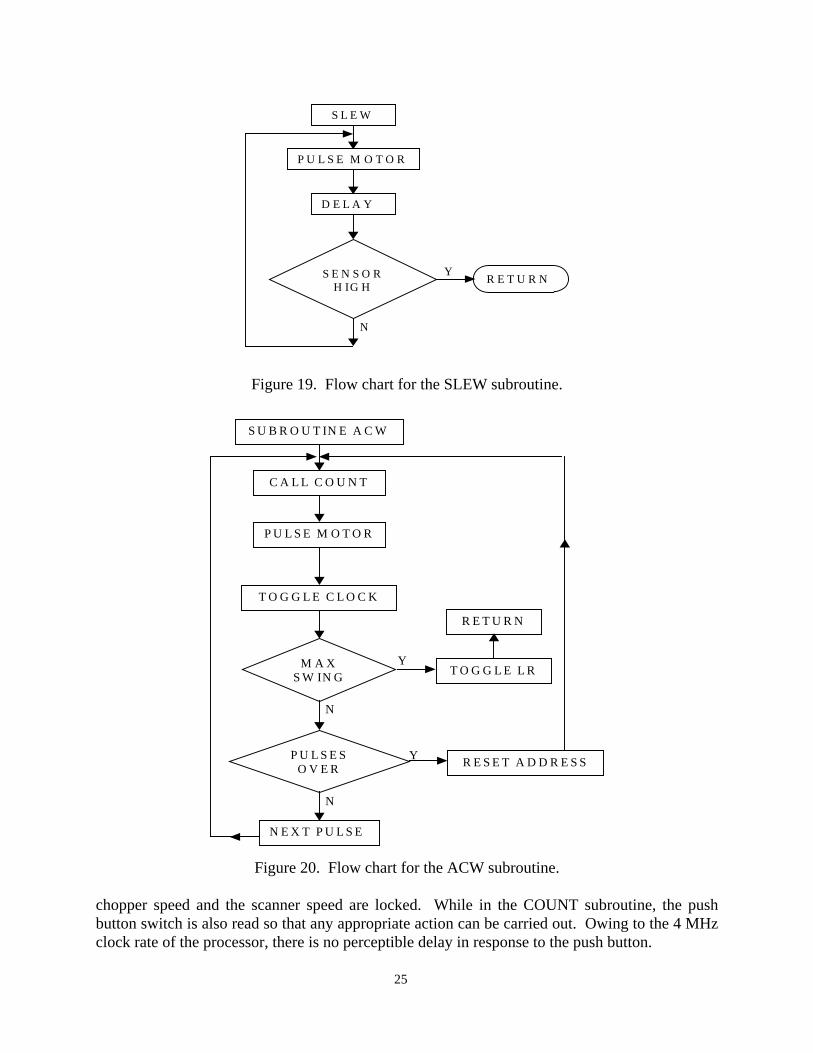
Figure 18. Flow chart for the main program of the stepper motor micro-controller. On power up, the main program calls the SLEW subroutine that rotates the motor until an active low signal from the optical sensor is detected. The flow chart for the SLEW subroutine is shown in Fig. 19. Then the program calls the ACW subroutine, which steps the motor through eight steps counter clockwise followed by the CW subroutine, which takes it, back clockwise, and repeats. The flow chart for the ACW subroutine is shown in Fig. 20. The program also toggles two direction signals, LR (Left to right) and RL (Right to Left) that enable the data collection program to tag the data collected, with the appropriate scan directions for later identification. The CW subroutine is identical to the ACW subroutine except for the fact that the LR signal is toggled in one subroutine and RL is toggled in the other. A CLOCK signal is also generated to initiate the data collection analog to digital converter (ADC) on the single board computer (SBC). The numeric codes for the step motor are generated and stored in SRAM at power up. The subroutine COUNT, which is shown in Fig. 21, counts the positive edge transitions of the TTL signal from the rotating chopper to time the step increments. Thus the
25
S L E W
P U L S E M O T O R
D E L A Y
S E N S O R H IG H
R E T U R NY
N
R E S E T A D D R E S S
S U B R O U T IN E A C W
C A L L C O U N T
P U L S E M O T O R
T O G G L E C L O C K
P U L S E S O V E R
N E X T P U L S E
M A X S W IN G T O G G L E L R
R E T U R N
Y
N
Y
N
Figure 19. Flow chart for the SLEW subroutine.
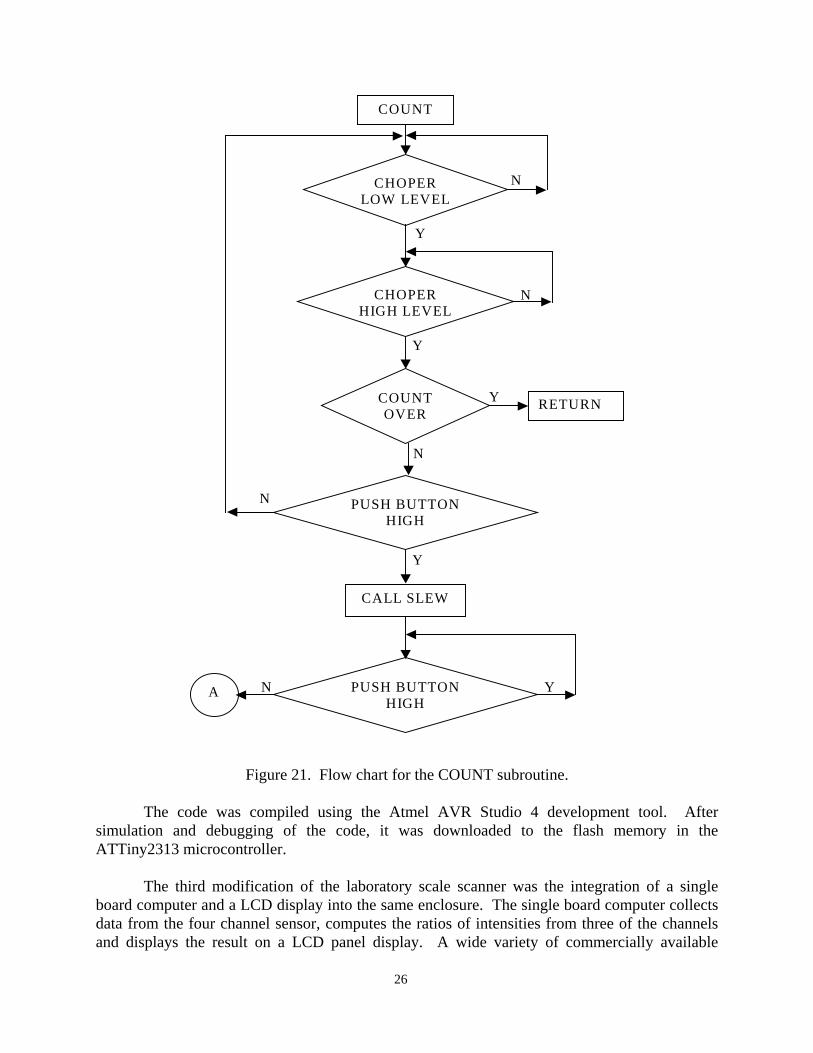
Figure 20. Flow chart for the ACW subroutine. chopper speed and the scanner speed are locked. While in the COUNT subroutine, the push button switch is also read so that any appropriate action can be carried out. Owing to the 4 MHz clock rate of the processor, there is no perceptible delay in response to the push button.
26
COUNT
CHOPER LOW LEVEL
PUSH BUTTON HIGH
COUNT OVER
CALL SLEW
A
RETURN
N
Y
CHOPER HIGH LEVEL
N
Y
N
Y
Y
N
PUSH BUTTON HIGH
N Y
Figure 21. Flow chart for the COUNT subroutine. The code was compiled using the Atmel AVR Studio 4 development tool. After simulation and debugging of the code, it was downloaded to the flash memory in the ATTiny2313 microcontroller. The third modification of the laboratory scale scanner was the integration of a single board computer and a LCD display into the same enclosure. The single board computer collects data from the four channel sensor, computes the ratios of intensities from three of the channels and displays the result on a LCD panel display. A wide variety of commercially available
27
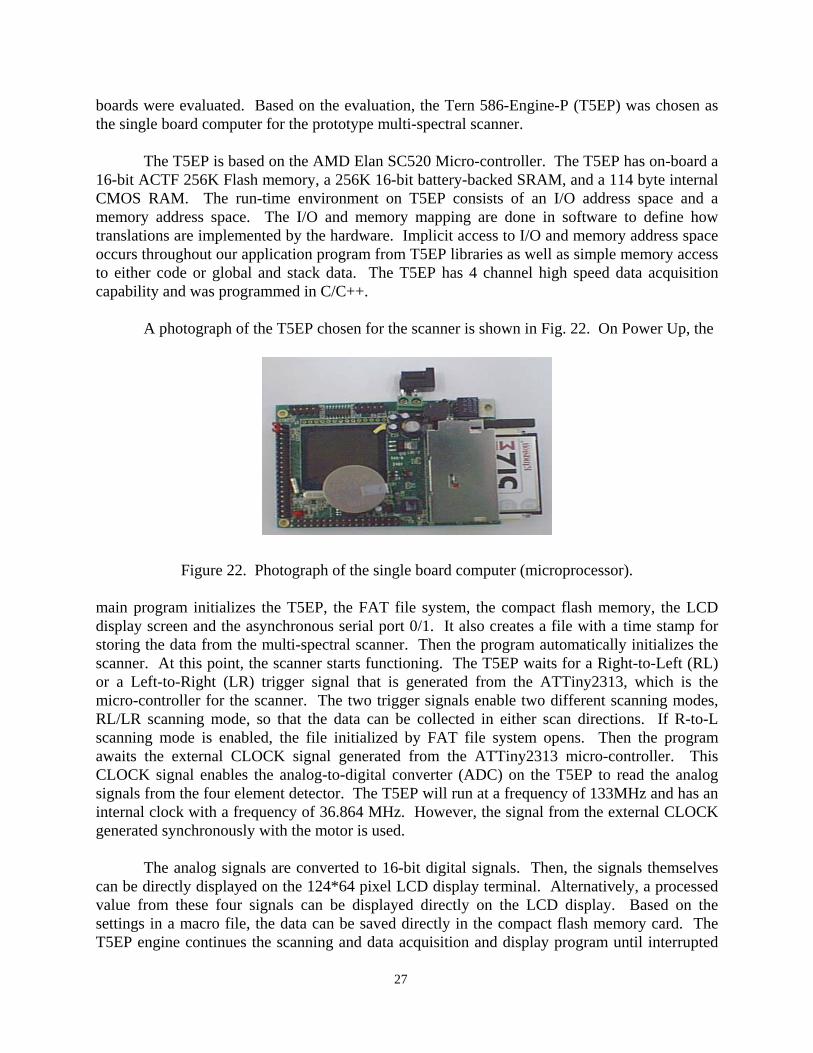
boards were evaluated. Based on the evaluation, the Tern 586-Engine-P (T5EP) was chosen as the single board computer for the prototype multi-spectral scanner. The T5EP is based on the AMD Elan SC520 Micro-controller. The T5EP has on-board a 16-bit ACTF 256K Flash memory, a 256K 16-bit battery-backed SRAM, and a 114 byte internal CMOS RAM. The run-time environment on T5EP consists of an I/O address space and a memory address space. The I/O and memory mapping are done in software to define how translations are implemented by the hardware. Implicit access to I/O and memory address space occurs throughout our application program from T5EP libraries as well as simple memory access to either code or global and stack data. The T5EP has 4 channel high speed data acquisition capability and was programmed in C/C++. A photograph of the T5EP chosen for the scanner is shown in Fig. 22. On Power Up, the
Figure 22. Photograph of the single board computer (microprocessor).
main program initializes the T5EP, the FAT file system, the compact flash memory, the LCD display screen and the asynchronous serial port 0/1. It also creates a file with a time stamp for storing the data from the multi-spectral scanner. Then the program automatically initializes the scanner. At this point, the scanner starts functioning. The T5EP waits for a Right-to-Left (RL) or a Left-to-Right (LR) trigger signal that is generated from the ATTiny2313, which is the micro-controller for the scanner. The two trigger signals enable two different scanning modes, RL/LR scanning mode, so that the data can be collected in either scan directions. If R-to-L scanning mode is enabled, the file initialized by FAT file system opens. Then the program awaits the external CLOCK signal generated from the ATTiny2313 micro-controller. This CLOCK signal enables the analog-to-digital converter (ADC) on the T5EP to read the analog signals from the four element detector. The T5EP will run at a frequency of 133MHz and has an internal clock with a frequency of 36.864 MHz. However, the signal from the external CLOCK generated synchronously with the motor is used. The analog signals are converted to 16-bit digital signals. Then, the signals themselves can be directly displayed on the 124*64 pixel LCD display terminal. Alternatively, a processed value from these four signals can be displayed directly on the LCD display. Based on the settings in a macro file, the data can be saved directly in the compact flash memory card. The T5EP engine continues the scanning and data acquisition and display program until interrupted

28
from an external source. During the evaluation, all the data collected from the power up was stored in the flash memory card for subsequent analysis. The program for the T5EP was tested using a frequency generator. A photograph of the experimental arrangement used to verify the working of the T5EP is shown in Fig. 23.
Figure 23. Photograph of the arrangement used for evaluating the microprocessor. A sine wave pattern from a signal generator is fed into the A/D of the T5EP. The T5EP is programmed to read in the data and display it on the LCD screen. The resulting pattern seen on the LCD is shown in Fig. 24.
Figure 24. Photograph of the LCD screen during the evaluation tests. The microprocessor faithfully captured the signal from each of the four channels and can display any channel on the LCD screen. Additional tests showed that any simple mathematical functions of these four voltages can also be directly displayed on the LCD screen. The programming was completed and the system was integrated into the mechanical package. The prototype multi-spectral scanner functions as a stand-alone system operated from 12V battery. The prototype scanner is approximately 10” x 9” x 5”. It can be either mounted on a tripod or carried using a handle. The entire scanner weighs about 14 lbs. The scanner has two
29
connectors, one for the power, and another for the data downloads on the back wall of the enclosure. Provisions for purging the interior of the prototype scanner has also been provided. In addition to the LCD display, there is also a breakout terminal that enables the output from the channels to be sampled and stored in a computer. 6. Evaluation of Prototype Scanner
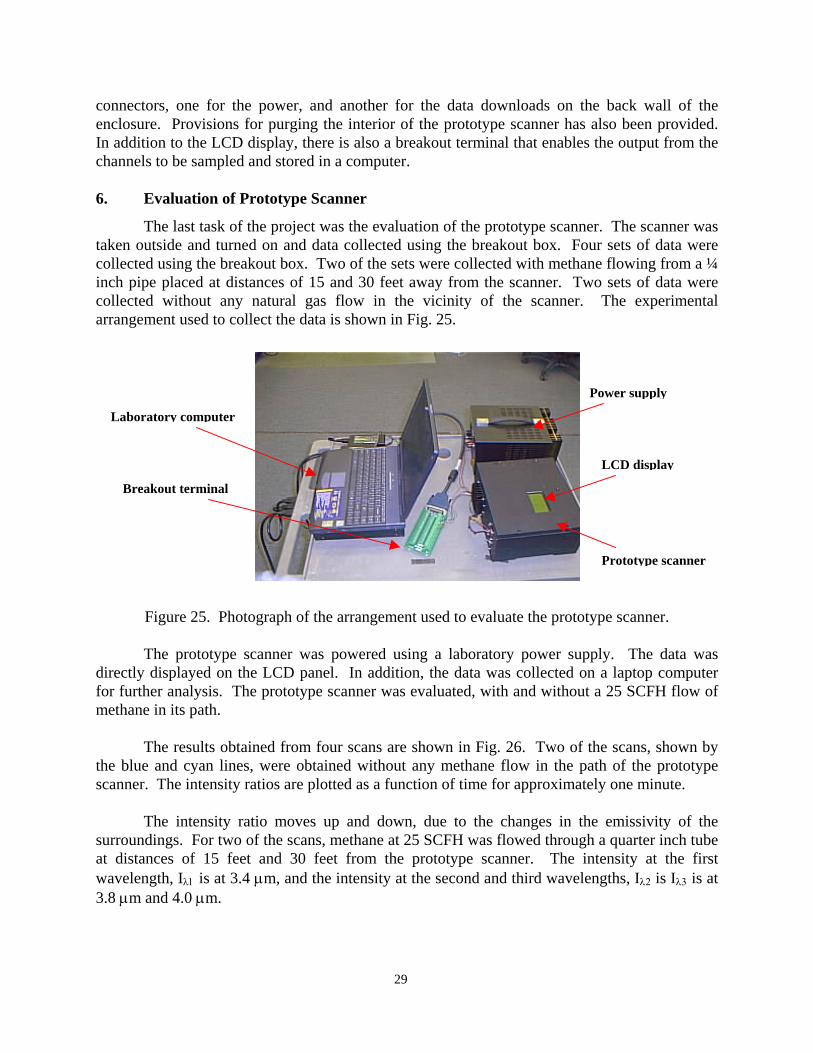
The last task of the project was the evaluation of the prototype scanner. The scanner was taken outside and turned on and data collected using the breakout box. Four sets of data were collected using the breakout box. Two of the sets were collected with methane flowing from a ¼ inch pipe placed at distances of 15 and 30 feet away from the scanner. Two sets of data were collected without any natural gas flow in the vicinity of the scanner. The experimental arrangement used to collect the data is shown in Fig. 25.
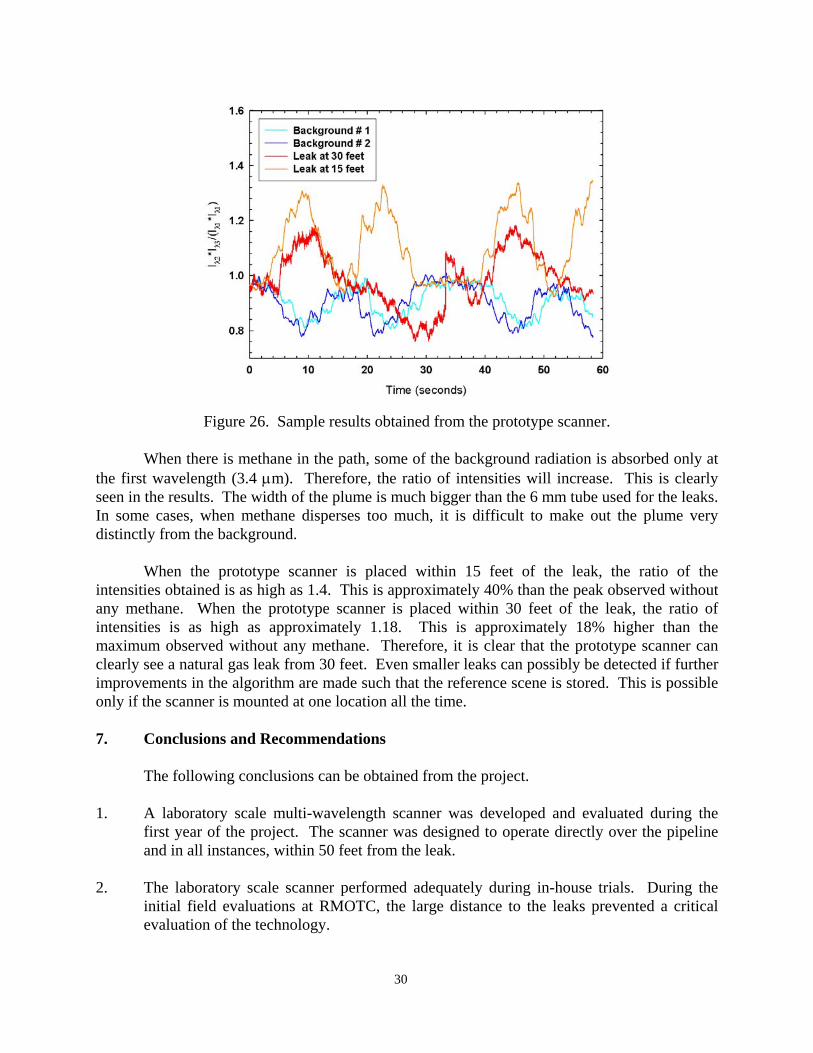
Figure 25. Photograph of the arrangement used to evaluate the prototype scanner. The prototype scanner was powered using a laboratory power supply. The data was directly displayed on the LCD panel. In addition, the data was collected on a laptop computer for further analysis. The prototype scanner was evaluated, with and without a 25 SCFH flow of methane in its path. The results obtained from four scans are shown in Fig. 26. Two of the scans, shown by the blue and cyan lines, were obtained without any methane flow in the path of the prototype scanner. The intensity ratios are plotted as a function of time for approximately one minute. The intensity ratio moves up and down, due to the changes in the emissivity of the surroundings. For two of the scans, methane at 25 SCFH was flowed through a quarter inch tube at distances of 15 feet and 30 feet from the prototype scanner. The intensity at the first wavelength, Iλ1 is at 3.4 μm, and the intensity at the second and third wavelengths, Iλ2 is Iλ3 is at 3.8 μm and 4.0 μm.
Power supply
Prototype scanner
Breakout terminal
Laboratory computer
LCD display
30
Figure 26. Sample results obtained from the prototype scanner. When there is methane in the path, some of the background radiation is absorbed only at the first wavelength (3.4 μm). Therefore, the ratio of intensities will increase. This is clearly seen in the results. The width of the plume is much bigger than the 6 mm tube used for the leaks. In some cases, when methane disperses too much, it is difficult to make out the plume very distinctly from the background. When the prototype scanner is placed within 15 feet of the leak, the ratio of the intensities obtained is as high as 1.4. This is approximately 40% than the peak observed without any methane. When the prototype scanner is placed within 30 feet of the leak, the ratio of intensities is as high as approximately 1.18. This is approximately 18% higher than the maximum observed without any methane. Therefore, it is clear that the prototype scanner can clearly see a natural gas leak from 30 feet. Even smaller leaks can possibly be detected if further improvements in the algorithm are made such that the reference scene is stored. This is possible only if the scanner is mounted at one location all the time. 7. Conclusions and Recommendations The following conclusions can be obtained from the project. 1. A laboratory scale multi-wavelength scanner was developed and evaluated during the
first year of the project. The scanner was designed to operate directly over the pipeline and in all instances, within 50 feet from the leak.
2. The laboratory scale scanner performed adequately during in-house trials. During the
initial field evaluations at RMOTC, the large distance to the leaks prevented a critical evaluation of the technology.

31
3. A prototype stand-alone natural gas detector was developed and evaluated during the second year of the project.
4. The prototype detector can clearly discern natural gas pipeline leaks at rates of 25 SCFH
at a distance of 30 feet from the detector. 5. Further field evaluations of the detector is required to fully understand the limits of
detectibility with the system. It is recommended that further development of the scanner be undertaken, either under a Small Business Innovation Research grant or private funding before commercialization of the scanner.
Related Documents