A Cost-Benefit Assessment of Gasification-Based Biorefining in the Kraft Pulp and Paper Industry Volume 2 Detailed Biorefinery Design and Performance Simulation FINAL REPORT Under contract DE-FC26-04NT42260 with the U.S. Department of Energy and with cost-sharing by the American Forest and Paper Association 21 December 2006 Eric D. Larson Princeton Environmental Institute Princeton University Princeton, NJ [email protected] Stefano Consonni and Silvia Napoletano Department of Energy Engineering Politecnico di Milano Milan, Italy [email protected] Ryan E. Katofsky Navigant Consulting, Inc. Burlington, MA [email protected] Kristiina Iisa and Jim Frederick Institute of Paper Science and Technology School of Chemical and Biomolecular Engineering Georgia Institute of Technology Atlanta, GA [email protected] [email protected] With contributions from: Wang Xun Department of Energy Engineering Politecnico di Milano

Welcome message from author
This document is posted to help you gain knowledge. Please leave a comment to let me know what you think about it! Share it to your friends and learn new things together.
Transcript
A Cost-Benefit Assessment of Gasification-BasedBiorefining in the Kraft Pulp and Paper Industry
Volume 2Detailed Biorefinery Design and Performance
Simulation
FINAL REPORTUnder contract DE-FC26-04NT42260 with the U.S. Department of Energy
and with cost-sharing by the American Forest and Paper Association
21 December 2006
Eric D. LarsonPrinceton Environmental InstitutePrinceton UniversityPrinceton, [email protected]
Stefano Consonni and Silvia NapoletanoDepartment of Energy EngineeringPolitecnico di MilanoMilan, [email protected]
Ryan E. KatofskyNavigant Consulting, Inc.Burlington, [email protected]
Kristiina Iisa and Jim FrederickInstitute of Paper Science and TechnologySchool of Chemical and Biomolecular EngineeringGeorgia Institute of TechnologyAtlanta, [email protected]@ipst.gatech.edu
With contributions from:Wang XunDepartment of Energy EngineeringPolitecnico di Milano
2
Table of contents
1 SUMMARY .......................................................................................................................7
2 SYSTEMS OF INTEREST ...............................................................................................82.1 Summary and nomenclature of plant configurations.........................................................9
3 CALCULATION OF MASS AND ENERGY BALANCES ..........................................103.1 GS.................................................................................................................................113.1 Aspen Plus.....................................................................................................................123.2 Calculation of fully integrated system............................................................................13
4 ASSUMPTIONS AND TECHNOLOGICAL ISSUES...................................................164.1 Black liquor gasifier ......................................................................................................164.2 Biomass boiler...............................................................................................................174.3 Biomass dryer................................................................................................................184.4 Biomass gasifier ............................................................................................................184.5 Syngas clean-up system.................................................................................................20
4.5.1 Syngas generated by the black liquor gasifier.........................................................204.5.2 Syngas generated by the biomass gasifier...............................................................20
4.5.2.1 Tar control ........................................................................................................................... 204.5.2.2 Biomass syngas to the gas turbine......................................................................................... 214.5.2.3 Biomass syngas to the Fuel Synthesis Island.......................................................................... 22
4.6 Gas turbine ....................................................................................................................224.7 HRSG and steam turbine ...............................................................................................244.8 Heat integration .............................................................................................................254.9 Oxygen production ........................................................................................................264.10 Lime Kiln ......................................................................................................................274.11 Sulfur Recovery system.................................................................................................27
4.11.1 Rectisol system......................................................................................................284.11.2 Selexol system.......................................................................................................294.11.3 Claus/SCOT unit....................................................................................................30
4.12 DME synthesis ..............................................................................................................314.12.1 DME synthesis kinetics model ...............................................................................314.12.2 DME reactor ..........................................................................................................324.12.3 Heat exchang design of DME synthesis section......................................................33
4.13 Fischer-Tropsch (FT) synthesis......................................................................................334.13.1 Kinetic model ........................................................................................................334.13.2 FT reactor ..............................................................................................................344.13.3 FT liquid product ...................................................................................................35
4.14 Mixed alcohols synthesis ...............................................................................................354.14.1 Mixed alcohols synthesis kinetic model .................................................................35
4.14.1.1 CO2 removal in the recycle loop............................................................................................ 364.14.2 Mixed alcohols reactor...........................................................................................36
3
5 PROCESS CONFIGURATIONS AND OPERATING CONDITIONS ........................385.1 Summary of technologies adopted for the major subsystems..........................................385.2 Input to Fuel Synthesis Island ........................................................................................38
5.2.1 Fuel synthesis fed with syngas from BLG ..............................................................385.2.2 Fuel synthesis fed with syngas from BLG and from biomass gasification...............39
5.3 Design and basic features of major subsystems ..............................................................395.3.1 BL gasification ......................................................................................................395.3.2 Biomass Gasification .............................................................................................40
5.3.2.1 Biomass gasification with syngas cooler ............................................................................... 405.3.2.2 Biomass gasification with quench ......................................................................................... 41
5.3.3 Combined cycle .....................................................................................................425.3.4 Rectisol system......................................................................................................42
5.3.4.1 Total H2S and CO2 removal .................................................................................................. 425.3.4.2 H2S removal ......................................................................................................................... 44
5.3.5 DME synthesis island ............................................................................................455.3.6 FT synthesis island.................................................................................................475.3.7 Mixed alcohols synthesis island .............................................................................48
5.4 DME cases ....................................................................................................................495.4.1 DMEa case: BLG with DME recycle island ...........................................................49
5.4.1.1 BL syngas cooling ................................................................................................................ 495.4.1.2 Power boiler and steam cycle ............................................................................................... 50
5.4.2 DMEb case: BLG and BGCC with DME recycle ...................................................505.4.3 DMEc case: BLG and BGCC with DME once-through production ........................51
5.5 FT cases ........................................................................................................................515.5.1 FTa case: BLG with FT production and BGCC with medium GT...........................515.5.2 FTb case: BLG with FT production and BGCC with large GT ...............................515.5.3 FTc case: BLG and BG with FT production and CC with medium GT...................51
5.6 MixOH case: BLG and BG with mixed alcohols production and CC with mediumGT........ .........................................................................................................................52
6 PROCESS SIMULATION RESULTS ...........................................................................606.1 Overall performances.....................................................................................................606.2 Energy efficiencies ........................................................................................................626.3 Biorefinery designs vs. conventional Tomlinson systems...............................................64
7 REFERENCES................................................................................................................67
APPENDIX A: DME AND FT SYNTHESIS.......................................................................A.1A.1 DME synthesis ............................................................................................................ A.1
A.1.1 Kinetics equations................................................................................................ A.1A.1.2 Reactor model...................................................................................................... A.3A.1.3 Comparisons with experiment results ................................................................... A.3A.1.4 Sensitivity study of DME synthesis section .......................................................... A.5
A.1.4.1 Effect of reactor pressure variation......................................................................................A.6A.1.4.2 Effect of unconverted gas recycle .........................................................................................A.7
A.2 FT synthesis .............................................................................................................. A.10
4
A.2.1 Kinetics equations.............................................................................................. A.10A.2.2 Reactor model.................................................................................................... A.12
APPENDIX B: KINETIC MODEL FOR MIXED ALCOHOL SYNTHESIS ................... B.1B.1 Model development and preliminary results................................................................. B.1
B.1.1 Introduction ......................................................................................................... B.1B.1.2 Scope of the work ................................................................................................ B.1B.1.3 Development of the kinetic model........................................................................ B.2B.1.4 Reactor simulation and validation of the kinetic model ........................................ B.6B.1.5 Simulation study of the effects of the operating variables ................................... B.13B.1.6 Implementation of the kinetic model in a Fortran subroutine .............................. B.17B.1.7 Comparison between the results obtained using ASPEN and the Fortranprogram.............. ............................................................................................................. B.18B.1.8 Conclusions ....................................................................................................... B.19
B.2 Additional results and model validation ..................................................................... B.19B.2.1 Introduction ....................................................................................................... B.19B.2.2 Validation of the kinetic model .......................................................................... B.20B.2.3 Conclusions ....................................................................................................... B.27
B.3 Literature cited .......................................................................................................... B.28
APPENDIX C: ANALYSIS AND SIMULATION OF A RECTISOL-BASED ACID GASPURIFICATION PROCESS ................................................................................................C.1
C.1 Background ................................................................................................................. C.1C.1.1 The selected Rectisol process layout .................................................................... C.1
C.2 “Rectisol-based” process design & features ................................................................. C.2C.2.1 Process principles ................................................................................................ C.2C.2.2 Process duties ...................................................................................................... C.2C.2.3 Process bases ....................................................................................................... C.2C.2.4 Process description .............................................................................................. C.3
C.2.4.1 The Acid Gas Absorber C1 .........................................................................................................C.5C.2.4.2 The H2S Concentrator C2...........................................................................................................C.5C.2.4.3 The CO2 Stripper C3 ..................................................................................................................C.6C.2.4.4 The Solvent Regenerator C4 .......................................................................................................C.6
C.2.5 Key process data & variables ............................................................................... C.6C.2.5.1 CO2 heat of absorption in methanol. ...........................................................................................C.6C.2.5.2 Different H2S and CO2 solubility in methanol..............................................................................C.7C.2.5.3 Methanol volatility .....................................................................................................................C.7
C.2.6 Aspen Plus Model................................................................................................ C.7C.2.7 Aspen Plus Model results and discussion.............................................................. C.7
C.2.7.1 Discussion................................................................................................................................C.10C.2.7.2 Addenda...................................................................................................................................C.10
C.2.8 Aspen Plus Model for the abatement of H2S only ............................................... C.11C.3 Absorption column: model and thermodynamics ....................................................... C.24
C.3.1 Nomenclature .................................................................................................... C.25C.3.2 Acid gas solubility ............................................................................................. C.25C.3.3 Heat of absorption of CO2 in methanol (-∆H abs)............................................... C.25

5
C.3.4 Thermodynamic model ...................................................................................... C.27C.3.5 Heat and material balance equations in the absorption column ........................... C.27C.3.6 ABSORBER.xls user interface........................................................................... C.29C.3.7 Results and discussion ....................................................................................... C.29
C.4 Aspen Plus thermodynamic model............................................................................. C.35C.5 References................................................................................................................. C.36
Note: “Navigant is a service mark of Navigant International, Inc. Navigant Consulting, Inc.(NCI) is not affiliated, associated, or in any way connected with Navigant International, Inc., andNCI’s use of “Navigant” is made under license from Navigant International, Inc.
6
NOMENCLATURE
ASF Anderson-Schulz-Flory (distribution)BLGCC Black Liquor Gasification Combined CycleBLGF Black Liquor Gasification FuelCC Combined CycleCSTR Continuous Stirred Tank ReactorDME Dimethyl EtherFSI Fuel Synthesis IslandFT Fischer TropschGHSV Gas Hourly Space VelocityGI Gasification IslandGT Gas TurbineGTL Gas To LiquidHRSG Heat Recovery Stream GeneratorHP High PressureIGCC Integrated Gasification Combined CycleIP Intermediate PressureLP Low PressureLPDME Liquid Phase DME (reactor)MixOH Mixed AlcoholsMP Medium PressurePFR Plug-Flow Reactorppmv parts per million by volumeSRU Sulfur Recovery UnitWGS Water Gas Shift
7
1 SUMMARY This volume illustrates the technologies, the assumptions and the modelization adopted to
estimate the heat and mass balances of the biorefinery systems considered in this study. Accurately calculating the mass/heat balances is crucial not only to verify the feasibility of
a conceptual design and the applicability of a technological option, but also to estimate economicreturns and environmental impacts. The modelization presented in this volume allows calculatingall the parameters needed to appraise the overall plant performances:
− operating conditions of the most important components;− extra-biomass input required to satisfy the mill steam demand;− auxiliary power consumption;− steam and cold duties;− net power production;− net fuel production.
These data are the basis to estimate capital and operating costs, and thus economic returns.The plant scheme and the operating conditions considered for each case are the outcome ofsignificant screening work, which included the test of a considerable number of alternatives andsensitivity analyses. The basic feature that characterizes a plant scheme is the liquid fuelgenerated in the Fuel Synthesis Island (FSI), for which we’ve considered three cases:
− DME− raw Fischer-Tropsch− Mixed Alcohol
The type of fuel however does not fully characterize our plant configurations. The other basicoptions specified are:
− the arrangement of the Fuel Synthesis Island (with or without syngas recycle);− the type of gas turbine (if any);− the type of biomass gasifier (if any).
The combination of these options generates a relatively large number of alternativeconfigurations. In this study we’ve focused on a total of seven cases which appear particularlymeaningful and interesting: three for DME, three for Fischer-Tropsch and one for MixedAlcohol. Although these seven cases do not exhaust the range of possible options, they give clearindications on the potential and the implications of pulpmill biorefinery systems.
Given the complexity of the systems to be modeled and the variety of the technologiesinvolved, the modelization has been particularly challenging. A BLGF plant comprises sub-systems that fall in the realm of combustion and process technology (gasifier, heat exchangers,burners, etc.), others typical of the chemical industry (gas clean-up system, reactors, distillationcolumns, etc. ) and others belonging to power plant technology (steam cycle, gas turbine,compressors and expanders, etc.). As a consequence, no single simulation tool is ideally suitedfor modeling the whole integrated biorefinery. In this study we’ve combined the use of twocomputer codes:
– GS, a code developed for research purposes at Politecnico di Milano and PrincetonUniversity;
– Aspen Plus, a code originally developed at MIT and now commercialized by AspenTechInc.Despite some complexity, the calculation algorithm based on these two codes provides an
accuracy similar (or higher) to that of the most detailed engineering studies that can be found inthe literature.
8
The technologies and the design parameters considered for each major sub-system are inbetween the state-of-the-art and the projections for the timeframe of the “Nth plant” biorefinery.
The results summarized in the last chapter of this volume allow appraising the merits ofeach plant option. The variety of the plant configurations analyzed in the study gives a widerange of power and fuel productions, as well as of efficiencies.
2 SYSTEMS OF INTEREST The systems considered in this study are determined by alternative combinations of a few
key processes:– black liquor gasification– biomass gasification (in one case biomass combustion)– syngas cooling and clean-up– catalytic synthesis of a liquid fuel from syngas– co-generation of power and heat
The various technologies that can be used for these basic processes give rise to a largenumber of alternative configurations. The configurations considered in this study have beenselected as among the most interesting and viable options to co-produce electricity, heat andliquid fuels under the constraint of handling all of the available black liquor and meeting thesteam demand of the reference pulp and paper mill.
The plant scheme and the operating conditions considered for each case are the outcome ofsignificant screening work, which included the test of a considerable number of alternatives andsensitivity analyses. This doesn’t mean that the schemes and the set of operating parametersconsidered here are necessarily optimal, although we believe the performance improvementsachievable by a more thorough optimization would be marginal. Significant improvements ofefficiencies, power output or fuel output are likely to be achieved only by significant changes inthe characteristics of the basic technologies, e.g. more effective catalysts, more efficient gasturbine, different gasification technology, etc.
Schematically, the systems modelled in this study consist of five basic “islands”:– black liquor gasification island– biomass gasification island (or, in one scheme, biomass boilers)– syngas heat recovery and syngas clean-up island– fuel synthesis island– power island
The gasification island includes a cryogenic Air Separation Unit for the production ofoxygen. The black liquor and biomass gasification islands are essentially the same for all thecases considered (except for the size of the biomass gasification island, which changes verysignificantly from one case to another). The heat recovery section has been tailored to thecharacteristics of each plant scheme to maximize the benefits of heat integration. The syngasclean-up island is centered around a Rectisol unit, except for the mixed alcohol case whichadopts a Selexol system. The fuel synthesis island is the section that gives the basiccharacterization to the plant scheme. We have considered the following cases:
– production of DME from black liquor syngas, with no syngas recycle– production of DME from black liquor syngas, with syngas recycle– production of raw Fischer-Tropsch fuel from black liquor syngas, no syngas recycle– production of raw Fischer-Tropsch fuel from a mix of black liquor and biomass syngas, no
syngas recycle
9
– production of mixed alcohol from a mix of black liquor and biomass syngas, with syngasrecycle.The cases of DME with syngas recycle and Fischer-Tropsch fuel from black liquor syngas
have been further differentiated based on the type of power island. For DME with syngas recyclewe’ve considered a case with power boilers (no biomass gasifier) and just a steam cycle, and acase with a biomass gasifier and a combined cycle. For the case of Fischer-Tropsch fuel fromblack liquor syngas we’ve considered a case with a medium-size, 70 MW class gas turbine (GE6FA) and another case with a large, 170 MW class gas turbine (GE 7FA).
2.1 Summary and nomenclature of plant configurations As already mentioned, the basic feature that characterizes a plant scheme is the type of
liquid fuel generated in the Fuel Synthesis Island (FSI):− DME− raw Fischer-Tropsch− Mixed Alcohol
The type of fuel however is not enough to fully characterize the plant configuration. Theother basic options specified are:
− the arrangement of the Fuel Synthesis Island (with or without syngas recycle);− the type of gas turbine (if any);− the type of biomass gasifier (if any)
nonemedium
scale(6FA)
mediumscale(6FA)
largescale(7FA)
NO (power boilers) DMEa syngas from BL goes to FSI
YES, with syngas cooler DMEb DMEcFTa FTb
syngas from BL goes to FSI,syngas from biomass gasifiergoes to gas turbine
YES, with quench MixOH FTcsyngas from BL and frombiomass gasifier are mixed, andthe whole flow goes to FSI
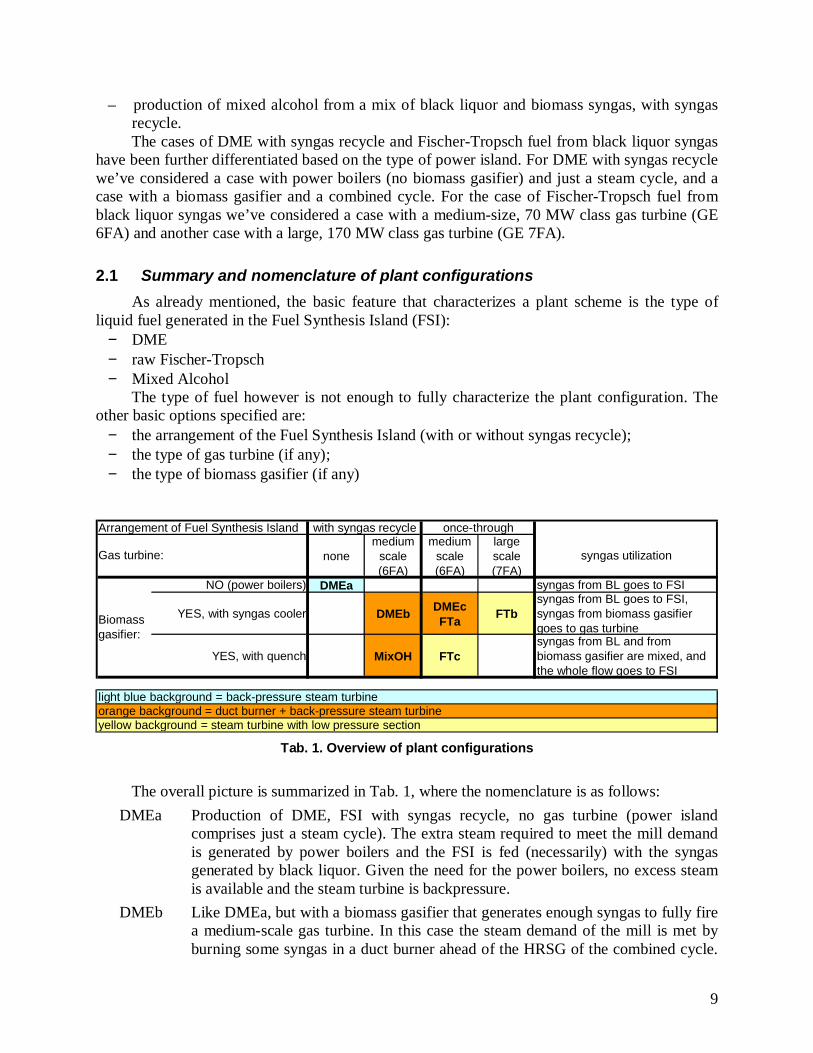
light blue background = back-pressure steam turbineorange background = duct burner + back-pressure steam turbineyellow background = steam turbine with low pressure section
syngas utilization
Biomassgasifier:
Gas turbine:
with syngas recycle once-throughArrangement of Fuel Synthesis Island
Tab. 1. Overview of plant configurations
The overall picture is summarized in Tab. 1, where the nomenclature is as follows:DMEa Production of DME, FSI with syngas recycle, no gas turbine (power island
comprises just a steam cycle). The extra steam required to meet the mill demandis generated by power boilers and the FSI is fed (necessarily) with the syngasgenerated by black liquor. Given the need for the power boilers, no excess steamis available and the steam turbine is backpressure.
DMEb Like DMEa, but with a biomass gasifier that generates enough syngas to fully firea medium-scale gas turbine. In this case the steam demand of the mill is met byburning some syngas in a duct burner ahead of the HRSG of the combined cycle.
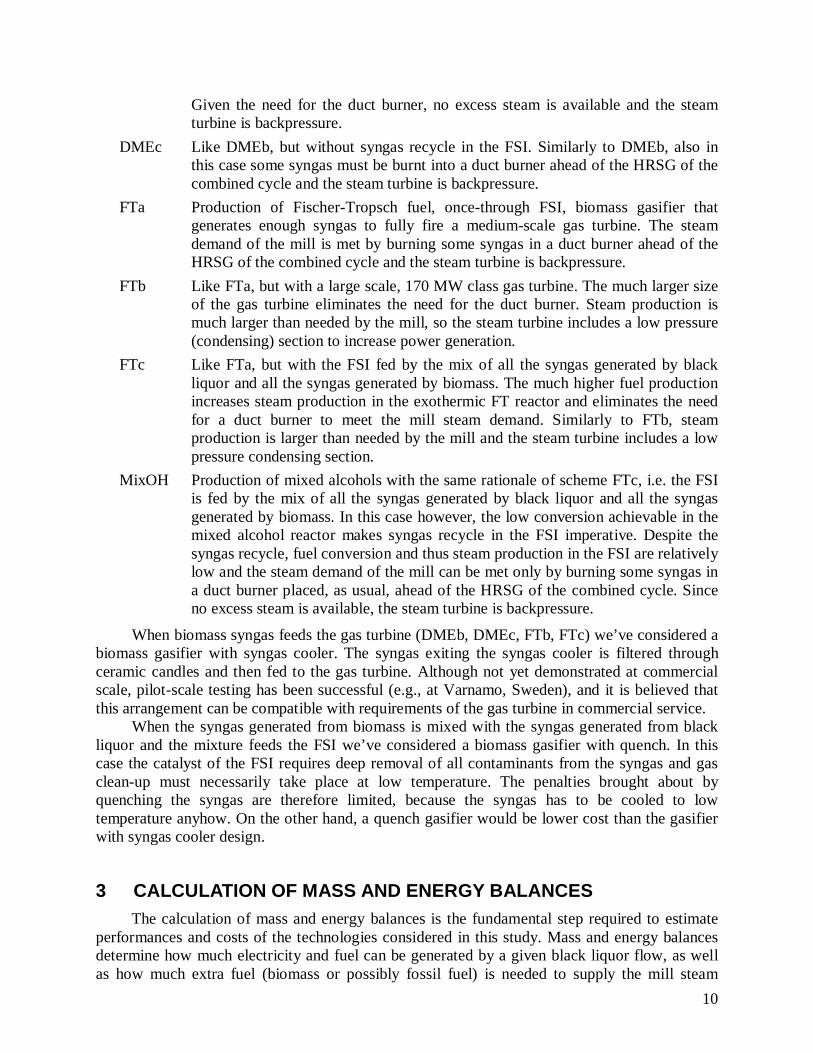
10
Given the need for the duct burner, no excess steam is available and the steamturbine is backpressure.
DMEc Like DMEb, but without syngas recycle in the FSI. Similarly to DMEb, also inthis case some syngas must be burnt into a duct burner ahead of the HRSG of thecombined cycle and the steam turbine is backpressure.
FTa Production of Fischer-Tropsch fuel, once-through FSI, biomass gasifier thatgenerates enough syngas to fully fire a medium-scale gas turbine. The steamdemand of the mill is met by burning some syngas in a duct burner ahead of theHRSG of the combined cycle and the steam turbine is backpressure.
FTb Like FTa, but with a large scale, 170 MW class gas turbine. The much larger sizeof the gas turbine eliminates the need for the duct burner. Steam production ismuch larger than needed by the mill, so the steam turbine includes a low pressure(condensing) section to increase power generation.
FTc Like FTa, but with the FSI fed by the mix of all the syngas generated by blackliquor and all the syngas generated by biomass. The much higher fuel productionincreases steam production in the exothermic FT reactor and eliminates the needfor a duct burner to meet the mill steam demand. Similarly to FTb, steamproduction is larger than needed by the mill and the steam turbine includes a lowpressure condensing section.
MixOH Production of mixed alcohols with the same rationale of scheme FTc, i.e. the FSIis fed by the mix of all the syngas generated by black liquor and all the syngasgenerated by biomass. In this case however, the low conversion achievable in themixed alcohol reactor makes syngas recycle in the FSI imperative. Despite thesyngas recycle, fuel conversion and thus steam production in the FSI are relativelylow and the steam demand of the mill can be met only by burning some syngas ina duct burner placed, as usual, ahead of the HRSG of the combined cycle. Sinceno excess steam is available, the steam turbine is backpressure.
When biomass syngas feeds the gas turbine (DMEb, DMEc, FTb, FTc) we’ve considered abiomass gasifier with syngas cooler. The syngas exiting the syngas cooler is filtered throughceramic candles and then fed to the gas turbine. Although not yet demonstrated at commercialscale, pilot-scale testing has been successful (e.g., at Varnamo, Sweden), and it is believed thatthis arrangement can be compatible with requirements of the gas turbine in commercial service.
When the syngas generated from biomass is mixed with the syngas generated from blackliquor and the mixture feeds the FSI we’ve considered a biomass gasifier with quench. In thiscase the catalyst of the FSI requires deep removal of all contaminants from the syngas and gasclean-up must necessarily take place at low temperature. The penalties brought about byquenching the syngas are therefore limited, because the syngas has to be cooled to lowtemperature anyhow. On the other hand, a quench gasifier would be lower cost than the gasifierwith syngas cooler design.
3 CALCULATION OF MASS AND ENERGY BALANCESThe calculation of mass and energy balances is the fundamental step required to estimate
performances and costs of the technologies considered in this study. Mass and energy balancesdetermine how much electricity and fuel can be generated by a given black liquor flow, as wellas how much extra fuel (biomass or possibly fossil fuel) is needed to supply the mill steam
11
requirements. Mass and energy balances also give the basic information needed to size and toestimate the cost of the most relevant equipment. All this allows estimating the capital costs andthe operating costs, as well as the unit cost of the final products (electricity and/or fuel).
The mass and energy balances and the overall performances of each pulpmill biorefineryconfiguration have been evaluated by combining the use of two computer codes:– GS, a code developed for research purposes at Politecnico di Milano and Princeton
University;– Aspen Plus, a code originally developed at MIT and now managed and commercialized by
AspenTech Inc.The following gives a brief description of each code and of the algorithm adopted to
calculate the mass and energy balances.
3.1 GSGS is a computer code originally developed at Politecnico di Milano and Princeton
University to predict the performance of complex Gas-Steam cycles. The code is a powerful andflexible tool that can accurately predict the performances of a wide variety of systems forelectricity production or cogeneration, including systems where the feedstock is gasified togenerate a syngas that undergoes a sequence of physical and chemical processes. As such, GShas also been used extensively for the analysis of gasification-based power systems, includingblack liquor gasification plants.
The system of interest is defined as an ensemble of components, each belonging to one ofsixteen basic types: pump, compressor, turbine, heat exchanger, combustor, gas turbineexpander, chemical reactor, mixer, flow splitter, heat recovery steam cycle, air splitter plant,shaft connecting different machines, saturator, solid oxide fuel cell, intercooled compressor,steam cycle. The variety of elementary components and the possibility to interconnect themmodularly provide high flexibility.
Once the system to be calculated has been defined and the coherence of the componentcharacteristics and their inter-connections have been verified, the code sequentially calculates themass, energy and atomic species balances of all plant components until it reaches theconvergence of thermodynamic conditions and component characteristics calculated at eachiteration. After reaching convergence, the code can carry out a complete entropy (or "Second-Law") analysis to calculate the destruction of exergy and reversible work within each componentand their input/output flows for the whole system.
The model accounts for all major phenomena and mechanisms affecting the performancesof a wide variety of energy conversion systems: heat losses; variation of turbomachineryefficiency with scale and stage similarity parameters; constraints imposed by choking of flow atthe gas turbine expander inlet, gas turbine cooling, incomplete chemical reactions, etc.; withproper input adjustments it can also predict basic off-design conditions.
The thermodynamic properties of all molecular species are calculated using a consistentmethodology and the same data bases: JANAF tables for all gaseous species; SI steam tables forwater and steam1. Chemical equilibrium is predicted by the same algorithm adopted inSTANJAN, a code originally developed at Stanford by prof. William Reynolds. Thus, GS cansimulate accurately the performance of reactors where the whole output flow or a subset of it isat chemical equilibrium.
1 For methanol, ethanol, butane and butane, enthalpy and entropy are taken from Perry, Nasa coefficients byBonnie McBride of NASA Lewis Center [from EDL website: www.galcit.caltech.edu/EDL/index.html].
12
3.1 Aspen PlusAspen Plus is a widely used commercial chemical process simulation package originally
developed for petrochemical refining applications. Due to its capability to simulate the operatingconditions of chemical plants and to accommodate calculation of chemical kinetics, it well suitedto calculate the chemical processing of syngas and the refining of the resulting products.
Aspen plus was originally developed at the MIT under a DOE project to simulate coalconversion processes. Now it has been widely accepted in the chemical industry as a design toolbecause of its ability to simulate a variety of steady-state processes ranging from single unitoperations to complex processes involving many units.
Aspen plus was chosen as the simulation platform for our modeling of the syngas tofuel/chemical synthesis/separation process, as well as the gas purification section. The purpose ofdeveloping this simulation is to understand how co-production is affected by the constraintsimposed by the chemical process, to evaluate different kinds of plant configurations, to find outways to improve the performance of current designs. The features that make Aspen plus suitableto these purposes are:
Powerful database of chemical species properties. Compared to power productionsystems, the fuel synthesis island and the gas purification section include more types ofchemicals (hydrocarbons, oxycompounds, sulfides, etc) which exhibit real gas behavior (i.e.departure from ideal gas law, including phase change). Having the correct thermophysicalproperties for such a large amount of compounds is crucial to predicting the performances ofprocesses based on real gas effects like distillation columns, vapor-liquid separators,absorbers, strippers, etc. Aspen includes powerful packages with a variety of methods topredict the thermodynamic properties of the species and the mixtures being calculated.
A variety of models for the processes (flash, two-phase reaction, distillation,absorption, regeneration, etc.) carried out in syngas to liquid plants. Unlike powerproduction, the synthesis of chemicals or fuels is often controlled by chemical kinetics and itssimulation requires some form of kinetic model. In addition to simple models based onstoichiometry or chemical equilibrium, Aspen includes generalized models for kinetically-controlled reactors which can be used to estimate the mass and energy balance of the basictypes reactors: fixed bed, stirred, slurry bed or bubbling slurry bed. The model library ofAspen also includes a number of gas-solid, gas-liquid and gas-gas separators that allowestimating the yield and the utilities load of the whole synthesis island. The Aspen model canbe used to illustrate the trade-offs among the design parameters that determine theperformance of a co-production system, as well as to test the sensitivity to the operatingconditions and the specifications of the major components.
The ability to embed user-compiled models into the simulation process. While theframework of the physical and chemical models that can be run with Aspen has generalapplicability, it is obviously impossible to include beforehand all types of compounds,reactors or kinetic rate expressions that can be encountered in specific applications. The lackof data on a specific process can be easily overcome by interfaces that allow users to embedtheir own models into Aspen simulations. In fact, for this project the fuel synthesis island hasbeen simulated by embedding kinetic models of DME, Fischer-Tropsch and Mixed Alcoholsynthesis into the Aspen framework. The specific kinetic expressions and the kinetic modelsrequired to simulate the synthesis of each type of fuel have been implemented in a Fortransubroutine called by the Aspen module that calculates the synthesis reactor. By developingappropriate in-house models, each user can tailor the simulation procedure to address specific
13
requirements, not only for kinetic expressions, but also for aspects related to fluid dynamics,heat transfer, etc.
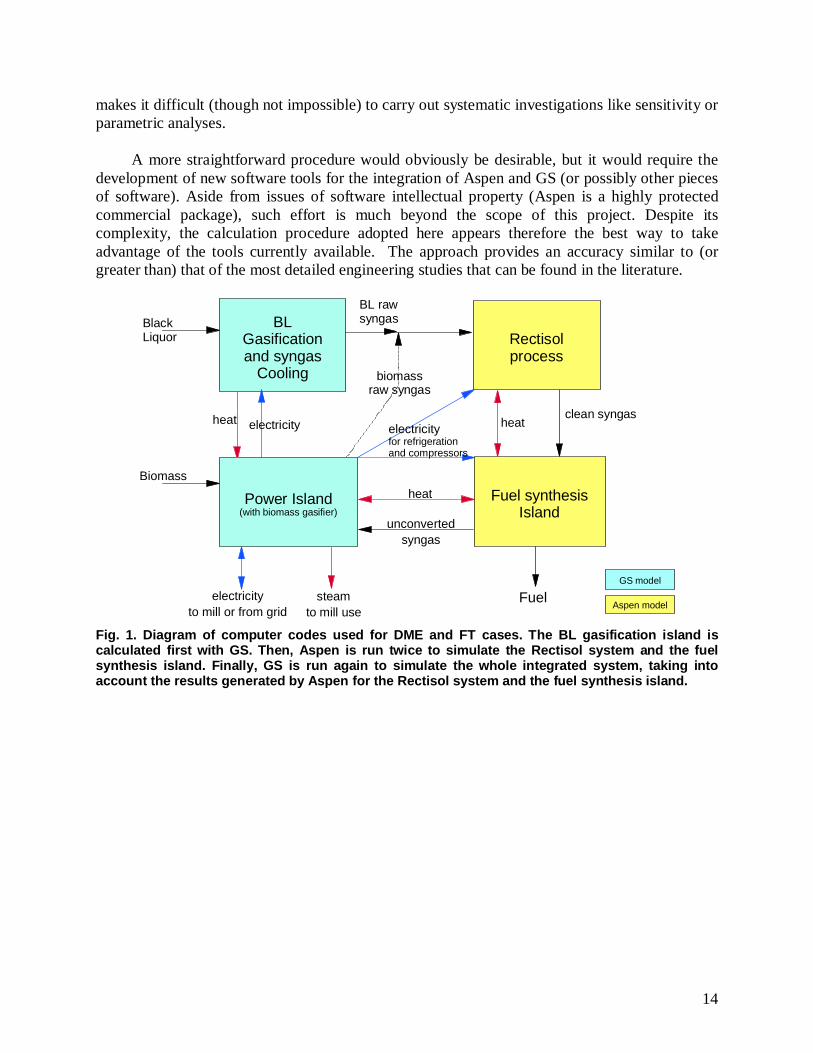
3.2 Calculation of fully integrated systemAspen or GS alone cannot carry out satisfactory simulations of the fully integrated systems
targeted in this project. This is why after a number of tests it was decided to use each code onlyfor the systems for which it is most suited (Fig. 1 and Fig. 2): Aspen, for the Rectisol system andthe fuel synthesis island; GS, for the gasification island and the power island.
In addition, GS was also used for the final pass giving the heat and mass balances of thewhole integrated system, i.e. the actual final output for each plant configuration. This approachgives the maximum possible accuracy at the expense of the complexity of the calculationprocedure, which requires a somewhat awkward but unavoidable sequence of GS and Aspenruns. The overall performances of each integrated system are calculated by going through thefollowing steps, with the output generated at each step being the input required for one of thesubsequent steps.1. Run the GS model of the BL gasification island to predict the flow rate and the
characteristics (composition, temperature, pressure) of the raw syngas at the inlet of the gasclean-up island, which are the inputs for the Aspen model of the Rectisol process.
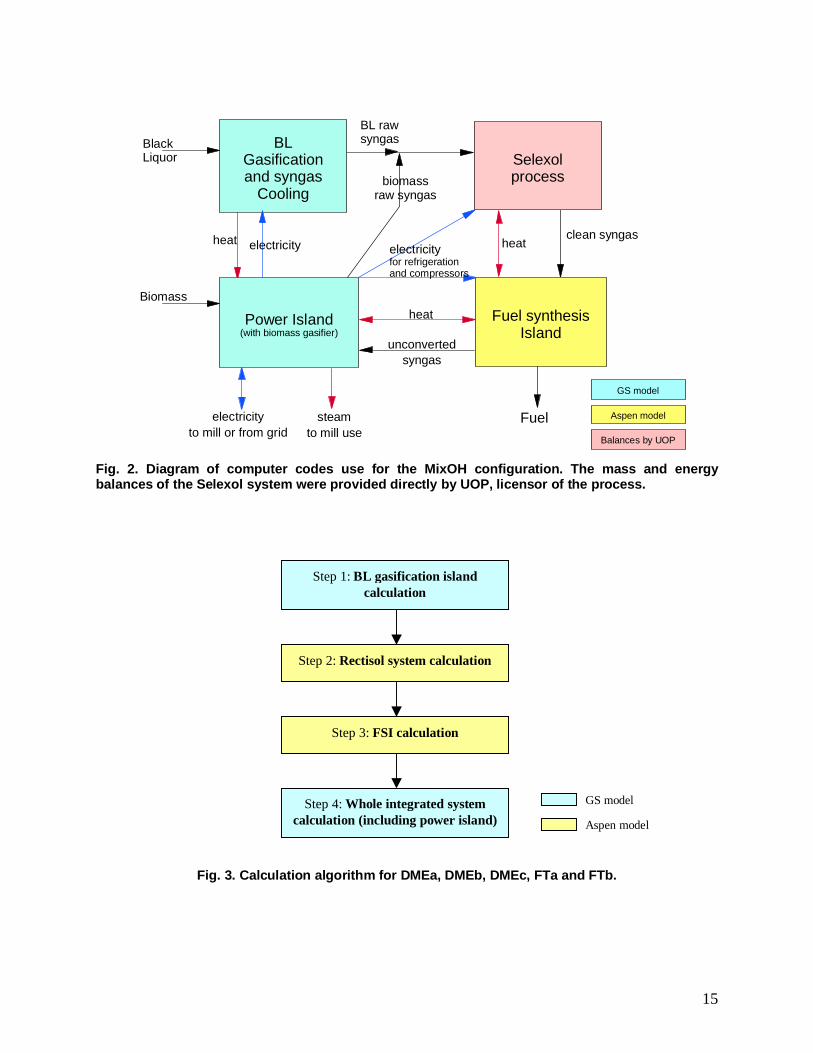
2. Run the Aspen model of the Rectisol process to calculate flow rate and conditions of theclean syngas, as well as all other parameters needed to calculate the energy balance of thewhole plant (cold and heat duty, flow rate and characteristics of streams other than the cleangas, etc.). In the MixOH case, syngas cleaning is carried out by the Selexol process and itsutilities and material balances have been provided directly by UOP, licensor of the process.
3. Run the Aspen model of the fuel synthesis island using as input the outputs of the GSsimulation of the gasification island and the Aspen simulation of the Rectisol system. Thisgives the amount of fuel available for export, as well as the flow rate and conditions(composition, temperature, pressure) of the unconverted syngas available for the powerisland, the refrigeration duty of the fuel synthesis island, the heat exchanged with powerisland, etc.
4. Run the GS model of the gasification island and power island altogether to predict theperformances of the fully integrated system. This final calculation takes into account theRectisol process and the fuel synthesis island as previously calculated by Aspen (heatexchanges, refrigeration duty, output flows, utilities, etc.), as well as the requirements ofancillary systems like the Claus and SCOT plant.
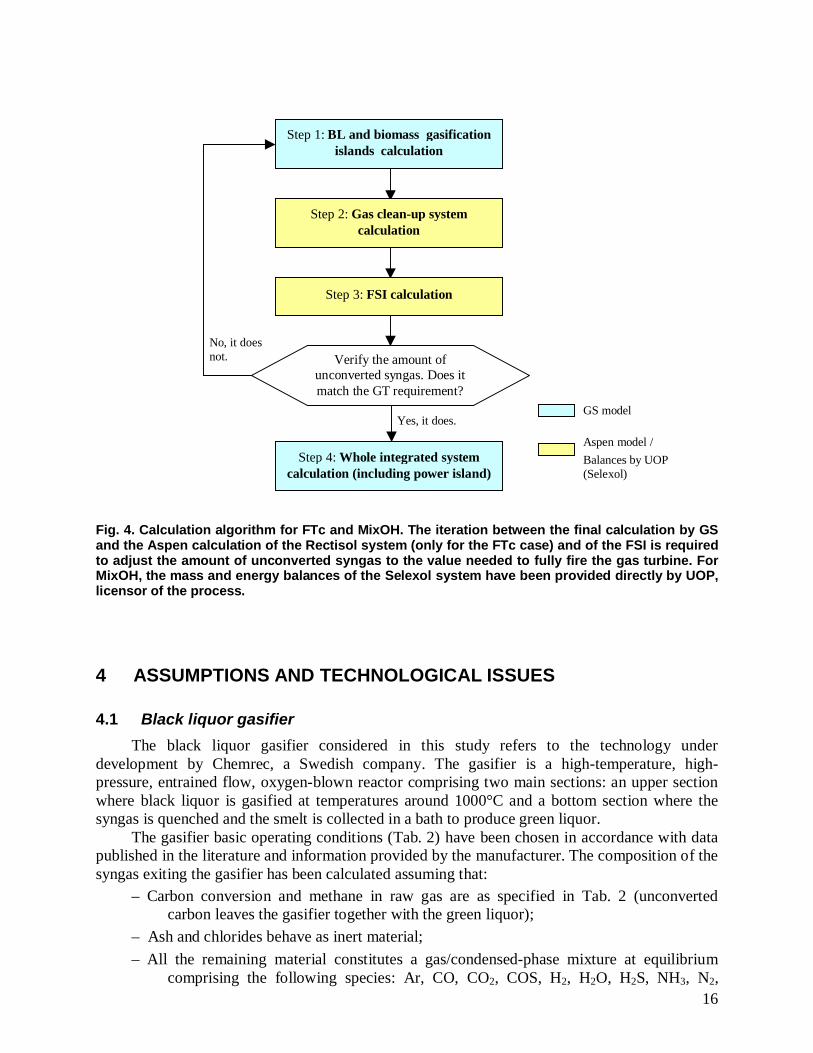
As long as no iteration is needed, this procedure requires a total of four runs in series (oneGS + two Aspen + one final GS) and can be managed without excessive penalties, as shown inFig. 3. This is the case for all plant configurations considered here except two: FTc and MixOH.In these cases the syngas generated by the biomass gasifier is mixed with the syngas generatedfrom black liquor and the whole syngas flow is used for fuel production. The gas turbine is fedwith the unconverted syngas from the fuel synthesis area (calculated by Aspen) and its flow ratemust match the amount needed to fully fire the gas turbine. This requires repeating iteratively thecalculation from step 2 to step 4, changing the amount of biomass fed to the biomass gasifieruntil the amount of unconverted syngas calculated by Aspen at step 3 equals the amountestimated by GS at step 4 for the gas turbine (Fig. 4). The complexity of this iteration procedure
14
makes it difficult (though not impossible) to carry out systematic investigations like sensitivity orparametric analyses.
A more straightforward procedure would obviously be desirable, but it would require thedevelopment of new software tools for the integration of Aspen and GS (or possibly other piecesof software). Aside from issues of software intellectual property (Aspen is a highly protectedcommercial package), such effort is much beyond the scope of this project. Despite itscomplexity, the calculation procedure adopted here appears therefore the best way to takeadvantage of the tools currently available. The approach provides an accuracy similar to (orgreater than) that of the most detailed engineering studies that can be found in the literature.
BLGasificationand syngas
Cooling
Rectisolprocess
Power Island(with biomass gasifier)
Fuel synthesisIsland
BL rawsyngas
clean syngasheat
heat
steamto mill use
electricity
Fuel
unconvertedsyngas
BlackLiquor
Biomass
electricityto mill or from grid
GS model
Aspen model
heatelectricityfor refrigerationand compressors
biomassraw syngas
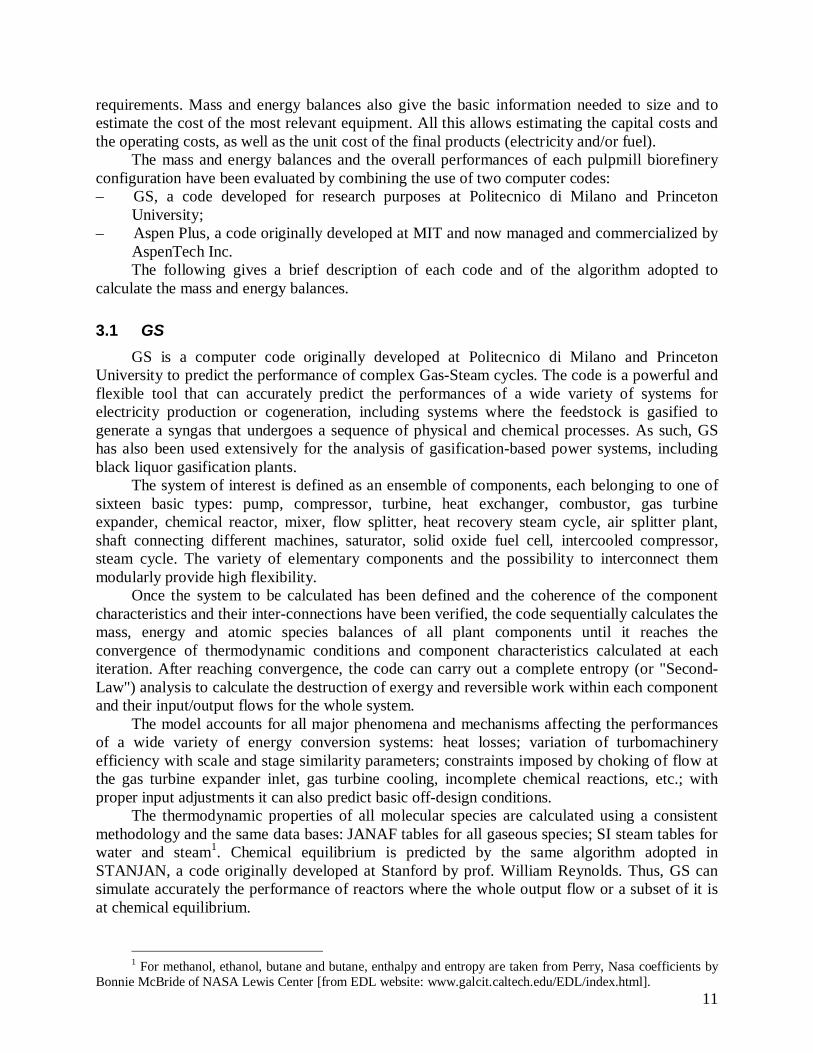
Fig. 1. Diagram of computer codes used for DME and FT cases. The BL gasification island iscalculated first with GS. Then, Aspen is run twice to simulate the Rectisol system and the fuelsynthesis island. Finally, GS is run again to simulate the whole integrated system, taking intoaccount the results generated by Aspen for the Rectisol system and the fuel synthesis island.
15
BLGasificationand syngas
Cooling
Selexolprocess
Power Island(with biomass gasifier)
Fuel synthesisIsland
BL rawsyngas
clean syngasheat
heat
steamto mill use
electricity
Fuel
unconvertedsyngas
BlackLiquor
Biomass
electricityto mill or from grid
Balances by UOP
Aspen model
heatelectricityfor refrigerationand compressors
biomassraw syngas
GS model
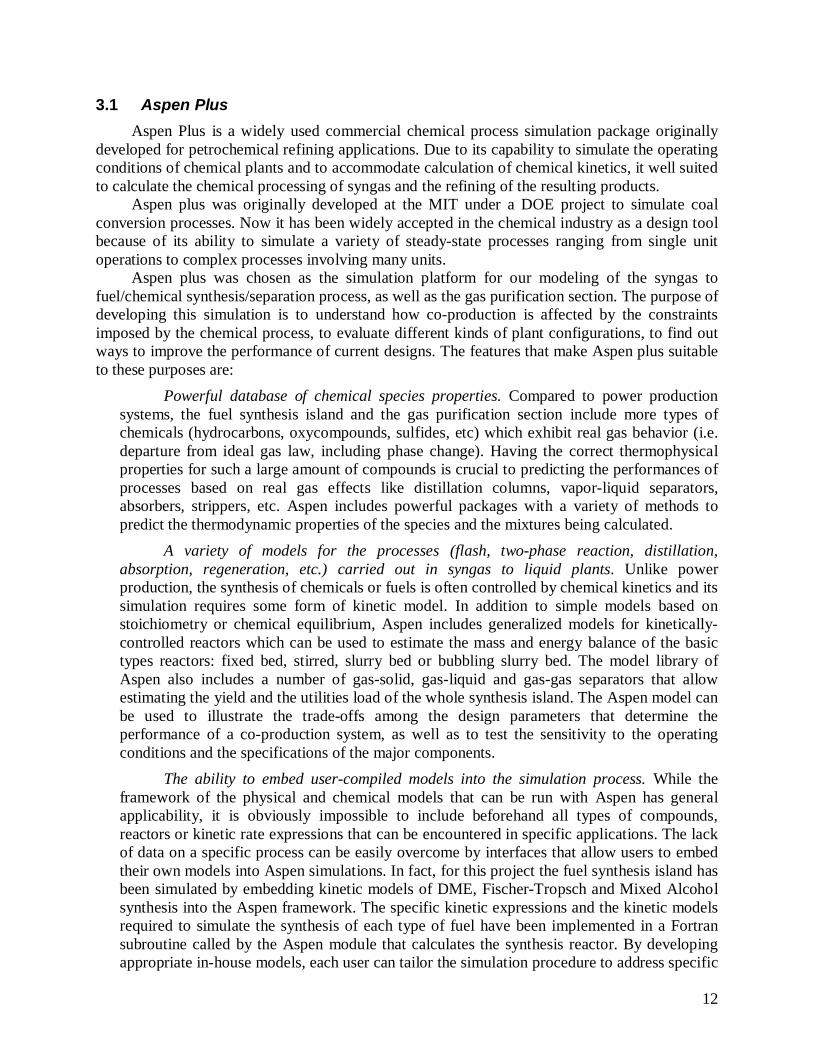
Fig. 2. Diagram of computer codes use for the MixOH configuration. The mass and energybalances of the Selexol system were provided directly by UOP, licensor of the process.
Step 1: BL gasification islandcalculation
Step 2: Rectisol system calculation
Step 3: FSI calculation
Step 4: Whole integrated systemcalculation (including power island)
GS model
Aspen model
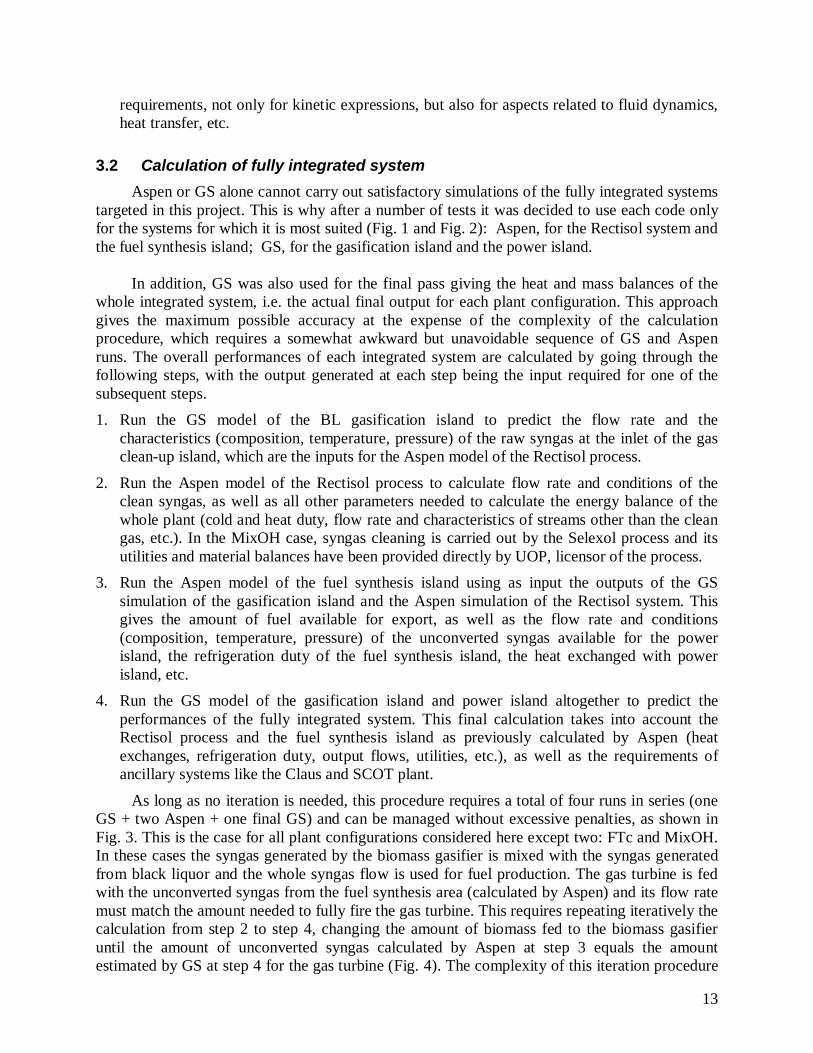
Fig. 3. Calculation algorithm for DMEa, DMEb, DMEc, FTa and FTb.
16
Step 1: BL and biomass gasificationislands calculation
Step 2: Gas clean-up systemcalculation
Step 3: FSI calculation
Step 4: Whole integrated systemcalculation (including power island)
Verify the amount ofunconverted syngas. Does itmatch the GT requirement?
Yes, it does.
No, it doesnot.
GS model
Aspen model /Balances by UOP(Selexol)
Fig. 4. Calculation algorithm for FTc and MixOH. The iteration between the final calculation by GSand the Aspen calculation of the Rectisol system (only for the FTc case) and of the FSI is requiredto adjust the amount of unconverted syngas to the value needed to fully fire the gas turbine. ForMixOH, the mass and energy balances of the Selexol system have been provided directly by UOP,licensor of the process.
4 ASSUMPTIONS AND TECHNOLOGICAL ISSUES
4.1 Black liquor gasifierThe black liquor gasifier considered in this study refers to the technology under
development by Chemrec, a Swedish company. The gasifier is a high-temperature, high-pressure, entrained flow, oxygen-blown reactor comprising two main sections: an upper sectionwhere black liquor is gasified at temperatures around 1000°C and a bottom section where thesyngas is quenched and the smelt is collected in a bath to produce green liquor.
The gasifier basic operating conditions (Tab. 2) have been chosen in accordance with datapublished in the literature and information provided by the manufacturer. The composition of thesyngas exiting the gasifier has been calculated assuming that:
– Carbon conversion and methane in raw gas are as specified in Tab. 2 (unconvertedcarbon leaves the gasifier together with the green liquor);
– Ash and chlorides behave as inert material;– All the remaining material constitutes a gas/condensed-phase mixture at equilibrium
comprising the following species: Ar, CO, CO2, COS, H2, H2O, H2S, NH3, N2,
17
Na2CO3, Na2SO4, Na2S, NaOH, K2CO3, K2SO4, where the species containing sodiumand potassium can be either liquid or solid or both, depending on temperature andpressure.
This calculation scheme, which determines the sulfur split between the syngas and thesolid/liquid phase, gives satisfactory agreement with specific information provided by themanufacturer of the gasifier, as well as with qualitative indications found in the literature.
Black Liquor GasifierPressure of raw syngas 35 bar (483 psig)Temperature of raw syngasbefore quench
1000°C(1832°F)
Heat loss to environment 0.5% of BL HHVHeat to cooling flows 2.0% of BL HHVCarbon conversion 99.9%Methane in raw syngas 1.5% mass in raw gas
Tab. 2. Basic BL gasifier operating parameters
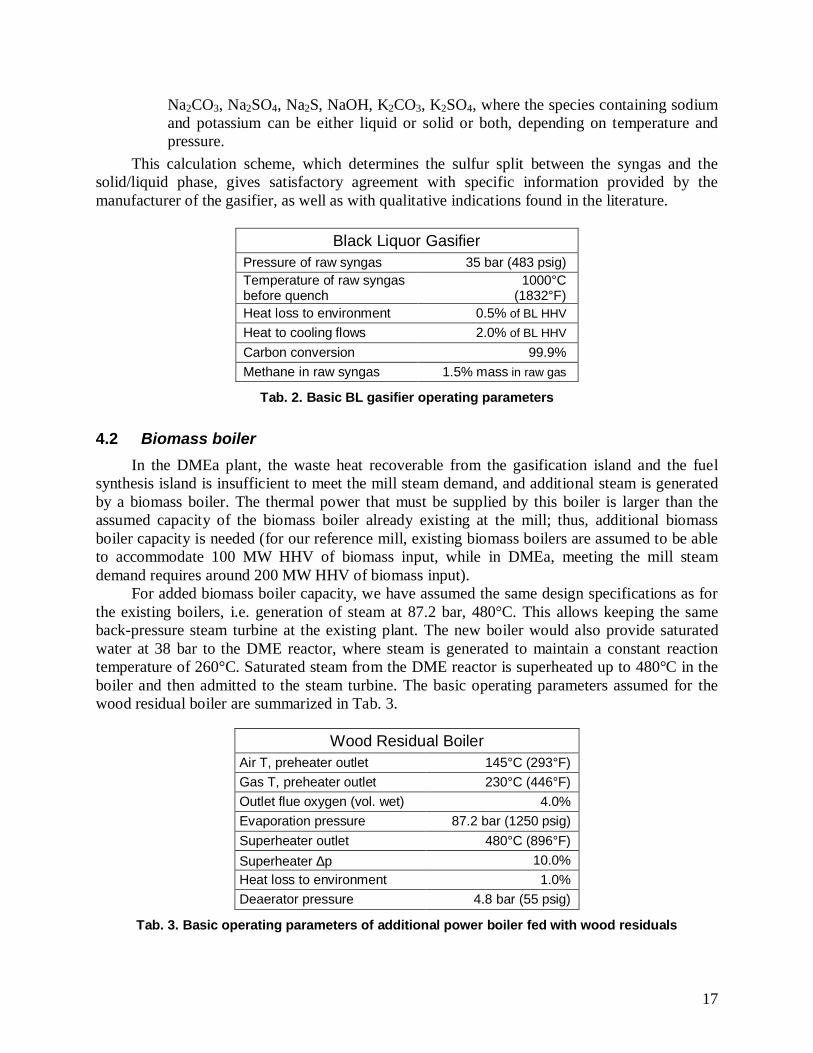
4.2 Biomass boilerIn the DMEa plant, the waste heat recoverable from the gasification island and the fuel
synthesis island is insufficient to meet the mill steam demand, and additional steam is generatedby a biomass boiler. The thermal power that must be supplied by this boiler is larger than theassumed capacity of the biomass boiler already existing at the mill; thus, additional biomassboiler capacity is needed (for our reference mill, existing biomass boilers are assumed to be ableto accommodate 100 MW HHV of biomass input, while in DMEa, meeting the mill steamdemand requires around 200 MW HHV of biomass input).
For added biomass boiler capacity, we have assumed the same design specifications as forthe existing boilers, i.e. generation of steam at 87.2 bar, 480°C. This allows keeping the sameback-pressure steam turbine at the existing plant. The new boiler would also provide saturatedwater at 38 bar to the DME reactor, where steam is generated to maintain a constant reactiontemperature of 260°C. Saturated steam from the DME reactor is superheated up to 480°C in theboiler and then admitted to the steam turbine. The basic operating parameters assumed for thewood residual boiler are summarized in Tab. 3.
Wood Residual BoilerAir T, preheater outlet 145°C (293°F)Gas T, preheater outlet 230°C (446°F)Outlet flue oxygen (vol. wet) 4.0%Evaporation pressure 87.2 bar (1250 psig)Superheater outlet 480°C (896°F)Superheater ∆p 10.0%Heat loss to environment 1.0%Deaerator pressure 4.8 bar (55 psig)
Tab. 3. Basic operating parameters of additional power boiler fed with wood residuals
18
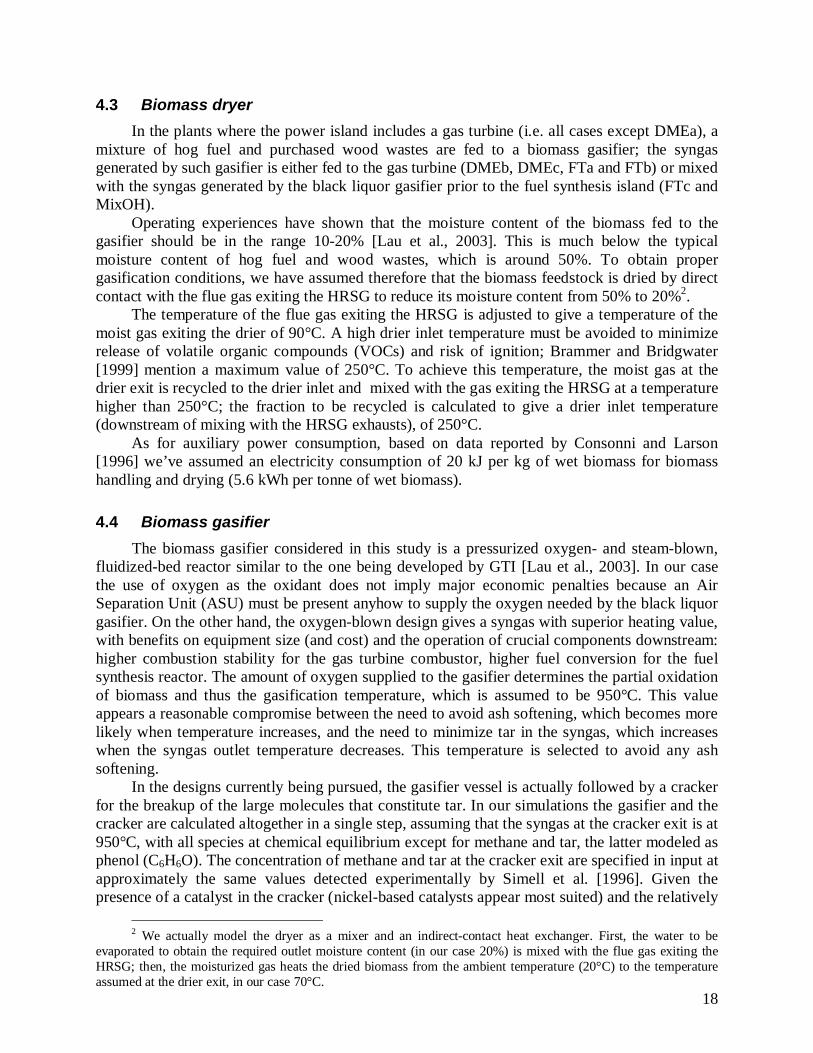
4.3 Biomass dryerIn the plants where the power island includes a gas turbine (i.e. all cases except DMEa), a
mixture of hog fuel and purchased wood wastes are fed to a biomass gasifier; the syngasgenerated by such gasifier is either fed to the gas turbine (DMEb, DMEc, FTa and FTb) or mixedwith the syngas generated by the black liquor gasifier prior to the fuel synthesis island (FTc andMixOH).
Operating experiences have shown that the moisture content of the biomass fed to thegasifier should be in the range 10-20% [Lau et al., 2003]. This is much below the typicalmoisture content of hog fuel and wood wastes, which is around 50%. To obtain propergasification conditions, we have assumed therefore that the biomass feedstock is dried by directcontact with the flue gas exiting the HRSG to reduce its moisture content from 50% to 20%2.
The temperature of the flue gas exiting the HRSG is adjusted to give a temperature of themoist gas exiting the drier of 90°C. A high drier inlet temperature must be avoided to minimizerelease of volatile organic compounds (VOCs) and risk of ignition; Brammer and Bridgwater[1999] mention a maximum value of 250°C. To achieve this temperature, the moist gas at thedrier exit is recycled to the drier inlet and mixed with the gas exiting the HRSG at a temperaturehigher than 250°C; the fraction to be recycled is calculated to give a drier inlet temperature(downstream of mixing with the HRSG exhausts), of 250°C.
As for auxiliary power consumption, based on data reported by Consonni and Larson[1996] we’ve assumed an electricity consumption of 20 kJ per kg of wet biomass for biomasshandling and drying (5.6 kWh per tonne of wet biomass).
4.4 Biomass gasifier The biomass gasifier considered in this study is a pressurized oxygen- and steam-blown,
fluidized-bed reactor similar to the one being developed by GTI [Lau et al., 2003]. In our casethe use of oxygen as the oxidant does not imply major economic penalties because an AirSeparation Unit (ASU) must be present anyhow to supply the oxygen needed by the black liquorgasifier. On the other hand, the oxygen-blown design gives a syngas with superior heating value,with benefits on equipment size (and cost) and the operation of crucial components downstream:higher combustion stability for the gas turbine combustor, higher fuel conversion for the fuelsynthesis reactor. The amount of oxygen supplied to the gasifier determines the partial oxidationof biomass and thus the gasification temperature, which is assumed to be 950°C. This valueappears a reasonable compromise between the need to avoid ash softening, which becomes morelikely when temperature increases, and the need to minimize tar in the syngas, which increaseswhen the syngas outlet temperature decreases. This temperature is selected to avoid any ashsoftening.
In the designs currently being pursued, the gasifier vessel is actually followed by a crackerfor the breakup of the large molecules that constitute tar. In our simulations the gasifier and thecracker are calculated altogether in a single step, assuming that the syngas at the cracker exit is at950°C, with all species at chemical equilibrium except for methane and tar, the latter modeled asphenol (C6H6O). The concentration of methane and tar at the cracker exit are specified in input atapproximately the same values detected experimentally by Simell et al. [1996]. Given thepresence of a catalyst in the cracker (nickel-based catalysts appear most suited) and the relatively
2 We actually model the dryer as a mixer and an indirect-contact heat exchanger. First, the water to beevaporated to obtain the required outlet moisture content (in our case 20%) is mixed with the flue gas exiting theHRSG; then, the moisturized gas heats the dried biomass from the ambient temperature (20°C) to the temperatureassumed at the drier exit, in our case 70°C.
19
high temperature, assuming that all species but methane and tar are at chemical equilibrium atthe cracker outlet appears reasonable. Experimental data reported by Simell et al. [1996] showequilibrium is nearly reached even at the moderate conditions of 5 bar and 900°C.
In addition to oxygen, the gasifier is fed also with steam to fluidize the bed. The operatingpressure is 36 bar, which is in the range of pressurized systems under development [Lau et al.1993; Blackadder et al. 1994]. In the configurations where the biomass syngas is mixed with theBL syngas (i.e. FTc and MixOH), pressurized gasification allows mixing the two streamswithout the need for biomass syngas gas compression; this is beneficial, because the losses dueto fuel gas compression are typically higher then those due to the compression of the fluidizingagent. On the other hand, in the configurations where the biomass syngas is supplied to the gasturbine, pressurized gasification allows the production of useful power by a gas expander. Thesebenefits will have to be weighed against the complexity and the operating costs of biomassfeeding to a pressurized reactor. In our case biomass is pressurized in lock hoppers with a streamof pure N2 provided from the ASU plant; the lock-hoppers energy consumption is that for inertgas compression.
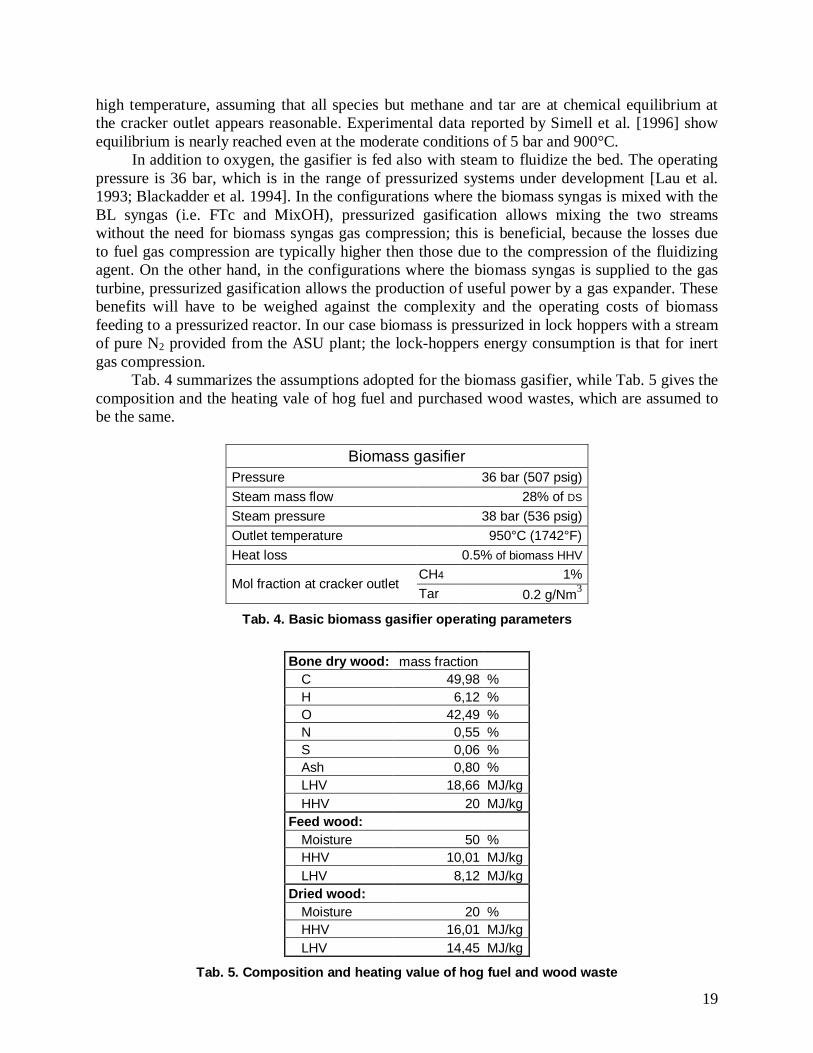
Tab. 4 summarizes the assumptions adopted for the biomass gasifier, while Tab. 5 gives thecomposition and the heating vale of hog fuel and purchased wood wastes, which are assumed tobe the same.
Biomass gasifierPressure 36 bar (507 psig)Steam mass flow 28% of DS
Steam pressure 38 bar (536 psig)Outlet temperature 950°C (1742°F)Heat loss 0.5% of biomass HHV
CH4 1%Mol fraction at cracker outlet
Tar 0.2 g/Nm3
Tab. 4. Basic biomass gasifier operating parameters
Bone dry wood: mass fractionC 49,98 %H 6,12 %O 42,49 %N 0,55 %S 0,06 %Ash 0,80 %LHV 18,66 MJ/kgHHV 20 MJ/kg
Feed wood:Moisture 50 %HHV 10,01 MJ/kgLHV 8,12 MJ/kg
Dried wood:Moisture 20 %HHV 16,01 MJ/kgLHV 14,45 MJ/kg
Tab. 5. Composition and heating value of hog fuel and wood waste

20
4.5 Syngas clean-up system The syngas generated by the gasification of black liquor or biomass must be cooled and
properly treated to insure proper and reliable operation of the equipment fed with the syngas. Thetechnologies to be used and the extent to which the gas must be purified depend on the syngascomposition and the requirements of the systems downstream. Consequently, the arrangementand the processes assumed here have been tailored to the characteristics of the various systemconfigurations.
4.5.1 Syngas generated by the black liquor gasifier The syngas generated from black liquor exhibits relatively high concentrations of
particulates, alkali, chlorine and sulfur. In the high-temperature gasification technologyconsidered here most of the particulates and the alkali should be removed by the quench and inthe heat exchanger placed immediately downstream of the gasifier, where the condensategenerated by cooling the saturated syngas below its dew point flows counter-current with thegas, thus acting like a scrubber. This condensation cooling alone should remove most of thesoluble species (alkali and acid gases) and particulates. On the other hand, given the verystringent requirements of the FSI downstream, we’ve considered two further treatments toachieve deep gas clean-up: low-temperature wet scrubbing and Rectisol. Despite its high cost,the latter is the most reliable process now available to achieve the purity required by the catalystsadopted to synthesize DME and FT fuels. In the MixOH case, the MoS2 catalyst considered forthe mixed alcohol synthesis requires some H2S in the syngas and the very deep removalachievable with Rectisol is unnecessary. In this case we’ve therefore considered a wet scrubberfollowed by a Selexol system, which is less costly than Rectisol.
4.5.2 Syngas generated by the biomass gasifier The clean-up requirements for the syngas generated by biomass are different depending on
whether the syngas is fed to the gas turbine or the FSI. The following summarizes thetechnologies and the operating parameters assumed in each case. The need to control tar is thesame in both cases.
4.5.2.1 Tar control Tars are condensable organic compounds formed during gasification. They condense at
temperatures around 350°C and their deposition on cool surfaces can cause severe operatingproblems: fouled heat transfer surfaces, constricted piping, clogged valves, etc. The tarconcentration in the syngas is a function of gasification temperature and of the properties of thefeedstock. Wood gasification (and biomass gasification in general) generates much more tar thancoal gasification due to lower reactor temperatures utilized. A number of design features (e.g.splitting oxidant injection into a primary and secondary flow) can be effective in reducing tarformation; however, a process for tar destruction is likely to be necessary to achieve the lowconcentrations required for reliable plant operation. In our case we have assumed that the gasleaving the gasifier goes through a fixed bed catalytic reactor where tars are cracked into specieswith lower molecular weight. A nickel-based catalyst appears preferable, because at highpressure the catalytic action of dolomite or other carbonate rocks may be inadequate, even at950°C. Pilot-scale tests have shown that nickel-based catalysts at elevated temperature (around900°C) have high activity for tar destruction; they also catalyze ammonia decomposition, andabout 80% ammonia conversion are achieved in the cracker. Then the amount of ammonia in the
21
product gas at the cracker exit is slightly higher than at equilibrium3 [Simell et al., 1996]. Hightemperature is needed also to avoid the formation of solid carbon, which could deposit and causecatalyst deactivation, as well as to compensate the deactivation caused at high pressure by H2S.
At present, many nickel-based catalysts are commercially available because of theirapplication in the steam reforming of hydrocarbons. They have demonstrated high activity alsofor tar destruction, although they undergo rapid deactivation due to poisoning by impurities andcoke formation. Additional research is needed to develop formulations with longer lifetime.
In the model adopted here, the total oxygen flow supplied to the gasifier and the cracker isadjusted to achieve the specified temperature of 950°C at the cracker exit, assuming that the gascomposition is at equilibrium except for methane and tar. In the configurations with the syngascooler, where the biomass syngas is treated with just a ceramic candle filter, its temperature ismaintained always above 375°C to prevent tar condensation. In the configurations with thequench, the biomass syngas is mixed with the black liquor syngas and treated in a Rectisol orSelexol system at low temperature.
4.5.2.2 Biomass syngas to the gas turbine In cases DMEa, DMEb, FTa and FTb the gas turbine is fed with a mixture of syngas
generated by the biomass gasifier and unconverted syngas from the fuel production island. Incases FTc and MixOH the gas turbine is fed solely with unconverted syngas.
The fuel gas fed to the gas turbine must not contain particulate or contaminants that candamage the turbine blades by erosion or corrosion. Additional contaminants of concern from anemission standpoint are nitrogen compounds, especially ammonia derived from nitrogen inbiomass feedstock.
Unlike unconverted syngas, the syngas generated by the biomass gasifier containscontaminants that must be removed to prevent damage to the equipment downstream. In theconfigurations where the biomass syngas goes only to the GT (DMEa, DMEb, FTa and FTb) wehave considered hot clean-up (ceramic filter operating around 450°C) that allows maintaining thesyngas at high temperature. A commercially proven, low-temperature technology like quenchand wet scrubbing would be simpler and safer, but less efficient. Consistent with our overallanalysis, we assume that hot gas cleaning will be equally reliable in a commercial Nth plant.
4.5.2.2.1 Particulate removal Particulates can cause severe turbine blade erosion even at very small concentrations. This
is why gas turbine manufacturers specify stringent limits (around 5 ppm by weight) for theirconcentration in the fuel gas. Since conventional cyclones can’t attain such low concentrations,high efficiency filtration devices like ceramic or metallic candle filters must be placed at anappropriate point of the syngas path.
In our modelization we have assumed that the bulk of the ash in the raw gas is removed bya cyclone at the gasifier exit, while all remaining particulates are separated by a ceramic (ormetallic) filter operating at the temperature that allows maintaining the syngas above 375°C alsodownstream of the syngas expander and after mixing with unconverted syngas. Maintaining thesyngas above 375°C is supposed to prevent the condensation of tars. At the same time, theoperating temperature of the filter (around 450°C) is low enough to induce the condensation ofmost alkali on the solid particles removed by the filter.
3 At equilibrium the ammonia content is 60-50 ppm at 905-960°C.
22
At present, high temperature filters are not a commercial process yet. They are being testedin some pilot-plant gasifier and additional development and demonstrations are required to provetheir effectiveness and commercial viability.
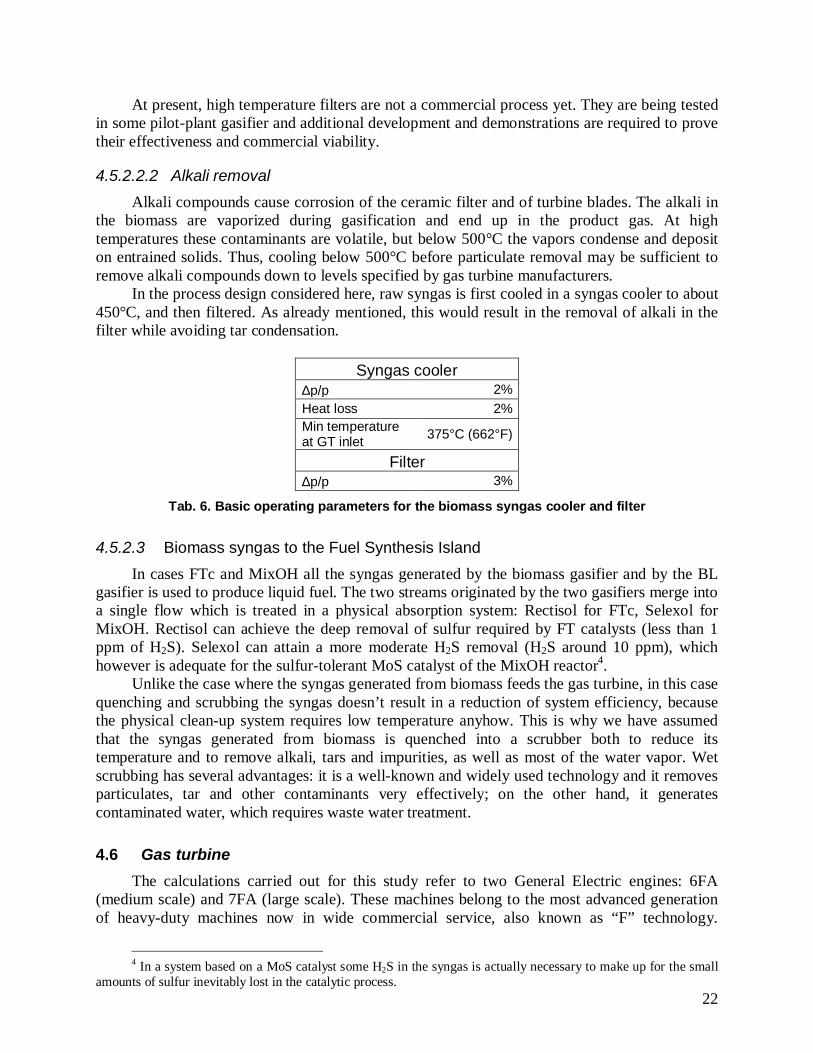
4.5.2.2.2 Alkali removal Alkali compounds cause corrosion of the ceramic filter and of turbine blades. The alkali in
the biomass are vaporized during gasification and end up in the product gas. At hightemperatures these contaminants are volatile, but below 500°C the vapors condense and depositon entrained solids. Thus, cooling below 500°C before particulate removal may be sufficient toremove alkali compounds down to levels specified by gas turbine manufacturers.
In the process design considered here, raw syngas is first cooled in a syngas cooler to about450°C, and then filtered. As already mentioned, this would result in the removal of alkali in thefilter while avoiding tar condensation.
Syngas cooler∆p/p 2%Heat loss 2%Min temperatureat GT inlet 375°C (662°F)
Filter∆p/p 3%
Tab. 6. Basic operating parameters for the biomass syngas cooler and filter
4.5.2.3 Biomass syngas to the Fuel Synthesis Island In cases FTc and MixOH all the syngas generated by the biomass gasifier and by the BL
gasifier is used to produce liquid fuel. The two streams originated by the two gasifiers merge intoa single flow which is treated in a physical absorption system: Rectisol for FTc, Selexol forMixOH. Rectisol can achieve the deep removal of sulfur required by FT catalysts (less than 1ppm of H2S). Selexol can attain a more moderate H2S removal (H2S around 10 ppm), whichhowever is adequate for the sulfur-tolerant MoS catalyst of the MixOH reactor4.
Unlike the case where the syngas generated from biomass feeds the gas turbine, in this casequenching and scrubbing the syngas doesn’t result in a reduction of system efficiency, becausethe physical clean-up system requires low temperature anyhow. This is why we have assumedthat the syngas generated from biomass is quenched into a scrubber both to reduce itstemperature and to remove alkali, tars and impurities, as well as most of the water vapor. Wetscrubbing has several advantages: it is a well-known and widely used technology and it removesparticulates, tar and other contaminants very effectively; on the other hand, it generatescontaminated water, which requires waste water treatment.
4.6 Gas turbine The calculations carried out for this study refer to two General Electric engines: 6FA
(medium scale) and 7FA (large scale). These machines belong to the most advanced generationof heavy-duty machines now in wide commercial service, also known as “F” technology.
4 In a system based on a MoS catalyst some H2S in the syngas is actually necessary to make up for the smallamounts of sulfur inevitably lost in the catalytic process.
23
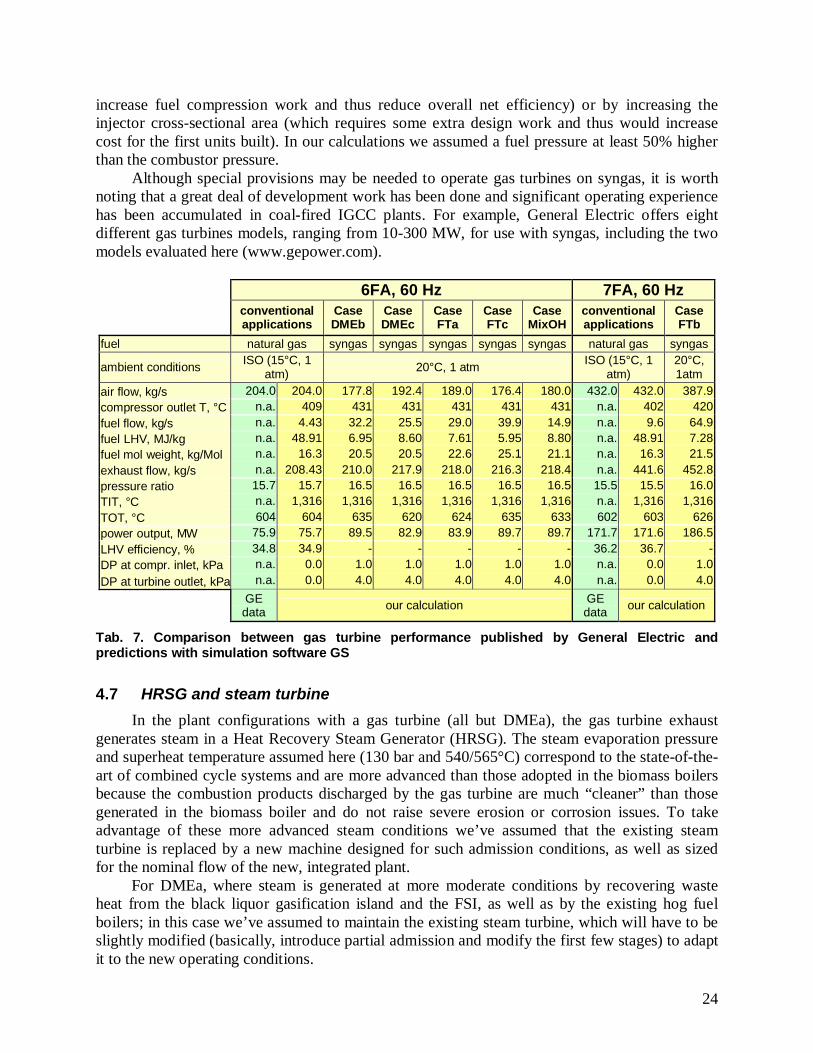
Performance predictions have been calibrated based on data published by General Electric; a fewrelevant inputs to the gas turbine model have been fine tuned to achieve the best possibleagreement with the overall performance published by GE. Tab. 7 compares the performancesquoted by GE with those generated by the calculation model for operation on natural gas fuel atISO conditions (15°C, 1 atm).
Compared to natural gas firing, feeding the gas turbine with a biomass-derived syngasincreased mass flow through the turbine because, due to the relatively low heating value of thebiomass syngas, a larger fuel flow rate is needed to reach a given Turbine Inlet Temperature(TIT). The larger mass flow through the turbine affects the match between the turbine and thecompressor, which must obviously operate in such a way that the compressor outlet pressureequals (once combustor pressure drop is accounted for) the turbine inlet pressure.
The calculation carried out in GS assumes that the expander operates underaerodynamically choked conditions i.e. its “reduced” (non-dimensional) mass flow is constant.This corresponds to the operating conditions of essentially all commercial gas turbines. In thissituation a larger mass flow can be accommodated only by increasing the pressure ahead of theturbine, i.e. by increasing the compressor pressure ratio. Higher pressure ratios move thecompressor toward the stall limit, and thus there is a limit to the mass flow increase that can betolerated by the gas turbine. In our calculations we have assumed that:
– The Turbine Inlet Temperature (TIT) is the same as with natural gas firing;– The compressor can operate with a compression ratio up to 5% above its value with natural
gas;– Further increases in fuel flow must be accommodated by reducing the air flow entering the
compressor, which in most engines can be easily accomplished by adjusting the inlet guidevanes. Due to the different flow rate and thermo-physical properties of syngas compared to natural
gas, maintaining the same TIT of the natural-gas version implies higher temperatures throughoutthe expansion and thus – everything else equal – higher blade metal temperatures and shorter lifeof the hot parts of the engine. This is why syngas-fired gas turbines are typically de-rated (TITlower by 10-30°C) to maintain the same life and reliability of the natural gas-fired version. Ourassumption of no change in TIT implies an increase in Turbine Outlet Temperature (TOT) of 10-20°C and can be justified by considering that by the time the Nth pulpmill biorefinery plant isrealized, TIT and TOT of state-of-the-art gas turbines will be significantly higher than thoseadopted today.
As to the 5% increase in pressure ratio, it is within the range typically tolerable by thecompressors of heavy-duty engines. Whether such an increase is compatible with lower air flowcan only be verified by the gas turbine manufacturer (when air flow is decreased by closing theInlet Guide Vanes, the compressor stall margin decreases).
Other issues raised by the use of syngas in a gas turbine are related to combustor stability,emissions and fuel injector pressure loss, which may be substantially different from those withnatural gas. The first two are mainly related to syngas chemical composition and heating value;the third is related to flow rate. Based on pilot-scale experimental work and the experienceaccumulated in Integrated Gasification Combined Cycles (IGCC), refineries and steel plants,combustion stability should not be a major issue as long as the fuel calorific value is above 4-6MJ/mn
3 (1 mn3 = 1 m3 at the "normal" conditions of 1 atm, 0°C). In the systems considered here,
the fuel fed to the gas turbine has a heating value higher than 6 MJ/mn3, so no particular flame
stability problems are envisaged. The increase in pressure loss to be applied across the fuelinjectors can be accommodated either by increasing the fuel pressure (which however will
24
increase fuel compression work and thus reduce overall net efficiency) or by increasing theinjector cross-sectional area (which requires some extra design work and thus would increasecost for the first units built). In our calculations we assumed a fuel pressure at least 50% higherthan the combustor pressure.
Although special provisions may be needed to operate gas turbines on syngas, it is worthnoting that a great deal of development work has been done and significant operating experiencehas been accumulated in coal-fired IGCC plants. For example, General Electric offers eightdifferent gas turbines models, ranging from 10-300 MW, for use with syngas, including the twomodels evaluated here (www.gepower.com).
6FA, 60 Hz 7FA, 60 Hzconventionalapplications
CaseDMEb
CaseDMEc
CaseFTa
CaseFTc
CaseMixOH
conventionalapplications
CaseFTb
fuel natural gas syngas syngas syngas syngas syngas natural gas syngas
ambient conditions ISO (15°C, 1atm) 20°C, 1 atm ISO (15°C, 1
atm)20°C,1atm
air flow, kg/s 204.0 204.0 177.8 192.4 189.0 176.4 180.0 432.0 432.0 387.9compressor outlet T, °C n.a. 409 431 431 431 431 431 n.a. 402 420fuel flow, kg/s n.a. 4.43 32.2 25.5 29.0 39.9 14.9 n.a. 9.6 64.9fuel LHV, MJ/kg n.a. 48.91 6.95 8.60 7.61 5.95 8.80 n.a. 48.91 7.28fuel mol weight, kg/Mol n.a. 16.3 20.5 20.5 22.6 25.1 21.1 n.a. 16.3 21.5exhaust flow, kg/s n.a. 208.43 210.0 217.9 218.0 216.3 218.4 n.a. 441.6 452.8pressure ratio 15.7 15.7 16.5 16.5 16.5 16.5 16.5 15.5 15.5 16.0TIT, °C n.a. 1,316 1,316 1,316 1,316 1,316 1,316 n.a. 1,316 1,316TOT, °C 604 604 635 620 624 635 633 602 603 626power output, MW 75.9 75.7 89.5 82.9 83.9 89.7 89.7 171.7 171.6 186.5LHV efficiency, % 34.8 34.9 - - - - - 36.2 36.7 -DP at compr. inlet, kPa n.a. 0.0 1.0 1.0 1.0 1.0 1.0 n.a. 0.0 1.0DP at turbine outlet, kPa n.a. 0.0 4.0 4.0 4.0 4.0 4.0 n.a. 0.0 4.0
GEdata our calculation GE
data our calculation
Tab. 7. Comparison between gas turbine performance published by General Electric andpredictions with simulation software GS
4.7 HRSG and steam turbine In the plant configurations with a gas turbine (all but DMEa), the gas turbine exhaust
generates steam in a Heat Recovery Steam Generator (HRSG). The steam evaporation pressureand superheat temperature assumed here (130 bar and 540/565°C) correspond to the state-of-the-art of combined cycle systems and are more advanced than those adopted in the biomass boilersbecause the combustion products discharged by the gas turbine are much “cleaner” than thosegenerated in the biomass boiler and do not raise severe erosion or corrosion issues. To takeadvantage of these more advanced steam conditions we’ve assumed that the existing steamturbine is replaced by a new machine designed for such admission conditions, as well as sizedfor the nominal flow of the new, integrated plant.
For DMEa, where steam is generated at more moderate conditions by recovering wasteheat from the black liquor gasification island and the FSI, as well as by the existing hog fuelboilers; in this case we’ve assumed to maintain the existing steam turbine, which will have to beslightly modified (basically, introduce partial admission and modify the first few stages) to adaptit to the new operating conditions.
25
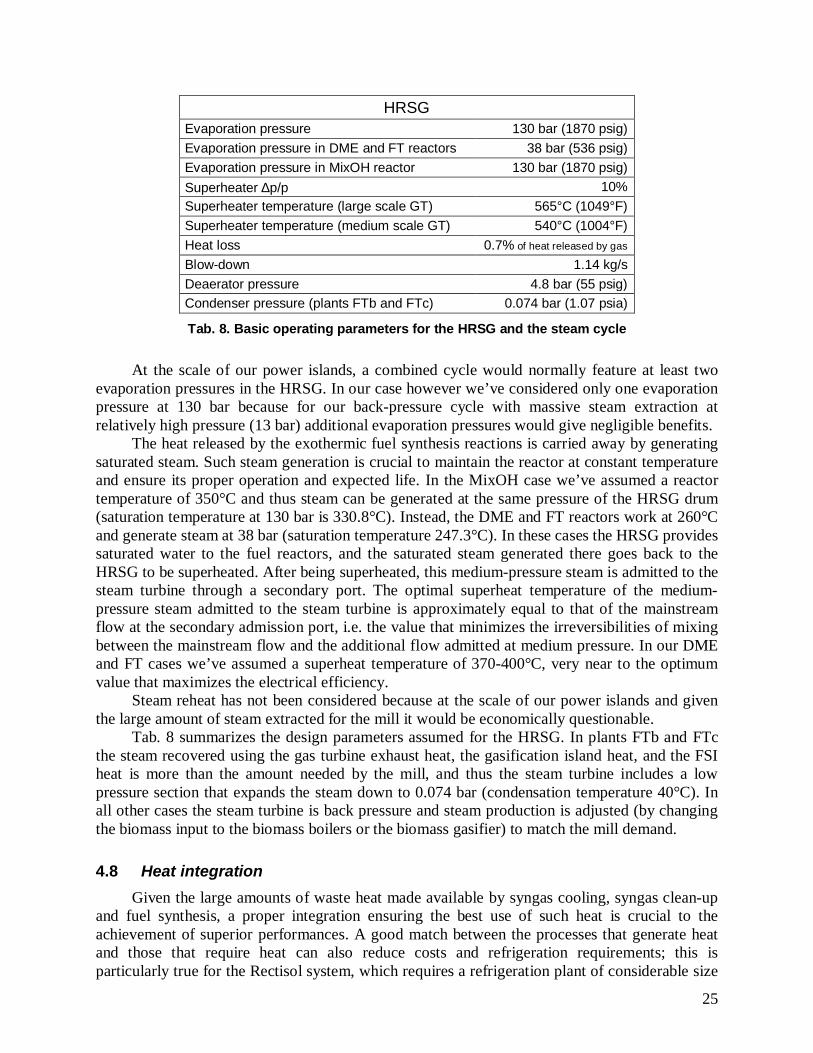
HRSGEvaporation pressure 130 bar (1870 psig)Evaporation pressure in DME and FT reactors 38 bar (536 psig)Evaporation pressure in MixOH reactor 130 bar (1870 psig)Superheater ∆p/p 10%Superheater temperature (large scale GT) 565°C (1049°F)Superheater temperature (medium scale GT) 540°C (1004°F)Heat loss 0.7% of heat released by gas
Blow-down 1.14 kg/sDeaerator pressure 4.8 bar (55 psig)Condenser pressure (plants FTb and FTc) 0.074 bar (1.07 psia)
Tab. 8. Basic operating parameters for the HRSG and the steam cycle
At the scale of our power islands, a combined cycle would normally feature at least twoevaporation pressures in the HRSG. In our case however we’ve considered only one evaporationpressure at 130 bar because for our back-pressure cycle with massive steam extraction atrelatively high pressure (13 bar) additional evaporation pressures would give negligible benefits.
The heat released by the exothermic fuel synthesis reactions is carried away by generatingsaturated steam. Such steam generation is crucial to maintain the reactor at constant temperatureand ensure its proper operation and expected life. In the MixOH case we’ve assumed a reactortemperature of 350°C and thus steam can be generated at the same pressure of the HRSG drum(saturation temperature at 130 bar is 330.8°C). Instead, the DME and FT reactors work at 260°Cand generate steam at 38 bar (saturation temperature 247.3°C). In these cases the HRSG providessaturated water to the fuel reactors, and the saturated steam generated there goes back to theHRSG to be superheated. After being superheated, this medium-pressure steam is admitted to thesteam turbine through a secondary port. The optimal superheat temperature of the medium-pressure steam admitted to the steam turbine is approximately equal to that of the mainstreamflow at the secondary admission port, i.e. the value that minimizes the irreversibilities of mixingbetween the mainstream flow and the additional flow admitted at medium pressure. In our DMEand FT cases we’ve assumed a superheat temperature of 370-400°C, very near to the optimumvalue that maximizes the electrical efficiency.
Steam reheat has not been considered because at the scale of our power islands and giventhe large amount of steam extracted for the mill it would be economically questionable.
Tab. 8 summarizes the design parameters assumed for the HRSG. In plants FTb and FTcthe steam recovered using the gas turbine exhaust heat, the gasification island heat, and the FSIheat is more than the amount needed by the mill, and thus the steam turbine includes a lowpressure section that expands the steam down to 0.074 bar (condensation temperature 40°C). Inall other cases the steam turbine is back pressure and steam production is adjusted (by changingthe biomass input to the biomass boilers or the biomass gasifier) to match the mill demand.
4.8 Heat integration Given the large amounts of waste heat made available by syngas cooling, syngas clean-up
and fuel synthesis, a proper integration ensuring the best use of such heat is crucial to theachievement of superior performances. A good match between the processes that generate heatand those that require heat can also reduce costs and refrigeration requirements; this isparticularly true for the Rectisol system, which requires a refrigeration plant of considerable size
26
(several MWref) to cool the syngas much below ambient temperature. The design of heat transferprocesses is also crucial to the achievement of proper operating conditions of key components: inthe syngas coolers, the generation of steam gives the high heat transfer coefficients needed tomaintain acceptable metal temperatures; in the fuel synthesis reactor, steam generation isessential to prevent catalyst overheating and achieve high conversion efficiencies.
The heat released by high temperature syngas streams from the black liquor gasifier and thebiomass gasifier are cooled to generate HP steam for the power island and the mill. Wheneverpossible, the heat made available at medium or low temperature is used to preheat make-upwater. This is particularly relevant for the plants with a large biomass gasifier, where the biomassdryer placed ahead of the gasifier and fed with the HRSG exhausts requires a large thermal input.Higher thermal inputs to the dryer are provided by increasing the temperature of the gas at theoutlet of the HRSG, which therefore exhibits a deficit of the low-temperature heat needed to pre-heat the water.
Despite the efforts to optimize the heat exchanger network, some low temperature heatmust be rejected to the environment and requires a cooling medium. We’ve assumed that enoughcooling water is available at the plant to bring the temperature of the streams to be cooled downto 35°C. This is particularly relevant for the Rectisol system, where to limit the refrigerationpower it is important that the syngas be cooled to the lowest possible temperature prior to itsinput into the refrigeration plant. Without adequate amounts of cooling water, net electricityproduction can be significantly lower than reported here, with somewhat higher capital costs.
To minimize irreversibilities and thus maximize efficiency, we’ve assumed that heat istransferred across relatively small temperature differences: minimum temperature difference10°C for gas-liquid heat transfer; minimum temperature difference ~ 15°C for gas-gas heattransfer. In an actual situation these temperature differences are subject to economicoptimization, to determine the best trade-off between efficiency and capital costs.
Heat exchangers operating at medium or low temperature are assumed to incur negligibleheat losses, whereas for the HRSG we’ve assumed a heat loss of 0.7% of the heat transferred(Tab. 8). For the syngas cooler of the biomass gasifier, which handles gas between 950°C and450-500°C, we’ve assumed a heat loss of 2% of heat transferred.
4.9 Oxygen production 95% pure oxygen (with 3.65% Ar and 1.35% N2) is supplied to the oxygen-blown gasifiers
by a stand-alone, conventional cryogenic Air Separation Unit (ASU) which generates oxygen atatmospheric pressure. Compression up to gasification pressure (36 bar) is carried out by anintercooled oxygen compressor. Some performance improvement may be gained by integratingthe ASU with the power plant, which however should be carefully weighed against theimplications and the unknowns of the added complexity of the plant and the start-up and shut-down procedures. We assume a non-integrated ASU in our designs.
The oxygen consumption of the gasifiers is determined by the composition, moisturecontent and heating value of the material to be gasified, as well as by the temperature to bereached (in our case, 1000°C for the black liquor gasifier, 950°C for the biomass gasifier). TheBL gasifier oxygen requirement – as well as the whole heat/mass balances – is very sensitive tothe Oxygen/Carbon ratio in the dry BL solids. Given the uncertainties about the actualcomposition of black liquor under polysulfide operating conditions, further work is needed to getreliable estimates of dry solids composition and properties at the conditions at which a millwould operate when integrated with a BL gasification system.
27
With gasification, the load of the lime kiln increases as a consequence of different smeltcomposition and a different breakdown between the sulfur that goes in the gas and in the smelt.Since the load increase is limited, we’ve assumed that it can be accommodated by firing the kilnwith oxygen enriched air. A small increase in the size of the Air Separation Unit provides a low-cost source of oxygen for this purpose. The ASU size is further increased a little to also provideoxygen for the O2 delignification unit existing at the mill. (See additional discussion on thistopic in Volume 1.)
In the configurations with a biomass gasifier, the ASU also provides the nitrogen requiredby the biomass lock-hoppers.
4.10 Lime Kiln Because of an increase of sodium carbonate leaving the gasifier in the condensed phase,
black liquor gasification requires a higher causticization load compared to processing in aTomlinson boiler. The higher causticization load requires a higher lime kiln capacity and higherlime kiln fuel consumption per unit of black liquor solids processed.
In the previous BLGCC study [Larson, Consonni and Katofsky, 2003] we’ve estimated a16% increase in lime kiln load based on the assumption that the ratio of Active Alkali in thepulping liquor to the wood feed to the digester for the polysulfide process is the same of theconventional process utilizing Tomlinson recovery boilers. This assumption must be verifiedbased on a more careful estimate of the heat/mass balances of polysulfide pulping. It is worthnoting that, due to the higher yield of the polysulfide process assumed with gasification, theincrease in kiln load (kW or kg/s of fuel oil) is significantly smaller than the increase in specificlime requirements (t of lime per t of BLS), which is 28%.
Given the relatively modest increase in the capacity required for the lime kiln, it is assumedthat the extra capacity needed is met by oxygen-enrichment of combustion air.
4.11 Sulfur Recovery system The H2S in the gas phase at the exit of the BL gasifier must be removed both to recover the
sulfur for the pulp mill and to prevent damages to the equipment downstream. Sulfur compoundsand other contaminants can poison the catalysts used for fuel synthesis, as well as corrode thegas turbine and the heat transfer equipment.
The removal of H2S and other contaminants can be carried out by a number of technologiesbased on chemical or physical absorption. The latter is favored by high pressures and lowtemperatures, which increase the solubility of the species to be captured into the liquid solventused to carry them away. Unlike chemical absorption, physical absorption does not require largeamounts of heat to regenerate the solvent; on the other hand, it requires high partial pressure ofthe gases to be removed. In our schemes gas clean-up is carried out at pressures between 32 and105 bar; this situation is favorable for physical absorption, which therefore has been assumed inall cases.
Specifically, we’ve considered two of the most widespread commercial physical absorptionprocesses that have accumulated significant operating experience with syngas treatment: Rectisoland Selexol. The former makes use of methanol as the solvent and operates at cryogenictemperatures (from -25°C to -60°C or even lower); the latter makes use of dimethyl ether ofpolyethylene glycol and typically operates at nearly ambient temperature (20-30°C). Rectisol canreduce the concentration of H2S to much lower levels then Selexol; however, its much loweroperating temperatures give higher power consumption and the complex plant arrangementresults in higher capital costs.
28
The catalysts considered here for the production of DME and FT are very sensitive tosulfur poisoning and require very low concentrations of H2S, of the order of 0.1 ppmv. Such aconcentration is beyond reach for Selexol and necessarily requires Rectisol, which therefore hasbeen assumed for all DME and FT cases. In addition to H2S, Rectisol also captures most of theCO2: without special provisions, up to 80% of the amount at inlet. This is a desirable featurebecause low CO2 concentrations in the gas fed to the FSI improve its conversion to liquid fuel.The removal of all the CO2 requires a more complex and thus more expensive design, which hasbeen adopted only when the unconverted syngas is recycled (cases DMEa and DMEb), to avoidexcessive CO2 build-up in the recycle loop.
The catalysts considered for the production of mixed alcohols is a Mo-based sulfide thatcan tolerate H2S concentration three orders of magnitude higher, around 100 ppmv; some H2S isactually needed in the gas to make up for the sulfur inevitably lost by the catalyst. Thiscircumstance suggests Selexol as a more suitable process for the MixOH case, and this is theoption we have used.
4.11.1 Rectisol system Given the significant consumption of utilities (especially refrigeration power, which
translates to electric power requirements), the Rectisol system has been modeled in detail withAspen Plus to quantify the requirements of refrigeration power, steam and electricity with anaccuracy comparable to the estimates for the other major subsystems. The model, theconfigurations and the results generated with Aspen Plus are illustrated in detail in Appendix C.Although this model cannot provide detailed design information, it is helpful to define the plantconfiguration, choose the most suitable operating conditions and estimate the mass and heatbalances.
The base configuration has been set up to achieve a concentration of H2S + COS below 1ppm and a concentration of CO2 below 1% by volume. As reported in Tab. 9, the acid gasesremoved from the syngas are released in three streams:
- one containing essentially all the H2S and COS removed from the syngas; the concentrationof H2S + COS in this stream is higher than 40% by vol., making it fully compatible withtreatment in a Claus plant;
- one consisting mainly of CO2 (more than 97% by volume) with no H2S nor COS, whichcan be vented to the atmosphere or used in chemical industry.
- a tailgas with about 50% CO2 and 50% N2, also with no H2S nor COS. This tailgas streamcan be discharged to atmosphere. However, if some ppm of H2S would still be present inthis flow, a LO-CAT or other process can effectively remove trace H2S.The base configuration has been adopted for cases DMEa and DMEb, where the very high
recycle rate in the FSI (97%) necessarily requires a thorough removal of the CO2 to prevent itsbuild-up in the recycle loop of the unconverted syngas. When the FSI is without unconvertedsyngas recycle, (as DMEc, FTa, FTb and FTc) the complete removal of CO2 is unnecessary andthe Rectisol plant can be significantly simplified to use only a single absorption column5. In thiscase the concentration of CO2 in the clean syngas is about 5%, depending on the inlet raw syngascomposition (Tab. 9).
5 Two columns are required for complete removal of CO2.
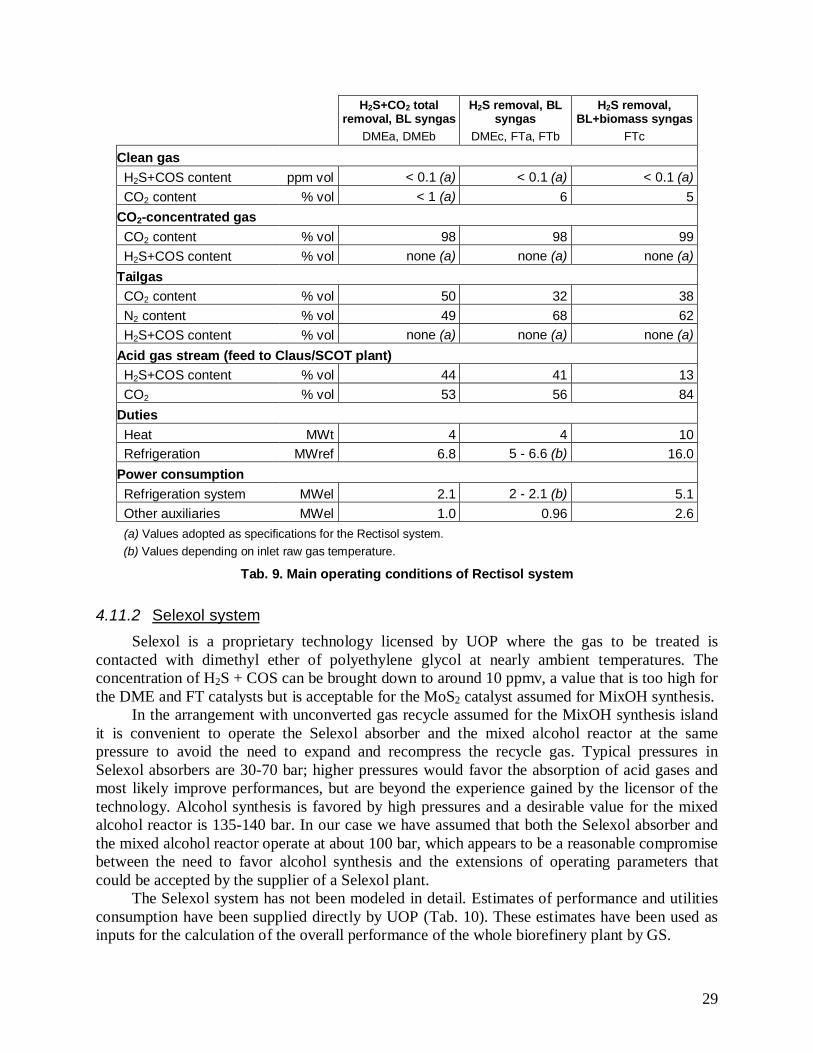
29
H2S+CO2 totalremoval, BL syngas
H2S removal, BLsyngas
H2S removal,BL+biomass syngas
DMEa, DMEb DMEc, FTa, FTb FTc
Clean gasH2S+COS content ppm vol < 0.1 (a) < 0.1 (a) < 0.1 (a)CO2 content % vol < 1 (a) 6 5
CO2-concentrated gasCO2 content % vol 98 98 99H2S+COS content % vol none (a) none (a) none (a)
TailgasCO2 content % vol 50 32 38N2 content % vol 49 68 62H2S+COS content % vol none (a) none (a) none (a)
Acid gas stream (feed to Claus/SCOT plant)H2S+COS content % vol 44 41 13CO2 % vol 53 56 84
DutiesHeat MWt 4 4 10Refrigeration MWref 6.8 5 - 6.6 (b) 16.0
Power consumptionRefrigeration system MWel 2.1 2 - 2.1 (b) 5.1Other auxiliaries MWel 1.0 0.96 2.6(a) Values adopted as specifications for the Rectisol system.(b) Values depending on inlet raw gas temperature.
Tab. 9. Main operating conditions of Rectisol system
4.11.2 Selexol system Selexol is a proprietary technology licensed by UOP where the gas to be treated is
contacted with dimethyl ether of polyethylene glycol at nearly ambient temperatures. Theconcentration of H2S + COS can be brought down to around 10 ppmv, a value that is too high forthe DME and FT catalysts but is acceptable for the MoS2 catalyst assumed for MixOH synthesis.
In the arrangement with unconverted gas recycle assumed for the MixOH synthesis islandit is convenient to operate the Selexol absorber and the mixed alcohol reactor at the samepressure to avoid the need to expand and recompress the recycle gas. Typical pressures inSelexol absorbers are 30-70 bar; higher pressures would favor the absorption of acid gases andmost likely improve performances, but are beyond the experience gained by the licensor of thetechnology. Alcohol synthesis is favored by high pressures and a desirable value for the mixedalcohol reactor is 135-140 bar. In our case we have assumed that both the Selexol absorber andthe mixed alcohol reactor operate at about 100 bar, which appears to be a reasonable compromisebetween the need to favor alcohol synthesis and the extensions of operating parameters thatcould be accepted by the supplier of a Selexol plant.
The Selexol system has not been modeled in detail. Estimates of performance and utilitiesconsumption have been supplied directly by UOP (Tab. 10). These estimates have been used asinputs for the calculation of the overall performance of the whole biorefinery plant by GS.
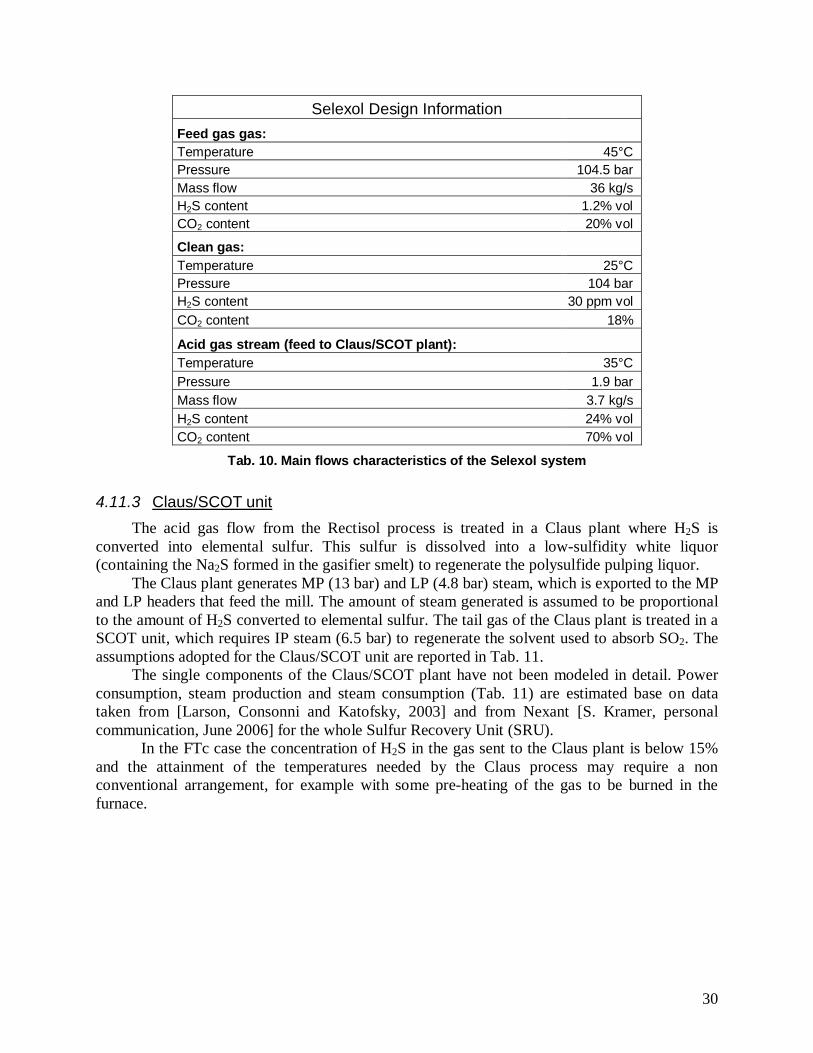
30
Selexol Design InformationFeed gas gas:Temperature 45°CPressure 104.5 barMass flow 36 kg/sH2S content 1.2% volCO2 content 20% vol
Clean gas:Temperature 25°CPressure 104 barH2S content 30 ppm vol
CO2 content 18%
Acid gas stream (feed to Claus/SCOT plant):Temperature 35°CPressure 1.9 barMass flow 3.7 kg/sH2S content 24% volCO2 content 70% vol
Tab. 10. Main flows characteristics of the Selexol system
4.11.3 Claus/SCOT unit The acid gas flow from the Rectisol process is treated in a Claus plant where H2S is
converted into elemental sulfur. This sulfur is dissolved into a low-sulfidity white liquor(containing the Na2S formed in the gasifier smelt) to regenerate the polysulfide pulping liquor.
The Claus plant generates MP (13 bar) and LP (4.8 bar) steam, which is exported to the MPand LP headers that feed the mill. The amount of steam generated is assumed to be proportionalto the amount of H2S converted to elemental sulfur. The tail gas of the Claus plant is treated in aSCOT unit, which requires IP steam (6.5 bar) to regenerate the solvent used to absorb SO2. Theassumptions adopted for the Claus/SCOT unit are reported in Tab. 11.
The single components of the Claus/SCOT plant have not been modeled in detail. Powerconsumption, steam production and steam consumption (Tab. 11) are estimated base on datataken from [Larson, Consonni and Katofsky, 2003] and from Nexant [S. Kramer, personalcommunication, June 2006] for the whole Sulfur Recovery Unit (SRU).
In the FTc case the concentration of H2S in the gas sent to the Claus plant is below 15%and the attainment of the temperatures needed by the Claus process may require a nonconventional arrangement, for example with some pre-heating of the gas to be burned in thefurnace.
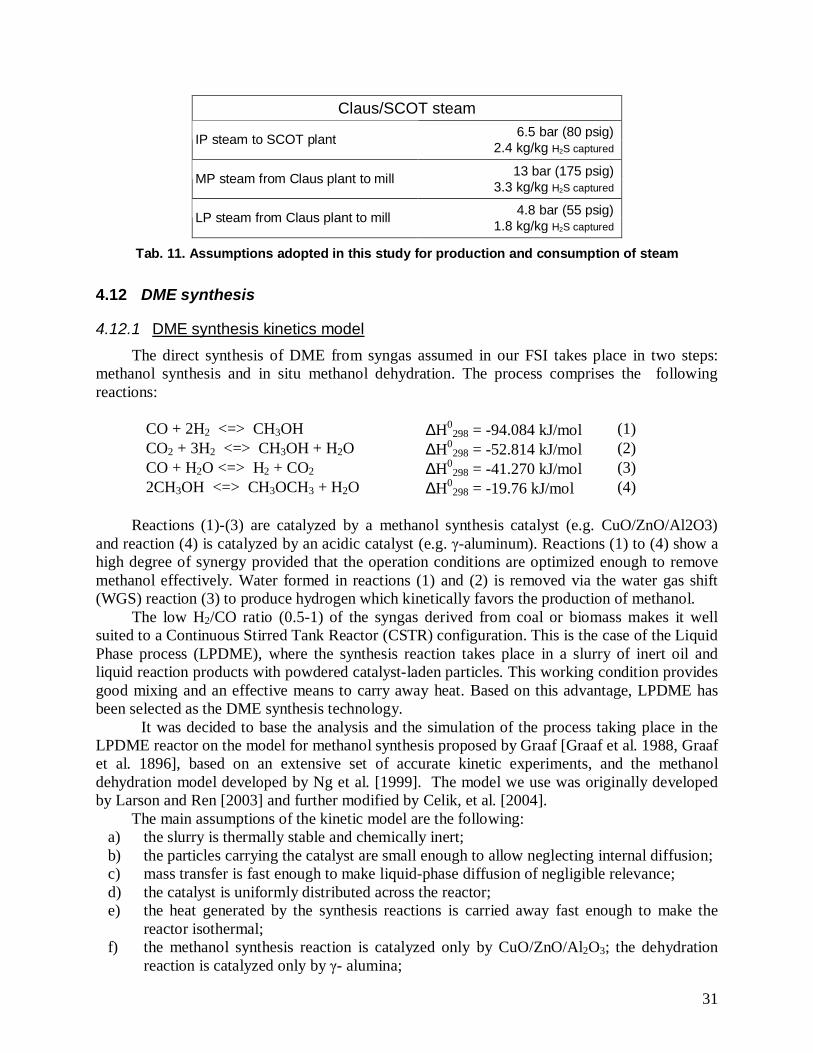
31
Claus/SCOT steam6.5 bar (80 psig)IP steam to SCOT plant 2.4 kg/kg H2S captured
13 bar (175 psig)MP steam from Claus plant to mill 3.3 kg/kg H2S captured
4.8 bar (55 psig)LP steam from Claus plant to mill 1.8 kg/kg H2S captured
Tab. 11. Assumptions adopted in this study for production and consumption of steam
4.12 DME synthesis
4.12.1 DME synthesis kinetics model The direct synthesis of DME from syngas assumed in our FSI takes place in two steps:
methanol synthesis and in situ methanol dehydration. The process comprises the followingreactions:
CO + 2H2 <=> CH3OH ∆H0298 = -94.084 kJ/mol (1)
CO2 + 3H2 <=> CH3OH + H2O ∆H0298 = -52.814 kJ/mol (2)
CO + H2O <=> H2 + CO2 ∆H0298 = -41.270 kJ/mol (3)
2CH3OH <=> CH3OCH3 + H2O ∆H0298 = -19.76 kJ/mol (4)
Reactions (1)-(3) are catalyzed by a methanol synthesis catalyst (e.g. CuO/ZnO/Al2O3)and reaction (4) is catalyzed by an acidic catalyst (e.g. -aluminum). Reactions (1) to (4) show ahigh degree of synergy provided that the operation conditions are optimized enough to removemethanol effectively. Water formed in reactions (1) and (2) is removed via the water gas shift(WGS) reaction (3) to produce hydrogen which kinetically favors the production of methanol.
The low H2/CO ratio (0.5-1) of the syngas derived from coal or biomass makes it wellsuited to a Continuous Stirred Tank Reactor (CSTR) configuration. This is the case of the LiquidPhase process (LPDME), where the synthesis reaction takes place in a slurry of inert oil andliquid reaction products with powdered catalyst-laden particles. This working condition providesgood mixing and an effective means to carry away heat. Based on this advantage, LPDME hasbeen selected as the DME synthesis technology.
It was decided to base the analysis and the simulation of the process taking place in theLPDME reactor on the model for methanol synthesis proposed by Graaf [Graaf et al. 1988, Graafet al. 1896], based on an extensive set of accurate kinetic experiments, and the methanoldehydration model developed by Ng et al. [1999]. The model we use was originally developedby Larson and Ren [2003] and further modified by Celik, et al. [2004].
The main assumptions of the kinetic model are the following:a) the slurry is thermally stable and chemically inert;b) the particles carrying the catalyst are small enough to allow neglecting internal diffusion;c) mass transfer is fast enough to make liquid-phase diffusion of negligible relevance;d) the catalyst is uniformly distributed across the reactor;e) the heat generated by the synthesis reactions is carried away fast enough to make the
reactor isothermal;f) the methanol synthesis reaction is catalyzed only by CuO/ZnO/Al2O3; the dehydration
reaction is catalyzed only by - alumina;
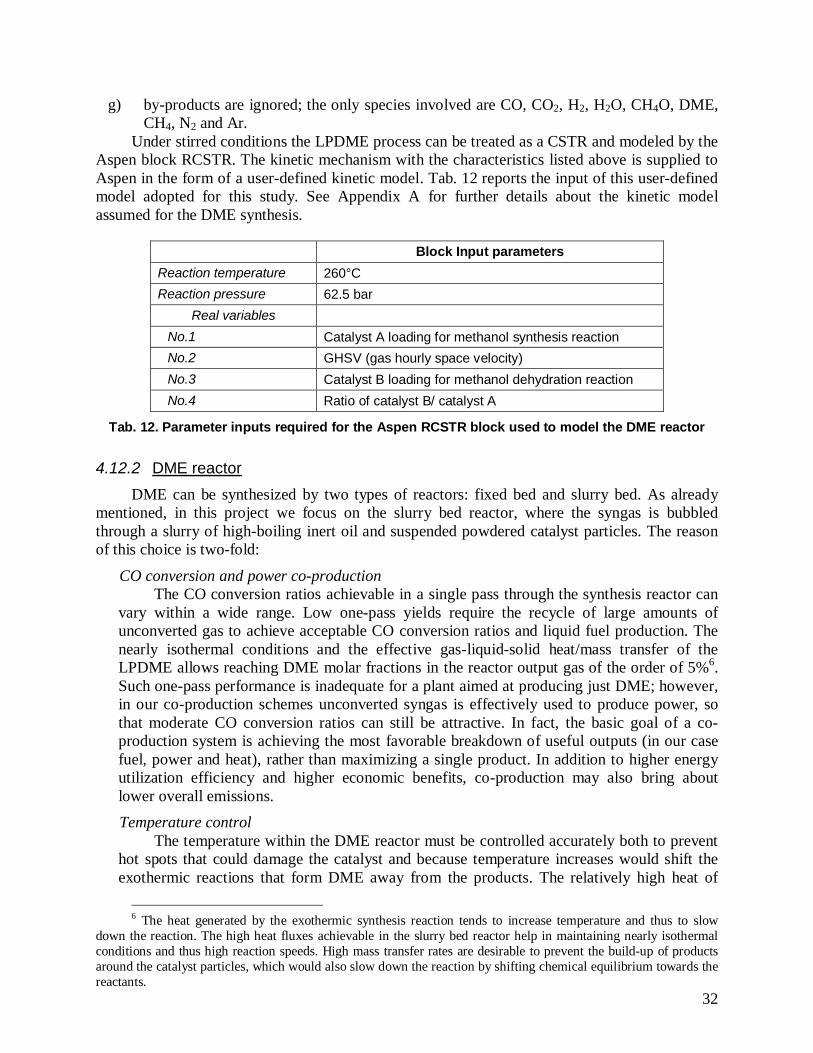
32
g) by-products are ignored; the only species involved are CO, CO2, H2, H2O, CH4O, DME,CH4, N2 and Ar.
Under stirred conditions the LPDME process can be treated as a CSTR and modeled by theAspen block RCSTR. The kinetic mechanism with the characteristics listed above is supplied toAspen in the form of a user-defined kinetic model. Tab. 12 reports the input of this user-definedmodel adopted for this study. See Appendix A for further details about the kinetic modelassumed for the DME synthesis.
Block Input parametersReaction temperature 260°CReaction pressure 62.5 bar
Real variablesNo.1 Catalyst A loading for methanol synthesis reactionNo.2 GHSV (gas hourly space velocity)No.3 Catalyst B loading for methanol dehydration reactionNo.4 Ratio of catalyst B/ catalyst A
Tab. 12. Parameter inputs required for the Aspen RCSTR block used to model the DME reactor
4.12.2 DME reactorDME can be synthesized by two types of reactors: fixed bed and slurry bed. As already
mentioned, in this project we focus on the slurry bed reactor, where the syngas is bubbledthrough a slurry of high-boiling inert oil and suspended powdered catalyst particles. The reasonof this choice is two-fold:
CO conversion and power co-productionThe CO conversion ratios achievable in a single pass through the synthesis reactor can
vary within a wide range. Low one-pass yields require the recycle of large amounts ofunconverted gas to achieve acceptable CO conversion ratios and liquid fuel production. Thenearly isothermal conditions and the effective gas-liquid-solid heat/mass transfer of theLPDME allows reaching DME molar fractions in the reactor output gas of the order of 5%6.Such one-pass performance is inadequate for a plant aimed at producing just DME; however,in our co-production schemes unconverted syngas is effectively used to produce power, sothat moderate CO conversion ratios can still be attractive. In fact, the basic goal of a co-production system is achieving the most favorable breakdown of useful outputs (in our casefuel, power and heat), rather than maximizing a single product. In addition to higher energyutilization efficiency and higher economic benefits, co-production may also bring aboutlower overall emissions.Temperature control
The temperature within the DME reactor must be controlled accurately both to preventhot spots that could damage the catalyst and because temperature increases would shift theexothermic reactions that form DME away from the products. The relatively high heat of
6 The heat generated by the exothermic synthesis reaction tends to increase temperature and thus to slowdown the reaction. The high heat fluxes achievable in the slurry bed reactor help in maintaining nearly isothermalconditions and thus high reaction speeds. High mass transfer rates are desirable to prevent the build-up of productsaround the catalyst particles, which would also slow down the reaction by shifting chemical equilibrium towards thereactants.
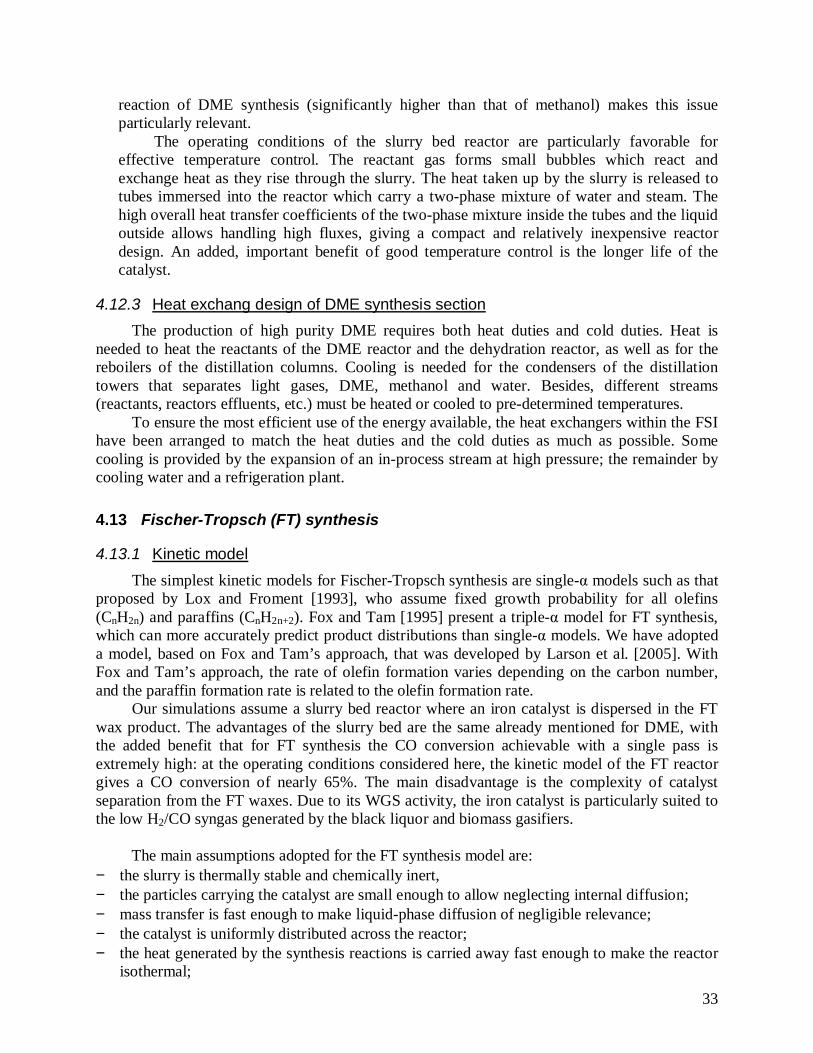
33
reaction of DME synthesis (significantly higher than that of methanol) makes this issueparticularly relevant.
The operating conditions of the slurry bed reactor are particularly favorable foreffective temperature control. The reactant gas forms small bubbles which react andexchange heat as they rise through the slurry. The heat taken up by the slurry is released totubes immersed into the reactor which carry a two-phase mixture of water and steam. Thehigh overall heat transfer coefficients of the two-phase mixture inside the tubes and the liquidoutside allows handling high fluxes, giving a compact and relatively inexpensive reactordesign. An added, important benefit of good temperature control is the longer life of thecatalyst.
4.12.3 Heat exchang design of DME synthesis section The production of high purity DME requires both heat duties and cold duties. Heat is
needed to heat the reactants of the DME reactor and the dehydration reactor, as well as for thereboilers of the distillation columns. Cooling is needed for the condensers of the distillationtowers that separates light gases, DME, methanol and water. Besides, different streams(reactants, reactors effluents, etc.) must be heated or cooled to pre-determined temperatures.
To ensure the most efficient use of the energy available, the heat exchangers within the FSIhave been arranged to match the heat duties and the cold duties as much as possible. Somecooling is provided by the expansion of an in-process stream at high pressure; the remainder bycooling water and a refrigeration plant.
4.13 Fischer-Tropsch (FT) synthesis
4.13.1 Kinetic model The simplest kinetic models for Fischer-Tropsch synthesis are single- models such as that
proposed by Lox and Froment [1993], who assume fixed growth probability for all olefins(CnH2n) and paraffins (CnH2n+2). Fox and Tam [1995] present a triple- model for FT synthesis,which can more accurately predict product distributions than single- models. We have adopteda model, based on Fox and Tam’s approach, that was developed by Larson et al. [2005]. WithFox and Tam’s approach, the rate of olefin formation varies depending on the carbon number,and the paraffin formation rate is related to the olefin formation rate.
Our simulations assume a slurry bed reactor where an iron catalyst is dispersed in the FTwax product. The advantages of the slurry bed are the same already mentioned for DME, withthe added benefit that for FT synthesis the CO conversion achievable with a single pass isextremely high: at the operating conditions considered here, the kinetic model of the FT reactorgives a CO conversion of nearly 65%. The main disadvantage is the complexity of catalystseparation from the FT waxes. Due to its WGS activity, the iron catalyst is particularly suited tothe low H2/CO syngas generated by the black liquor and biomass gasifiers.
The main assumptions adopted for the FT synthesis model are:− the slurry is thermally stable and chemically inert,− the particles carrying the catalyst are small enough to allow neglecting internal diffusion;− mass transfer is fast enough to make liquid-phase diffusion of negligible relevance;− the catalyst is uniformly distributed across the reactor;− the heat generated by the synthesis reactions is carried away fast enough to make the reactor
isothermal;
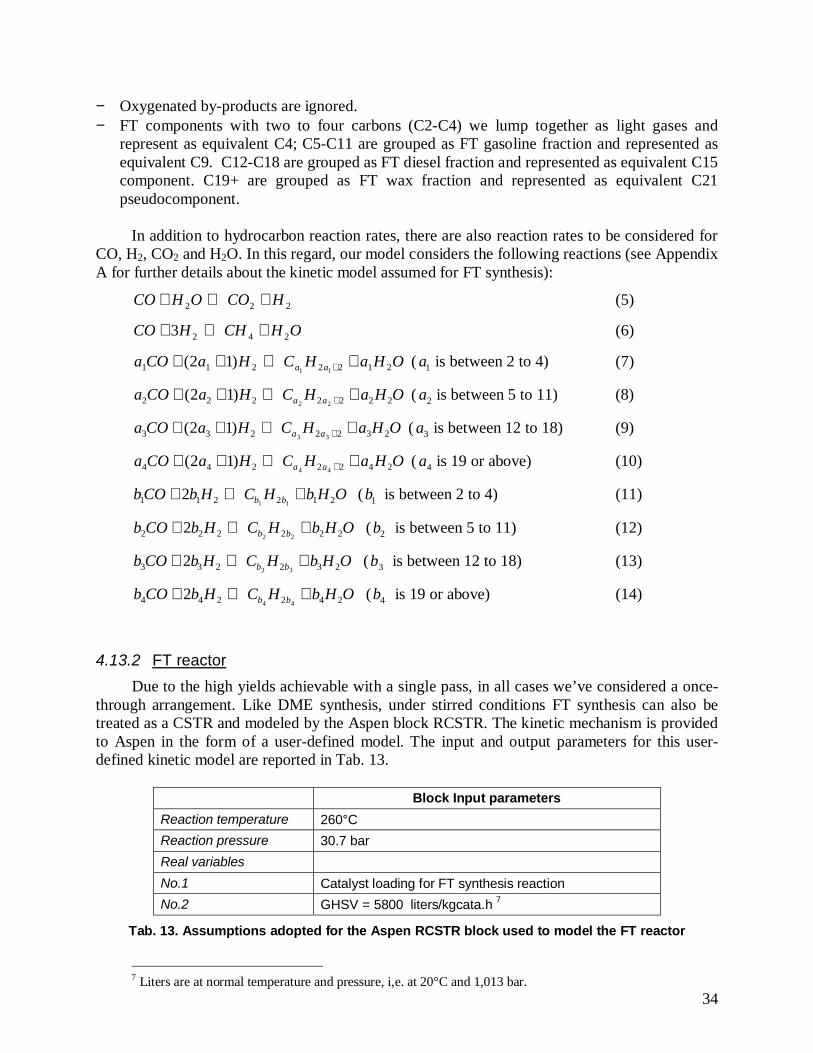
34
− Oxygenated by-products are ignored.− FT components with two to four carbons (C2-C4) we lump together as light gases and
represent as equivalent C4; C5-C11 are grouped as FT gasoline fraction and represented asequivalent C9. C12-C18 are grouped as FT diesel fraction and represented as equivalent C15component. C19+ are grouped as FT wax fraction and represented as equivalent C21pseudocomponent.
In addition to hydrocarbon reaction rates, there are also reaction rates to be considered forCO, H2, CO2 and H2O. In this regard, our model considers the following reactions (see AppendixA for further details about the kinetic model assumed for FT synthesis):
222 HCOOHCO +⇔+ (5)
OHCHHCO 2423 +⇔+ (6)
OHaHCHaCOa aa 2122211 11)12( +⇔++ + ( 1a is between 2 to 4) (7)
OHaHCHaCOa aa 2222222 22)12( +⇔++ + ( 2a is between 5 to 11) (8)
OHaHCHaCOa aa 2322233 33)12( +⇔++ + ( 3a is between 12 to 18) (9)
OHaHCHaCOa aa 2422244 44)12( +⇔++ + ( 4a is 19 or above) (10)
OHbHCHbCOb bb 212211 112 +⇔+ ( 1b is between 2 to 4) (11)
OHbHCHbCOb bb 222222 222 +⇔+ ( 2b is between 5 to 11) (12)
OHbHCHbCOb bb 232233 332 +⇔+ ( 3b is between 12 to 18) (13)
OHbHCHbCOb bb 242244 442 +⇔+ ( 4b is 19 or above) (14)
4.13.2 FT reactor Due to the high yields achievable with a single pass, in all cases we’ve considered a once-
through arrangement. Like DME synthesis, under stirred conditions FT synthesis can also betreated as a CSTR and modeled by the Aspen block RCSTR. The kinetic mechanism is providedto Aspen in the form of a user-defined model. The input and output parameters for this user-defined kinetic model are reported in Tab. 13.
Block Input parametersReaction temperature 260°CReaction pressure 30.7 barReal variablesNo.1 Catalyst loading for FT synthesis reactionNo.2 GHSV = 5800 liters/kgcata.h 7
Tab. 13. Assumptions adopted for the Aspen RCSTR block used to model the FT reactor
7 Liters are at normal temperature and pressure, i,e. at 20°C and 1,013 bar.
35
4.13.3 FT liquid product The raw liquid product of the FT synthesis reactor is a mixture of distillate, naphtha and
wax which needs further processing to upgrade it to gasoline and diesel fuel. Because of thecomplexity of this process and the small scale of our biorefinery (compared to refineries fed withfossil fuels), we’ve assumed that the raw liquid is exported to an existing petroleum refinerywithout further processing. The raw FT product must be kept warm in order to maintain thewaxes as liquid, thus requiring trucks with heated tanks.
4.14 Mixed alcohols synthesis
4.14.1 Mixed alcohols synthesis kinetic model Alcohols and other oxygenated liquids are viewed as desirable gasoline additives both to
improve the octane number and to reduce engine emissions. Catalysts used for the production ofhigher alcohols from synthesis gas can be divided into four categories [Liu et al., 1997]:
− the first one is based on a soluble Ru complex used as an homogeneous catalyst;− the second can be described as modified methanol catalysts, e.g. alkali-doped ZnO/chromia
or Cu-based catalysts;− the third comprises mixed-metal Fischer-Tropsch catalysts, e.g. Co and Fe on a support;− the last comprises alkali-promoted MoS2 catalysts.
Mo-based systems are promising due to their high tolerance to sulfur compounds in thefeed gas, high WGS reaction activity, high activity and selectivity for linear alcohols. The lastcharacteristic is very important, because the formation of hydrocarbons ( -olefins and n-paraffins) from CO and H2 is thermodynamically favored with respect to the formation of higheralcohols, i.e. Keq (the equilibrium constant) of hydrocarbons are higher than Keq of alcohols;consequently, the synthesis of higher alcohols requires selective catalysts capable of finding away around the tendency favoured by thermodynamics to drive the process toward alcohols.
Given the lack of any published models in the literature, for this study a new kinetic modelhas been developed to estimate CO conversion and alcohols formation over a Mo-based catalyst.The model has been developed at the Dept. of Chemistry of Politecnico di Milano by the groupled by prof. P. Forzatti, who for many years has been at the forefront of research onheterogeneous catalytic processes (see Appendix B for a full description of the model developedby prof. Lietti and Tronconi). The kinetic model is based on the experimental data published byGunturu et al. [1998] on the synthesis of methanol and higher alcohols from syngas by means ofa C-supported, K-promoted Co-Mo sulfide catalyst (Mo-Co-K/C). The work of Gunturu et al.provides data on the whole set of reactions for higher alcohols synthesis, as well as rateexpressions and estimates of kinetic parameters.
The kinetic model based on Gunturu’s data has been implemented into a Fortran code,which has been subsequently embedded into the Aspen model of the plant section devoted tomixed alcohol synthesis. Similarly to the model for DME synthesis and FT synthesis, the modelof mixed alcohol synthesis is executed by Aspen when calculating the mass and energy balanceof the Fuel Synthesis Island.
The simplified reaction scheme adopted for the synthesis of higher alcohols is thefollowing:
CO + 2H2 ↔ CH 3 OH (15)
CH3OH + H2 → CH4 + H2O (16)
36
CH3OH + CO + 2H2 → C2H5OH + H2O (17)
C2H5OH + CO + 2H2 → C3H7OH + H2O (18)
CO + H2O ↔ CO2 + H2 (19)In this lumped reaction scheme, the production of methanol from CO and H2 (reaction 15)
is considered reversible and limited by chemical equilibrium. Further, it is assumed that allhydrocarbon products are produced from methanol and comprise only methane (reaction 16).The formation of ethanol (reaction 17) and the formation of propanol (reaction 18) proceed byreaction of CO and H2 with methanol and with ethanol, respectively, according to a consecutivescheme. CO2 formation is accounted for by the WGS reaction (reaction 19) which is assumed tobe always at equilibrium.
Alcohols with carbon number higher than three (C4+ alcohols) are formed in quantities sosmall that they are irrelevant to the mass/energy balances and thus are neglected; in fact, C4+
carbon selectivity is less than 4% [Aden et al. 2005]. As for ethers (dimethyl ether, diethyl ether)and other oxygenates not explicitly identified as alcohols, they have been lumped into thehydrocarbon fraction, i.e. methane.
Since the experimental data reported by Gunturu refer to an inlet flow with no CO2, in thekinetic model developed here CO2 is assumed to behave as an inert and its influence on thereaction rates is due solely to the decrease of the partial pressure of the reactants. As long as theCO2 concentration in the syngas is only a few percentage points, this assumption is most likelyrealistic. On the other hand, large concentrations of CO2 could influence the kineticcharacteristics of the catalyst and reduce its activity and/or its selectivity to higher alcohols. Inthe MixOH case considered here the concentration of CO2 in the reactor inlet gas is about 30%, avalue for which an impact on the catalyst behavior cannot be excluded. Consequently, thealcohols production calculated by our model may be optimistic and requires verification withfurther experimental data on conditions with high CO2 concentration.
4.14.1.1 CO2 removal in the recycle loop The high CO2 content in the syngas fed to the mixed alcohol reactor is due to the recycle
loop, which returns to the reactor the by-product CO2 generated by the alcohol synthesis. TheCO2 concentration at the reactor inlet could be drastically reduced by removing nearly all theCO2 in the recycle flow by the same Selexol system that removes H2S. This arrangement wouldbe more expensive due not only to the larger mass flow through the Selexol (which would handlethe recycled syngas together with the fresh syngas) but also to the more complex and costlyarrangement of the Selexol plant required to remove both H2S and CO2. Moreover, the recycledstream includes a large amount of methane (a byproduct of the synthesis reactions) which wouldbe captured in significant amounts in the column designed to capture the CO2. Most of thismethane would be subsequently released together with CO2 in the flash chambers for Selexolregeneration and its effective recovery would be problematic. Since the penalties due to methanecapture appear much more severe than those possibly due to lower catalyst activity, we’veconsidered a scheme without thorough CO2 removal from the syngas.
4.14.2 Mixed alcohols reactor Similarly to the synthesis of DME and FT fuel, alcohol synthesis is also exothermic and the
heat of reaction must be effectively removed to prevent temperature increases that may sinter andthus deactivate the catalyst.
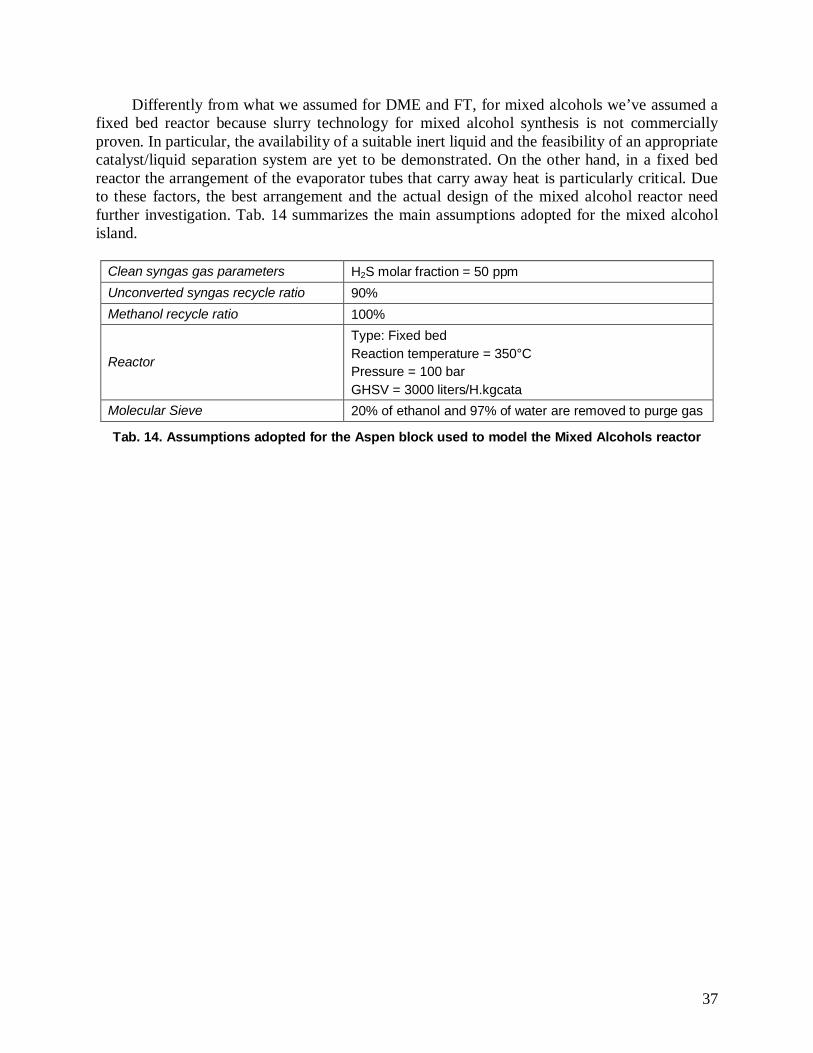
37
Differently from what we assumed for DME and FT, for mixed alcohols we’ve assumed afixed bed reactor because slurry technology for mixed alcohol synthesis is not commerciallyproven. In particular, the availability of a suitable inert liquid and the feasibility of an appropriatecatalyst/liquid separation system are yet to be demonstrated. On the other hand, in a fixed bedreactor the arrangement of the evaporator tubes that carry away heat is particularly critical. Dueto these factors, the best arrangement and the actual design of the mixed alcohol reactor needfurther investigation. Tab. 14 summarizes the main assumptions adopted for the mixed alcoholisland.
Clean syngas gas parameters H2S molar fraction = 50 ppmUnconverted syngas recycle ratio 90%Methanol recycle ratio 100%
Reactor
Type: Fixed bedReaction temperature = 350°CPressure = 100 barGHSV = 3000 liters/H.kgcata
Molecular Sieve 20% of ethanol and 97% of water are removed to purge gas
Tab. 14. Assumptions adopted for the Aspen block used to model the Mixed Alcohols reactor
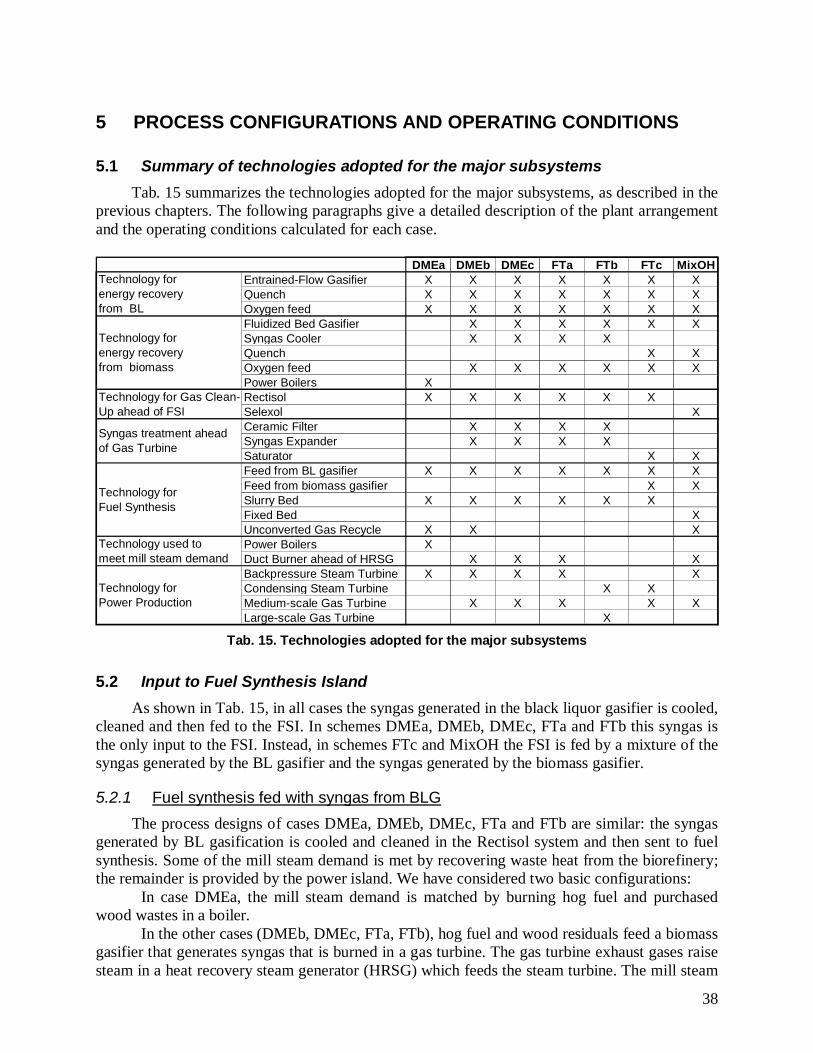
38
5 PROCESS CONFIGURATIONS AND OPERATING CONDITIONS
5.1 Summary of technologies adopted for the major subsystemsTab. 15 summarizes the technologies adopted for the major subsystems, as described in the
previous chapters. The following paragraphs give a detailed description of the plant arrangementand the operating conditions calculated for each case.
DMEa DMEb DMEc FTa FTb FTc MixOHEntrained-Flow Gasifier X X X X X X XQuench X X X X X X XOxygen feed X X X X X X XFluidized Bed Gasifier X X X X X XSyngas Cooler X X X XQuench X XOxygen feed X X X X X XPower Boilers XRectisol X X X X X XSelexol XCeramic Filter X X X XSyngas Expander X X X XSaturator X XFeed from BL gasifier X X X X X X XFeed from biomass gasifier X XSlurry Bed X X X X X XFixed Bed XUnconverted Gas Recycle X X XPower Boilers XDuct Burner ahead of HRSG X X X XBackpressure Steam Turbine X X X X XCondensing Steam Turbine X XMedium-scale Gas Turbine X X X X XLarge-scale Gas Turbine X
Technology forPower Production
Syngas treatment aheadof Gas Turbine
Technology used tomeet mill steam demand
Technology forFuel Synthesis
Technology forenergy recoveryfrom BL
Technology forenergy recoveryfrom biomass
Technology for Gas Clean-Up ahead of FSI
Tab. 15. Technologies adopted for the major subsystems
5.2 Input to Fuel Synthesis Island As shown in Tab. 15, in all cases the syngas generated in the black liquor gasifier is cooled,
cleaned and then fed to the FSI. In schemes DMEa, DMEb, DMEc, FTa and FTb this syngas isthe only input to the FSI. Instead, in schemes FTc and MixOH the FSI is fed by a mixture of thesyngas generated by the BL gasifier and the syngas generated by the biomass gasifier.
5.2.1 Fuel synthesis fed with syngas from BLG The process designs of cases DMEa, DMEb, DMEc, FTa and FTb are similar: the syngas
generated by BL gasification is cooled and cleaned in the Rectisol system and then sent to fuelsynthesis. Some of the mill steam demand is met by recovering waste heat from the biorefinery;the remainder is provided by the power island. We have considered two basic configurations:
In case DMEa, the mill steam demand is matched by burning hog fuel and purchasedwood wastes in a boiler.
In the other cases (DMEb, DMEc, FTa, FTb), hog fuel and wood residuals feed a biomassgasifier that generates syngas that is burned in a gas turbine. The gas turbine exhaust gases raisesteam in a heat recovery steam generator (HRSG) which feeds the steam turbine. The mill steam
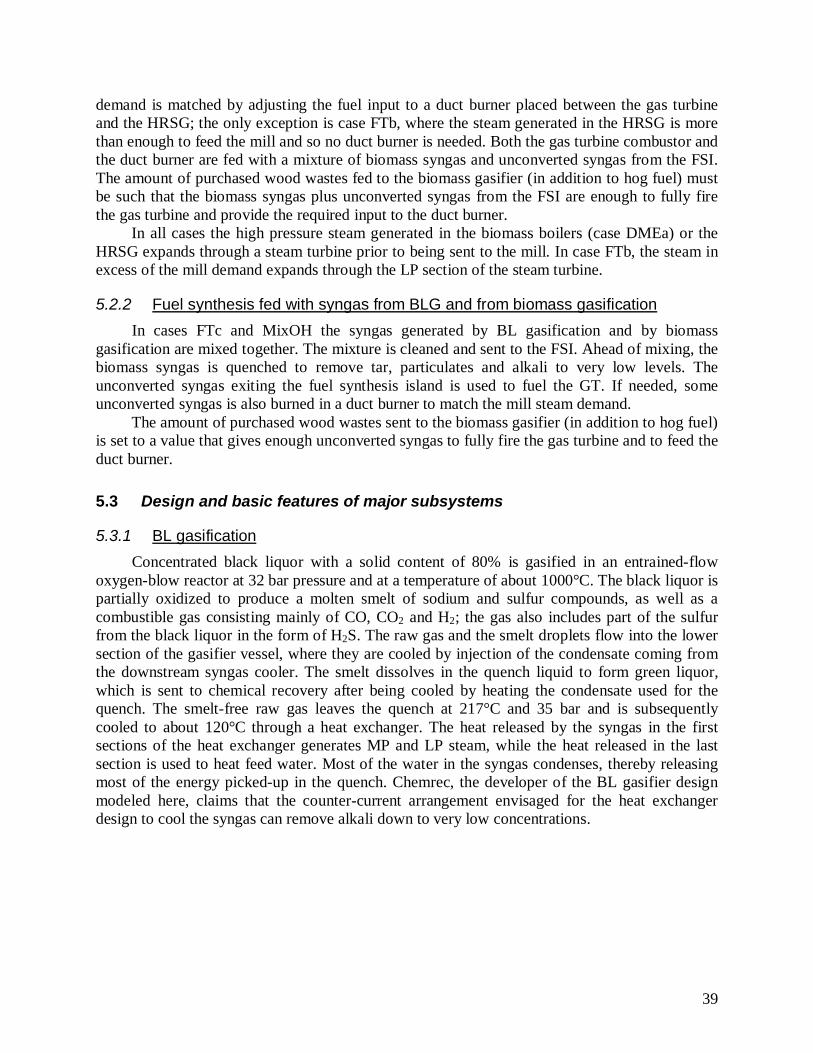
39
demand is matched by adjusting the fuel input to a duct burner placed between the gas turbineand the HRSG; the only exception is case FTb, where the steam generated in the HRSG is morethan enough to feed the mill and so no duct burner is needed. Both the gas turbine combustor andthe duct burner are fed with a mixture of biomass syngas and unconverted syngas from the FSI.The amount of purchased wood wastes fed to the biomass gasifier (in addition to hog fuel) mustbe such that the biomass syngas plus unconverted syngas from the FSI are enough to fully firethe gas turbine and provide the required input to the duct burner.
In all cases the high pressure steam generated in the biomass boilers (case DMEa) or theHRSG expands through a steam turbine prior to being sent to the mill. In case FTb, the steam inexcess of the mill demand expands through the LP section of the steam turbine.
5.2.2 Fuel synthesis fed with syngas from BLG and from biomass gasification In cases FTc and MixOH the syngas generated by BL gasification and by biomass
gasification are mixed together. The mixture is cleaned and sent to the FSI. Ahead of mixing, thebiomass syngas is quenched to remove tar, particulates and alkali to very low levels. Theunconverted syngas exiting the fuel synthesis island is used to fuel the GT. If needed, someunconverted syngas is also burned in a duct burner to match the mill steam demand.
The amount of purchased wood wastes sent to the biomass gasifier (in addition to hog fuel)is set to a value that gives enough unconverted syngas to fully fire the gas turbine and to feed theduct burner.
5.3 Design and basic features of major subsystems
5.3.1 BL gasification Concentrated black liquor with a solid content of 80% is gasified in an entrained-flow
oxygen-blow reactor at 32 bar pressure and at a temperature of about 1000°C. The black liquor ispartially oxidized to produce a molten smelt of sodium and sulfur compounds, as well as acombustible gas consisting mainly of CO, CO2 and H2; the gas also includes part of the sulfurfrom the black liquor in the form of H2S. The raw gas and the smelt droplets flow into the lowersection of the gasifier vessel, where they are cooled by injection of the condensate coming fromthe downstream syngas cooler. The smelt dissolves in the quench liquid to form green liquor,which is sent to chemical recovery after being cooled by heating the condensate used for thequench. The smelt-free raw gas leaves the quench at 217°C and 35 bar and is subsequentlycooled to about 120°C through a heat exchanger. The heat released by the syngas in the firstsections of the heat exchanger generates MP and LP steam, while the heat released in the lastsection is used to heat feed water. Most of the water in the syngas condenses, thereby releasingmost of the energy picked-up in the quench. Chemrec, the developer of the BL gasifier designmodeled here, claims that the counter-current arrangement envisaged for the heat exchangerdesign to cool the syngas can remove alkali down to very low concentrations.
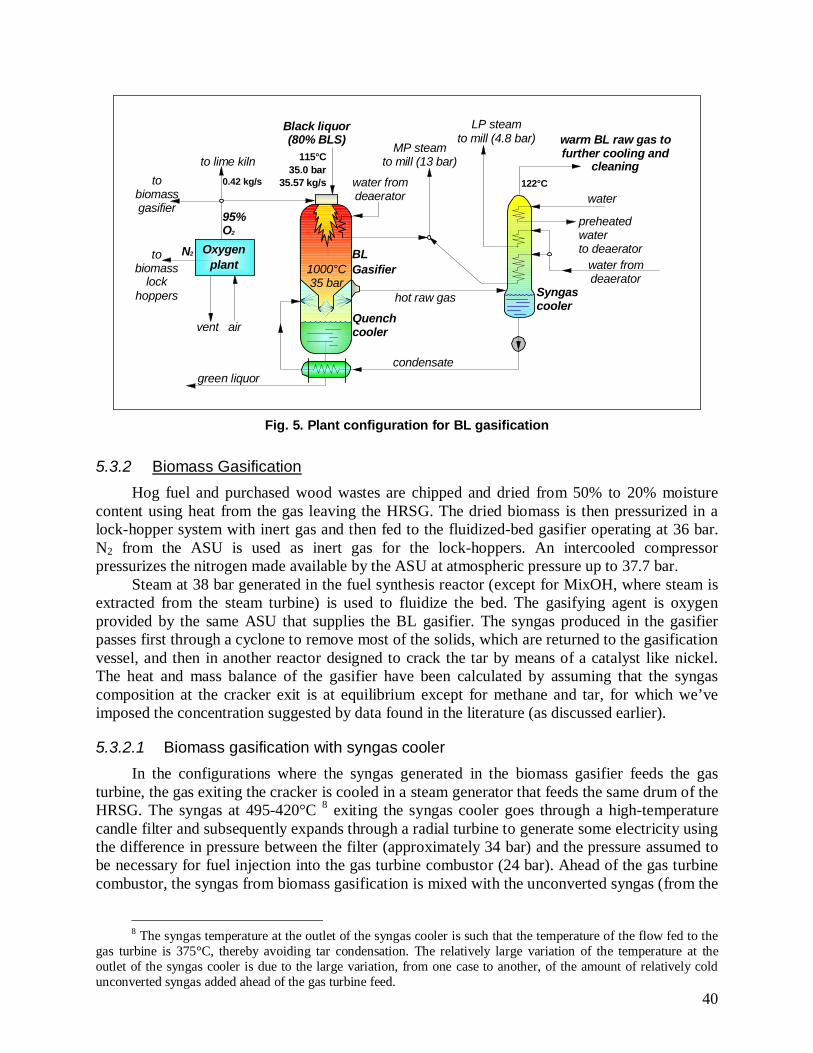
40
Quenchcooler
1000°C35 bar
BLGasifier
Black liquor(80% BLS)
115°C35.0 bar
35.57 kg/s
hot raw gas
condensate
water fromdeaerator
air
Oxygenplant
vent
to lime kiln
95%O2
water fromdeaerator
warm BL raw gas tofurther cooling and
cleaningMP steam
to mill (13 bar)
LP steamto mill (4.8 bar)
Syngascooler
water
preheatedwaterto deaerator
122°C
green liquor
0.42 kg/stobiomassgasifier
tobiomass
lockhoppers
N2
Fig. 5. Plant configuration for BL gasification
5.3.2 Biomass Gasification Hog fuel and purchased wood wastes are chipped and dried from 50% to 20% moisture
content using heat from the gas leaving the HRSG. The dried biomass is then pressurized in alock-hopper system with inert gas and then fed to the fluidized-bed gasifier operating at 36 bar.N2 from the ASU is used as inert gas for the lock-hoppers. An intercooled compressorpressurizes the nitrogen made available by the ASU at atmospheric pressure up to 37.7 bar.
Steam at 38 bar generated in the fuel synthesis reactor (except for MixOH, where steam isextracted from the steam turbine) is used to fluidize the bed. The gasifying agent is oxygenprovided by the same ASU that supplies the BL gasifier. The syngas produced in the gasifierpasses first through a cyclone to remove most of the solids, which are returned to the gasificationvessel, and then in another reactor designed to crack the tar by means of a catalyst like nickel.The heat and mass balance of the gasifier have been calculated by assuming that the syngascomposition at the cracker exit is at equilibrium except for methane and tar, for which we’veimposed the concentration suggested by data found in the literature (as discussed earlier).
5.3.2.1 Biomass gasification with syngas cooler In the configurations where the syngas generated in the biomass gasifier feeds the gas
turbine, the gas exiting the cracker is cooled in a steam generator that feeds the same drum of theHRSG. The syngas at 495-420°C 8 exiting the syngas cooler goes through a high-temperaturecandle filter and subsequently expands through a radial turbine to generate some electricity usingthe difference in pressure between the filter (approximately 34 bar) and the pressure assumed tobe necessary for fuel injection into the gas turbine combustor (24 bar). Ahead of the gas turbinecombustor, the syngas from biomass gasification is mixed with the unconverted syngas (from the
8 The syngas temperature at the outlet of the syngas cooler is such that the temperature of the flow fed to thegas turbine is 375°C, thereby avoiding tar condensation. The relatively large variation of the temperature at theoutlet of the syngas cooler is due to the large variation, from one case to another, of the amount of relatively coldunconverted syngas added ahead of the gas turbine feed.
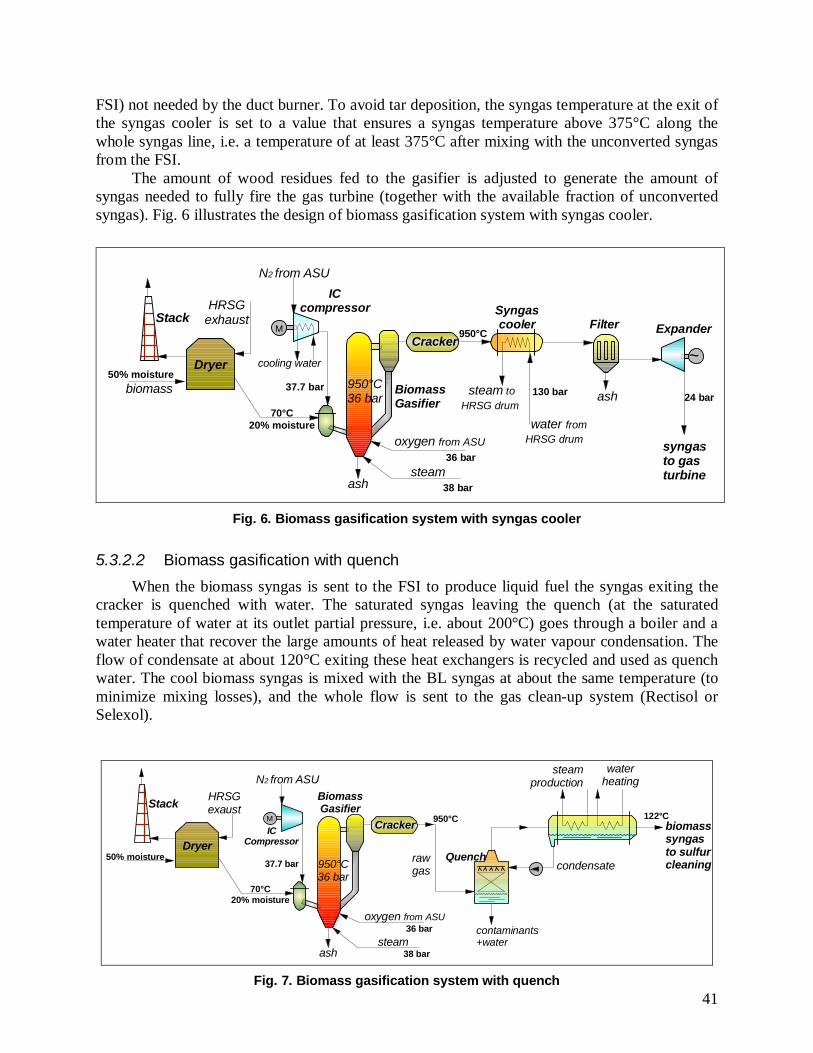
41
FSI) not needed by the duct burner. To avoid tar deposition, the syngas temperature at the exit ofthe syngas cooler is set to a value that ensures a syngas temperature above 375°C along thewhole syngas line, i.e. a temperature of at least 375°C after mixing with the unconverted syngasfrom the FSI.
The amount of wood residues fed to the gasifier is adjusted to generate the amount ofsyngas needed to fully fire the gas turbine (together with the available fraction of unconvertedsyngas). Fig. 6 illustrates the design of biomass gasification system with syngas cooler.
Syngascooler
Dryer
ash
N2 from ASU
BiomassGasifier
FilterStack
biomass
syngasto gasturbine
70°C20% moisture
HRSGexhaust
950°C
37.7 bar
oxygen from ASU
steam36 bar
38 bar
50% moisturesteam to
HRSG drum
water fromHRSG drum
130 bar
ash
CrackerM
cooling water
950°C36 bar
~
Expander
24 bar
ICcompressor
Fig. 6. Biomass gasification system with syngas cooler
5.3.2.2 Biomass gasification with quench When the biomass syngas is sent to the FSI to produce liquid fuel the syngas exiting the
cracker is quenched with water. The saturated syngas leaving the quench (at the saturatedtemperature of water at its outlet partial pressure, i.e. about 200°C) goes through a boiler and awater heater that recover the large amounts of heat released by water vapour condensation. Theflow of condensate at about 120°C exiting these heat exchangers is recycled and used as quenchwater. The cool biomass syngas is mixed with the BL syngas at about the same temperature (tominimize mixing losses), and the whole flow is sent to the gas clean-up system (Rectisol orSelexol).
contaminants+water
Dryer
BiomassGasifierStack
M
70°C20% moisture
HRSGexaust
950°C
steam38 barash
950°C36 bar
Cracker
N2 from ASU
oxygen from ASU36 bar
condensate
steamproduction
waterheating
biomasssyngasto sulfurcleaning
122°C
rawgas
50% moisture
ICCompressor
Quench37.7 bar
Fig. 7. Biomass gasification system with quench
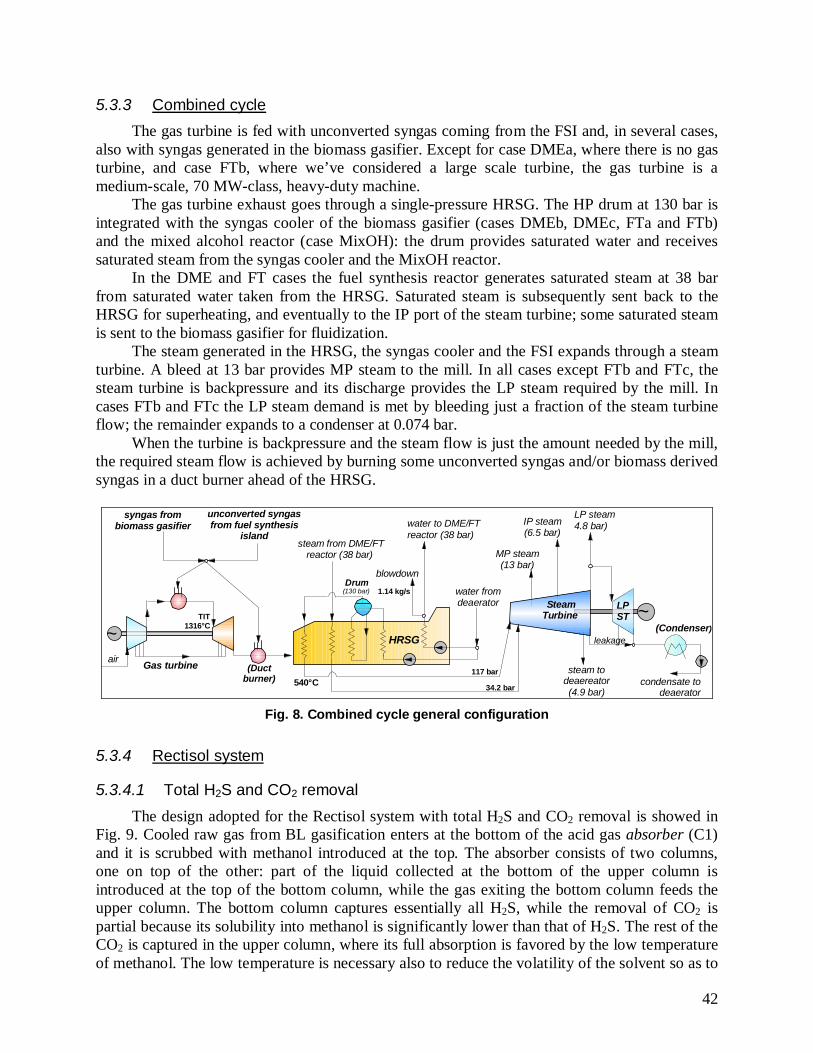
42
5.3.3 Combined cycle The gas turbine is fed with unconverted syngas coming from the FSI and, in several cases,
also with syngas generated in the biomass gasifier. Except for case DMEa, where there is no gasturbine, and case FTb, where we’ve considered a large scale turbine, the gas turbine is amedium-scale, 70 MW-class, heavy-duty machine.
The gas turbine exhaust goes through a single-pressure HRSG. The HP drum at 130 bar isintegrated with the syngas cooler of the biomass gasifier (cases DMEb, DMEc, FTa and FTb)and the mixed alcohol reactor (case MixOH): the drum provides saturated water and receivessaturated steam from the syngas cooler and the MixOH reactor.
In the DME and FT cases the fuel synthesis reactor generates saturated steam at 38 barfrom saturated water taken from the HRSG. Saturated steam is subsequently sent back to theHRSG for superheating, and eventually to the IP port of the steam turbine; some saturated steamis sent to the biomass gasifier for fluidization.
The steam generated in the HRSG, the syngas cooler and the FSI expands through a steamturbine. A bleed at 13 bar provides MP steam to the mill. In all cases except FTb and FTc, thesteam turbine is backpressure and its discharge provides the LP steam required by the mill. Incases FTb and FTc the LP steam demand is met by bleeding just a fraction of the steam turbineflow; the remainder expands to a condenser at 0.074 bar.
When the turbine is backpressure and the steam flow is just the amount needed by the mill,the required steam flow is achieved by burning some unconverted syngas and/or biomass derivedsyngas in a duct burner ahead of the HRSG.
~LPST
~Gas turbineair
Drum(130 bar)
(Ductburner)
blowdown
syngas frombiomass gasifier
unconverted syngasfrom fuel synthesis
island
TIT1316°C
water fromdeaerator Steam
Turbine
HRSG
540°C
water to DME/FTreactor (38 bar)
steam from DME/FTreactor (38 bar)
1.14 kg/s
117 bar
34.2 bar
MP steam(13 bar)
LP steam4.8 bar)IP steam
(6.5 bar)
steam todeaereator(4.9 bar)
(Condenser)leakage
condensate todeaerator
Fig. 8. Combined cycle general configuration
5.3.4 Rectisol system
5.3.4.1 Total H2S and CO2 removal The design adopted for the Rectisol system with total H2S and CO2 removal is showed in
Fig. 9. Cooled raw gas from BL gasification enters at the bottom of the acid gas absorber (C1)and it is scrubbed with methanol introduced at the top. The absorber consists of two columns,one on top of the other: part of the liquid collected at the bottom of the upper column isintroduced at the top of the bottom column, while the gas exiting the bottom column feeds theupper column. The bottom column captures essentially all H2S, while the removal of CO2 ispartial because its solubility into methanol is significantly lower than that of H2S. The rest of theCO2 is captured in the upper column, where its full absorption is favored by the low temperatureof methanol. The low temperature is necessary also to reduce the volatility of the solvent so as to
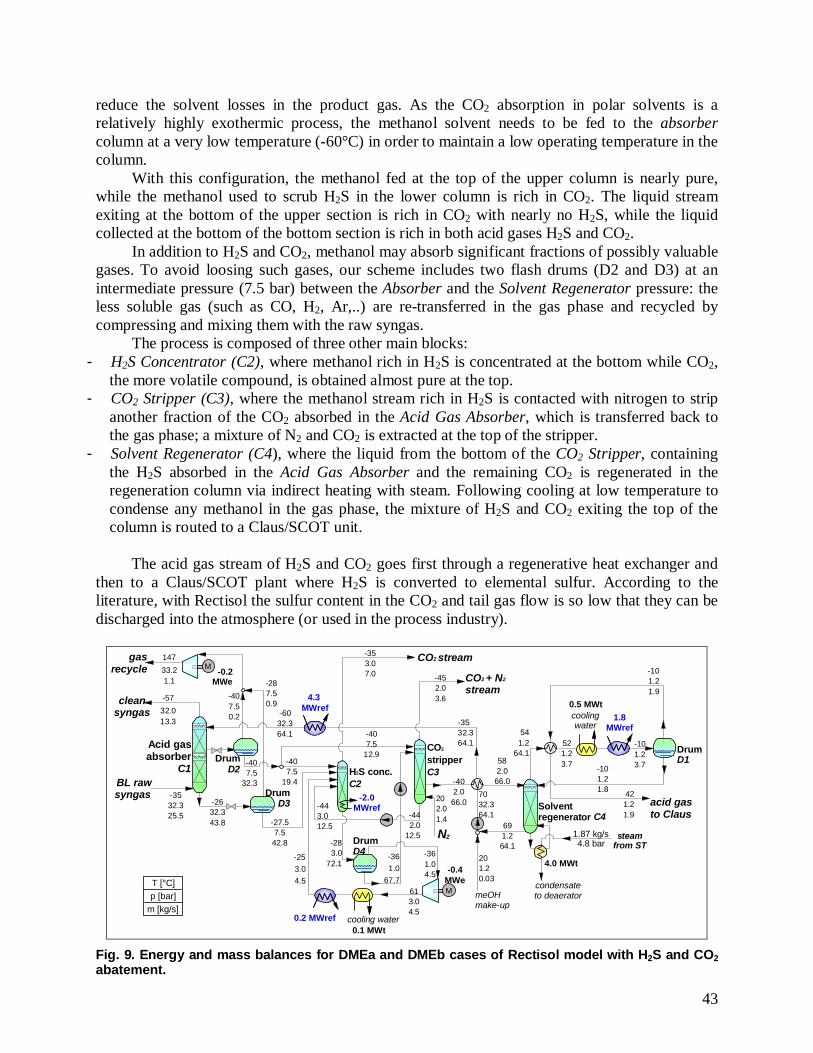
43
reduce the solvent losses in the product gas. As the CO2 absorption in polar solvents is arelatively highly exothermic process, the methanol solvent needs to be fed to the absorbercolumn at a very low temperature (-60°C) in order to maintain a low operating temperature in thecolumn.
With this configuration, the methanol fed at the top of the upper column is nearly pure,while the methanol used to scrub H2S in the lower column is rich in CO2. The liquid streamexiting at the bottom of the upper section is rich in CO2 with nearly no H2S, while the liquidcollected at the bottom of the bottom section is rich in both acid gases H2S and CO2.
In addition to H2S and CO2, methanol may absorb significant fractions of possibly valuablegases. To avoid loosing such gases, our scheme includes two flash drums (D2 and D3) at anintermediate pressure (7.5 bar) between the Absorber and the Solvent Regenerator pressure: theless soluble gas (such as CO, H2, Ar,..) are re-transferred in the gas phase and recycled bycompressing and mixing them with the raw syngas.
The process is composed of three other main blocks:- H2S Concentrator (C2), where methanol rich in H2S is concentrated at the bottom while CO2,
the more volatile compound, is obtained almost pure at the top.- CO2 Stripper (C3), where the methanol stream rich in H2S is contacted with nitrogen to strip
another fraction of the CO2 absorbed in the Acid Gas Absorber, which is transferred back tothe gas phase; a mixture of N2 and CO2 is extracted at the top of the stripper.
- Solvent Regenerator (C4), where the liquid from the bottom of the CO2 Stripper, containingthe H2S absorbed in the Acid Gas Absorber and the remaining CO2 is regenerated in theregeneration column via indirect heating with steam. Following cooling at low temperature tocondense any methanol in the gas phase, the mixture of H2S and CO2 exiting the top of thecolumn is routed to a Claus/SCOT unit.
The acid gas stream of H2S and CO2 goes first through a regenerative heat exchanger andthen to a Claus/SCOT plant where H2S is converted to elemental sulfur. According to theliterature, with Rectisol the sulfur content in the CO2 and tail gas flow is so low that they can bedischarged into the atmosphere (or used in the process industry).
14733.21.1
-3532.325.5
-0.4MWe
-3532.364.1
-2.0MWref
-27.57.542.8
582.066.0
613.04.5
-452.03.6
-283.0
72.1
-6032.364.1
-353.07.0
T [°C]
m [kg/s]p [bar]
-2632.343.8
4.3MWref
M
N2
CO2 stream
4.0 MWt
condensateto deaerator
steamfrom ST
1.87 kg/s4.8 bar
meOHmake-up
691.264.1
acid gasto Claus
-0.2MWe
M
BL rawsyngas
gasrecycle
cleansyngas
-5732.013.3
202.01.4
CO2 + N2
stream
-101.21.9
421.21.9
-253.04.5
-443.012.5
-407.5
32.3
-407.5
12.9
201.20.03
-361.04.5
0.2 MWref
-101.21.8
541.2
64.1521.23.7
-101.23.7
-407.50.2
-407.5
19.4
-361.0
67.7
-287.50.9
-442.0
12.5
-402.066.0
7032.364.1
coolingwater
0.5 MWt
cooling water0.1 MWt
1.8MWref
Acid gasabsorber
C1 H2S conc.C2
CO2
stripperC3
Solventregenerator C4
DrumD1Drum
D2
DrumD3
DrumD4
Fig. 9. Energy and mass balances for DMEa and DMEb cases of Rectisol model with H2S and CO2abatement.
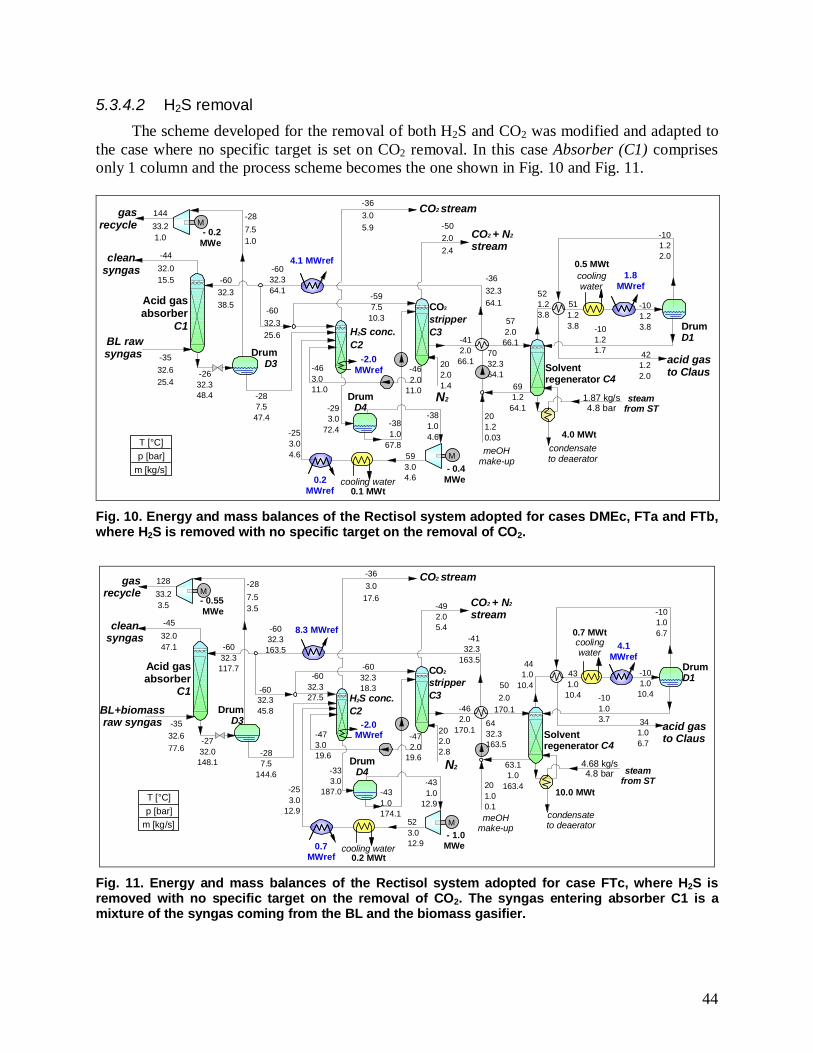
44
5.3.4.2 H2S removal The scheme developed for the removal of both H2S and CO2 was modified and adapted to
the case where no specific target is set on CO2 removal. In this case Absorber (C1) comprisesonly 1 column and the process scheme becomes the one shown in Fig. 10 and Fig. 11.
14433.21.0
-3532.625.4
- 0.4MWe
-2.0MWref
-287.547.4
572.066.1
593.04.6
-502.02.4
-293.0
72.4
-6032.364.1
-363.05.9
T [°C]
m [kg/s]p [bar]
-2632.348.4
4.1 MWref
M
N2
CO2 stream
4.0 MWtcondensateto deaerator
steamfrom ST
1.87 kg/s4.8 bar
meOHmake-up
691.2
64.1
acid gasto Claus
- 0.2MWe
M
BL rawsyngas
gasrecycle
cleansyngas
-287.51.0
-4432.015.5
202.01.4
CO2 + N2
stream-101.22.0
421.22.0
-253.04.6
-463.011.0
201.20.03
-381.04.6
0.2MWref
-101.21.7
521.23.8
511.23.8
-101.23.8
1.8MWref-60
32.338.5
-381.0
67.8
-462.0
11.0
-412.066.1
7032.364.1
-3632.364.1
-6032.325.6
-597.5
10.3
cooling water0.1 MWt
coolingwater
0.5 MWt
Acid gasabsorber
C1
DrumD3
DrumD4
H2S conc.C2
CO2
stripperC3 Drum
D1
Solventregenerator C4
Fig. 10. Energy and mass balances of the Rectisol system adopted for cases DMEc, FTa and FTb,where H2S is removed with no specific target on the removal of CO2.
- 1.0MWe
-2.0MWref
T [°C]
m [kg/s]p [bar]
8.3 MWref
M
N2
CO2 stream
10.0 MWt
condensateto deaerator
steamfrom ST
4.68 kg/s4.8 bar
meOHmake-up
acid gasto Claus
- 0.55MWe
M
BL+biomassraw syngas
gasrecycle
cleansyngas
CO2 + N2
stream
0.7MWref
4.1MWref
cooling water0.2 MWt
coolingwater
0.7 MWt
12833.23.5
-3532.677.6
-4132.3
163.5
-287.5
144.6
-492.05.4-60
32.3163.5
-363.0
17.6
-287.53.5
-4532.047.1
-6032.345.8
-6032.3117.7
523.012.9
-333.0
187.0
-2732.0148.1
202.02.8
-253.0
12.9
-6032.318.3
-431.0
12.9-431.0174.1
-472.0
19.6
-6032.327.5
-462.0
170.1
63.11.0
163.4
-101.06.7
341.06.7
201.00.1
-101.03.7
441.0
10.4431.010.4
-101.010.4
6432.3163.5
-473.019.6
502.0
170.1
Acid gasabsorber
C1Drum
D3
DrumD4
H2S conc.C2
CO2
stripperC3
Solventregenerator C4
DrumD1
Fig. 11. Energy and mass balances of the Rectisol system adopted for case FTc, where H2S isremoved with no specific target on the removal of CO2. The syngas entering absorber C1 is amixture of the syngas coming from the BL and the biomass gasifier.
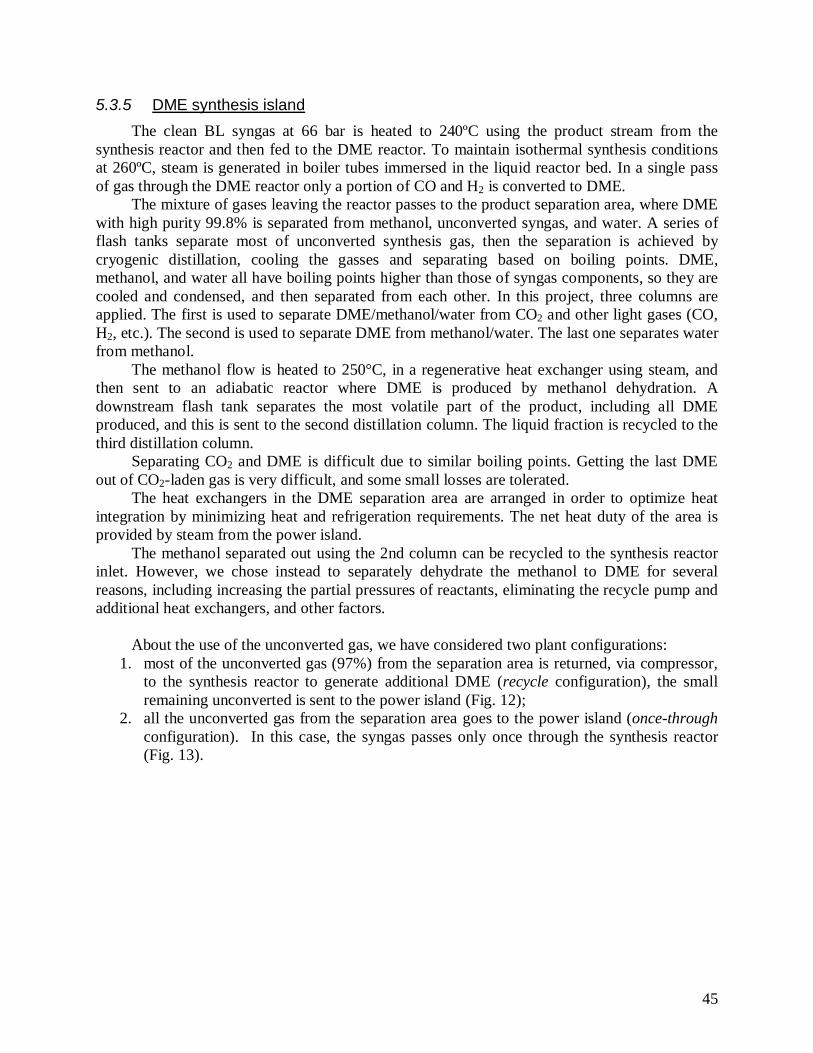
45
5.3.5 DME synthesis islandThe clean BL syngas at 66 bar is heated to 240ºC using the product stream from the
synthesis reactor and then fed to the DME reactor. To maintain isothermal synthesis conditionsat 260ºC, steam is generated in boiler tubes immersed in the liquid reactor bed. In a single passof gas through the DME reactor only a portion of CO and H2 is converted to DME.
The mixture of gases leaving the reactor passes to the product separation area, where DMEwith high purity 99.8% is separated from methanol, unconverted syngas, and water. A series offlash tanks separate most of unconverted synthesis gas, then the separation is achieved bycryogenic distillation, cooling the gasses and separating based on boiling points. DME,methanol, and water all have boiling points higher than those of syngas components, so they arecooled and condensed, and then separated from each other. In this project, three columns areapplied. The first is used to separate DME/methanol/water from CO2 and other light gases (CO,H2, etc.). The second is used to separate DME from methanol/water. The last one separates waterfrom methanol.
The methanol flow is heated to 250°C, in a regenerative heat exchanger using steam, andthen sent to an adiabatic reactor where DME is produced by methanol dehydration. Adownstream flash tank separates the most volatile part of the product, including all DMEproduced, and this is sent to the second distillation column. The liquid fraction is recycled to thethird distillation column.
Separating CO2 and DME is difficult due to similar boiling points. Getting the last DMEout of CO2-laden gas is very difficult, and some small losses are tolerated.
The heat exchangers in the DME separation area are arranged in order to optimize heatintegration by minimizing heat and refrigeration requirements. The net heat duty of the area isprovided by steam from the power island.
The methanol separated out using the 2nd column can be recycled to the synthesis reactorinlet. However, we chose instead to separately dehydrate the methanol to DME for severalreasons, including increasing the partial pressures of reactants, eliminating the recycle pump andadditional heat exchangers, and other factors.
About the use of the unconverted gas, we have considered two plant configurations:1. most of the unconverted gas (97%) from the separation area is returned, via compressor,
to the synthesis reactor to generate additional DME (recycle configuration), the smallremaining unconverted is sent to the power island (Fig. 12);
2. all the unconverted gas from the separation area goes to the power island (once-throughconfiguration). In this case, the syngas passes only once through the synthesis reactor(Fig. 13).
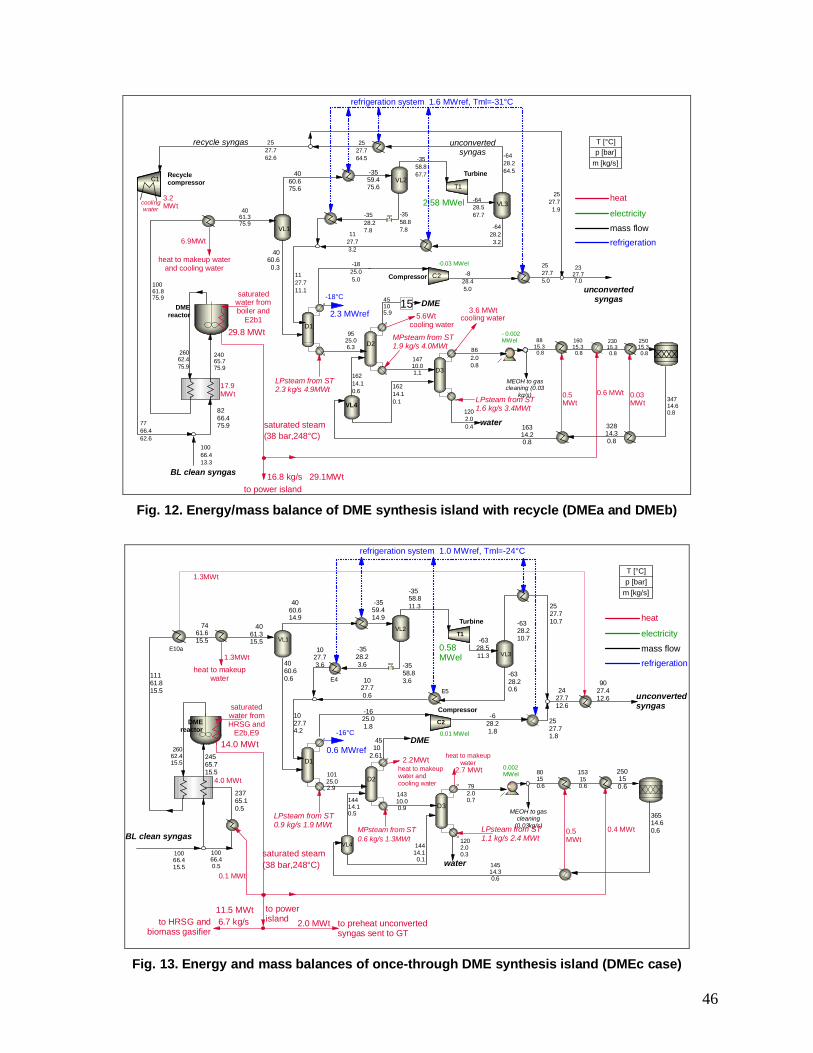
46
DMEreactor
VL1
Recyclecompressor
recycle syngas
BL clean syngas
unconvertedsyngas
unconvertedsyngas
DME
water
MEOH to gascleaning (0.03
kg/s)
24065.775.9
2327.77.0
8266.475.9
9525.06.3
14710.01.1
VL3
VL2
VL40.5MWt
8815.3 0.8
10061.875.9
26062.475.9
saturatedwater fromboiler and
E2b1
to power island16.8 kg/s 29.1MWt
saturated steam(38 bar,248°C)
29.8 MWt
0.6 MWt
2.58 MWel
-0.03 MWel
Turbine
Compressor
refrigeration system 1.6 MWref, Tml=-31°C
45105.9
34714.60.8
0.03MWt
heat
electricity
mass flowrefrigeration
10066.413.3
4061.375.9
4060.675.6
4060.60.3
1127.711.1
2527.762.6
7766.462.6
1127.73.2
-3559.475.6
-3558.87.8
-3528.27.8
-3558.867.7
-6428.567.7
-6428.264.5
-6428.23.2
2527.764.5
2527.71.9
-1825.05.0
-828.45.0
2527.75.0
16214.10.6
1202.00.4
862.00.8
16015.3 0.8
23015.3 0.8
25015.3 0.8
32814.30.8
16314.20.8
16214.10.1
6.9MWt
heat to makeup waterand cooling water
17.9MWt
LPsteam from ST2.3 kg/s 4.9MWt
MPsteam from ST1.9 kg/s 4.0MWt
LPsteam from ST1.6 kg/s 3.4MWt
- 0.002MWel
-18°C
cooling watercooling water2.3 MWref 5.6Wt
3.6 MWt15
T1
D1
D2
D3
C2
C1
coolingwater
3.2MWt
T [°C]
m [kg/s]p [bar]
Fig. 12. Energy/mass balance of DME synthesis island with recycle (DMEa and DMEb)
DMEreactor
BL clean syngas
unconvertedsyngas
DME
water
26062.415.5
2427.712.6
14310.00.9
1202.00.3100
66.415.5
E4
E5
C2
T1
VL3
VL2
MEOH to gascleaning
(0.03kg/s)
0.01 MWel
E10a1.3MWt
1.3MWt
heat to makeupwater
LPsteam from ST0.9 kg/s 1.9 MWt MPsteam from ST
0.6 kg/s 1.3MWtLPsteam from ST1.1 kg/s 2.4 MWt
0.5MWt
saturated steam(38 bar,248°C)
0.4 MWt
saturatedwater fromHRSG and
E2b,E9
to powerisland
11.5 MWt6.7 kg/s
14.0 MWt
0.1 MWt
to HRSG andbiomass gasifier
2.0 MWt to preheat unconvertedsyngas sent to GT
heat to makeupwater
2.7 MWt
0.58MWel
4.0 MWt
Turbine
Compressor
0.002MWel
24565.715.5
-6328.511.3
1027.73.6
250150.6
10066.40.5
11161.815.5
4060.60.6
-3558.83.6
-6328.20.6
10125.02.9
-1625.01.8
4510
2.61
792.00.7
-628.21.8
23765.10.5
7461.615.5
4061.315.5
4060.614.9
-3559.414.9
-3528.23.6
-3558.811.3
-6328.210.7
2527.710.7
1027.70.6
1027.74.2
2527.71.8
9027.412.6
153150.6
80150.6
14514.30.6
14414.10.5
14414.10.1
VL1
D1
D2
D3
VL4
heat to makeupwater andcooling water
2.2MWt
refrigeration system 1.0 MWref, Tml=-24°C
36514.60.6
-16°C
0.6 MWref
T [°C]
m [kg/s]p [bar]
heat
electricity
mass flowrefrigeration
Fig. 13. Energy and mass balances of once-through DME synthesis island (DMEc case)
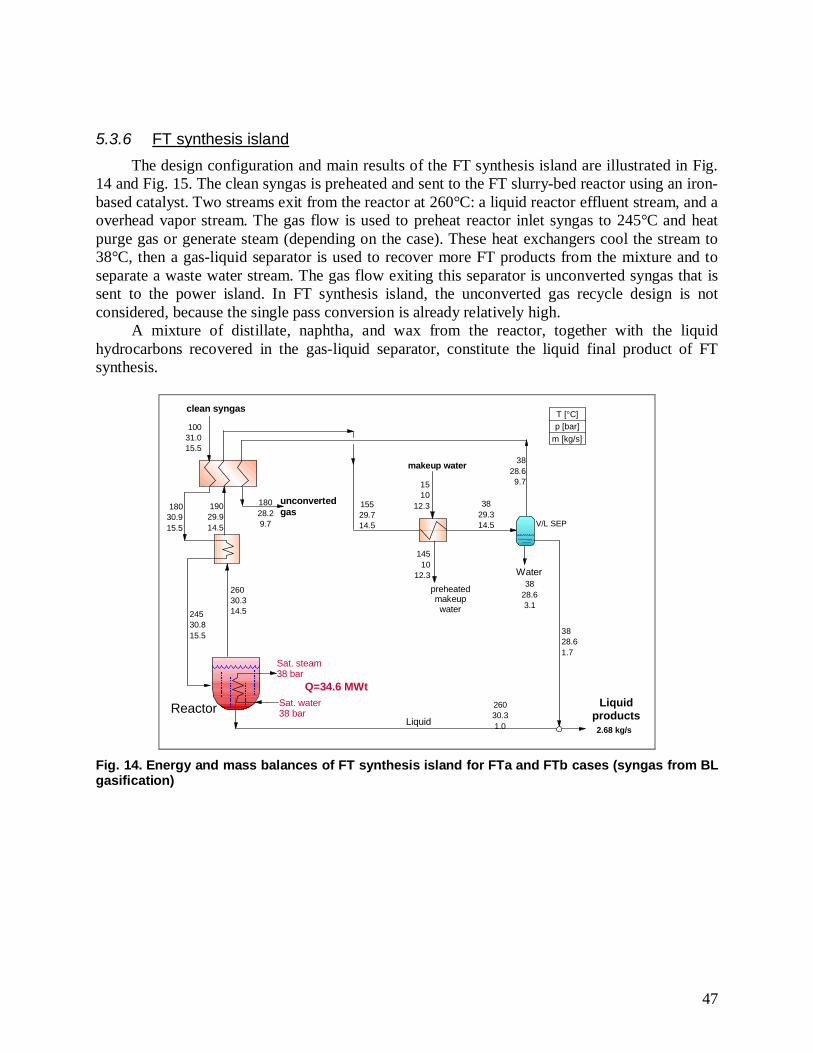
47
5.3.6 FT synthesis islandThe design configuration and main results of the FT synthesis island are illustrated in Fig.
14 and Fig. 15. The clean syngas is preheated and sent to the FT slurry-bed reactor using an iron-based catalyst. Two streams exit from the reactor at 260°C: a liquid reactor effluent stream, and aoverhead vapor stream. The gas flow is used to preheat reactor inlet syngas to 245°C and heatpurge gas or generate steam (depending on the case). These heat exchangers cool the stream to38°C, then a gas-liquid separator is used to recover more FT products from the mixture and toseparate a waste water stream. The gas flow exiting this separator is unconverted syngas that issent to the power island. In FT synthesis island, the unconverted gas recycle design is notconsidered, because the single pass conversion is already relatively high.
A mixture of distillate, naphtha, and wax from the reactor, together with the liquidhydrocarbons recovered in the gas-liquid separator, constitute the liquid final product of FTsynthesis.
10031.015.5
clean syngas
26030.314.5
3828.63.1
Water
Q=34.6 MWtSat. water38 barReactor
24530.815.5
26030.31.0
Sat. steam38 bar
18028.29.7
3829.314.5
3828.61.7
2.68 kg/s
unconvertedgas
Liquidproducts
18030.915.5
19029.914.5
15529.714.5
3828.69.7
14510
12.3
1510
12.3
makeup water
preheatedmakeupwater
V/L SEP
T [°C]
m [kg/s]p [bar]
Liquid
Fig. 14. Energy and mass balances of FT synthesis island for FTa and FTb cases (syngas from BLgasification)
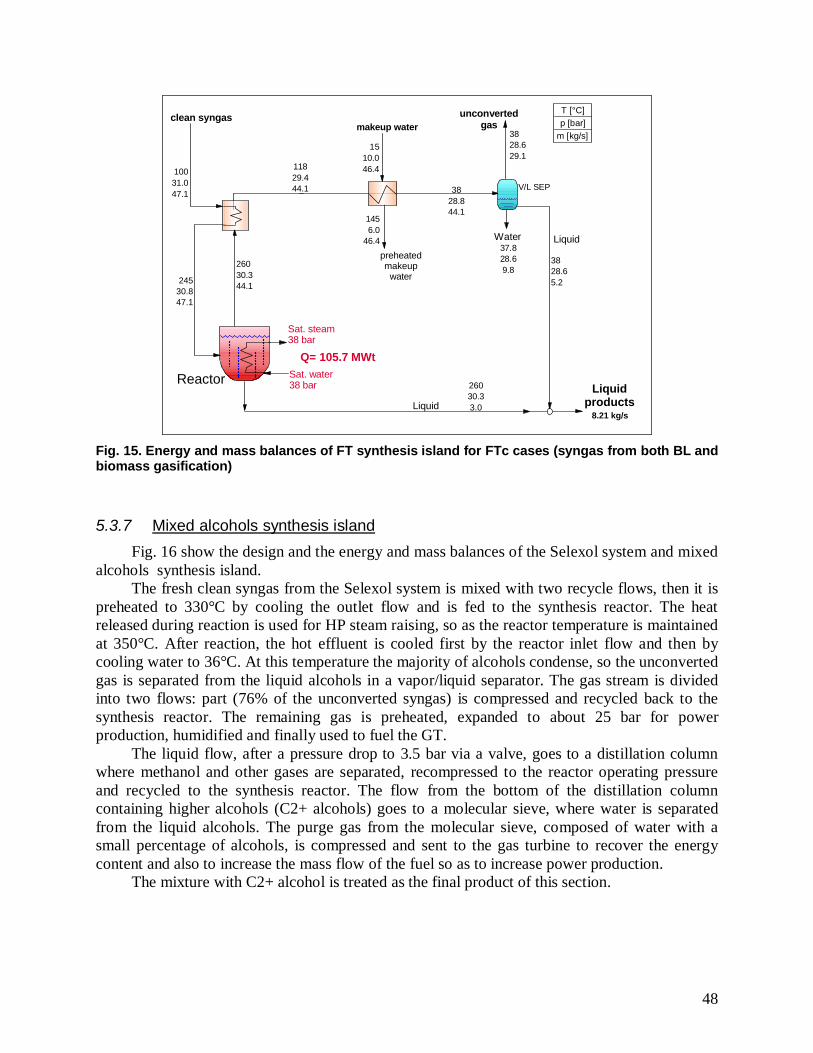
48
10031.047.1
26030.344.1
37.828.69.8
Water
Q= 105.7 MWt
Reactor
24530.847.1
3828.844.1
3828.65.2
11829.444.1
3828.629.1
26030.33.0
Liquid
Liquid
V/L SEP
clean syngas unconvertedgas
Liquidproducts
1456.0
46.4
1510.046.4
makeup water
preheatedmakeup
water
Sat. water38 bar
Sat. steam38 bar
T [°C]
m [kg/s]p [bar]
8.21 kg/s
Fig. 15. Energy and mass balances of FT synthesis island for FTc cases (syngas from both BL andbiomass gasification)
5.3.7 Mixed alcohols synthesis islandFig. 16 show the design and the energy and mass balances of the Selexol system and mixed
alcohols synthesis island.The fresh clean syngas from the Selexol system is mixed with two recycle flows, then it is
preheated to 330°C by cooling the outlet flow and is fed to the synthesis reactor. The heatreleased during reaction is used for HP steam raising, so as the reactor temperature is maintainedat 350°C. After reaction, the hot effluent is cooled first by the reactor inlet flow and then bycooling water to 36°C. At this temperature the majority of alcohols condense, so the unconvertedgas is separated from the liquid alcohols in a vapor/liquid separator. The gas stream is dividedinto two flows: part (76% of the unconverted syngas) is compressed and recycled back to thesynthesis reactor. The remaining gas is preheated, expanded to about 25 bar for powerproduction, humidified and finally used to fuel the GT.
The liquid flow, after a pressure drop to 3.5 bar via a valve, goes to a distillation columnwhere methanol and other gases are separated, recompressed to the reactor operating pressureand recycled to the synthesis reactor. The flow from the bottom of the distillation columncontaining higher alcohols (C2+ alcohols) goes to a molecular sieve, where water is separatedfrom the liquid alcohols. The purge gas from the molecular sieve, composed of water with asmall percentage of alcohols, is compressed and sent to the gas turbine to recover the energycontent and also to increase the mass flow of the fuel so as to increase power production.
The mixture with C2+ alcohol is treated as the final product of this section.
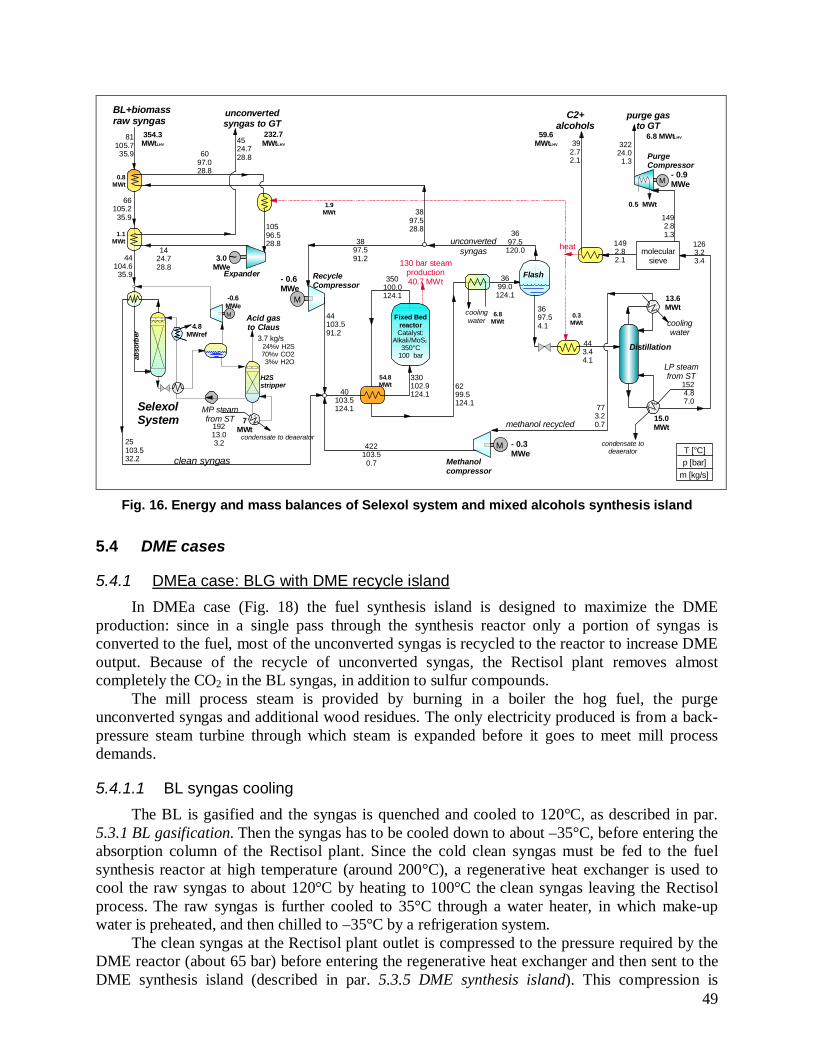
49
M
Methanolcompressor
SelexolSystem
Fixed BedreactorCatalyst:
Alkali/MoS2
350°C100 bar
methanol recycled
BL+biomassraw syngas
unconvertedsyngas to GT
81105.735.9
- 0.3MWe
molecularsieve
C2+alcohols
purge gasto GT
coolingwater
unconvertedsyngas
- 0.6MWe
LP steamfrom ST
M
clean syngas
RecycleCompressor
Flash
abso
rber
15.0MWt
25103.532.2
350100.0124.1
330102.9124.140
103.5124.1
6299.5124.1
3697.5
120.038
97.591.2
44103.591.2
422103.50.7
3699.0124.1
3697.54.1
773.20.7
4524.728.8
1492.81.3
6.8MWt
443.44.1
1.9MWt
0.3MWt
heat
10596.528.8
Distillation
1492.82.1
1263.23.4
392.72.1
condensate todeaerator
1524.87.0
coolingwater
13.6MWt
condensate to deaerator
354.3MWtLHV
232.7MWtLHV
59.6MWtLHV
6.8 MWtLHV
130 bar steamproduction40.7 MWt
T [°C]
m [kg/s]p [bar]
H2Sstripper
Acid gasto Claus
3.7 kg/s24%v H2S70%v CO23%v H2O
MP steamfrom ST 7
MWt
M
Expander
3.0MWe
M
0.5 MWt
PurgeCompressor
1.1MWt
0.8MWt
66105.235.9
44104.635.9
6097.028.8
19213.03.2
~1424.728.8
3897.528.8
- 0.9MWe
32224.01.3
4.8MWref
-0.6MWe
54.8MWt
Fig. 16. Energy and mass balances of Selexol system and mixed alcohols synthesis island
5.4 DME cases
5.4.1 DMEa case: BLG with DME recycle islandIn DMEa case (Fig. 18) the fuel synthesis island is designed to maximize the DME
production: since in a single pass through the synthesis reactor only a portion of syngas isconverted to the fuel, most of the unconverted syngas is recycled to the reactor to increase DMEoutput. Because of the recycle of unconverted syngas, the Rectisol plant removes almostcompletely the CO2 in the BL syngas, in addition to sulfur compounds.
The mill process steam is provided by burning in a boiler the hog fuel, the purgeunconverted syngas and additional wood residues. The only electricity produced is from a back-pressure steam turbine through which steam is expanded before it goes to meet mill processdemands.
5.4.1.1 BL syngas coolingThe BL is gasified and the syngas is quenched and cooled to 120°C, as described in par.
5.3.1 BL gasification. Then the syngas has to be cooled down to about –35°C, before entering theabsorption column of the Rectisol plant. Since the cold clean syngas must be fed to the fuelsynthesis reactor at high temperature (around 200°C), a regenerative heat exchanger is used tocool the raw syngas to about 120°C by heating to 100°C the clean syngas leaving the Rectisolprocess. The raw syngas is further cooled to 35°C through a water heater, in which make-upwater is preheated, and then chilled to –35°C by a refrigeration system.
The clean syngas at the Rectisol plant outlet is compressed to the pressure required by theDME reactor (about 65 bar) before entering the regenerative heat exchanger and then sent to theDME synthesis island (described in par. 5.3.5 DME synthesis island). This compression is
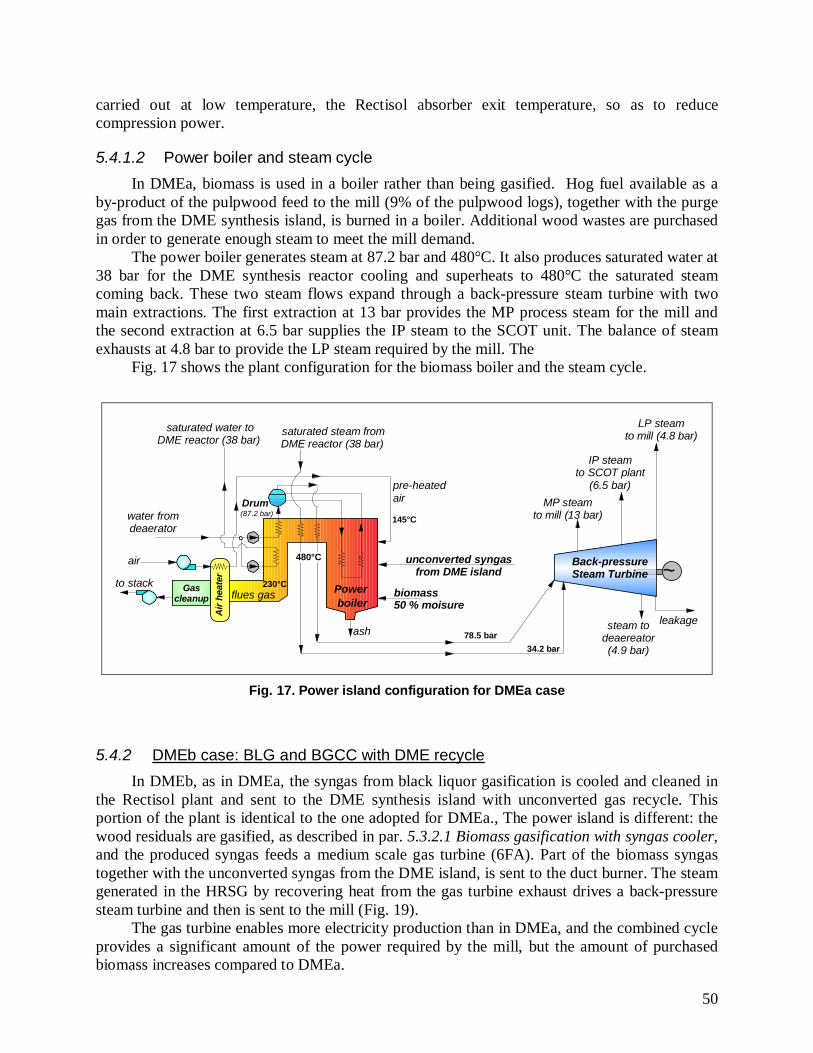
50
carried out at low temperature, the Rectisol absorber exit temperature, so as to reducecompression power.
5.4.1.2 Power boiler and steam cycleIn DMEa, biomass is used in a boiler rather than being gasified. Hog fuel available as a
by-product of the pulpwood feed to the mill (9% of the pulpwood logs), together with the purgegas from the DME synthesis island, is burned in a boiler. Additional wood wastes are purchasedin order to generate enough steam to meet the mill demand.
The power boiler generates steam at 87.2 bar and 480°C. It also produces saturated water at38 bar for the DME synthesis reactor cooling and superheats to 480°C the saturated steamcoming back. These two steam flows expand through a back-pressure steam turbine with twomain extractions. The first extraction at 13 bar provides the MP process steam for the mill andthe second extraction at 6.5 bar supplies the IP steam to the SCOT unit. The balance of steamexhausts at 4.8 bar to provide the LP steam required by the mill. The
Fig. 17 shows the plant configuration for the biomass boiler and the steam cycle.
~Back-pressureSteam Turbine
ash
Powerboiler
Gascleanup
air
to stackbiomass50 % moisure
Air
heat
er
unconverted syngasfrom DME island
steam todeaereator(4.9 bar)
Drum(87.2 bar)
leakage
water fromdeaerator
saturated water toDME reactor (38 bar)
saturated steam fromDME reactor (38 bar)
145°C
pre-heatedair
230°Cflues gas
78.5 bar34.2 bar
MP steamto mill (13 bar)
LP steamto mill (4.8 bar)
IP steamto SCOT plant
(6.5 bar)
480°C
Fig. 17. Power island configuration for DMEa case
5.4.2 DMEb case: BLG and BGCC with DME recycleIn DMEb, as in DMEa, the syngas from black liquor gasification is cooled and cleaned in
the Rectisol plant and sent to the DME synthesis island with unconverted gas recycle. Thisportion of the plant is identical to the one adopted for DMEa., The power island is different: thewood residuals are gasified, as described in par. 5.3.2.1 Biomass gasification with syngas cooler,and the produced syngas feeds a medium scale gas turbine (6FA). Part of the biomass syngastogether with the unconverted syngas from the DME island, is sent to the duct burner. The steamgenerated in the HRSG by recovering heat from the gas turbine exhaust drives a back-pressuresteam turbine and then is sent to the mill (Fig. 19).
The gas turbine enables more electricity production than in DMEa, and the combined cycleprovides a significant amount of the power required by the mill, but the amount of purchasedbiomass increases compared to DMEa.
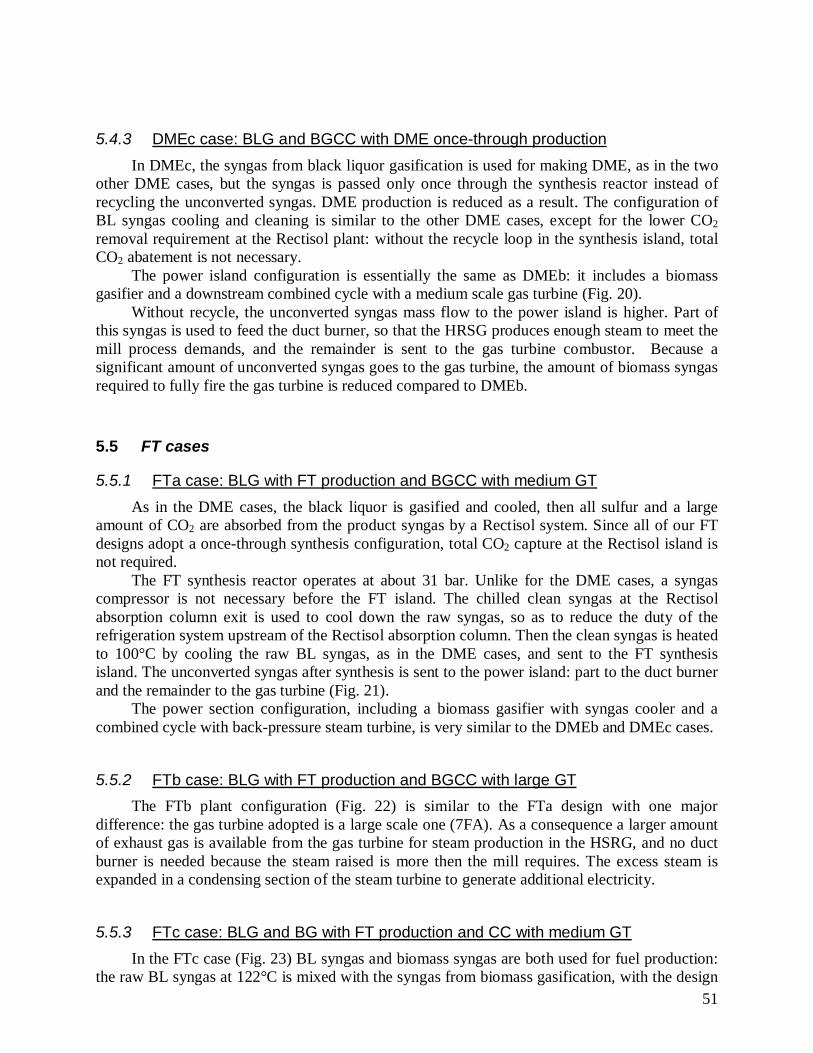
51
5.4.3 DMEc case: BLG and BGCC with DME once-through productionIn DMEc, the syngas from black liquor gasification is used for making DME, as in the two
other DME cases, but the syngas is passed only once through the synthesis reactor instead ofrecycling the unconverted syngas. DME production is reduced as a result. The configuration ofBL syngas cooling and cleaning is similar to the other DME cases, except for the lower CO2removal requirement at the Rectisol plant: without the recycle loop in the synthesis island, totalCO2 abatement is not necessary.
The power island configuration is essentially the same as DMEb: it includes a biomassgasifier and a downstream combined cycle with a medium scale gas turbine (Fig. 20).
Without recycle, the unconverted syngas mass flow to the power island is higher. Part ofthis syngas is used to feed the duct burner, so that the HRSG produces enough steam to meet themill process demands, and the remainder is sent to the gas turbine combustor. Because asignificant amount of unconverted syngas goes to the gas turbine, the amount of biomass syngasrequired to fully fire the gas turbine is reduced compared to DMEb.
5.5 FT cases
5.5.1 FTa case: BLG with FT production and BGCC with medium GTAs in the DME cases, the black liquor is gasified and cooled, then all sulfur and a large
amount of CO2 are absorbed from the product syngas by a Rectisol system. Since all of our FTdesigns adopt a once-through synthesis configuration, total CO2 capture at the Rectisol island isnot required.
The FT synthesis reactor operates at about 31 bar. Unlike for the DME cases, a syngascompressor is not necessary before the FT island. The chilled clean syngas at the Rectisolabsorption column exit is used to cool down the raw syngas, so as to reduce the duty of therefrigeration system upstream of the Rectisol absorption column. Then the clean syngas is heatedto 100°C by cooling the raw BL syngas, as in the DME cases, and sent to the FT synthesisisland. The unconverted syngas after synthesis is sent to the power island: part to the duct burnerand the remainder to the gas turbine (Fig. 21).
The power section configuration, including a biomass gasifier with syngas cooler and acombined cycle with back-pressure steam turbine, is very similar to the DMEb and DMEc cases.
5.5.2 FTb case: BLG with FT production and BGCC with large GTThe FTb plant configuration (Fig. 22) is similar to the FTa design with one major
difference: the gas turbine adopted is a large scale one (7FA). As a consequence a larger amountof exhaust gas is available from the gas turbine for steam production in the HSRG, and no ductburner is needed because the steam raised is more then the mill requires. The excess steam isexpanded in a condensing section of the steam turbine to generate additional electricity.
5.5.3 FTc case: BLG and BG with FT production and CC with medium GTIn the FTc case (Fig. 23) BL syngas and biomass syngas are both used for fuel production:
the raw BL syngas at 122°C is mixed with the syngas from biomass gasification, with the design
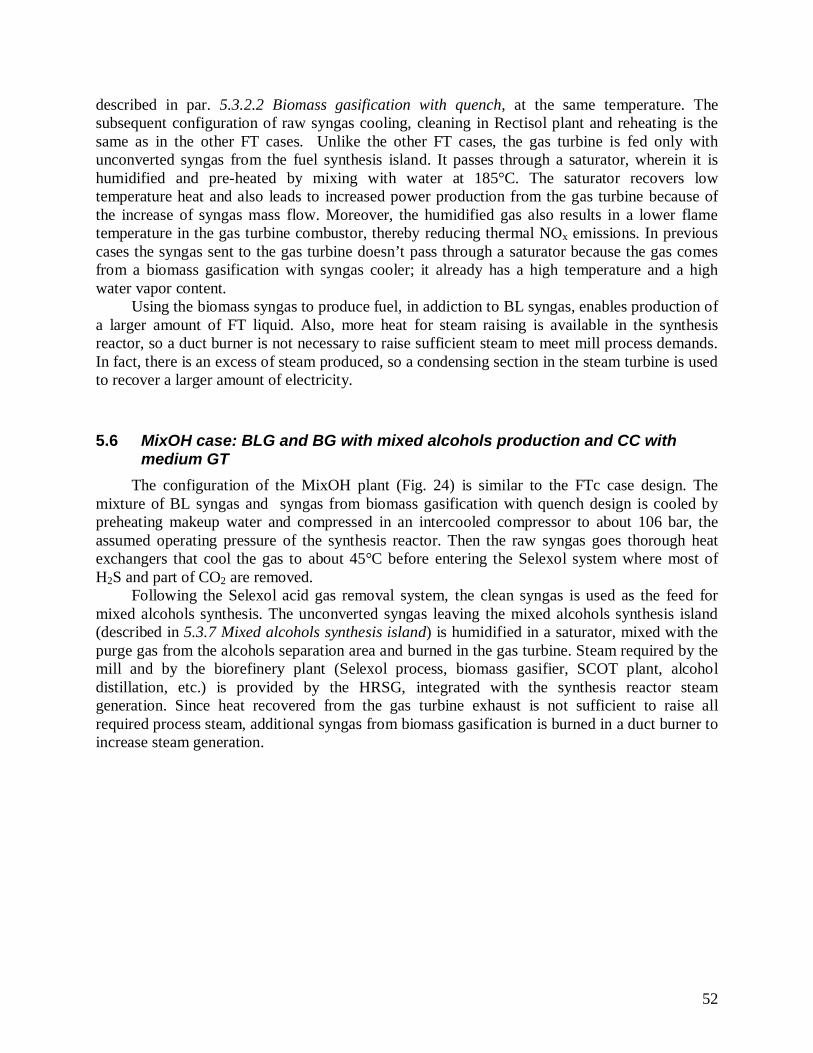
52
described in par. 5.3.2.2 Biomass gasification with quench, at the same temperature. Thesubsequent configuration of raw syngas cooling, cleaning in Rectisol plant and reheating is thesame as in the other FT cases. Unlike the other FT cases, the gas turbine is fed only withunconverted syngas from the fuel synthesis island. It passes through a saturator, wherein it ishumidified and pre-heated by mixing with water at 185°C. The saturator recovers lowtemperature heat and also leads to increased power production from the gas turbine because ofthe increase of syngas mass flow. Moreover, the humidified gas also results in a lower flametemperature in the gas turbine combustor, thereby reducing thermal NOx emissions. In previouscases the syngas sent to the gas turbine doesn’t pass through a saturator because the gas comesfrom a biomass gasification with syngas cooler; it already has a high temperature and a highwater vapor content.
Using the biomass syngas to produce fuel, in addiction to BL syngas, enables production ofa larger amount of FT liquid. Also, more heat for steam raising is available in the synthesisreactor, so a duct burner is not necessary to raise sufficient steam to meet mill process demands.In fact, there is an excess of steam produced, so a condensing section in the steam turbine is usedto recover a larger amount of electricity.
5.6 MixOH case: BLG and BG with mixed alcohols production and CC withmedium GT
The configuration of the MixOH plant (Fig. 24) is similar to the FTc case design. Themixture of BL syngas and syngas from biomass gasification with quench design is cooled bypreheating makeup water and compressed in an intercooled compressor to about 106 bar, theassumed operating pressure of the synthesis reactor. Then the raw syngas goes thorough heatexchangers that cool the gas to about 45°C before entering the Selexol system where most ofH2S and part of CO2 are removed.
Following the Selexol acid gas removal system, the clean syngas is used as the feed formixed alcohols synthesis. The unconverted syngas leaving the mixed alcohols synthesis island(described in 5.3.7 Mixed alcohols synthesis island) is humidified in a saturator, mixed with thepurge gas from the alcohols separation area and burned in the gas turbine. Steam required by themill and by the biorefinery plant (Selexol process, biomass gasifier, SCOT plant, alcoholdistillation, etc.) is provided by the HRSG, integrated with the synthesis reactor steamgeneration. Since heat recovered from the gas turbine exhaust is not sufficient to raise allrequired process steam, additional syngas from biomass gasification is burned in a duct burner toincrease steam generation.
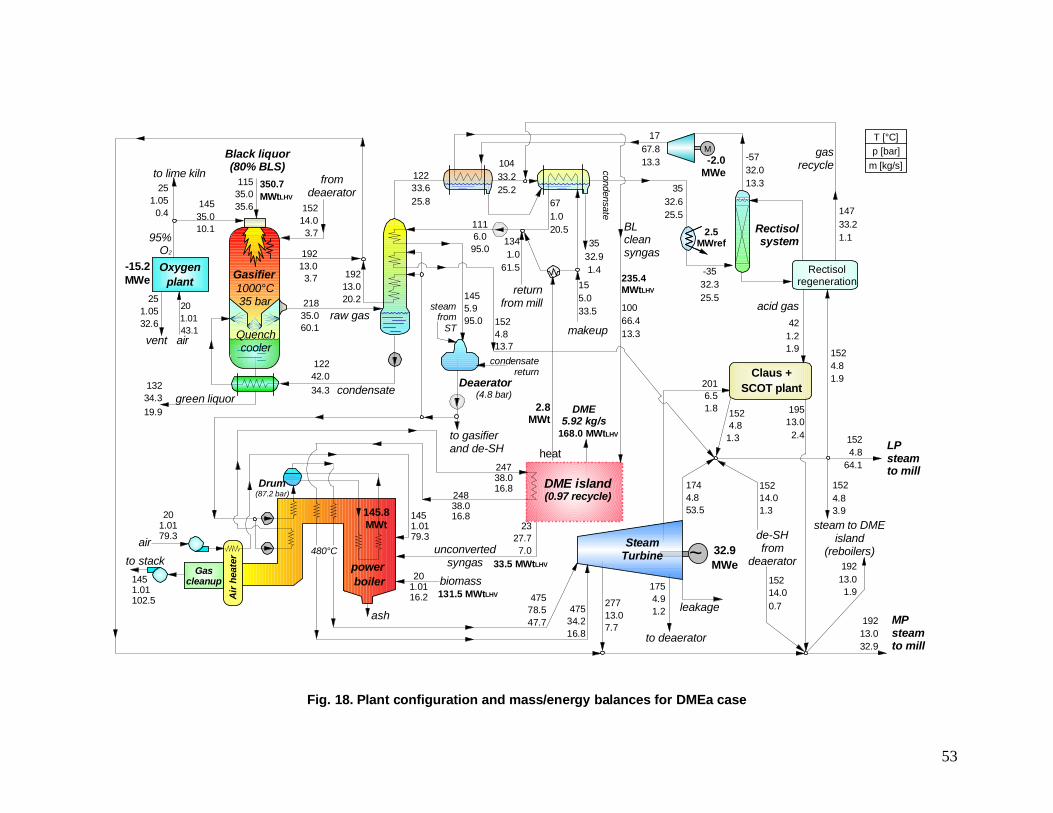
53
Quenchcooler
1000°C35 bar
Gasifier
19213.03.7
green liquor
Black liquor(80% BLS)
15214.03.7
11535.035.6
raw gas
condensate
fromdeaerator
12242.034.3
21835.060.1
~SteamTurbine
ash
powerboiler
Gascleanup
airto stack
1451.0179.3
201.0116.2
201.0179.3
1451.01102.5
biomass
Air
heat
er
Claus +SCOT plant
201.0143.1
-15.2MWe
14535.010.1
251.05
0.4
air
Oxygenplant
vent
to lime kiln
95%O2
251.0532.6
LPsteamto mill
1524.8
64.1
MPsteamto mill
19213.032.9
unconvertedsyngas
DME island(0.97 recycle)
Deaerator (4.8 bar)
19513.0
2.4
152 4.81.3
1744.853.5
19213.020.2
1524.813.7
1116.095.0
2016.51.8
47578.547.7
47534.216.8
27713.07.7
2327.77.0
24738.016.8
1455.995.0
to deaerator
1754.91.2
13234.319.9
12233.625.8
to gasifierand de-SH
de-SHfrom
deaerator
15214.01.3
15214.00.7
Drum(87.2 bar) 248
38.016.8
leakage
DME5.92 kg/s
32.9MWe
steamfrom
ST
T [°C]
m [kg/s]p [bar]
480°C
350.7MWtLHV
131.5 MWtLHV
33.5 MWtLHV
168.0 MWtLHV
Rectisolsystem
BLcleansyngas
returnfrom mill
1341.0
61.5
155.033.5
makeup
-5732.013.3
235.4MWtLHV
1767.813.3104
33.225.2
3532.91.4
3532.625.5
-3532.325.5
condensatereturn
condensate
M-2.0
MWe
671.020.5
10066.413.3
steam to DMEisland
(reboilers)192
13.01.9
1524.83.9
heat
2.8MWt
acid gas
gasrecycle
1524.81.9
14733.21.1
Rectisolregeneration
421.21.9
2.5MWref
145.8MWt
Fig. 18. Plant configuration and mass/energy balances for DMEa case

54
19213.03.7
greenliquor
Black liquor(80% BLS)
15114.03.7
11535.035.6
raw gasQuenchcooler
1000°C35 bar
BLGasifier
condensate
fromdeaerator
12242.034.3
21835.060.1
201.0174.6
-26.4MWe
14536.010.1
251.050.4
air
Oxygenplant
vent
to lime kiln
95%O2
241.0554.9
Deaerator (4.8 bar)
19213.020.2
1524.813.6
11210.0100.2
1456.0
100.2
12233.625.8
de-SH
steamfromST
37524.032.6
43116.6151.8
6351.05
210.0
89.5MWe~ 751
1.04217.4
135716.1
184.0
201.01177.8 Gas turbine (6FA)air
Syngas cooler31.8 MWt
Drum(130 bar)
~SteamTurbine
25813.07.9
42.0MWe
201.0130.7
701.0119.2
DryerLP
steamto mill
1524.864.1
MPsteamto mill
19213.032.9
Claus +SCOT plant
BL cleansyngas
13234.319.9
901.0228.9
unconvertedsyngas
2291.0217.4
95036.032.6
42134.232.6
331130.027.5
330130.0
27.5
14636.07.7
24838.04.3
oxygen
steam
37034.212.6
535117.063.0
1594.854.3
1886.51.8
16537.71.5
BiomassGasifier
19513.02.4
1524.81.3
15114.00.6
15114.00.4
HRSG
Duct burner
1504.80.2
fromblowdownflash
blowdown24738.01.14
540°C
Cracker
return frommill
1341.0
61.5
155.038.7
makeup
heat
ash
950°C36 bar DME island
(0.97 recycle)
5.7MWt
24738.016.8248
38.012.6
350.7MWtLHV
Filter
223.8MWtLHV
ash
biomass249.6 MWtLHV
36.3MWtLHV
T [°C]
m [kg/s]p [bar]
10.0 kg/s
bleeds
to deaerator1594.81.6
~2.4
MWe
Expander
37524.032.2
10433.225.2
3532.91.4
23.5 MWt
134.0MWt
nitrogen
-0.9MWe
241.051.5
11324.07.4
37524.00.4
226.5MWtLHV
condensate
condensateto deaeratorM
coolingwater
0.6 MWt
M
2.5MWref
leakage
781.017.3
de-SH
19213.01.9
steam
to DMEisland
1524.83.9
Rectisolsystem
acid gas
gasrecycle
Rectisolrigeneration
14733.21.1
-5732.013.3
1767.813.3
3532.925.5
-3532.625.5
10066.413.3
1524.81.9
421.21.9
-2.0 MWe
235.4MWtLHV
DME5.92 kg/s
168.0 MWtLHV
33.5 MWtLHV
Fig. 19. Plant configuration and mass/energy balances for DMEb case
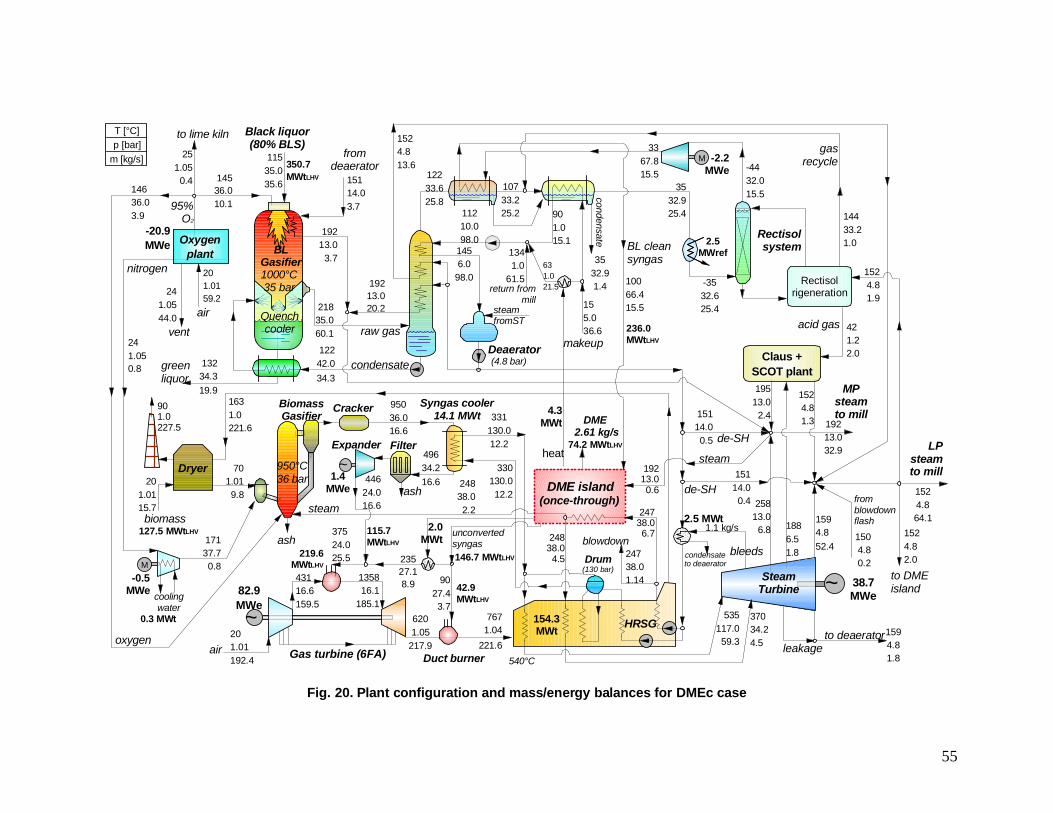
55
19213.0
3.7
greenliquor
Black liquor(80% BLS)
15114.03.7
11535.035.6
raw gasQuenchcooler
1000°C35 bar
BLGasifier
condensate
fromdeaerator
12242.034.3
21835.060.1
201.0159.2
-20.9MWe
14536.010.1
251.05
0.4
air
Oxygenplant
vent
to lime kiln
95%O2
241.0544.0
19213.020.2
1524.813.6
11210.098.0
1456.0
98.0
12233.625.8
44624.016.6
43116.6159.5
6201.05
217.9
82.9MWe~ 767
1.04221.6
135816.1
185.1
201.01192.4 Gas turbine (6FA)air
Syngas cooler14.1 MWt
201.0115.7
701.019.8
13234.319.9
901.0227.5
unconvertedsyngas
1631.0221.6
95036.016.6
49634.216.6
331130.012.2
330130.012.2
14636.03.9
24838.02.2
oxygen
steam
17137.70.8
BiomassGasifier
Duct burner
Cracker
ash
950°C36 bar
350.7MWtLHV
Filter
219.6MWtLHV
ash
biomass127.5 MWtLHV
42.9MWtLHV
T [°C]
m [kg/s]p [bar]
146.7 MWtLHV
~1.4
MWe
Expander
37524.025.5
nitrogen
-0.5MWe
241.050.8
9027.43.7
23527.18.9
115.7MWtLHV
M
coolingwater
0.3 MWt
2.0MWt
Deaerator (4.8 bar)
de-SH
steamfromST
~SteamTurbine
25813.0
6.8
38.7MWe
LPsteamto mill
1524.864.1
MPsteamto mill
19213.032.9
Claus +SCOT plant
BL cleansyngas
10066.415.5
37034.24.5
535117.059.3
1594.852.4
1886.51.8
19513.0
2.4
1524.81.3
15114.00.5
15114.0
0.4
1504.80.2
fromblowdownflash
540°C
return frommill
1341.0
61.5
155.036.6
makeup
heat
-4432.015.5
DME island(once-through)
DME 2.61 kg/s
4.3MWt
24738.06.7
236.0MWtLHV
74.2 MWtLHV
1524.81.9
1.1 kg/s
bleeds
to deaerator1594.81.8
3367.815.5
10733.225.2
3532.91.4
3532.925.4
-3532.625.4
2.5 MWt
condensate
condensateto deaerator
M -2.2 MWe
2.5MWref
leakage
901.015.1
de-SH
19213.00.6
steam
to DMEisland
1524.82.0
Rectisolsystem
acid gas
gasrecycle
14433.21.0
Rectisolrigeneration
421.22.0
631.021.5
Drum(130 bar)
HRSG
blowdown24738.01.14
154.3MWt
24838.0
4.5
Dryer
Fig. 20. Plant configuration and mass/energy balances for DMEc case
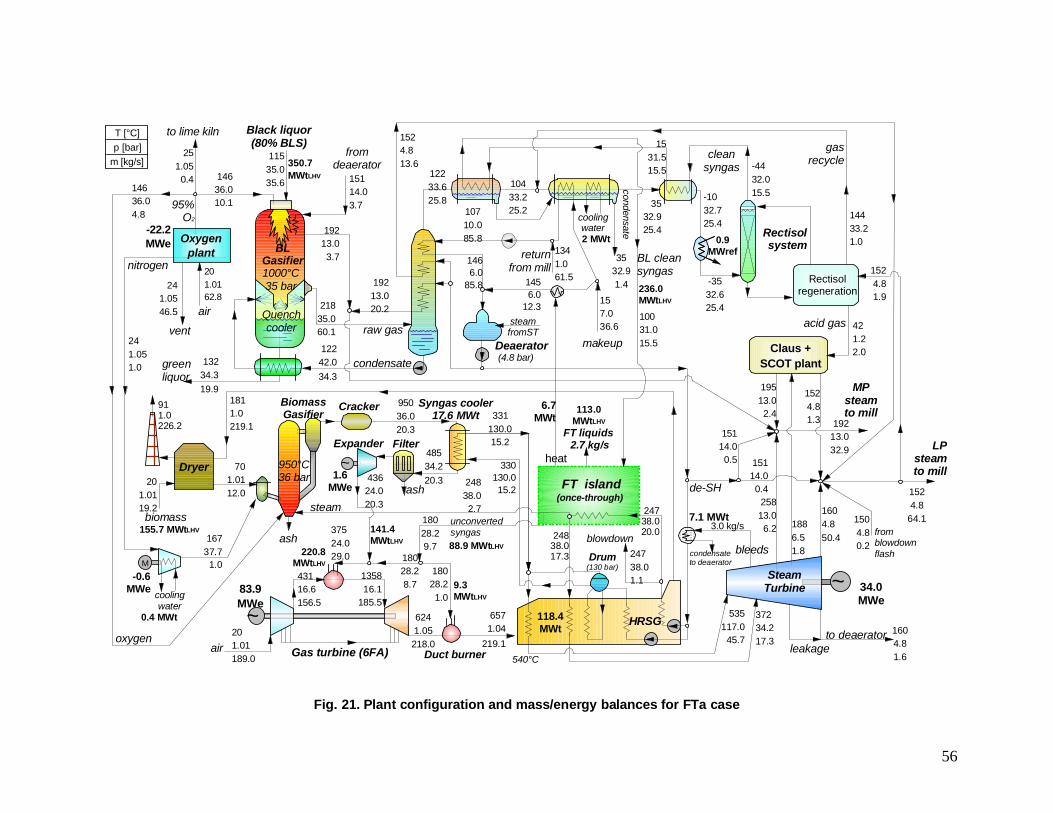
56
greenliquor
Black liquor(80% BLS)
11535.035.6
raw gasQuenchcooler
1000°C35 bar
BLGasifier
condensate
fromdeaerator
201.0162.8
-22.2MWe
14636.010.1
251.05
0.4
air
Oxygenplant
vent
to lime kiln
95%O2
241.0546.5
cleansyngas
Deaerator (4.8 bar)
10710.085.8
1466.0
85.8
de-SH
steamfromST
43624.020.3
43116.6156.5
6241.05218.0
83.9MWe~ 657
1.04219.1
135816.1
185.5
201.01189.0 Gas turbine (6FA)air
Syngas cooler17.6 MWt
Drum(130 bar)
~SteamTurbine
25813.06.2
leakage
34.0MWe
201.0119.2
701.0112.0
Dryer
LPsteamto mill
1524.8
64.1
MPsteamto mill
19213.032.9
Claus +SCOT plant
BL cleansyngas
10031.015.5
911.0226.2
unconvertedsyngas
1811.0219.1
95036.020.3
48534.220.3
331130.015.2
330130.015.2
14636.04.8
24838.02.7
oxygen
steam
37234.217.3
535117.0
45.7
1604.850.4
1886.51.8
16737.7
1.0
BiomassGasifier
19513.02.4
1524.81.3
15114.00.5 151
14.00.4
HRSG
Duct burner
1504.80.2
fromblowdownflash
blowdown24738.01.1
540°C
Cracker
returnfrom mill
1341.061.5
157.036.6
makeup
heat
ash
950°C36 bar FT island
(once-through)
FT liquids 2.7 kg/s
6.7MWt
24738.020.0248
38.017.3
350.7MWtLHV
113.0MWtLHV
Filter
220.8MWtLHV
ash
biomass155.7 MWtLHV
9.3MWtLHV
T [°C]
m [kg/s]p [bar]
88.9 MWtLHV
3.0 kg/s
bleeds
to deaerator 1604.81.6
18028.29.7
~1.6
MWe
Expander
37524.029.0
1531.515.5
7.1 MWt
118.4MWt
nitrogen
-0.6MWe
coolingwater
241.051.0
18028.21.0
18028.28.7
1456.0
12.3
141.4MWtLHV
condensate
2 MWt
condensateto deaeratorM
coolingwater
0.4 MWt
Rectisolsystem
acid gas
gasrecycle
Rectisolregeneration
19213.03.7
15114.03.7
12242.034.3
21835.060.1
19213.020.2
1524.813.6
12233.625.8
13234.319.9
10433.225.2
3532.91.4
-4432.015.5
3532.925.4
-3532.625.4
0.9MWref
-1032.725.4
236.0MWtLHV
1524.81.9
14433.21.0
421.22.0
Fig. 21. Plant configuration and mass/energy balances for FTa case
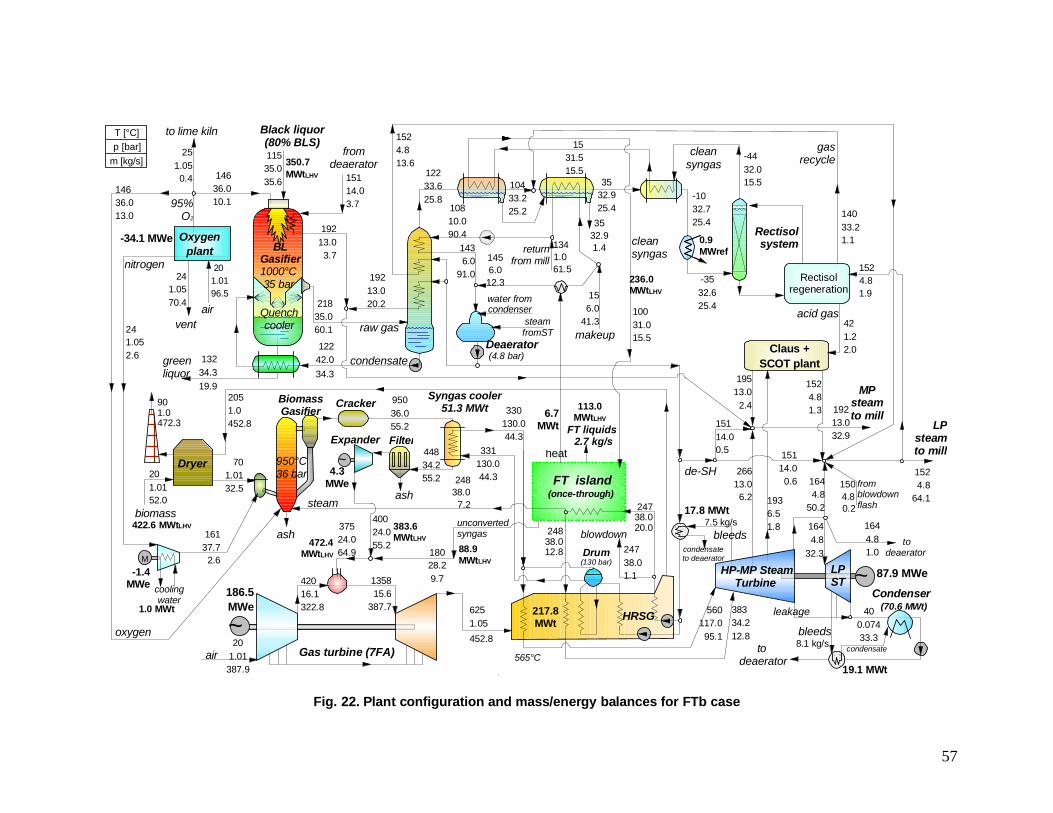
57
greenliquor
Black liquor(80% BLS)11535.035.6
raw gasQuenchcooler
1000°C35 bar
BLGasifier
condensate
fromdeaerator
201.0196.5
-34.1 MWe
251.050.4
air
Oxygenplant
vent
to lime kiln
95%O2
241.0570.4
Deaerator (4.8 bar)
de-SH
steamfromST
40024.055.2
6251.05452.8
Gas turbine (7FA)
Drum(130 bar)
26613.06.2
201.0152.0
701.0132.5
Dryer
LPsteamto mill
1524.8
64.1
MPsteamto mill192
13.032.9
Claus +SCOT plant
901.0472.3
2051.0452.8
95036.055.2
14636.013.0
24838.0
7.2
oxygen
steam
38334.212.8
560117.095.1
1644.8
32.3
1936.51.8
16137.7
2.6
BiomassGasifier
15114.00.5 151
14.00.6
HRSG
blowdown
565°C
Cracker
ash
950°C36 bar FT island
(once-through)
350.7MWtLHV
Filter
472.4MWtLHV
ashbiomass
422.6 MWtLHV
T [°C]
m [kg/s]p [bar]
~4.3
MWe
Expander
37524.064.9
~
42016.1322.8
186.5MWe
135815.6
387.7
201.01387.9
air
~ HP-MP SteamTurbine
bleeds
87.9 MWe
1644.8
50.2
Condenser (70.6 MWt)
LPST
8.1 kg/s
leakage
todeaerator
400.07433.3
todeaerator
1644.81.0
10810.090.4
1436.0
91.0
24738.01.1
water fromcondenser
19.1 MWt
17.8 MWt
217.8MWt
cleansyngas
cleansyngas
156.0
41.3makeup
heat
unconvertedsyngas
383.6MWtLHV
nitrogen
241.052.6
returnfrom mill
1341.061.5
bleedscondensateto deaerator
7.5 kg/s
condensate
-1.4MWe
M
coolingwater
1.0 MWt
acid gas
gasrecycle
Rectisolregeneration
14033.21.1
1524.81.9
1504.80.2
fromblowdownflash
19213.03.7
15114.03.7
12242.034.3
21835.060.1
19213.020.2
1524.813.6
13234.319.9
10031.015.5
19513.0
2.4
1524.81.3
FT liquids 2.7 kg/s
24738.020.0248
38.012.8
113.0MWtLHV
1531.515.5122
33.625.8
10433.225.2
3532.91.4
-4432.015.535
32.925.4
-3532.625.4
0.9MWref
-1032.725.4
236.0MWtLHV
1456.012.3
88.9MWtLHV
18028.29.7
14636.010.1
Rectisolsystem
421.22.0
331130.044.3
44834.255.2
Syngas cooler51.3 MWt 6.7
MWt330
130.044.3
Fig. 22. Plant configuration and mass/energy balances for FTb case
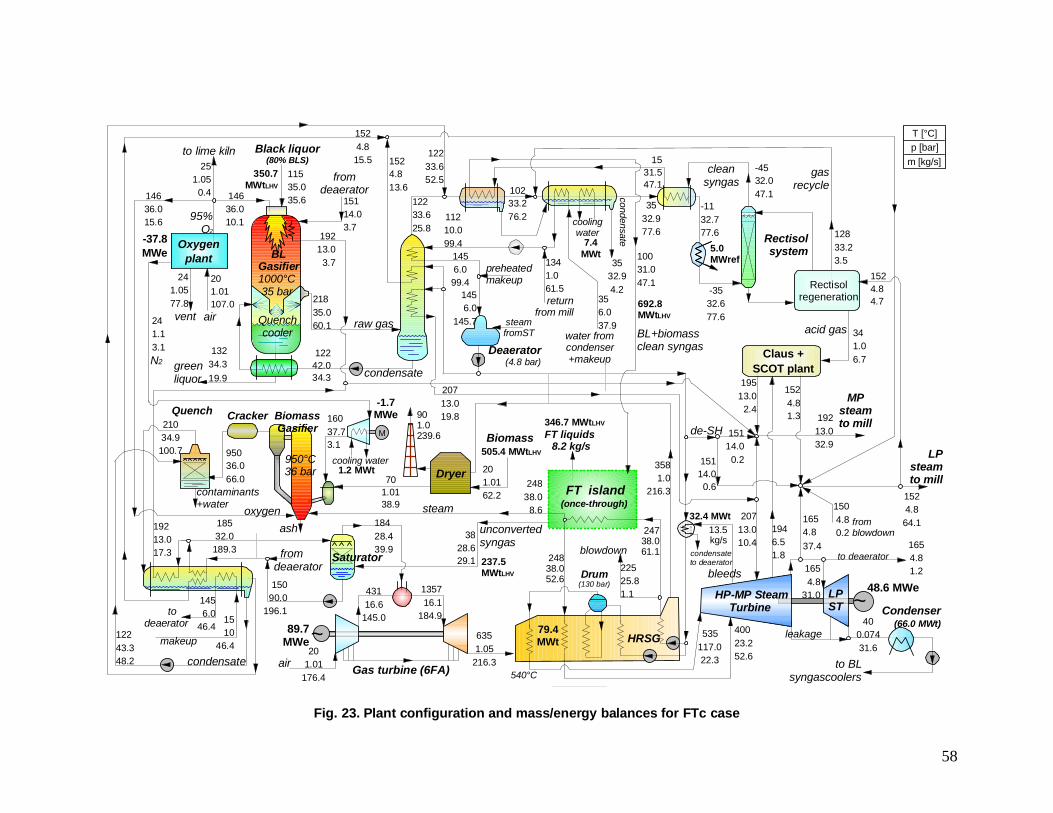
58
greenliquor
Black liquor(80% BLS)
11535.035.6
raw gasQuenchcooler
1000°C35 bar
BLGasifier
condensate
fromdeaerator
12243.348.2
201.01107.0
-37.8MWe
251.05
0.4
air
Oxygenplant
vent
to lime kiln
95%O2
241.0577.8
20713.019.8
1456.099.4
de-SH
steamfromST
18428.439.9
89.7MWe~ 635
1.05216.3
135716.1
184.9
201.01
176.4air
Drum(130 bar)
20713.010.4
LPsteamto mill
1524.864.1
MPsteamto mill192
13.032.9
Claus +SCOT plant
unconvertedsyngas
43116.6
145.0
14636.015.6
3828.629.1
oxygen steam
40023.252.6
535117.022.3
1654.837.4
1946.51.8
19513.0
2.4
1524.81.3
15114.0
0.215114.00.6
HRSG
1504.80.2
fromblowdown
blowdown22525.81.1
540°C
FT island(once-through)
FT liquids 8.2 kg/s
24738.061.1
24838.052.6
350.7MWtLHV
346.7 MWtLHV
237.5MWtLHV
Dryer
901.0239.6
N2
Cracker
ash
950°C36 bar
Biomass
16037.73.1
BiomassGasifier
fromdeaerator
condensate
Quench
contaminants+water
1524.815.5
Saturator
15090.0
196.1
18532.0189.3
24838.0
8.6
201.0162.2
505.4 MWtLHV
3581.0
216.370
1.0138.9
95036.066.0
21034.9100.7
-1.7MWe
~ HP-MP SteamTurbine
bleeds48.6 MWe
13.5kg/s
Condenser (66.0 MWt)
LPST
leakage
to BLsyngascoolers
400.07431.6
to deaerator
cleansyngas
10031.047.1
returnfrom mill
1341.061.5
1510
46.4makeup
692.8MWtLHV
1531.547.1102
33.276.2
3532.94.2
-1132.777.6
-3532.677.6
todeaerator
3532.977.6
water fromcondenser+makeup
356.037.9
preheatedmakeup
1456.0
46.4
241.13.1
1654.81.2
12233.652.5
19213.017.3
32.4 MWt
79.4MWt
condensateto deaerator
Gas turbine (6FA)
1654.8
31.0
coolingwater
condensate7.4MWt
M
cooling water1.2 MWt
11210.099.4
1456.0
145.7
Deaerator (4.8 bar)
acid gas
gasrecycle
Rectisolregeneration
12833.23.5
1524.84.7
-4532.047.1
Rectisolsystem
341.06.7
BL+biomassclean syngas
19213.0
3.7
15114.03.7
12242.034.3
21835.060.1
1524.813.6
13234.319.9
12233.625.8
14636.010.1
5.0MWref
T [°C]
m [kg/s]p [bar]
Fig. 23. Plant configuration and mass/energy balances for FTc case
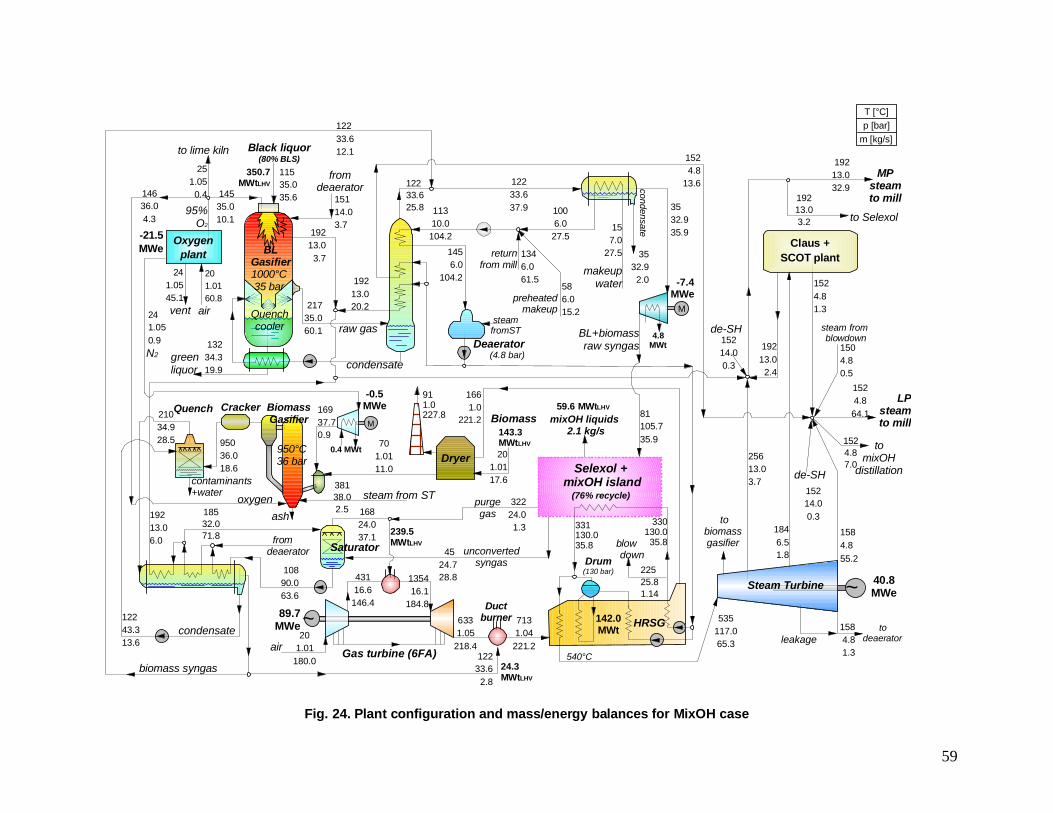
59
19213.03.7
greenliquor
Black liquor(80% BLS)
15114.03.7
11535.035.6
raw gasQuenchcooler
1000°C35 bar
BLGasifier
condensate
fromdeaerator
12243.313.6
21735.060.1
201.0160.8
-21.5MWe
14535.010.1
251.050.4
air
Oxygenplant
vent
to lime kiln
95%O2
241.0545.1
19213.020.2
1524.8
13.612233.625.8
de-SHsteamfromST
16824.037.1
89.7MWe~ 633
1.05218.4
135416.1
184.8
201.01
180.0air
Drum(130 bar)
25613.03.7
LPsteamto mill
1524.864.1
MPsteamto mill
19213.02.4
13234.319.9
unconvertedsyngas
43116.6146.4
14636.04.3
oxygen steam from ST
535117.065.3
1584.855.2
19213.03.2
19213.032.9
1524.81.3
15214.00.3
1504.80.5
HRSG
steam fromblowdown
blow down
22525.81.14
540°C
Selexol +mixOH island
(76% recycle)
mixOH liquids 2.1 kg/s
330130.035.8
331130.035.8
350.7MWtLHV
59.6 MWtLHV
T [°C]
m [kg/s]p [bar]
239.5MWtLHV
Dryer
911.0227.8
N2
Cracker
ash
950°C36 bar
Biomass16937.70.9
BiomassGasifier
fromdeaerator
condensate
Quench
contaminants+water
10890.063.6
18532.071.8
38138.02.5
201.0117.6
143.3MWtLHV
1661.0
221.2
701.0111.0
95036.018.6
21034.928.5
-0.5MWe
~Steam Turbine 40.8MWe
leakageto
deaerator
Claus +SCOT plant
BL+biomassraw syngas
returnfrom mill
1346.061.5
3532.935.9
makeupwater
241.050.9
1524.87.0
12233.612.1
19213.06.0
142.0MWt
Gas turbine (6FA)
1584.81.3
M
0.4 MWt
11310.0104.2
Deaerator (4.8 bar)
1006.027.5
biomass syngas
81105.735.9
4524.728.8
32224.01.3
tobiomassgasifier
purgegas
preheatedmakeup
1456.0
104.2586.015.2
Ductburner 713
1.04221.2
12233.62.8
de-SH
to Selexol
15214.00.3
3532.92.0
condensate
M
-7.4 MWe
157.0
27.5
12233.637.9
1846.51.8
tomixOH
distillation
4.8MWt
24.3MWtLHV
Saturator
Fig. 24. Plant configuration and mass/energy balances for MixOH case
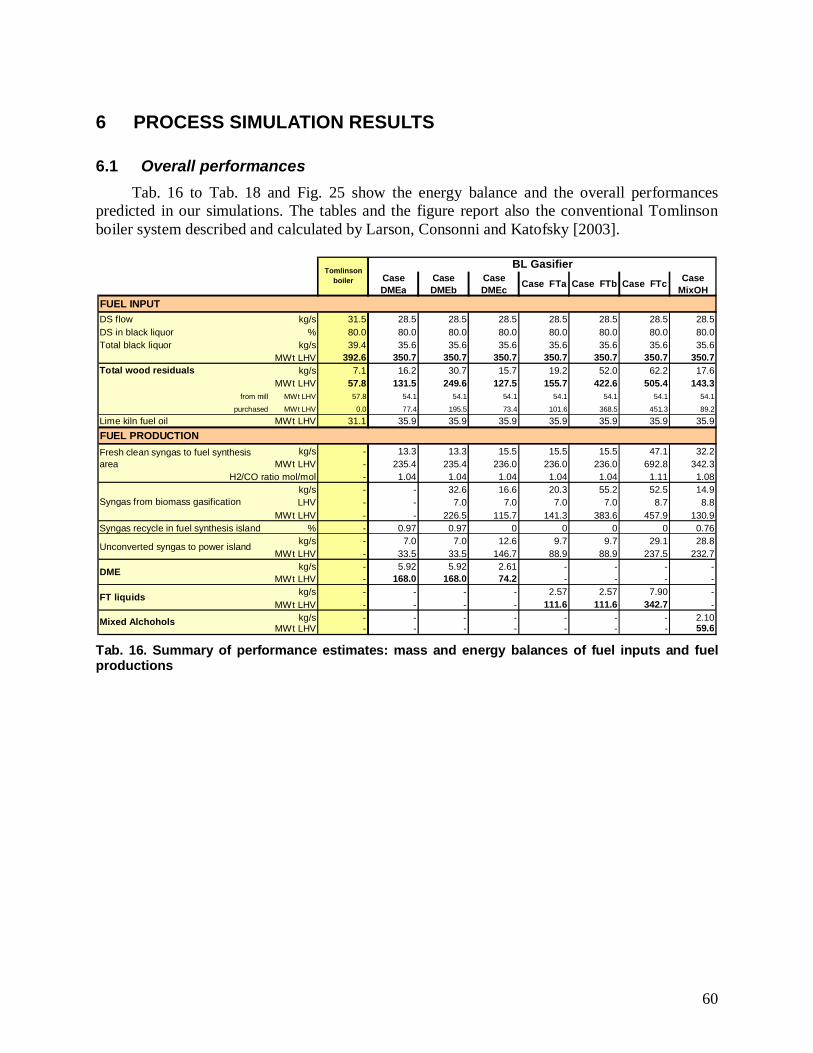
60
6 PROCESS SIMULATION RESULTS
6.1 Overall performances Tab. 16 to Tab. 18 and Fig. 25 show the energy balance and the overall performances
predicted in our simulations. The tables and the figure report also the conventional Tomlinsonboiler system described and calculated by Larson, Consonni and Katofsky [2003].
CaseDMEa
CaseDMEb
CaseDMEc Case FTa Case FTb Case FTc Case
MixOHFUEL INPUTDS flow kg/s 31.5 28.5 28.5 28.5 28.5 28.5 28.5 28.5DS in black liquor % 80.0 80.0 80.0 80.0 80.0 80.0 80.0 80.0Total black liquor kg/s 39.4 35.6 35.6 35.6 35.6 35.6 35.6 35.6
MWt LHV 392.6 350.7 350.7 350.7 350.7 350.7 350.7 350.7Total wood residuals kg/s 7.1 16.2 30.7 15.7 19.2 52.0 62.2 17.6
MWt LHV 57.8 131.5 249.6 127.5 155.7 422.6 505.4 143.3from mill MWt LHV 57.8 54.1 54.1 54.1 54.1 54.1 54.1 54.1
purchased MWt LHV 0.0 77.4 195.5 73.4 101.6 368.5 451.3 89.2
Lime kiln fuel oil MWt LHV 31.1 35.9 35.9 35.9 35.9 35.9 35.9 35.9FUEL PRODUCTION
kg/s - 13.3 13.3 15.5 15.5 15.5 47.1 32.2MWt LHV - 235.4 235.4 236.0 236.0 236.0 692.8 342.3
H2/CO ratio mol/mol - 1.04 1.04 1.04 1.04 1.04 1.11 1.08kg/s - - 32.6 16.6 20.3 55.2 52.5 14.9LHV - - 7.0 7.0 7.0 7.0 8.7 8.8
MWt LHV - - 226.5 115.7 141.3 383.6 457.9 130.9Syngas recycle in fuel synthesis island % - 0.97 0.97 0 0 0 0 0.76
kg/s - 7.0 7.0 12.6 9.7 9.7 29.1 28.8MWt LHV - 33.5 33.5 146.7 88.9 88.9 237.5 232.7
kg/s - 5.92 5.92 2.61 - - - -MWt LHV - 168.0 168.0 74.2 - - - -
kg/s - - - - 2.57 2.57 7.90 -MWt LHV - - - - 111.6 111.6 342.7 -
kg/s - - - - - - - 2.10MWt LHV - - - - - - - 59.6
BL GasifierTomlinson
boiler
Unconverted syngas to power island
DME
Mixed Alchohols
Syngas from biomass gasification
FT liquids
Fresh clean syngas to fuel synthesisarea
Tab. 16. Summary of performance estimates: mass and energy balances of fuel inputs and fuelproductions
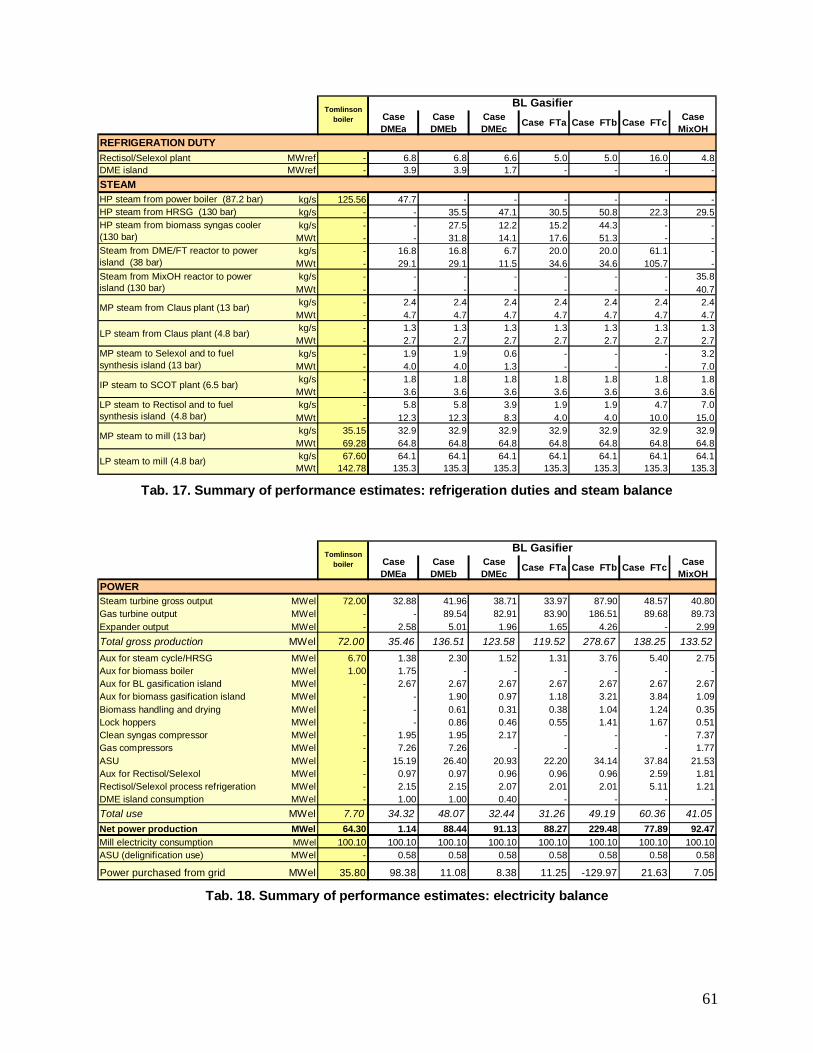
61
CaseDMEa
CaseDMEb
CaseDMEc Case FTa Case FTb Case FTc Case
MixOHREFRIGERATION DUTYRectisol/Selexol plant MWref - 6.8 6.8 6.6 5.0 5.0 16.0 4.8DME island MWref - 3.9 3.9 1.7 - - - -STEAMHP steam from power boiler (87.2 bar) kg/s 125.56 47.7 - - - - - -HP steam from HRSG (130 bar) kg/s - - 35.5 47.1 30.5 50.8 22.3 29.5
kg/s - - 27.5 12.2 15.2 44.3 - -MWt - - 31.8 14.1 17.6 51.3 - -kg/s - 16.8 16.8 6.7 20.0 20.0 61.1 -
MWt - 29.1 29.1 11.5 34.6 34.6 105.7 -kg/s - - - - - - - 35.8
MWt - - - - - - - 40.7kg/s - 2.4 2.4 2.4 2.4 2.4 2.4 2.4
MWt - 4.7 4.7 4.7 4.7 4.7 4.7 4.7kg/s - 1.3 1.3 1.3 1.3 1.3 1.3 1.3
MWt - 2.7 2.7 2.7 2.7 2.7 2.7 2.7kg/s - 1.9 1.9 0.6 - - - 3.2
MWt - 4.0 4.0 1.3 - - - 7.0kg/s - 1.8 1.8 1.8 1.8 1.8 1.8 1.8
MWt - 3.6 3.6 3.6 3.6 3.6 3.6 3.6kg/s - 5.8 5.8 3.9 1.9 1.9 4.7 7.0
MWt - 12.3 12.3 8.3 4.0 4.0 10.0 15.0kg/s 35.15 32.9 32.9 32.9 32.9 32.9 32.9 32.9
MWt 69.28 64.8 64.8 64.8 64.8 64.8 64.8 64.8kg/s 67.60 64.1 64.1 64.1 64.1 64.1 64.1 64.1
MWt 142.78 135.3 135.3 135.3 135.3 135.3 135.3 135.3
BL GasifierTomlinson
boiler
LP steam to Rectisol and to fuelsynthesis island (4.8 bar)
HP steam from biomass syngas cooler(130 bar)
MP steam to Selexol and to fuelsynthesis island (13 bar)
Steam from DME/FT reactor to powerisland (38 bar)
LP steam to mill (4.8 bar)
MP steam from Claus plant (13 bar)
LP steam from Claus plant (4.8 bar)
IP steam to SCOT plant (6.5 bar)
MP steam to mill (13 bar)
Steam from MixOH reactor to powerisland (130 bar)
Tab. 17. Summary of performance estimates: refrigeration duties and steam balance
CaseDMEa
CaseDMEb
CaseDMEc Case FTa Case FTb Case FTc Case
MixOHPOWERSteam turbine gross output MWel 72.00 32.88 41.96 38.71 33.97 87.90 48.57 40.80Gas turbine output MWel - - 89.54 82.91 83.90 186.51 89.68 89.73Expander output MWel - 2.58 5.01 1.96 1.65 4.26 - 2.99Total gross production MWel 72.00 35.46 136.51 123.58 119.52 278.67 138.25 133.52Aux for steam cycle/HRSG MWel 6.70 1.38 2.30 1.52 1.31 3.76 5.40 2.75Aux for biomass boiler MWel 1.00 1.75 - - - - - -Aux for BL gasification island MWel - 2.67 2.67 2.67 2.67 2.67 2.67 2.67Aux for biomass gasification island MWel - - 1.90 0.97 1.18 3.21 3.84 1.09Biomass handling and drying MWel - - 0.61 0.31 0.38 1.04 1.24 0.35Lock hoppers MWel - - 0.86 0.46 0.55 1.41 1.67 0.51Clean syngas compressor MWel - 1.95 1.95 2.17 - - - 7.37Gas compressors MWel - 7.26 7.26 - - - - 1.77ASU MWel - 15.19 26.40 20.93 22.20 34.14 37.84 21.53Aux for Rectisol/Selexol MWel - 0.97 0.97 0.96 0.96 0.96 2.59 1.81Rectisol/Selexol process refrigeration MWel - 2.15 2.15 2.07 2.01 2.01 5.11 1.21DME island consumption MWel - 1.00 1.00 0.40 - - - -Total use MWel 7.70 34.32 48.07 32.44 31.26 49.19 60.36 41.05Net power production MWel 64.30 1.14 88.44 91.13 88.27 229.48 77.89 92.47Mill electricity consumption MWel 100.10 100.10 100.10 100.10 100.10 100.10 100.10 100.10ASU (delignification use) MWel - 0.58 0.58 0.58 0.58 0.58 0.58 0.58
Power purchased from grid MWel 35.80 98.38 11.08 8.38 11.25 -129.97 21.63 7.05
BL GasifierTomlinson
boiler
Tab. 18. Summary of performance estimates: electricity balance
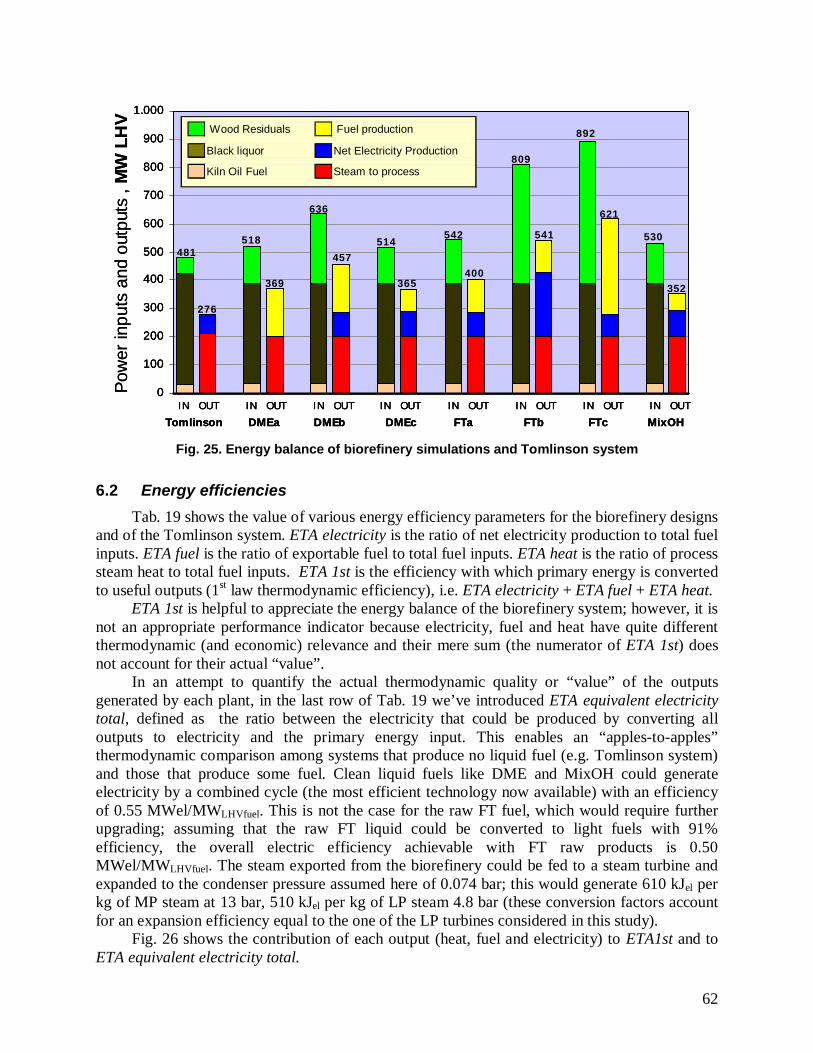
62
Pow
erin
puts
and
outp
uts
,MW
LH
V
0
100
200
300
400
500
600
700
800
900
1.000
Tomlinson DMEa DMEb DMEc FTa FTb FTc MixOHIN OUT IN OUT IN OUT IN OUT IN OUT IN OUT IN OUT IN OUT
Wood Residuals Fuel production
Black liquor Net Electricity Production
Kiln Oil Fuel Steam to process
481
276
518
369
636
457514
365
542
400
809
541 530
892
621
352
Fig. 25. Energy balance of biorefinery simulations and Tomlinson system
6.2 Energy efficiencies Tab. 19 shows the value of various energy efficiency parameters for the biorefinery designs
and of the Tomlinson system. ETA electricity is the ratio of net electricity production to total fuelinputs. ETA fuel is the ratio of exportable fuel to total fuel inputs. ETA heat is the ratio of processsteam heat to total fuel inputs. ETA 1st is the efficiency with which primary energy is convertedto useful outputs (1st law thermodynamic efficiency), i.e. ETA electricity + ETA fuel + ETA heat.
ETA 1st is helpful to appreciate the energy balance of the biorefinery system; however, it isnot an appropriate performance indicator because electricity, fuel and heat have quite differentthermodynamic (and economic) relevance and their mere sum (the numerator of ETA 1st) doesnot account for their actual “value”.
In an attempt to quantify the actual thermodynamic quality or “value” of the outputsgenerated by each plant, in the last row of Tab. 19 we’ve introduced ETA equivalent electricitytotal, defined as the ratio between the electricity that could be produced by converting alloutputs to electricity and the primary energy input. This enables an “apples-to-apples”thermodynamic comparison among systems that produce no liquid fuel (e.g. Tomlinson system)and those that produce some fuel. Clean liquid fuels like DME and MixOH could generateelectricity by a combined cycle (the most efficient technology now available) with an efficiencyof 0.55 MWel/MWLHVfuel. This is not the case for the raw FT fuel, which would require furtherupgrading; assuming that the raw FT liquid could be converted to light fuels with 91%efficiency, the overall electric efficiency achievable with FT raw products is 0.50MWel/MWLHVfuel. The steam exported from the biorefinery could be fed to a steam turbine andexpanded to the condenser pressure assumed here of 0.074 bar; this would generate 610 kJel perkg of MP steam at 13 bar, 510 kJel per kg of LP steam 4.8 bar (these conversion factors accountfor an expansion efficiency equal to the one of the LP turbines considered in this study).
Fig. 26 shows the contribution of each output (heat, fuel and electricity) to ETA1st and toETA equivalent electricity total.
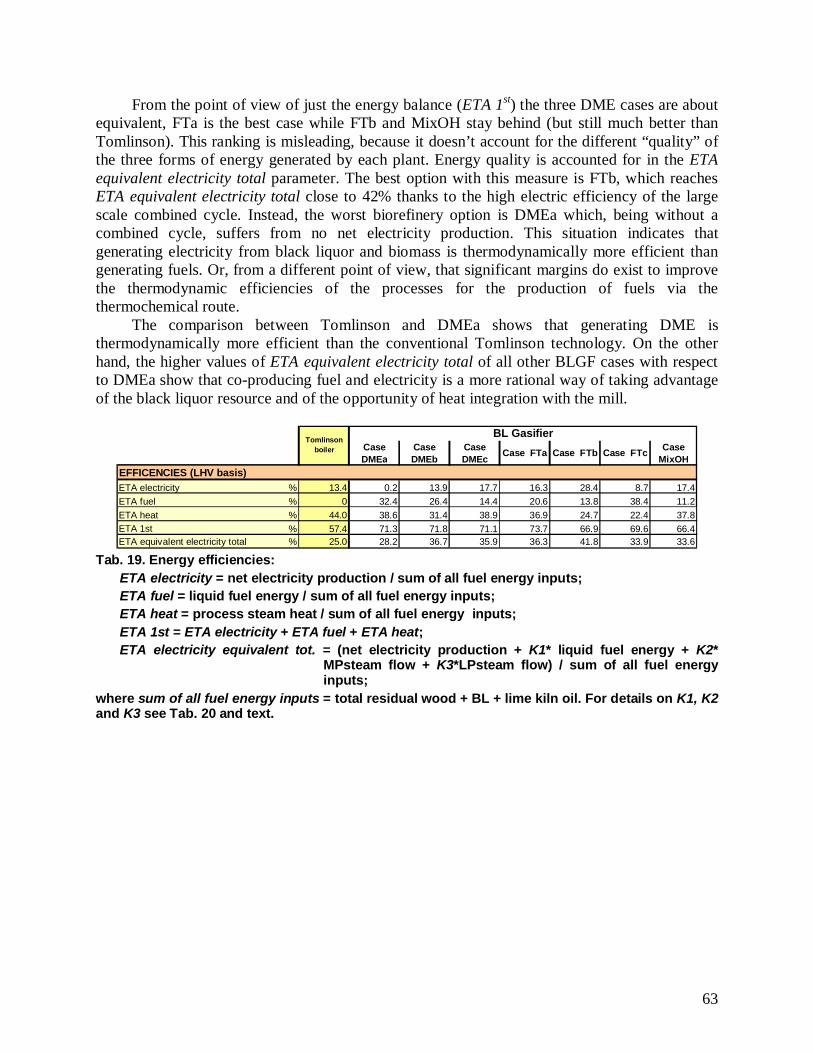
63
From the point of view of just the energy balance (ETA 1st) the three DME cases are aboutequivalent, FTa is the best case while FTb and MixOH stay behind (but still much better thanTomlinson). This ranking is misleading, because it doesn’t account for the different “quality” ofthe three forms of energy generated by each plant. Energy quality is accounted for in the ETAequivalent electricity total parameter. The best option with this measure is FTb, which reachesETA equivalent electricity total close to 42% thanks to the high electric efficiency of the largescale combined cycle. Instead, the worst biorefinery option is DMEa which, being without acombined cycle, suffers from no net electricity production. This situation indicates thatgenerating electricity from black liquor and biomass is thermodynamically more efficient thangenerating fuels. Or, from a different point of view, that significant margins do exist to improvethe thermodynamic efficiencies of the processes for the production of fuels via thethermochemical route.
The comparison between Tomlinson and DMEa shows that generating DME isthermodynamically more efficient than the conventional Tomlinson technology. On the otherhand, the higher values of ETA equivalent electricity total of all other BLGF cases with respectto DMEa show that co-producing fuel and electricity is a more rational way of taking advantageof the black liquor resource and of the opportunity of heat integration with the mill.
CaseDMEa
CaseDMEb
CaseDMEc Case FTa Case FTb Case FTc Case
MixOHEFFICENCIES (LHV basis)ETA electricity % 13.4 0.2 13.9 17.7 16.3 28.4 8.7 17.4ETA fuel % 0 32.4 26.4 14.4 20.6 13.8 38.4 11.2ETA heat % 44.0 38.6 31.4 38.9 36.9 24.7 22.4 37.8ETA 1st % 57.4 71.3 71.8 71.1 73.7 66.9 69.6 66.4ETA equivalent electricity total % 25.0 28.2 36.7 35.9 36.3 41.8 33.9 33.6
BL GasifierTomlinson
boiler
Tab. 19. Energy efficiencies:ETA electricity = net electricity production / sum of all fuel energy inputs;ETA fuel = liquid fuel energy / sum of all fuel energy inputs;ETA heat = process steam heat / sum of all fuel energy inputs;ETA 1st = ETA electricity + ETA fuel + ETA heat;ETA electricity equivalent tot. = (net electricity production + K1* liquid fuel energy + K2*
MPsteam flow + K3*LPsteam flow) / sum of all fuel energyinputs;
where sum of all fuel energy inputs = total residual wood + BL + lime kiln oil. For details on K1, K2and K3 see Tab. 20 and text.
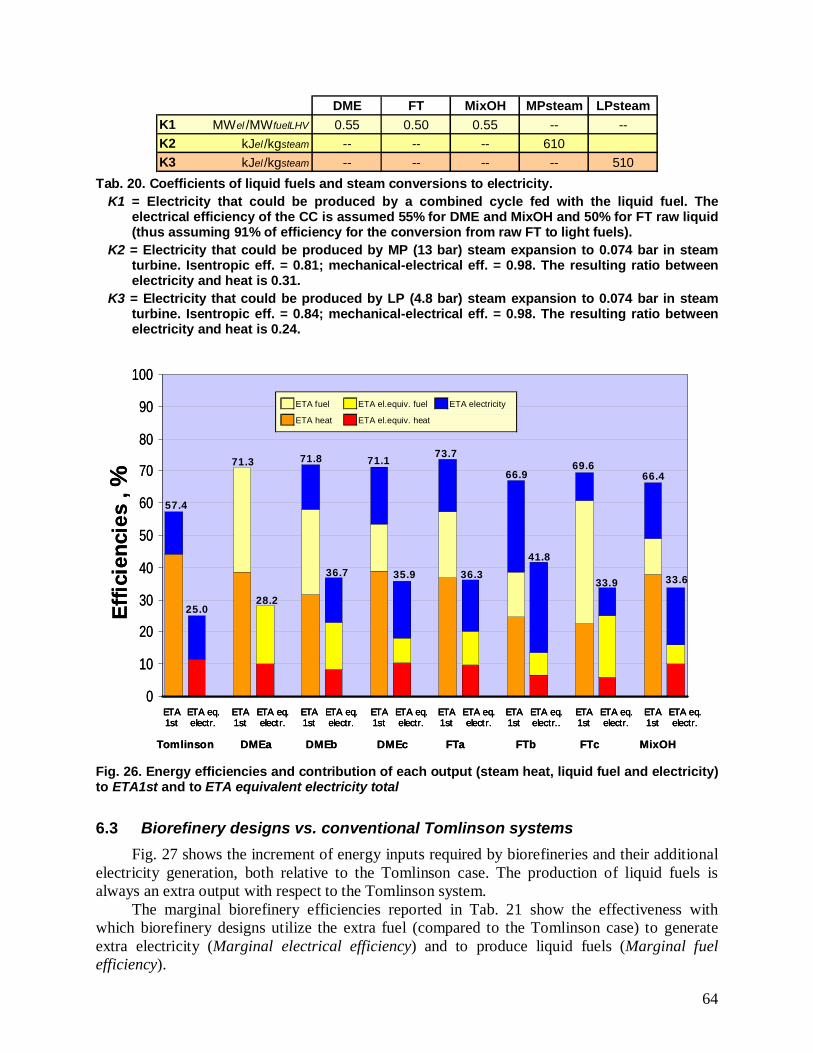
64
DME FT MixOH MPsteam LPsteamK1 MWel /MWfuelLHV 0.55 0.50 0.55 -- --K2 kJel /kgsteam -- -- -- 610K3 kJel /kgsteam -- -- -- -- 510
Tab. 20. Coefficients of liquid fuels and steam conversions to electricity.K1 = Electricity that could be produced by a combined cycle fed with the liquid fuel. The
electrical efficiency of the CC is assumed 55% for DME and MixOH and 50% for FT raw liquid(thus assuming 91% of efficiency for the conversion from raw FT to light fuels).
K2 = Electricity that could be produced by MP (13 bar) steam expansion to 0.074 bar in steamturbine. Isentropic eff. = 0.81; mechanical-electrical eff. = 0.98. The resulting ratio betweenelectricity and heat is 0.31.
K3 = Electricity that could be produced by LP (4.8 bar) steam expansion to 0.074 bar in steamturbine. Isentropic eff. = 0.84; mechanical-electrical eff. = 0.98. The resulting ratio betweenelectricity and heat is 0.24.
Effic
ienc
ies
,%
Tomlinson DMEa DMEb DMEc FTa FTb FTc MixOH
ETA1st
ETA eq.electr.
ETA1st
ETA eq.electr.
ETA1st
ETA eq.electr.
ETA1st
ETA eq.electr.
ETA1st
ETA eq.electr.
ETA1st
ETA eq.electr..
ETA1st
ETA eq.electr.
ETA1st
ETA eq.electr.
0
10
20
30
40
50
60
70
80
90
100
ETA fuel ETA el.equiv. fuel ETA electricity
ETA heat ETA el.equiv. heat
57.4
71.3 71.8 71.173.7
66.969.6
66.4
25.028.2
36.7 35.9 36.3
41.8
33.9 33.6
Effic
ienc
ies
,%
Tomlinson DMEa DMEb DMEc FTa FTb FTc MixOH
ETA1st
ETA eq.electr.
ETA1st
ETA eq.electr.
ETA1st
ETA eq.electr.
ETA1st
ETA eq.electr.
ETA1st
ETA eq.electr.
ETA1st
ETA eq.electr.
ETA1st
ETA eq.electr.
ETA1st
ETA eq.electr.
ETA1st
ETA eq.electr.
ETA1st
ETA eq.electr.
ETA1st
ETA eq.electr..
ETA1st
ETA eq.electr..
ETA1st
ETA eq.electr.
ETA1st
ETA eq.electr.
ETA1st
ETA eq.electr.
ETA1st
ETA eq.electr.
0
10
20
30
40
50
60
70
80
90
100
ETA fuel ETA el.equiv. fuel ETA electricity
ETA heat ETA el.equiv. heat
57.4
71.3 71.8 71.173.7
66.969.6
66.4
25.028.2
36.7 35.9 36.3
41.8
33.9 33.6
Fig. 26. Energy efficiencies and contribution of each output (steam heat, liquid fuel and electricity)to ETA1st and to ETA equivalent electricity total
6.3 Biorefinery designs vs. conventional Tomlinson systems Fig. 27 shows the increment of energy inputs required by biorefineries and their additional
electricity generation, both relative to the Tomlinson case. The production of liquid fuels isalways an extra output with respect to the Tomlinson system.
The marginal biorefinery efficiencies reported in Tab. 21 show the effectiveness withwhich biorefinery designs utilize the extra fuel (compared to the Tomlinson case) to generateextra electricity (Marginal electrical efficiency) and to produce liquid fuels (Marginal fuelefficiency).
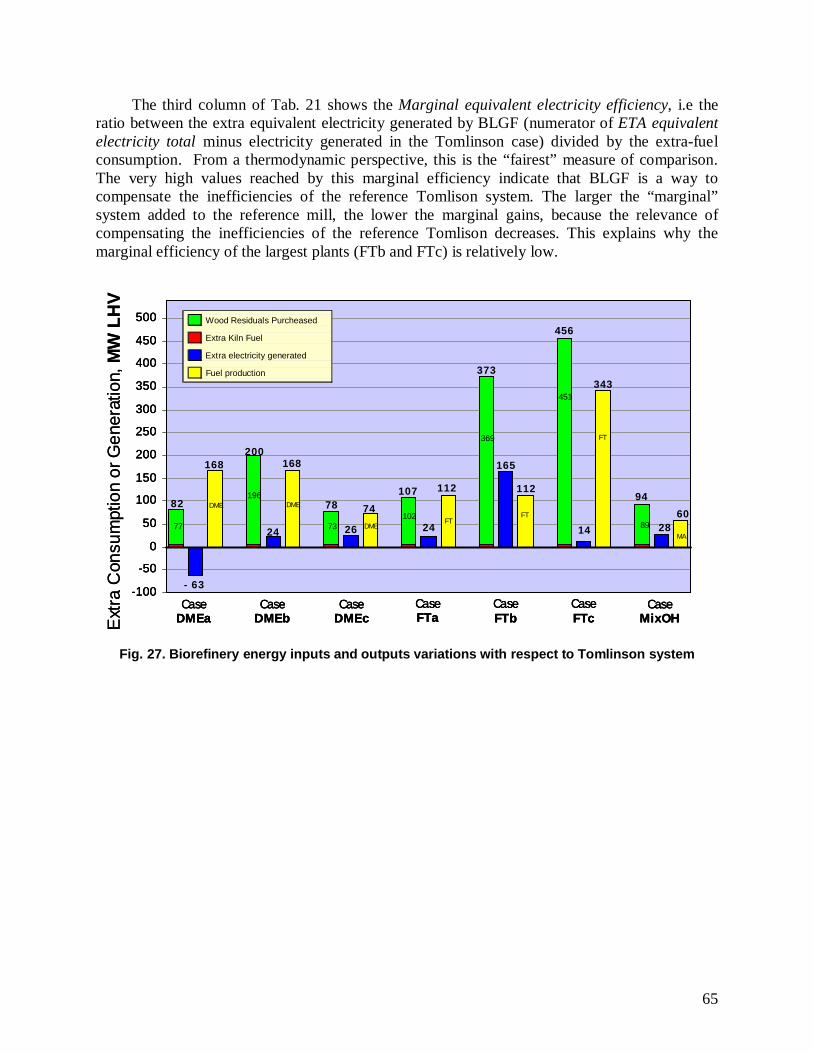
65
The third column of Tab. 21 shows the Marginal equivalent electricity efficiency, i.e theratio between the extra equivalent electricity generated by BLGF (numerator of ETA equivalentelectricity total minus electricity generated in the Tomlinson case) divided by the extra-fuelconsumption. From a thermodynamic perspective, this is the “fairest” measure of comparison.The very high values reached by this marginal efficiency indicate that BLGF is a way tocompensate the inefficiencies of the reference Tomlison system. The larger the “marginal”system added to the reference mill, the lower the marginal gains, because the relevance ofcompensating the inefficiencies of the reference Tomlison decreases. This explains why themarginal efficiency of the largest plants (FTb and FTc) is relatively low.
Ext
raC
onsu
mpt
ion
or G
ener
atio
n,M
W L
HV
-100
-50
0
50
100
150
200
250
300
350
400
450
500 Wood Residuals Purcheased
Extra Kiln Fuel
Extra electricity generated
Fuel production
CaseDMEa
CaseDMEb
CaseDMEc
CaseFTa
CaseFTb
CaseFTc
CaseMixOH
168
DME
- 63
82
168
74
26
78
200
2477 73
196DME
DMEFT
FT
FT
MA
112
24
107
102
369
373
165
112
456
14
343
94
2860
451
89
Fig. 27. Biorefinery energy inputs and outputs variations with respect to Tomlinson system
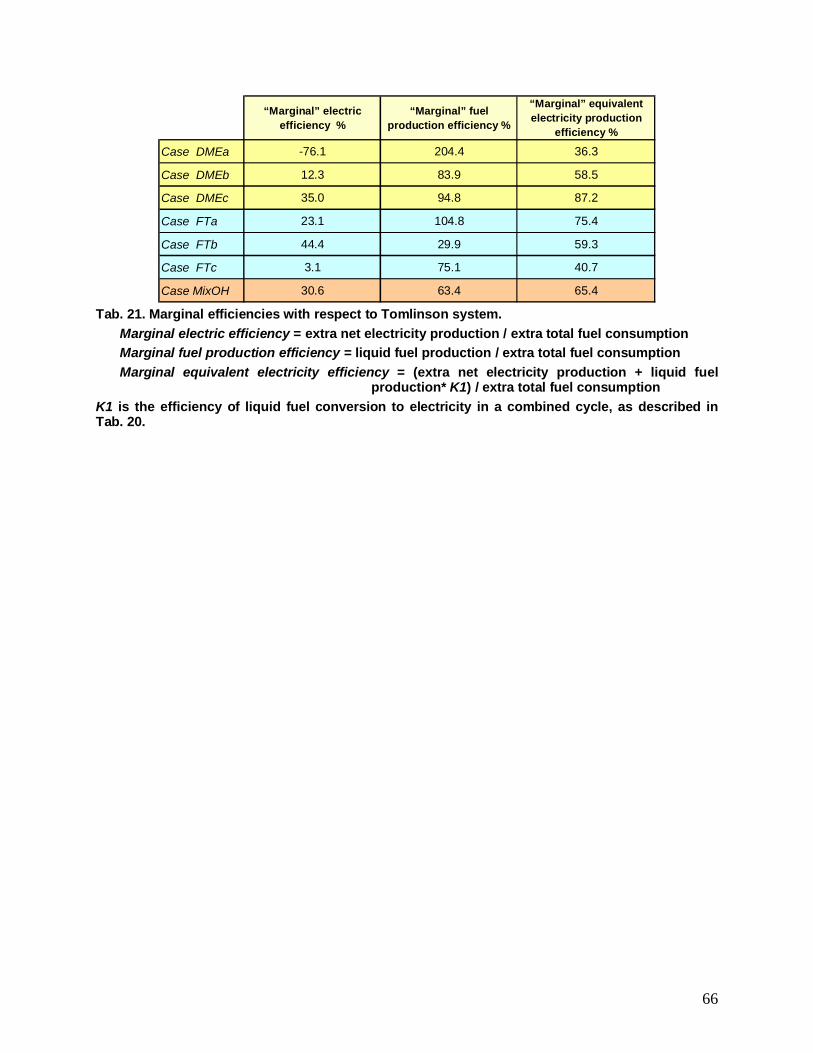
66
“Marginal” electricefficiency %
“Marginal” fuelproduction efficiency %
“Marginal” equivalentelectricity production
efficiency %
Case DMEa -76.1 204.4 36.3
Case DMEb 12.3 83.9 58.5
Case DMEc 35.0 94.8 87.2
Case FTa 23.1 104.8 75.4
Case FTb 44.4 29.9 59.3
Case FTc 3.1 75.1 40.7
Case MixOH 30.6 63.4 65.4
Tab. 21. Marginal efficiencies with respect to Tomlinson system.Marginal electric efficiency = extra net electricity production / extra total fuel consumptionMarginal fuel production efficiency = liquid fuel production / extra total fuel consumptionMarginal equivalent electricity efficiency = (extra net electricity production + liquid fuel
production* K1) / extra total fuel consumptionK1 is the efficiency of liquid fuel conversion to electricity in a combined cycle, as described inTab. 20.
67
7 REFERENCES
Aden A., Spath P., Atherton B., 2005. “The Potential of Thermochemical Ethanol Via MixedAlcohols Production”, Milestone Completion Report, National Renewable EnergyLaboratory (NREL), October 31
Bechtel, 1998. “Aspen Process Flowsheet Simulation Model of a Battelle Biomass-BasedGasification, Fischer-Tropsch Liquefaction and Combined-Cycle Power Plant”, DE-AC22-93PC91029-16, May, US Dept. of Energy, Pittsburgh, Pennsylvania.
Blackadder W.H., Lundberg H., Rensfelt E., and Waldheim L., 1994. “Heat and PowerProduction via Gasification in the Range 5 50 MWe,” in Advanced In BiomassThermochemical Conversion, A.V. Bridgwater (ed.), Balckie Academic & ProfessionalPress, London.
Brammer J.G. and Bridgwater A.V., 1999. “Drying technologies for an integrated gasifcationbio-energy plant”, Renewable and Sustainable Energy Reviews, 3: 243-289
Bridgwater A.V., 1995. “The technical and economic feasibility of biomass gasi cation for powergeneration”, Fuel 74(5):631–53.
Celik, F.E., Larson, E.D. and Williams, R.H. “Transportation fuels from coal with low CO2emissions,” paper presented at the 7th International Conference on Greenhouse GasControl Technologies, Vancouver, BC, 5-9 September, 2004.
Consonni S. and Larson E.D., 1998. “Biomass-Gasifier/Aeroderivative Gas Turbine CombinedCycle: Part A – Techonologies and Performance Modeling, and Part B – PerformanceCalculations and Economic Assessment”, J. of Engineering for Gas Turbines and Power,118: 507-525.
Cummer K. and Brown R., 2002. “Ancillary equipment for biomass gasification”, Biomass andBioenergy, 23: 113-128
Dayton D., 2002. “A Review of the Literature on Catalytic Biomass Tar Destruction”,NREL/TP-510-32815, National Renewable Energy Laboratory (NREL), December
Devi L., Ptasinski K. and Janssen F., 2003. “A review of the primary measures for tarelimination in biomass gasification processes”, Biomass and Bioenergy 24:125 – 140
Dry M.E., 2002. ”The Fischer–Tropsch process: 1950–2000”, Catalysis Today 71:227–241
Ekbom T., Lindblom M., Berglin N. and Ahlvik P., 2003. “Technical and CommercialFeasibility Study of Black Liquor Gasification with Methanol/DME Production as MotorFuels for Automotive Uses – BLGMF”
Fox J.M. and Tam S.S., 1995. “Correlation of slurry reactor Fischer–Tropsch yield data”, Topicsin Catalysis, 2:285-300
68
Graaf G.H., Winkelman J.G.M., and Stamhuis E.J., 1988. ‘‘Kinetics of three-phase methanolsynthesis’’, Chemical Engineering Science, 43 (8), pp. 2161-2168.
Graaf G.H., and Beenackers A.A.C.M., 1996. ‘‘Comparison of two-phase and three-phasemethanol synthesis processes’’, Chemical Engineering and Processing, 35, pp. 413-427.
Gunturu A.K., Kugler E.L., Cropley J.B. and Dadyburjor D.B., 1998. “A Kinetic Model for theSynthesis of High-Molecular-Weight Alcohols over a Sulfided Co-K-Mo/C Catalyst”, Ind.Eng. Chem. Res. 37: 2107-2115
Hamelinck C. Faaij A., den Uil H. and Boerrigter H., 2004. “Production of FT transportationfuels from biomass; technical options, process analysis and optimisation, and developmentpotential”, Energy 29:1743–1771
Larson E.D. and Tingjin R., 2003. “Synthetic fuel production by indirect coal liquefaction”,Energy for Sustainable Development, Volume VII No. 4
Larson, E.D., Consonni, S., and Katofsky, R.E., 2003. “A Cost-Benefit Assessment of BiomassGasification Power Generation in the Pulp and Paper Industry, Final Report” final report,Princeton Environmental Institute, Princeton, NJ, October.
Larson, E.D., Kreutz, T.G. and Consonni, S., 1999. “Combined Biomass and Black LiquorGasifier/Gas Turbine Cogeneration at Pulp and Paper Mills,” J. of Engineering for GasTurbines and Power, 121: 394-400.
Lau F.S., Bowen D.A., Dihu R., Doong S., Hughes E.E., Remick, R., Slimane R., Turn S.Q., andZabransky R., 2003. “Techno-Economic Analysis of Hydrogen Production by Gasificationof Biomass”, Gas Technology Institute (GTI), contract DE-FC36-01GO11089 for DOE,June
Lau F.S., Carty R.H., Onischak M., and Bain R.L., 1993. “Development of the IGT RenugasProcess,” Conference on Strategic Benefits of Biomass and Waste Fuels, Electric PowerResearch Institute, Washington, DC, 30 March – 1 April, 1993.
Liu Z., Li X., Close M.R., Kugler E.L., Peterson J.L., Dadyburjor D.B., 1997. Ind. Eng. Chem.Res., 36, 3085-3093
Milne T.A., Evans R.J. and Abatzoglou N., 1998. “Biomass gasifier “Tars”: Their Nature,Formation and Conversion”, NREL/TP-570-25357, National Renewable EnergyLaboratory, November
Ng K.L., Chadwick D., and Toseland B.A., 1999. ‘‘Kinetics and modeling of dimethyl ethersynthesis from synthesis gas’’, Chemical Engineering Science, 54, pp. 3587-3592. ContractDE-AC26-99FT40675 for US DOE by Research Triangle Institute, Research Triangle
Pan Y.G., Roca X., Velo E., Puigjaner L., 1999. “Removal of tar by secondary air injection inIuidized bed gasification of residual biomass and coal”, Fuel; 78:1703–9.
Ranke, G. and Weiss, H., “Separation of Gaseous Components from a Gaseous Mixture byPhysical Scrubbing”, United States patent 4,324,567, 1982
69
Riesenfeld F.C., Kohl, A., “Gas Purification”, II Edition, Gulf Publishing Company, 1974
Simell P., Kurkela, E., Stahlberg P. and Hepola, J., 1996. “Catalytic hot gas cleaning ofgasification gas.” Catalysis Today 27(1-2), 55-62.
Spath P.L., Dyton D.C., 2003. “Preliminary Screening — Technical and Economic Assessmentof Synthesis Gas to Fuels and Chemicals with Emphasis on the Potential for Biomass-Derived Syngas”, NREL/TP-510-34929, National Renewable Energy Laboratory (NREL),December
SRI Consulting, 2002. “Dimethyl ether as alternate fuel”, Report No. 245, June
The Rectisol Process for Gas Purification, Lurgi Engineering Oel-Gas-Chemie, brochureavailable @ http://www.lurgi.com
Tijmensen M., Faaij A., Hamelinck C. and van Hardeveld M., 2002. “Exploration of thepossibilities for production of Fischer Tropsch liquids and power via biomass gasification”,Biomass and Bioenergy 23:129 – 152
U.S. Department of Energy, 1998. “Baseline Design/Economics for Advanced Fischer-TropschTechnology, Final report”, April
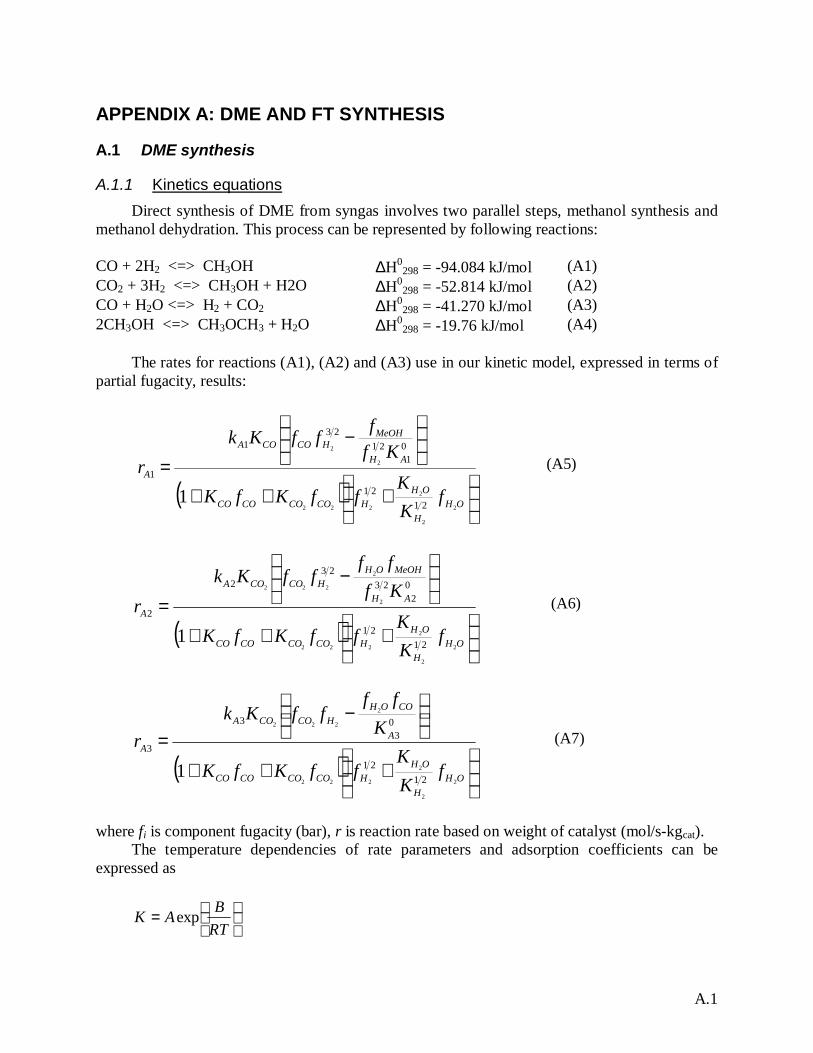
A.1
APPENDIX A: DME AND FT SYNTHESIS
A.1 DME synthesis
A.1.1 Kinetics equationsDirect synthesis of DME from syngas involves two parallel steps, methanol synthesis and
methanol dehydration. This process can be represented by following reactions:
CO + 2H2 <=> CH3OH ∆H0298 = -94.084 kJ/mol (A1)
CO2 + 3H2 <=> CH3OH + H2O ∆H0298 = -52.814 kJ/mol (A2)
CO + H2O <=> H2 + CO2 ∆H0298 = -41.270 kJ/mol (A3)
2CH3OH <=> CH3OCH3 + H2O ∆H0298 = -19.76 kJ/mol (A4)
The rates for reactions (A1), (A2) and (A3) use in our kinetic model, expressed in terms ofpartial fugacity, results:
( )
+++
−
=
OHH
OHHCOCOCOCO
AH
MeOHHCOCOA
A
fKK
ffKfK
KffffKk
r
2
2
2
222
2
2
2121
01
2123
1
1
1
(A5)
( )
+++
−
=
OHH
OHHCOCOCOCO
AH
MeOHOHHCOCOA
A
fKK
ffKfK
Kfff
ffKkr
2
2
2
222
2
2
222
2121
02
2323
2
2
1
(A6)
( )
+++
−
=
OHH
OHHCOCOCOCO
A
COOHHCOCOA
A
fKK
ffKfK
Kff
ffKkr
2
2
2
222
2
222
2121
03
3
3
1
(A7)
where fi is component fugacity (bar), r is reaction rate based on weight of catalyst (mol/s-kgcat).The temperature dependencies of rate parameters and adsorption coefficients can be
expressed as
=
RTBAK exp
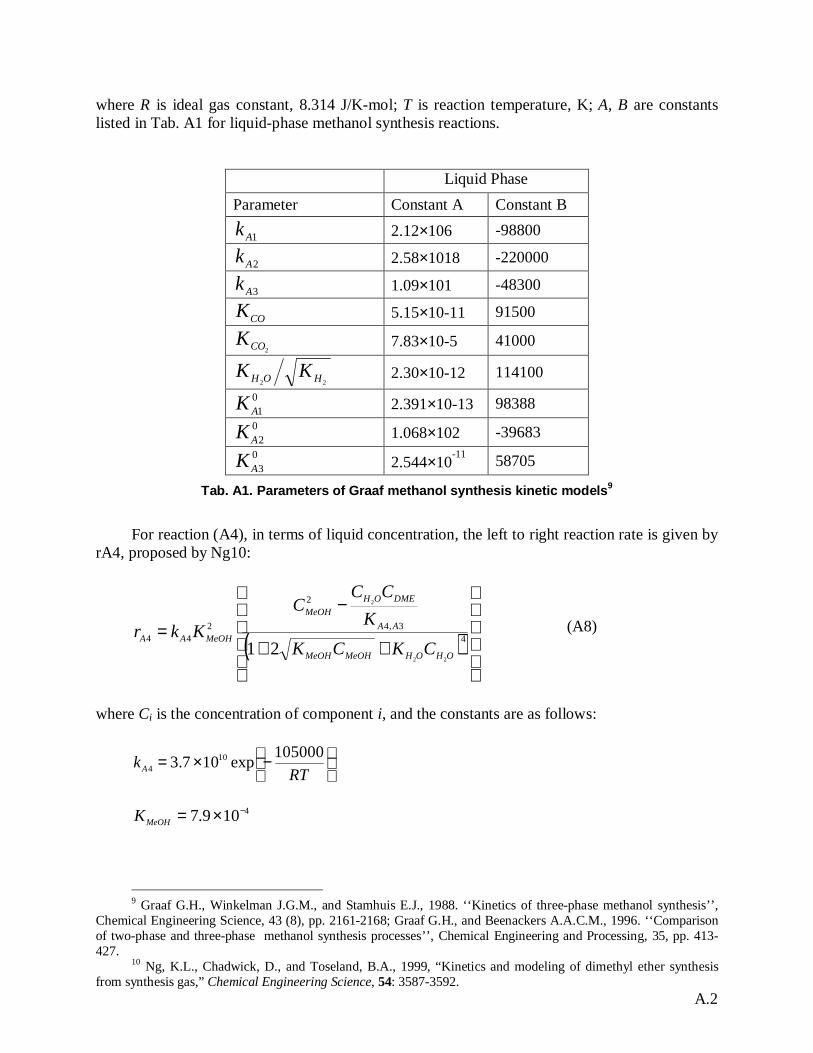
A.2
where R is ideal gas constant, 8.314 J/K-mol; T is reaction temperature, K; A, B are constantslisted in Tab. A1 for liquid-phase methanol synthesis reactions.
Liquid PhaseParameter Constant A Constant B
1Ak 2.12×10⁶ -98800
2Ak 2.58×10¹⁸ -220000
3Ak 1.09×101 -48300
COK 5.15×10⁻¹¹ 91500
2COK 7.83×10⁻⁵ 41000
22 HOH KK 2.30×10⁻¹² 11410001AK 2.391×10⁻¹³ 98388
02AK 1.068×10² -39683
03AK 2.544×10⁻¹¹ 58705
Tab. A1. Parameters of Graaf methanol synthesis kinetic models9
For reaction (A4), in terms of liquid concentration, the left to right reaction rate is given byrA4, proposed by Ng10:
( )
++
−= 4
3,4
2
244
22
2
21 OHOHMeOHMeOH
AA
DMEOHMeOH
MeOHAACKCK
KCC
CKkr (A8)
where Ci is the concentration of component i, and the constants are as follows:
−×=
RTkA
105000exp107.3 104
4109.7 −×=MeOHK
9 Graaf G.H., Winkelman J.G.M., and Stamhuis E.J., 1988. ‘‘Kinetics of three-phase methanol synthesis’’,Chemical Engineering Science, 43 (8), pp. 2161-2168; Graaf G.H., and Beenackers A.A.C.M., 1996. ‘‘Comparisonof two-phase and three-phase methanol synthesis processes’’, Chemical Engineering and Processing, 35, pp. 413-427.
10 Ng, K.L., Chadwick, D., and Toseland, B.A., 1999, “Kinetics and modeling of dimethyl ether synthesisfrom synthesis gas,” Chemical Engineering Science, 54: 3587-3592.
A.3
KA4,A3 is the equilibrium constant expressed in terms of concentration. We have assumed the fixvalue11 of 8.571.
A.1.2 Reactor modelPerformance of the reactor is defined by the following material and energy balances:
, ,( ) ( / )in outi i L comp G i i L iF F k i V P H cα− = −
, , , ,( ) ( / ) ( / )L comp G i i L i s s G i i L ik i V P H c k C H Cα α− = −
, , ,( / )s s G i i L i cata i jk C H C W rα − = ∑
If include the factors of mass transfer into reaction rates, the above model can be simplifiedas:
,in out
i i cata i jF F W r− = ∑
where ,i jr stands for the reaction rates of component i in reaction j. The totalconsumption/formation rates of components considered in the DME reaction are as follows:
4
432
32
321
31
421
2
2
232
2
ADME
AAAOH
AACO
AAAH
AACO
AAAMeOH
rrrrrr
rrr
rrrrrrr
rrrr
=
++=
−−=
−−−=+−=
−+=
in which rA1, rA2, rA3 and rA4 are defined by equations (A5), (A6), (A7), and (A8).
A.1.3 Comparisons with experiment resultsIn order to test this kinetic model, comparisons with experimental results were made.
Experimental data are from Gogate and Lee12. The properties of the catalysts used in it that workare listed in Tab. A2. Tab. A3 shows the operating conditions considered. Tab. A4 shows acomparison of experimental results with predictions using our model for three different ratios of
11 Seidel, A., 1990, “Calculating chemical reaction equilibrium for a homogeneous phase from the material balanceof a batch reactor,” Chemical Engineering Science, 45(9): 2970-2973.
12 Gogate, M.R., and Vijayaraghavan, P., 1992. ‘‘A single-stage, liquid-phase dimethyl ether synthesis process fromsyngas: thermodynamic analysis of the LPDME process system’’, Fuel Science and Technology International, 10(3), pp. 281-311.
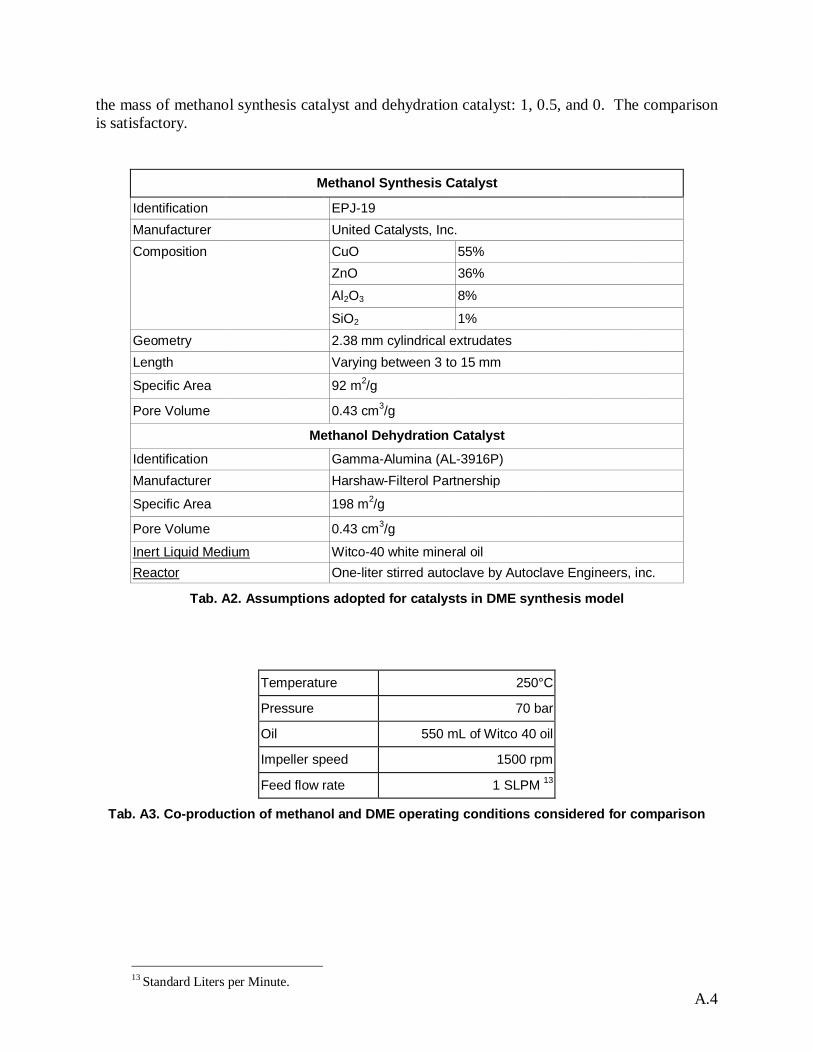
A.4
the mass of methanol synthesis catalyst and dehydration catalyst: 1, 0.5, and 0. The comparisonis satisfactory.
Methanol Synthesis Catalyst
Identification EPJ-19Manufacturer United Catalysts, Inc.Composition CuO 55%
ZnO 36%
Al2O3 8%
SiO2 1%Geometry 2.38 mm cylindrical extrudatesLength Varying between 3 to 15 mm
Specific Area 92 m2/g
Pore Volume 0.43 cm3/g
Methanol Dehydration Catalyst
Identification Gamma-Alumina (AL-3916P)Manufacturer Harshaw-Filterol Partnership
Specific Area 198 m2/g
Pore Volume 0.43 cm3/g
Inert Liquid Medium Witco-40 white mineral oilReactor One-liter stirred autoclave by Autoclave Engineers, inc.
Tab. A2. Assumptions adopted for catalysts in DME synthesis model
Temperature 250°C
Pressure 70 bar
Oil 550 mL of Witco 40 oil
Impeller speed 1500 rpm
Feed flow rate 1 SLPM 13
Tab. A3. Co-production of methanol and DME operating conditions considered for comparison
13 Standard Liters per Minute.
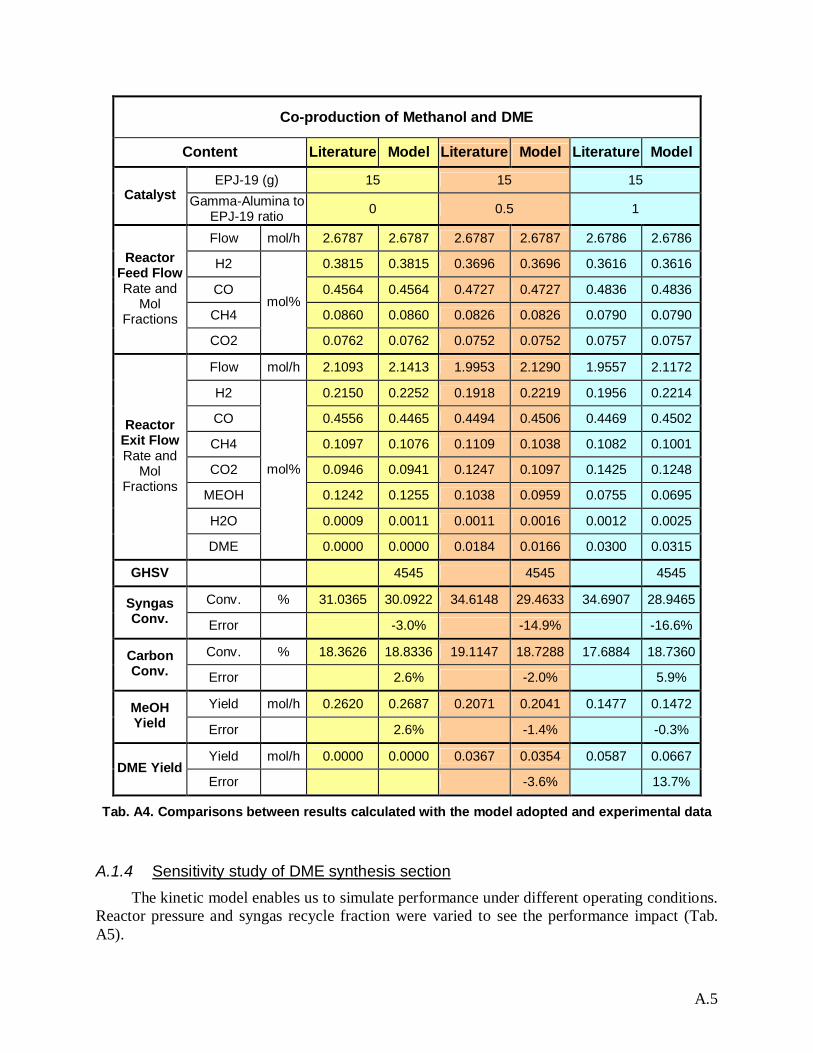
A.5
Co-production of Methanol and DME
Content Literature Model Literature Model Literature Model
EPJ-19 (g) 15 15 15Catalyst Gamma-Alumina to
EPJ-19 ratio 0 0.5 1
Flow mol/h 2.6787 2.6787 2.6787 2.6787 2.6786 2.6786
H2 0.3815 0.3815 0.3696 0.3696 0.3616 0.3616
CO 0.4564 0.4564 0.4727 0.4727 0.4836 0.4836
CH4 0.0860 0.0860 0.0826 0.0826 0.0790 0.0790
ReactorFeed FlowRate and
MolFractions
CO2
mol%
0.0762 0.0762 0.0752 0.0752 0.0757 0.0757
Flow mol/h 2.1093 2.1413 1.9953 2.1290 1.9557 2.1172
H2 0.2150 0.2252 0.1918 0.2219 0.1956 0.2214
CO 0.4556 0.4465 0.4494 0.4506 0.4469 0.4502
CH4 0.1097 0.1076 0.1109 0.1038 0.1082 0.1001
CO2 0.0946 0.0941 0.1247 0.1097 0.1425 0.1248
MEOH 0.1242 0.1255 0.1038 0.0959 0.0755 0.0695
H2O 0.0009 0.0011 0.0011 0.0016 0.0012 0.0025
ReactorExit FlowRate and
MolFractions
DME
mol%
0.0000 0.0000 0.0184 0.0166 0.0300 0.0315
GHSV 4545 4545 4545
Conv. % 31.0365 30.0922 34.6148 29.4633 34.6907 28.9465SyngasConv. Error -3.0% -14.9% -16.6%
Conv. % 18.3626 18.8336 19.1147 18.7288 17.6884 18.7360CarbonConv. Error 2.6% -2.0% 5.9%
Yield mol/h 0.2620 0.2687 0.2071 0.2041 0.1477 0.1472MeOHYield Error 2.6% -1.4% -0.3%
Yield mol/h 0.0000 0.0000 0.0367 0.0354 0.0587 0.0667DME Yield
Error -3.6% 13.7%
Tab. A4. Comparisons between results calculated with the model adopted and experimental data
A.1.4 Sensitivity study of DME synthesis sectionThe kinetic model enables us to simulate performance under different operating conditions.
Reactor pressure and syngas recycle fraction were varied to see the performance impact (Tab.A5).
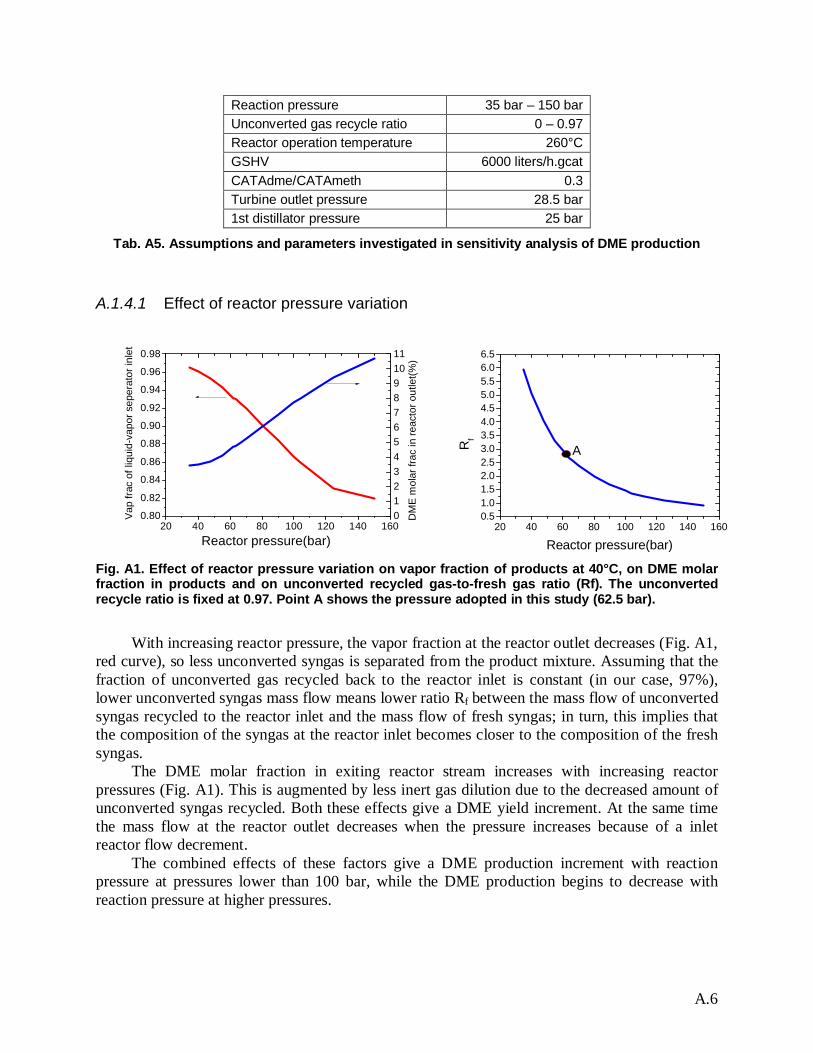
A.6
Reaction pressure 35 bar – 150 barUnconverted gas recycle ratio 0 – 0.97Reactor operation temperature 260°CGSHV 6000 liters/h.gcatCATAdme/CATAmeth 0.3Turbine outlet pressure 28.5 bar1st distillator pressure 25 bar
Tab. A5. Assumptions and parameters investigated in sensitivity analysis of DME production
A.1.4.1 Effect of reactor pressure variation
Fig. A1. Effect of reactor pressure variation on vapor fraction of products at 40°C, on DME molarfraction in products and on unconverted recycled gas-to-fresh gas ratio (Rf). The unconvertedrecycle ratio is fixed at 0.97. Point A shows the pressure adopted in this study (62.5 bar).
With increasing reactor pressure, the vapor fraction at the reactor outlet decreases (Fig. A1,red curve), so less unconverted syngas is separated from the product mixture. Assuming that thefraction of unconverted gas recycled back to the reactor inlet is constant (in our case, 97%),lower unconverted syngas mass flow means lower ratio Rf between the mass flow of unconvertedsyngas recycled to the reactor inlet and the mass flow of fresh syngas; in turn, this implies thatthe composition of the syngas at the reactor inlet becomes closer to the composition of the freshsyngas.
The DME molar fraction in exiting reactor stream increases with increasing reactorpressures (Fig. A1). This is augmented by less inert gas dilution due to the decreased amount ofunconverted syngas recycled. Both these effects give a DME yield increment. At the same timethe mass flow at the reactor outlet decreases when the pressure increases because of a inletreactor flow decrement.
The combined effects of these factors give a DME production increment with reactionpressure at pressures lower than 100 bar, while the DME production begins to decrease withreaction pressure at higher pressures.
20 40 60 80 100 120 140 1600.80
0.82
0.84
0.86
0.88
0.90
0.92
0.94
0.96
0.98
01234567891011
Reactor pressure(bar)
Vap
frac
of l
iqui
d-va
por s
eper
ator
inle
t
DM
E m
olar
frac
in re
acto
r out
let(%
)
20 40 60 80 100 120 140 1600.51.01.52.02.53.03.54.04.55.05.56.06.5
ARf
Reactor pressure(bar)
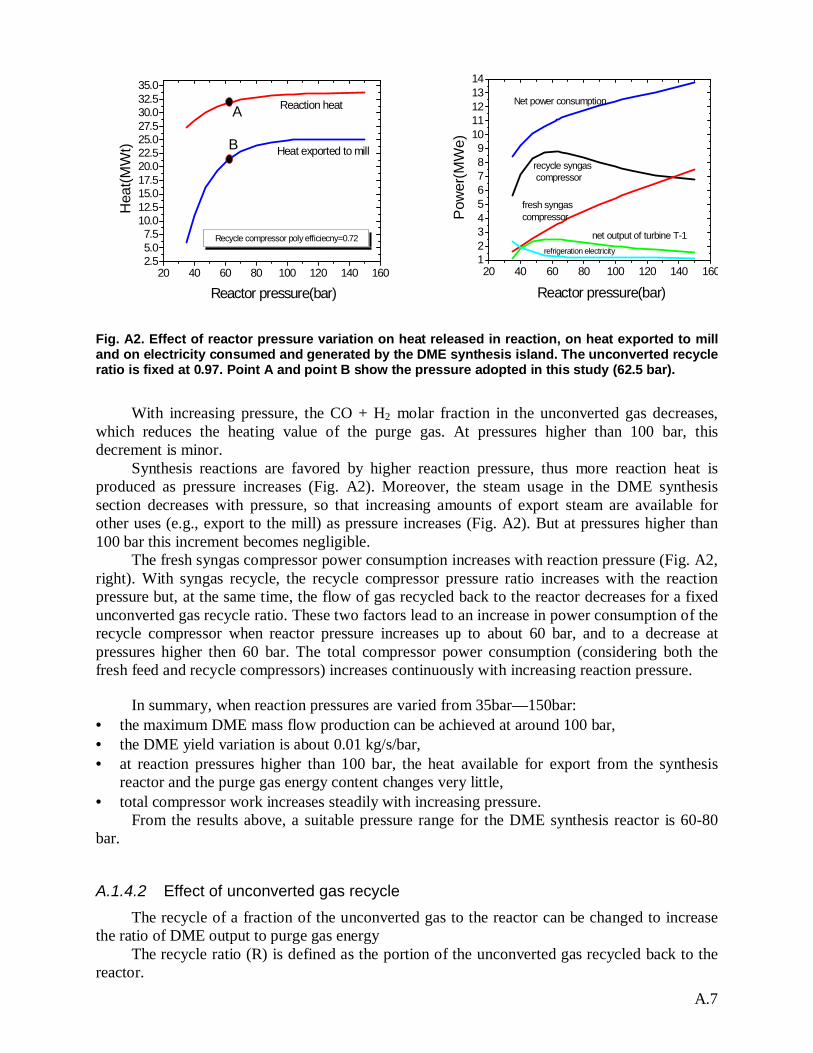
A.7
Fig. A2. Effect of reactor pressure variation on heat released in reaction, on heat exported to milland on electricity consumed and generated by the DME synthesis island. The unconverted recycleratio is fixed at 0.97. Point A and point B show the pressure adopted in this study (62.5 bar).
With increasing pressure, the CO + H2 molar fraction in the unconverted gas decreases,which reduces the heating value of the purge gas. At pressures higher than 100 bar, thisdecrement is minor.
Synthesis reactions are favored by higher reaction pressure, thus more reaction heat isproduced as pressure increases (Fig. A2). Moreover, the steam usage in the DME synthesissection decreases with pressure, so that increasing amounts of export steam are available forother uses (e.g., export to the mill) as pressure increases (Fig. A2). But at pressures higher than100 bar this increment becomes negligible.
The fresh syngas compressor power consumption increases with reaction pressure (Fig. A2,right). With syngas recycle, the recycle compressor pressure ratio increases with the reactionpressure but, at the same time, the flow of gas recycled back to the reactor decreases for a fixedunconverted gas recycle ratio. These two factors lead to an increase in power consumption of therecycle compressor when reactor pressure increases up to about 60 bar, and to a decrease atpressures higher then 60 bar. The total compressor power consumption (considering both thefresh feed and recycle compressors) increases continuously with increasing reaction pressure.
In summary, when reaction pressures are varied from 35bar—150bar:• the maximum DME mass flow production can be achieved at around 100 bar,• the DME yield variation is about 0.01 kg/s/bar,• at reaction pressures higher than 100 bar, the heat available for export from the synthesis
reactor and the purge gas energy content changes very little,• total compressor work increases steadily with increasing pressure.
From the results above, a suitable pressure range for the DME synthesis reactor is 60-80bar.
A.1.4.2 Effect of unconverted gas recycleThe recycle of a fraction of the unconverted gas to the reactor can be changed to increase
the ratio of DME output to purge gas energyThe recycle ratio (R) is defined as the portion of the unconverted gas recycled back to the
reactor.
20 40 60 80 100 120 140 1602.55.07.5
10.012.515.017.520.022.525.027.530.032.535.0
B
A Reaction heat
Heat exported to mill
Recycle compressor poly efficiecny=0.72
Reactor pressure(bar)
Hea
t(MW
t)
20 40 60 80 100 120 140 160123456789
1011121314
Reactor pressure(bar)
Pow
er(M
We)
Net power consumption
refrigeration electricity
net output of turbine T-1
fresh syngascompressor
recycle syngas compressor
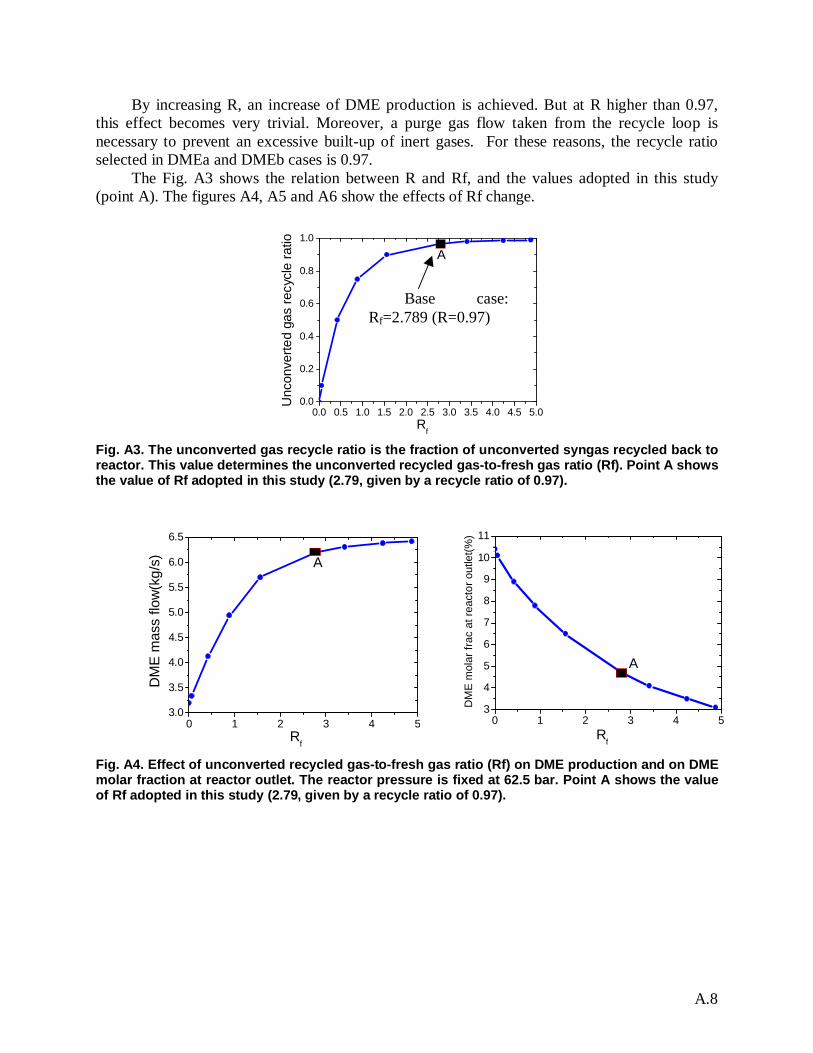
A.8
By increasing R, an increase of DME production is achieved. But at R higher than 0.97,this effect becomes very trivial. Moreover, a purge gas flow taken from the recycle loop isnecessary to prevent an excessive built-up of inert gases. For these reasons, the recycle ratioselected in DMEa and DMEb cases is 0.97.
The Fig. A3 shows the relation between R and Rf, and the values adopted in this study(point A). The figures A4, A5 and A6 show the effects of Rf change.
Fig. A3. The unconverted gas recycle ratio is the fraction of unconverted syngas recycled back toreactor. This value determines the unconverted recycled gas-to-fresh gas ratio (Rf). Point A showsthe value of Rf adopted in this study (2.79, given by a recycle ratio of 0.97).
Fig. A4. Effect of unconverted recycled gas-to-fresh gas ratio (Rf) on DME production and on DMEmolar fraction at reactor outlet. The reactor pressure is fixed at 62.5 bar. Point A shows the valueof Rf adopted in this study (2.79, given by a recycle ratio of 0.97).
Base case:Rf=2.789 (R=0.97)
0.0 0.5 1.0 1.5 2.0 2.5 3.0 3.5 4.0 4.5 5.00.0
0.2
0.4
0.6
0.8
1.0
A
Rf
Unc
onve
rted
gas
recy
cle
ratio
0 1 2 3 4 53
4
5
6
7
8
9
10
11
A
Rf
DM
E m
olar
frac
at r
eact
or o
utle
t(%)
0 1 2 3 4 53.0
3.5
4.0
4.5
5.0
5.5
6.0
6.5
A
DM
E m
ass
flow
(kg/
s)
Rf
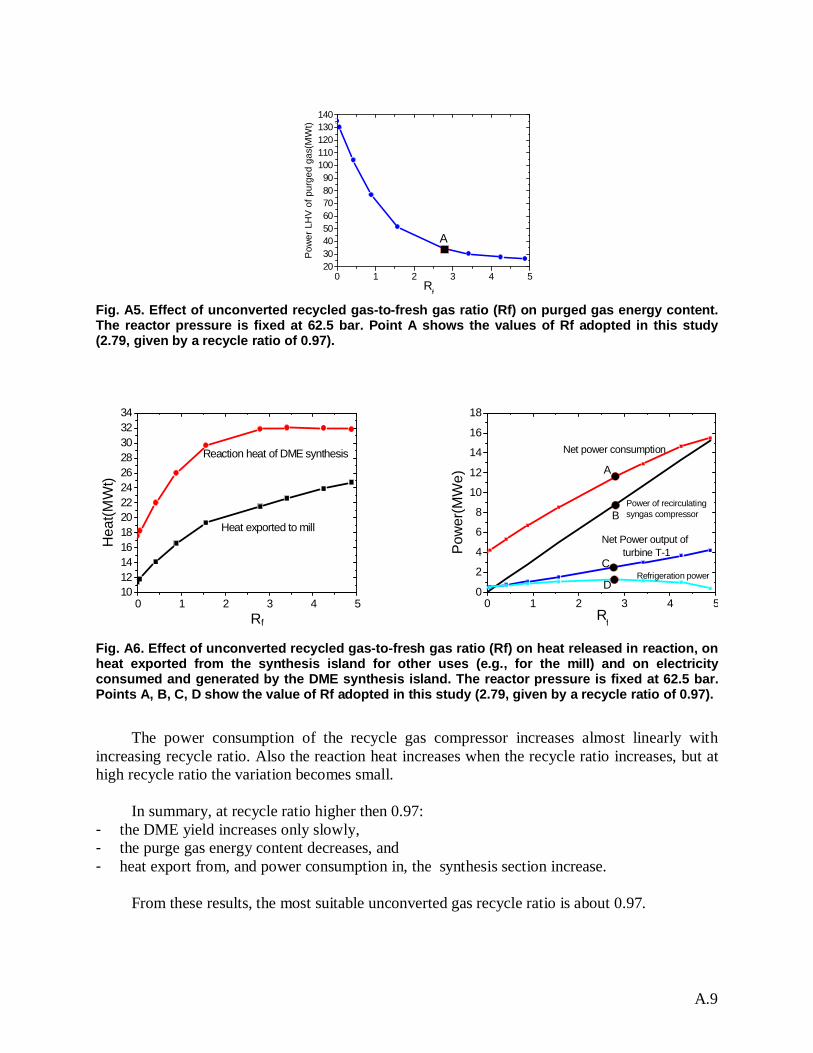
A.9
Fig. A5. Effect of unconverted recycled gas-to-fresh gas ratio (Rf) on purged gas energy content.The reactor pressure is fixed at 62.5 bar. Point A shows the values of Rf adopted in this study(2.79, given by a recycle ratio of 0.97).
Fig. A6. Effect of unconverted recycled gas-to-fresh gas ratio (Rf) on heat released in reaction, onheat exported from the synthesis island for other uses (e.g., for the mill) and on electricityconsumed and generated by the DME synthesis island. The reactor pressure is fixed at 62.5 bar.Points A, B, C, D show the value of Rf adopted in this study (2.79, given by a recycle ratio of 0.97).
The power consumption of the recycle gas compressor increases almost linearly withincreasing recycle ratio. Also the reaction heat increases when the recycle ratio increases, but athigh recycle ratio the variation becomes small.
In summary, at recycle ratio higher then 0.97:- the DME yield increases only slowly,- the purge gas energy content decreases, and- heat export from, and power consumption in, the synthesis section increase.
From these results, the most suitable unconverted gas recycle ratio is about 0.97.
0 1 2 3 4 52030405060708090
100110120130140
A
Rf
Pow
er L
HV
of p
urge
d ga
s(M
Wt)
0 1 2 3 4 510121416182022242628303234
Heat exported to mill
Reaction heat of DME synthesis
Recirculating ratio
Hea
t(MW
t)
0 1 2 3 4 50
2
4
6
8
10
12
14
16
18
D
C
B
A
Rf
Net power consumption
Power of recirculatingsyngas compressor
Net Power output of turbine T-1
Refrigeration power
Pow
er(M
We)
Rf
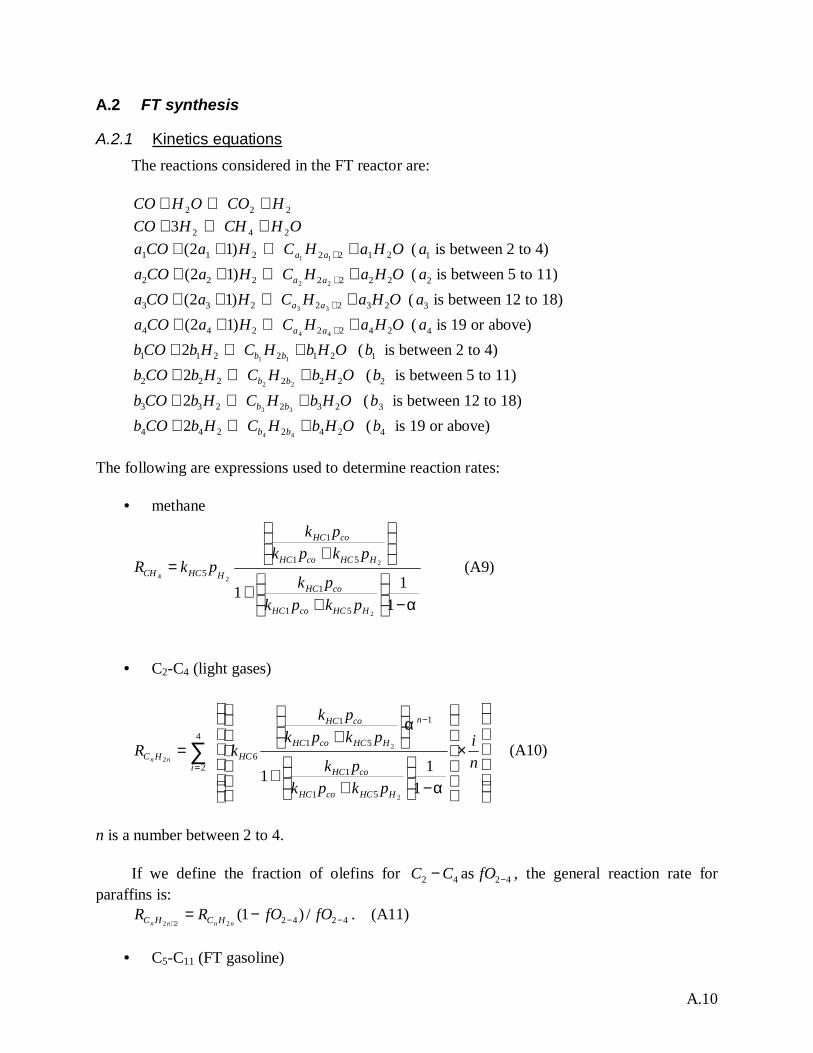
A.10
A.2 FT synthesis
A.2.1 Kinetics equationsThe reactions considered in the FT reactor are:
222 HCOOHCO +⇔+OHCHHCO 2423 +⇔+
OHaHCHaCOa aa 2122211 11)12( +⇔++ + ( 1a is between 2 to 4)
OHaHCHaCOa aa 2222222 22)12( +⇔++ + ( 2a is between 5 to 11)
OHaHCHaCOa aa 2322233 33)12( +⇔++ + ( 3a is between 12 to 18)
OHaHCHaCOa aa 2422244 44)12( +⇔++ + ( 4a is 19 or above)
OHbHCHbCOb bb 212211 112 +⇔+ ( 1b is between 2 to 4)
OHbHCHbCOb bb 222222 222 +⇔+ ( 2b is between 5 to 11)
OHbHCHbCOb bb 232233 332 +⇔+ ( 3b is between 12 to 18)
OHbHCHbCOb bb 242244 442 +⇔+ ( 4b is 19 or above)
The following are expressions used to determine reaction rates:
• methane
α−
++
+=
111
2
2
24
51
1
51
1
5
HHCcoHC
coHC
HHCcoHC
coHC
HHCCH
pkpkpk
pkpkpk
pkR (A9)
• C2-C4 (light gases)
×
−
++
+=
−
=∑ n
i
pkpkpk
pkpkpk
kR
HHCcoHC
coHC
n
HHCcoHC
coHC
HCi
HC nn
α
α
111
2
2
2
51
1
1
51
1
6
4
2
(A10)
n is a number between 2 to 4.
If we define the fraction of olefins for 42 CC − as 42−fO , the general reaction rate forparaffins is:
4242 /)1(222 −−−=
+fOfORR
nnnn HCHC . (A11)
• C5-C11 (FT gasoline)
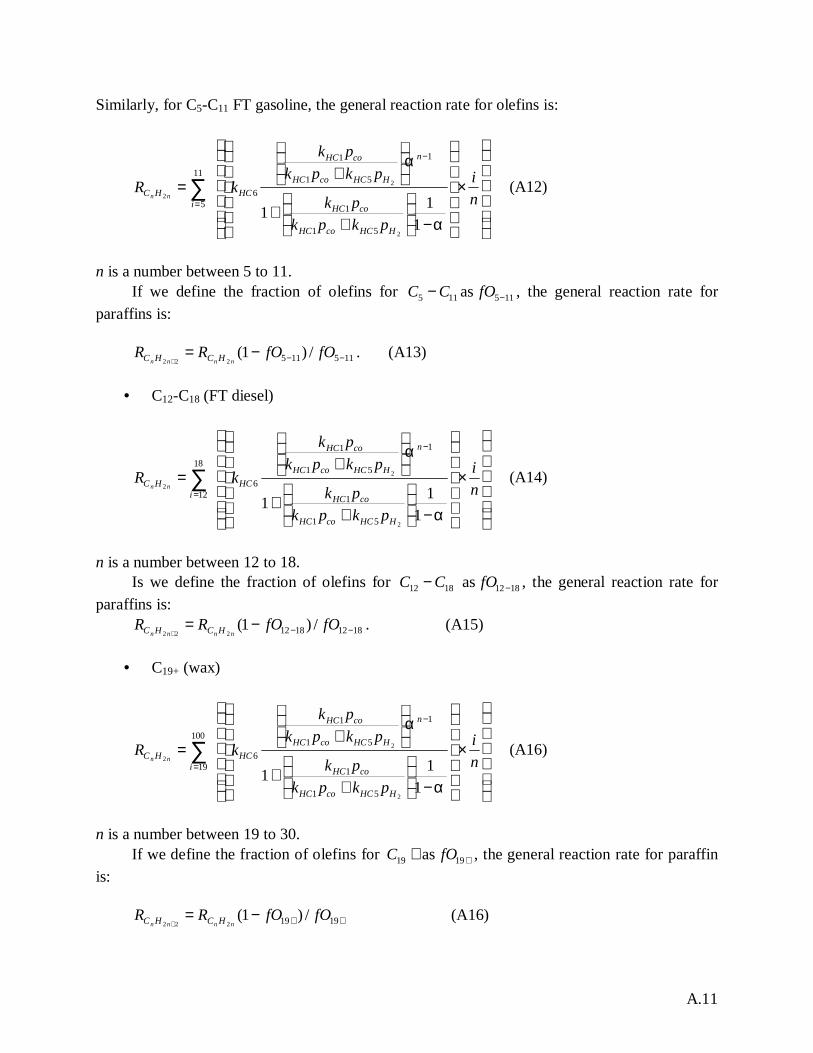
A.11
Similarly, for C5-C11 FT gasoline, the general reaction rate for olefins is:
×
−
++
+=
−
=∑ n
i
pkpkpk
pkpkpk
kR
HHCcoHC
coHC
n
HHCcoHC
coHC
HCi
HC nn
α
α
111
2
2
2
51
1
1
51
1
6
11
5
(A12)
n is a number between 5 to 11.If we define the fraction of olefins for 115 CC − as 115−fO , the general reaction rate for
paraffins is:
115115 /)1(222 −−−=
+fOfORR
nnnn HCHC . (A13)
• C12-C18 (FT diesel)
×
−
++
+=
−
=∑ n
i
pkpkpk
pkpkpk
kR
HHCcoHC
coHC
n
HHCcoHC
coHC
HCi
HC nn
α
α
111
2
2
2
51
1
1
51
1
6
18
12
(A14)
n is a number between 12 to 18.Is we define the fraction of olefins for 1812 CC − as 1812−fO , the general reaction rate for
paraffins is:18121812 /)1(
222 −−−=+
fOfORRnnnn HCHC . (A15)
• C19+ (wax)
×
−
++
+=
−
=∑ n
i
pkpkpk
pkpkpk
kR
HHCcoHC
coHC
n
HHCcoHC
coHC
HCi
HC nn
α
α
111
2
2
2
51
1
1
51
1
6
100
19
(A16)
n is a number between 19 to 30.If we define the fraction of olefins for +19C as +19fO , the general reaction rate for paraffin
is:
++−=+ 1919 /)1(
222fOfORR
nnnn HCHC (A16)
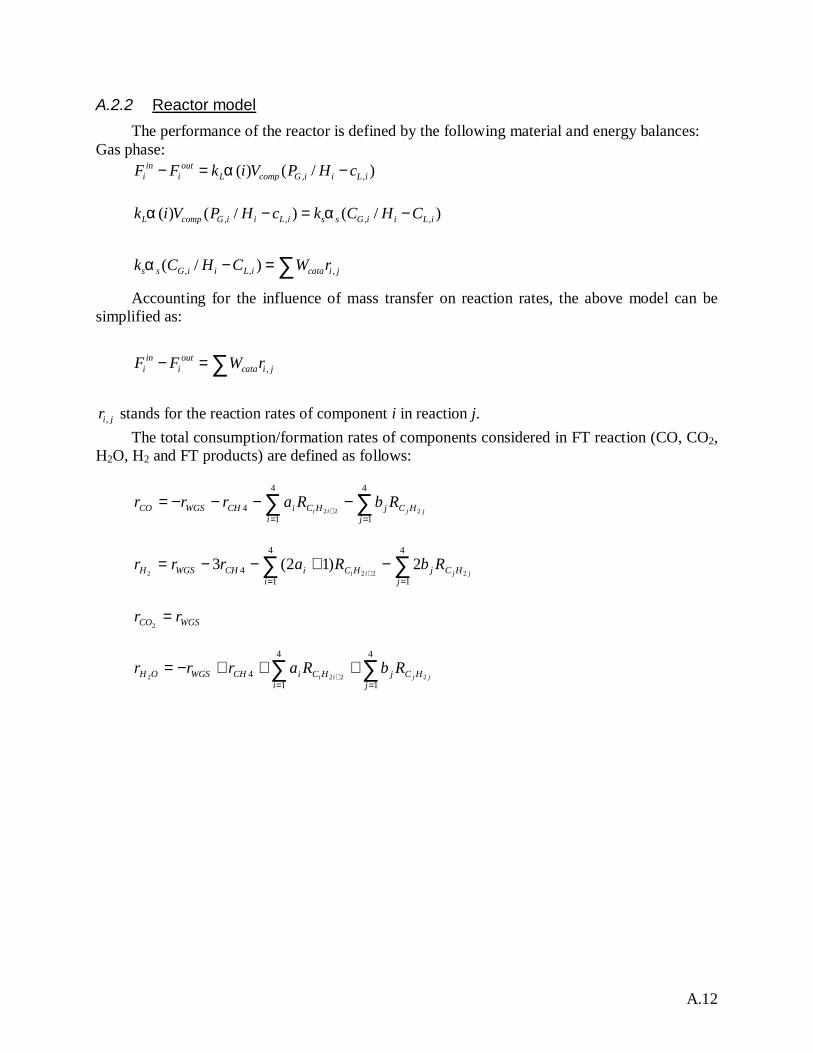
A.12
A.2.2 Reactor modelThe performance of the reactor is defined by the following material and energy balances:
Gas phase:, ,( ) ( / )in out
i i L comp G i i L iF F k i V P H cα− = −
, , , ,( ) ( / ) ( / )L comp G i i L i s s G i i L ik i V P H c k C H Cα α− = −
, , ,( / )s s G i i L i cata i jk C H C W rα − = ∑Accounting for the influence of mass transfer on reaction rates, the above model can be
simplified as:
,in out
i i cata i jF F W r− = ∑
,i jr stands for the reaction rates of component i in reaction j.The total consumption/formation rates of components considered in FT reaction (CO, CO2,
H2O, H2 and FT products) are defined as follows:
∑∑==
−−−−=+
4
1
4
14 222
jHCj
iHCiCHWGSCO jjii
RbRarrr
∑∑==
−+−−=+
4
1
4
14 2222
2)12(3j
HCji
HCiCHWGSH jjiiRbRarrr
WGSCO rr =2
∑∑==
+++−=+
4
1
4
14 2222
jHCj
iHCiCHWGSOH jjii
RbRarrr

B.1
APPENDIX B: KINETIC MODEL FOR MIXED ALCOHOL SYNTHESIS14
B.1 Model development and preliminary results
B.1.1 IntroductionIt has been known for many decades that mixtures of methanol and higher alcohols (i.e.
long chain alcohols) could be used directly as fuel, as fuel additives for octane or cetaneenhancement, or as oxygenate fuel additives for environmental reasons [1 - 4 and referencestherein]. In the ’90s, the abrupt development of MTBE demand and the prognoses for a mid-termshortage of oil-derived isobutene has led to a renewed interest in the synthesis, particularly overmethanol-modified synthesis catalysts which lead to the production of mainly methanol andisobutanol. The consecutive dehydration of isobutanol to isobutene, the precursor of MTBEalong with methanol, is state of the art: in this way, a syngas route to MTBE would be accessible[3]. However to date the synthesis of higher alcohols, particularly of isobutanol, still suffers frompoor selectivity, so that the synthesis of methanol and Fischer-Tropsch liquid fuels are preferablyconsidered nowadays as a way of exploitation the huge reserves of natural gas located in remoteareas, via syngas production (Gas-to-liquid, GTL).
Catalysts used for the production of higher alcohols from synthesis gas (mixtures of COand H2) can be divided into four categories [2, 5 and references therein]. The first one is basedon a soluble Ru complex used as an homogeneous catalyst. The second one can be described asmodified methanol catalysts (e.g. alkali-doped ZnO/chromia or Cu-based catalysts). The thirdcategory of catalysts comprises mixed-metal Fischer-Tropsch catalysts (e.g. Co and Fe on asupport). Finally, the last category includes alkali-promoted MoS2 catalysts.
Among the various catalysts, Mo-based systems are the catalysts of choice in the case ofS-containing feed due to their high tolerance for sulfur compounds. They also show high activityin the water-gas shift reaction and high activity and selectivity for linear alcohols. The lastcharacteristic is important in view of the fact that there are several possible reactions betweenCO and H2, that are thermodynamically competitive to the synthesis of higher alcohols. Inparticular, the formation of hydrocarbons ( -olefins and n-paraffins) from CO and H2 isthermodynamically favored with respect to the formation of higher alcohols (i.e. Keq ofhydrocarbons are higher than Keq of alcohols) [1]. For this reason, for the higher alcoholssynthesis, the usage of an highly selective catalysts is necessary to guide the process selectivitytoward alcohols.
B.1.2 Scope of the workThe scope of this work is to build a Fortran code able to estimate, given a set of process
conditions (temperature, pressure, feed composition), the rates of formation of the main products(i.e. methanol, ethanol, propanol, methane, carbon dioxide and water) involved in the higheralcohols synthesis over a Mo-based catalyst.
For this reason we first selected, based on literature indications, a set of rate expressionsdescribing the kinetic behavior of the species involved in the mechanism of formation of thehigher alcohols; based on such rate equations, we then constructed a Fortran code able toestimate directly the CO conversion and alcohols productivity given a set of process conditions.
14 Authors: Prof. Enrico Tronconi, Prof. Luca Lietti, Eng. Zuzana Vallusova, Eng. Carlo Giorgio Visconti.Milano, July 2006
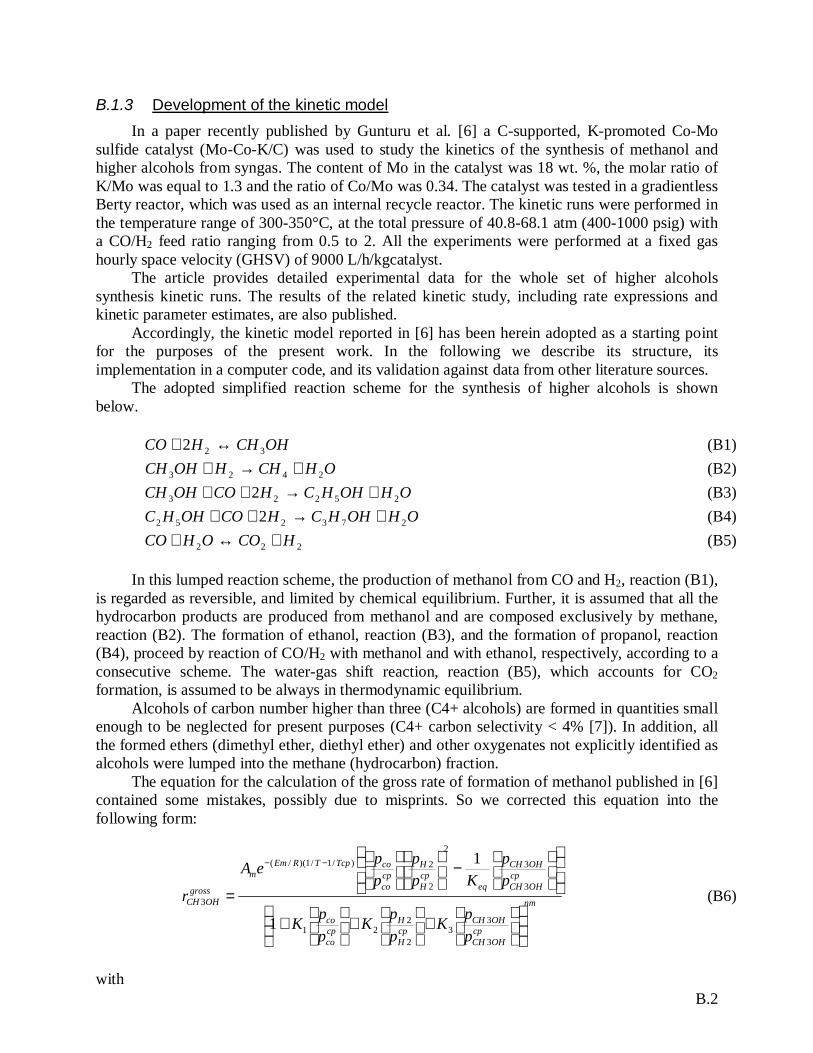
B.2
B.1.3 Development of the kinetic modelIn a paper recently published by Gunturu et al. [6] a C-supported, K-promoted Co-Mo
sulfide catalyst (Mo-Co-K/C) was used to study the kinetics of the synthesis of methanol andhigher alcohols from syngas. The content of Mo in the catalyst was 18 wt. %, the molar ratio ofK/Mo was equal to 1.3 and the ratio of Co/Mo was 0.34. The catalyst was tested in a gradientlessBerty reactor, which was used as an internal recycle reactor. The kinetic runs were performed inthe temperature range of 300-350°C, at the total pressure of 40.8-68.1 atm (400-1000 psig) witha CO/H2 feed ratio ranging from 0.5 to 2. All the experiments were performed at a fixed gashourly space velocity (GHSV) of 9000 L/h/kgcatalyst.
The article provides detailed experimental data for the whole set of higher alcoholssynthesis kinetic runs. The results of the related kinetic study, including rate expressions andkinetic parameter estimates, are also published.
Accordingly, the kinetic model reported in [6] has been herein adopted as a starting pointfor the purposes of the present work. In the following we describe its structure, itsimplementation in a computer code, and its validation against data from other literature sources.
The adopted simplified reaction scheme for the synthesis of higher alcohols is shownbelow.
OHCHHCO 322 ↔+ (B1)OHCHHOHCH 2423 +→+ (B2)
OHOHHCHCOOHCH 25223 2 +→++ (B3)OHOHHCHCOOHHC 273252 2 +→++ (B4)
222 HCOOHCO +↔+ (B5)
In this lumped reaction scheme, the production of methanol from CO and H2, reaction (B1),is regarded as reversible, and limited by chemical equilibrium. Further, it is assumed that all thehydrocarbon products are produced from methanol and are composed exclusively by methane,reaction (B2). The formation of ethanol, reaction (B3), and the formation of propanol, reaction(B4), proceed by reaction of CO/H2 with methanol and with ethanol, respectively, according to aconsecutive scheme. The water-gas shift reaction, reaction (B5), which accounts for CO2formation, is assumed to be always in thermodynamic equilibrium.
Alcohols of carbon number higher than three (C4+ alcohols) are formed in quantities smallenough to be neglected for present purposes (C4+ carbon selectivity < 4% [7]). In addition, allthe formed ethers (dimethyl ether, diethyl ether) and other oxygenates not explicitly identified asalcohols were lumped into the methane (hydrocarbon) fraction.
The equation for the calculation of the gross rate of formation of methanol published in [6]contained some mistakes, possibly due to misprints. So we corrected this equation into thefollowing form:
nm
cpOHCH
OHCHcpH
Hcpco
co
cpOHCH
OHCH
eqcpH
Hcpco
coTcpTREmm
grossOHCH
ppK
ppK
ppK
pp
Kpp
ppeA
r
+
+
+
−
=
−−
3
33
2
221
3
3
2
2
2)/1/1)(/(
3
1
1
(B6)
with
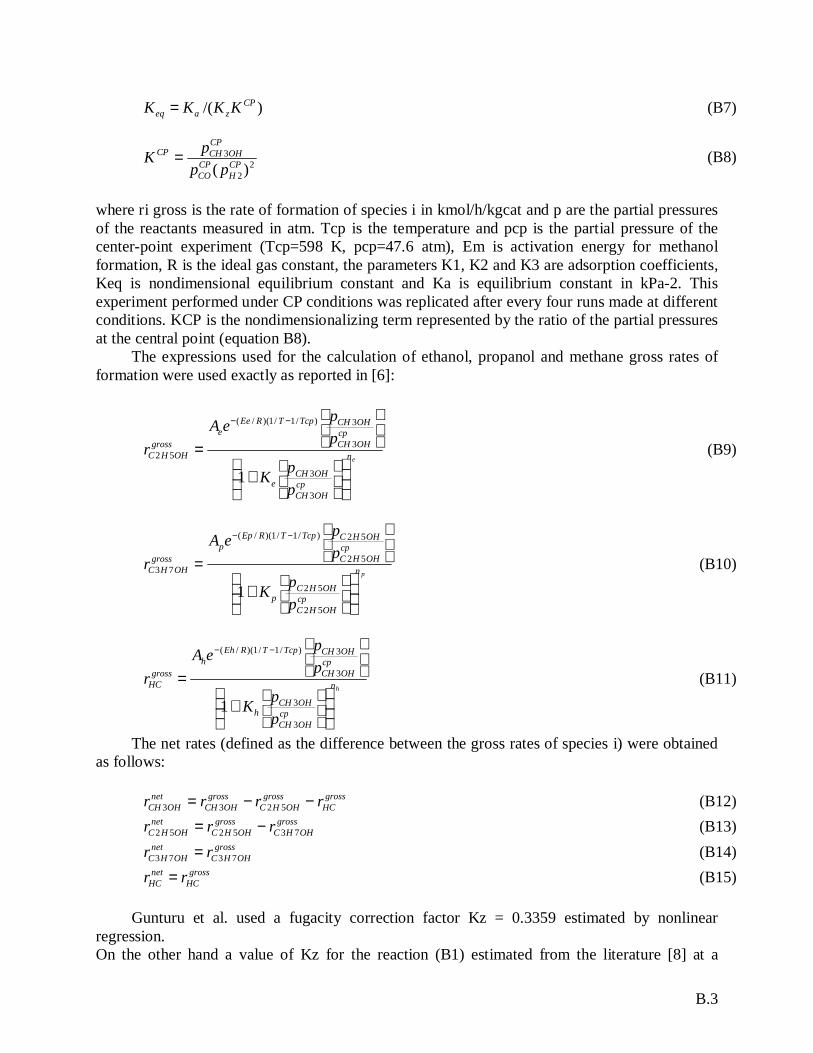
B.3
)/( CPzaeq KKKK = (B7)
22
3
)( CPH
CPCO
CPOHCHCP
pppK = (B8)
where ri gross is the rate of formation of species i in kmol/h/kgcat and p are the partial pressuresof the reactants measured in atm. Tcp is the temperature and pcp is the partial pressure of thecenter-point experiment (Tcp=598 K, pcp=47.6 atm), Em is activation energy for methanolformation, R is the ideal gas constant, the parameters K1, K2 and K3 are adsorption coefficients,Keq is nondimensional equilibrium constant and Ka is equilibrium constant in kPa-2. Thisexperiment performed under CP conditions was replicated after every four runs made at differentconditions. KCP is the nondimensionalizing term represented by the ratio of the partial pressuresat the central point (equation B8).
The expressions used for the calculation of ethanol, propanol and methane gross rates offormation were used exactly as reported in [6]:
en
cpOHCH
OHCHe
cpOHCH
OHCHTcpTREee
grossOHHC
ppK
ppeA
r
+
=
−−
3
3
3
3)/1/1)(/(
52
1
(B9)
pn
cpOHHC
OHHCp
cpOHHC
OHHCTcpTREpp
grossOHHC
ppK
ppeA
r
+
=
−−
52
52
52
52)/1/1)(/(
73
1
(B10)
hn
cpOHCH
OHCHh
cpOHCH
OHCHTcpTREhh
grossHC
ppK
ppeA
r
+
=
−−
3
3
3
3)/1/1)(/(
1
(B11)
The net rates (defined as the difference between the gross rates of species i) were obtainedas follows:
grossHC
grossOHHC
grossOHCH
netOHCH rrrr −−= 5233 (B12)
grossOHHC
grossOHHC
netOHHC rrr 735252 −= (B13)
grossOHHC
netOHHC rr 7373 = (B14)
grossHC
netHC rr = (B15)
Gunturu et al. used a fugacity correction factor Kz = 0.3359 estimated by nonlinearregression.On the other hand a value of Kz for the reaction (B1) estimated from the literature [8] at a
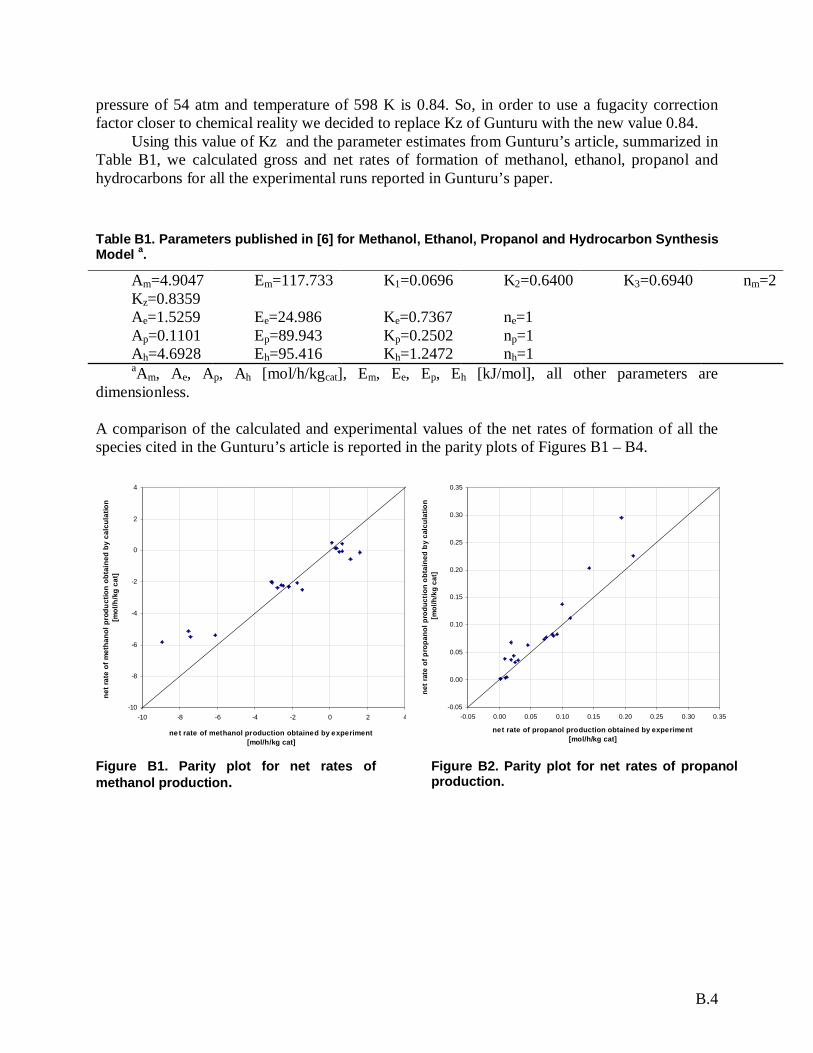
B.4
pressure of 54 atm and temperature of 598 K is 0.84. So, in order to use a fugacity correctionfactor closer to chemical reality we decided to replace Kz of Gunturu with the new value 0.84.
Using this value of Kz and the parameter estimates from Gunturu’s article, summarized inTable B1, we calculated gross and net rates of formation of methanol, ethanol, propanol andhydrocarbons for all the experimental runs reported in Gunturu’s paper.
Table B1. Parameters published in [6] for Methanol, Ethanol, Propanol and Hydrocarbon SynthesisModel a.
Am=4.9047 Em=117.733 K1=0.0696 K2=0.6400 K3=0.6940 nm=2Kz=0.8359Ae=1.5259 Ee=24.986 Ke=0.7367 ne=1Ap=0.1101 Ep=89.943 Kp=0.2502 np=1Ah=4.6928 Eh=95.416 Kh=1.2472 nh=1aAm, Ae, Ap, Ah [mol/h/kgcat], Em, Ee, Ep, Eh [kJ/mol], all other parameters are
dimensionless.
A comparison of the calculated and experimental values of the net rates of formation of all thespecies cited in the Gunturu’s article is reported in the parity plots of Figures B1 – B4.
-10
-8
-6
-4
-2
0
2
4
-10 -8 -6 -4 -2 0 2 4
net rate of methanol production obtained by experiment[mol/h/kg cat]
net r
ate
of m
etha
nol p
rodu
ctio
n ob
tain
ed b
y ca
lcul
atio
n[m
ol/h
/kg
cat]
-0.05
0.00
0.05
0.10
0.15
0.20
0.25
0.30
0.35
-0.05 0.00 0.05 0.10 0.15 0.20 0.25 0.30 0.35
net rate of propanol production obtained by experiment[mol/h/kg cat]
net r
ate
of p
ropa
nol p
rodu
ctio
n ob
tain
ed b
y ca
lcul
atio
n[m
ol/h
/kg
cat]
Figure B1. Parity plot for net rates ofmethanol production.
Figure B2. Parity plot for net rates of propanolproduction.
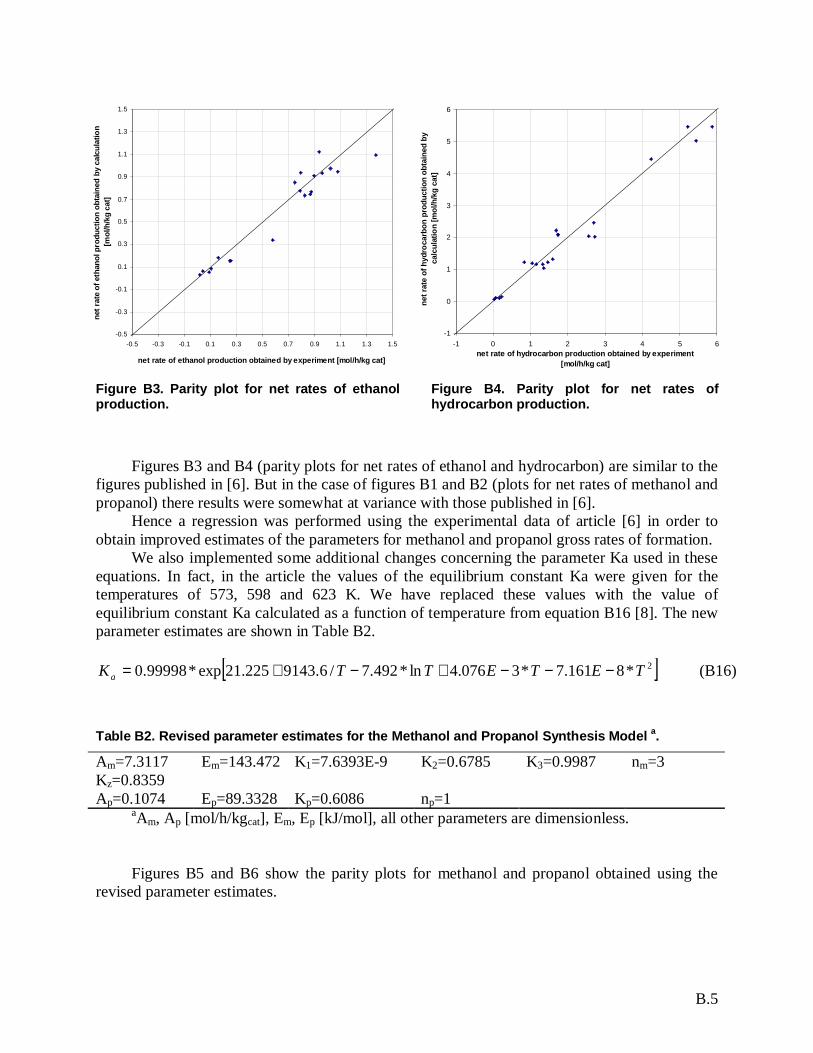
B.5
-0.5
-0.3
-0.1
0.1
0.3
0.5
0.7
0.9
1.1
1.3
1.5
-0.5 -0.3 -0.1 0.1 0.3 0.5 0.7 0.9 1.1 1.3 1.5
net rate of ethanol production obtained by experiment [mol/h/kg cat]
net r
ate
of e
than
ol p
rodu
ctio
n ob
tain
ed b
y ca
lcul
atio
n[m
ol/h
/kg
cat]
-1
0
1
2
3
4
5
6
-1 0 1 2 3 4 5 6net rate of hydrocarbon production obtained by experiment
[mol/h/kg cat]
net r
ate
of h
ydro
carb
on p
rodu
ctio
n ob
tain
ed b
yca
lcul
atio
n [m
ol/h
/kg
cat]
Figure B3. Parity plot for net rates of ethanolproduction.
Figure B4. Parity plot for net rates ofhydrocarbon production.
Figures B3 and B4 (parity plots for net rates of ethanol and hydrocarbon) are similar to thefigures published in [6]. But in the case of figures B1 and B2 (plots for net rates of methanol andpropanol) there results were somewhat at variance with those published in [6].
Hence a regression was performed using the experimental data of article [6] in order toobtain improved estimates of the parameters for methanol and propanol gross rates of formation.
We also implemented some additional changes concerning the parameter Ka used in theseequations. In fact, in the article the values of the equilibrium constant Ka were given for thetemperatures of 573, 598 and 623 K. We have replaced these values with the value ofequilibrium constant Ka calculated as a function of temperature from equation B16 [8]. The newparameter estimates are shown in Table B2.
[ ]2*8161.7*3076.4ln*492.7/6.9143225.21exp*99998.0 TETETTK a −−−+−+= (B16)
Table B2. Revised parameter estimates for the Methanol and Propanol Synthesis Model a.
Am=7.3117 Em=143.472 K1=7.6393E-9 K2=0.6785 K3=0.9987 nm=3Kz=0.8359Ap=0.1074 Ep=89.3328 Kp=0.6086 np=1
aAm, Ap [mol/h/kgcat], Em, Ep [kJ/mol], all other parameters are dimensionless.
Figures B5 and B6 show the parity plots for methanol and propanol obtained using therevised parameter estimates.
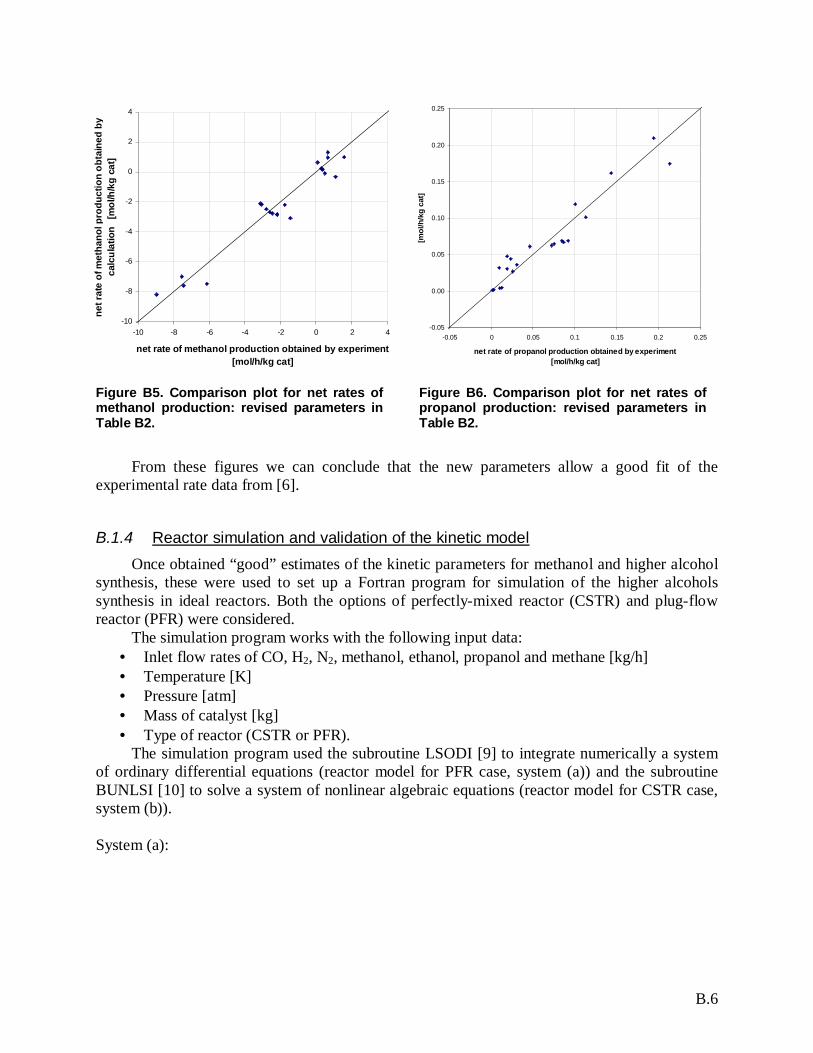
B.6
-10
-8
-6
-4
-2
0
2
4
-10 -8 -6 -4 -2 0 2 4
net rate of methanol production obtained by experiment[mol/h/kg cat]
net r
ate
of m
etha
nol p
rodu
ctio
n ob
tain
ed b
yca
lcul
atio
n [
mol
/h/k
g ca
t]
-0.05
0.00
0.05
0.10
0.15
0.20
0.25
-0.05 0 0.05 0.1 0.15 0.2 0.25
net rate of propanol production obtained by experiment[mol/h/kg cat]
[mol
/h/k
g ca
t]
Figure B5. Comparison plot for net rates ofmethanol production: revised parameters inTable B2.
Figure B6. Comparison plot for net rates ofpropanol production: revised parameters inTable B2.
From these figures we can conclude that the new parameters allow a good fit of theexperimental rate data from [6].
B.1.4 Reactor simulation and validation of the kinetic modelOnce obtained “good” estimates of the kinetic parameters for methanol and higher alcohol
synthesis, these were used to set up a Fortran program for simulation of the higher alcoholssynthesis in ideal reactors. Both the options of perfectly-mixed reactor (CSTR) and plug-flowreactor (PFR) were considered.
The simulation program works with the following input data:• Inlet flow rates of CO, H2, N2, methanol, ethanol, propanol and methane [kg/h]• Temperature [K]• Pressure [atm]• Mass of catalyst [kg]• Type of reactor (CSTR or PFR).
The simulation program used the subroutine LSODI [9] to integrate numerically a systemof ordinary differential equations (reactor model for PFR case, system (a)) and the subroutineBUNLSI [10] to solve a system of nonlinear algebraic equations (reactor model for CSTR case,system (b)).
System (a):
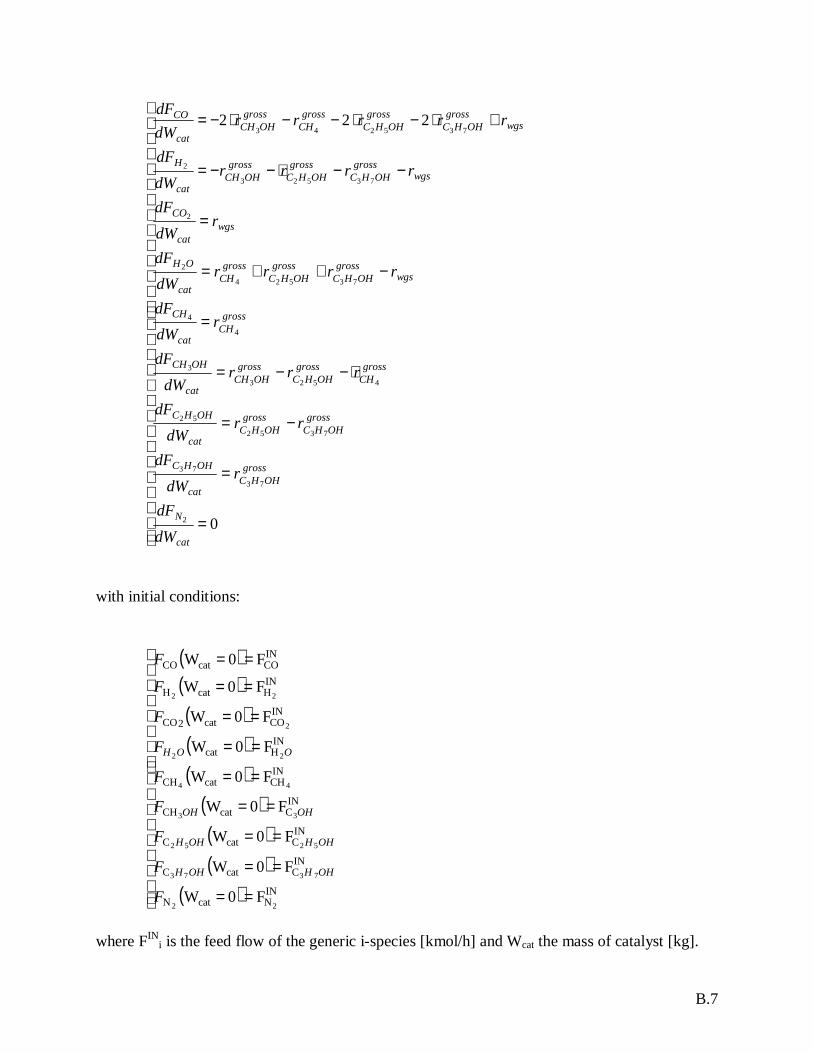
B.7
=
=
−=
⋅−−=
=
−++=
=
−−⋅−−=
+⋅−⋅−−⋅−=
0
222
2
73
73
7352
52
4523
3
4
4
73524
2
2
73523
2
735243
cat
N
grossOHHC
cat
OHHC
grossOHHC
grossOHHC
cat
OHHC
grossCH
grossOHHC
grossOHCH
cat
OHCH
grossCH
cat
CH
wgsgross
OHHCgross
OHHCgross
CHcat
OH
wgscat
CO
wgsgross
OHHCgross
OHHCgross
OHCHcat
H
wgsgross
OHHCgross
OHHCgross
CHgross
OHCHcat
CO
dWdF
rdW
dF
rrdW
dF
rrrdW
dF
rdWdF
rrrrdWdF
rdWdF
rrrrdWdF
rrrrrdWdF
with initial conditions:
( )( )( )( )( )
( )( )( )
( )
==
==
==
==
==
==
==
==
==
F0W
F0W
F0W
F0W
F0W
F0W
F0W
F0W
F0W
INNcatN
INCcatC
INCcatC
INCcatCH
INCHcatCH
INHcat
INCOcat2CO
INHcatH
INCOcatCO
22
7373
5252
33
44
22
2
22
F
F
F
F
F
F
F
F
F
OHHOHH
OHHOHH
OHOH
OOH
where FINi is the feed flow of the generic i-species [kmol/h] and Wcat the mass of catalyst [kg].
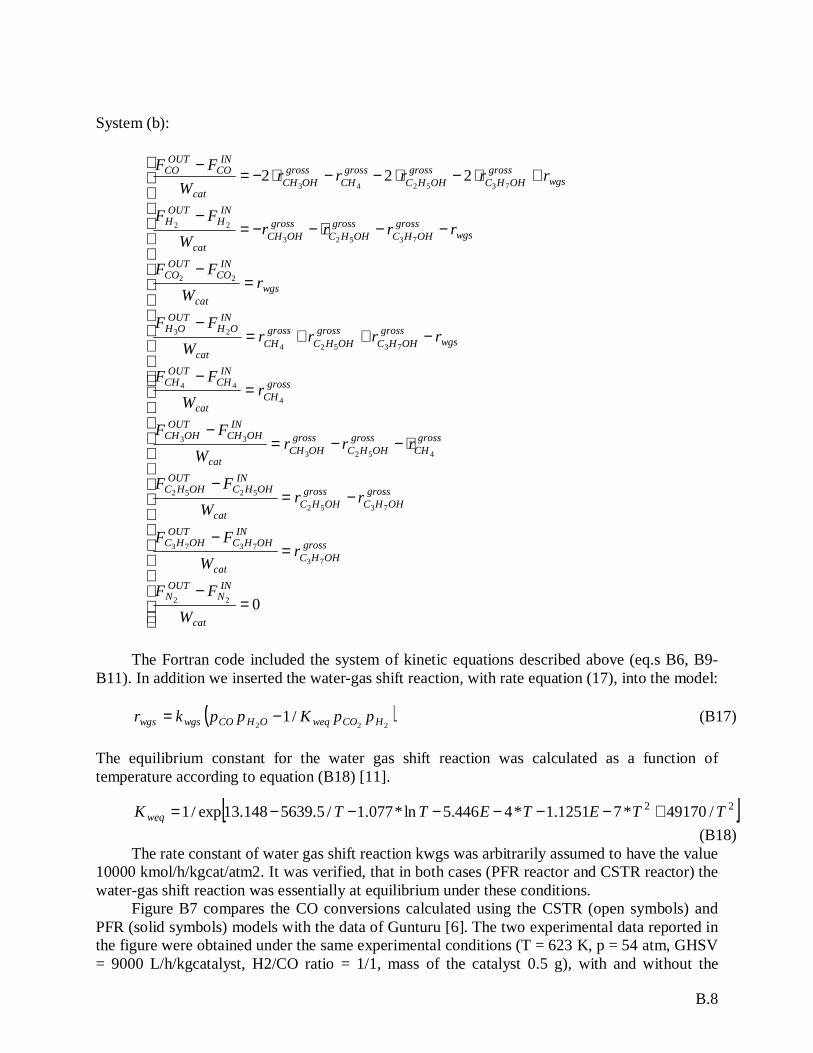
B.8
System (b):
=−
=−
−=−
⋅−−=−
=−
−++=−
=−
−−⋅−−=−
+⋅−⋅−−⋅−=−
0
222
22
73
7373
7352
5252
4523
33
4
44
73524
23
22
73523
22
735243
cat
INN
OUTN
grossOHHC
cat
INOHHC
OUTOHHC
grossOHHC
grossOHHC
cat
INOHHC
OUTOHHC
grossCH
grossOHHC
grossOHCH
cat
INOHCH
OUTOHCH
grossCH
cat
INCH
OUTCH
wgsgross
OHHCgross
OHHCgross
CHcat
INOH
OUTOH
wgscat
INCO
OUTCO
wgsgross
OHHCgross
OHHCgross
OHCHcat
INH
OUTH
wgsgross
OHHCgross
OHHCgross
CHgross
OHCHcat
INCO
OUTCO
WFF
rW
FF
rrW
FF
rrrW
FF
rW
FF
rrrrW
FF
rW
FF
rrrrW
FF
rrrrrW
FF
The Fortran code included the system of kinetic equations described above (eq.s B6, B9-B11). In addition we inserted the water-gas shift reaction, with rate equation (17), into the model:
( )222
/1 HCOweqOHCOwgswgs ppKppkr −= (B17)
The equilibrium constant for the water gas shift reaction was calculated as a function oftemperature according to equation (B18) [11].
[ ]22 /49170*71251.1*4446.5ln*077.1/5.5639148.13exp/1 TTETETTK weq +−−−−−−=(B18)
The rate constant of water gas shift reaction kwgs was arbitrarily assumed to have the value10000 kmol/h/kgcat/atm2. It was verified, that in both cases (PFR reactor and CSTR reactor) thewater-gas shift reaction was essentially at equilibrium under these conditions.
Figure B7 compares the CO conversions calculated using the CSTR (open symbols) andPFR (solid symbols) models with the data of Gunturu [6]. The two experimental data reported inthe figure were obtained under the same experimental conditions (T = 623 K, p = 54 atm, GHSV= 9000 L/h/kgcatalyst, H2/CO ratio = 1/1, mass of the catalyst 0.5 g), with and without the
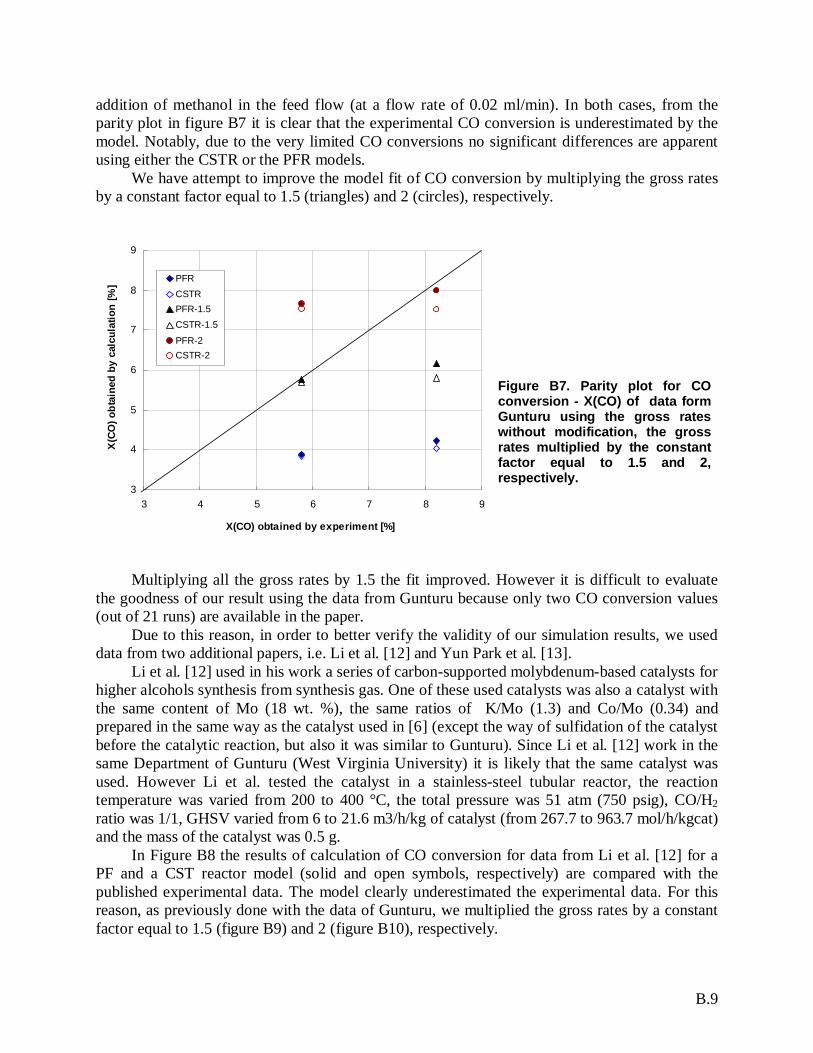
B.9
addition of methanol in the feed flow (at a flow rate of 0.02 ml/min). In both cases, from theparity plot in figure B7 it is clear that the experimental CO conversion is underestimated by themodel. Notably, due to the very limited CO conversions no significant differences are apparentusing either the CSTR or the PFR models.
We have attempt to improve the model fit of CO conversion by multiplying the gross ratesby a constant factor equal to 1.5 (triangles) and 2 (circles), respectively.
3
4
5
6
7
8
9
3 4 5 6 7 8 9
X(CO) obtained by experiment [%]
X(C
O) o
btai
ned
by c
alcu
latio
n [%
] PFRCSTRPFR-1.5CSTR-1.5
PFR-2CSTR-2
Figure B7. Parity plot for COconversion - X(CO) of data formGunturu using the gross rateswithout modification, the grossrates multiplied by the constantfactor equal to 1.5 and 2,respectively.
Multiplying all the gross rates by 1.5 the fit improved. However it is difficult to evaluatethe goodness of our result using the data from Gunturu because only two CO conversion values(out of 21 runs) are available in the paper.
Due to this reason, in order to better verify the validity of our simulation results, we useddata from two additional papers, i.e. Li et al. [12] and Yun Park et al. [13].
Li et al. [12] used in his work a series of carbon-supported molybdenum-based catalysts forhigher alcohols synthesis from synthesis gas. One of these used catalysts was also a catalyst withthe same content of Mo (18 wt. %), the same ratios of K/Mo (1.3) and Co/Mo (0.34) andprepared in the same way as the catalyst used in [6] (except the way of sulfidation of the catalystbefore the catalytic reaction, but also it was similar to Gunturu). Since Li et al. [12] work in thesame Department of Gunturu (West Virginia University) it is likely that the same catalyst wasused. However Li et al. tested the catalyst in a stainless-steel tubular reactor, the reactiontemperature was varied from 200 to 400 °C, the total pressure was 51 atm (750 psig), CO/H2ratio was 1/1, GHSV varied from 6 to 21.6 m3/h/kg of catalyst (from 267.7 to 963.7 mol/h/kgcat)and the mass of the catalyst was 0.5 g.
In Figure B8 the results of calculation of CO conversion for data from Li et al. [12] for aPF and a CST reactor model (solid and open symbols, respectively) are compared with thepublished experimental data. The model clearly underestimated the experimental data. For thisreason, as previously done with the data of Gunturu, we multiplied the gross rates by a constantfactor equal to 1.5 (figure B9) and 2 (figure B10), respectively.
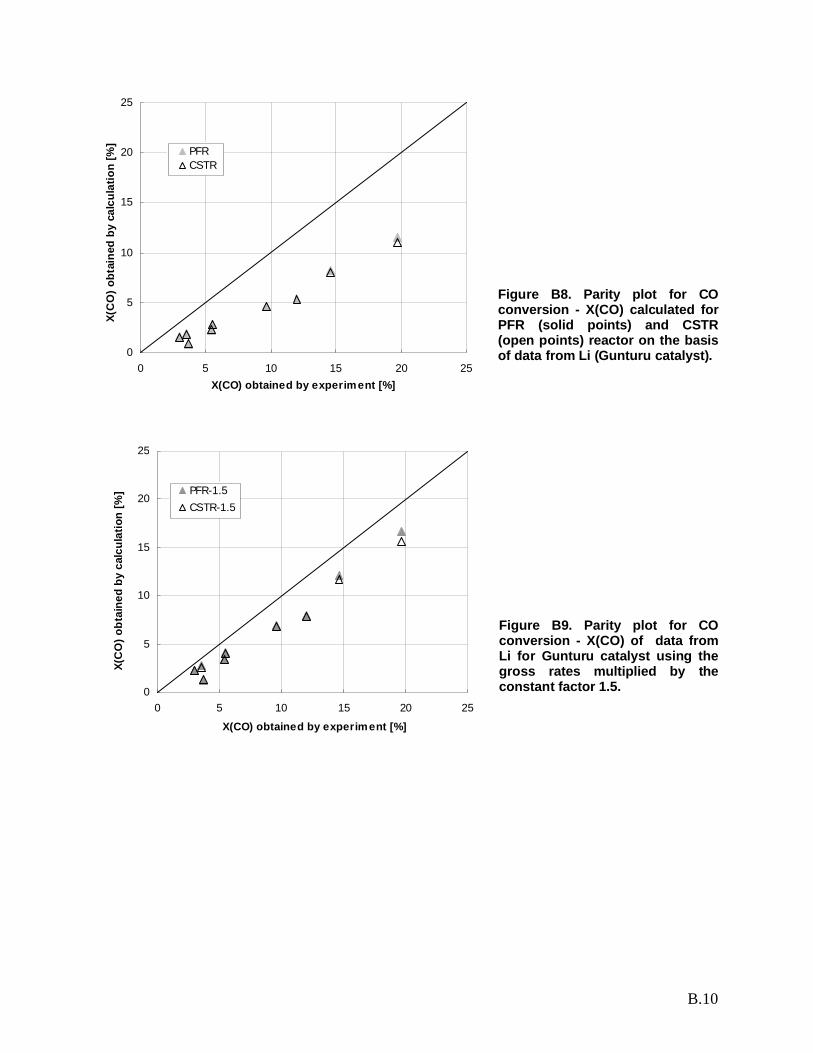
B.10
0
5
10
15
20
25
0 5 10 15 20 25X(CO) obtained by experiment [%]
X(C
O) o
btai
ned
by c
alcu
latio
n [%
]
PFRCSTR
Figure B8. Parity plot for COconversion - X(CO) calculated forPFR (solid points) and CSTR(open points) reactor on the basisof data from Li (Gunturu catalyst).
0
5
10
15
20
25
0 5 10 15 20 25
X(CO) obtained by experiment [%]
X(C
O) o
btai
ned
by c
alcu
latio
n [%
] PFR-1.5CSTR-1.5
Figure B9. Parity plot for COconversion - X(CO) of data fromLi for Gunturu catalyst using thegross rates multiplied by theconstant factor 1.5.
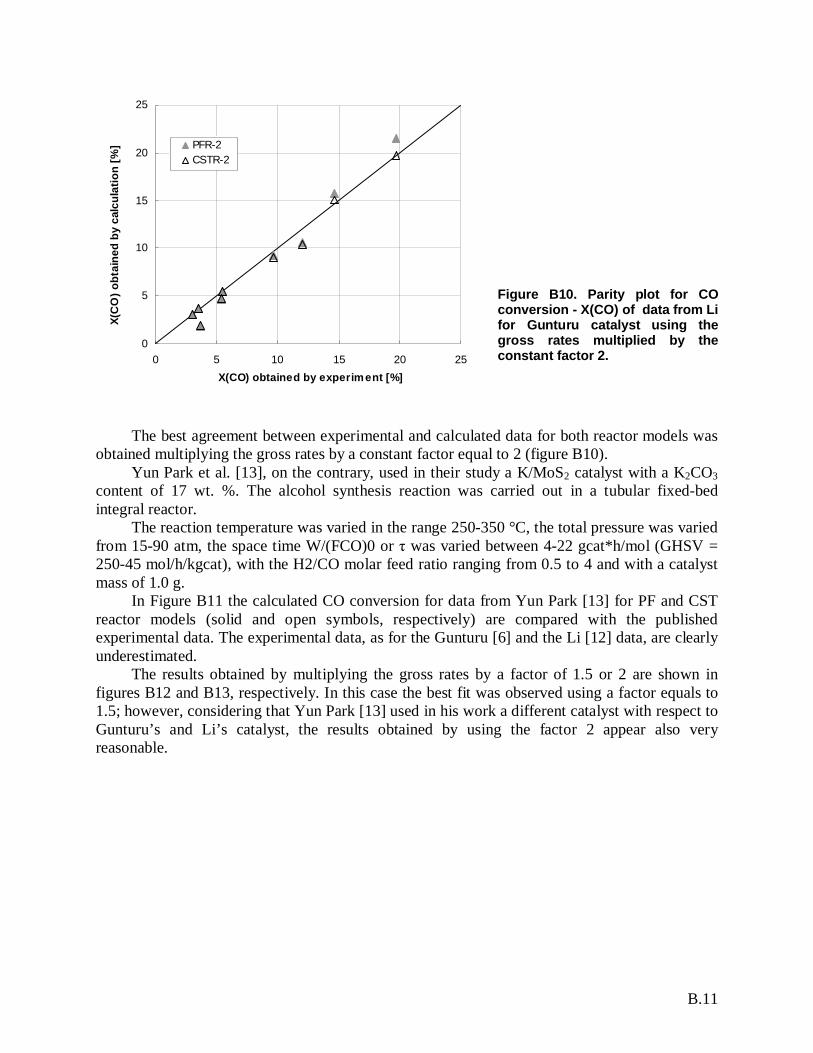
B.11
0
5
10
15
20
25
0 5 10 15 20 25X(CO) obtained by experiment [%]
X(C
O) o
btai
ned
by c
alcu
latio
n [%
] PFR-2CSTR-2
Figure B10. Parity plot for COconversion - X(CO) of data from Lifor Gunturu catalyst using thegross rates multiplied by theconstant factor 2.
The best agreement between experimental and calculated data for both reactor models wasobtained multiplying the gross rates by a constant factor equal to 2 (figure B10).
Yun Park et al. [13], on the contrary, used in their study a K/MoS2 catalyst with a K2CO3content of 17 wt. %. The alcohol synthesis reaction was carried out in a tubular fixed-bedintegral reactor.
The reaction temperature was varied in the range 250-350 °C, the total pressure was variedfrom 15-90 atm, the space time W/(FCO)0 or was varied between 4-22 gcat*h/mol (GHSV =250-45 mol/h/kgcat), with the H2/CO molar feed ratio ranging from 0.5 to 4 and with a catalystmass of 1.0 g.
In Figure B11 the calculated CO conversion for data from Yun Park [13] for PF and CSTreactor models (solid and open symbols, respectively) are compared with the publishedexperimental data. The experimental data, as for the Gunturu [6] and the Li [12] data, are clearlyunderestimated.
The results obtained by multiplying the gross rates by a factor of 1.5 or 2 are shown infigures B12 and B13, respectively. In this case the best fit was observed using a factor equals to1.5; however, considering that Yun Park [13] used in his work a different catalyst with respect toGunturu’s and Li’s catalyst, the results obtained by using the factor 2 appear also veryreasonable.
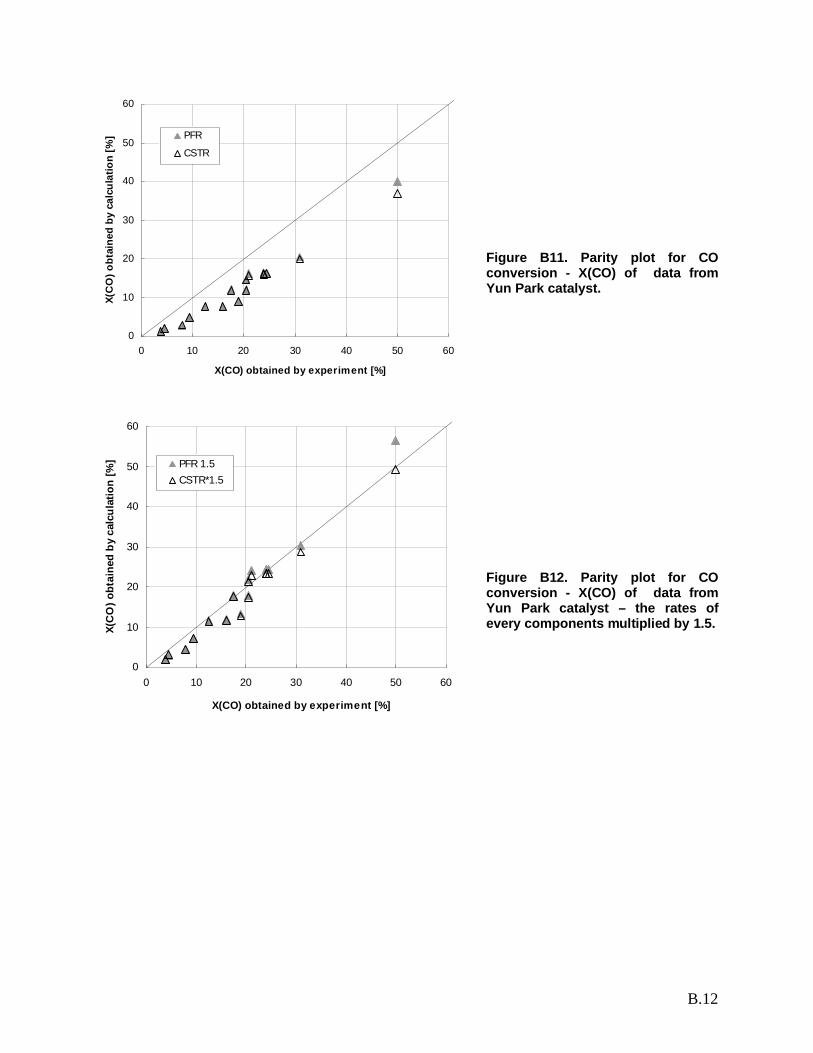
B.12
0
10
20
30
40
50
60
0 10 20 30 40 50 60
X(CO) obtained by experiment [%]
X(C
O) o
btai
ned
by c
alcu
latio
n [%
] PFR
CSTR
Figure B11. Parity plot for COconversion - X(CO) of data fromYun Park catalyst.
0
10
20
30
40
50
60
0 10 20 30 40 50 60
X(CO) obtained by experiment [%]
X(C
O) o
btai
ned
by c
alcu
latio
n [%
] PFR 1.5CSTR*1.5
Figure B12. Parity plot for COconversion - X(CO) of data fromYun Park catalyst – the rates ofevery components multiplied by 1.5.
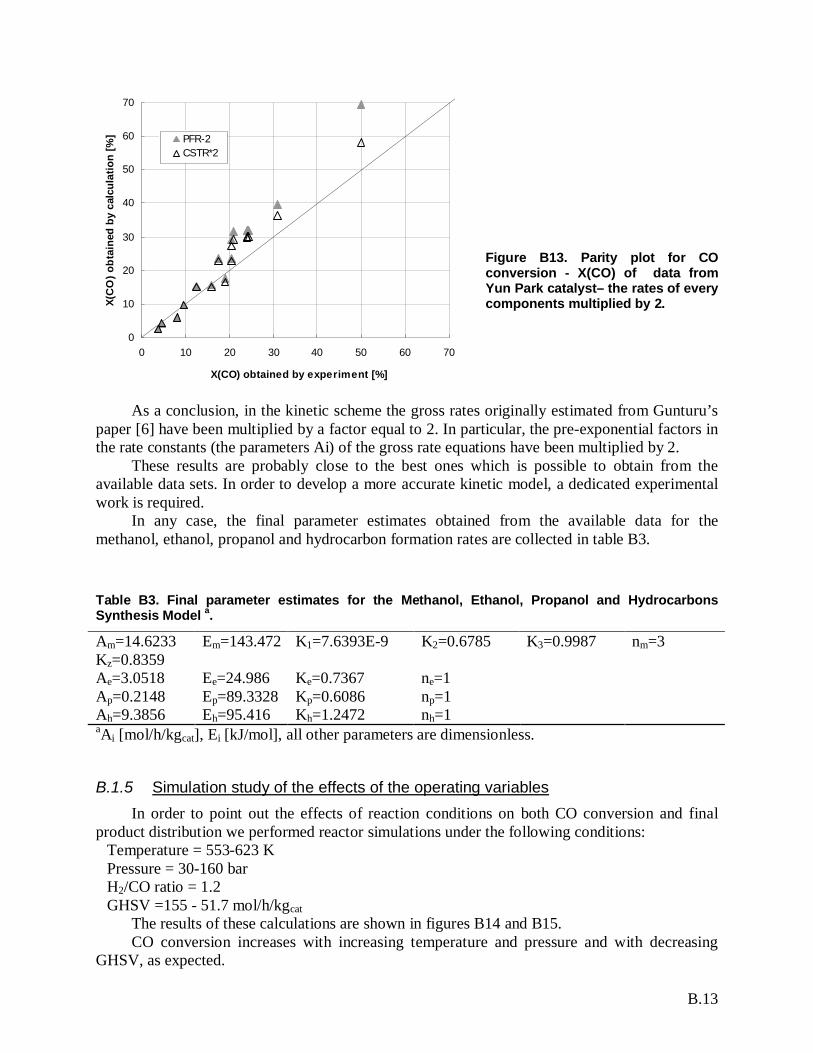
B.13
0
10
20
30
40
50
60
70
0 10 20 30 40 50 60 70
X(CO) obtained by experiment [%]
X(C
O) o
btai
ned
by c
alcu
latio
n [%
] PFR-2CSTR*2
Figure B13. Parity plot for COconversion - X(CO) of data fromYun Park catalyst– the rates of everycomponents multiplied by 2.
As a conclusion, in the kinetic scheme the gross rates originally estimated from Gunturu’spaper [6] have been multiplied by a factor equal to 2. In particular, the pre-exponential factors inthe rate constants (the parameters Ai) of the gross rate equations have been multiplied by 2.
These results are probably close to the best ones which is possible to obtain from theavailable data sets. In order to develop a more accurate kinetic model, a dedicated experimentalwork is required.
In any case, the final parameter estimates obtained from the available data for themethanol, ethanol, propanol and hydrocarbon formation rates are collected in table B3.
Table B3. Final parameter estimates for the Methanol, Ethanol, Propanol and HydrocarbonsSynthesis Model a.
Am=14.6233 Em=143.472 K1=7.6393E-9 K2=0.6785 K3=0.9987 nm=3Kz=0.8359Ae=3.0518 Ee=24.986 Ke=0.7367 ne=1Ap=0.2148 Ep=89.3328 Kp=0.6086 np=1Ah=9.3856 Eh=95.416 Kh=1.2472 nh=1aAi [mol/h/kgcat], Ei [kJ/mol], all other parameters are dimensionless.
B.1.5 Simulation study of the effects of the operating variablesIn order to point out the effects of reaction conditions on both CO conversion and final
product distribution we performed reactor simulations under the following conditions: Temperature = 553-623 K Pressure = 30-160 bar H2/CO ratio = 1.2 GHSV =155 - 51.7 mol/h/kgcat
The results of these calculations are shown in figures B14 and B15.CO conversion increases with increasing temperature and pressure and with decreasing
GHSV, as expected.
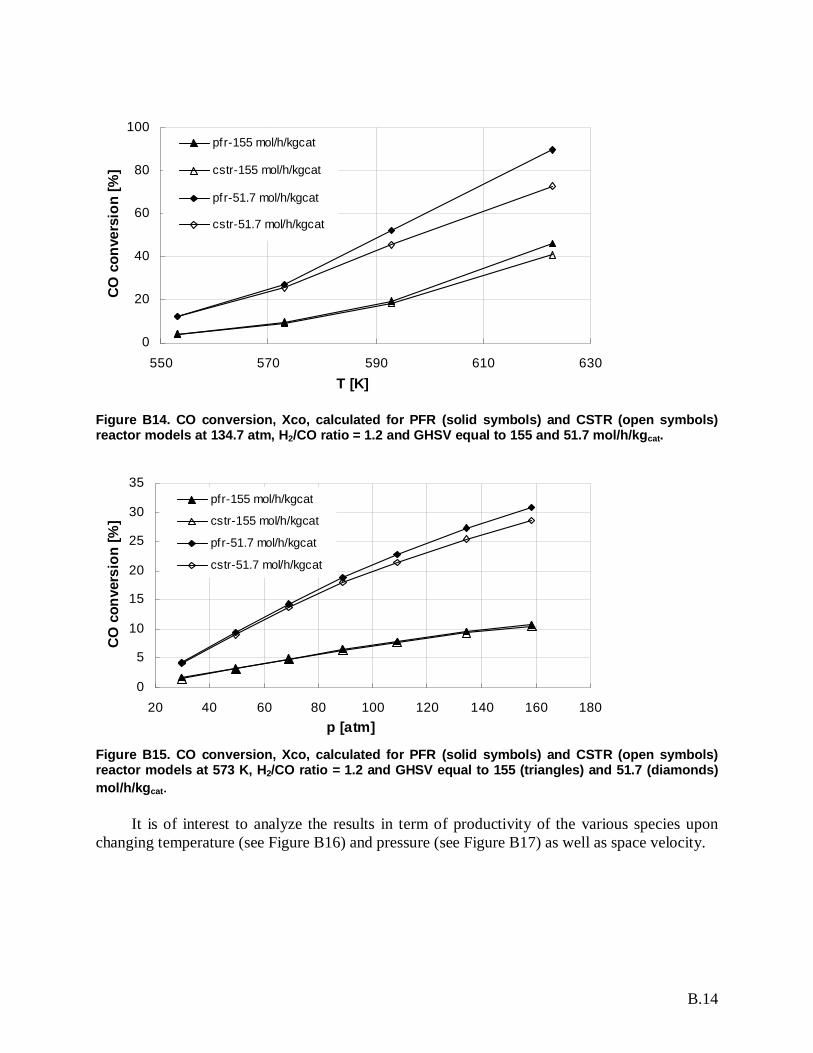
B.14
0
20
40
60
80
100
550 570 590 610 630T [K]
CO c
onve
rsio
n [%
]
pfr-155 mol/h/kgcat
cstr-155 mol/h/kgcat
pfr-51.7 mol/h/kgcat
cstr-51.7 mol/h/kgcat
Figure B14. CO conversion, Xco, calculated for PFR (solid symbols) and CSTR (open symbols)reactor models at 134.7 atm, H2/CO ratio = 1.2 and GHSV equal to 155 and 51.7 mol/h/kgcat.
0
5
10
15
20
25
30
35
20 40 60 80 100 120 140 160 180p [atm]
CO
con
vers
ion
[%]
pfr-155 mol/h/kgcat
cstr-155 mol/h/kgcat
pfr-51.7 mol/h/kgcat
cstr-51.7 mol/h/kgcat
Figure B15. CO conversion, Xco, calculated for PFR (solid symbols) and CSTR (open symbols)reactor models at 573 K, H2/CO ratio = 1.2 and GHSV equal to 155 (triangles) and 51.7 (diamonds)mol/h/kgcat.
It is of interest to analyze the results in term of productivity of the various species uponchanging temperature (see Figure B16) and pressure (see Figure B17) as well as space velocity.
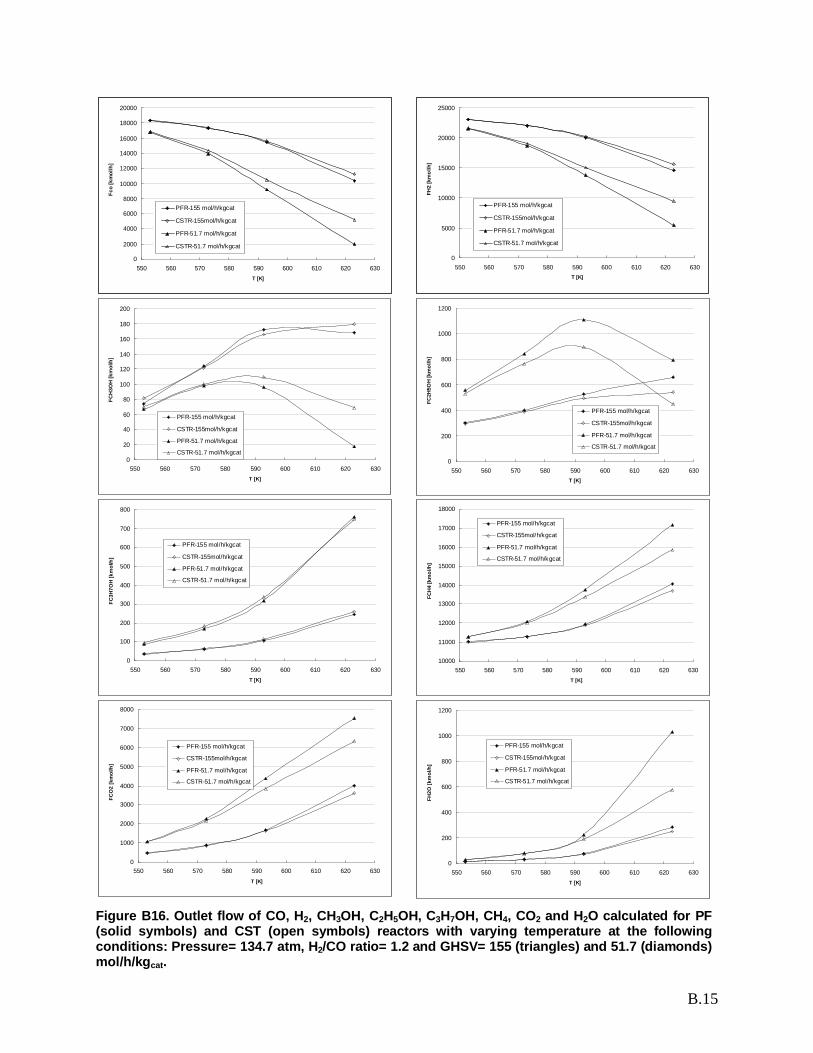
B.15
0
2000
4000
6000
8000
10000
12000
14000
16000
18000
20000
550 560 570 580 590 600 610 620 630T [K]
Fco
[km
ol/h
]
PFR-155 mol/h/kgcat
CSTR-155mol/h/kgcat
PFR-51.7 mol/h/kgcat
CSTR-51.7 mol/h/kgcat
0
5000
10000
15000
20000
25000
550 560 570 580 590 600 610 620 630T [K]
FH2
[km
ol/h
]
PFR-155 mol/h/kgcat
CSTR-155mol/h/kgcat
PFR-51.7 mol/h/kgcat
CSTR-51.7 mol/h/kgcat
0
20
40
60
80
100
120
140
160
180
200
550 560 570 580 590 600 610 620 630T [K]
FCH
3OH
[km
ol/h
]
PFR-155 mol/h/kgcat
CSTR-155mol/h/kgcat
PFR-51.7 mol/h/kgcat
CSTR-51.7 mol/h/kgcat0
200
400
600
800
1000
1200
550 560 570 580 590 600 610 620 630T [K]
FC2H
5OH
[km
ol/h
]
PFR-155 mol/h/kgcat
CSTR-155mol/h/kgcat
PFR-51.7 mol/h/kgcat
CSTR-51.7 mol/h/kgcat
0
100
200
300
400
500
600
700
800
550 560 570 580 590 600 610 620 630T [K]
FC3H
7OH
[km
ol/h
]
PFR-155 mol/h/kgcat
CSTR-155mol/h/kgcat
PFR-51.7 mol/h/kgcat
CSTR-51.7 mol/h/kgcat
10000
11000
12000
13000
14000
15000
16000
17000
18000
550 560 570 580 590 600 610 620 630T [K]
FCH
4 [k
mol
/h]
PFR-155 mol/h/kgcat
CSTR-155mol/h/kgcat
PFR-51.7 mol/h/kgcat
CSTR-51.7 mol/h/kgcat
0
1000
2000
3000
4000
5000
6000
7000
8000
550 560 570 580 590 600 610 620 630T [K]
FCO
2 [k
mol
/h]
PFR-155 mol/h/kgcat
CSTR-155mol/h/kgcat
PFR-51.7 mol/h/kgcat
CSTR-51.7 mol/h/kgcat
0
200
400
600
800
1000
1200
550 560 570 580 590 600 610 620 630T [K]
FH2O
[km
ol/h
]
PFR-155 mol/h/kgcat
CSTR-155mol/h/kgcat
PFR-51.7 mol/h/kgcat
CSTR-51.7 mol/h/kgcat
Figure B16. Outlet flow of CO, H2, CH3OH, C2H5OH, C3H7OH, CH4, CO2 and H2O calculated for PF(solid symbols) and CST (open symbols) reactors with varying temperature at the followingconditions: Pressure= 134.7 atm, H2/CO ratio= 1.2 and GHSV= 155 (triangles) and 51.7 (diamonds)mol/h/kgcat.
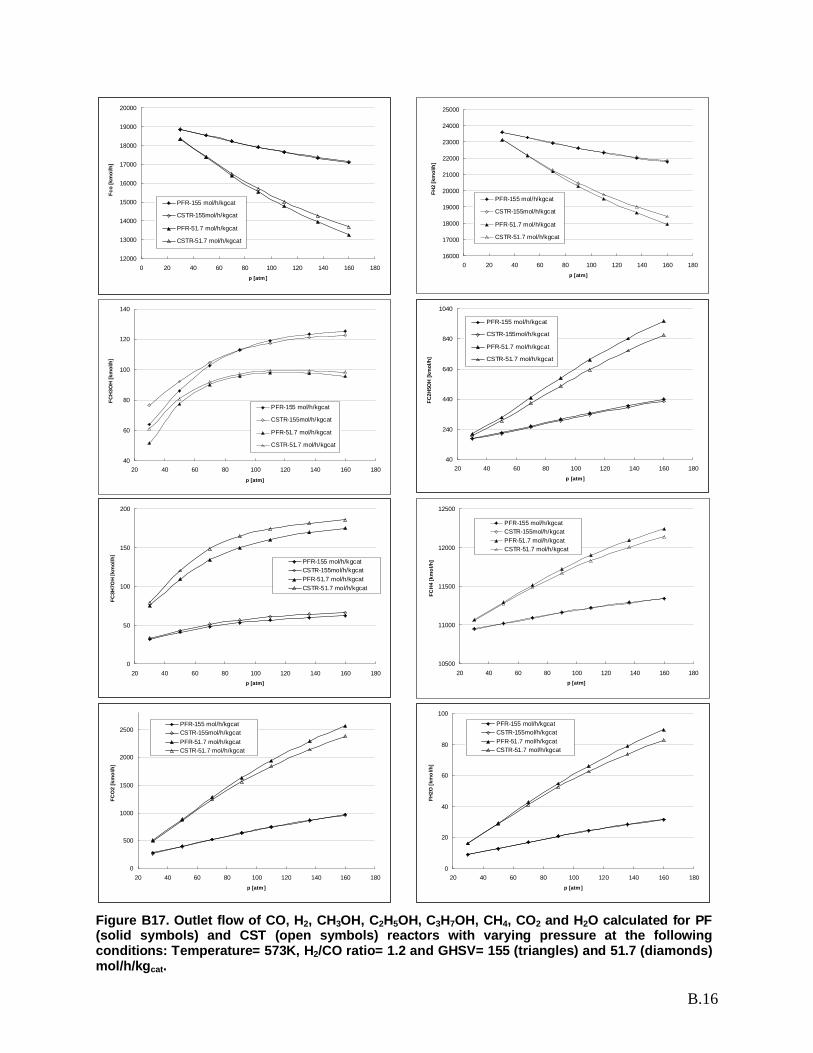
B.16
12000
13000
14000
15000
16000
17000
18000
19000
20000
0 20 40 60 80 100 120 140 160 180p [atm ]
Fco
[km
ol/h
]
PFR-155 mol/h/kgcat
CSTR-155mol/h/kgcat
PFR-51.7 mol/h/kgcat
CSTR-51.7 mol/h/kgcat
16000
17000
18000
19000
20000
21000
22000
23000
24000
25000
0 20 40 60 80 100 120 140 160 180p [atm]
FH2
[km
ol/h
]
PFR-155 mol/h/kgcat
CSTR-155mol/h/kgcat
PFR-51.7 mol/h/kgcat
CSTR-51.7 mol/h/kgcat
40
60
80
100
120
140
20 40 60 80 100 120 140 160 180p [atm]
FCH
3OH
[km
ol/h
]
PFR-155 mol/h/kgcat
CSTR-155mol/h/kgcat
PFR-51.7 mol/h/kgcat
CSTR-51.7 mol/h/kgcat
40
240
440
640
840
1040
20 40 60 80 100 120 140 160 180p [atm]
FC2H
5OH
[km
ol/h
]
PFR-155 mol/h/kgcat
CSTR-155mol/h/kgcat
PFR-51.7 mol/h/kgcat
CSTR-51.7 mol/h/kgcat
0
50
100
150
200
20 40 60 80 100 120 140 160 180p [atm]
FC3H
7OH
[km
ol/h
]
PFR-155 mol/h/kgcatCSTR-155mol/h/kgcatPFR-51.7 mol/h/kgcatCSTR-51.7 mol/h/kgcat
10500
11000
11500
12000
12500
20 40 60 80 100 120 140 160 180p [atm]
FCH
4 [k
mol
/h]
PFR-155 mol/h/kgcatCSTR-155mol/h/kgcatPFR-51.7 mol/h/kgcatCSTR-51.7 mol/h/kgcat
0
500
1000
1500
2000
2500
20 40 60 80 100 120 140 160 180p [atm]
FCO
2 [k
mol
/h]
PFR-155 mol/h/kgcatCSTR-155mol/h/kgcatPFR-51.7 mol/h/kgcatCSTR-51.7 mol/h/kgcat
0
20
40
60
80
100
20 40 60 80 100 120 140 160 180p [atm]
FH2O
[km
ol/h
]
PFR-155 mol/h/kgcatCSTR-155mol/h/kgcatPFR-51.7 mol/h/kgcatCSTR-51.7 mol/h/kgcat
Figure B17. Outlet flow of CO, H2, CH3OH, C2H5OH, C3H7OH, CH4, CO2 and H2O calculated for PF(solid symbols) and CST (open symbols) reactors with varying pressure at the followingconditions: Temperature= 573K, H2/CO ratio= 1.2 and GHSV= 155 (triangles) and 51.7 (diamonds)mol/h/kgcat.
B.17
From Figure B16 it is clear that it is possible to increase the CO and the H2 conversionsimply by increasing the temperature and decreasing the GHSV. In addition, from Figure B16 itis evident that, working at fixed temperature and decreasing the GHSV, it is possible tomaximize the selectivity to C2+ alcohols. In the same manner, it is clear that increasing thetemperature, at fixed GHSV, it is possible to maximize the C3H7OH selectivity.
These trends are typical of chemical systems in which there are consecutive reactions, i.e.reactions following the generic scheme:
A -> B -> CIn the case of the mixed alcohols synthesis, in particular, this generic scheme can be written
as the sum of the two following reactions paths:CO + H2 -> CH3OH -> C2H5OH -> C3H7OHCO + H2 -> CH3OH -> CH4
This means that methanol and ethanol are intermediates compounds in the higher alcoholssynthesis reaction, so their outlet flows depend, as it is also clear from the balance equations (12-13), from the rates of formation of methanol, ethanol and methane in the case of methanol andfrom both the rates of formation of ethanol and propanol in the case of ethanol.
So, the effect of the temperature on the net reaction rate of these components (i.e. the outletflows of these compounds) is complex, deriving from the linear combination of more than one“Arrhenius-type” equations. This justifies the graphs reported in Figure B16, which show amaximum in the outlet flow of methanol and ethanol with respect to the temperature.
Concerning the effects of pressure, from Figure B17 it is clear that increasing pressureresults in higher conversions of the reactants and, in the investigated range, also in higheralcohols selectivities.
This monotonic and limited effect of the pressure on the CO conversion and alcoholsselectivity can be ascribed to the limited effect of the pressure on the kinetic laws of the reactionsinvolved in the mixed alcohols synthesis and it evidences that the temperature and the GHSV arethe two major parameters to vary in order to optimize both the CO conversion and the higheralcohols selectivity.
B.1.6 Implementation of the kinetic model in a Fortran subroutineOn the basis of the received template USRKIN.f, we have developed two different Fortran
codes to be interfaced with the process simulator ASPEN. Such routines are able to evaluate thegross rates of formation of CO, H2, CH3OH, C2H5OH, C3H7OH, CH4, H2O and CO2 in amultitubolar plug flow reactor and in a continuous stirred tank reactor on the basis of thefollowing parameters supplied by Aspen:
• Molar fraction of the inlet components• Temperature [K]• Pressure [Pa]• Mass of catalyst [kg]In the program we used the system of kinetic equation represented by eq.s 6, 9-11, with
parameter estimates as in Table B3. In addition we inserted into the model the water-gas shiftreaction, with rate equation (17). The equilibrium constant for the water gas shift reaction wascalculated as a function of temperature according to equation (18) [11].
B.18
B.1.7 Comparison between the results obtained using ASPEN and the Fortranprogram
In order to check the subroutine developed and its correct interface with Aspen, wesimulated the two PF and CST reactors for a set of conditions supplied by Xun Wang, i.e.:Temperature = 573 KPressure = 136 barFeed flow rates [kmol/s]:
H2 6.5691 CO 5.3216 Ar 0.369 N2 1.1275 CO2 0.0336 H2O 0.0012 CH4 3.0101 METHANOL 0.03312359 ETHANOL 0.04081143 PROPANOL 0.00349779
The obtained CO conversion data, as well as the calculated product distributions arereported in table B4. The same table also shows the results calculated by Xun Wang usingAspen.
Table B4. The product distribution calculated for PF reactor with Aspen and with the Fortran code,for the reaction condition reported above
Aspen(kmol/s)
Fortran(kmol/s)
CO 4.8099 4.8136CO2 0.2435 0.2428H2 6.0559 6.1102Ar 0.369N2 1.1275 1.6547*
H2O 0.0079 0.0079CH3OH 0.0344 0.0343C2H5OH 0.1113 0.1113C3H7OH 0.0167 0.0166CH4 3.1298 3.1369XCO (%) 9.62 9.58* In the FORTRAN code we used only onespecies representing all the inert gasestogether i.e., the lump of nitrogen and argon.
From the data reported in Table B4 it can be concluded that the two programs leads toessentially the same results.
We note that all calculations were performed for single-pass process (i.e., with no recycle).In the case of the presence of a recycle, large quantity of CO2 would be present in the feed.Although the literature sources we have worked with did not investigate the effect of CO2
B.19
content in the feed on the behaviour of the catalyst, it is likely that this compound affect theactivity of the catalyst.
As matter of facts, the inhibiting effect of the presence of CO2 in the feed on the higheralcohol synthesis has been demonstrated for a ZnCrO+15%Cs2O catalyst [2]. In this case, thepresence of 6% CO2 in the feed depresses the yield of higher alcohols by a factor of three.Methanol formation is only marginally affected, however, so that the relative content of higheralcohol with respect to methanol is greatly reduced. It is also worth noticing that the presence ofcarbon dioxide in the feed causes greater amounts of water to be produced via the water gas shiftreaction. The inhibiting effects of the CO2 were explained by assuming that water rather thanCO2 inhibits the HAS reaction by competing for adsorption with the intermediate C1-species onthe catalyst surface.
B.1.8 ConclusionsOn the basis of a kinetic analysis reported in the literature for the synthesis of higher
alcohols from CO/H2 mixtures over a Mo-based catalyst [6], a Fortran subroutine to beintegrated in Aspen able to estimate the rate of formation of the main products of the synthesis(i.e. methanol, ethanol, propanol, methane, carbon dioxide and water) was developed.
The ability of the lumped kinetic model to predict the CO conversion and the productdistribution of the higher alcohol synthesis over Mo-based catalysts was validated againstexperimental data measured at different reaction conditions (type of reactor, catalyst, T, P, inletflows, GHSV) obtained from various literature sources [6, 12, 13].
Finally, an analysis of the effect of temperature and pressure on the CO conversion and onthe products distribution was performed. It was so verified that higher temperature and pressureand lower space velocities have a positive effect on the conversion of CO. The optimization ofthe process conditions, however, should be performed also on the basis of the productsselectivities, that exhibit a complex trend with increasing temperature and pressure.
The lumped kinetic model has been implemented in a FORTRAN subroutine which hasbeen successfully interfaced with the ASPEN process simulation program.
B.2 Additional results and model validation
B.2.1 IntroductionIn our previous paragraphs of Appendix B we have discussed the results of a Fortran
subroutine developed on the basis of a lumped kinetic analysis described in the literature [12] forthe synthesis of higher alcohols from CO/H2 mixtures over a Mo-based catalyst. The derivedkinetics were able to estimate the rates of formation of the main products of the synthesis (i.e.methanol, ethanol, propanol, methane, carbon dioxide and water).
The ability of the lumped kinetic model to predict the CO conversion in the higher alcoholsynthesis over Mo-based catalysts was validated against experimental data measured at differentreaction conditions (type of reactor, catalyst, T, P, inlet flows, GHSV) obtained from variousliterature sources [6, 12, 13]. In our previous report we have shown that in order to obtain goodfits of CO conversion the gross rates must be multiplied by a factor equal to 2. In this way wewere able to achieve a good fit of the experimental CO conversion data from three differentsources [6, 12, 13].
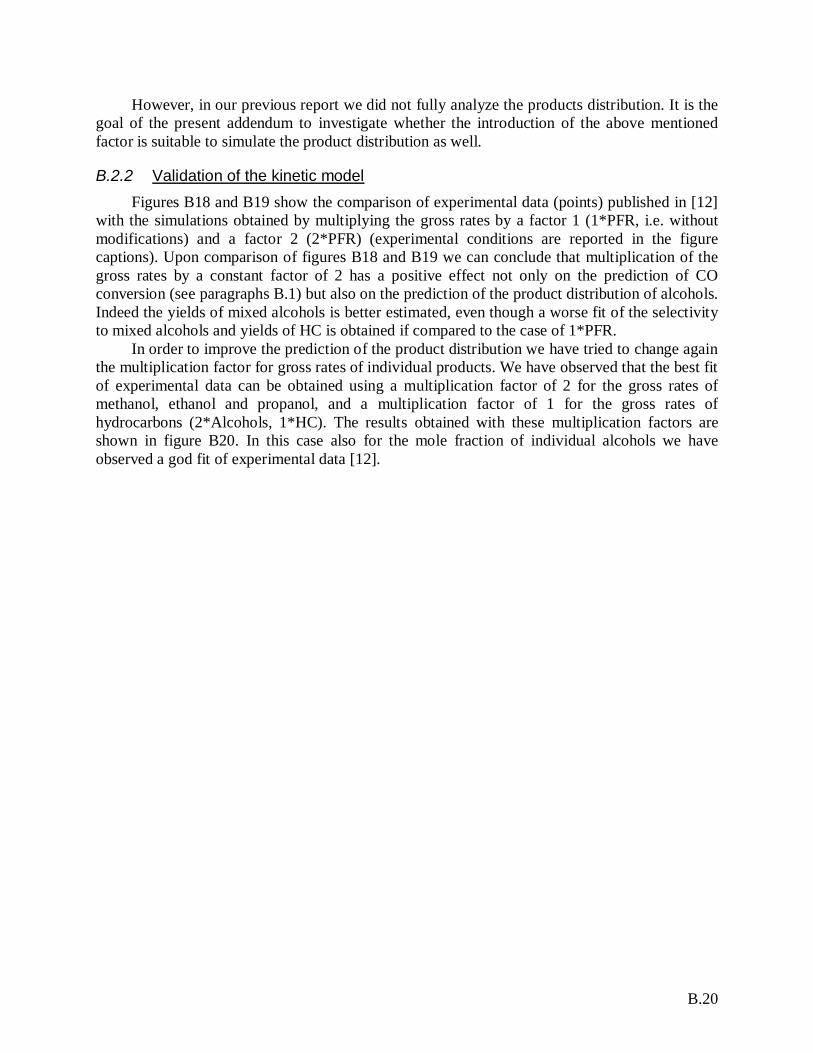
B.20
However, in our previous report we did not fully analyze the products distribution. It is thegoal of the present addendum to investigate whether the introduction of the above mentionedfactor is suitable to simulate the product distribution as well.
B.2.2 Validation of the kinetic modelFigures B18 and B19 show the comparison of experimental data (points) published in [12]
with the simulations obtained by multiplying the gross rates by a factor 1 (1*PFR, i.e. withoutmodifications) and a factor 2 (2*PFR) (experimental conditions are reported in the figurecaptions). Upon comparison of figures B18 and B19 we can conclude that multiplication of thegross rates by a constant factor of 2 has a positive effect not only on the prediction of COconversion (see paragraphs B.1) but also on the prediction of the product distribution of alcohols.Indeed the yields of mixed alcohols is better estimated, even though a worse fit of the selectivityto mixed alcohols and yields of HC is obtained if compared to the case of 1*PFR.
In order to improve the prediction of the product distribution we have tried to change againthe multiplication factor for gross rates of individual products. We have observed that the best fitof experimental data can be obtained using a multiplication factor of 2 for the gross rates ofmethanol, ethanol and propanol, and a multiplication factor of 1 for the gross rates ofhydrocarbons (2*Alcohols, 1*HC). The results obtained with these multiplication factors areshown in figure B20. In this case also for the mole fraction of individual alcohols we haveobserved a god fit of experimental data [12].
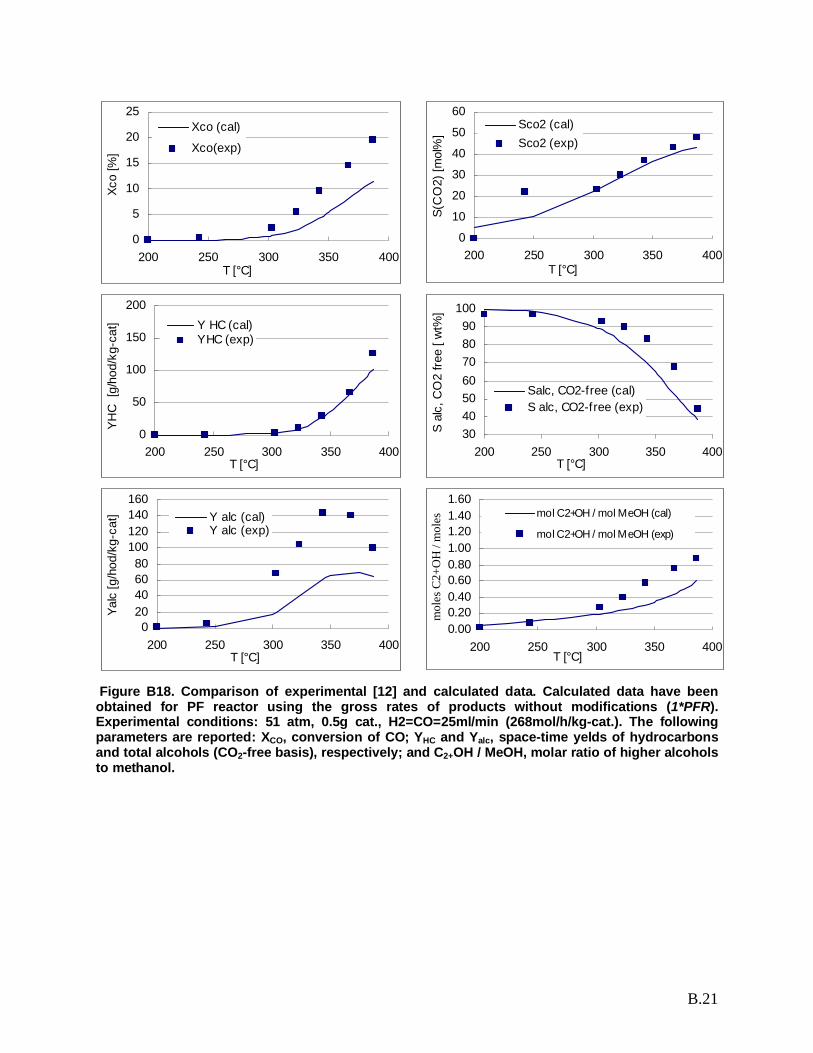
B.21
0
5
10
15
20
25
200 250 300 350 400T [°C]
Xco
[%]
Xco (cal)
Xco(exp)
0
10
20
30
40
50
60
200 250 300 350 400T [°C]
S(C
O2)
[mol
%]
Sco2 (cal)Sco2 (exp)
0
50
100
150
200
200 250 300 350 400T [°C]
YHC
[g/
hod/
kg-c
at] Y HC (cal)
YHC (exp)
30405060708090
100
200 250 300 350 400T [°C]
S al
c, C
O2
free
[ wt%
]
Salc, CO2-free (cal)S alc, CO2-free (exp)
020406080
100120140160
200 250 300 350 400T [°C]
Yalc
[g/h
od/k
g-ca
t] Y alc (cal)Y alc (exp)
0.000.200.400.600.801.001.201.401.60
200 250 300 350 400T [°C]
mol C2+OH / mol MeOH (cal)
mol C2+OH / mol MeOH (exp)
Figure B18. Comparison of experimental [12] and calculated data. Calculated data have beenobtained for PF reactor using the gross rates of products without modifications (1*PFR).Experimental conditions: 51 atm, 0.5g cat., H2=CO=25ml/min (268mol/h/kg-cat.). The followingparameters are reported: XCO, conversion of CO; YHC and Yalc, space-time yelds of hydrocarbonsand total alcohols (CO2-free basis), respectively; and C2+OH / MeOH, molar ratio of higher alcoholsto methanol.
mol
es C
2+O
H /
mol
esM
eOH
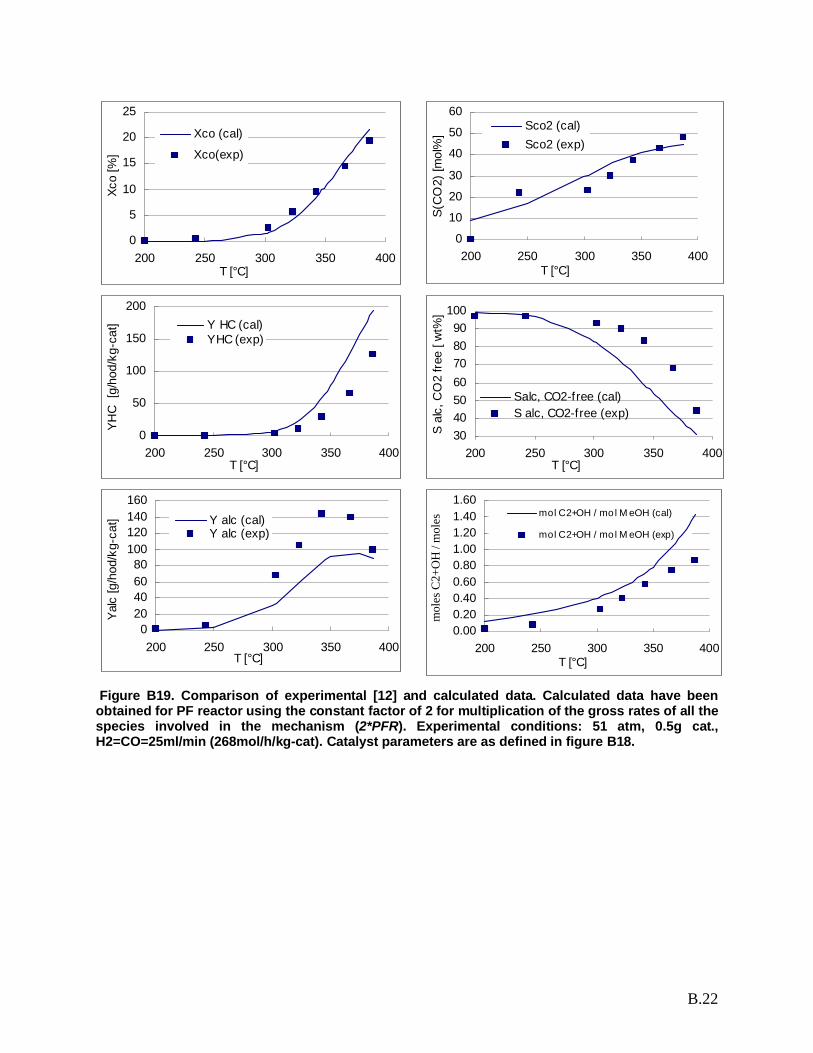
B.22
0
5
10
15
20
25
200 250 300 350 400T [°C]
Xco
[%]
Xco (cal)
Xco(exp)
0
10
20
30
40
50
60
200 250 300 350 400T [°C]
S(C
O2)
[mol
%]
Sco2 (cal)Sco2 (exp)
0
50
100
150
200
200 250 300 350 400T [°C]
YHC
[g/
hod/
kg-c
at] Y HC (cal)
YHC (exp)
30405060708090
100
200 250 300 350 400T [°C]
S al
c, C
O2
free
[ wt%
]
Salc, CO2-free (cal)S alc, CO2-free (exp)
020406080
100120140160
200 250 300 350 400T [°C]
Yalc
[g/h
od/k
g-ca
t] Y alc (cal)Y alc (exp)
0.000.200.400.600.801.001.201.401.60
200 250 300 350 400T [°C]
mol C2+OH / mo l M eOH (cal)
mol C2+OH / mo l M eOH (exp)
Figure B19. Comparison of experimental [12] and calculated data. Calculated data have beenobtained for PF reactor using the constant factor of 2 for multiplication of the gross rates of all thespecies involved in the mechanism (2*PFR). Experimental conditions: 51 atm, 0.5g cat.,H2=CO=25ml/min (268mol/h/kg-cat). Catalyst parameters are as defined in figure B18.
mol
es C
2+O
H /
mol
esM
eOH
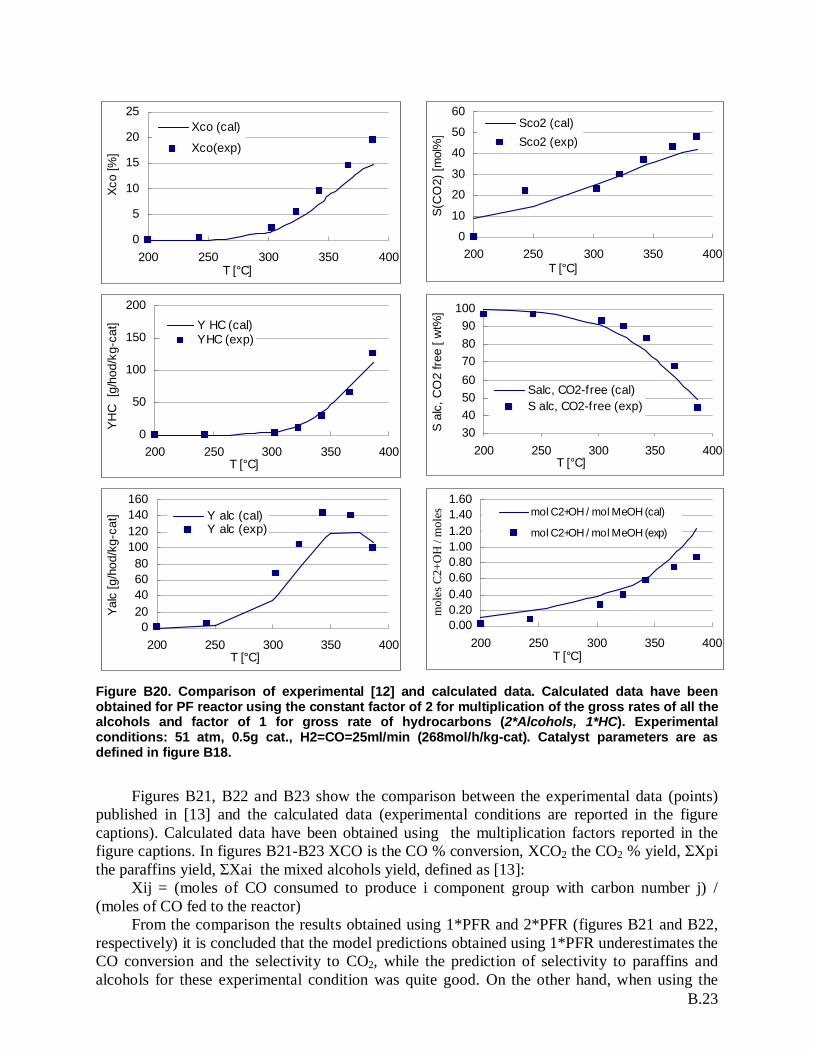
B.23
0
5
10
15
20
25
200 250 300 350 400T [°C]
Xco
[%]
Xco (cal)
Xco(exp)
0
10
20
30
40
50
60
200 250 300 350 400T [°C]
S(C
O2)
[mol
%]
Sco2 (cal)Sco2 (exp)
0
50
100
150
200
200 250 300 350 400T [°C]
YHC
[g/
hod/
kg-c
at] Y HC (cal)
YHC (exp)
30405060708090
100
200 250 300 350 400T [°C]
S al
c, C
O2
free
[ wt%
]
Salc, CO2-free (cal)S alc, CO2-free (exp)
020406080
100120140160
200 250 300 350 400T [°C]
Yalc
[g/h
od/k
g-ca
t] Y alc (cal)Y alc (exp)
0.000.200.400.600.801.001.201.401.60
200 250 300 350 400T [°C]
mol C2+OH / mol MeOH (cal)
mol C2+OH / mol MeOH (exp)
Figure B20. Comparison of experimental [12] and calculated data. Calculated data have beenobtained for PF reactor using the constant factor of 2 for multiplication of the gross rates of all thealcohols and factor of 1 for gross rate of hydrocarbons (2*Alcohols, 1*HC). Experimentalconditions: 51 atm, 0.5g cat., H2=CO=25ml/min (268mol/h/kg-cat). Catalyst parameters are asdefined in figure B18.
Figures B21, B22 and B23 show the comparison between the experimental data (points)published in [13] and the calculated data (experimental conditions are reported in the figurecaptions). Calculated data have been obtained using the multiplication factors reported in thefigure captions. In figures B21-B23 XCO is the CO % conversion, XCO2 the CO2 % yield, Xpithe paraffins yield, Xai the mixed alcohols yield, defined as [13]:
Xij = (moles of CO consumed to produce i component group with carbon number j) /(moles of CO fed to the reactor)
From the comparison the results obtained using 1*PFR and 2*PFR (figures B21 and B22,respectively) it is concluded that the model predictions obtained using 1*PFR underestimates theCO conversion and the selectivity to CO2, while the prediction of selectivity to paraffins andalcohols for these experimental condition was quite good. On the other hand, when using the
mol
es C
2+O
H /
mol
esM
eOH
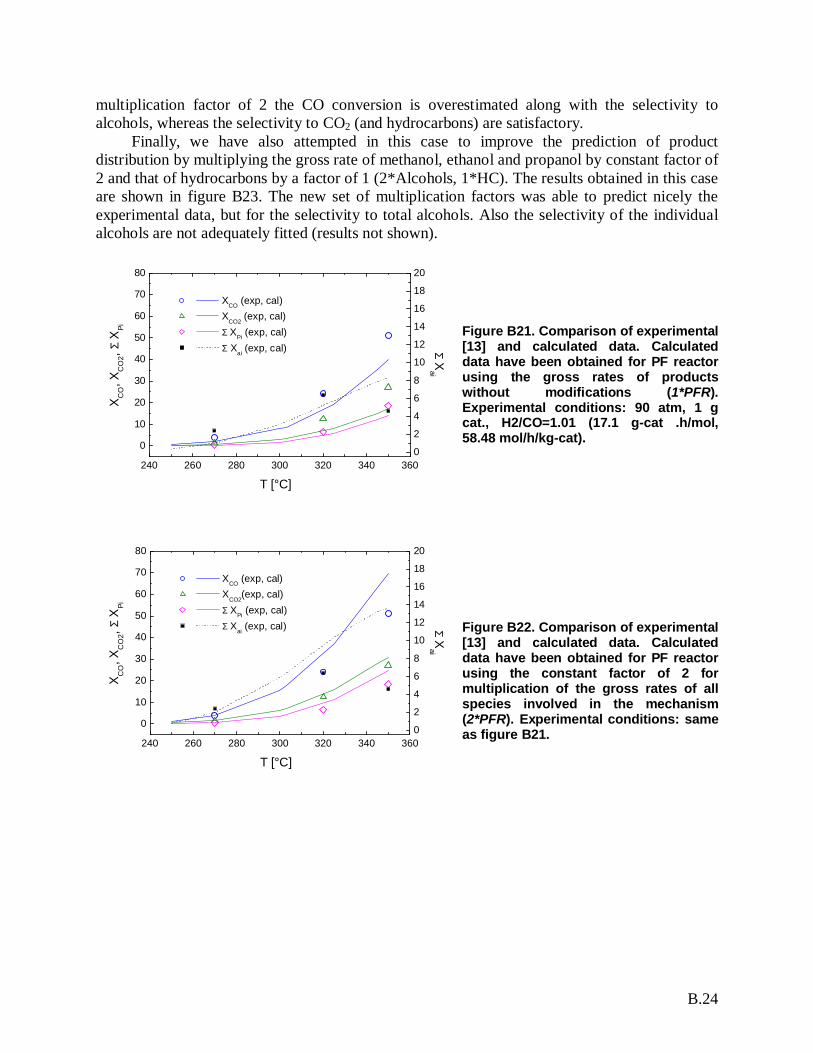
B.24
multiplication factor of 2 the CO conversion is overestimated along with the selectivity toalcohols, whereas the selectivity to CO2 (and hydrocarbons) are satisfactory.
Finally, we have also attempted in this case to improve the prediction of productdistribution by multiplying the gross rate of methanol, ethanol and propanol by constant factor of2 and that of hydrocarbons by a factor of 1 (2*Alcohols, 1*HC). The results obtained in this caseare shown in figure B23. The new set of multiplication factors was able to predict nicely theexperimental data, but for the selectivity to total alcohols. Also the selectivity of the individualalcohols are not adequately fitted (results not shown).
240 260 280 300 320 340 360
0
10
20
30
40
50
60
70
80
0
2
4
6
8
10
12
14
16
18
20
Σ Xai
X CO, X
CO
2,Σ
XPi
T [°C]
XCO (exp, cal) X
CO2 (exp, cal)
Σ XPi (exp, cal)Σ Xai (exp, cal)
Figure B21. Comparison of experimental[13] and calculated data. Calculateddata have been obtained for PF reactorusing the gross rates of productswithout modifications (1*PFR).Experimental conditions: 90 atm, 1 gcat., H2/CO=1.01 (17.1 g-cat .h/mol,58.48 mol/h/kg-cat).
240 260 280 300 320 340 360
0
10
20
30
40
50
60
70
80
0
2
4
6
8
10
12
14
16
18
20
Σ Xai
X CO, X
CO
2,Σ X
Pi
T [°C]
XCO (exp, cal) X
CO2(exp, cal)
Σ XPi (exp, cal)Σ Xai (exp, cal) Figure B22. Comparison of experimental
[13] and calculated data. Calculateddata have been obtained for PF reactorusing the constant factor of 2 formultiplication of the gross rates of allspecies involved in the mechanism(2*PFR). Experimental conditions: sameas figure B21.
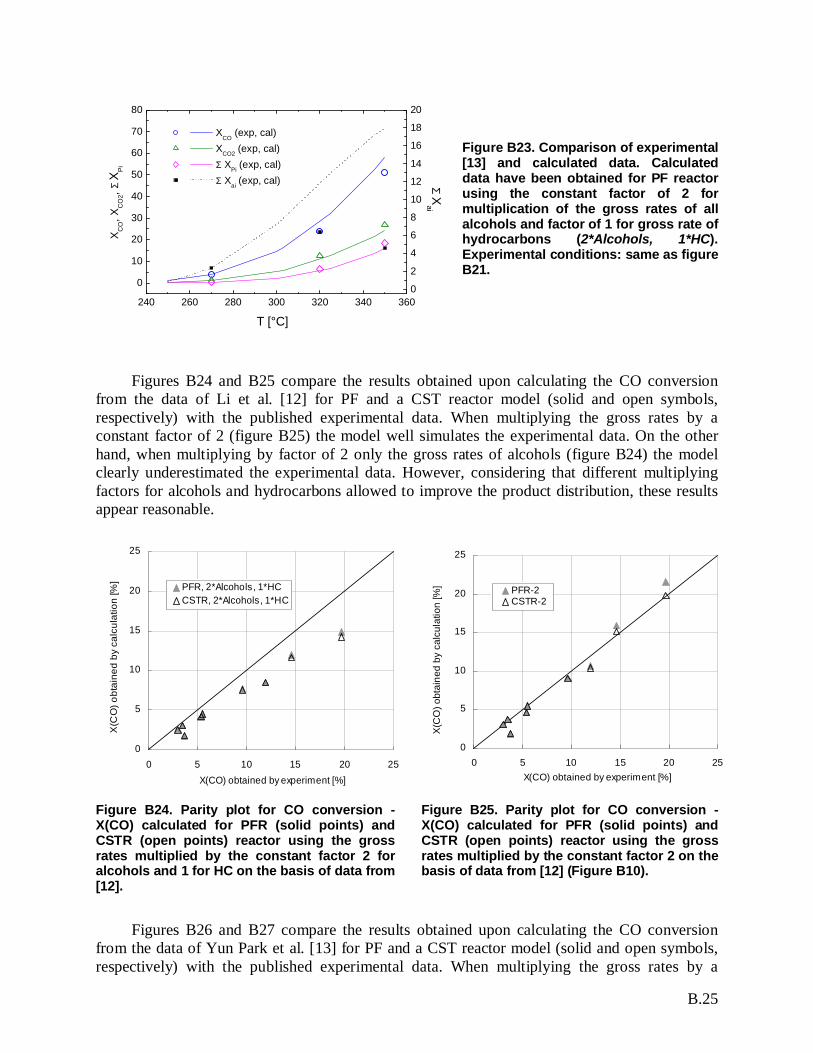
B.25
240 260 280 300 320 340 360
0
10
20
30
40
50
60
70
80
0
2
4
6
8
10
12
14
16
18
20
ΣX
ai
XC
O, X
CO
2,ΣX
Pi
T [°C]
XCO
(exp, cal) XCO2 (exp, cal)Σ XPi (exp, cal)Σ Xai (exp, cal)
Figure B23. Comparison of experimental[13] and calculated data. Calculateddata have been obtained for PF reactorusing the constant factor of 2 formultiplication of the gross rates of allalcohols and factor of 1 for gross rate ofhydrocarbons (2*Alcohols, 1*HC).Experimental conditions: same as figureB21.
Figures B24 and B25 compare the results obtained upon calculating the CO conversionfrom the data of Li et al. [12] for PF and a CST reactor model (solid and open symbols,respectively) with the published experimental data. When multiplying the gross rates by aconstant factor of 2 (figure B25) the model well simulates the experimental data. On the otherhand, when multiplying by factor of 2 only the gross rates of alcohols (figure B24) the modelclearly underestimated the experimental data. However, considering that different multiplyingfactors for alcohols and hydrocarbons allowed to improve the product distribution, these resultsappear reasonable.
0
5
10
15
20
25
0 5 10 15 20 25X(CO) obtained by experiment [%]
X(C
O) o
btai
ned
by c
alcu
latio
n [%
] PFR, 2*Alcohols, 1*HCCSTR, 2*Alcohols, 1*HC
0
5
10
15
20
25
0 5 10 15 20 25X(CO) obtained by experiment [%]
X(C
O) o
btai
ned
by c
alcu
latio
n [%
] PFR-2CSTR-2
Figure B24. Parity plot for CO conversion -X(CO) calculated for PFR (solid points) andCSTR (open points) reactor using the grossrates multiplied by the constant factor 2 foralcohols and 1 for HC on the basis of data from[12].
Figure B25. Parity plot for CO conversion -X(CO) calculated for PFR (solid points) andCSTR (open points) reactor using the grossrates multiplied by the constant factor 2 on thebasis of data from [12] (Figure B10).
Figures B26 and B27 compare the results obtained upon calculating the CO conversionfrom the data of Yun Park et al. [13] for PF and a CST reactor model (solid and open symbols,respectively) with the published experimental data. When multiplying the gross rates by a
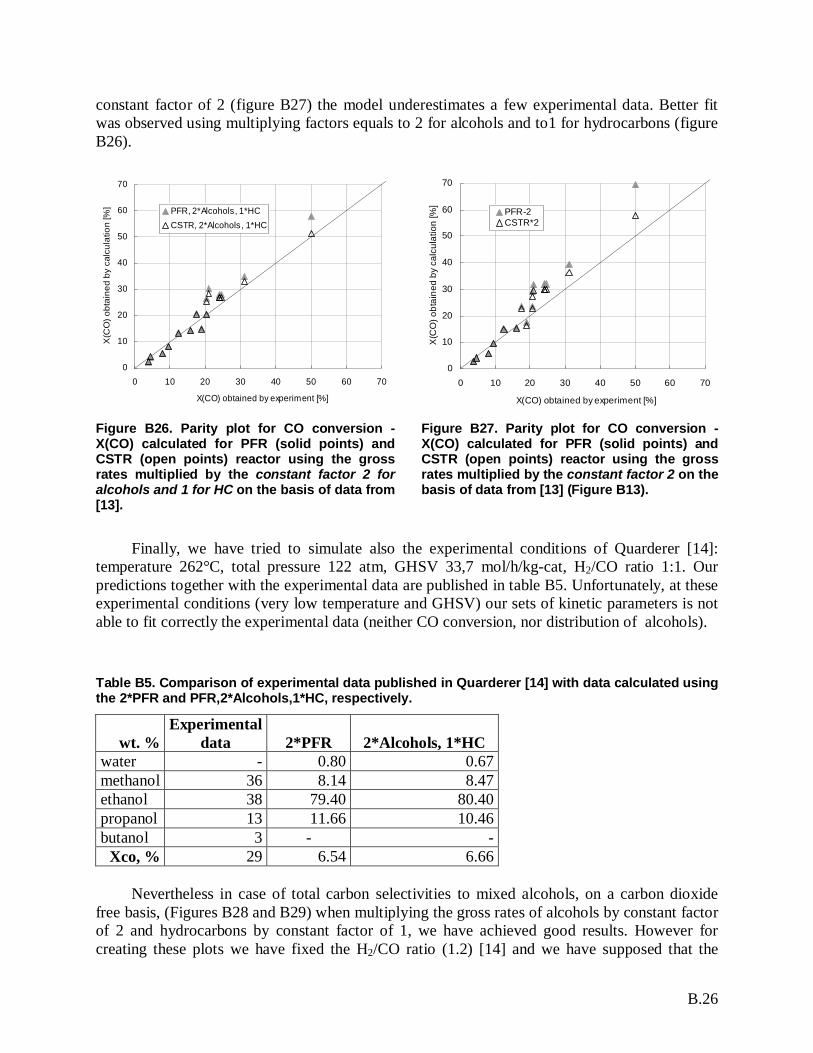
B.26
constant factor of 2 (figure B27) the model underestimates a few experimental data. Better fitwas observed using multiplying factors equals to 2 for alcohols and to1 for hydrocarbons (figureB26).
0
10
20
30
40
50
60
70
0 10 20 30 40 50 60 70
X(CO) obtained by experiment [%]
X(C
O) o
btai
ned
by c
alcu
latio
n [%
] PFR, 2*Alcohols, 1*HCCSTR, 2*Alcohols, 1*HC
0
10
20
30
40
50
60
70
0 10 20 30 40 50 60 70
X(CO) obtained by experiment [%]
X(C
O) o
btai
ned
by c
alcu
latio
n [%
]
PFR-2CSTR*2
Figure B26. Parity plot for CO conversion -X(CO) calculated for PFR (solid points) andCSTR (open points) reactor using the grossrates multiplied by the constant factor 2 foralcohols and 1 for HC on the basis of data from[13].
Figure B27. Parity plot for CO conversion -X(CO) calculated for PFR (solid points) andCSTR (open points) reactor using the grossrates multiplied by the constant factor 2 on thebasis of data from [13] (Figure B13).
Finally, we have tried to simulate also the experimental conditions of Quarderer [14]:temperature 262°C, total pressure 122 atm, GHSV 33,7 mol/h/kg-cat, H2/CO ratio 1:1. Ourpredictions together with the experimental data are published in table B5. Unfortunately, at theseexperimental conditions (very low temperature and GHSV) our sets of kinetic parameters is notable to fit correctly the experimental data (neither CO conversion, nor distribution of alcohols).
Table B5. Comparison of experimental data published in Quarderer [14] with data calculated usingthe 2*PFR and PFR,2*Alcohols,1*HC, respectively.
wt. %Experimental
data 2*PFR 2*Alcohols, 1*HCwater - 0.80 0.67methanol 36 8.14 8.47ethanol 38 79.40 80.40propanol 13 11.66 10.46butanol 3 - -
Xco, % 29 6.54 6.66
Nevertheless in case of total carbon selectivities to mixed alcohols, on a carbon dioxidefree basis, (Figures B28 and B29) when multiplying the gross rates of alcohols by constant factorof 2 and hydrocarbons by constant factor of 1, we have achieved good results. However forcreating these plots we have fixed the H2/CO ratio (1.2) [14] and we have supposed that the
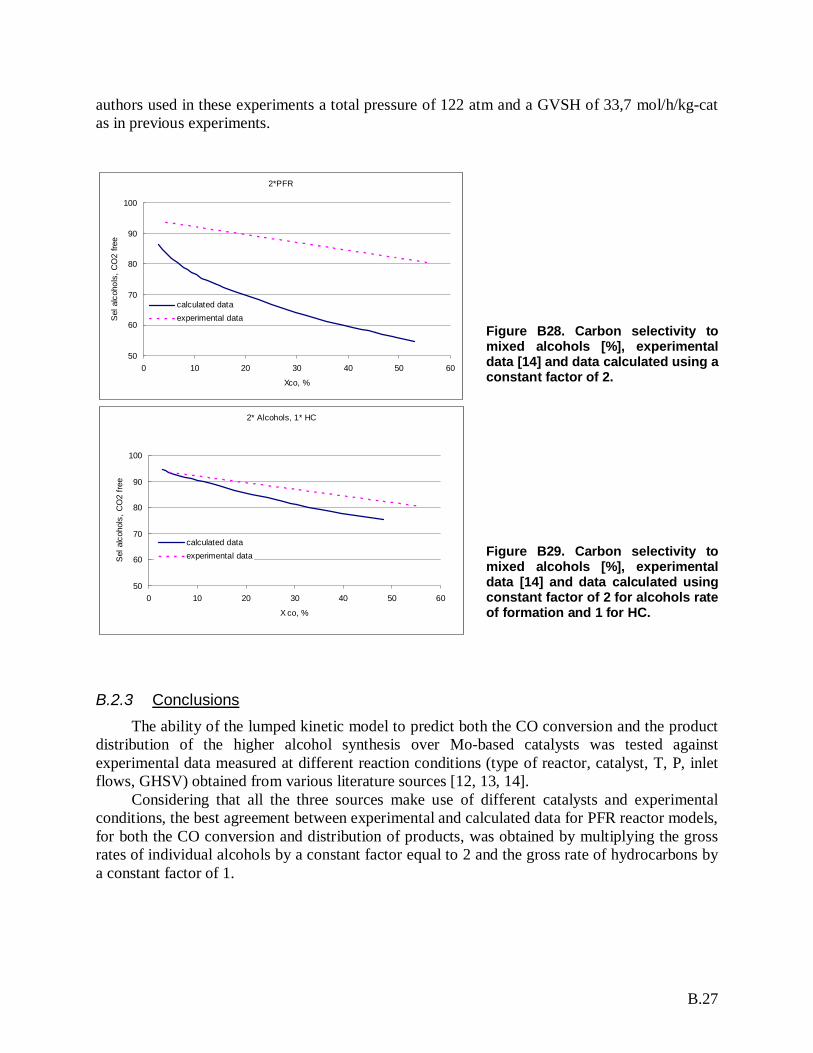
B.27
authors used in these experiments a total pressure of 122 atm and a GVSH of 33,7 mol/h/kg-catas in previous experiments.
2*PFR
50
60
70
80
90
100
0 10 20 30 40 50 60
Xco, %
Sel
alc
ohol
s, C
O2
free
calculated dataexperimental data
Figure B28. Carbon selectivity tomixed alcohols [%], experimentaldata [14] and data calculated using aconstant factor of 2.
2* Alcohols, 1* HC
50
60
70
80
90
100
0 10 20 30 40 50 60
X co, %
Sel
alc
ohol
s, C
O2
free
calculated dataexperimental data Figure B29. Carbon selectivity to
mixed alcohols [%], experimentaldata [14] and data calculated usingconstant factor of 2 for alcohols rateof formation and 1 for HC.
B.2.3 ConclusionsThe ability of the lumped kinetic model to predict both the CO conversion and the product
distribution of the higher alcohol synthesis over Mo-based catalysts was tested againstexperimental data measured at different reaction conditions (type of reactor, catalyst, T, P, inletflows, GHSV) obtained from various literature sources [12, 13, 14].
Considering that all the three sources make use of different catalysts and experimentalconditions, the best agreement between experimental and calculated data for PFR reactor models,for both the CO conversion and distribution of products, was obtained by multiplying the grossrates of individual alcohols by a constant factor equal to 2 and the gross rate of hydrocarbons bya constant factor of 1.
B.28
B.3 Literature cited[1] G. Natta, U. Colombo, I. Pasquon, in Catalysis (P.H. Ammet, Ed.), Vol V., Charter 3,
Reinhold, New York, 1957, p.131.[2] P. Forzatti, E. Tronconi, I. Pasquon, Catal. Rev.-Sci.Eng., 33 (1&2), 109-168 (1991).[3] K.A.N. Verkerk, B. Jaeger, C.-H. Finkeldei, W. Keim, Appl. Catal. A: General, 186, 407-
431 (1999).[4] R.G. Herman, Catal. Today, 55, 233-245 (2000).[5] Z. Liu, X. Li, M.R. Close, E.L. Kugler, J.L. Peterson, D.B. Dadyburjor, Ind. Eng. Chem.
Res., 36, 3085-3093 (1997).[6] A.N. Gunturu, E.L. Kugler, J.B. Cropley, D.B. Dadyburjor, Ind. Eng. Chem. Res., 37,
2107-2115 (1998).[7] A. Aden, P. Spath, B. Atherton, NREL Milestone Completion Report “The Potential of
thermochemical Ethanol Via Mixed Alcohols Production”, (2005).[8] Ullmann’s Encyclopedia of Industrial Chemistry, Fifth, Completely Revised Edition,
Volume A16, B. Elvers, S. Hawkins, G. Schulz (Eds.), ISBN 3-527-20116-5 (VCH,Wienheim).
[9] J.F. Painter and A.C. Hindmarsh, Computing and mathematics research division, 1-316,Lawrence Livermore national laboratory, Livermore, 1987.
[10] G. Buzzi-Ferraris, E. Tronconi, "BUNLSI - A FORTRAN program for solution ofsystems of nonlinear algebraic equations", Comput. Chem. Eng. 10, 129-141 (1986).
[11] L. Bisset, Chem. Eng. (N.Y.) 84 (1997) no.21, 155.[12] X. Li, L. Feng, Z. Liu, B. Zhong, D.B. Dadyburjor and E.L. Kugler, Ind. Eng. Chem.
Res., 37, 3853-3863 (1998).[13] T. Yun Park, I.S. Nam and Y. Gul Kim, Ind. Eng. Chem. Res., 36, 5246-5257 (1997).[14] G.J. Quarderer, 78th Spring National AIChe Meeting, April 6-10, 1986, New Orleanse,
Luisiana.
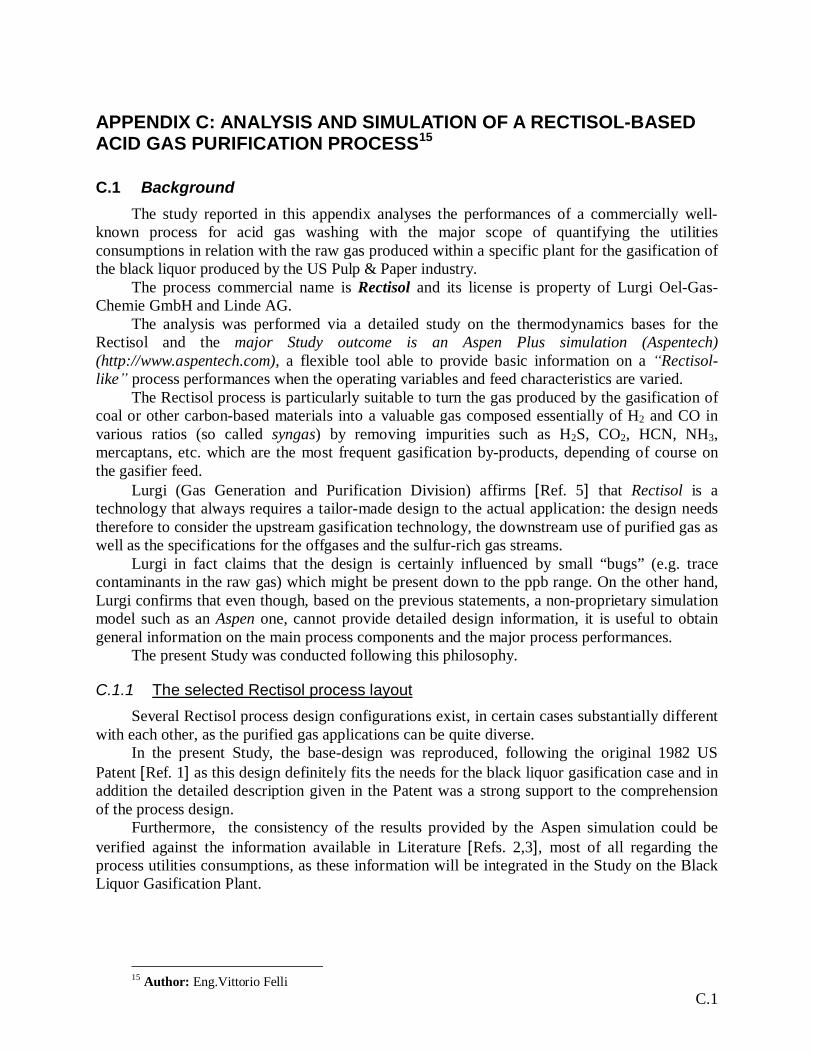
C.1
APPENDIX C: ANALYSIS AND SIMULATION OF A RECTISOL-BASEDACID GAS PURIFICATION PROCESS15
C.1 BackgroundThe study reported in this appendix analyses the performances of a commercially well-
known process for acid gas washing with the major scope of quantifying the utilitiesconsumptions in relation with the raw gas produced within a specific plant for the gasification ofthe black liquor produced by the US Pulp & Paper industry.
The process commercial name is Rectisol and its license is property of Lurgi Oel-Gas-Chemie GmbH and Linde AG.
The analysis was performed via a detailed study on the thermodynamics bases for theRectisol and the major Study outcome is an Aspen Plus simulation (Aspentech)(http://www.aspentech.com), a flexible tool able to provide basic information on a Rectisol-like process performances when the operating variables and feed characteristics are varied.
The Rectisol process is particularly suitable to turn the gas produced by the gasification ofcoal or other carbon-based materials into a valuable gas composed essentially of H2 and CO invarious ratios (so called syngas) by removing impurities such as H2S, CO2, HCN, NH3,mercaptans, etc. which are the most frequent gasification by-products, depending of course onthe gasifier feed.
Lurgi (Gas Generation and Purification Division) affirms [Ref. 5] that Rectisol is atechnology that always requires a tailor-made design to the actual application: the design needstherefore to consider the upstream gasification technology, the downstream use of purified gas aswell as the specifications for the offgases and the sulfur-rich gas streams.
Lurgi in fact claims that the design is certainly influenced by small “bugs” (e.g. tracecontaminants in the raw gas) which might be present down to the ppb range. On the other hand,Lurgi confirms that even though, based on the previous statements, a non-proprietary simulationmodel such as an Aspen one, cannot provide detailed design information, it is useful to obtaingeneral information on the main process components and the major process performances.
The present Study was conducted following this philosophy.
C.1.1 The selected Rectisol process layoutSeveral Rectisol process design configurations exist, in certain cases substantially different
with each other, as the purified gas applications can be quite diverse.In the present Study, the base-design was reproduced, following the original 1982 US
Patent [Ref. 1] as this design definitely fits the needs for the black liquor gasification case and inaddition the detailed description given in the Patent was a strong support to the comprehensionof the process design.
Furthermore, the consistency of the results provided by the Aspen simulation could beverified against the information available in Literature [Refs. 2,3], most of all regarding theprocess utilities consumptions, as these information will be integrated in the Study on the BlackLiquor Gasification Plant.
15 Author: Eng.Vittorio Felli
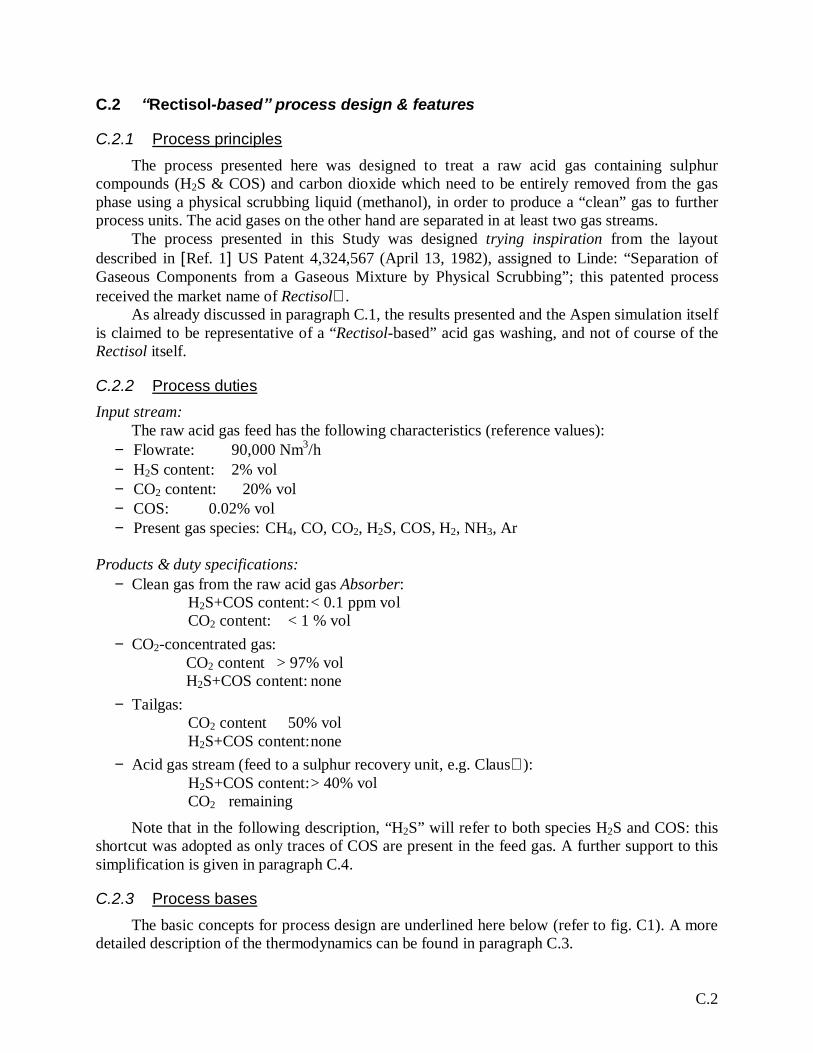
C.2
C.2 Rectisol-based process design & features
C.2.1 Process principlesThe process presented here was designed to treat a raw acid gas containing sulphur
compounds (H2S & COS) and carbon dioxide which need to be entirely removed from the gasphase using a physical scrubbing liquid (methanol), in order to produce a “clean” gas to furtherprocess units. The acid gases on the other hand are separated in at least two gas streams.
The process presented in this Study was designed trying inspiration from the layoutdescribed in [Ref. 1] US Patent 4,324,567 (April 13, 1982), assigned to Linde: “Separation ofGaseous Components from a Gaseous Mixture by Physical Scrubbing”; this patented processreceived the market name of Rectisol.
As already discussed in paragraph C.1, the results presented and the Aspen simulation itselfis claimed to be representative of a “Rectisol-based” acid gas washing, and not of course of theRectisol itself.
C.2.2 Process dutiesInput stream:
The raw acid gas feed has the following characteristics (reference values):− Flowrate: 90,000 Nm3/h− H2S content: 2% vol− CO2 content: 20% vol− COS: 0.02% vol− Present gas species: CH4, CO, CO2, H2S, COS, H2, NH3, Ar
Products & duty specifications:− Clean gas from the raw acid gas Absorber:
H2S+COS content: < 0.1 ppm volCO2 content: < 1 % vol
− CO2-concentrated gas: CO2 content > 97% vol H2S+COS content: none
− Tailgas:CO2 content 50% volH2S+COS content: none
− Acid gas stream (feed to a sulphur recovery unit, e.g. Claus):H2S+COS content: > 40% volCO2 remaining
Note that in the following description, “H2S” will refer to both species H2S and COS: thisshortcut was adopted as only traces of COS are present in the feed gas. A further support to thissimplification is given in paragraph C.4.
C.2.3 Process basesThe basic concepts for process design are underlined here below (refer to fig. C1). A more
detailed description of the thermodynamics can be found in paragraph C.3.
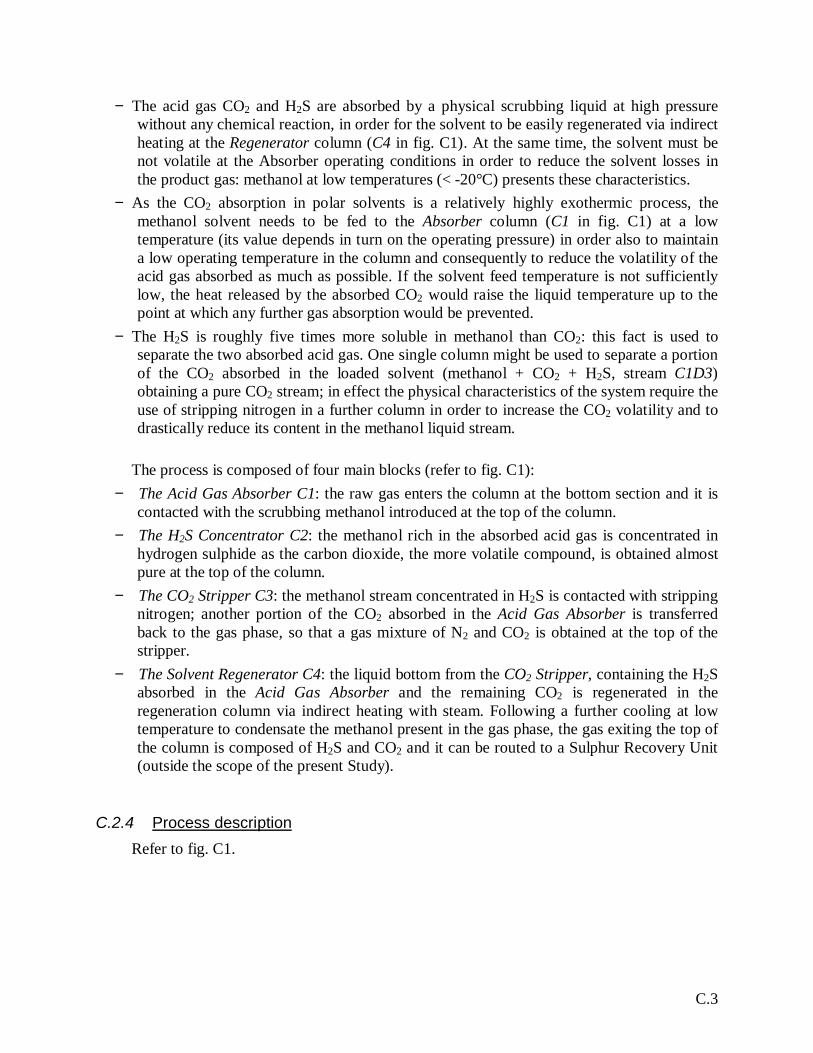
C.3
− The acid gas CO2 and H2S are absorbed by a physical scrubbing liquid at high pressurewithout any chemical reaction, in order for the solvent to be easily regenerated via indirectheating at the Regenerator column (C4 in fig. C1). At the same time, the solvent must benot volatile at the Absorber operating conditions in order to reduce the solvent losses inthe product gas: methanol at low temperatures (< -20°C) presents these characteristics.
− As the CO2 absorption in polar solvents is a relatively highly exothermic process, themethanol solvent needs to be fed to the Absorber column (C1 in fig. C1) at a lowtemperature (its value depends in turn on the operating pressure) in order also to maintaina low operating temperature in the column and consequently to reduce the volatility of theacid gas absorbed as much as possible. If the solvent feed temperature is not sufficientlylow, the heat released by the absorbed CO2 would raise the liquid temperature up to thepoint at which any further gas absorption would be prevented.
− The H2S is roughly five times more soluble in methanol than CO2: this fact is used toseparate the two absorbed acid gas. One single column might be used to separate a portionof the CO2 absorbed in the loaded solvent (methanol + CO2 + H2S, stream C1D3)obtaining a pure CO2 stream; in effect the physical characteristics of the system require theuse of stripping nitrogen in a further column in order to increase the CO2 volatility and todrastically reduce its content in the methanol liquid stream.
The process is composed of four main blocks (refer to fig. C1):− The Acid Gas Absorber C1: the raw gas enters the column at the bottom section and it is
contacted with the scrubbing methanol introduced at the top of the column.− The H2S Concentrator C2: the methanol rich in the absorbed acid gas is concentrated in
hydrogen sulphide as the carbon dioxide, the more volatile compound, is obtained almostpure at the top of the column.
− The CO2 Stripper C3: the methanol stream concentrated in H2S is contacted with strippingnitrogen; another portion of the CO2 absorbed in the Acid Gas Absorber is transferredback to the gas phase, so that a gas mixture of N2 and CO2 is obtained at the top of thestripper.
− The Solvent Regenerator C4: the liquid bottom from the CO2 Stripper, containing the H2Sabsorbed in the Acid Gas Absorber and the remaining CO2 is regenerated in theregeneration column via indirect heating with steam. Following a further cooling at lowtemperature to condensate the methanol present in the gas phase, the gas exiting the top ofthe column is composed of H2S and CO2 and it can be routed to a Sulphur Recovery Unit(outside the scope of the present Study).
C.2.4 Process descriptionRefer to fig. C1.
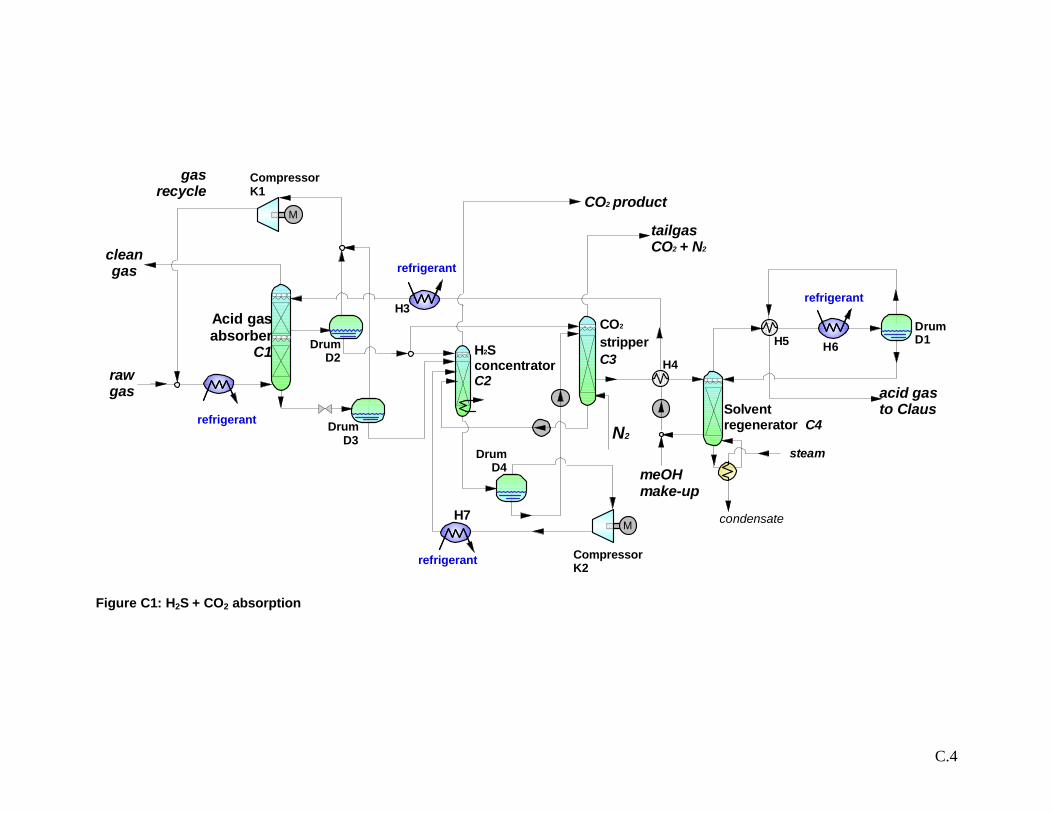
C.4
M
N2
CO2 product
condensate
steam
meOHmake-up
acid gasto Claus
M
rawgas
gasrecycle
cleangas
tailgasCO2 + N2
refrigerant
refrigerant
refrigerant
Acid gasabsorber
C1 H2SconcentratorC2
CO2
stripperC3
Solventregenerator C4
DrumD1Drum
D2
DrumD3
CompressorK1
CompressorK2
DrumD4
H5 H6
H3
H4
H7
refrigerant
Figure C1: H2S + CO2 absorption
C.5
C.2.4.1 The Acid Gas Absorber C1The pressure of the column was fixed at 32 bar based on the pressure of the raw feed gas
(EXH1), which is an external input. This high pressure raw gas stream EXH1 is pre-cooled in theexchanger H1 by the lean gas stream C1H1; it is then mixed with the recycle gas K1M2 to befinally cooled in the exchanger H2 before being introduced at the bottom stage of the absorbercolumn C1.
The absorber is composed of two columns, one on top of the other: part of the uppercolumn bottom liquid is introduced at the top of the bottom column while the gas exiting thebottom column feeds the upper column.
− The bottom column is the H2S Absorption Section where the H2S originally present in theraw gas is totally absorbed by the scrubbing methanol, while only part of the CO2 isabsorbed, as this is less soluble than H2S in methanol. Furthermore, as the CO2 absorptionin polar solvents is an exothermic phenomenon, the portion of absorbed CO2 in the bottomsection raises the liquid temperature in the column so that the driving force for the CO2absorption itself sharply decreases and the CO2 remaining in the gas phase requires afurther treatment in the upper section to be completely absorbed.
− In the upper section, the CO2 which left in the gas phase is completely absorbed by meansof the top low-temperature pure methanol liquid stream H3C1.
It is clear thereby that while pure methanol is fed at the top of the absorber C1, methanolrich in CO2 is fed at the top of the H2S absorber.
On the other hand, two liquid streams exit the absorber C1:− C1D2: rich in CO2 while no H2S is present− C1D3: rich in both acid gases H2S and CO2
Note that clearly other gases which are much less soluble in methanol with respect to H2Sand CO2 at the operating conditions might still be partially absorbed in the liquid phase and thiscould be a problem as they might be valuable products for purposes of the Process Designer. Tosolve this issue, two flash drums D2 and D3 at an intermediate pressure (7.5 bar) between theAbsorber and the Solvent Regenerator pressure were introduced: the less soluble gas (such asCO, H2, Ar,...) are re-transferred in the gas phase and they can be recycled to the column via thecompressor K1.
C.2.4.2 The H2S Concentrator C2This column is designed to enrich the down coming liquid in H2S by a selective desorption
of CO2, the less soluble component. Column C2 is composed of two sections:− The bottom section is the stripping column: both H2S-loaded streams D3C2 from the
absorber C1 and P4C2 from the CO2 Stripper are fed to the column to let the gas beingdesorbed. The stripping gas is provided by the low pressure (1 bara) flash vaporization ofthe bottom C2 residue C2D4 in drum D4: the gas phase is re-compressed throughcompressor K1, cooled in exchanger H7 and introduced at C2 bottom.
− The top section is the H2S absorber that in fact is absorbed by the stream S1C2, comingfrom the absorber C1, which is rich in CO2 but does not contain any H2S.
Therefore, two streams exit the H2S Concentrator C2:
C.6
− C2EX: gas stream exiting the top stage of the H2S Concentrator, which is composed ofCO2 (> 97% vol) and other gases, excluding H2S.
− P2C3: liquid stream containing both CO2 and H2S; a portion of these gaseous componentswas already released in the low pressure vessel D4.
C.2.4.3 The CO2 Stripper C3This column leads to a further extent the CO2 desorption from the acid gases rich solvent
from column C2 as it works at a lower pressure (2 bar) with respect to C2 and stripping nitrogenis used in order to obtain a tailgas with no H2S on top of the stripper. The Stripper C3 is againcomposed of two sections:
− the bottom one is the stripping section: the stream P2C3 is fed at the top (theoretic) platewhile the stripping nitrogen is introduced at the bottom one. Both CO2 and H2S arestripped from the liquid solvent.
− The gas leaving the bottom section is then scrubbed in the top one via the liquid streamS1C3 which comes from the absorber C1 and it is rich in CO2 but it does not contain anyH2S. In the top H2S scrubbing section, H2S is completely absorbed in the liquid phase.
Three product streams exit the CO2 Stripper C3:− C3EX: tailgas composed of CO2 and nitrogen, roughly in the same ratio.− C3H4: liquid stream containing the CO2 left in the solvent after the stripping columns and
practically the whole H2S which is absorbed in the Absorber C1. This stream is routed tothe Solvent Regenerator C4.
− C3P4: liquid stream to the bottom section of column C2.
C.2.4.4 The Solvent Regenerator C4The methanol solvent is fed to an intermediate plate of the atmospheric Regenerator C4
and the stripping heat is provided by the low pressure steam reboiler.As methanol boiling temperature at atmospheric pressure is around 65°C and methanol is
quite volatile at these operating conditions, the column top section is provided with a heatexchanger H6, fed by a refrigerant, which cools down the vapors to a temperature low enough (-10°C) that practically all the methanol is condensed and re-routed to the column C4 as reflux.
H6 is represented in fig. C1 as external to column C4, but indeed it is quite common havingit inside the very top section of the Regenerator, above the first plate.
This is a fundamental design item as it prevents high solvent losses.
C.2.5 Key process data & variables
C.2.5.1 CO2 heat of absorption in methanol.As already pointed out, the CO2 absorption in polar solvents is an exothermic phenomenon:
if the heat released increases the scrubbing liquid temperature above a certain point, dependingon the Absorber pressure, the absorption cannot take place and only a very small part of thecolumn is effective.Two process variables are strictly dependent on this phenomenon:
− the scrubbing methanol circulation rate to the Absorber C1 (and consequently, for a fixedgas rate fed to the column, the molar ratio liquid/gas);
− the scrubbing methanol feed temperature to Absorber C1.
C.7
Both variables contribute to maintain a sufficiently low operating temperature inside theAbsorber and consequently a good acid gas absorption level: the first variable, which must beabove a minimum, provides a sufficiently high liquid heat capacity, while the second variable,which must be below a maximum, prevents any hot spot throughout the column.
This basic equations and models governing the effect of the previous variables areextensively presented in paragraph C.3, while figures C2-C3 show the effect of the methanolcirculation rate on the clean product gas quality.
C.2.5.2 Different H2S and CO2 solubility in methanolThis property guarantees the possibility of separating the two gases downstream of the
Absorber, obtaining therefore two CO2 rich gas streams containing no H2S. The relativesolubility of the two acid gases has a number of implications on the process design, mainly onthe solvent flowrates selected for the various column of the layout of fig. C1: as an example, theflow ratio between streams C1D2 and C1D3 is quite important for the Absorber design.
Refer again to paragraph C.3 for details.
C.2.5.3 Methanol volatilityAmong other polar solvents, methanol is used in Rectisol process as it is relatively cheap
and at the selected Absorber operating conditions it is not volatile: it is generally assumed thatthe solvent losses to the product gas are negligible.
C.2.6 Aspen Plus ModelThe model here presented was simulated with the Aspen Plus Process Simulator; the Aspen
Plus file, the heat and material balance together with the most useful concentration andtemperature profiles for the various column are reported in paragraph C.4.
The simulation performed provides all the information on the “Rectisol-based” plantincluded in the scope of the present Study.
It is quite important though reminding here that the process simulation performed in thepresent Study and the Rectisol process available on the market share the same design principlesbut of course a large amount of information related to Rectisol are not available in the Literatureas they are property of the Licensor. This implies that the model designed here must be taken asa first approximation of the industrial plant. This is particularly true for the secondary productstreams such as the “Tailgas” or the “CO2 gas”: in certain cases the Aspen Model cannot providefor these streams exactly the same characteristics that the Rectisol would provide and this is onlybecause of the lack of proprietary information.
C.2.7 Aspen Plus Model results and discussionThe results of the Aspen Plus process simulation are reported in detail in paragraph C.4.Here below, the overall results and performance parameters are presented in comparison
with the published data, in order to confirm the reliability of the Model.− Table C1: the Model and the original Patent [Ref. 1] are compared in terms of main
streams characteristics− Table C2: the Model and the original Patent [Ref. 1] are compared in terms of overall
performance parameters− Table C3: the Model utilities consumptions are compared to the data available in
Literature.
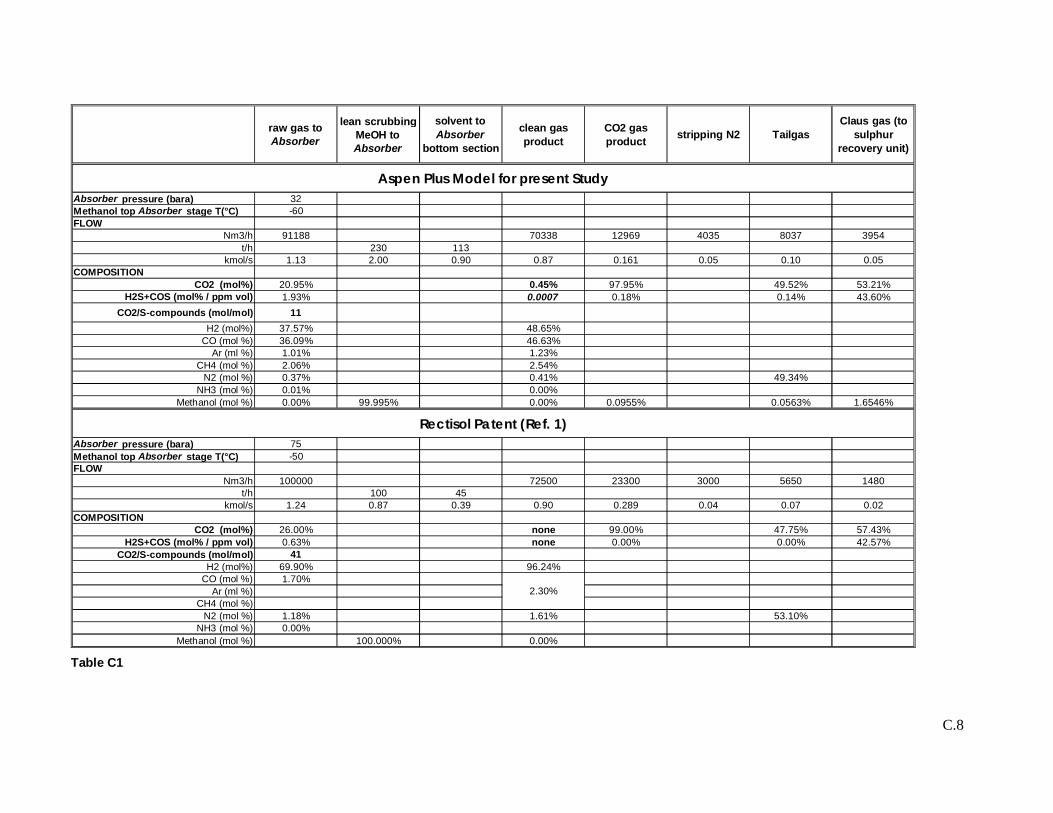
C.8
raw gas toAbsorber
lean scrubbingMeOH toAbsorber
solvent toAbsorber
bottom section
clean gasproduct
CO2 gasproduct stripping N2 Tailgas
Claus gas (tosulphur
recovery unit)
Absorber pressure (bara) 32Methanol top Absorber stage T(°C) -60FLOW
Nm3/h 91188 70338 12969 4035 8037 3954t/h 230 113
kmol/s 1.13 2.00 0.90 0.87 0.161 0.05 0.10 0.05COMPOSITION
CO2 (mol%) 20.95% 0.45% 97.95% 49.52% 53.21%H2S+COS (mol% / ppm vol) 1.93% 0.0007 0.18% 0.14% 43.60%
CO2/S-compounds (mol/mol) 11H2 (mol%) 37.57% 48.65%
CO (mol %) 36.09% 46.63%Ar (ml %) 1.01% 1.23%
CH4 (mol %) 2.06% 2.54%N2 (mol %) 0.37% 0.41% 49.34%
NH3 (mol %) 0.01% 0.00%Methanol (mol %) 0.00% 99.995% 0.00% 0.0955% 0.0563% 1.6546%
Absorber pressure (bara) 75Methanol top Absorber stage T(°C) -50FLOW
Nm3/h 100000 72500 23300 3000 5650 1480t/h 100 45
kmol/s 1.24 0.87 0.39 0.90 0.289 0.04 0.07 0.02COMPOSITION
CO2 (mol%) 26.00% none 99.00% 47.75% 57.43%H2S+COS (mol% / ppm vol) 0.63% none 0.00% 0.00% 42.57%
CO2/S-compounds (mol/mol) 41H2 (mol%) 69.90% 96.24%
CO (mol %) 1.70%Ar (ml %)
CH4 (mol %)N2 (mol %) 1.18% 1.61% 53.10%
NH3 (mol %) 0.00%Methanol (mol %) 100.000% 0.00%
Aspen Plus Model for present Study
Rectisol Patent (Ref. 1)
2.30%
Table C1
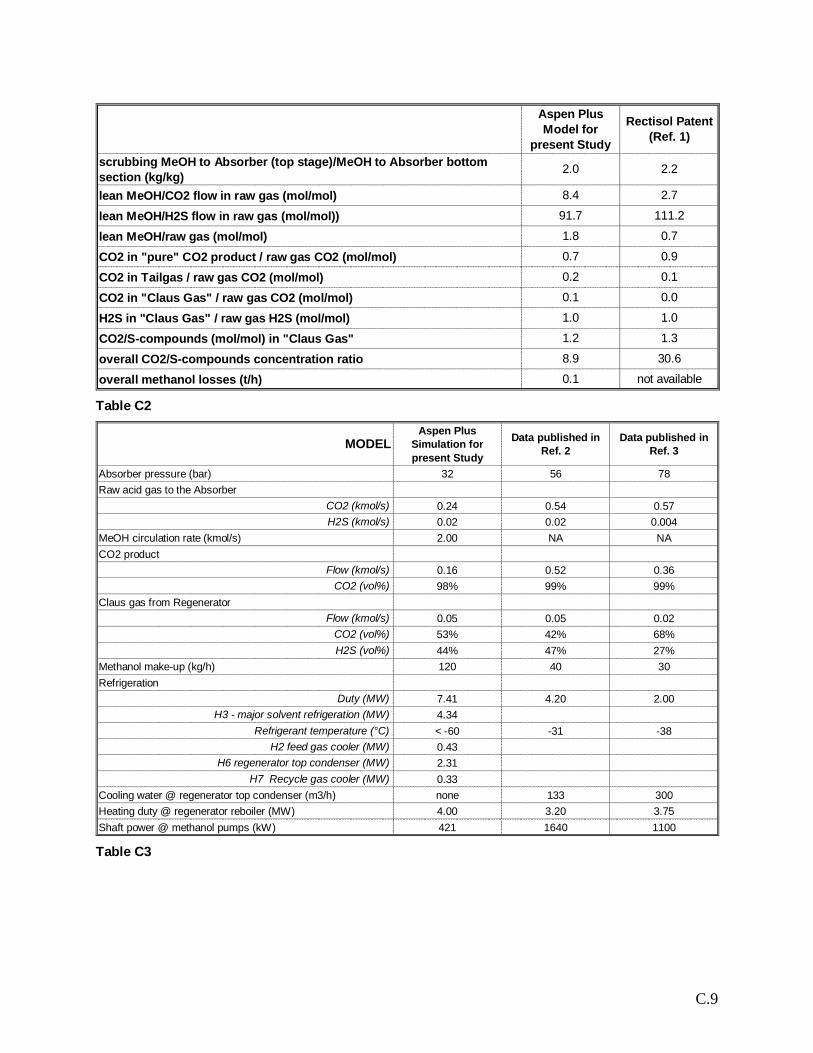
C.9
Aspen PlusModel for
present Study
Rectisol Patent(Ref. 1)
scrubbing MeOH to Absorber (top stage)/MeOH to Absorber bottomsection (kg/kg) 2.0 2.2
lean MeOH/CO2 flow in raw gas (mol/mol) 8.4 2.7
lean MeOH/H2S flow in raw gas (mol/mol)) 91.7 111.2
lean MeOH/raw gas (mol/mol) 1.8 0.7
CO2 in "pure" CO2 product / raw gas CO2 (mol/mol) 0.7 0.9
CO2 in Tailgas / raw gas CO2 (mol/mol) 0.2 0.1
CO2 in "Claus Gas" / raw gas CO2 (mol/mol) 0.1 0.0
H2S in "Claus Gas" / raw gas H2S (mol/mol) 1.0 1.0
CO2/S-compounds (mol/mol) in "Claus Gas" 1.2 1.3
overall CO2/S-compounds concentration ratio 8.9 30.6
overall methanol losses (t/h) 0.1 not available
Table C2
MODELAspen Plus
Simulation forpresent Study
Data published inRef. 2
Data published inRef. 3
Absorber pressure (bar) 32 56 78Raw acid gas to the Absorber
CO2 (kmol/s) 0.24 0.54 0.57H2S (kmol/s) 0.02 0.02 0.004
MeOH circulation rate (kmol/s) 2.00 NA NACO2 product
Flow (kmol/s) 0.16 0.52 0.36CO2 (vol%) 98% 99% 99%
Claus gas from RegeneratorFlow (kmol/s) 0.05 0.05 0.02
CO2 (vol%) 53% 42% 68%H2S (vol%) 44% 47% 27%
Methanol make-up (kg/h) 120 40 30Refrigeration
Duty (MW) 7.41 4.20 2.00H3 - major solvent refrigeration (MW) 4.34
Refrigerant temperature (°C) < -60 -31 -38H2 feed gas cooler (MW) 0.43
H6 regenerator top condenser (MW) 2.31H7 Recycle gas cooler (MW) 0.33
Cooling water @ regenerator top condenser (m3/h) none 133 300Heating duty @ regenerator reboiler (MW) 4.00 3.20 3.75Shaft power @ methanol pumps (kW) 421 1640 1100
Table C3
C.10
C.2.7.1 DiscussionTables C1 and C2 show a high reproducibility of the Patent data by the Model:
− the raw gas flow and the CO2&H2S compositions are very similar in the two cases in thedifferent streams
− the distribution of the CO2 in the feed raw gas into the product streams and the Claus Gas(to Sulphur Recovery Unit) is reproduced quite consistently in the two cases
− the Claus Gas composition is very close in the two cases− the overall CO2 concentration factor [(CO2/S-compounds mol/mol) ratio between Claus
Gas and the raw feed gas] has the same order of magnitude in the two casesThe two process layouts, although very similar, do present minor differences: the key ones
are the Absorber pressure that in the Patent case is roughly 2.5 times as much the ModelAbsorber pressure. In addition, in the Patent case the Absorber column is provided of an inter-stage cooler which helps the absorption and which was not introduced in the Model layout.
The previous explain how the molar ratio methanol solvent/raw gas for the Model case isroughly 2 times as much the Patent value.
Table C3 compares the utilities consumption for the Aspen Model and the Rectisol typicalplants data available in Literature.
The results have the same order of magnitude, which confirms again the Modelconsistency.
The heat duty to the Regenerator reboiler is higher in the Model case because the methanolcirculation rate in the plant is higher, which in turn depends on the lower Absorber pressure inthe Model case.
The previous considerations confirm that the main scope of the Present Study wasachieved: the Model is a tool which allows a first evaluation of the Rectisol processperformances in terms of lean gas characteristics, process key parameters and process utilitiesconsumptions.
C.2.7.2 Addenda1. It is clear from what previously explained that methanol circulation rate within the “Rectisol-
based” plant has a very important effect on its utilities consumptions as they are mostlyrelated to this key parameter.
It is important stressing the fact that the choice of the methanol circulation rate as perthe Model results reported in paragraph C.4 is not unique: a smaller value could have beenselected respecting nevertheless the specifications on the product clean gas from theAbsorber.
The choice of 2 kmol/s (methanol stream to the Absorber) guarantees though the bestcompromise between the utilities consumption values reported in Literature and the Aspensimulation results (although not perfect!) for all the process product streams, including thetailgas and the CO2 gas stream.
In this way, the utilities consumptions were slightly overestimated but the Aspen Modelresulted being consistent.
The effects of methanol circulation rate on various process parameters are reported infigures C3 to C6.
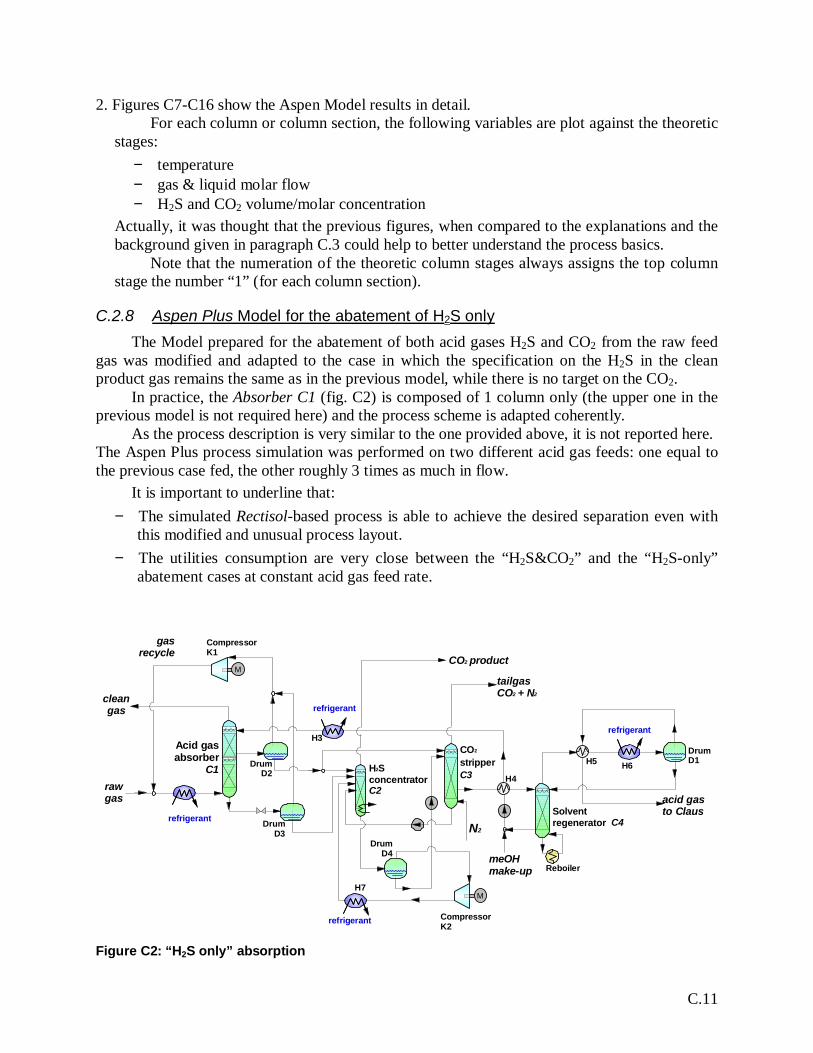
C.11
2. Figures C7-C16 show the Aspen Model results in detail.For each column or column section, the following variables are plot against the theoretic
stages:− temperature− gas & liquid molar flow− H2S and CO2 volume/molar concentration
Actually, it was thought that the previous figures, when compared to the explanations and thebackground given in paragraph C.3 could help to better understand the process basics.
Note that the numeration of the theoretic column stages always assigns the top columnstage the number “1” (for each column section).
C.2.8 Aspen Plus Model for the abatement of H2S onlyThe Model prepared for the abatement of both acid gases H2S and CO2 from the raw feed
gas was modified and adapted to the case in which the specification on the H2S in the cleanproduct gas remains the same as in the previous model, while there is no target on the CO2.
In practice, the Absorber C1 (fig. C2) is composed of 1 column only (the upper one in theprevious model is not required here) and the process scheme is adapted coherently.
As the process description is very similar to the one provided above, it is not reported here.The Aspen Plus process simulation was performed on two different acid gas feeds: one equal tothe previous case fed, the other roughly 3 times as much in flow.
It is important to underline that:− The simulated Rectisol-based process is able to achieve the desired separation even with
this modified and unusual process layout.− The utilities consumption are very close between the “H2S&CO2” and the “H2S-only”
abatement cases at constant acid gas feed rate.
M
N2
CO2 product
meOHmake-up
acid gasto Claus
M
rawgas
gasrecycle
cleangas
tailgasCO2 + N2
refrigerant
refrigerant
refrigerant
Acid gasabsorber
C1 H2SconcentratorC2
CO2
stripperC3
Solventregenerator C4
DrumD1Drum
D2
DrumD3
CompressorK1
CompressorK2
DrumD4
H5 H6
H3
H4
H7
refrigerant
Reboiler
Figure C2: “H2S only” absorption
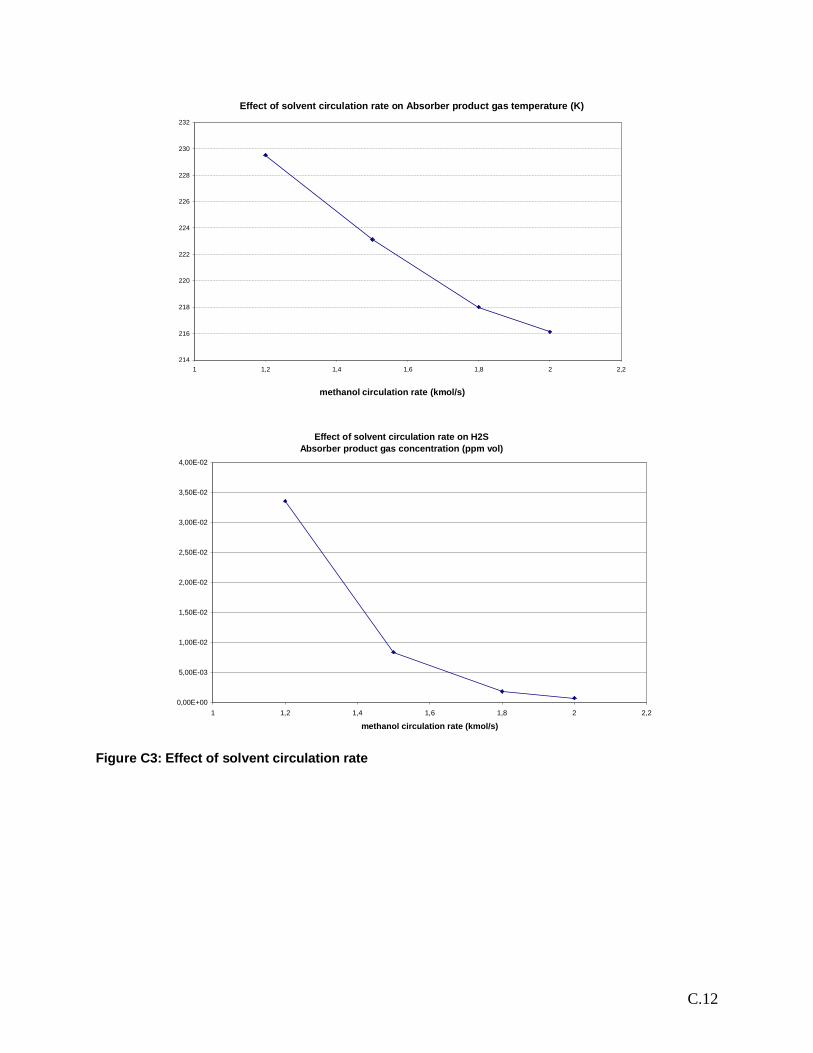
C.12
Effect of solvent circulation rate on Absorber product gas temperature (K)
214
216
218
220
222
224
226
228
230
232
1 1,2 1,4 1,6 1,8 2 2,2
methanol circulation rate (kmol/s)
Effect of solvent circulation rate on H2SAbsorber product gas concentration (ppm vol)
0,00E+00
5,00E-03
1,00E-02
1,50E-02
2,00E-02
2,50E-02
3,00E-02
3,50E-02
4,00E-02
1 1,2 1,4 1,6 1,8 2 2,2
methanol circulation rate (kmol/s)
Figure C3: Effect of solvent circulation rate
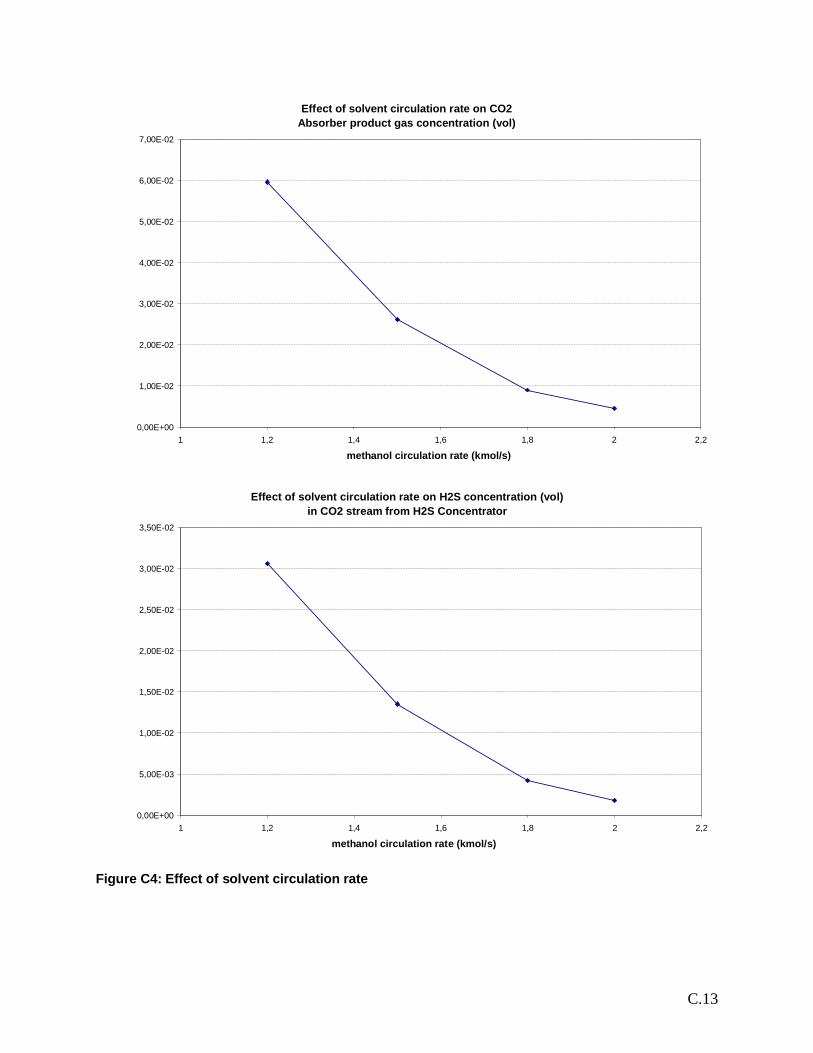
C.13
Effect of solvent circulation rate on CO2Absorber product gas concentration (vol)
0,00E+00
1,00E-02
2,00E-02
3,00E-02
4,00E-02
5,00E-02
6,00E-02
7,00E-02
1 1,2 1,4 1,6 1,8 2 2,2
methanol circulation rate (kmol/s)
Effect of solvent circulation rate on H2S concentration (vol)in CO2 stream from H2S Concentrator
0,00E+00
5,00E-03
1,00E-02
1,50E-02
2,00E-02
2,50E-02
3,00E-02
3,50E-02
1 1,2 1,4 1,6 1,8 2 2,2
methanol circulation rate (kmol/s)
Figure C4: Effect of solvent circulation rate
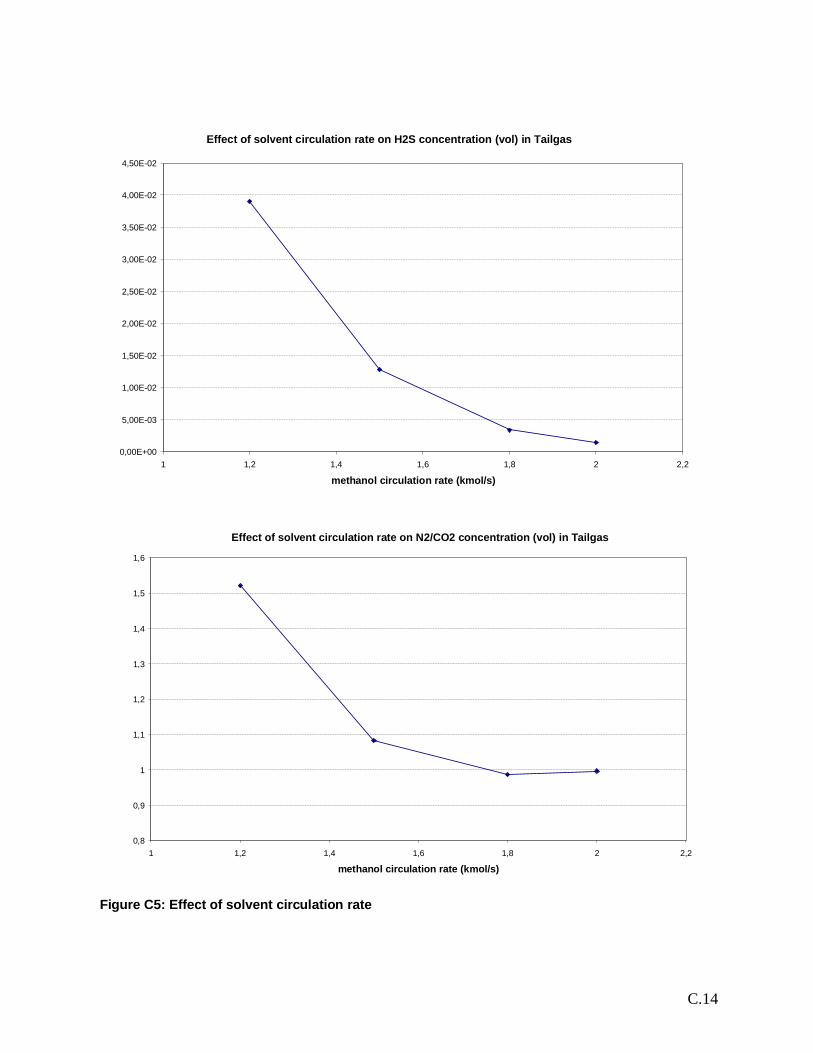
C.14
Effect of solvent circulation rate on H2S concentration (vol) in Tailgas
0,00E+00
5,00E-03
1,00E-02
1,50E-02
2,00E-02
2,50E-02
3,00E-02
3,50E-02
4,00E-02
4,50E-02
1 1,2 1,4 1,6 1,8 2 2,2
methanol circulation rate (kmol/s)
Effect of solvent circulation rate on N2/CO2 concentration (vol) in Tailgas
0,8
0,9
1
1,1
1,2
1,3
1,4
1,5
1,6
1 1,2 1,4 1,6 1,8 2 2,2
methanol circulation rate (kmol/s)
Figure C5: Effect of solvent circulation rate
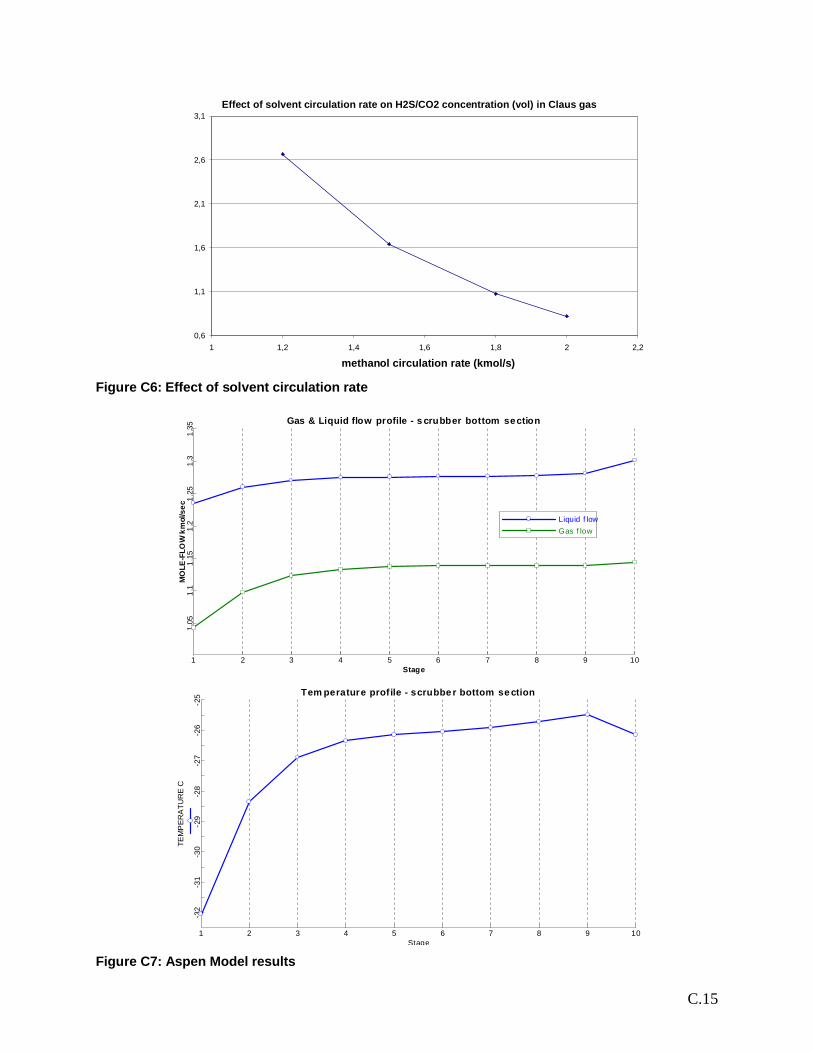
C.15
Effect of solvent circulation rate on H2S/CO2 concentration (vol) in Claus gas
0,6
1,1
1,6
2,1
2,6
3,1
1 1,2 1,4 1,6 1,8 2 2,2
methanol circulation rate (kmol/s)
Figure C6: Effect of solvent circulation rate
Gas & Liquid flow profile - s crubber bottom section
Stage
MO
LE-F
LOW
km
ol/s
ec
1 2 3 4 5 6 7 8 9 10
1.05
1.1
1.15
1.2
1.25
1.3
1.35
Liquid f lowGas f low
Tem perature profile - scrubbe r bottom se ction
Stage
TEM
PER
ATU
RE
C
1 2 3 4 5 6 7 8 9 10
-32
-31
-30
-29
-28
-27
-26
-25
Figure C7: Aspen Model results
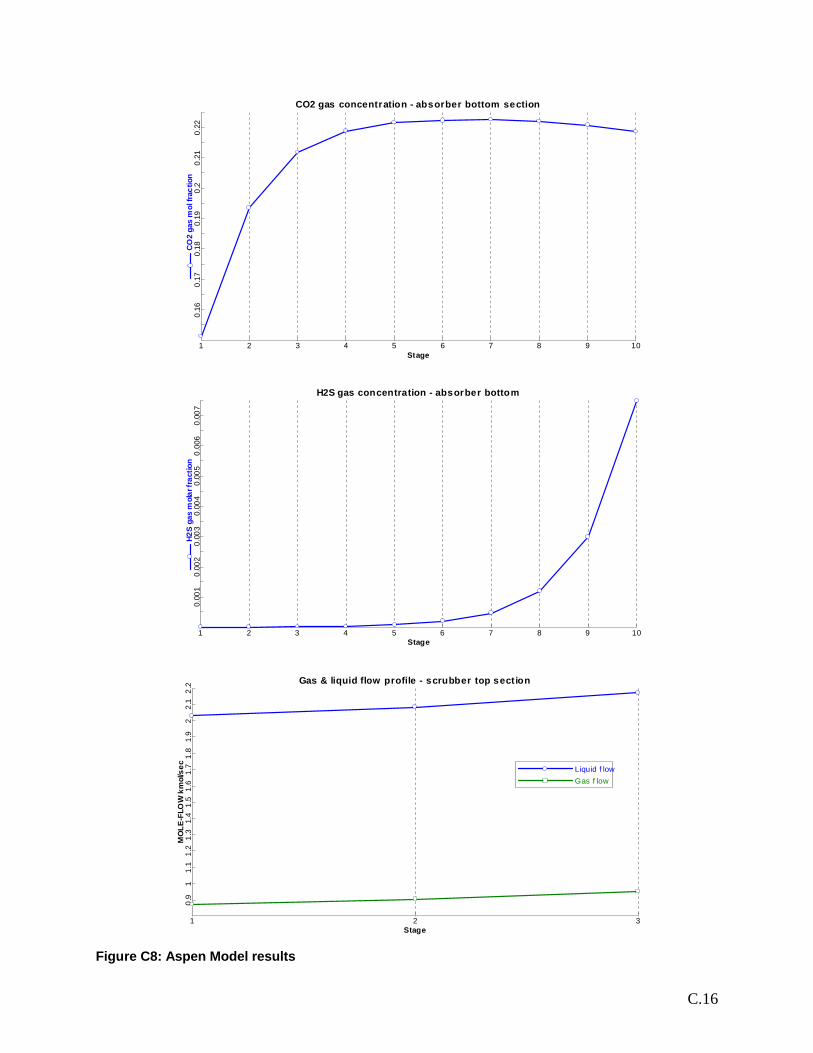
C.16
CO2 gas concentration - absorber bottom section
Stage
CO
2 ga
s m
ol fr
actio
n
1 2 3 4 5 6 7 8 9 10
0.16
0.17
0.18
0.19
0.2
0.21
0.22
H2S gas concentration - absorber bottom
Stage
H2S
gas
mol
ar fr
actio
n
1 2 3 4 5 6 7 8 9 10
0.00
10.
002
0.00
30.
004
0.00
50.
006
0.00
7
Gas & liquid flow profile - scrubber top section
Stage
MO
LE-F
LOW
km
ol/s
ec
1 2 3
0.9
11.
11.
21.
31.
41.
51.
61.
71.
81.
92
2.1
2.2
Liquid f lowGas f low
Figure C8: Aspen Model results
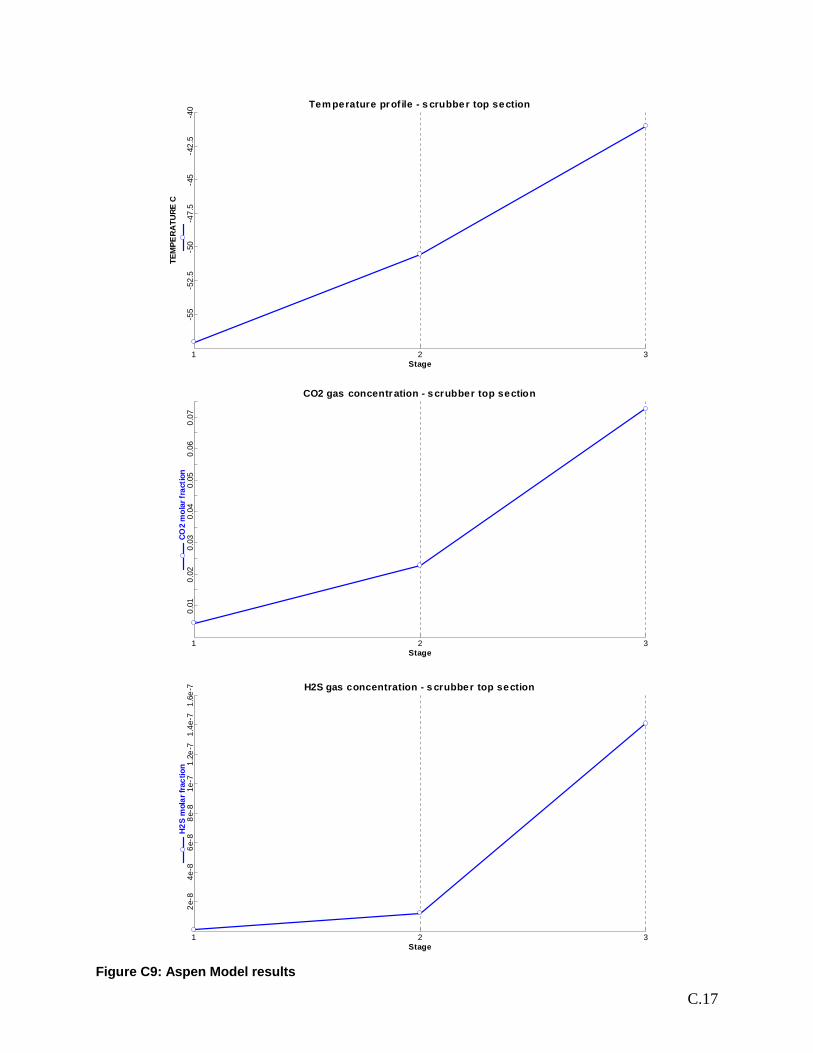
C.17
Tem perature prof ile - s crubber top section
Stage
TEM
PER
ATU
RE C
1 2 3
-55
-52.
5-5
0-4
7.5
-45
-42.
5-4
0
CO2 gas concentration - scrubber top section
Stage
CO2
mol
ar fr
actio
n
1 2 3
0.01
0.02
0.03
0.04
0.05
0.06
0.07
H2S gas concentration - s crubber top section
Stage
H2S
mol
ar fr
actio
n
1 2 3
2e-8
4e-8
6e-8
8e-8
1e-7
1.2e
-71.
4e-7
1.6e
-7
Figure C9: Aspen Model results
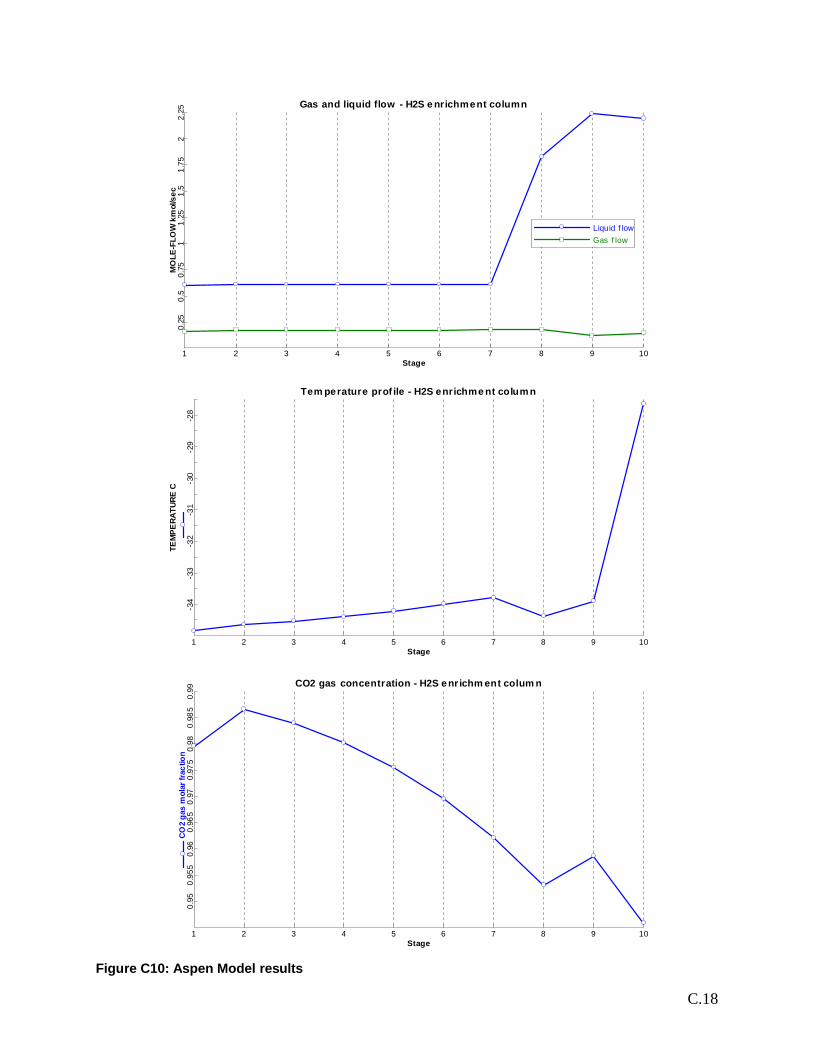
C.18
Gas and liquid flow - H2S e nrichment column
Stage
MO
LE-F
LOW
km
ol/s
ec
1 2 3 4 5 6 7 8 9 10
0.25
0.5
0.75
11.
251.
51.
752
2.25
Liquid f lowGas f low
Tem perature prof ile - H2S enrichme nt colum n
Stage
TEM
PERA
TURE
C
1 2 3 4 5 6 7 8 9 10
-34
-33
-32
-31
-30
-29
-28
CO2 gas concentration - H2S e nr ichm ent colum n
Stage
CO
2 ga
s m
olar
frac
tion
1 2 3 4 5 6 7 8 9 10
0.95
0.95
50.
960.
965
0.97
0.97
50.
980.
985
0.99
Figure C10: Aspen Model results
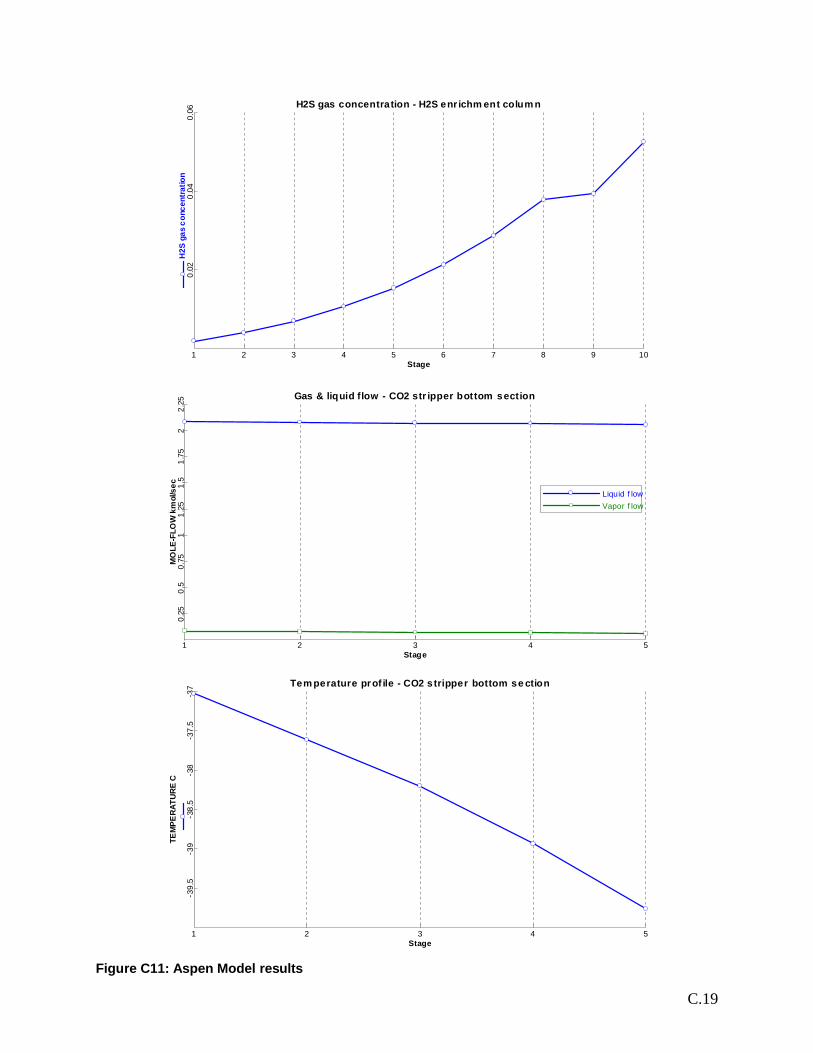
C.19
H2S gas concentration - H2S enr ichm ent colum n
Stage
H2S
gas
con
cent
ratio
n
1 2 3 4 5 6 7 8 9 10
0.02
0.04
0.06
Gas & liquid flow - CO2 str ipper bottom section
Stage
MO
LE-F
LOW
km
ol/s
ec
1 2 3 4 5
0.25
0.5
0.75
11.
251.
51.
752
2.25
Liquid f lowVapor f low
Tem perature prof ile - CO2 s tripper bottom se ction
Stage
TEM
PER
ATU
RE
C
1 2 3 4 5
-39.
5-3
9-3
8.5
-38
-37.
5-3
7
Figure C11: Aspen Model results

C.20
CO2 gas concentration - CO2 s trippe r bottom se ction
Stage
CO2
mol
ar fr
actio
n
1 2 3 4 5
0.22
50.
275
0.32
50.
375
0.42
5
H2S gas concentration - CO2 s trippe r bottom se ction
Stage
H2S
mol
ar c
once
ntra
tion
1 2 3 4 5
0.03
60.
038
0.04
0.04
20.
044
Gas & liquid flow - CO2 str ipper top section
Stage
MO
LE-F
LOW
km
ol/s
ec
1 2 3 4 5
0.1
0.15
0.2
0.25
0.3
0.35
0.4
Liquid f lowGas f low
Figure C12: Aspen Model results
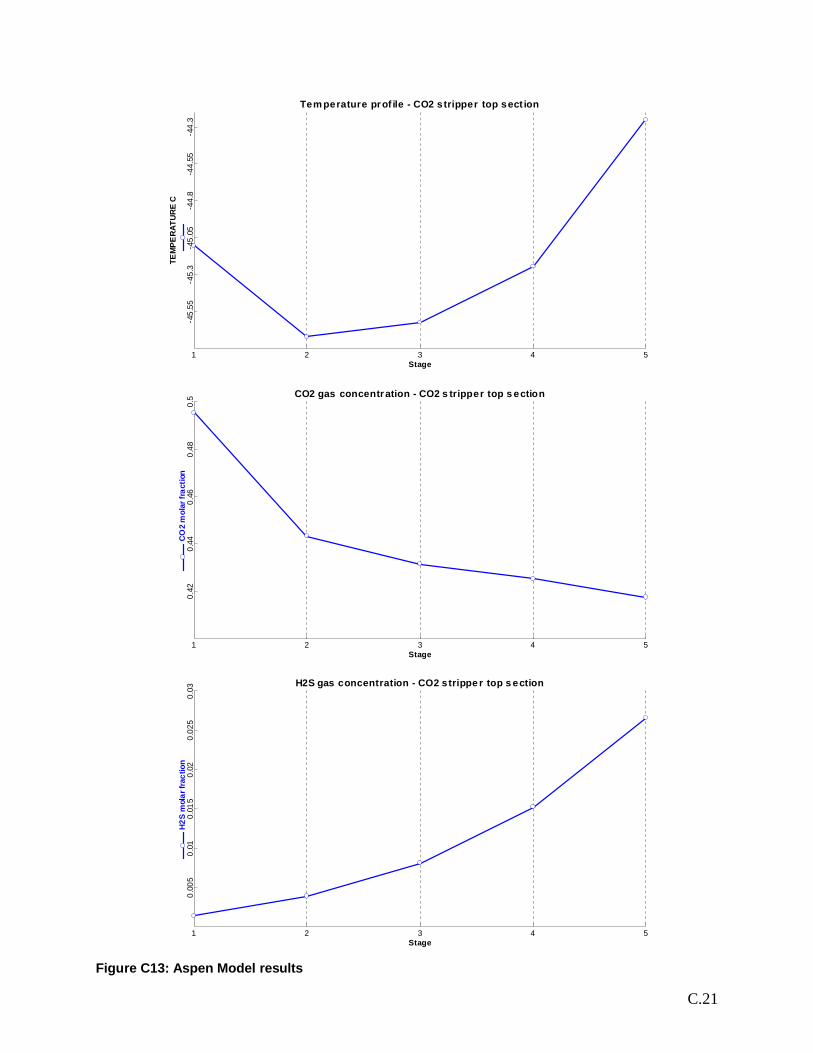
C.21
Tem perature prof ile - CO2 stripper top sect ion
Stage
TEM
PER
ATU
RE
C
1 2 3 4 5
-45.
55-4
5.3
-45.
05-4
4.8
-44.
55-4
4.3
CO2 gas concentration - CO2 s tripper top s ection
Stage
CO
2 m
olar
frac
tion
1 2 3 4 5
0.42
0.44
0.46
0.48
0.5
H2S gas concentration - CO2 strippe r top s ection
Stage
H2S
mol
ar fr
actio
n
1 2 3 4 5
0.00
50.
010.
015
0.02
0.02
50.
03
Figure C13: Aspen Model results
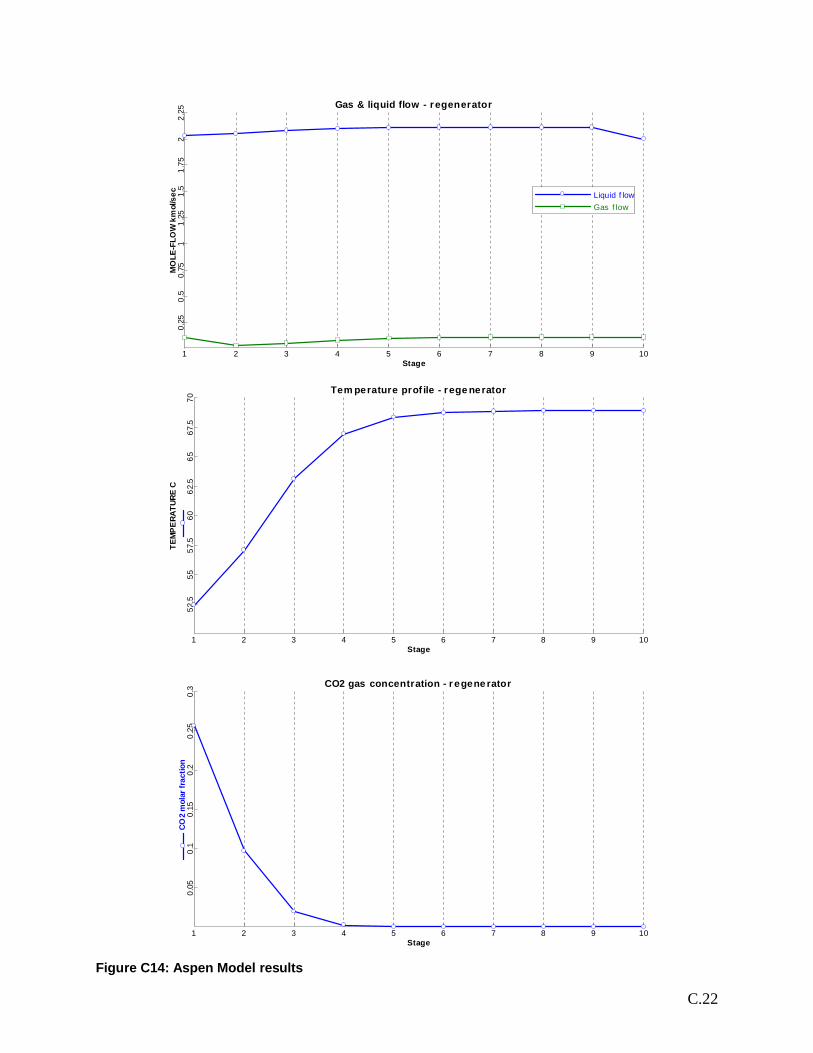
C.22
Gas & liquid flow - regenerator
Stage
MO
LE-F
LOW
km
ol/s
ec
1 2 3 4 5 6 7 8 9 10
0.25
0.5
0.75
11.
251.
51.
752
2.25
Liquid f lowGas f low
Tem perature prof ile - rege nerator
Stage
TEM
PE
RATU
RE C
1 2 3 4 5 6 7 8 9 10
52.5
5557
.560
62.5
6567
.570
CO2 gas concentration - r egene rator
Stage
CO2
mol
ar fr
actio
n
1 2 3 4 5 6 7 8 9 10
0.05
0.1
0.15
0.2
0.25
0.3
Figure C14: Aspen Model results
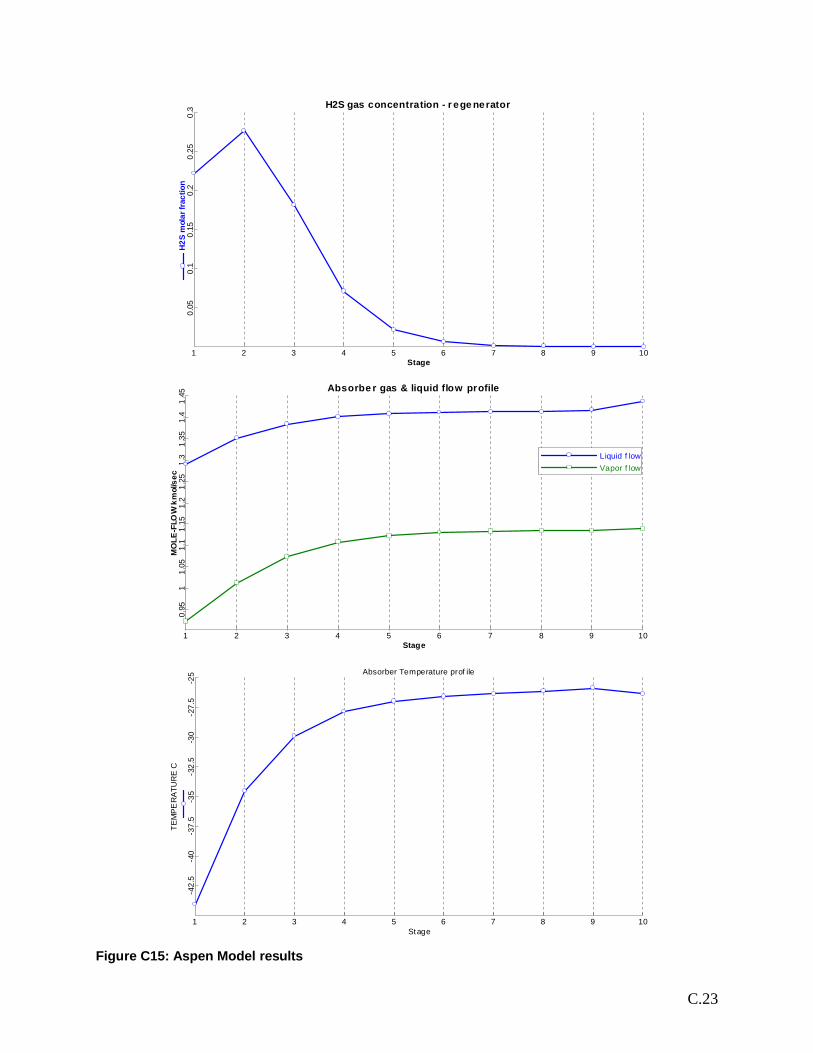
C.23
H2S gas concentration - r ege nerator
Stage
H2S
mol
ar fr
actio
n
1 2 3 4 5 6 7 8 9 10
0.05
0.1
0.15
0.2
0.25
0.3
Absorbe r gas & liquid flow profile
Stage
MO
LE-F
LOW
km
ol/s
ec
1 2 3 4 5 6 7 8 9 10
0.95
11.
051.
11.
151.
21.
251.
31.
351.
41.
45
L iquid f lowVapor f low
Absorber Temperature prof ile
Stage
TEM
PER
ATU
RE
C
1 2 3 4 5 6 7 8 9 10
-42.
5-4
0-3
7.5
-35
-32.
5-3
0-2
7.5
-25
Figure C15: Aspen Model results
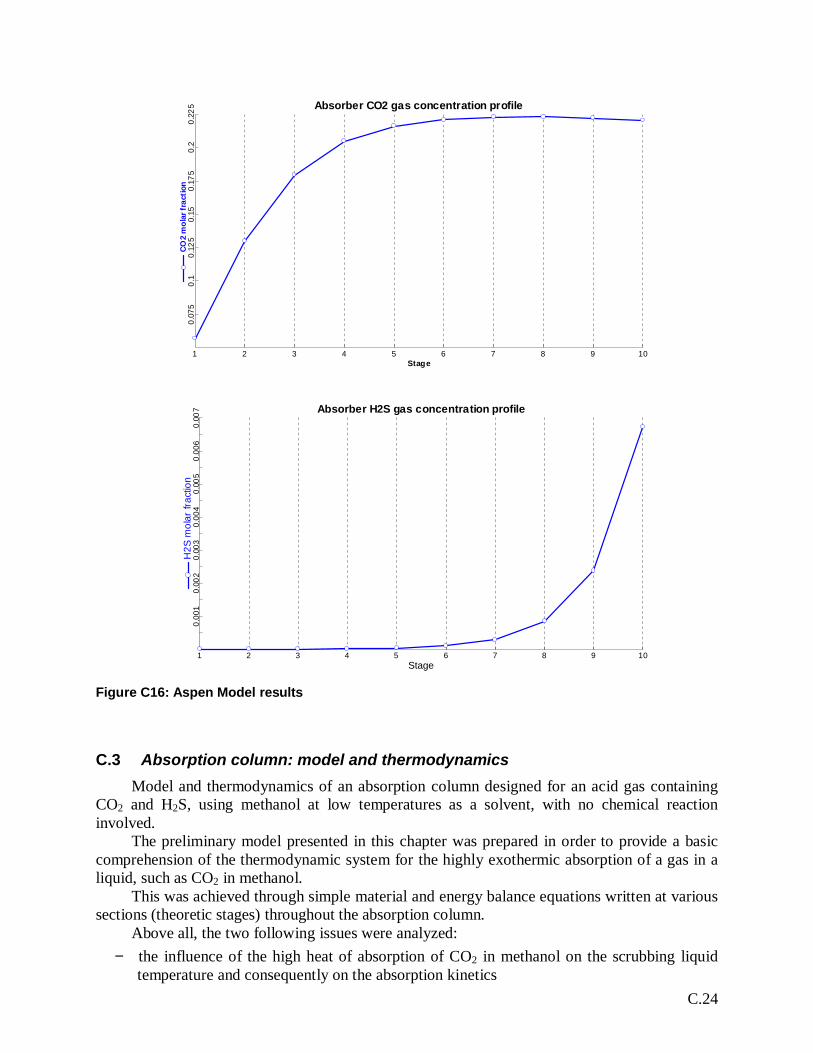
C.24
Absorber CO2 gas concentration profile
Stage
CO2
mol
ar fr
actio
n
1 2 3 4 5 6 7 8 9 10
0.07
50.
10.
125
0.15
0.17
50.
20.
225
Absorber H2S gas concentration profile
Stage
H2S
mol
ar fr
actio
n
1 2 3 4 5 6 7 8 9 10
0.00
10.
002
0.00
30.
004
0.00
50.
006
0.00
7
Figure C16: Aspen Model results
C.3 Absorption column: model and thermodynamicsModel and thermodynamics of an absorption column designed for an acid gas containing
CO2 and H2S, using methanol at low temperatures as a solvent, with no chemical reactioninvolved.
The preliminary model presented in this chapter was prepared in order to provide a basiccomprehension of the thermodynamic system for the highly exothermic absorption of a gas in aliquid, such as CO2 in methanol.
This was achieved through simple material and energy balance equations written at varioussections (theoretic stages) throughout the absorption column.
Above all, the two following issues were analyzed:− the influence of the high heat of absorption of CO2 in methanol on the scrubbing liquid
temperature and consequently on the absorption kinetics
C.25
− the effect of the scrubbing methanol flowrate on the methanol temperature, as a result ofthe variation of the total liquid flow heat capacity, and on the acid gas concentration in thegas product.
The results of the model are expected to highlight potential problems for a ProcessSimulation Software (Aspen Plus in the present Study) on the “Rectisol-based” process, at thesame time suggesting starting realistic operating conditions for the simulation itself.
A simple thermodynamic model was coupled with basic heat and material balanceequations and it was applied to each theoretic stage of an absorption column: the mathematicmodel was implemented on the Excel file ABSORBER.xls (reported in paragraph C.4). Theexcel file output provides the details for the product gas from the scrubbing column(temperature, composition, flowrate), the number of ideal stages required and the profiles for thetemperature, the H2S and CO2 gas and liquid concentration throughout the column.
C.3.1 Nomenclaturex liquid molar fractiony gas molar fractionH Henry constant (pressure)P pressureT temperatureL liquid molar flowG gas molar flow
absQd & theoretic stage enthalpy balance( )absH∆− heat of absorptioncpl liquid specific heat @ const pressurecpg gas specific heat @ const pressure
C.3.2 Acid gas solubilityCO2 and H2S are both soluble in methanol, even though the solubility of H2S is higher than
the CO2 one: roughly 5 times as much. The following table C4 [Ref. 3] reports the equilibriumsolubility of H2S and CO2 in methanol at two different temperatures when the acid gas partialpressure is equal to 1 atm:
temperature (°C) solubility (vol/vol) selectivity H2S/CO2H2S CO2
-10 41 8 5.1-20 92 15 6.1
Table C4
C.3.3 Heat of absorption of CO2 in methanol (-∆H abs)It is hard finding this experimental data in Literature, as the system CO2/methanol (physical
absorption, no reaction) is quite specific to the Rectisol process, and consequently very fewexperimental data have been published.
It is well known though that the CO2 absorption in polar solvents is a quite exothermicprocess:
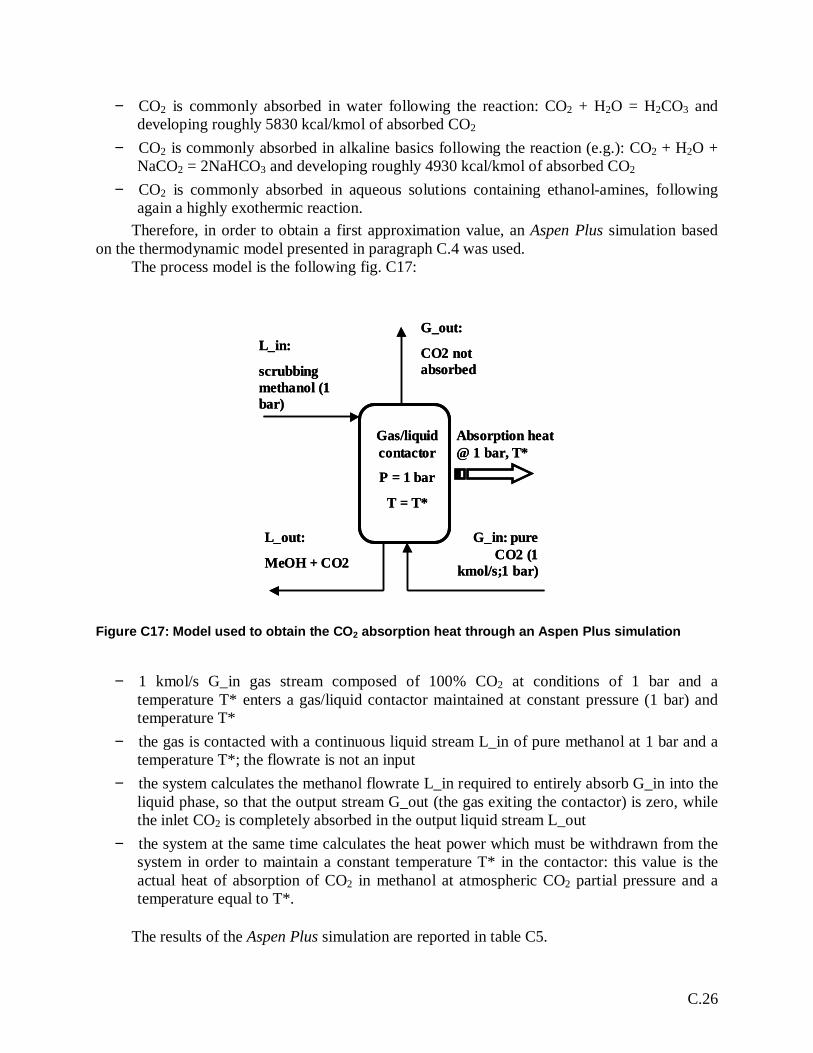
C.26
− CO2 is commonly absorbed in water following the reaction: CO2 + H2O = H2CO3 anddeveloping roughly 5830 kcal/kmol of absorbed CO2
− CO2 is commonly absorbed in alkaline basics following the reaction (e.g.): CO2 + H2O +NaCO2 = 2NaHCO3 and developing roughly 4930 kcal/kmol of absorbed CO2
− CO2 is commonly absorbed in aqueous solutions containing ethanol-amines, followingagain a highly exothermic reaction.
Therefore, in order to obtain a first approximation value, an Aspen Plus simulation basedon the thermodynamic model presented in paragraph C.4 was used.
The process model is the following fig. C17:
L_in:
scrubbingmethanol (1bar)
G_out:
CO2 notabsorbed
G_in: pureCO2 (1
kmol/s;1 bar)
Gas/liquidcontactor
P = 1 bar
T = T*
L_out:
MeOH + CO2
Absorption heat@ 1 bar, T*
L_in:
scrubbingmethanol (1bar)
G_out:
CO2 notabsorbed
G_in: pureCO2 (1
kmol/s;1 bar)
Gas/liquidcontactor
P = 1 bar
T = T*
L_out:
MeOH + CO2
Absorption heat@ 1 bar, T*
Figure C17: Model used to obtain the CO2 absorption heat through an Aspen Plus simulation
− 1 kmol/s G_in gas stream composed of 100% CO2 at conditions of 1 bar and atemperature T* enters a gas/liquid contactor maintained at constant pressure (1 bar) andtemperature T*
− the gas is contacted with a continuous liquid stream L_in of pure methanol at 1 bar and atemperature T*; the flowrate is not an input
− the system calculates the methanol flowrate L_in required to entirely absorb G_in into theliquid phase, so that the output stream G_out (the gas exiting the contactor) is zero, whilethe inlet CO2 is completely absorbed in the output liquid stream L_out
− the system at the same time calculates the heat power which must be withdrawn from thesystem in order to maintain a constant temperature T* in the contactor: this value is theactual heat of absorption of CO2 in methanol at atmospheric CO2 partial pressure and atemperature equal to T*.
The results of the Aspen Plus simulation are reported in table C5.
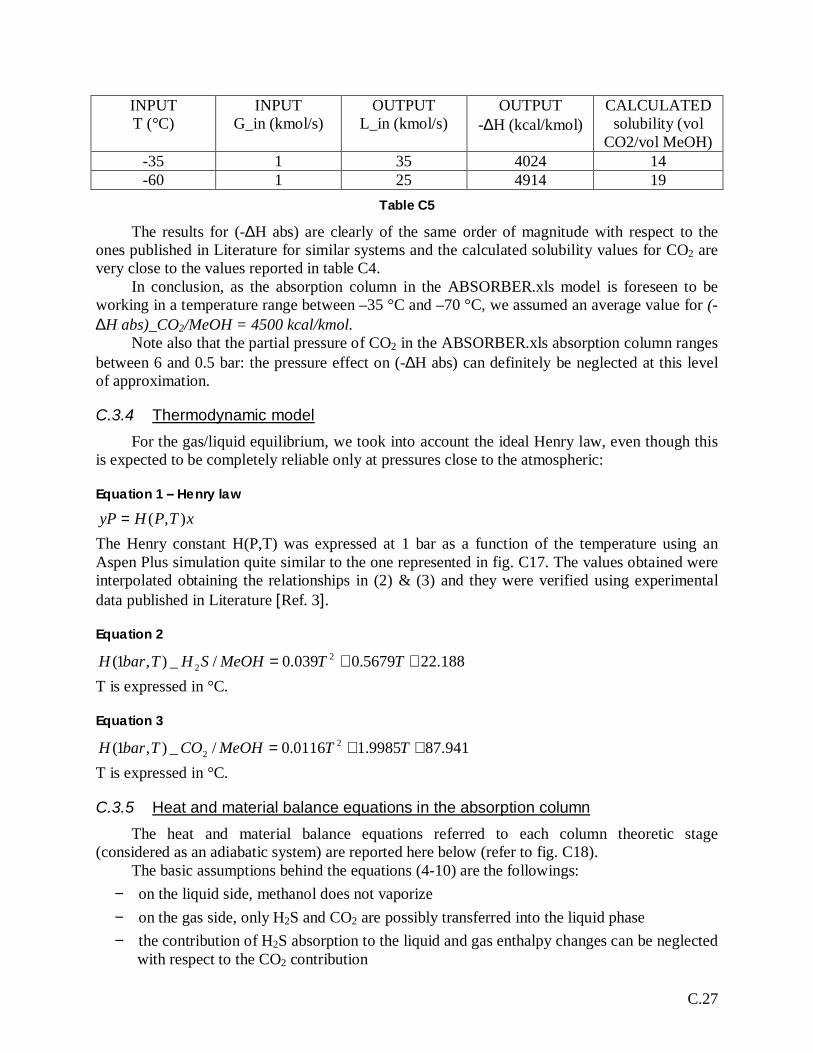
C.27
INPUTT (°C)
INPUTG_in (kmol/s)
OUTPUTL_in (kmol/s)
OUTPUT-∆H (kcal/kmol)
CALCULATEDsolubility (vol
CO2/vol MeOH)-35 1 35 4024 14-60 1 25 4914 19
Table C5
The results for (-∆H abs) are clearly of the same order of magnitude with respect to theones published in Literature for similar systems and the calculated solubility values for CO2 arevery close to the values reported in table C4.
In conclusion, as the absorption column in the ABSORBER.xls model is foreseen to beworking in a temperature range between –35 °C and –70 °C, we assumed an average value for (-∆H abs)_CO2/MeOH = 4500 kcal/kmol.
Note also that the partial pressure of CO2 in the ABSORBER.xls absorption column rangesbetween 6 and 0.5 bar: the pressure effect on (-∆H abs) can definitely be neglected at this levelof approximation.
C.3.4 Thermodynamic modelFor the gas/liquid equilibrium, we took into account the ideal Henry law, even though this
is expected to be completely reliable only at pressures close to the atmospheric:
Equation 1 Henry law
xTPHyP ),(=
The Henry constant H(P,T) was expressed at 1 bar as a function of the temperature using anAspen Plus simulation quite similar to the one represented in fig. C17. The values obtained wereinterpolated obtaining the relationships in (2) & (3) and they were verified using experimentaldata published in Literature [Ref. 3].
Equation 2
188.225679.0039.0/_),1( 22 ++= TTMeOHSHTbarH
T is expressed in °C.
Equation 3
941.879985.10116.0/_),1( 22 ++= TTMeOHCOTbarH
T is expressed in °C.
C.3.5 Heat and material balance equations in the absorption columnThe heat and material balance equations referred to each column theoretic stage
(considered as an adiabatic system) are reported here below (refer to fig. C18).The basic assumptions behind the equations (4-10) are the followings:
− on the liquid side, methanol does not vaporize− on the gas side, only H2S and CO2 are possibly transferred into the liquid phase− the contribution of H2S absorption to the liquid and gas enthalpy changes can be neglected
with respect to the CO2 contribution
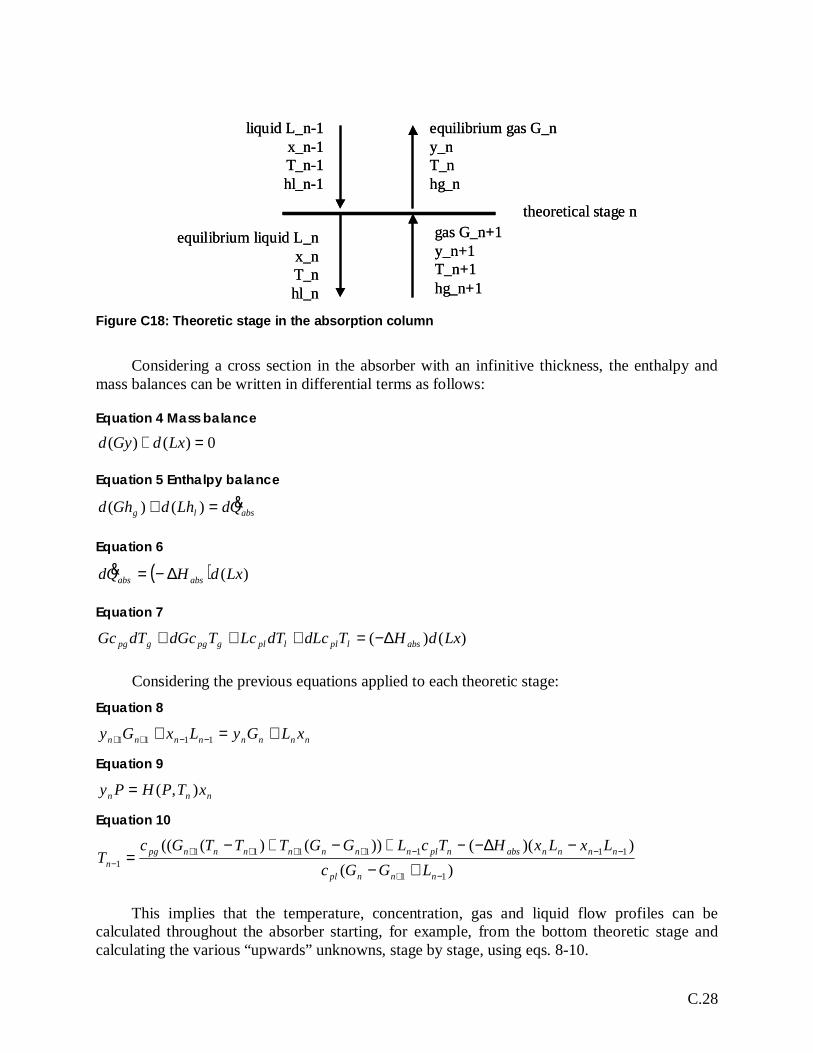
C.28
equilibrium gas G_ny_nT_nhg_n
gas G_n+1y_n+1T_n+1hg_n+1
equilibrium liquid L_nx_nT_nhl_n
liquid L_n-1x_n-1T_n-1hl_n-1
theoretical stage n
equilibrium gas G_ny_nT_nhg_n
gas G_n+1y_n+1T_n+1hg_n+1
equilibrium liquid L_nx_nT_nhl_n
liquid L_n-1x_n-1T_n-1hl_n-1
theoretical stage n
Figure C18: Theoretic stage in the absorption column
Considering a cross section in the absorber with an infinitive thickness, the enthalpy andmass balances can be written in differential terms as follows:
Equation 4 Mass balance
0)()( =+ LxdGyd
Equation 5 Enthalpy balance
abslg QdLhdGhd &=+ )()(
Equation 6
( ) )(LxdHQd absabs ∆−=&
Equation 7
)()( LxdHTdLcdTLcTdGcdTGc abslpllplgpggpg ∆−=+++
Considering the previous equations applied to each theoretic stage:Equation 8
nnnnnnnn xLGyLxGy +=+ −−++ 1111
Equation 9
nnn xTPHPy ),(=
Equation 10
)())(())()(((
11
11111111
−+
−−−++++− +−
−∆−−+−+−=
nnnpl
nnnnabsnplnnnnnnnpgn LGGc
LxLxHTcLGGTTTGcT
This implies that the temperature, concentration, gas and liquid flow profiles can becalculated throughout the absorber starting, for example, from the bottom theoretic stage andcalculating the various “upwards” unknowns, stage by stage, using eqs. 8-10.
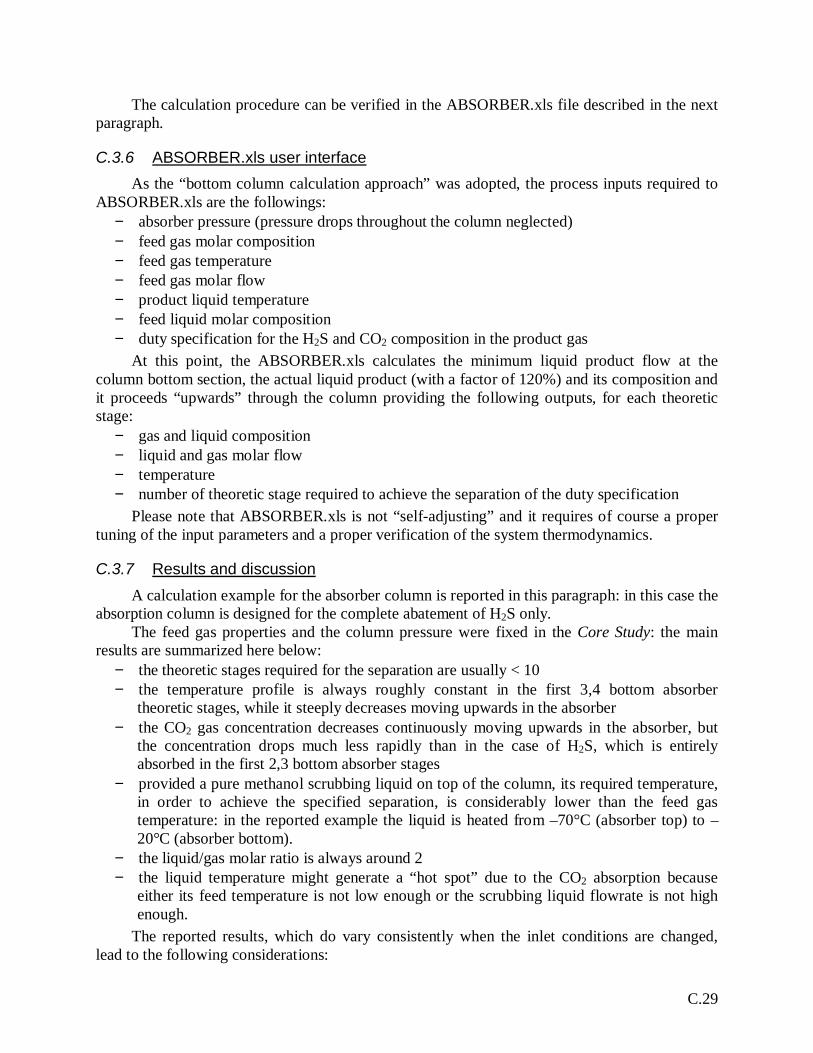
C.29
The calculation procedure can be verified in the ABSORBER.xls file described in the nextparagraph.
C.3.6 ABSORBER.xls user interfaceAs the “bottom column calculation approach” was adopted, the process inputs required to
ABSORBER.xls are the followings:− absorber pressure (pressure drops throughout the column neglected)− feed gas molar composition− feed gas temperature− feed gas molar flow− product liquid temperature− feed liquid molar composition− duty specification for the H2S and CO2 composition in the product gas
At this point, the ABSORBER.xls calculates the minimum liquid product flow at thecolumn bottom section, the actual liquid product (with a factor of 120%) and its composition andit proceeds “upwards” through the column providing the following outputs, for each theoreticstage:
− gas and liquid composition− liquid and gas molar flow− temperature− number of theoretic stage required to achieve the separation of the duty specification
Please note that ABSORBER.xls is not “self-adjusting” and it requires of course a propertuning of the input parameters and a proper verification of the system thermodynamics.
C.3.7 Results and discussionA calculation example for the absorber column is reported in this paragraph: in this case the
absorption column is designed for the complete abatement of H2S only.The feed gas properties and the column pressure were fixed in the Core Study: the main
results are summarized here below:− the theoretic stages required for the separation are usually < 10− the temperature profile is always roughly constant in the first 3,4 bottom absorber
theoretic stages, while it steeply decreases moving upwards in the absorber− the CO2 gas concentration decreases continuously moving upwards in the absorber, but
the concentration drops much less rapidly than in the case of H2S, which is entirelyabsorbed in the first 2,3 bottom absorber stages
− provided a pure methanol scrubbing liquid on top of the column, its required temperature,in order to achieve the specified separation, is considerably lower than the feed gastemperature: in the reported example the liquid is heated from –70°C (absorber top) to –20°C (absorber bottom).
− the liquid/gas molar ratio is always around 2− the liquid temperature might generate a “hot spot” due to the CO2 absorption because
either its feed temperature is not low enough or the scrubbing liquid flowrate is not highenough.
The reported results, which do vary consistently when the inlet conditions are changed,lead to the following considerations:
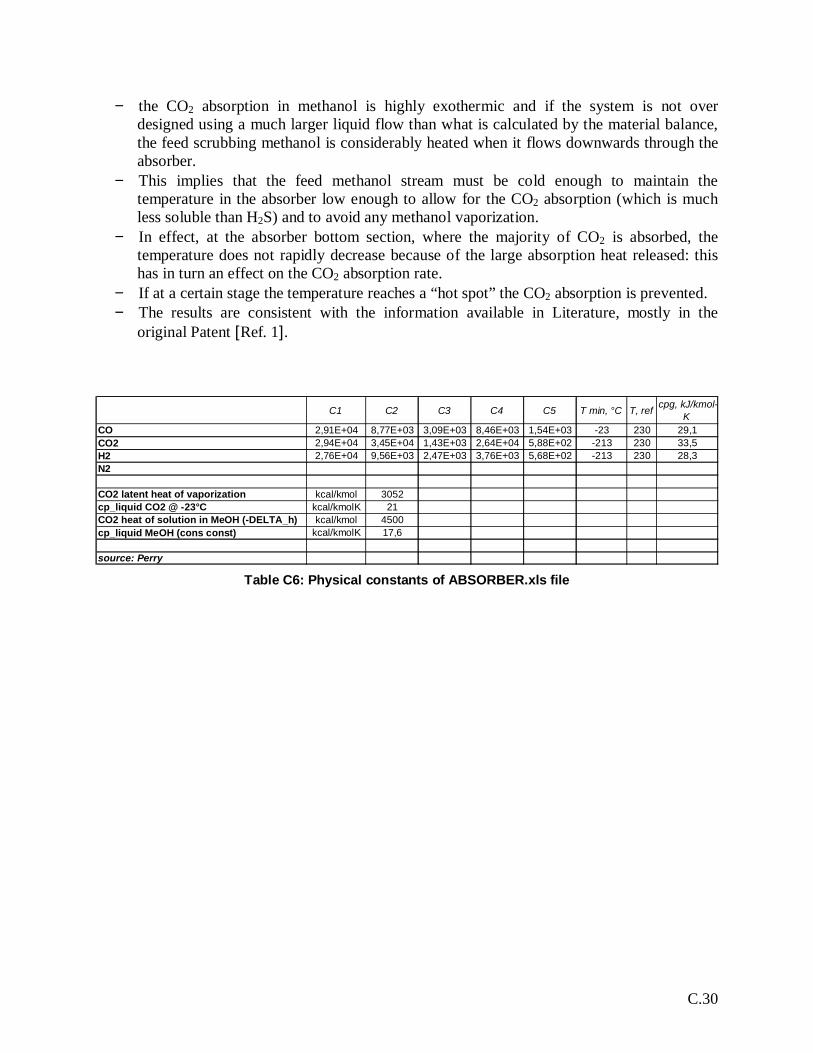
C.30
− the CO2 absorption in methanol is highly exothermic and if the system is not overdesigned using a much larger liquid flow than what is calculated by the material balance,the feed scrubbing methanol is considerably heated when it flows downwards through theabsorber.
− This implies that the feed methanol stream must be cold enough to maintain thetemperature in the absorber low enough to allow for the CO2 absorption (which is muchless soluble than H2S) and to avoid any methanol vaporization.
− In effect, at the absorber bottom section, where the majority of CO2 is absorbed, thetemperature does not rapidly decrease because of the large absorption heat released: thishas in turn an effect on the CO2 absorption rate.
− If at a certain stage the temperature reaches a “hot spot” the CO2 absorption is prevented.− The results are consistent with the information available in Literature, mostly in the
original Patent [Ref. 1].
C1 C2 C3 C4 C5 T min, °C T, ref cpg, kJ/kmol-K
CO 2,91E+04 8,77E+03 3,09E+03 8,46E+03 1,54E+03 -23 230 29,1CO2 2,94E+04 3,45E+04 1,43E+03 2,64E+04 5,88E+02 -213 230 33,5H2 2,76E+04 9,56E+03 2,47E+03 3,76E+03 5,68E+02 -213 230 28,3N2
CO2 latent heat of vaporization kcal/kmol 3052cp_liquid CO2 @ -23°C kcal/kmolK 21CO2 heat of solution in MeOH (-DELTA_h) kcal/kmol 4500cp_liquid MeOH (cons const) kcal/kmolK 17,6
source: Perry
Table C6: Physical constants of ABSORBER.xls file
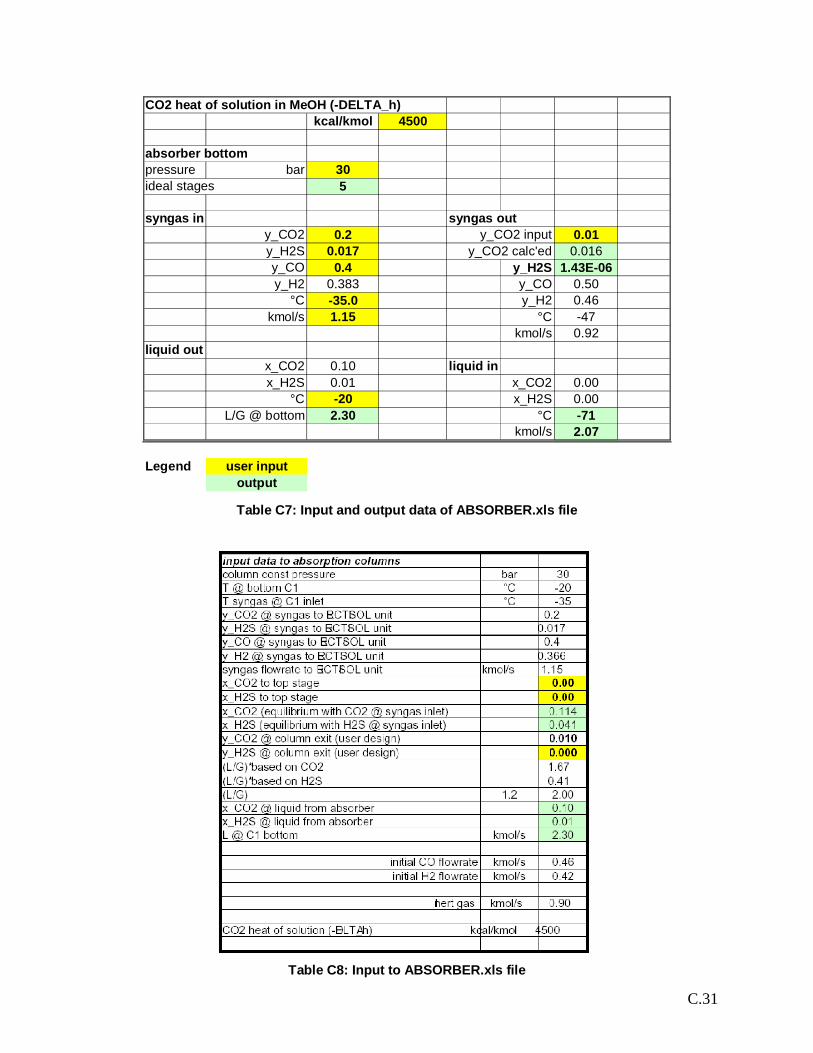
C.31
CO2 heat of solution in MeOH (-DELTA_h)kcal/kmol 4500
absorber bottompressure bar 30ideal stages 5
syngas in syngas outy_CO2 0.2 y_CO2 input 0.01y_H2S 0.017 y_CO2 calc'ed 0.016y_CO 0.4 y_H2S 1.43E-06y_H2 0.383 y_CO 0.50
°C -35.0 y_H2 0.46kmol/s 1.15 °C -47
kmol/s 0.92liquid out
x_CO2 0.10 liquid inx_H2S 0.01 x_CO2 0.00
°C -20 x_H2S 0.00L/G @ bottom 2.30 °C -71
kmol/s 2.07
Legend user inputoutput
Table C7: Input and output data of ABSORBER.xls file
Table C8: Input to ABSORBER.xls file
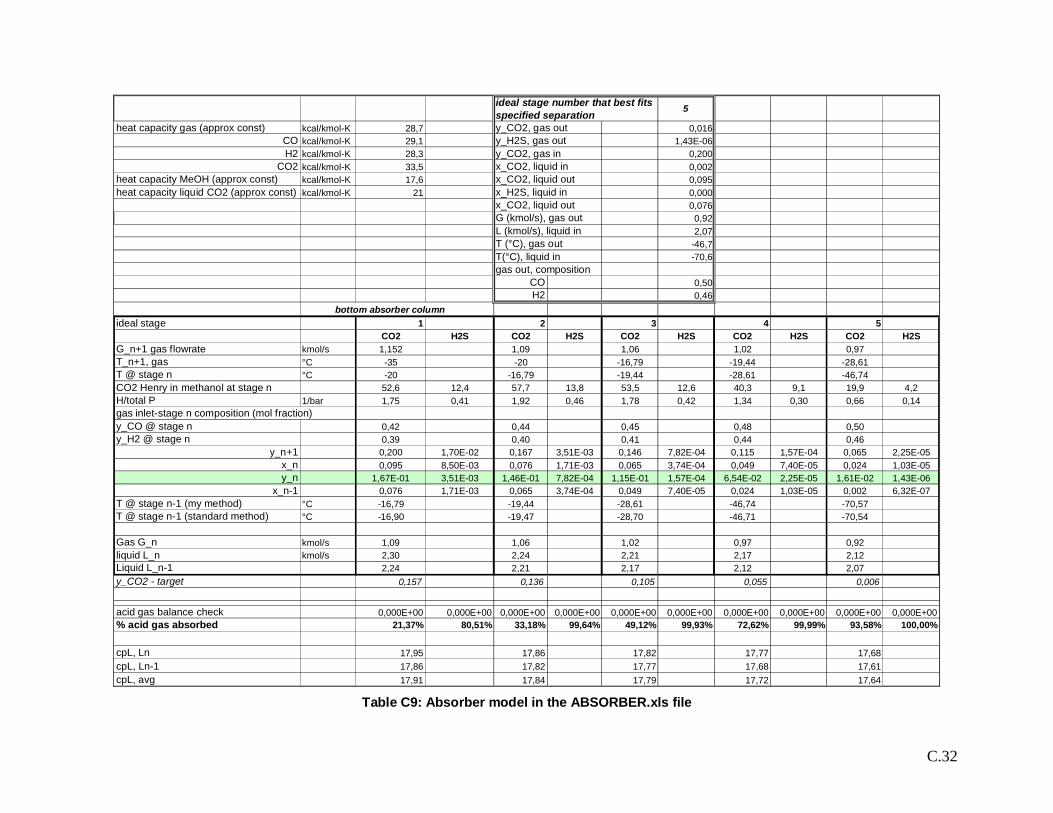
C.32
5
heat capacity gas (approx const) kcal/kmol-K 28,7 y_CO2, gas out 0,016CO kcal/kmol-K 29,1 y_H2S, gas out 1,43E-06H2 kcal/kmol-K 28,3 y_CO2, gas in 0,200
CO2 kcal/kmol-K 33,5 x_CO2, liquid in 0,002heat capacity MeOH (approx const) kcal/kmol-K 17,6 x_CO2, liquid out 0,095heat capacity liquid CO2 (approx const) kcal/kmol-K 21 x_H2S, liquid in 0,000
x_CO2, liquid out 0,076G (kmol/s), gas out 0,92L (kmol/s), liquid in 2,07T (°C), gas out -46,7T(°C), liquid in -70,6gas out, composition
CO 0,50H2 0,46
bottom absorber columnideal stage 1 2 3 4 5
CO2 H2S CO2 H2S CO2 H2S CO2 H2S CO2 H2SG_n+1 gas flowrate kmol/s 1,152 1,09 1,06 1,02 0,97T_n+1, gas °C -35 -20 -16,79 -19,44 -28,61T @ stage n °C -20 -16,79 -19,44 -28,61 -46,74CO2 Henry in methanol at stage n 52,6 12,4 57,7 13,8 53,5 12,6 40,3 9,1 19,9 4,2H/total P 1/bar 1,75 0,41 1,92 0,46 1,78 0,42 1,34 0,30 0,66 0,14gas inlet-stage n composition (mol fraction)y_CO @ stage n 0,42 0,44 0,45 0,48 0,50y_H2 @ stage n 0,39 0,40 0,41 0,44 0,46
y_n+1 0,200 1,70E-02 0,167 3,51E-03 0,146 7,82E-04 0,115 1,57E-04 0,065 2,25E-05x_n 0,095 8,50E-03 0,076 1,71E-03 0,065 3,74E-04 0,049 7,40E-05 0,024 1,03E-05y_n 1,67E-01 3,51E-03 1,46E-01 7,82E-04 1,15E-01 1,57E-04 6,54E-02 2,25E-05 1,61E-02 1,43E-06
x_n-1 0,076 1,71E-03 0,065 3,74E-04 0,049 7,40E-05 0,024 1,03E-05 0,002 6,32E-07T @ stage n-1 (my method) °C -16,79 -19,44 -28,61 -46,74 -70,57T @ stage n-1 (standard method) °C -16,90 -19,47 -28,70 -46,71 -70,54
Gas G_n kmol/s 1,09 1,06 1,02 0,97 0,92liquid L_n kmol/s 2,30 2,24 2,21 2,17 2,12Liquid L_n-1 2,24 2,21 2,17 2,12 2,07y_CO2 - target 0,157 0,136 0,105 0,055 0,006
acid gas balance check 0,000E+00 0,000E+00 0,000E+00 0,000E+00 0,000E+00 0,000E+00 0,000E+00 0,000E+00 0,000E+00 0,000E+00% acid gas absorbed 21,37% 80,51% 33,18% 99,64% 49,12% 99,93% 72,62% 99,99% 93,58% 100,00%
cpL, Ln 17,95 17,86 17,82 17,77 17,68cpL, Ln-1 17,86 17,82 17,77 17,68 17,61cpL, avg 17,91 17,84 17,79 17,72 17,64
ideal stage number that best fitsspecified separation
Table C9: Absorber model in the ABSORBER.xls file
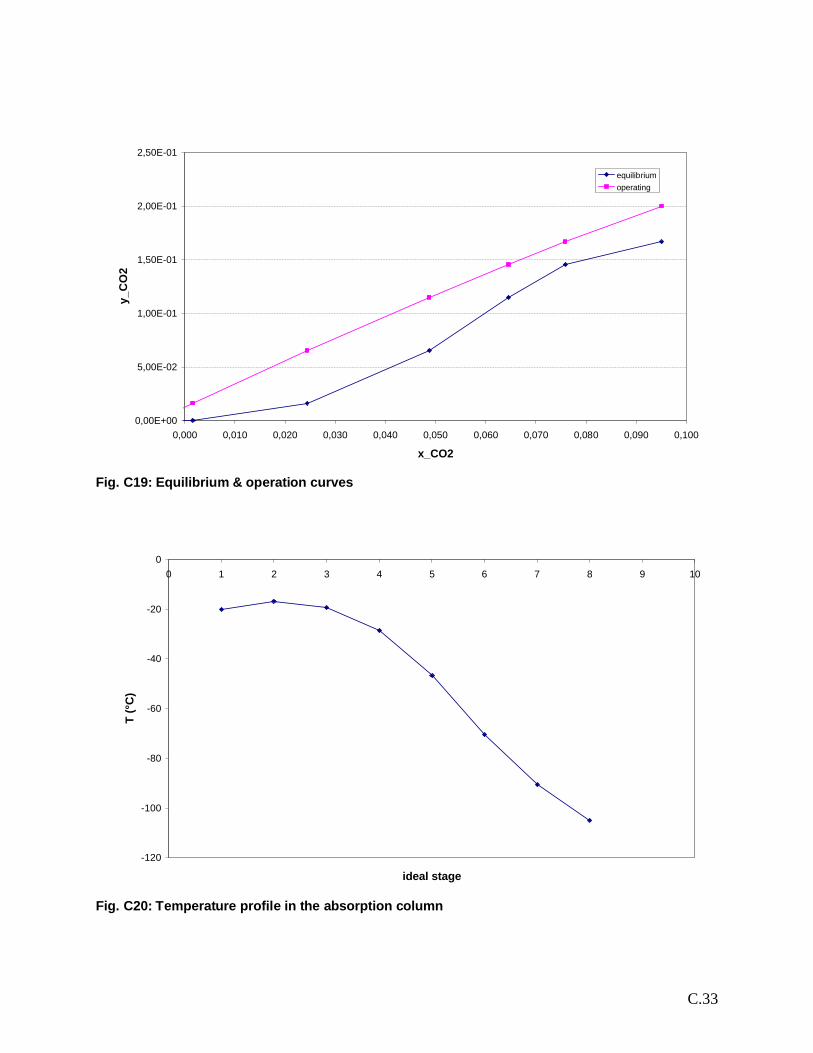
C.33
0,00E+00
5,00E-02
1,00E-01
1,50E-01
2,00E-01
2,50E-01
0,000 0,010 0,020 0,030 0,040 0,050 0,060 0,070 0,080 0,090 0,100
x_CO2
y_C
O2
equilibriumoperating
Fig. C19: Equilibrium & operation curves
-120
-100
-80
-60
-40
-20
00 1 2 3 4 5 6 7 8 9 10
ideal stage
T (°
C)
Fig. C20: Temperature profile in the absorption column
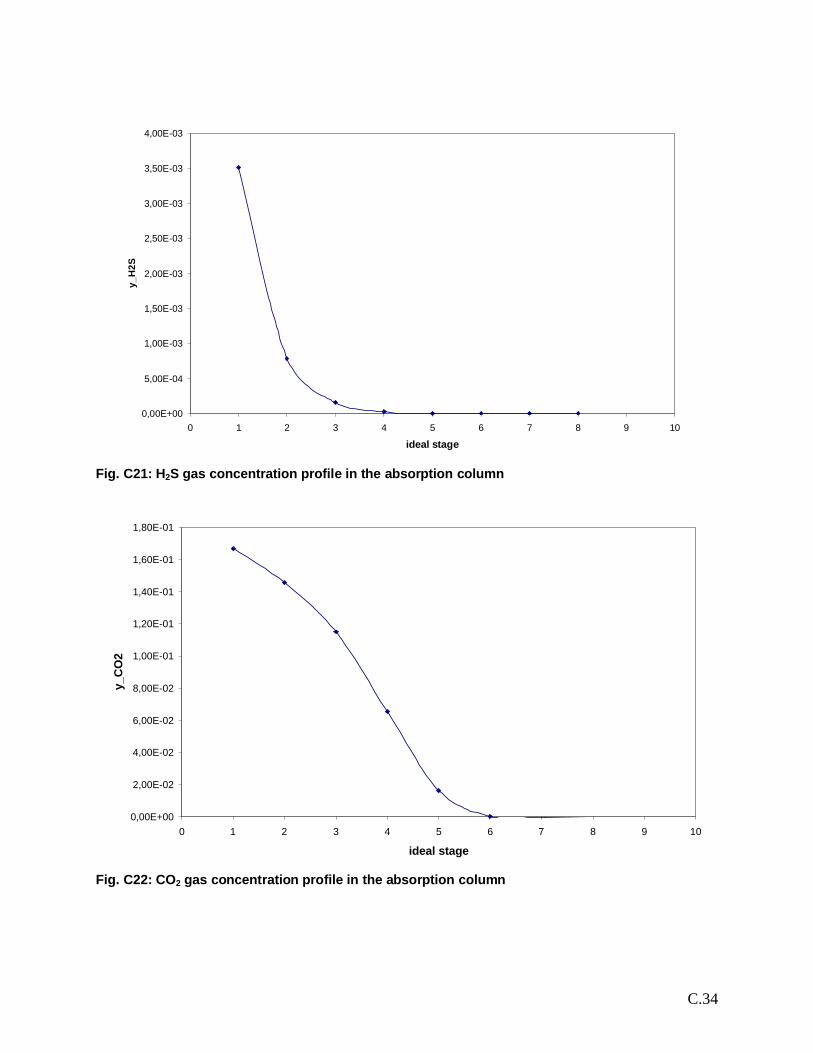
C.34
0,00E+00
5,00E-04
1,00E-03
1,50E-03
2,00E-03
2,50E-03
3,00E-03
3,50E-03
4,00E-03
0 1 2 3 4 5 6 7 8 9 10
ideal stage
y_H
2S
Fig. C21: H2S gas concentration profile in the absorption column
0,00E+00
2,00E-02
4,00E-02
6,00E-02
8,00E-02
1,00E-01
1,20E-01
1,40E-01
1,60E-01
1,80E-01
0 1 2 3 4 5 6 7 8 9 10
ideal stage
y_C
O2
Fig. C22: CO2 gas concentration profile in the absorption column
C.35
C.4 Aspen Plus thermodynamic modelThe Aspen Plus Helpdesk provides a specific advice for the thermodynamic models that fit
the acid gas absorption by a methanol solvent and a clear reference is made to the Rectisolprocess.The list is reported here below:
− PRWS− RKSWS− PRMHV2− PSRK− SR-POLAR
The Aspen Support Service experts (email: [email protected]) suggested thatPSRK does not have adjustable parameters because it is based on the UNIFAC equation of stateand it might not give the best results. The other listed models, though, require binary parameters(methanol/acid gas): Aspen Plus is not provided with data for the system methanol/COS and onthe other hand these parameters were not available.
Actually, the only thermodynamic model which can process the COS without any externalintervention is the SR-POLAR one.
It was decided therefore to use the PSRK model and to remove the COS from the raw gasfeed stream (its composition is 0.02 % vol) and replacing the flow of this component by a molar-equivalent amount of H2S. This was done in the hypothesis that the binary parameters of thesystems MeOH/COS and MeOH/H2S are quite similar.
This hypothesis could not be verified directly as we lacked of the parameters, but thefollowing sensitivity analysis was performed:
− a sample raw gas streams quite similar to the Aspen Model one in term of compositionand properties was fed to a single stage absorber: in one case though the raw gas streamcontained 1% vol of H2S, on the other case 1% vol of COS. An Aspen Plus simulationcalculated the methanol flow (@ the raw gas T and P) required to absorb 99 % of themolar flow of the raw S-containing gas (H2S or COS).
− All the thermodynamic model listed here above were used, but as we anticipated only theSR-POLAR one performed the calculations for the COS case.
− The results reported in Table C10 show that:1. for the H2S case, the MeOH required flowrate and the absorption heat data are of
the same order of magnitude for the different models, even though the PSRK andPRWS ones provide the largest estimation for the methanol flow and a relativelysmall heat of absorption;
2. The SR-POLAR model, which allows comparing the MeOH/COS andMeOH/H2S performances, shows the same value for the heat and two equal orderof magnitude values for the required methanol flow.
Based on the previous considerations and on the fact that the COS concentration is roughly1% mol/mol of the H2S one, the error due to replacing the COS flow by a molar-correspondentflow of H2S was considered negligible to the degree of approximation of the results provided inthe present Study.
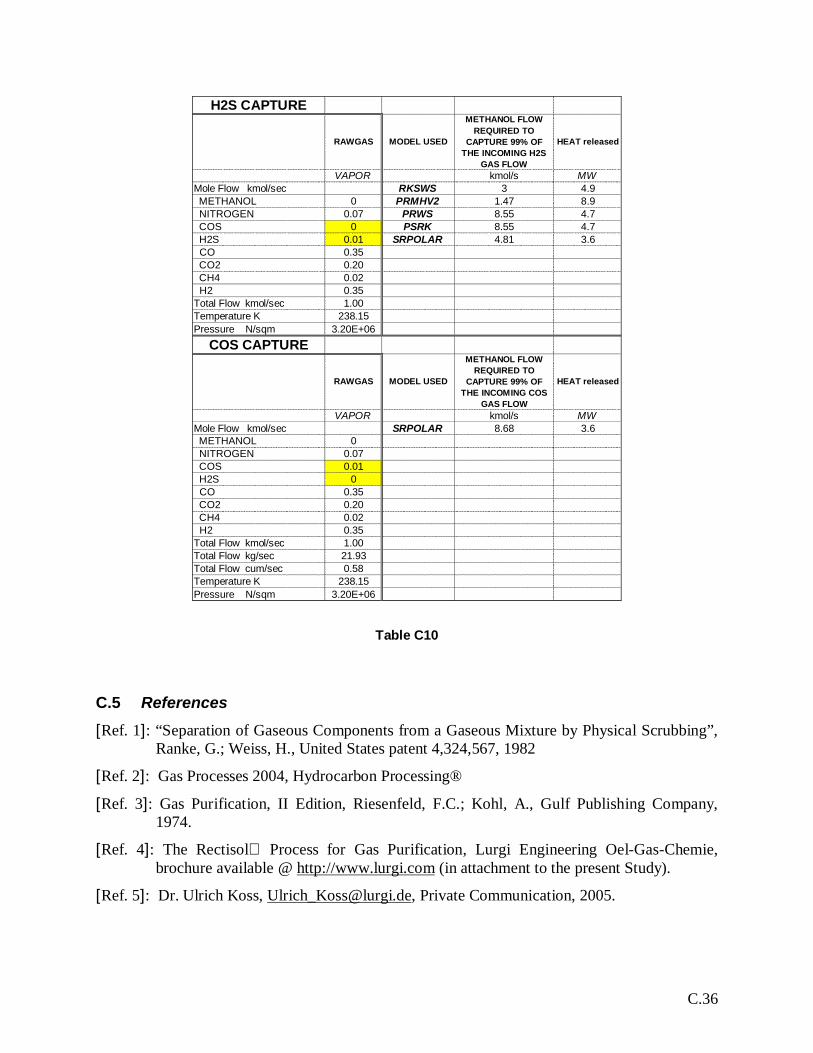
C.36
H2S CAPTURE
RAWGAS MODEL USED
METHANOL FLOWREQUIRED TO
CAPTURE 99% OFTHE INCOMING H2S
GAS FLOW
HEAT released
VAPOR kmol/s MWMole Flow kmol/sec RKSWS 3 4.9 METHANOL 0 PRMHV2 1.47 8.9 NITROGEN 0.07 PRWS 8.55 4.7 COS 0 PSRK 8.55 4.7 H2S 0.01 SRPOLAR 4.81 3.6 CO 0.35 CO2 0.20 CH4 0.02 H2 0.35Total Flow kmol/sec 1.00Temperature K 238.15Pressure N/sqm 3.20E+06
COS CAPTURE
RAWGAS MODEL USED
METHANOL FLOWREQUIRED TO
CAPTURE 99% OFTHE INCOMING COS
GAS FLOW
HEAT released
VAPOR kmol/s MWMole Flow kmol/sec SRPOLAR 8.68 3.6 METHANOL 0 NITROGEN 0.07 COS 0.01 H2S 0 CO 0.35 CO2 0.20 CH4 0.02 H2 0.35Total Flow kmol/sec 1.00Total Flow kg/sec 21.93Total Flow cum/sec 0.58Temperature K 238.15Pressure N/sqm 3.20E+06
Table C10
C.5 References
[Ref. 1]: “Separation of Gaseous Components from a Gaseous Mixture by Physical Scrubbing”,Ranke, G.; Weiss, H., United States patent 4,324,567, 1982
[Ref. 2]: Gas Processes 2004, Hydrocarbon Processing®
[Ref. 3]: Gas Purification, II Edition, Riesenfeld, F.C.; Kohl, A., Gulf Publishing Company,1974.
[Ref. 4]: The Rectisol Process for Gas Purification, Lurgi Engineering Oel-Gas-Chemie,brochure available @ http://www.lurgi.com (in attachment to the present Study).
[Ref. 5]: Dr. Ulrich Koss, [email protected], Private Communication, 2005.
Related Documents